Abstract
Changes in acoustic parameters measured in a room may depend on the location and orientation of the sound source and microphones or on the reverberation conditions of the room. As was found in the research presented in this publication, reverberation in a room is also influenced by thermo-hygrometric conditions. The article presents an experimental analysis involving the impact of temperature and relative air humidity in a room on reverberation time. Since it is very difficult to control the temperature and relative humidity in real conditions, the tests were carried out both in laboratory conditions and with the use of simulations. For this purpose, the results of the reverberation time measurements in the reverberation chamber for various thermo-hygrometric conditions were obtained. Then, the reverberation chamber was modeled in the ODEON Version 11.0 program, and after the validation of the model, a series of simulations were performed, demonstrating the changes in the reverberation time as a function of temperature and relative air humidity. The results are presented in both a two-dimensional and three-dimensional version, i.e., the dependence of the reverberation time as a function of two variables: air temperature and relative humidity.
1. Introduction
When staying in various types of interiors on a daily basis, we are confronted with sound perception all the time. The acoustic properties of the interiors have a large impact on the way people perceive sound [1]. The basic parameter used to describe interior acoustics is the reverberation time. There are also other parameters describing the acoustics of the interiors correlated with the reverberation time. Frequently, statistical methods are used to relate the reverberation time to other parameters. One example of such an approach is illustrated by the relationship between reverberation time and sound strength using the method of least squares [2]. Another example may be founded on a statistical relationship of reverberation time with the speech transmission index (STI) [3,4] or on such a relationship based on a theoretical basis [5]. There are many historical models of reverberation time estimation that are still applied today [6], and yet the problem of reverberation time estimation remains the subject of incessant interest for many researchers [7,8,9], and research works on new estimation methods of reverberation time are still developed nowadays [10]. Another problem involving the estimation of the acoustic parameters of the interiors concerns the selection of the appropriate software. The mentioned problem has also been addressed in the research works undertaken by acousticians, as presented in the article by Brandäo et al. [11]. The analysis of indoor acoustics can be related to many acoustic parameters, whereof the variability may depend on the characteristics of the equipment, expertise of the operator, position and number of sources and receivers, method of final processing, measurement method, or thermo-hygrometric conditions [12]. Some of these changes, as well as the inaccuracy in adopting acoustic parameters of the applied finishing materials of the interiors (sound absorption and sound dispersion coefficients), can be regarded as disturbances or perturbations [13]. Thermo-hygrometric conditions are included in the acoustic analysis rather infrequently. Only a few standards take into consideration such conditions in acoustic measurements. For example, the standard ISO 9613-1 [14] takes into account the effect of air absorption in the propagation of sound waves and allows for the direct correlation with temperature, relative humidity, and static pressure. Additionally, the standard ISO 354 [15] refers to the impact of temperature, and relative humidity, recommending maintaining the humidity from 30% to 90% at 15 °C, without any assessment method for these values being provided. Yet, it should be remembered that in reverberation rooms, such as sacral buildings [16,17], air humidity and temperature have a large influence on the reverberation time occurring in them. For these reasons, the present study attempts to determine the impact of air temperature and relative humidity on the acoustic parameters of the interiors. The tests were carried out in a reverberation room in the acoustic laboratory of the local university. The test room was deliberately chosen because it is reverberant, and its acoustic properties are known in terms of geometry and materials delimiting the room.
2. Methodology
2.1. Theoretical Foundations
The change of air temperature changes the propagation speed of a sound wave, and thus, it modifies the Sabine equation for the reverberation time:
Already in Equation (1), we can see the impact of temperature and relative humidity. Firstly, the variable speed of sound, c, is calculated from the formula:
Secondly, the term denotes acoustic absorption of the room, where the term denotes the attenuation of sound by the air, which is written by the formula:
where m is the power attenuation coefficient, in reciprocal meters, calculated according to ISO 9613-1: 1993 [14].
Table 1 shows the changes in sound attenuation by the air as a function of frequency for different values of relative humidity.

Table 1.
Air intensity attenuation coefficient [12,18].
It should be noted that the reverberation time in the reverberation room or in other rooms is determined by appropriate measurements (see chapter 2.2). However, in order to determine the sound absorption coefficients of the examined materials in the reverberation room, the measurement results of RT should be inserted into Formula (1), and this parameter should be determined by means of appropriate calculation procedures. Then, the information on temperature and relative air humidity is indispensable.
2.2. Measurement in the Reverberation Room
The measurements were taken in the reverberation room, whereof the dimensions are shown in Figure 1. The reverberation time was the measured parameter. The volume of the reverberation room is 192.7 m3, and its shape meets the condition defined in the standard [15]: , where lmax is the length of the longest straight line which fits within the boundary of the room.
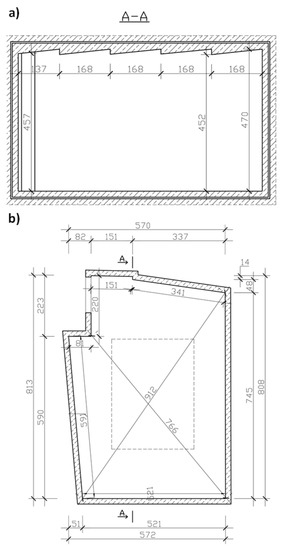
Figure 1.
Reverberation room: (a) cross-section of the reverberation room; (b) reverberation room projection. [16,19].
Permanent, suspended dispersing elements were used in the reverberation room, which allowed us to ensure the dispersion of the acoustic field. The reverberation time was determined by the intermittent noise method. Six measurements of sound decay were made for each of the six microphone positions and for each of the two loudspeaker positions. This allowed us to obtain a good average in each of the 1/3 octave intervals in the range of 100–5000 Hz. The measuring system consisted of two elements:
- The transmitting part of the test system consisted of a loudspeaker with a spherical radiation pattern, and an artificial test noise generator with an amplifier manufactured by Svantek.
- The receiving part of the test system consisted of a 4-channel SVAN 958 sound level meter, two 1/2ʺ microphones, an acoustic calibrator SV03A, and a PC computer with the software SvanPC + Software Official 1.0.21 e.
The positions of the microphones during the measurements were at least 1.5 m from each other and at least 2.0 m from the sound source. The location of the sound source and microphones during the measurement is shown in Figure 2.
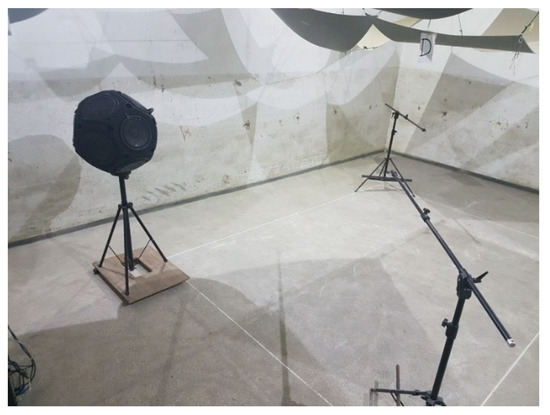
Figure 2.
Microphone system—the source during the reverberation time of the reverberation room [20].
Thus, the measured reverberation time for each frequency band is the arithmetic mean Tf of 72 measurements. In this case, the standard uncertainty of the mean value Tf is equal to the experimental standard deviation of the mean from 72 cycles of independent measurements. We can also determine the average values and measurement uncertainties for environmental factors (temperature, relative humidity, and atmospheric pressure).
The measurement result for environmental factors can be calculated from Formula (4):
where is the measured value, is the scatter of the sensor indications, is the resolution of the sensor indications, is the error of the sensor indications, and is the uncertainty in determining the error of indications.
The standard deviation of the scatter of the sensor indications, , is determined as a combined estimate of the standard deviations of the m series with n measurements each. The standard deviation of the resolution of the sensor indications, , is determined with the assumption of rectangular distribution with resolution limits equal to , , and , respectively. The load capacities and are determined on the basis of the expanded uncertainty, U, defined at the confidence level of 95% for the normal distribution in the calibration certificate of the instrument.
2.3. Simulations
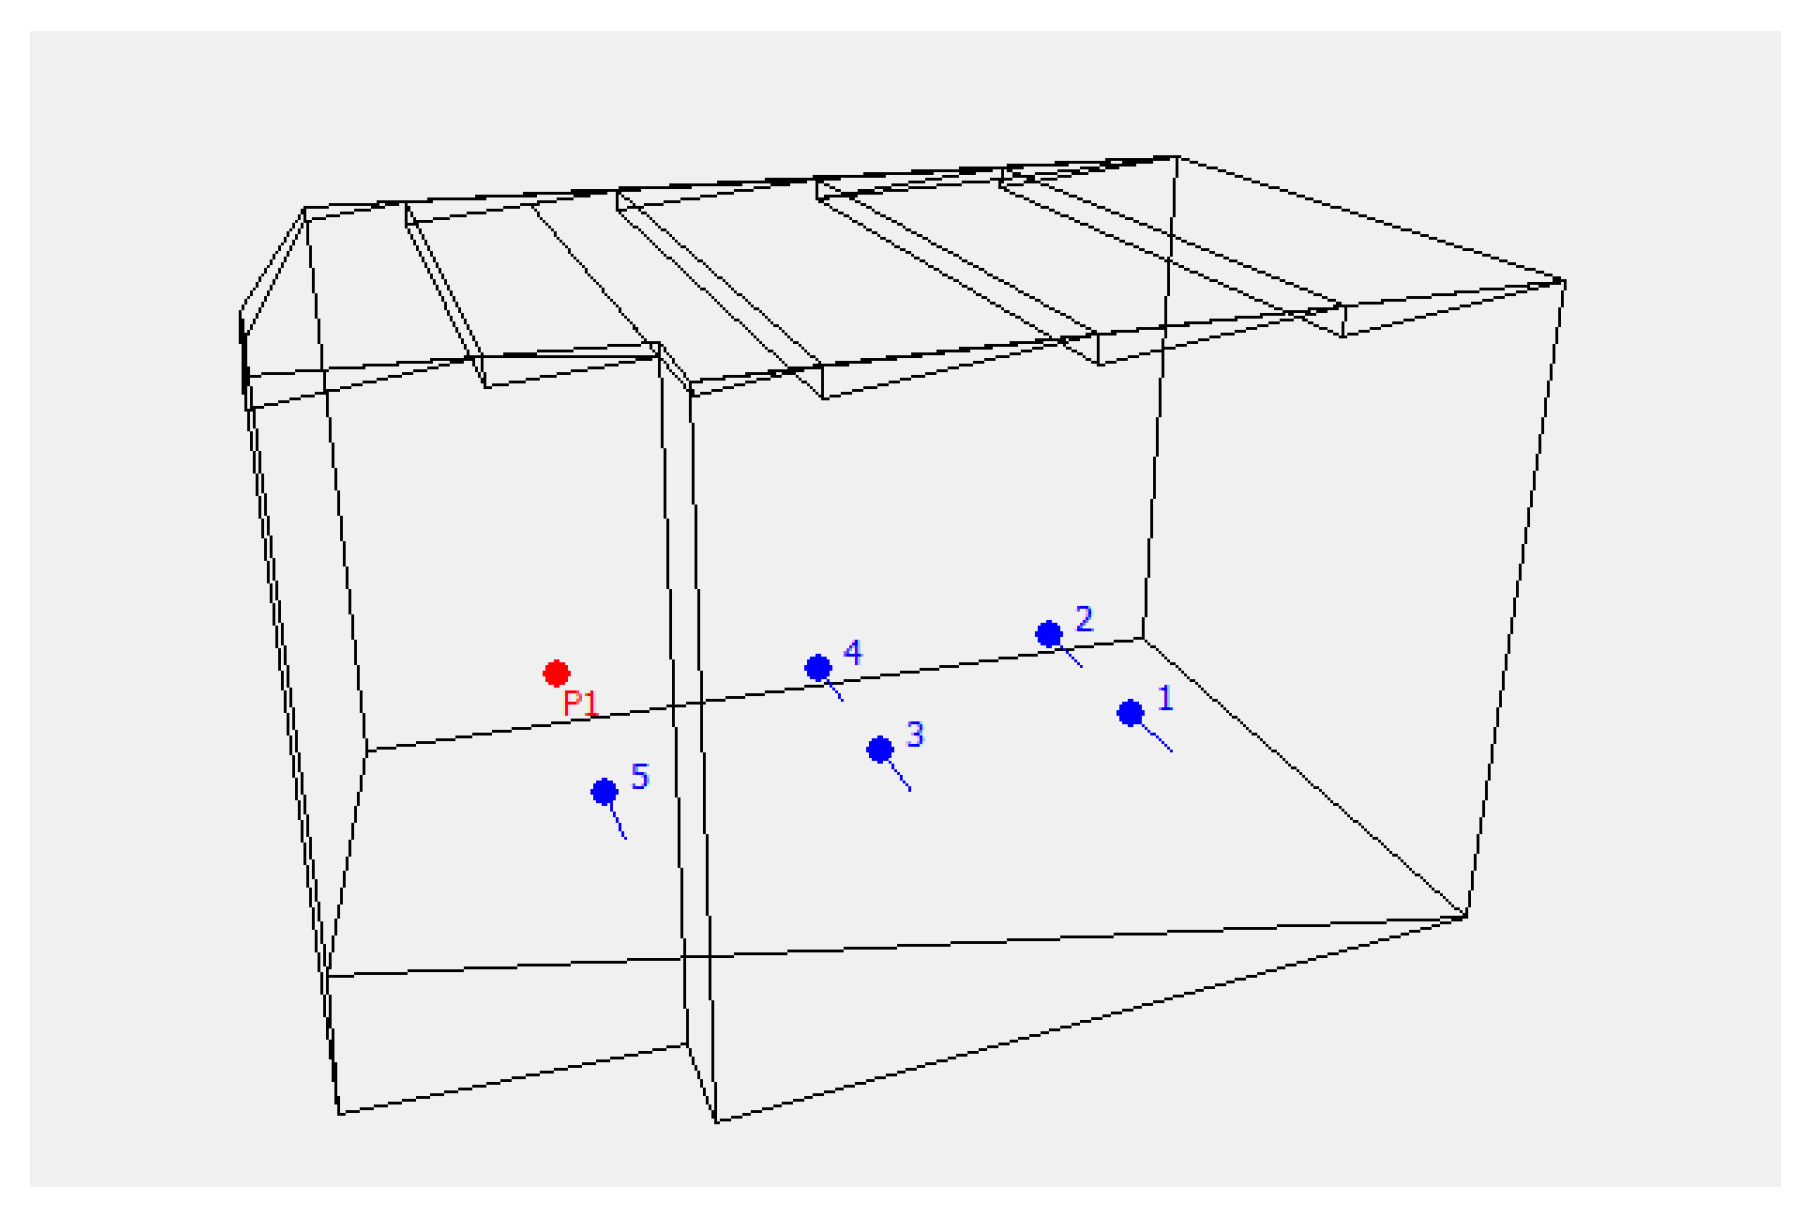
To simulate the acoustic field in the reverberation room, ODEON software Version 11.0 was applied. The software makes use of the principles of geometric acoustics and adopts a hybrid calculation method that combines the image source method and the ray-tracing method [20,21]. In order to analyze the room in the ODEON software, a virtual model realized in Cad 3D is imported [22]. First of all, a model for the room for which acoustic measurements are available is created, ensuring accurate mirroring of the room (Figure 3).
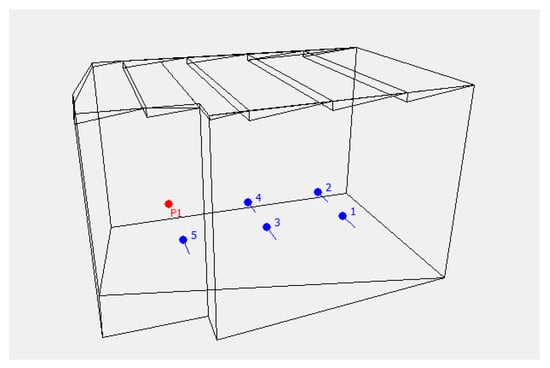
Figure 3.
Model of the reverberation room with the measuring points (1–5) and sound source (P1).
In order to calibrate the model more precisely, more measurement points were placed for averaging purposes than in the actual measurement. In the next step, the acoustic model is calibrated by setting the value of the absorption coefficient for all surfaces of the virtual model. Then, the measured and simulated reverberation time values are compared, which allows for an appropriate calibration of the acoustic model. The partitions delimiting the reverberation room are made of concrete. Table 2 presents the values of the sound absorption coefficient of the partitions delimiting the room.
Table 2.
Adopted sound absorption coefficients of the partitions delimiting the room.
The adopted coefficients slightly differ from the tabular (literature) coefficients adopted for concrete.
3. Results and Discussion
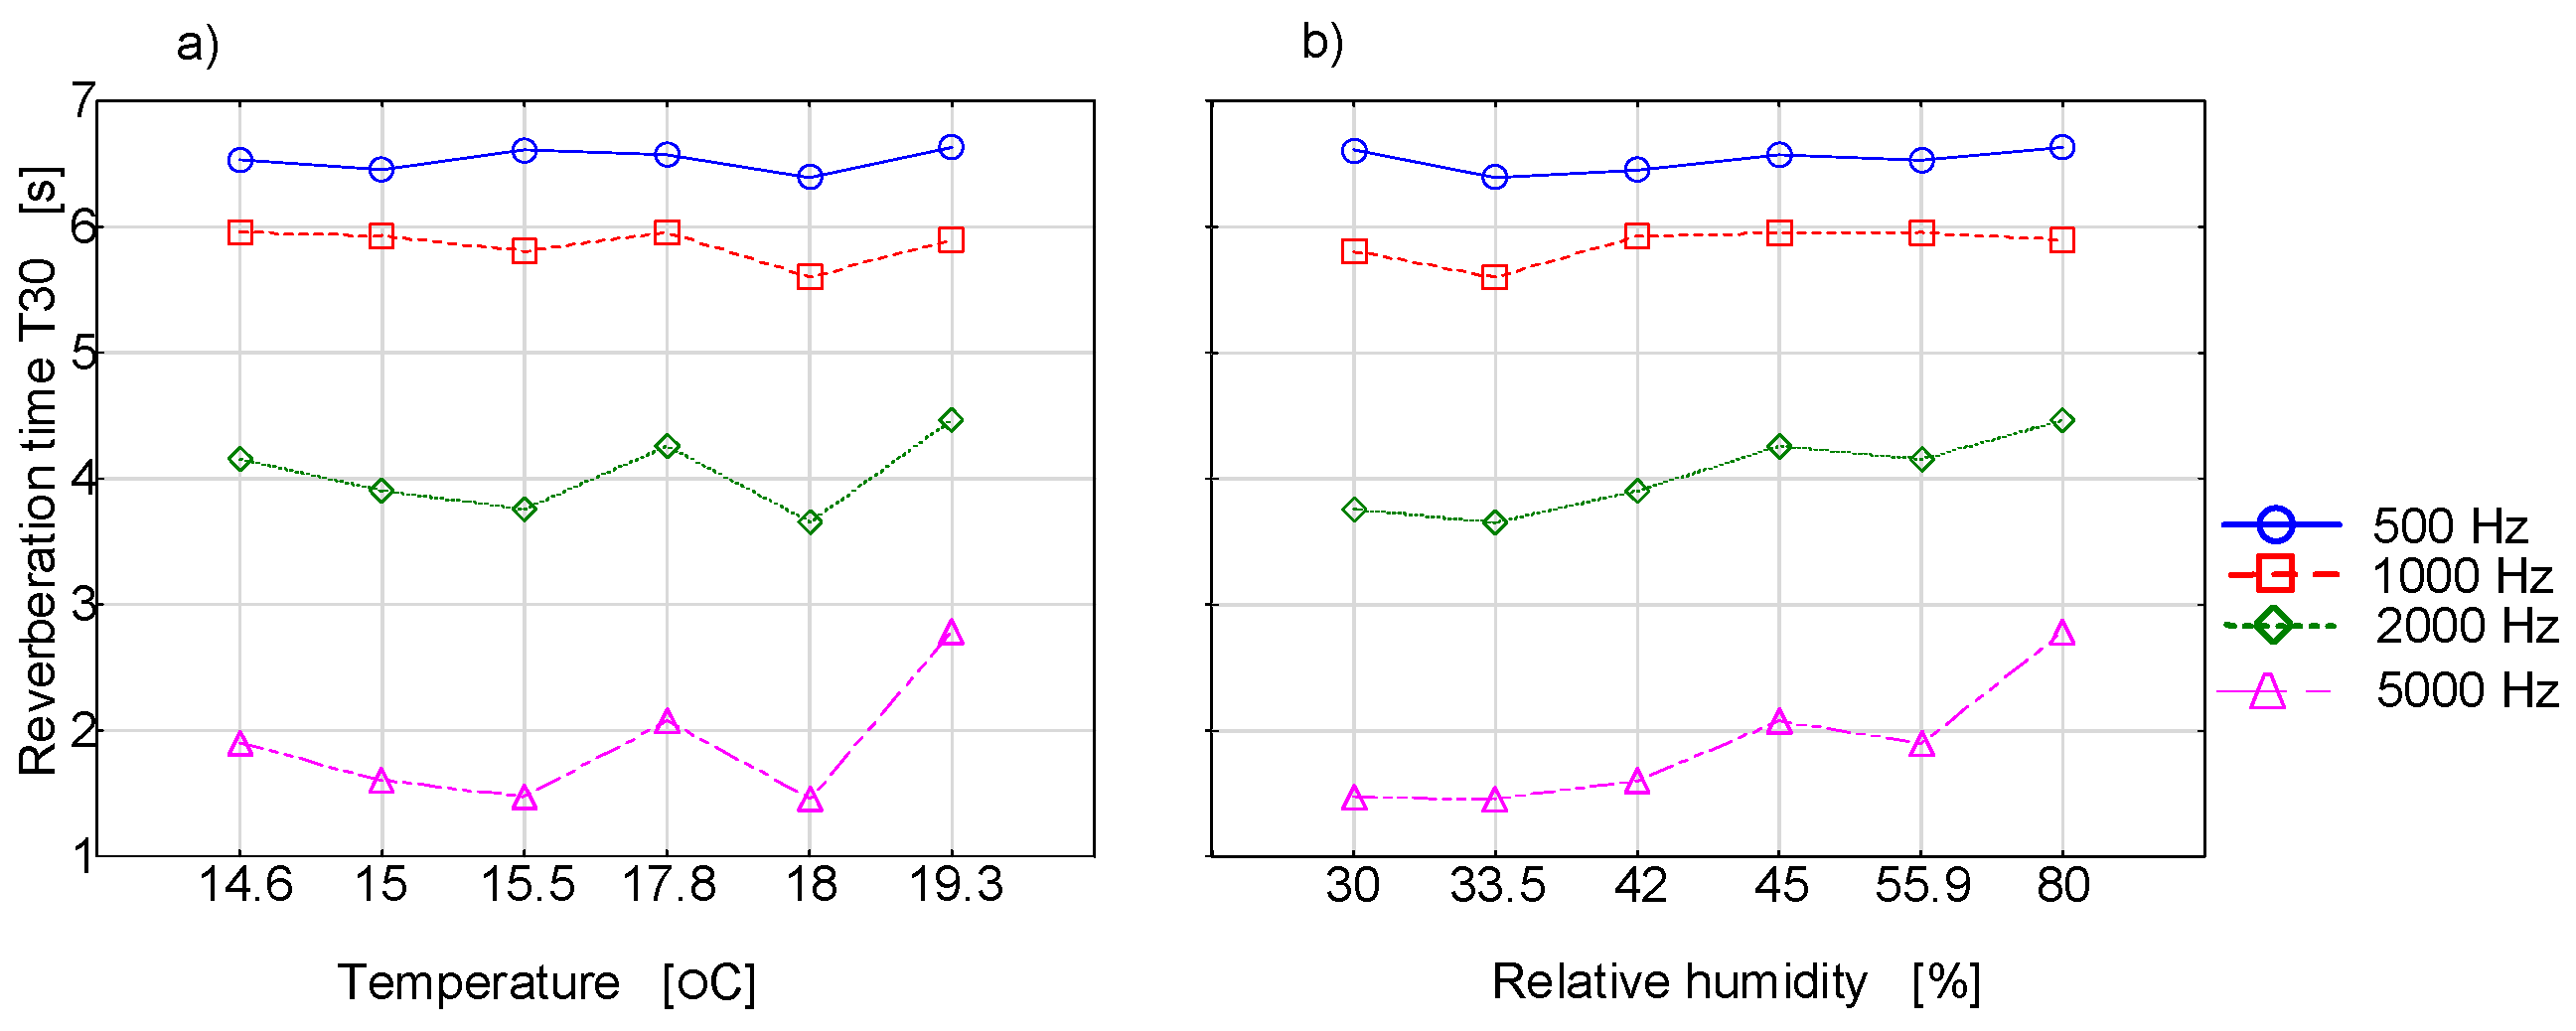
Figure 4 presents the measurement results of the reverberation time as a function of the temperature or relative humidity for selected frequency bands.
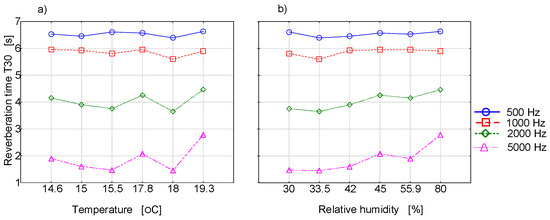
Figure 4.
Reverberation time is a function of temperature (a) and relative humidity (b) for different frequencies.
Table 3.
Uncertainty budget for selected frequency bands.
It should be noted that in the laboratory conditions in the reverberation room, it is not possible to control the temperature or relative humidity of the air in such a way as to be able to determine the appropriate dependences of reverberation time as a function of these parameters. The present studies are primarily exploratory studies aimed to better examine the phenomenon. Since some changes in reverberation time were reported in the effect of thermo-hygrometric changes, simulation tests were initiated in which it was possible to fully control the changes in the temperature and in relative humidity of the air. However, in order for the numerical tests to be reliable, the measurements in the reverberation room were used as indispensable elements for the validation of the acoustic model. Figure 5 presents the measurement and simulation results in ODEON under the same thermo-hygrometric conditions.
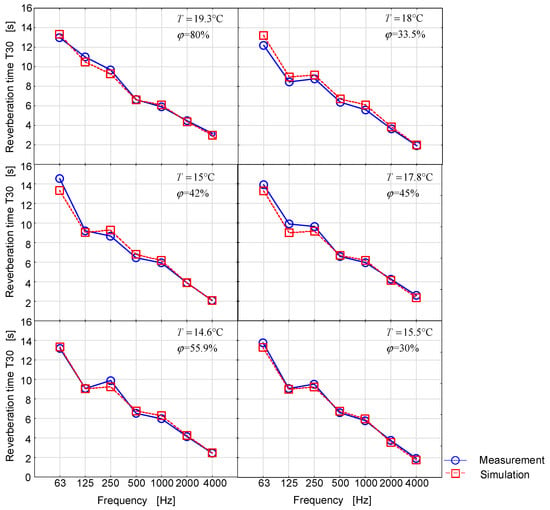
Figure 5.
Reverberation time is a function of frequency for different temperatures and relative air humidity.
The model was validated using the formula proposed by Stern [23]:
where E is the value of the comparison error and UV is the validation uncertainty.
The value of the validation error was determined as follows:
where is the experimental error and is the simulation error.
To calculate the simulation error, a simple estimation method was used [20]:
where S is the simulation result and M is the measurement result.
The validation uncertainty is defined as:
where UE is the experimental uncertainty, M is the experimental uncertainty in the use of input data, and US is the simulation uncertainty.
The detailed procedure and the validation results of the model of the described reverberation room are described in the article of Nowoświat, Olechowska [20]. In this paper, we present the final result of the validation, as summarized in Table 4.
Table 4.
Validation results of the acoustic model.
It is worth noting that both the validation and the visual representation of the results in Figure 5 confirm the accepted absorption parameters for the room-delimiting partitions.
Additionally, the normalized error (JND) of the simulation was determined [24].
Figure 6 shows the results of the normalized error (JND).
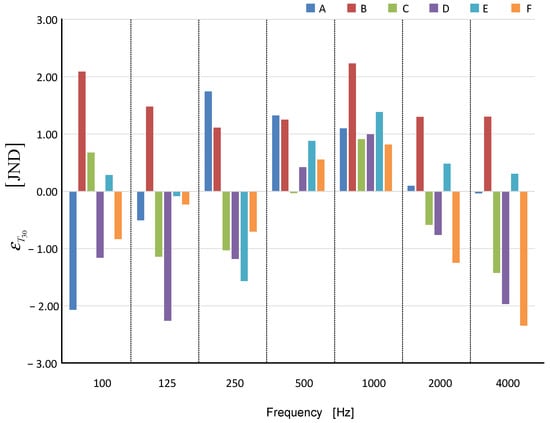
Figure 6.
Normalized JND error as a frequency function for six cases: A—, B—, C—, D—, E—, and F—.
We can conclude from the graphs presented in Figure 4 and Figure 5 that the reverberation time varies to some extent depending on the thermo-hygrometric conditions. In fact, it is difficult to find research results in the world literature which provide the changes in acoustic parameters of the interiors as a function of temperature or air humidity.
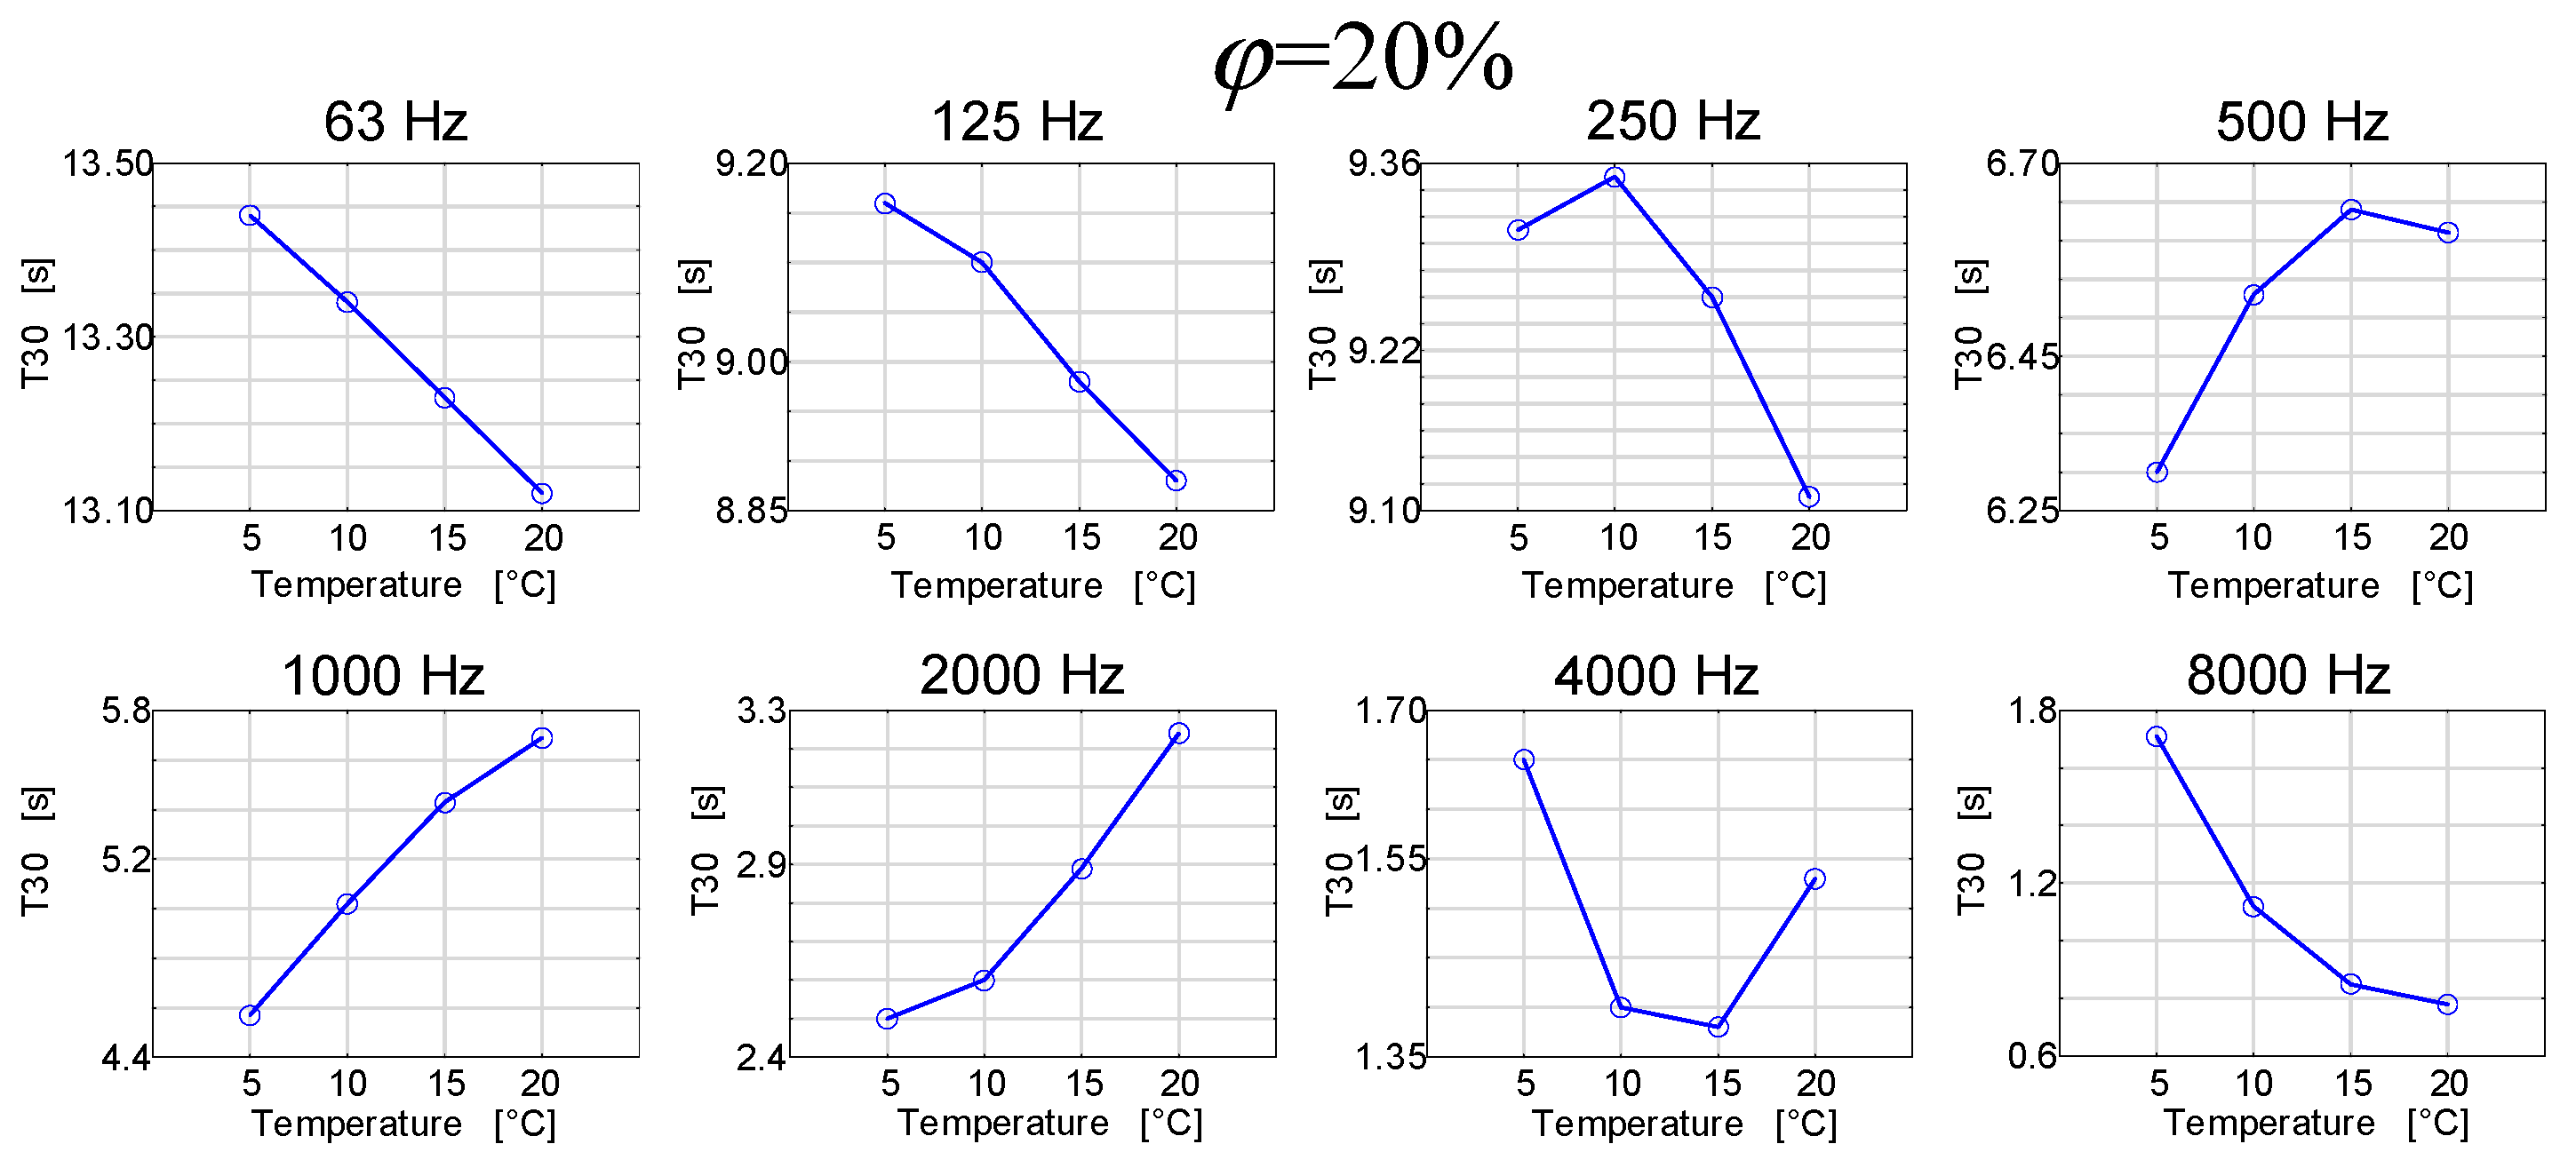
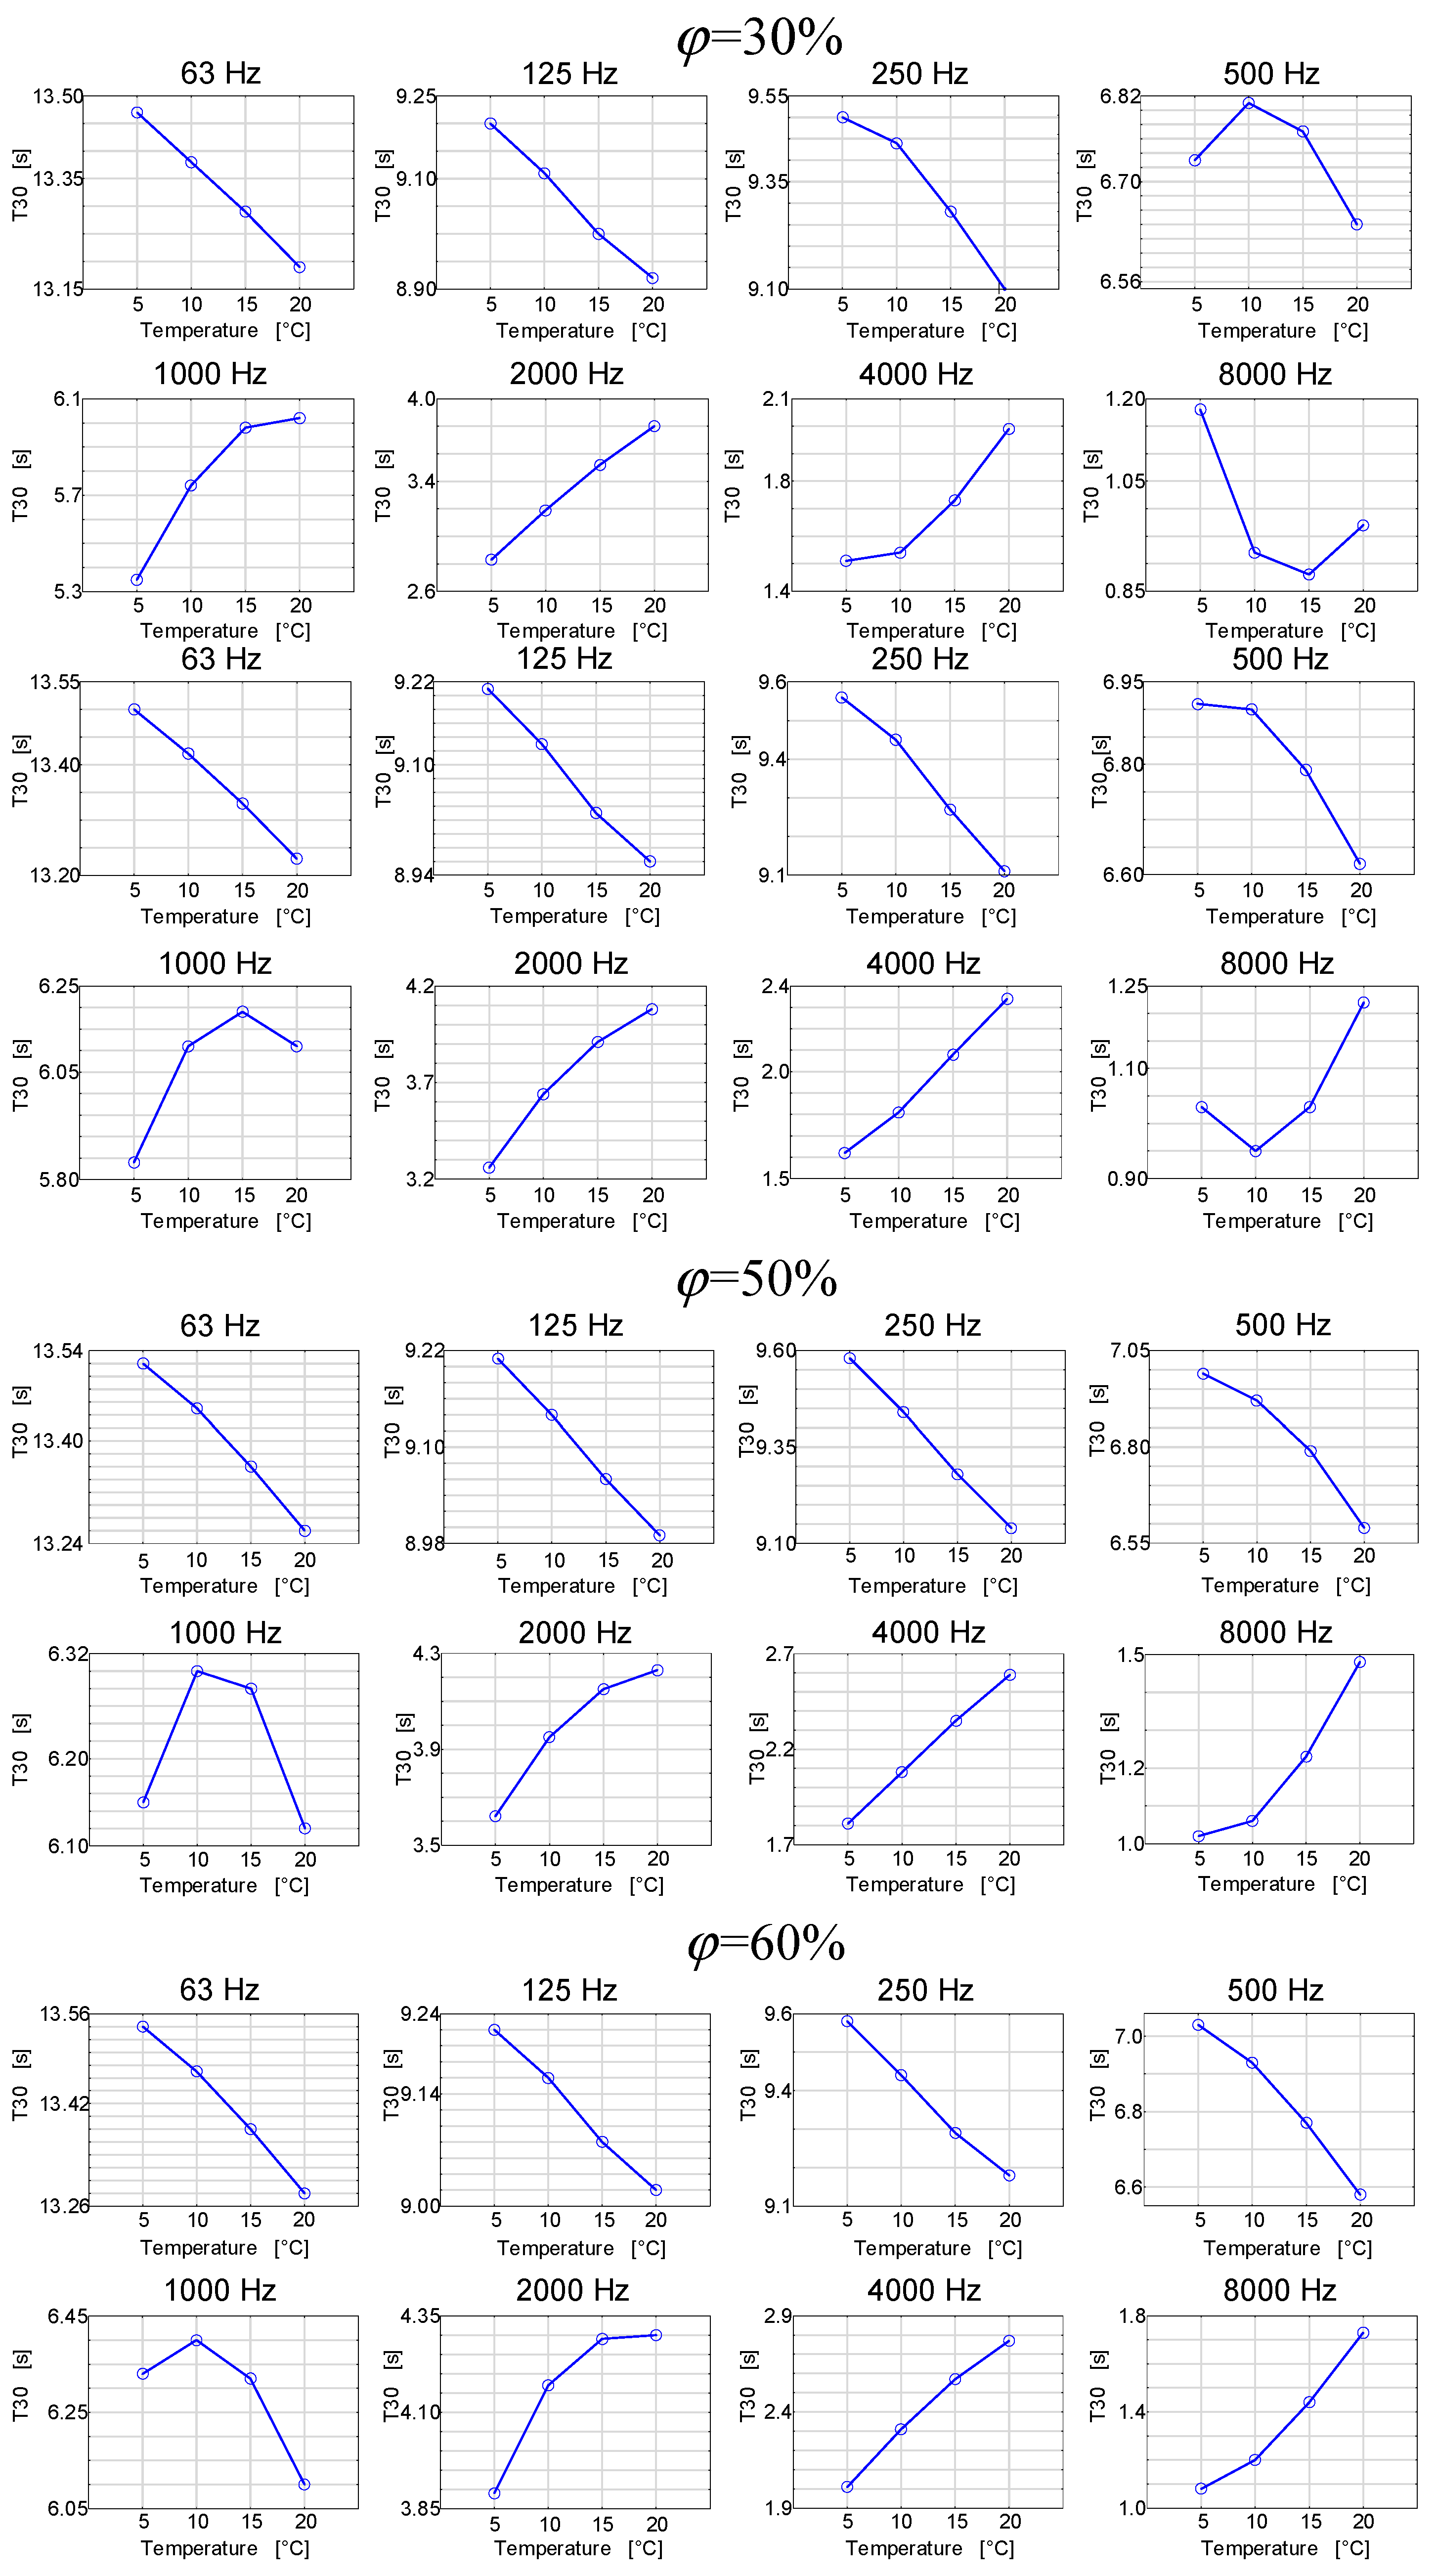
As already mentioned, the analysis of the aforementioned changes was carried out by means of simulations, and the results are presented in Figure 7 and Figure 8 [25].

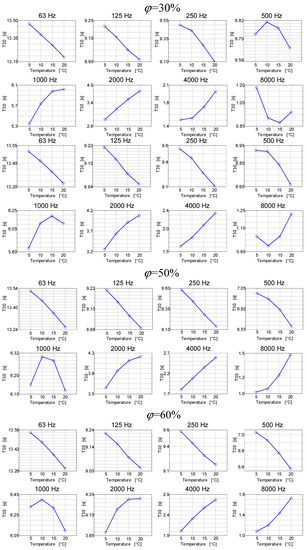
Figure 7.
Reverberation times as a function of air temperature for octave frequencies at different air humidity in the room.
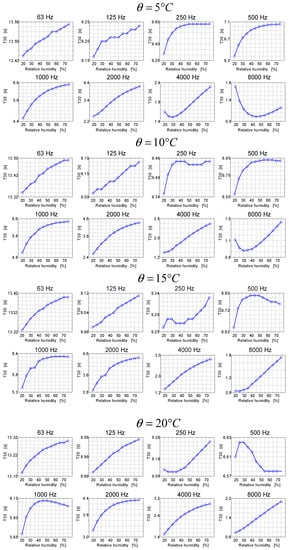
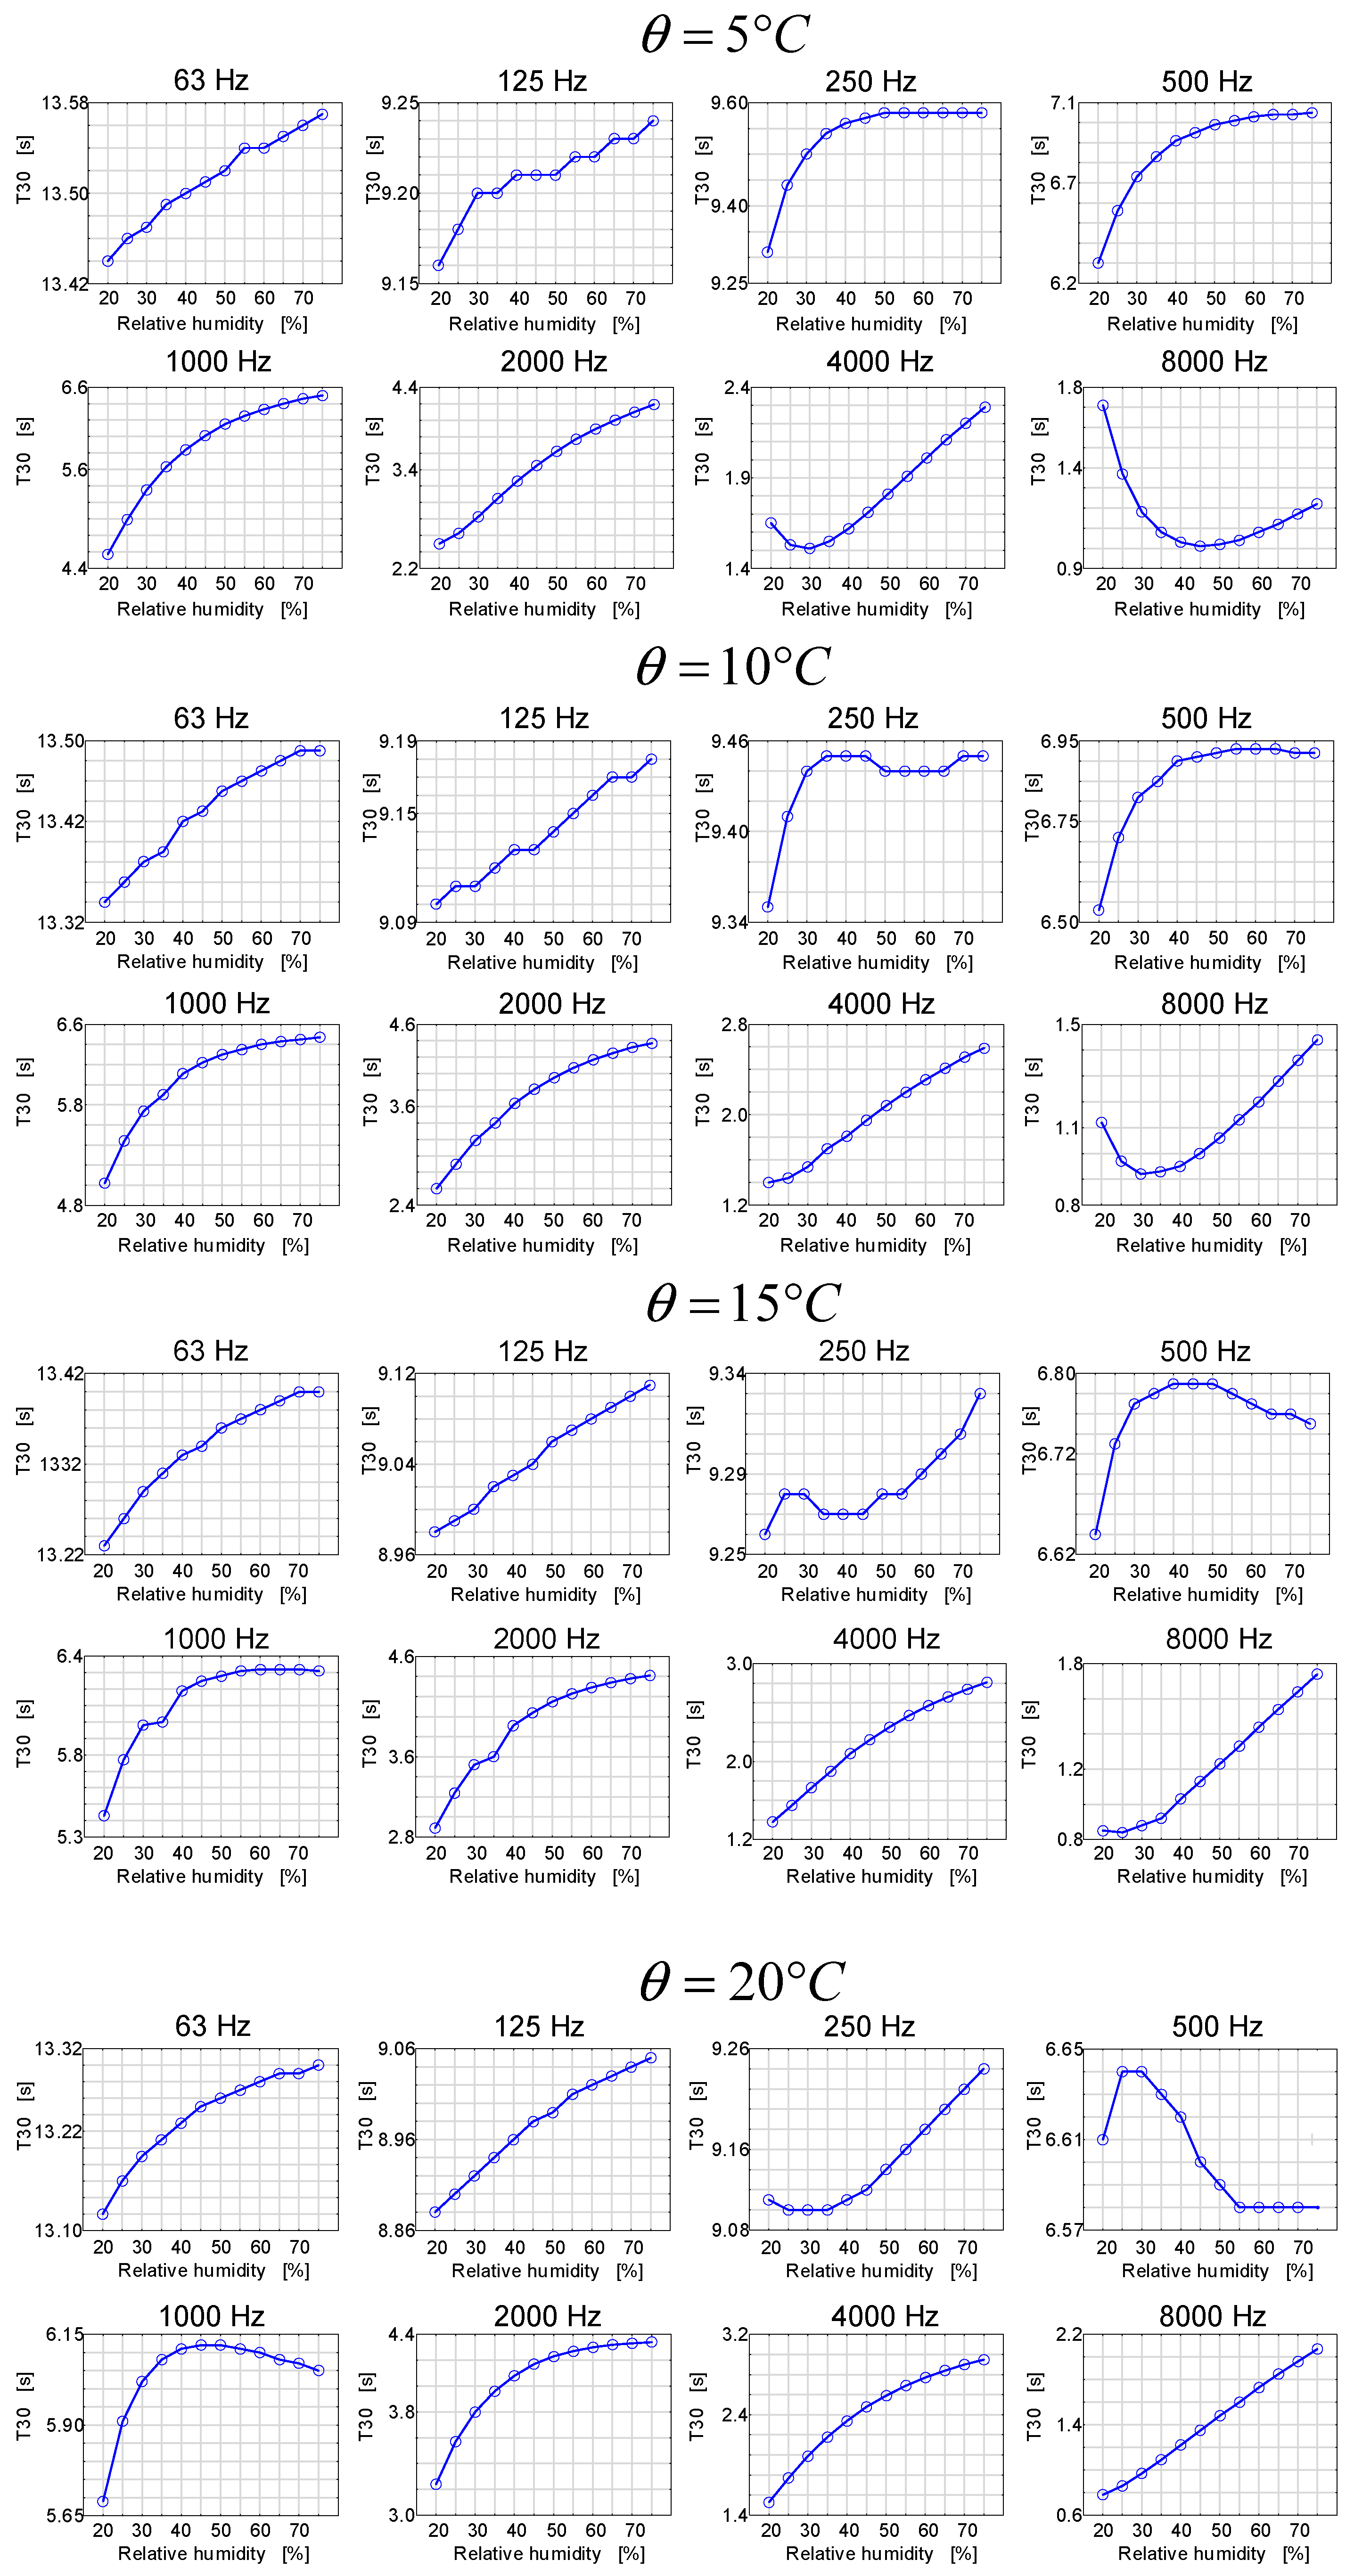
Figure 8.
Reverberation times as a function of air humidity for octave frequencies at different air temperatures in the room.
The results presented in Figure 7 can be viewed as quite interesting. It turns out that the reverberation time in a room as a function of temperature in this room may have different characteristics depending on the frequency band. For low frequencies, the reverberation time as a function of temperature generally decreases, and for high frequencies, it generally increases. At the same time, the frequency in the 1000 Hz band increases for low temperatures, and after exceeding the limit of 15 °C, it decreases. Therefore, the subsequent graphs in Figure 8 show the reverberation time courses as a function of relative humidity at different air temperature values.
The results presented in Figure 8, similarly to the previous case, show that the reverberation time in the room as a function of humidity may have different characteristics, depending on the frequency band.
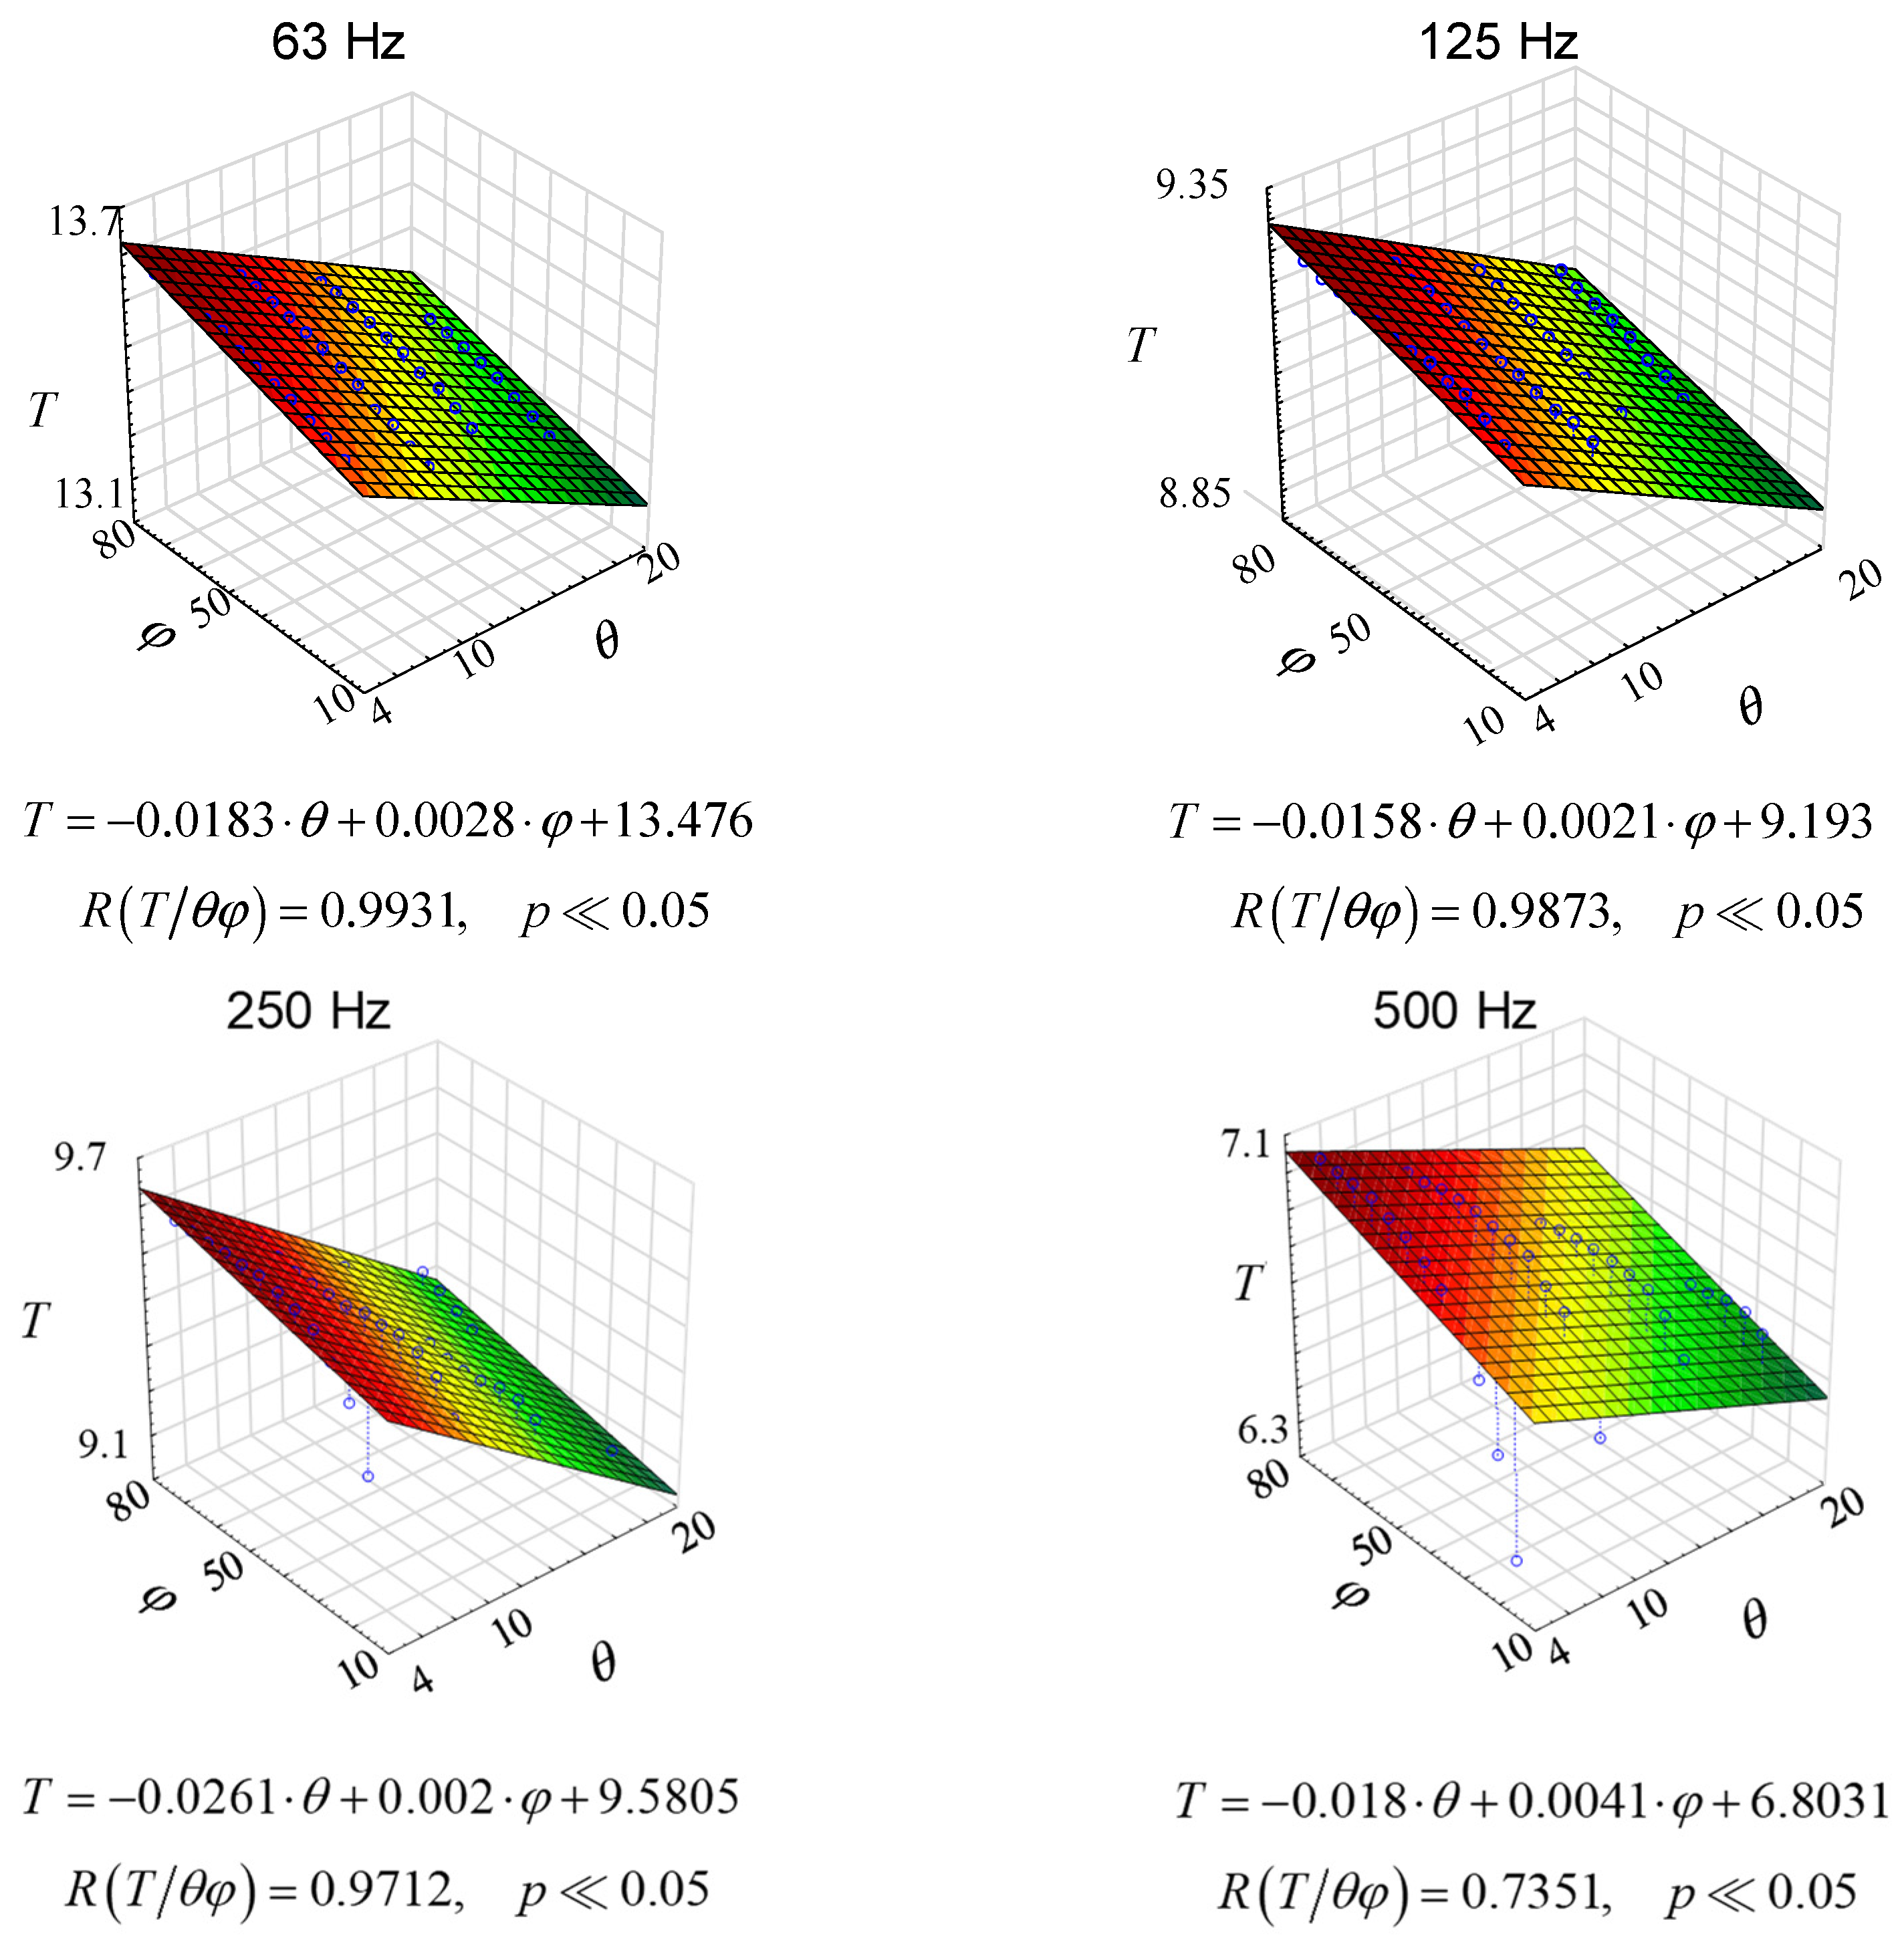
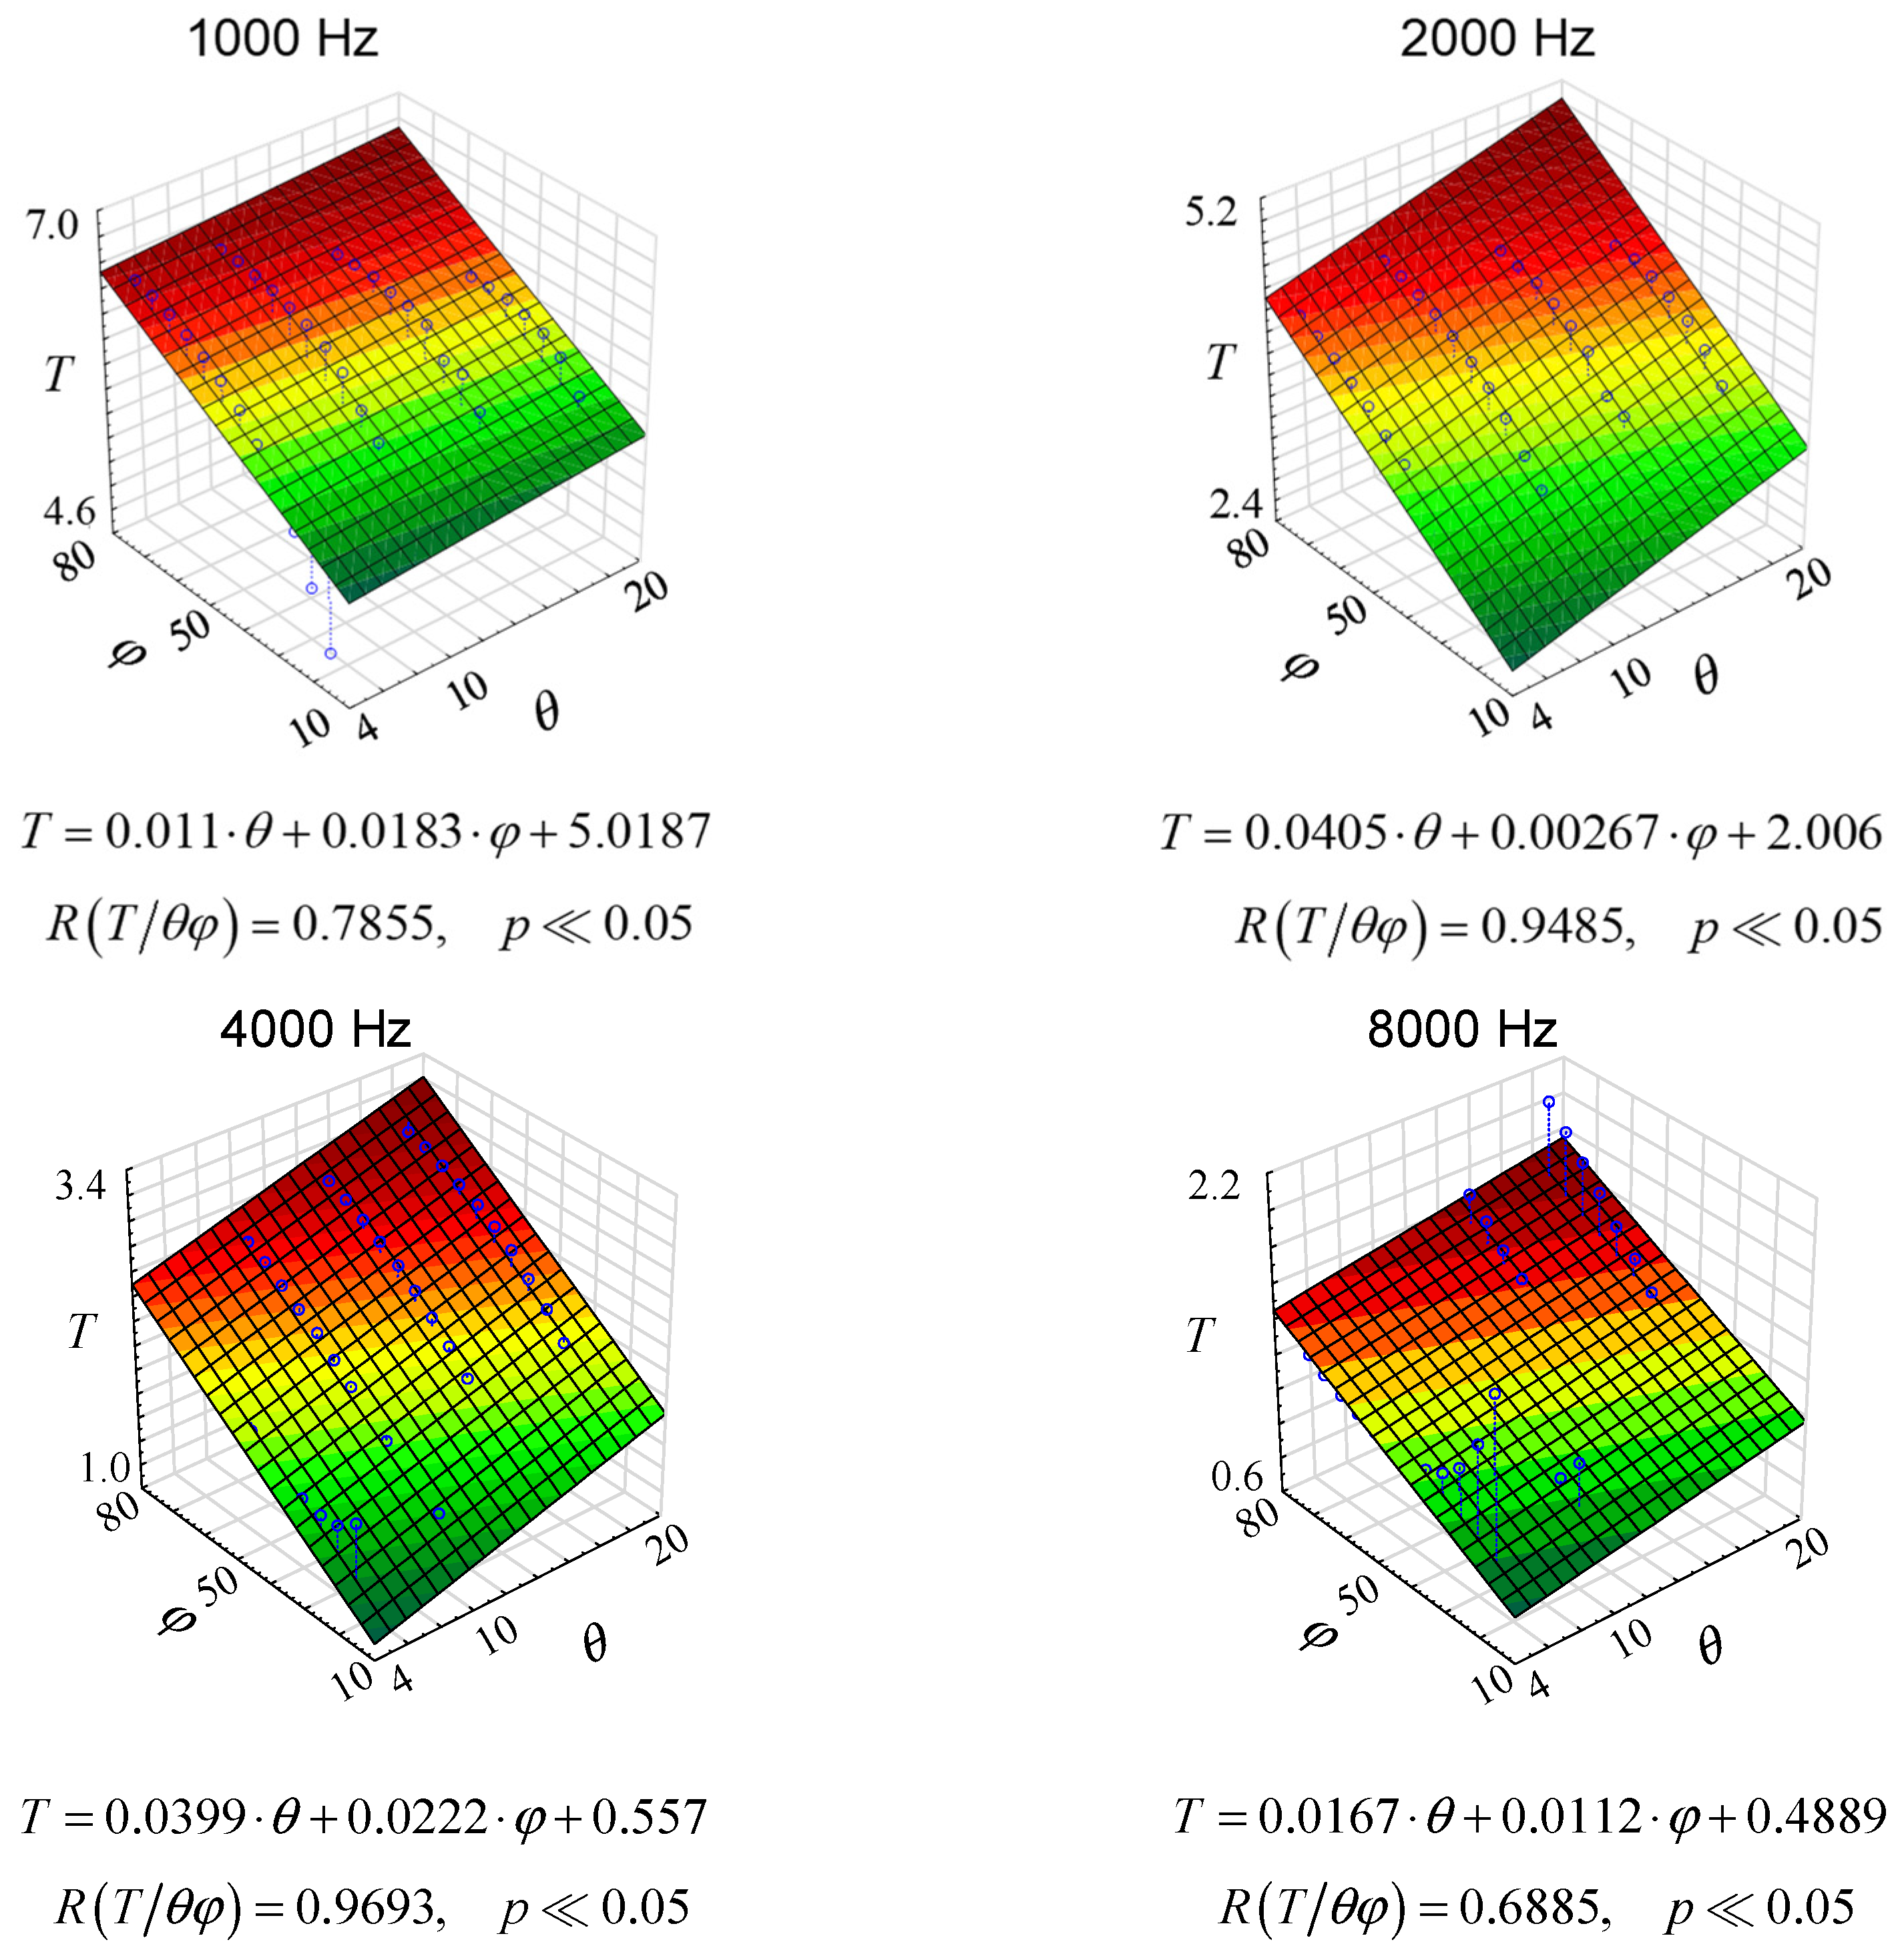
Since there are changes in the reverberation conditions in the room, both with the changes in temperature and with the changes in the relative humidity of the air, the three-dimensional graphs shown in Figure 9 were proposed.
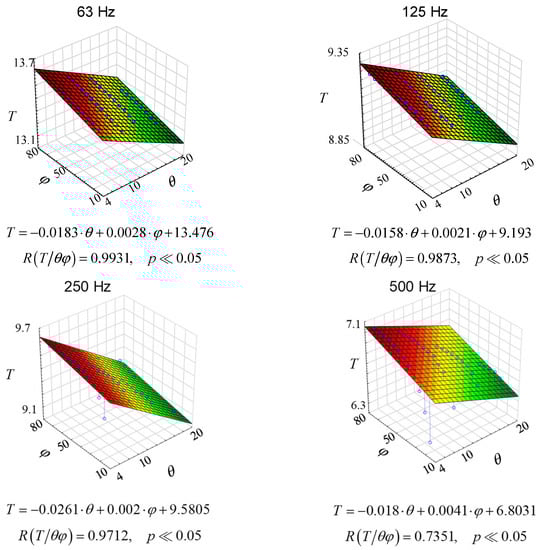

Figure 9.
Reverberation times as a function of humidity and air temperature for octave frequencies, where φ stands for relative humidity and θ stands for air temperature.
As it can be seen from the graphs in Figure 9, multiple correlations are different for each case. In fact, it is quite logical because, as shown, e.g., in Figure 7 or 8, the changes are non-linear. Yet, Figure 9 contributes something to the general knowledge. Firstly, the linear coefficients are quite high, which leads to the conclusion that there is a linear correlation between the reverberation time in a room and the thermo-hygrometric condition. Secondly, the changes in reverberation time under different thermo-hygrometric conditions are significant, which suggests that thermo-hygrometric conditions should be taken into account when estimating reverberation time. This conclusion is important primarily for rooms with long reverberation.
4. Conclusions
The article examines the impact of the main environmental variables on the changes in reverberation time in a room. The reverberation time was measured at different temperatures and at different values of relative humidity in laboratory rooms, and then it was determined by simulation. It should be noted that it is not possible to control the thermo-hygrometric parameters. To be precise, it is impossible to change the temperature while maintaining constant relative air humidity, and it is also impossible to maintain constant relative humidity when changing air temperature during the measurements of reverberation time. Therefore, empirical studies involving the reverberation time under various thermo-hygrometric conditions were obtained in the course of a dozen or so months of research. The aim of these studies was to observe the impact of thermo-hygrometric changes on the obtained reverberation time values. Only after this finding I have suggested to carry out controllable simulation research.
The simulation studies have led to some conclusions:
- The nature in the changes of reverberation time depending on temperature and relative air humidity is completely different for different frequency bands.
- The nature of the changes in the reverberation time as a function of relative humidity for the same frequency band is different for the changing air temperatures—see, e.g., the center frequency of 250 Hz for the temperatures of 10 °C and 15 °C.
- The nature of the reverberation time changes as a function of the temperature for the same frequency band and is different for the changing relative air humidity.
- The impact involving the changes in the relative air humidity on the change of the reverberation time characteristics as a function of frequency is much smaller than the impact of temperature change.
Summarizing the obtained results, it can be observed that with the rise of the temperature and air humidity, the reverberation time, on average, increases (differently in different frequency bands). It should be noted that the article concerns a highly reverberant room, and hence the influence of temperature changes and air humidity is particularly strong. However, architects can take these results into account when designing soundproofed rooms (e.g., auditoriums) that have large volumes, where the absorption by air plays an important role. The reverberation time significantly affects the Speech Transmission Index, which was demonstrated in the work of Leccese et al. [4] and Nowoświat et al. [5]. When designing rooms, architects should take into account the impact of the usage temperature and air humidity of the rooms on the reverberation time.
Funding
This research received no external funding.
Institutional Review Board Statement
Not applicable.
Informed Consent Statement
Not applicable.
Data Availability Statement
The author has all the data.
Conflicts of Interest
The author declares no conflict of interest.
References
- Reinten, J.; Braat-Eggen, P.; Horniks, M.; Kort, H.S.M.; Kohlrausch, A. The indoor sound environment and human task performance: A literature review on the role of room acoustics. Build. Environ. 2017, 123, 315–332. [Google Scholar] [CrossRef]
- Aretz, M.; Orlowski, R.I. Sound strength and reverberation time in small concert halls. Appl. Acoust. 2009, 70, 1099–1110. [Google Scholar] [CrossRef]
- Tang, S.K.; Yeung, M.H. Reverberation times and speech transmission index in classrooms. J. Sound Vib. 2006, 294, 596–607. [Google Scholar] [CrossRef]
- Leccese, F.; Rocca, M.; Salvadori, G. Fast estimation of Speech Transmission Index using the Reverberation Time: Comparison between predictive equations for educational rooms of different sizes. Appl. Acoust. 2018, 140, 143–149. [Google Scholar] [CrossRef]
- Nowoświat, A.; Olechowska, M. Fast estimation of Speech Transmission Index using the Reverberation Time. Appl. Acoust. 2016, 102, 55–61. [Google Scholar] [CrossRef]
- Nowoświat, A.; Olechowska, M. Investigation studies on the application of reverberation time. Arch. Acoust. 2016, 41, 15–26. [Google Scholar] [CrossRef] [Green Version]
- Montoya, J.C. Comparison and analysis of the methods defined by ASTM standard E2235-04, ISO 3382-2-2008 and EASY acoustical modeling software to determine reverberation time RT60 in ordinary rooms. J. Acoust. Soc. Am. 2017, 142m, 2508. [Google Scholar] [CrossRef]
- Rosenhouse, G. Reverberation time analysis for nonrectangular rooms using the Monte Carlo method. J. Acoust. Soc. Am. 2017, 141, 3711. [Google Scholar] [CrossRef]
- Meissner, M. Acoustics of small rectangular rooms: Analytical and numerical determination of reverberation parameters. Appl. Acoust. 2017, 120, 111–119. [Google Scholar] [CrossRef]
- Zhou, X.; Späh, M.; Henghst, K.; Zhang, T. Predicting the reverberation time in rectangular rooms with non-uniform absorption distribution. Appl. Acoust. 2021, 171, 107539. [Google Scholar] [CrossRef]
- Brandäo, E.; Santos, E.S.O.; Melo, V.S.G.; Tenenbaum, R.A.; Mereze, P.H. On the performance investigation of distinct algorithms for room acoustics simulation. Appl. Acoust. 2022, 187, 108484. [Google Scholar] [CrossRef]
- Tronchin, L. Variability of room acoustic parameters with thermo-hygrometric conditions. Appl. Acoust. 2021, 177, 107933. [Google Scholar] [CrossRef]
- Winkler-Skalna, A.; Nowoświat, A. Use of n-perturbation interval ray tracing method in predicting acoustic field distribution. Appl. Math. Model. 2021, 93, 426–442. [Google Scholar] [CrossRef]
- ISO 9613-1:1993; Acoustics—Attenuation of Sound during Propagation Outdoors-Part 1: Calculation of the Absorption of Sound by the Atmosphere. International Organization for Standardization, Geneva, Switzerland, 1993.
- ISO 354:2003; Acoustics—Measurement of Sound Absorption in a Reverberation Room. International Organization for Standardization, Geneva, Switzerland, 2003.
- Nowoświat, A.; Olechowska, M.; Marchacz, M. The effect of acoustical remedies changing the reverberation time for different frequencies in a dome used for worship: A case study. Appl. Acoust. 2020, 160, 107143. [Google Scholar] [CrossRef]
- Berardi, U. Simulation of acoustical parameters in rectangular churches. J. Build. Perform. Simul. 2014, 7, 1–16. [Google Scholar] [CrossRef]
- Harris, C. M Absorption of sound in air in the audio-frequency range. J. Acoust. Soc. Am. 1963, 35, 11–17. [Google Scholar] [CrossRef]
- Nowoświat, A.; Bochen, J.; Dulak, L.; Żuchowski, R. Investigation studies involving sound absorbing parameters of roadside screen panels subjected to aging in simulated conditions. Appl. Acoust. 2016, 111, 8–15. [Google Scholar] [CrossRef]
- Nowoświat, A.; Olechowska, M. Experimental validation of the model reverberation time prediction in room. Buildings 2022, 12, 347. [Google Scholar] [CrossRef]
- Lannace, G.; Berardi, U.; De Rossi, F.; Mazza, S.; Trematerra, A.; Ciaburro, G. Acoustic Enhancement of a modern church. Buildings 2019, 9, 83. [Google Scholar]
- Zeng, X.; Christensen, C.L.; Rindel, J.H. Practical methods to define scattering coefficients in a room acoustics computer model. Appl. Acoust. 2006, 67, 771–786. [Google Scholar] [CrossRef]
- Stern, F.; Wilson, R.; Coleman, H.; Paterson, E.G. Comprehensive approach to verification and validation of CFD simulations—Part 1: Methodology and procedures. J. Fluids Eng. 2001, 123, 793–802. [Google Scholar] [CrossRef]
- Marbjerg, G.; Brunskog, J.; Jeong, C. The difficulties of simulating the acoustics of an empty rectangular room with an absorbing ceiling. Appl. Acoust. 2018, 141, 35–45. [Google Scholar] [CrossRef]
- Nowoświat, A. Application of Perturbation Methods in the Acoustic Assessment of Interiors for the Reception of Verbal Sounds; Wyd. Politechniki Śląskiej: Gliwice, Poland, 2019. [Google Scholar]


Publisher’s Note: MDPI stays neutral with regard to jurisdictional claims in published maps and institutional affiliations. |
© 2022 by the author. Licensee MDPI, Basel, Switzerland. This article is an open access article distributed under the terms and conditions of the Creative Commons Attribution (CC BY) license (https://creativecommons.org/licenses/by/4.0/).