Article

The Over-Strength Coefficient of Masonry-Infilled RC Frame Structures under Bidirectional Ground Motions

1
Key Laboratory of Earthquake Engineering and Engineering Vibration, Institute of Engineering Mechanics, China Earthquake Administration, Harbin 150080, China
2
Key Laboratory of Earthquake Disaster Mitigation, Ministry of Emergency Management, Harbin 150080, China
3
School of Civil Engineering, Yantai University, Yantai 264005, China
4
Department of Civil & Environmental Engineering, University of Alberta, Edmonton, AB T6G 2R3, Canada
*
Author to whom correspondence should be addressed.
Buildings 2022, 12(9), 1290; https://doi.org/10.3390/buildings12091290
Submission received: 16 July 2022 / Revised: 10 August 2022 / Accepted: 11 August 2022 / Published: 23 August 2022
(This article belongs to the Special Issue Resilience-Based Structural Seismic Design and Evaluation)

Abstract

:
The over-strength coefficient is one of the key factors for the seismic safety of a structure. For RC frames, the infill wall may improve the lateral bearing capacity, while the seismic demand increases as well, which leads to the unexpected seismic performance of an infilled RC frame in past earthquakes. Therefore, it is necessary to systematically study the over-strength effect of the infilled RC frames from the point of seismic capacity and demand. In this paper, 36 RC frame structures with/without infill walls are designed, and the corresponding finite element modelings, considering the in-plane and out-of-plane performance coupling effect of infill walls, are established to conduct incremental dynamic analyses (IDA). The seismic capacity values of over-strength coefficients are calculated, utilizing the IDA results under bidirectional ground motions. The effects of seismic precautionary intensity and number of stories on the over-strength coefficient of the RC frame with/without infill walls are discussed. The over-strength coefficient capacity value of the infilled frame is apparently higher than that of the bare frame, due to the contribution of infill walls. However, the seismic demand analysis of the over-strength coefficient shows that the capacity–demand ratio of masonry-infilled RC frame structures is greatly reduced, especially for the bottom soft-story infilled frame.

1. Introduction

In the FEMA-P695 report of the project ATC-63 [1], the overall seismic performance coefficient is a general term for the response modification coefficient, the system over-strength coefficient and the displacement amplification coefficient. The system over-strength coefficient refers to the ratio of the actual strength to the design strength of the structure, which reflects the structural strength reserve. The effect of system over-strength has been confirmed in previous earthquake damage investigations and shaking table tests of reinforced concrete structures and steel structures [2,3,4,5,6]. The source of the system over-strength is quite complicated, which can be attributed to three aspects: design over-strength, material over-strength and structural over-strength [7,8].
At present, the values of system over-strength coefficients in seismic design codes or standards of different countries are determined according to engineering experience, and the values vary greatly. Therefore, it has attracted extensive attention worldwide, and a lot of research work on the over-strength coefficient has been carried out. Osteraas and Krawinkler [9] adopted a pushover analysis method to systematically study the over-strength coefficient of steel frames designed according to the allowable stress design method. The results show that the over-strength coefficient of the flexural steel frame is between 8.0 and 2.1, and the over-strength coefficient of the center-supported steel frame is between 2.8 and 2.2. Rahgozar and Humar [10] studied the over-strength coefficient of flexural steel frames with different heights. The structural strength reserve (i.e., the structural over-strength effect) decreases with the increase in the height, and the P-∆ effect makes the structural reserve strength further decrease. Calderoni et al. [11] studied the seismic performance of steel frames under different precautionary intensities and pointed out that the existence of the over-strength ensured that the structure had a certain anti-collapse ability. Balendra and Huang [12] analyzed the behavior of 3, 6 and 10 stories of flexural steel frames designed by British standard BS5950 by using pushover analysis. This shows that the steel frame has good over-strength effect and ductility, and the over-strength coefficient for the steel frame structures with X-bracing and Y-bracing is further increased. Stefano et al. [13] studied the effect of the over-strength effect of the element cross-section on the performance of the irregular structure. Rossi and Lombardo [14] studied the effect of node connection on over-strength of eccentric braced frame structures with different stories.
In the specifications of different countries, the provisions of the over-strength coefficient are different. Wei et al. [15] compared the relevant provisions on the system over-strength in the design codes of various countries. Zhai and Xie [16] quantitatively analyzed the over-strength coefficient of RC frame structures designed according to the Chinese seismic code. Zhou et al. [17] analyzed the influence of various factors on the over-strength capability of the RC frame structure. Ma and Cao [18] studied the influence of the number of spans and the precautionary intensity on the system over-strength coefficient of the frame structures. Xin et al. [19] discussed the reasonable value of the system over-strength coefficient in the displacement-based seismic design method. Kuylmaz and Topkaya [20] studied the over-strength effect of eccentrically braced steel frames, indicating that the over-strength effect is mainly affected by the length and span of the bracing, and secondly by the precautionary intensity and the height of the structure. Elnashai and Mwafy [21] discussed the influence of periodic variation on the over-strength coefficient and the relationship between the over-strength coefficient and the response modification coefficient. Dickof et al. [22] studied the over-strength coefficient and ductility coefficient of wood–steel composite structures. It is recommended that the over-strength coefficient be 1.25 and the ductility coefficient be 2.5. Cui et al. [23] studied the effect of infill walls and floors on the system over-strength of RC frame structures. Li et al. [24] analyzed the over-strength coefficient of infill wall RC frame structures by using adaptive POA and IDA. Johnson and Dowell [25] evaluated the over-strength coefficient for nonstructural component anchorage into concrete via dynamic shaking table tests. Xin [26] studied the over-strength coefficient of the steel grid box frame structure under different pushover methods and IDA method. The importance of the over-strength coefficient is much larger than that of the structural ductility reduction coefficient. Abraik and Youssef [8] evaluated the ductility and over-strength of shape–memory-alloy reinforced concrete shear walls. It can be seen that there are few studies focusing on the over-strength coefficient of RC frame structures with infill walls. In the most recent earthquake events, masonry-infilled RC frame structures exhibited unfavorable failure phenomenon, although the infill wall can improve the bearing capacity of the structure [27]. On the contrary, the research indicates that the seismic demand of the infilled RC frame increases compared to the bare frame [28]. Therefore, it is necessary to systematically study the over-strength effect of the infilled RC frames from the point of seismic capacity and demand.
In this paper, 36 representative masonry-infilled RC frame structures are designed according to Chinese seismic design codes, and a simplified finite element modeling technique, considering in-plane and out-of-plane performance coupling effect of infill walls, is presented. The corresponding finite element modelings for the designed structures are built in OpenSees [29]. Then, 20 pairs of ground motions are selected, the averaged response spectrum of which is in agreement with the designed response spectrum and is utilized to carry out incremental dynamic analyses under bidirectional ground motions [30,31]. The capacity values of over-strength coefficients are calculated to analyze the effects of seismic precautionary intensity and number of stories on the over-strength coefficient of RC frame with/without infill walls. The capacity–demand ratio of the over-strength coefficient for the 36 structures is analyzed as well.

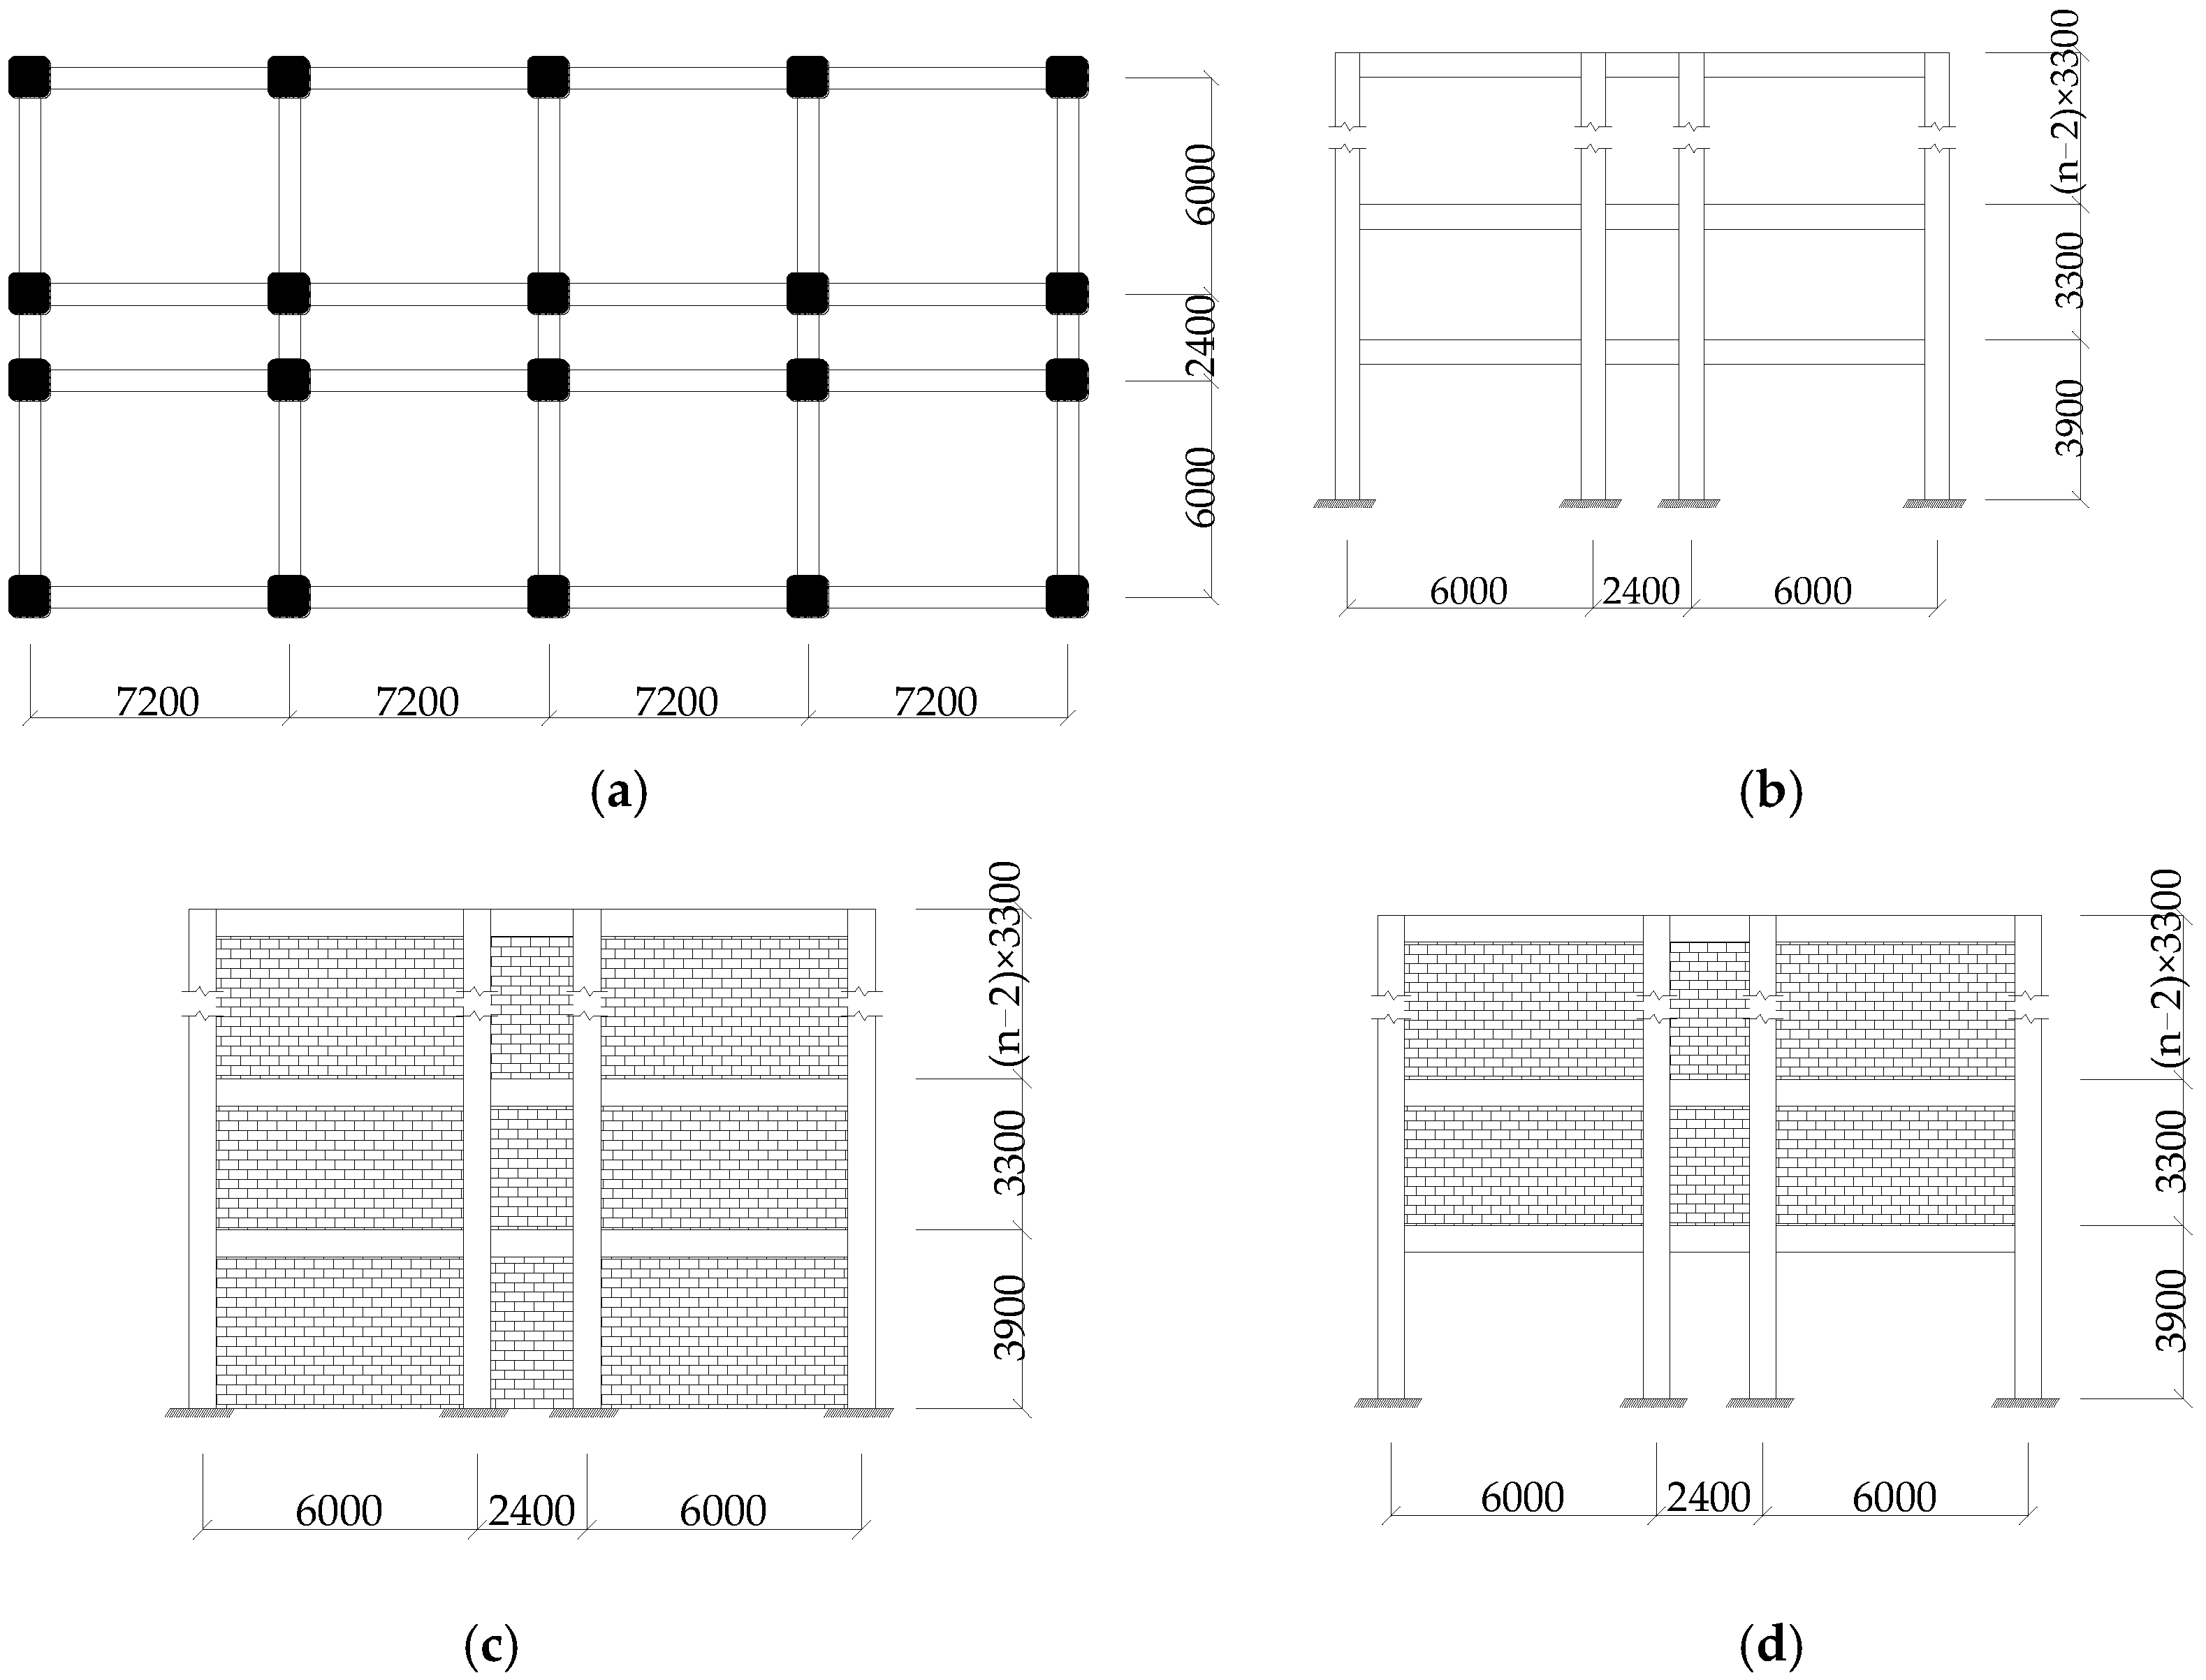
2. Design of Masonry-Infilled RC Frame Structures

In this section, in accordance with the Chinese seismic code [32], a series of representative masonry-infilled RC frame structures with 3, 6, 9 and 12 stories and in the level VI (0.05 g), VII (0.1 g), and VIII (0.2 g) of seismic precautionary intensity regions are designed, respectively. The seismic precautionary intensity means that the structure is expected to have recoverable performance when it is subjected to the corresponding PGA value [33].
The plan of all structures is the same, as shown in Figure 1a. The elevations of the different structures with/without infill walls are shown in Figure 1b–d, in which the height of the ground story is 3.9 m, and the height of other stories is 3.3 m. The design information includes: basic wind pressure is 0.55 kN/m2, ground roughness belongs to Class C, basic snow pressure is 0.30 kN/m2, dead load of floor is 5.0 kN/m2, and live load of floor is 2.5 kN/m2. Moreover, an inaccessible roof is adopted, and the live load of the roof is 0.5 kN/m2. Site classification belongs to Site II, and the site characteristic period is 0.35 s.
The compressive strength of the concrete of the columns and beams is 30 MPa, the strength of longitudinal reinforcement is 400 MPa, and the hooping strength is 235 MPa. The details of the reinforcement can be seen in Reference [28]. The dimensions of the beams and columns are listed in Table 1. The thickness of the floor is 100 mm, and the thickness of the infill wall is 200 mm. The concrete hollow block, a widely used construction material in China, is used for infill wall, and the compressive strength of the block is 2.8 MPa.
To evaluate the effect of infill walls on the seismic performance of frame structures, three different infill wall arrangements were considered: (a) The effects of stiffness and load bearing capacity of the infill wall are not considered, and the structure is regarded as a bare frame with only the mass of the infill wall imposed on the beam-column joints. (b) The effects of stiffness and load bearing capacity of the infill wall are considered, the infill wall is in full layout, and it is simulated by a simplified analysis model. (c) The frame with a soft-story at the bottom story, a usual arrangement for infill walls, is also analyzed. These three types of frame structures are represented by F, IF, and IFE, respectively, and the three seismic precautionary intensity levels are represented by −6, −7 and −8, respectively. On this basis, these structures can be numbered by combining the number of stories (e.g., F3-6 represents a three-story bare frame structure for seismic precautionary intensity VI). In summary, 36 RC frame structures were analyzed in this paper.

3. Finite element Modeling Technology

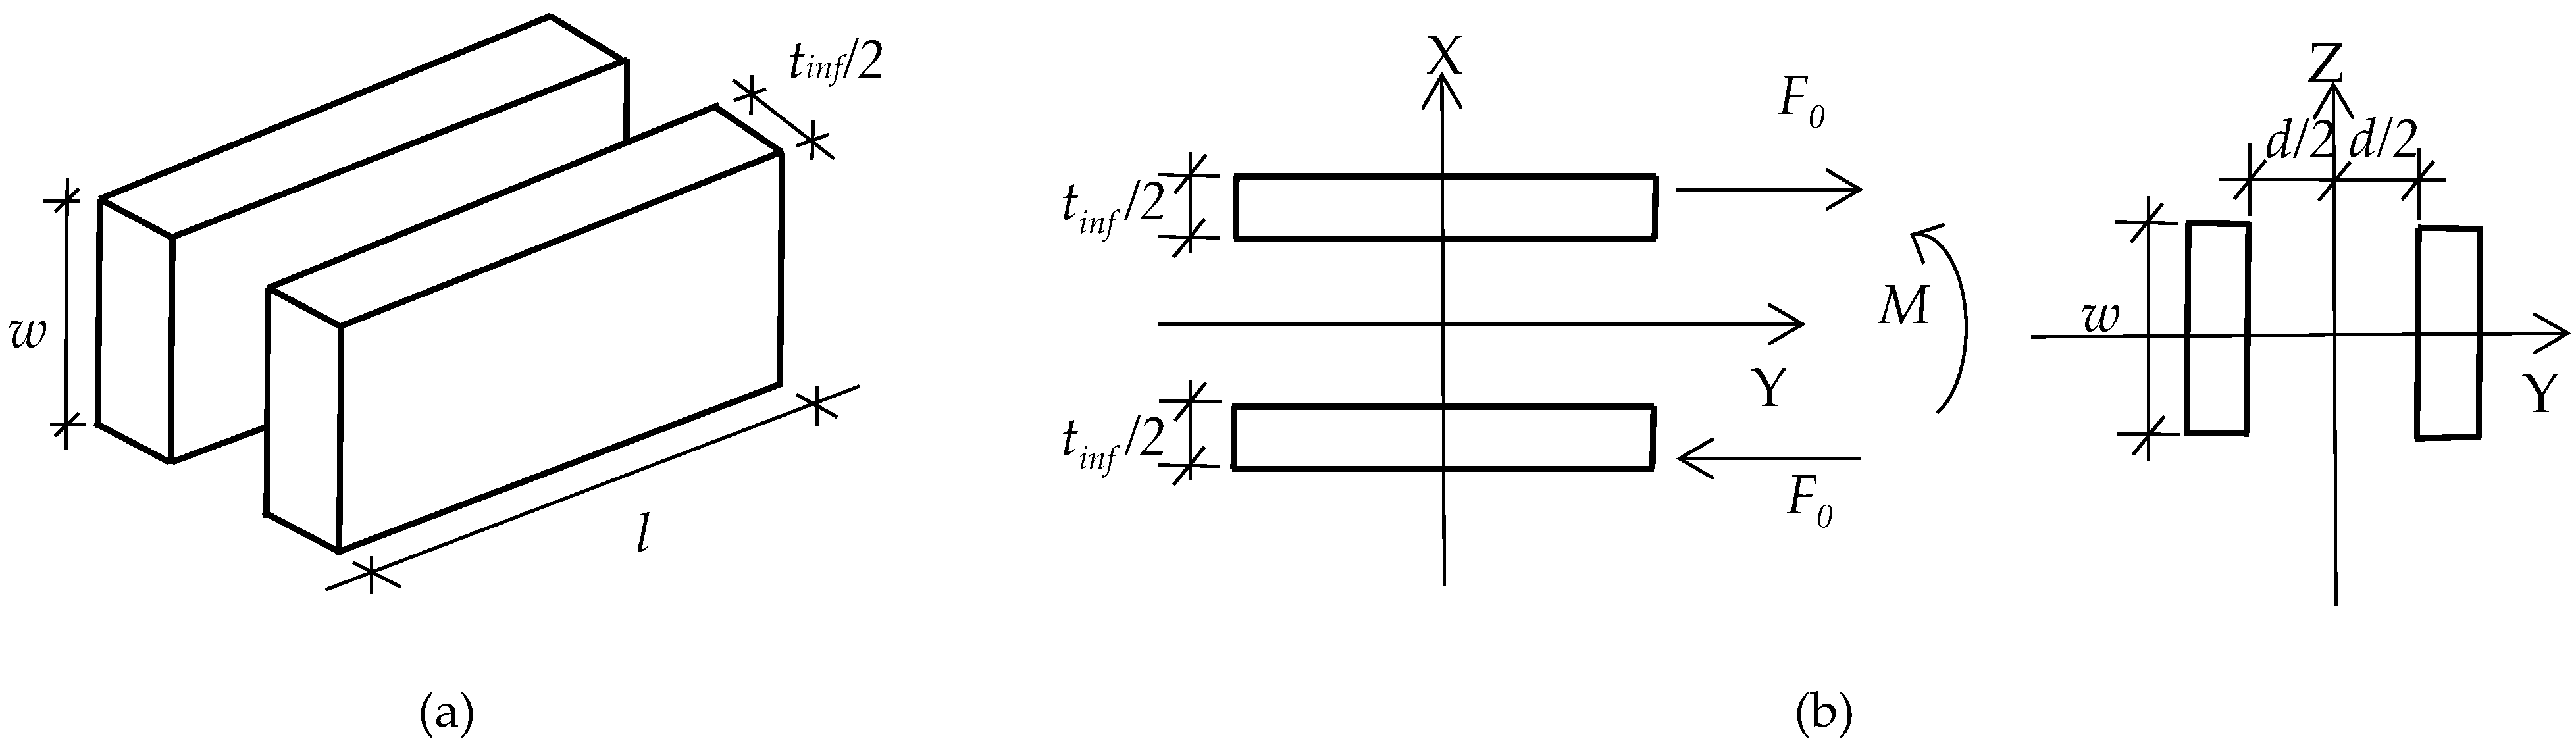
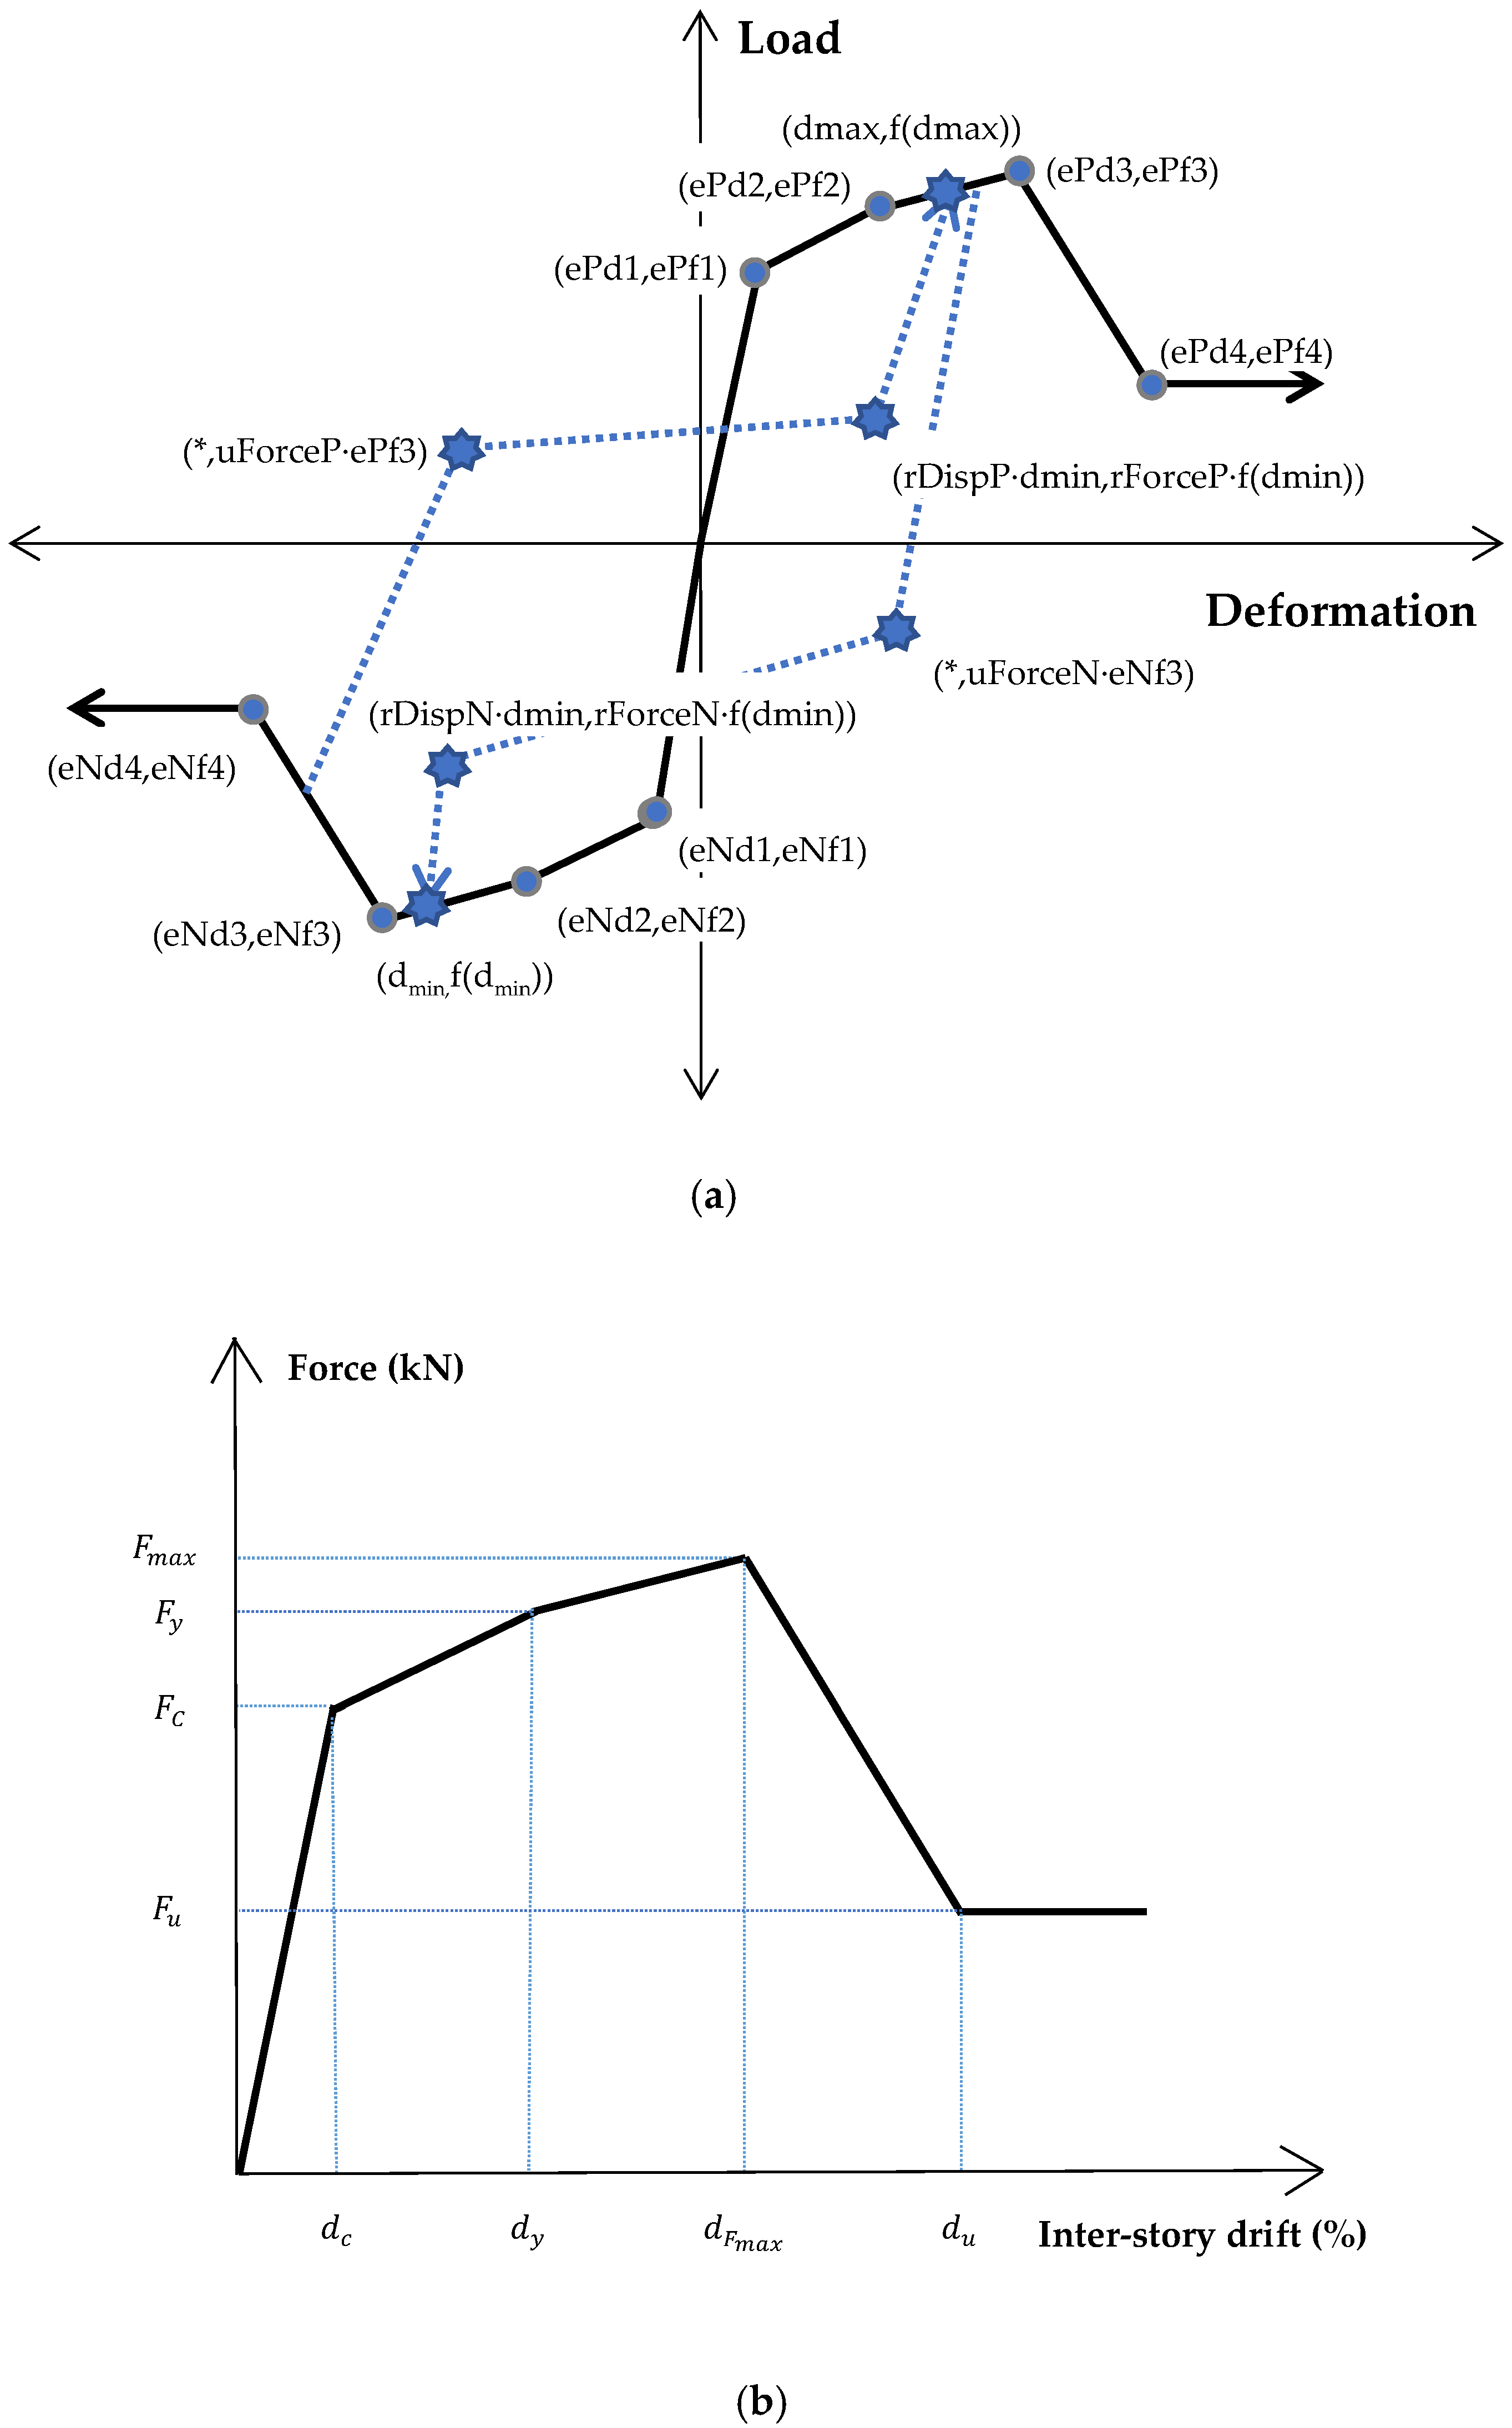
3.1. Modeling of Frames and Infill Walls

Three-dimensional finite element modelings for these 36 RC frame structures are built and simulated in OpenSees. The beam and column elements are modeled by using displacement-based beam-column elements, and the element sections are composed of fiber sections. The fiber section model is close to the actual mechanical performance in the modeling of RC frame structures [34]. For the concrete, the uniaxial material model Concrete02 is used. In order to consider the improvement of concrete strength caused by the lateral restraint of the stirrups, the core area of the section is composed of confined concrete. The improved characteristic parameters for the confined concrete is determined by the Kent–Scott–Park model [35]. For the steel, the uniaxial material model Steel01 is adopted, which is widely used due to its high computational efficiency.
The infill wall is simulated by a simplified five-element model constituted of four diagonal beam elements with rigid behavior, a central horizontal beam element representing the in-plane and out-of-plane non-linear hysteretic behavior of the infill wall, and the two nodes at the ends of the central element with the wall mass, as shown in Figure 2. More specifically, when the infill wall is subjected to in-plane loads, the central element section is subjected to tension and compression to represent the performance of the infill wall; when the infill wall is subjected to out-of-plane loads, the central element is subjected to bending moments, and half of the fibers on the section are in tension and half in compression, as shown in Figure 3. Since the two fibers in the section have a certain distance from the center of the wall, the model can better reflect the arch mechanism in out of plane of the infill wall.
The material constitutive model of the central element adopts the Pinching4 model, as shown in Figure 4. The skeleton curve of the Pinching4 model is defined by eight points as shown in the solid line, and the unloading and reloading path is shown in the dotted line. Compared with other material models such as Hysteretic [36,37], Concrete01 in OpenSees, Pinching4 material can simulate the strength degradation, stiffness degradation and increase in deformation caused by loading and unloading, which gives Pinching4 material a great advantage in simulating in-plane and out-of-plane damage interactions in the infill wall [38,39].
The determination of the mechanical performance of the infill wall needs to first determine the skeleton curve. The tension and compression parts of the skeleton curve used in this paper are the same, and the load and displacement values for the four characteristic points are shown is Figure 4b and are determined as follows [40,41]:
* The ratio of the cracking strength F c to the peak strength F m a x is taken as 0.55, and the cracking inter-story drift ratio d c is between the values 0.075% and 0.12%.
* The yielding strength F y and inter-story drift ratio d y are the intermediate values between the coordinate values of the cracking and peak points, that is, F y = ( F m a x + F c ) / 2 , and d y = ( d F m a x + d c ) / 2 .
* The in-plane peak strength of the infill wall generally occurs when the inter-story drift ratio is between 0.25% and 0.5%. The peak strength F m a x can be calculated by the following formula:
F m a x = 0.818 L i n f t i n f f t p C
C = ( 1 + C 1 2 + 1 ) / C 1
C 1 = 1.925 L i n f h i n f
where f t p is the masonry cracking strength, which can be taken as 1/9 to 1/10 of the masonry compressive strength f c , and f c can be easily obtained through experimental tests, L i n f is the length of the infill wall, t i n f is the thickness of the infill wall, and h i n f is the height of the infill wall.
* The residual strength F u is adopted as 20% of the F m a x , and the corresponding residual inter-story drift ratio d u is five times the d F m a x .
In addition, the hysteresis rule of the pinching4 model takes into account the stiffness degradation, strength degradation and pinching effect of the infill wall through three parameters α, β and γ.

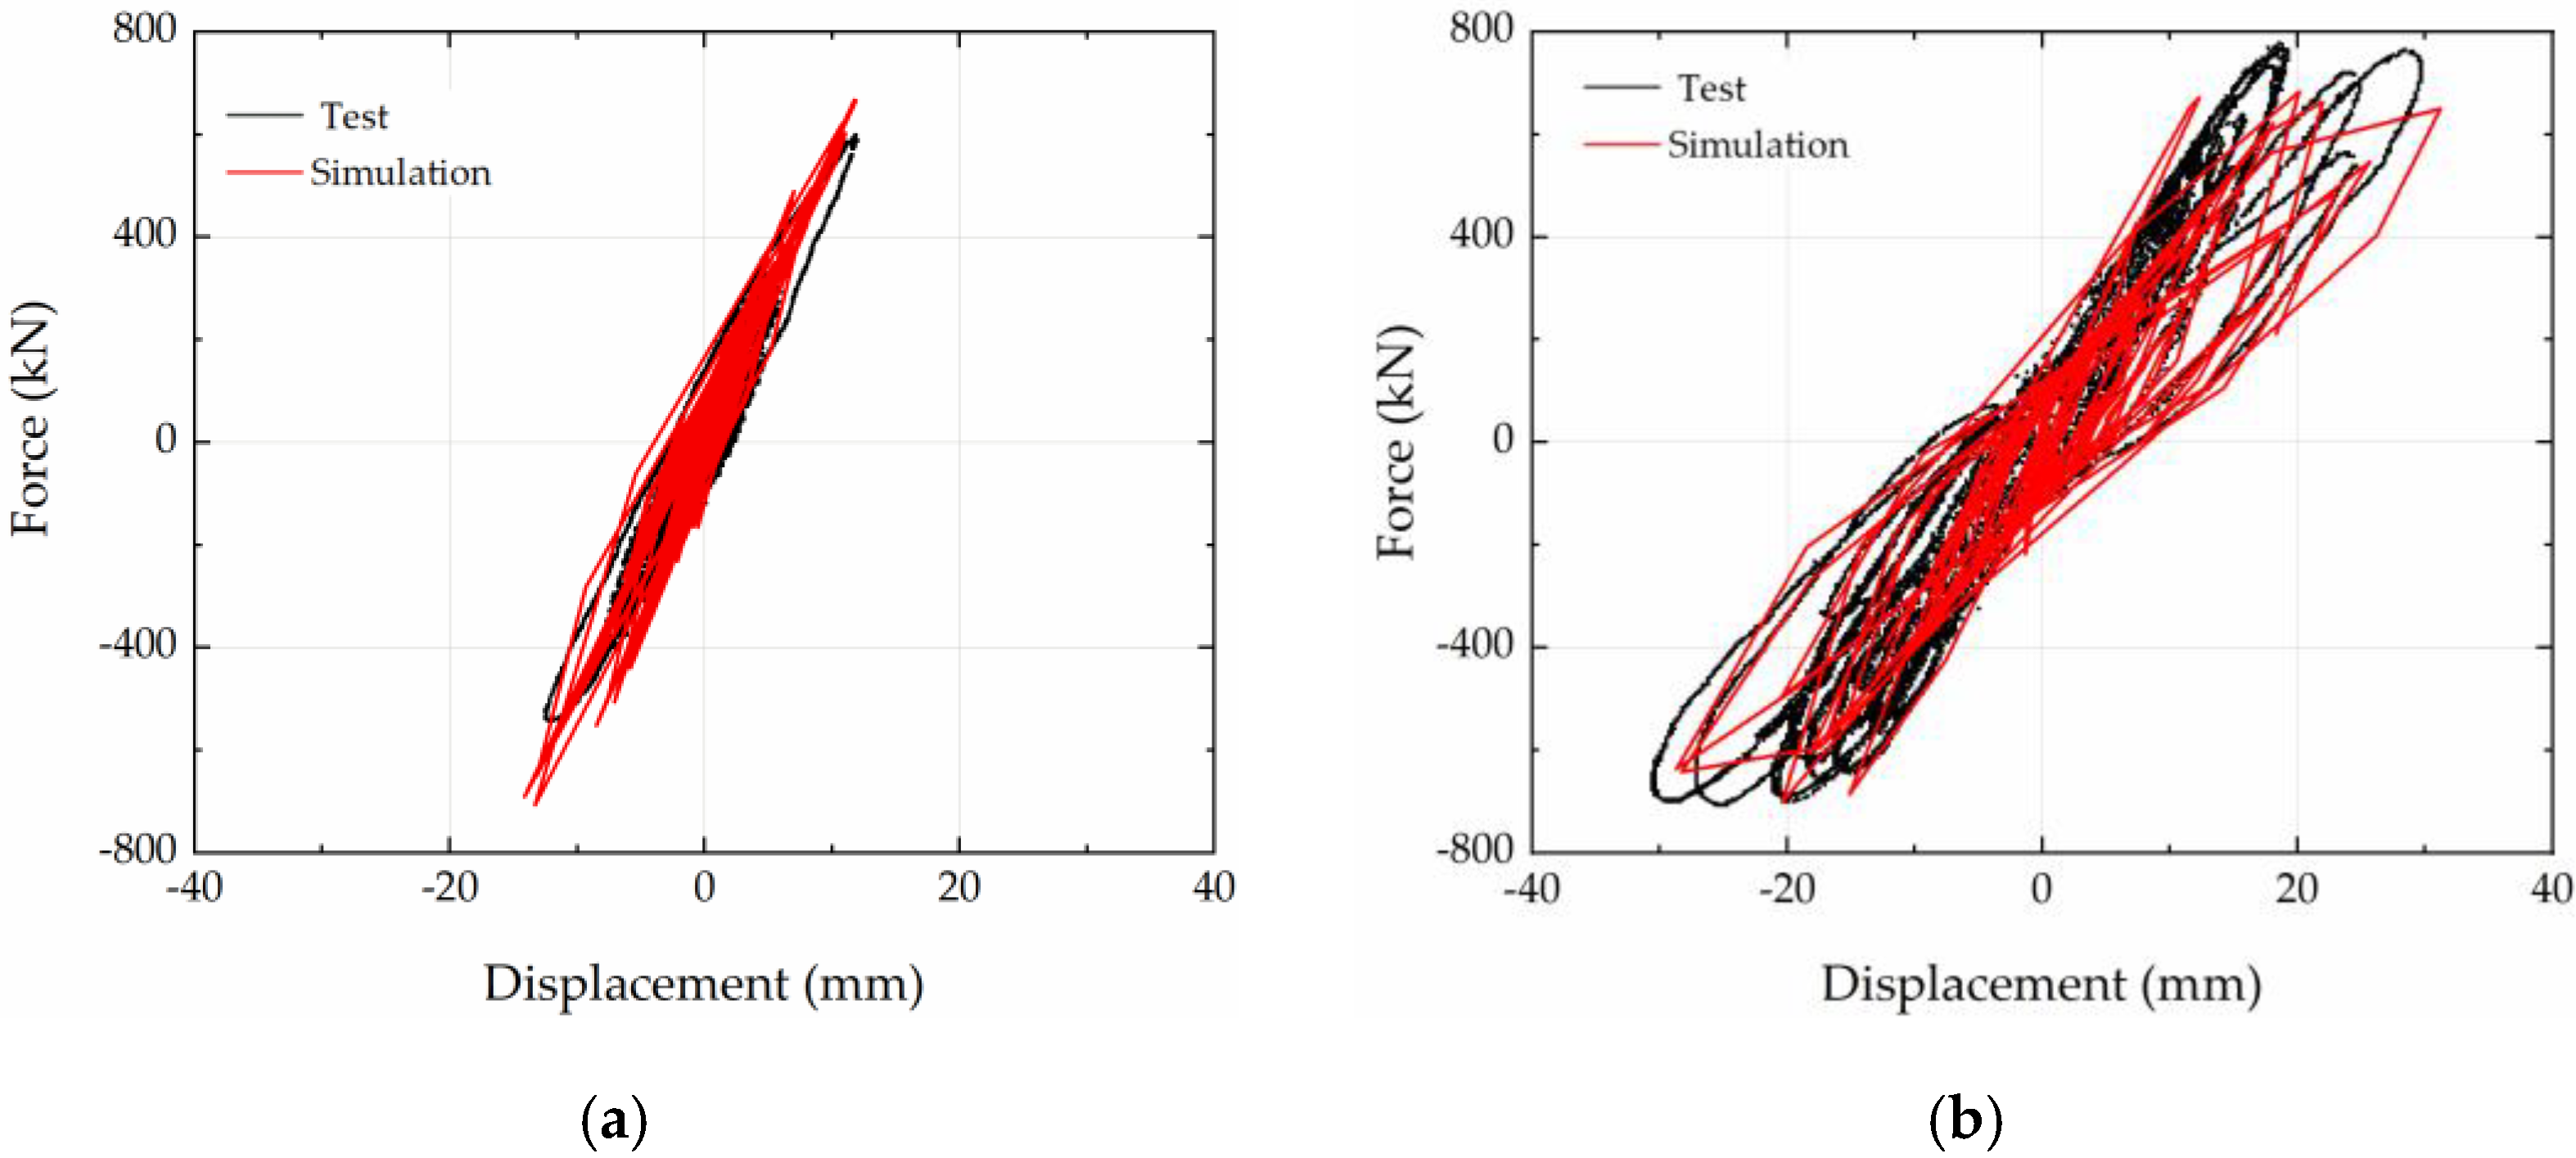
3.2. Verification of Finite Element Modeling

A shaking table test of an infilled RC frame specimen was adopted to verify the accuracy of the simplified model in simulating the in-plane and out-of-plane interaction effects of infill walls. The test was performed by Hashemi and Mosalam [42]. The test specimen is a substructure of a five-story multi-span infilled frame structure, and the ground motion is applied to the specimen in a direction perpendicular to the infill wall.
The relationship between the base shear force and the top displacement of the test specimen under the action of the two ground motions is shown in Figure 5, the time history curve of the base shear force for ground motion Tar6 case is shown in Figure 6, and the relative error is listed in Table 2. It can be seen that the finite element simulation results are in good agreement with the test results, and the pinch effect and loading and unloading trends are roughly the same. The relative error between the numerical values and the test values in terms of bearing capacity and stiffness is small, the peak bearing capacity is within 20%, and the initial stiffness is within 10%. Generally, the simplified model can simulate the performance of infill walls under the action of ground motion well.

4. Ground Motions

In this paper, 20 pairs of ground motions recommended by the report FEMA-P695 [43] were adopted for incremental dynamic analysis (IDA) and were further used for structural over-strength coefficient analysis. The 20 pairs of ground motions include ten pairs of far-field ground motions, five pairs of near-field pulsed ground motions, and five pairs of near-field non-pulsed ground motions. Table 3 lists the related information of these ground motions, where PGA ranges from 0.15 to 1.2 g, and PGA/PGV ranges from 0.3 to 2.9 g/(cm/s).
Taking the seismic precautionary intensity VI as an example, the peak acceleration value of each ground motion is adjusted to 0.035 g for the more frequent case, 0.1 g for the precautionary case, 0.22 g for the rare case, and 0.32 g for the extremely rare case [44,45]. After calculating the response spectrum of each ground motion, the average response spectrum and the seismic design response spectrum of four different intensities are plotted in Figure 7. It can be seen that the averaged response spectrum is in good agreement with the designed response spectrum in the short period, which meets the analysis requirements.

5. Over-Strength Coefficient Capacity Analysis

5.1. Introduction of Over-Strength Coefficient Capacity Analysis

In earthquake damage investigations, it has been shown that the actual seismic capacity of the structure is generally higher than the designed seismic capacity, which is referred to as the system over-strength effect. The existence of system over-strength is an important factor that prevents the structure from collapsing when subjected to strong earthquakes greater than the design seismic force [35,40,46]. The system over-strength coefficient Rs can be defined as the ratio of the actual yielding strength of the structure to the design seismic force, which reflects the strength reserve of the structure. It can be calculated by the following formula:
R s = V y / V d
where V y is the yielding strength of the structure, and V d is the design seismic force.
The process of system over-strength coefficient analysis is as follow:
(1)
Perform incremental dynamic analysis (IDA) of the model under one pair of ground motion, obtain the maximum inter-story drift ratio under different ground motion levels, and plot the IDA curve of the model under this pair of ground motion.
(2)
Obtain the structural dynamic capacity curve in the form of maximum base shear force (Vmax) and maximum top displacement (∆max), then transform the dynamic capacity curve into a double-linear elastic–plastic curve by using the equal energy principle, and solve the equivalent yielding strength Vy of the structure.
(3)
Calculate the design seismic force Vd of the structure by using the bottom shear method or the mode-superposition response spectrum method.
(4)
Calculate the system over-strength coefficient Rs by its definition as shown in Formula (4).
(5)
Repeat the above steps to obtain the system over-strength coefficient under each pair of ground motion.
(6)
Take the median value as the system over-strength coefficient capacity value.

5.2. Over-Strength Coefficient Capacity Analysis of Infilled RC Frame Structure

According to the process described above, the incremental dynamic analysis is first performed. For the sake of brevity and the limitation of text space, only the IDA curves of the three structural models are given, as shown in Figure 8.
Then, structural dynamic capacity curves are obtained, and the median values of over-strength coefficients of 36 RC frame structures under bidirectional ground motion action are calculated, which are shown in Table 4 and Figure 9. It can be seen that the system over-strength coefficient capacity values of the bare frame structures designed according to different precautionary intensities of VI, VII and VIII are between 9.7–19.69, 5.24–9.01, 3.31–4.57, which are greater than 9.5, 5.0, 3.0, respectively. The over-strength coefficient capacity values of the fully infilled frame structures for different precautionary intensities are between 21.45–33.62, 11.52–20.51, 6.05–9.83, reaching 21.0, 11.5, and 6.0, respectively. The over-strength coefficient capacity values of the infilled frame structures with a bottom soft-story for different precautionary intensities are between 15.39–26.79, 9.76–18.41, 3.63–6.46, reaching 15.0, 9.5, 3.5, respectively.
Specifically, with the increase in the precautionary intensity, the over-strength coefficient shows a significant decrease trend regardless of the existence of the infill wall. As the intensity increases, the increase trend of the yielding base shear force V y of the structure is obviously smaller than that of the design seismic force V d . This may be because the higher the precautionary intensity, the higher the seismic force that the structure may be subjected to, and the more difficult it is to realize the seismic capacity of the structure. Therefore, the strength reserve of the structure decreases with the increase in the precautionary intensity, which is expressed as the over-strength coefficients that are significantly decreasing.
For structures designed according to the same precautionary intensity, the over-strength coefficient of the bare frame structures increases with the increase in the number of stories, and the over-strength coefficients of the fully infilled frame and the bottom soft-story infilled frame structures first increase and then decrease with the increase in the number of stories. For the bare frame structures, as the number of stories increases, the yielding strength V y increases, and the system over-strength coefficient increases with the increase in the number of stories, although the design seismic force V d also increases. However, this growth trend gradually slows down. In general, the natural vibration period is larger for a taller structure, and the seismic influence coefficient used for calculating design seismic force is smaller, while under practical earthquake action, due to the influence of higher-order mode, the yielding force V y of the structure is relatively higher. Therefore, the strength reserves of high-rise structures are higher. Furthermore, the design of high-rise structures in this paper may be more cautious and conservative, which also strengthens the result. For the fully infilled frame and the bottom soft-story infilled frame structures, although the infill wall has high rigidity, its deformation ability is poor, and serious brittle damage often occurs. In a high-rise structure, the displacement response is often larger; thus, the damage of infill walls is more serious. As a result, the system over-strength coefficient decreases in the high-rise structure.
To exhibit the effect of infill walls on the over-strength coefficient of the frame structure, the over-strength coefficient capacity values of the three types of structures are plotted together, as shown in Figure 10. It can be seen that the over-strength coefficient of the fully infilled frame structure is 93.5% higher than that of the bare frame structure on average; the over-strength coefficient of the bottom soft-story infilled frame structure is 50.5% higher than that of the bare frame structure on average; the over-strength coefficient of the fully infilled frame structure is increased by 31.8% on average compared with the result of the bottom soft-story infilled frame structure.
The over-strength coefficient is a reflection of the seismic capacity of the structure. The existence of the infill wall improves the rigidity and strength of the structure, and the damage of the infill wall will consume a part of the energy so that the yielding strength V y of the structure is significantly increased, and the seismic performance of the structure is greatly improved. However, this strengthening effect of infill walls is gradually reduced as the number of stories increases. This may be due to the fact that infill walls are more severely damaged in the high-rise structure. With the increase in the precautionary intensity, the over-strength coefficient of the structure shows a significant decreasing trend regardless of whether the effect of the infill wall is considered. As a result, the effect of the infill wall on the over-strength coefficient has no significant relevance with the precautionary intensity.

6. The Assessment of Over-Strength Coefficient

In order to evaluate the rationality of the system over-strength coefficient value, the capacity–demand ratio of the over-strength coefficient is adopted, and the calculation process is as follows:
(1)
Develop the structural dynamic capacity curve of the model under one pair of ground motion; then, convert the structural capacity curve into the spectral acceleration-displacement curve, that is, the capacity spectrum curve.
(2)
Convert the seismic response spectrum with 5% damping into the spectral displacement–acceleration format as well, that is, the demand spectrum curve.
(3)
Solve the intersection of the capacity spectrum and demand spectrum curves by using the dynamic capability spectrum method; then, obtain the target vertex displacement Δe and the corresponding base shear force Vy under different strength spectra.
(4)
Knowing the seismic design force Vd of the structure, according to Formula (4), calculate the demand value of the over-strength coefficient at different strength spectra.
(5)
Calculate the over-strength coefficient capacity–demand ratio of the structure according to the following formula.
λ R s = R s C / R s D
(6)
Repeat the above steps to obtain the demand values and capacity–demand ratios of the system over-strength coefficient under each pair of ground motions.
(7)
Take the median values as the demand value and capacity–demand ratio of the system over-strength coefficient.
Using the dynamic capability spectrum method, the over-strength coefficient demand values of 36 structures for the more frequent, precautionary, rare, and extremely rare ground motion demand spectra are calculated. The results are shown in Figure 11.
It can be seen from Figure 11a that the demand values of the over-strength coefficients of the bare frame structures under different precautionary intensities are 2.66~2.11, 2.24~1.78, and 2.02~1.59 for the precautionary case and reached 2.1, 1.7, and 1.5, respectively. For the rare case, the values are 5.58~3.80, 4.02~3.07, 3.32~2.32 and reached 3.8, 3.0, and 2.3, respectively. In Figure 11b, for the precautionary case, the demand values of fully infilled frame structures are 7.1~2.31, 6.02~2.29, and 3.72~1.54, which are above 2.3, 3.2, and 1.5, respectively. For the rare case, the values are 13.79~5.00, 8.72~4.07, and 5.5~2.47, which are above 5.0, 4.0, and 2.4, respectively. In Figure 11c, for the precautionary case, the demand values of bottom soft-story infilled frame structures are 7.33~2.42, 5.11~1.93, and 3.52~1.44, which are above 2.7, 1.9, and 1.4, respectively. For the rare case, the values are 14.07~4.34, 7.97~3.47, and 5.39~2.66, which are above 4.3, 3.4, and 2.6, respectively. In general, the over-strength coefficient demand value of the three types of frame structures increases with the increase in the seismic demand spectrum intensity, decreases with the increase in the precautionary intensity, and increases with the increase in the number of stories. The fully infilled frame has the largest over-strength coefficient demand value, while the bare frame has the smallest over-strength coefficient demand value.
The over-strength coefficient capacity–demand ratio values are obtained by dividing the over-strength coefficient capability value by the demand value in the rare case, as shown in Figure 12.
It can be seen that for the bare frame, the capacity–demand ratio is between 1.15 and 2.98; for the fully infilled frame, the ratio is between 1.00 and 3.05; they are all greater than or equal to 1. However, for the bottom soft-story infilled frame, the minimum capacity–demand ratio value is only 0.90. Therefore, for the structure designed according to the seismic code, the bare frame has a good strength reserve under the action of a rare earthquake; however, when the infill wall is considered, although the infill wall can improve the bearing capacity of the structure, the structural stiffness and vibration model have been changed, especially when the bottom infill wall of the structure is missing, the over-strength coefficient capacity–demand ratio is greatly reduced, which indicates that the structure is at risk under the action of rare earthquakes. Therefore, in the design of the masonry-infilled RC frame structure, the arrangement of the soft-story at the bottom should be avoided, or some strengthen technologies should be adopted.

7. Conclusions

In this paper, a total of 36 bare frame, fully infilled frame, and bottom soft-story infilled frame structures with 3, 6, 9, and 12 stories and for seismic precautionary intensities VI, VII and VIII are designed, and three-dimensional finite element modelings are built by using an improved five-element infill wall model in OpenSees.
Then, the system over-strength coefficient capacity value of the structures under bidirectional ground motion action is obtained by using the IDA method, and the effect of the infill wall on the over-strength coefficient is discussed. It can be concluded that the system over-strength coefficients of the three types of frame structures all decrease with the increase in the precautionary intensity, and the values of over-strength coefficients for different intensities are quite different. For the bare frame structure, the over-strength coefficient increases with the increase in the number of stories; for the fully infilled frame and the bottom soft-story infilled frame structures, the over-strength coefficient first increases and then decreases with the increase in the number of stories. The inclusion of infill walls significantly enhances the performance of frame structures; therefore, the over-strength coefficient of the infilled frame structure is significantly higher than that of the bare frame structure, and the coefficient of the fully infilled frame structure is greater than that of the bottom soft-story infilled frame structure. As the number of stories increases, the effect of the infill wall is gradually reduced. However, for different intensities, it does not show a clear rule for the increase in the over-strength coefficient of the infilled frame structure.
In addition, the capacity–demand ratio of the over-strength coefficient is analyzed to evaluate the strength reserve of three types of frame structures with and without infill walls. It has shown that the bare frame structure has a good strength reserve, while the seismic performance of masonry-infilled RC frame structures is deteriorated, although the infill wall can improve the bearing capacity of the structure, and the design of the bottom soft-story infilled frame structure requires some additional strengthening treatments.

Author Contributions

Conceptualization, J.K.; methodology, X.W.; software, Y.S. and X.W.; formal analysis, Y.S.; investigation, M.G., C.L. and X.W.; resources, J.K., X.W. and Y.S.; writing—original draft preparation, J.K., writing—review and editing, X.W.; visualization, J.K. and X.W.; supervision, M.G. and C.L.; project administration, X.W.; funding acquisition, X.W., M.G., C.L. and J.K. All authors have read and agreed to the published version of the manuscript.

Funding

The research is supported by the Scientific Research Fund of the Institute of Engineering Mechanics, China Earthquake Administration (grant nos. 2018B07, 2019A01, and 2021EEEVL0301), the National Nature Science Foundation of China (grant nos. 51808478 and 51908484), and the Natural Science Foundation of Shandong (grant no. ZR2019QEE033). This support is greatly appreciated.

Institutional Review Board Statement

Not applicable.

Informed Consent Statement

Not applicable.

Data Availability Statement

The data presented in this study are available on request from the corresponding author.

Acknowledgments

Grateful acknowledgment is given to Liang Cui and Bo Liu at the School of Civil Engineering, Yantai University.

Conflicts of Interest

The authors declare no conflict of interest.

References

  1. Applied Technology Council. Quantification of Building Seismic Performance Factors; US Department of Homeland Security, FEMA: Washington, DC, USA, 2009. [Google Scholar]
  2. International Conference of Building Officials. Uniform building code. In Proceedings of the International Conference of Building Officials, Whittier, CA, USA, 18–21 October 1927. [Google Scholar]
  3. Kandel, S.; Suwal, D.R. Effect of Building Configuration on Overstrength Factor and Ductility Factor. Eng. Technol. Q. Rev. 2021, 4, 10–18. [Google Scholar] [CrossRef]
  4. Qazi, A.U.; Rasool, A.M.; Ibrahim, Y.E.; Hameed, A.; Ali, M.F. Behavior of Scaled Infilled Masonry, Confined Masonry & Reinforced Concrete Structures under Dynamic Excitations. Buildings 2022, 12, 774. [Google Scholar] [CrossRef]
  5. Khan, N.A.; Monti, G.; Nuti, C.; Vailati, M. Effects of infills in the seismic performance of an RC factory building in Pakistan. Buildings 2021, 11, 276. [Google Scholar] [CrossRef]
  6. Almasabha, G.; Alshboul, O.; Shehadeh, A.; Almuflih, A.S. Machine Learning Algorithm for Shear Strength Prediction of Short Links for Steel Buildings. Buildings 2022, 12, 775. [Google Scholar] [CrossRef]
  7. Manganiello, L.; Montuori, R.; Nastri, E.; Piluso, V. The influence of the axial restraint on the overstrength of short links. J. Constr. Steel Res. 2021, 184, 106758. [Google Scholar] [CrossRef]
  8. Abraik, E.; Youssef, M.A. Ductility and overstrength of shape-memory-alloy reinforced-concrete shear walls. Eng. Struct. 2021, 239, 112236. [Google Scholar] [CrossRef]
  9. Osteraas, J.; Krawinkler, H. Strength and Ductility Considerations in Seismic Design. John A. Blume Earthquake Engineering Center Technical Report 90. Stanford Digital Repository. Stanford University. 1990. Available online: http://purl.stanford.edu/cb239mm7088 (accessed on 16 July 2022).
  10. Rahgozar, M.; Humar, J. Accounting for overstrength in seismic design of steel structures. Can. J. Civ. Eng. 1998, 25, 1–15. [Google Scholar] [CrossRef]
  11. Calderoni, B.; Ghersi, A.; Rinaldi, Z. Statistical analysis of seismic behaviour of steel frames: Influence of overstrength. J. Constr. Steel Res. 1996, 39, 137–161. [Google Scholar] [CrossRef] [Green Version]
  12. Balendra, T.; Huang, X. Overstrength and ductility factors for steel frames designed according to BS 5950. J. Struct. Eng. 2003, 129, 1019–1035. [Google Scholar] [CrossRef]
  13. De Stefano, M.; Marino, E.M.; Rossi, P.P. Effect of overstrength on the seismic behaviour of multi-storey regularly asymmetric buildings. Bull. Earthq. Eng. 2006, 4, 23–42. [Google Scholar] [CrossRef]
  14. Rossi, P.; Lombardo, A. Influence of the link overstrength factor on the seismic behaviour of eccentrically braced frames. J. Constr. Steel Res. 2007, 63, 1529–1545. [Google Scholar] [CrossRef]
  15. Wei, F.; Li, G.; Bai, S. Design specifications of various countries on the basis of seismic fortification and structural over-strength consideration. J. Chongqing Univ. (Nat. Sci. Ed.) 2007, 30, 102–108. (In Chinese) [Google Scholar]
  16. Zhai, C.; Xie, L. Study on overstrength of RC frame structures. Jianzhu Jiegou Xuebao J. Build. Struct. 2007, 28, 101–106. [Google Scholar]
  17. Zhou, J.; Cai, J.; Fang, X. Seismic overstrength factors for reinforced concrete frames. World Earthq. Eng. 2007, 23, 227–233. [Google Scholar]
  18. Ma, H.W.; Chao, X.Y. A simplified analytical method for maximum inelastic seismic response of RC frames. Eng. Mech. 2007, 24, 113. (In Chinese) [Google Scholar]
  19. Xin, L.; Liang, X.W.; Tong, Y.S. Study on the value of design bearing capacity in displacement-based seismic design. J. Earthq. Eng. Enigineering Vib. 2009, 29, 35–41. [Google Scholar]
  20. Kuşyılmaz, A.; Topkaya, C. Design overstrength of steel eccentrically braced frames. Int. J. Steel Struct. 2013, 13, 529–545. [Google Scholar] [CrossRef]
  21. Elnashai, A.S.; Mwafy, A.M. Overstrength and force reduction factors of multistorey reinforced-concrete buildings. Struct. Des. Tall Spec. Build. 2002, 11, 329–351. [Google Scholar] [CrossRef]
  22. Dickof, C.; Stiemer, S.; Bezabeh, M.; Tesfamariam, S. CLT–steel hybrid system: Ductility and overstrength values based on static pushover analysis. J. Perform. Constr. Facil. 2014, 28, A4014012. [Google Scholar] [CrossRef]
  23. Cui, S.S. Research on Global Seismic Performance Factors and Conprehensive Response Modification Factors of RC Frames Structures. Ph.D. Thesis, Harbin Institute of Technology, Harbin, China, 2013. (In Chinese). [Google Scholar]
  24. Li, Y.J.; Lv, D.G.; Wang, Z.Y. The overstrength factor of RC frames with infilled walls based on adaptive POA and IDA. Eng. Mech. 2017, 34, 197. [Google Scholar] [CrossRef]
  25. Johnson, T.P.; Dowell, R.K. Evaluation of the overstrength factor for nonstructural component anchorage into concrete via dynamic shaking table tests. J. Build. Eng. 2017, 11, 205–215. [Google Scholar] [CrossRef]
  26. Xin, Y.Z. Study on Response Modification Factor for the Steel Grid Box Frame Structure Based on Seismostruct. Master’s Thesis, Southwest Jiaotong University, Chengdu, China, 2018. (In Chinese). [Google Scholar]
  27. Bai, J.; He, J.; Li, C.; Jin, S.; Yang, H. Experimental investigation on the seismic performance of a novel damage-control replaceable RC beam-to-column joint. Eng. Struct. 2022, 267, 114692. [Google Scholar] [CrossRef]
  28. Cui, L. Seismic Performance Factors of Infilled RC Frame. Master’s Thesis, Yantai University, Yantai, China, 2022. (In Chinese). [Google Scholar]
  29. Kong, J.; Su, Y.; Zheng, Z.; Wang, X.; Zhang, Y. The Influence of Vertical Arrangement and Masonry Material of Infill Walls on the Seismic Performance of RC Frames. Buildings 2022, 12, 825. [Google Scholar] [CrossRef]
  30. Roy, N.S.; Choudhury, S. Seismic Vulnerability Assessment Methods: A Review. In Proceedings of the International Conference on Advances in Structural Mechanics and Applications, Silchar, India, 26–28 March 2021; pp. 282–300. [Google Scholar]
  31. Oggu, P.; Gopikrishna, K.; Nagariya, A. Seismic behavior and response reduction factors for concrete moment-resisting frames. Bull. Earthq. Eng. 2021, 19, 5643–5663. [Google Scholar] [CrossRef]
  32. GB50011-2010; Code for Seismic Design of Buildings. China Architecture and Building Press: Beijing, China, 2010.
  33. Cheng, Y.; Dong, Y.R.; Bai, G.L.; Wang, Y.Y. IDA-based seismic fragility of high-rise frame-core tube structure subjected to multi-dimensional long-period ground motions. J. Build. Eng. 2021, 43, 102917. [Google Scholar] [CrossRef]
  34. Di Trapani, F.; Sberna, A.P.; Marano, G.C. A new genetic algorithm-based framework for optimized design of steel-jacketing retrofitting in shear-critical and ductility-critical RC frame structures. Eng. Struct. 2021, 243, 112684. [Google Scholar] [CrossRef]
  35. Huang, W.; Gould, P.L. 3-D pushover analysis of a collapsed reinforced concrete chimney. Finite Elem. Anal. Des. 2007, 43, 879–887. [Google Scholar] [CrossRef]
  36. Zuo, Z.; He, Y.; Li, S. Rational Use of Idealized Shear-Building Models to Approximate Actual Buildings. Buildings 2022, 12, 273. [Google Scholar] [CrossRef]
  37. Lowes, L.; Mitra, N.; Altoontash, A. A Beam-Column Joint Model for Simulating the Earthquake Response of Reinforced Concrete Frames. PEER Report 2003/10; University of California, Berkeley: Berkeley, CA, USA, 2004. [Google Scholar]
  38. Marinković, M.; Butenweg, C. Experimental testing of decoupled masonry infills with steel anchors for out-of-plane support under combined in-plane and out-of-plane seismic loading. Constr. Build. Mater. 2022, 318, 126041. [Google Scholar] [CrossRef]
  39. Furtado, A.; Rodrigues, H.; Arêde, A. Experimental and numerical assessment of confined infill walls with openings and textile-reinforced mortar. Soil Dyn. Earthq. Eng. 2021, 151, 106960. [Google Scholar] [CrossRef]
  40. Varum, H.; Furtado, A.; Rodrigues, H.; Dias-Oliveira, J.; Vila-Pouca, N.; Arêde, A. Seismic performance of the infill masonry walls and ambient vibration tests after the Ghorka 2015, Nepal earthquake. Bull. Earthq. Eng. 2017, 15, 1185–1212. [Google Scholar] [CrossRef]
  41. Furtado, A.; Rodrigues, H.; Arêde, A.; Varum, H. Simplified macro-model for infill masonry walls considering the out-of-plane behaviour. Earthq. Eng. Struct. Dyn. 2016, 45, 507–524. [Google Scholar] [CrossRef]
  42. Kadysiewski, S.; Mosalam, K.M. Modeling of Unreinforced Masonry Infill Walls Considering in-Plane and out-of-Plane Interaction; Pacific Earthquake Engineering Research Center Berkeley: Berkeley, CA, USA, 2009; Volume 70. [Google Scholar]
  43. Kurban, C.O.; Topkaya, C. A numerical study on response modification, overstrength, and displacement amplification factors for steel plate shear wall systems. Earthq. Eng. Struct. Dyn. 2009, 38, 497–516. [Google Scholar] [CrossRef]
  44. Xie, L.; Ye, X.; Chong, X.; Jiang, Q. Parameter research on numerical analysis of low-cyclic loading test of RC columns. China Civ. Eng. J. 2012, 45, 273–277. (In Chinese) [Google Scholar] [CrossRef]
  45. Hashemi, A.; Mosalam, K.M. Shake-table experiment on reinforced concrete structure containing masonry infill wall. Earthq. Eng. Struct. Dyn. 2006, 35, 1827–1852. [Google Scholar] [CrossRef]
  46. Lv, D.G.; Cui, S.S.; Chen, Z.H. Assessment of sidesway collapse resistant capacity of reinforced concrete frame structures based on pushover analysis. Eng. Mech. 2013, 30, 80–189. [Google Scholar] [CrossRef]
Figure 1. Plan and elevation views of RC frame structures with/without infill walls: (a) plan; (b) elevation of bare frame; (c) elevation of fully infilled frame; (d) elevation of the bottom soft-story infilled frame.
Buildings 12 01290 g001
Figure 2. Simplified five-element model for infill walls.
Buildings 12 01290 g002
Figure 3. Details of the central element: (a) set of two fiber section; (b) analysis of section force.
Buildings 12 01290 g003
Figure 4. Pingching 4 constitutive model; (a) hysteretic behavior; (b) skeleton curve.
Buildings 12 01290 g004
Figure 5. Base shear force-top displacement curves: (a) Tar6 case; (b) Duz7 case.
Buildings 12 01290 g005
Figure 6. Time history curve of the base shear force for the Tar6 case.
Buildings 12 01290 g006
Figure 7. Average response spectrum and seismic design response spectrum for seismic precautionary intensity VI.
Buildings 12 01290 g007
Figure 8. The IDA curves of 20 pairs of ground motions for (a) Model F6-6; (b) Model IF6-6; (c) Model IFE6-6.
Buildings 12 01290 g008
Figure 9. Over-strength coefficient values of 36 RC frame structures: (a) bare frame; (b) fully infilled frame; (c) bottom soft-story infilled frame.
Buildings 12 01290 g009
Figure 10. Over-strength coefficient values for different precautionary intensities: (a) intensity VI; (b) intensity VII; (c) intensity VIII.
Buildings 12 01290 g010
Figure 11. Demand analysis based on dynamic capacity spectra: (a) bare frame; (b) gully infilled frame; (c) bottom soft-story infilled frame.
Buildings 12 01290 g011
Figure 12. The structural capacity–demand ratio of over-strength coefficient: (a) rare frame; (b) fully infilled frame; (c) bottom soft-story infilled frame.
Buildings 12 01290 g012
Table 1. Dimensions of beams and columns in structures.
Number of StoriesStoryThe Section of ColumnsThe Section of Beams
bc (mm)hc (mm)bb (mm)hb (mm)
31~3500500250500
51~5600600300600
81~8650650300600
101700700350700
2~8650650300600
9~10600600300600
121700700350700
2~10650650300700
11~12600600300600
Table 2. Comparison of numerical and test results.
Tar6Duz7
Initial Stiffness (kN/mm)Residual Stiffness (kN/mm)Peak Load (kN)Initial Stiffness (kN/mm)Residual Stiffness (kN/mm)Peak Load (kN)
Test63.7750.63588.9648.7028.03763.35
Numerical68.2947.97691.9353.5121.72687.39
Error7.09%5.26%17.48%9.86%22.51%9.95%
Table 3. Ground motion records.
No.Ground MotionsPGA (g)PGV
(cm/s)
PGD
(cm)
PGA/PGV (g/(cm/s))
GM-1RSN126_GAZLI_GAZ0900.8639 67.62 20.71 0.0128
RSN126_GAZLI_GAZ0000.7017 66.18 27.32 0.0106
GM-2RSN160_IMPVALL.H_H-BCR2300.7769 44.92 15.09 0.0173
RSN160_IMPVALL.H_H-BCR1400.5987 46.73 20.21 0.0128
GM-3RSN165_IMPVALL.H_H-CHI0120.2699 24.79 9.29 0.0109
RSN165_IMPVALL.H_H-CHI2820.2542 29.89 7.65 0.0085
GM-4RSN495_NAHANNI_S10101.1079 43.90 6.80 0.0252
RSN495_NAHANNI_S12801.2007 40.61 10.20 0.0296
GM-5RSN741_LOMAP_BRN0000.4564 51.36 8.11 0.0089
RSN741_LOMAP_BRN0900.5023 44.47 5.05 0.0113
GM-6RSN181_IMPVALL.H_H-E061400.4473 66.99 27.88 0.0067
RSN181_IMPVALL.H_H-E062300.4490 113.50 72.85 0.0040
GM-7RSN182_IMPVALL.H_H-E071400.3408 51.65 27.98 0.0066
RSN182_IMPVALL.H_H-E072300.4691 113.08 46.92 0.0041
GM-8RSN292_ITALY_A-STU2700.3205 71.92 29.31 0.0045
RSN292_ITALY_A-STU0000.2267 36.96 13.11 0.0061
GM-9RSN802_LOMAP_STG0000.5145 41.56 16.32 0.0124
RSN802_LOMAP_STG0900.3262 45.95 33.31 0.0071
GM-10RSN828_CAPEMEND_PET0000.5908 49.30 16.59 0.0120
RSN828_CAPEMEND_PET0900.6616 88.47 33.20 0.0075
GM-11RSN68_SFERN_PEL0900.2248 21.71 15.91 0.0104
RSN68_SFERN_PEL1800.1949 16.93 12.87 0.0115
GM-12RSN125_FRIULI.A_A-TMZ0000.3571 22.84 4.59 0.0156
RSN125_FRIULI.A_A-TMZ2700.3151 30.50 5.21 0.0103
GM-13RSN169_IMPVALL.H_H-DLT2620.2357 26.31 14.69 0.0090
RSN169_IMPVALL.H_H-DLT3520.3497 32.98 20.17 0.0106
GM-14RSN174_IMPVALL.H_H-E111400.3668 36.00 25.08 0.0102
RSN174_IMPVALL.H_H-E112300.3794 44.59 21.31 0.0085
GM-15RSN721_SUPER.B_B-ICC0000.3573 48.05 19.27 0.0074
RSN721_SUPER.B_B-ICC0900.2595 41.77 21.85 0.0062
GM-16RSN725_SUPER.B_B-POE2700.4750 41.15 7.73 0.0115
RSN725_SUPER.B_B-POE3600.2862 29.00 11.36 0.0099
GM-17RSN752_LOMAP_CAP0000.5111 38.01 7.06 0.0134
RSN752_LOMAP_CAP0900.4386 29.60 4.91 0.0148
GM-18RSN767_LOMAP_G030000.5591 36.29 10.84 0.0154
RSN767_LOMAP_G030900.3682 45.40 24.09 0.0081
GM-19RSN900_LANDERS_YER2700.2445 51.10 41.69 0.0048
RSN900_LANDERS_YER3600.1518 29.08 23.13 0.0052
GM-20RSN953_NORTHR_MUL0090.4434 59.27 15.47 0.0075
RSN953_NORTHR_MUL2790.4880 66.68 12.17 0.0073
Table 4. Over-strength coefficient values of 36 RC frame structures.
Number of Stories36912
precautionary intensity678678678678
bare frame9.75.243.3114.58.13.916.958.94.119.699.014.57
fully infilled frame21.4511.526.053220.516.2233.62179.8329.513.56.15
bottom soft-story frame15.399.763.632212.26.226.7918.4152412.56.46
Publisher’s Note: MDPI stays neutral with regard to jurisdictional claims in published maps and institutional affiliations.

