Article

Experimental Study on Aeroelastic Instability of Spherical Inflatable Membrane Structures with a Large Rise–Span Ratio

1
School of Civil Engineering and Architecture, Northeast Electric Power University, Jilin 132012, China
2
Key Lab of Electric Power Infrastructure Safety Assessment and Disaster Prevention of Jilin Province, Northeast Electric Power University, Jilin 132012, China
3
Tianjin Research Institute for Water Transport Engineering of China Ministry of Transport, Tianjin 300456, China
4
Liaoning Provincial Transportation Planning & Design Institute Co., Ltd., Shenyang 110000, China
*
Author to whom correspondence should be addressed.
Buildings 2022, 12(9), 1336; https://doi.org/10.3390/buildings12091336
Submission received: 29 July 2022 / Revised: 24 August 2022 / Accepted: 26 August 2022 / Published: 30 August 2022

Abstract

:
Spherical inflatable membrane structures are extremely prone to suffer aeroelastic instability under strong winds, which requires detailed investigation. In this paper, based on the digital image correlation technology (DIC), the displacement and strain response characteristics under wind loads are investigated. Furthermore, the aeroelastic instability characteristics and the criteria for determining the occurrence of this phenomenon are defined. The results show that the top, windward, and side parts of the structure deform upward, inward, and outward. The extreme value of the total displacement occurs at approximately 1/2 of the windward region. Maximum principal strains occur at the windward and leeward centers together with the top region. After the wind speed exceeds the critical value (the dimensionless critical wind speed is observed at 1.37), the structure undergoes a sudden change of dominant vibration mode, the damping ratio decreases dramatically and reaches nearly zero. It can be concluded that the aeroelastic instability of the spherical inflatable membrane structure is caused by vortex-induced resonance and is characterized by a sudden increase in deformation and amplitude, a sudden change of the dominant vibration mode, and a rapid decay of the damping ratio. The Reynolds number after reaching the instability critical wind speed is Re > 3.1 × 10⁵.

1. Introduction

Wind loads are a primary concern in the design of dome structures because they are sensitive to wind loads due to their large spans and the fact that they are often constructed with flexible materials [1]. In recent years, a new dome-type building—inflatable membrane structure with a large span and height—is widely used in stadiums, coal sheds, radomes, and other scenarios because of its many advantages such as haze control, light quality, and low cost. Figure 1 shows the latest application of large span spherical inflatable membrane structures. It is commonly believed that membrane structures with a high flexibility and a low inertial mass show non-negligible vibration and deformation under wind load. This vibration and deformation in turn affects the flow field around the structure, forming a significant fluid–structure interaction (FSI) effect. Under certain circumstances, after reaching the corresponding wind speed, the structure will gradually acquire energy from the air, leading to an increase in vibration phenomenon and “aeroelastic instability” occurs [2,3]. In recent years, there have been many engineering examples of wind-induced damage to inflatable membrane structures. For example, in 1995, the Georgia Dome in the United States was damaged by a strong wind with a maximum speed of 80 km/h, which was much less than a design wind speed of 128 km/h. In 2017, a wind gust destroyed an inflatable tennis court in the Zhulebino district of Moscow, Russia. However, it is still unclear whether the cause of the failure of these structures is strength damage or aeroelastic instability.
Most of the early research on the aeroelastic instability of architectural membrane structures was focused on tensioned membrane structures. Li et al. [4] studied the non-constant aerodynamic properties of flat and curved large-span roofs using large eddy simulation (LES). Studies showed that airflow turbulence and roof shape have a significant impact on wind loads and aerodynamic stability. Takadate and Uematsu [5] investigated the steady and unsteady aerodynamic forces on three types of large-span roofs, flat, cylindrical, and suspended roofs, based on computational fluid dynamics (CFD) and LES. The results of FSI analysis showed that the distributions of the mean and root mean square (RMS) fluctuating wind pressure coefficients were found to be different from those of the rigid roof because of the effect of roof deformation. Michalski et al. [2] outlined a virtual design methodology for lightweight flexible membrane structures under the impact of fluctuating wind loads. Liu et al. [6] conducted a theoretical study on the galloping of tensioned orthotropic anisotropic saddle-shaped closed-membrane structures and established the control equations for the interaction between wind and structure, taking into account both orthotropic anisotropy and geometric nonlinearity, to obtain the critical wind speed equation. Ding et al. [7,8] investigated the unsteady aerodynamic characteristics of large-span gable roofs by wind tunnel tests and numerical simulations. The results showed that when the wind speed exceeds a certain value, the dynamic response considering the effect of unsteady aerodynamic forces will be larger than the response ignoring the effect of unsteady aerodynamic forces. Chen et al. [9] conducted aeroelastic model wind tunnel tests on closed-type one-way tensioned membrane structures. The influence of the pretension and coming flow speed on the structure amplitude, vibration mode, total damping ratio and the correlation relation between the displacement and flow speed above the roof were studied. The results indicated that the aeroelastic instability of the closed-type membrane structure was caused by the vortex-induced resonance and this kind of instability is characterized by a sudden increase in the amplitude, a sudden change of the dominant vibration mode, and a sudden decrease in the structure total damping ratio. Therefore, there is a basic conclusion on the issue of aeroelastic instability of tensioned membrane structures. The tensioned membrane structures are subject to aeroelastic instability, provided that the following vibration characteristics occur during the structure vibration: (1) The vibration amplitude increases suddenly and rapidly with the increase in wind speed, and the amplification factor reaches more than 2.5; (2) a sudden switch of the structure from one vibration mode to another. (3) The total response damping ratio of the structure decays rapidly with the increasing wind speed. These research results can be used as a reference for inflatable membrane structures. However, due to different structure forms, the specific instability characteristic of the inflatable membrane building needs to be specially studied.
Regarding the aeroelastic instability of the inflatable membrane structure, Newman and Ganguli [10] conducted initially a basic study of inflatable spherical structures under wind loads, and the purpose of this study was to give some recommendations for structure safety of inflatable buildings under wind loads that could be used for practical engineering reference. He and Shen [11] studied the wind effect under the exponential wind speed profile flow of inflatable membrane gas holders. The results showed that the inflatable membrane gas holder structure had an obvious aeroelastic effect. Under a certain wind speed, the influence of FSI should not be neglected, and the structure will vibrate unstably. Tavakol et al. [12,13] conducted experiments and numerical studies of turbulent flow around a flexible hemisphere. The paths, separation, and recirculation zones of the hemisphere different turbulent boundary layer flows were determined considering FSI, and the pressure and speed distributions at different locations on the hemisphere were provided and compared. Mokin et al. [14] conducted a numerical simulation study of FSI for an inflatable spherical membrane. The results showed that the increased wind load on the surface of the structure was caused by the deformation of the structure. Aerodynamic instability can cause excessive relaxation and large deflections in the structure. It confirms the importance of studying the aeroelastic behavior of inflatable membrane structures under wind loads. Wood et al. [15,16] conducted experiments and numerical simulations of an inflatable flexible hemispherical membrane exposed to an artificially generated turbulent boundary layer for three Reynolds numbers (Re = 50,000, 75,000, and 100,000). The time-averaged speed field velocities and Reynolds stresses of rigid and flexible hemispheres were studied in comparison. It was found that the mean deformation of the flexible structure varied significantly with the increment of Reynolds numbers, showing a significant FSI effect. Nayer et al. [17] performed turbulent gust impact simulations for a flexible hemispherical inflatable membrane. The effect of the gusts on the flow field, the resulting forces on the structure, and the corresponding deformations in case of the flexible structure were analyzed in detail, and the temporal relationships between the local or global force and the local deformations were evaluated. The investigation pinpointed the areas of high stresses and strains, where the structure is susceptible to failure. Zhao et al. [18,19] used a triple-camera system to measure and analyze the dynamic geometry of inflatable membrane structures on-site. An efficient and accurate method for measuring the dynamic geometry of inflatable membrane structures was provided.
In summary, to the knowledge of the authors, the research on the aeroelastic instability of inflatable membrane structures is still rare. Previous studies on aeroelastic model wind tunnel tests of inflatable membrane structures are scarce. These articles have paid attention to the fluid–structure interaction effects of such structures. The definition and characteristics of the aeroelastic instability of such structures are not yet clear. On the one hand, the manufacture of the aeroelastic model is very complex and difficult. On the other hand, non-contact measurement means are relatively limited. Contact measurement devices can interfere with the flow field around the structure. With the development of non-contact measurement equipment, the aeroelastic model test measurement for the inflatable membrane structure has become more accurate and reliable. In this paper, we adopt the DIC technology to measure the full-field displacement and strain of the inflatable membrane structure subjected to wind. Based on the measured results, the wind-induced vibration characteristics of the spherical inflatable membrane structure are investigated in this paper. Furthermore, the aeroelastic instability characteristics and the criteria for determining the occurrence of this phenomenon of the spherical inflatable membrane structure are discussed and defined based on the above wind-induced characteristics. The dimensionless aeroelastic instability critical wind speed of the spherical inflatable membrane structure is also given.

2. Wind Tunnel Test on the Aeroelastic Model

The wind tunnel test is conducted in the TKS-400 wind tunnel laboratory at Tianjin Research Institute for Water Transport Engineering. The laboratory is an open-circuit wind tunnel with a single test section. The test section dimensions are: 4.4 m in width, 2.5 m in height, and 15 m in length. The operable wind speed ranges from 0 to 30 m/s.
In this paper, the aeroelastic model test is based on a spherical inflatable membrane structure with the 2:3 rise–span ratio. The span of the prototype structure is 60 m, the rise is 40 m, and the internal pressure is 400 Pa. The prototype structure is made of polyvinylidene difluoride (PVDF) with a density of 1350 kg/m3, a thickness of 1.13 mm, and a modulus of elasticity of 2500 MPa.

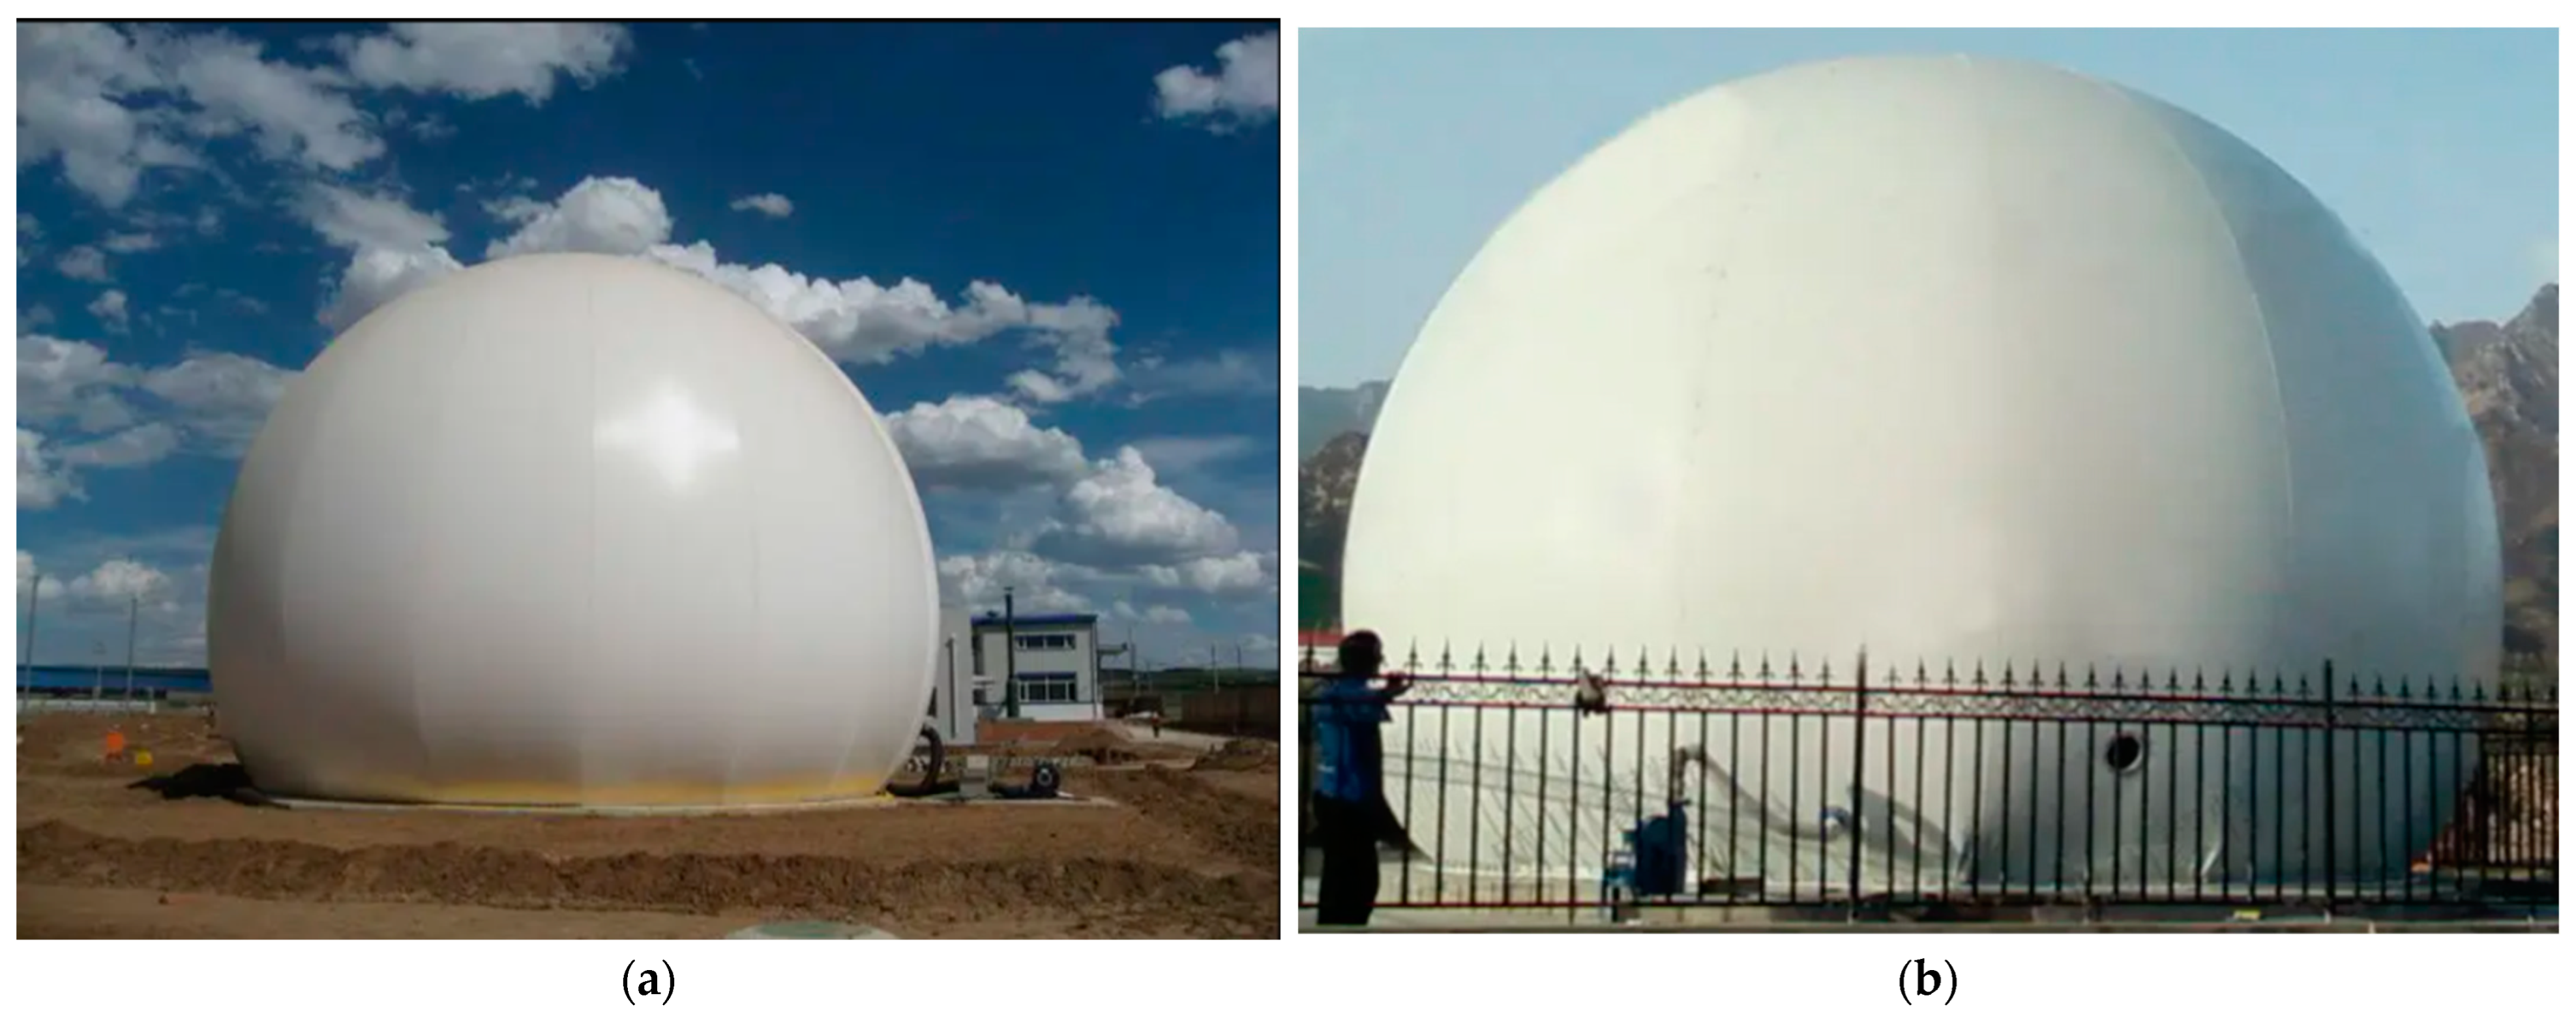
2.1. Design of the Aeroelastic Model

The aeroelastic model is made of latex membrane material. The selected material has a thickness of 0.14 mm, a density of 1033.45 kg/m3, and a modulus of elasticity of 720 MPa. Similarity analysis is first required in designing the scaled aeroelastic model to ensure that the dynamic response of the model and the prototype structure under the incoming flow is similar as much as possible [20]. In this paper, the length scale ratio λL = Lm/Lp is defined as the basic scale ratio (The symbol L represents the length, the subscript m and p represent the model and prototype, respectively), and other scale ratios can be expressed by the basic scale ratio. The length scale ratio is usually determined by the size of the wind tunnel laboratory test section and the blockage rate, and the blockage rate of the wind tunnel section should not exceed 5%. The length scale ratio is λL = 1:100 in the test, the model rise is 0.4 m, the span is 0.6 m, and the corresponding wind tunnel blockage rate is 1.45%. According to the normal working wind speed of the laboratory, the wind speed ratio is determined as 1:1. Other test-related scale ratios are shown in Table 1. In this table, “u” represents the wind speed, “m” represents the quality of the membrane material, “P” represents the internal pressure, and “f” represents the frequency.
In terms of reality, it is difficult to realize a full aeroelastic simulation of the prototype structure. For example, the material of the aeroelastic model is usually heavier, but the added mass caused by the structure vibration has a much larger effect on the response than the effect of the membrane mass [21,22], so the influence of the aeroelastic effect caused by the mass of the membrane is negligible. The Froude number reflects the relationship between the ratio of the gravity and the inertia force. This condition can be relaxed due to the light mass of the membrane and the fact that the effect of gravity on the structure is much smaller compared to the internal pressure and aerodynamic forces. The research shows that when the Reynolds number is greater than 3 × 10⁵, the flow form of the fluid around the spherical structure is basically fixed [23]. The Reynolds numbers for the model and prototype in this paper are 4.5 × 10⁵ and 4.5 × 10⁷, respectively. Therefore, the effect caused by the Reynolds number can be ignored.

2.2. Manufacture of the Aeroelastic Model

The model is fabricated with shape finding analysis, cutting analysis [24], heat seal installation, inflation, and air tightness check. The air inlet and outlet at the bottom center of the inflatable membrane are connected to the internal pressure measurement equipment and the inflation equipment, respectively. A schematic diagram of model installation is shown in Figure 2.

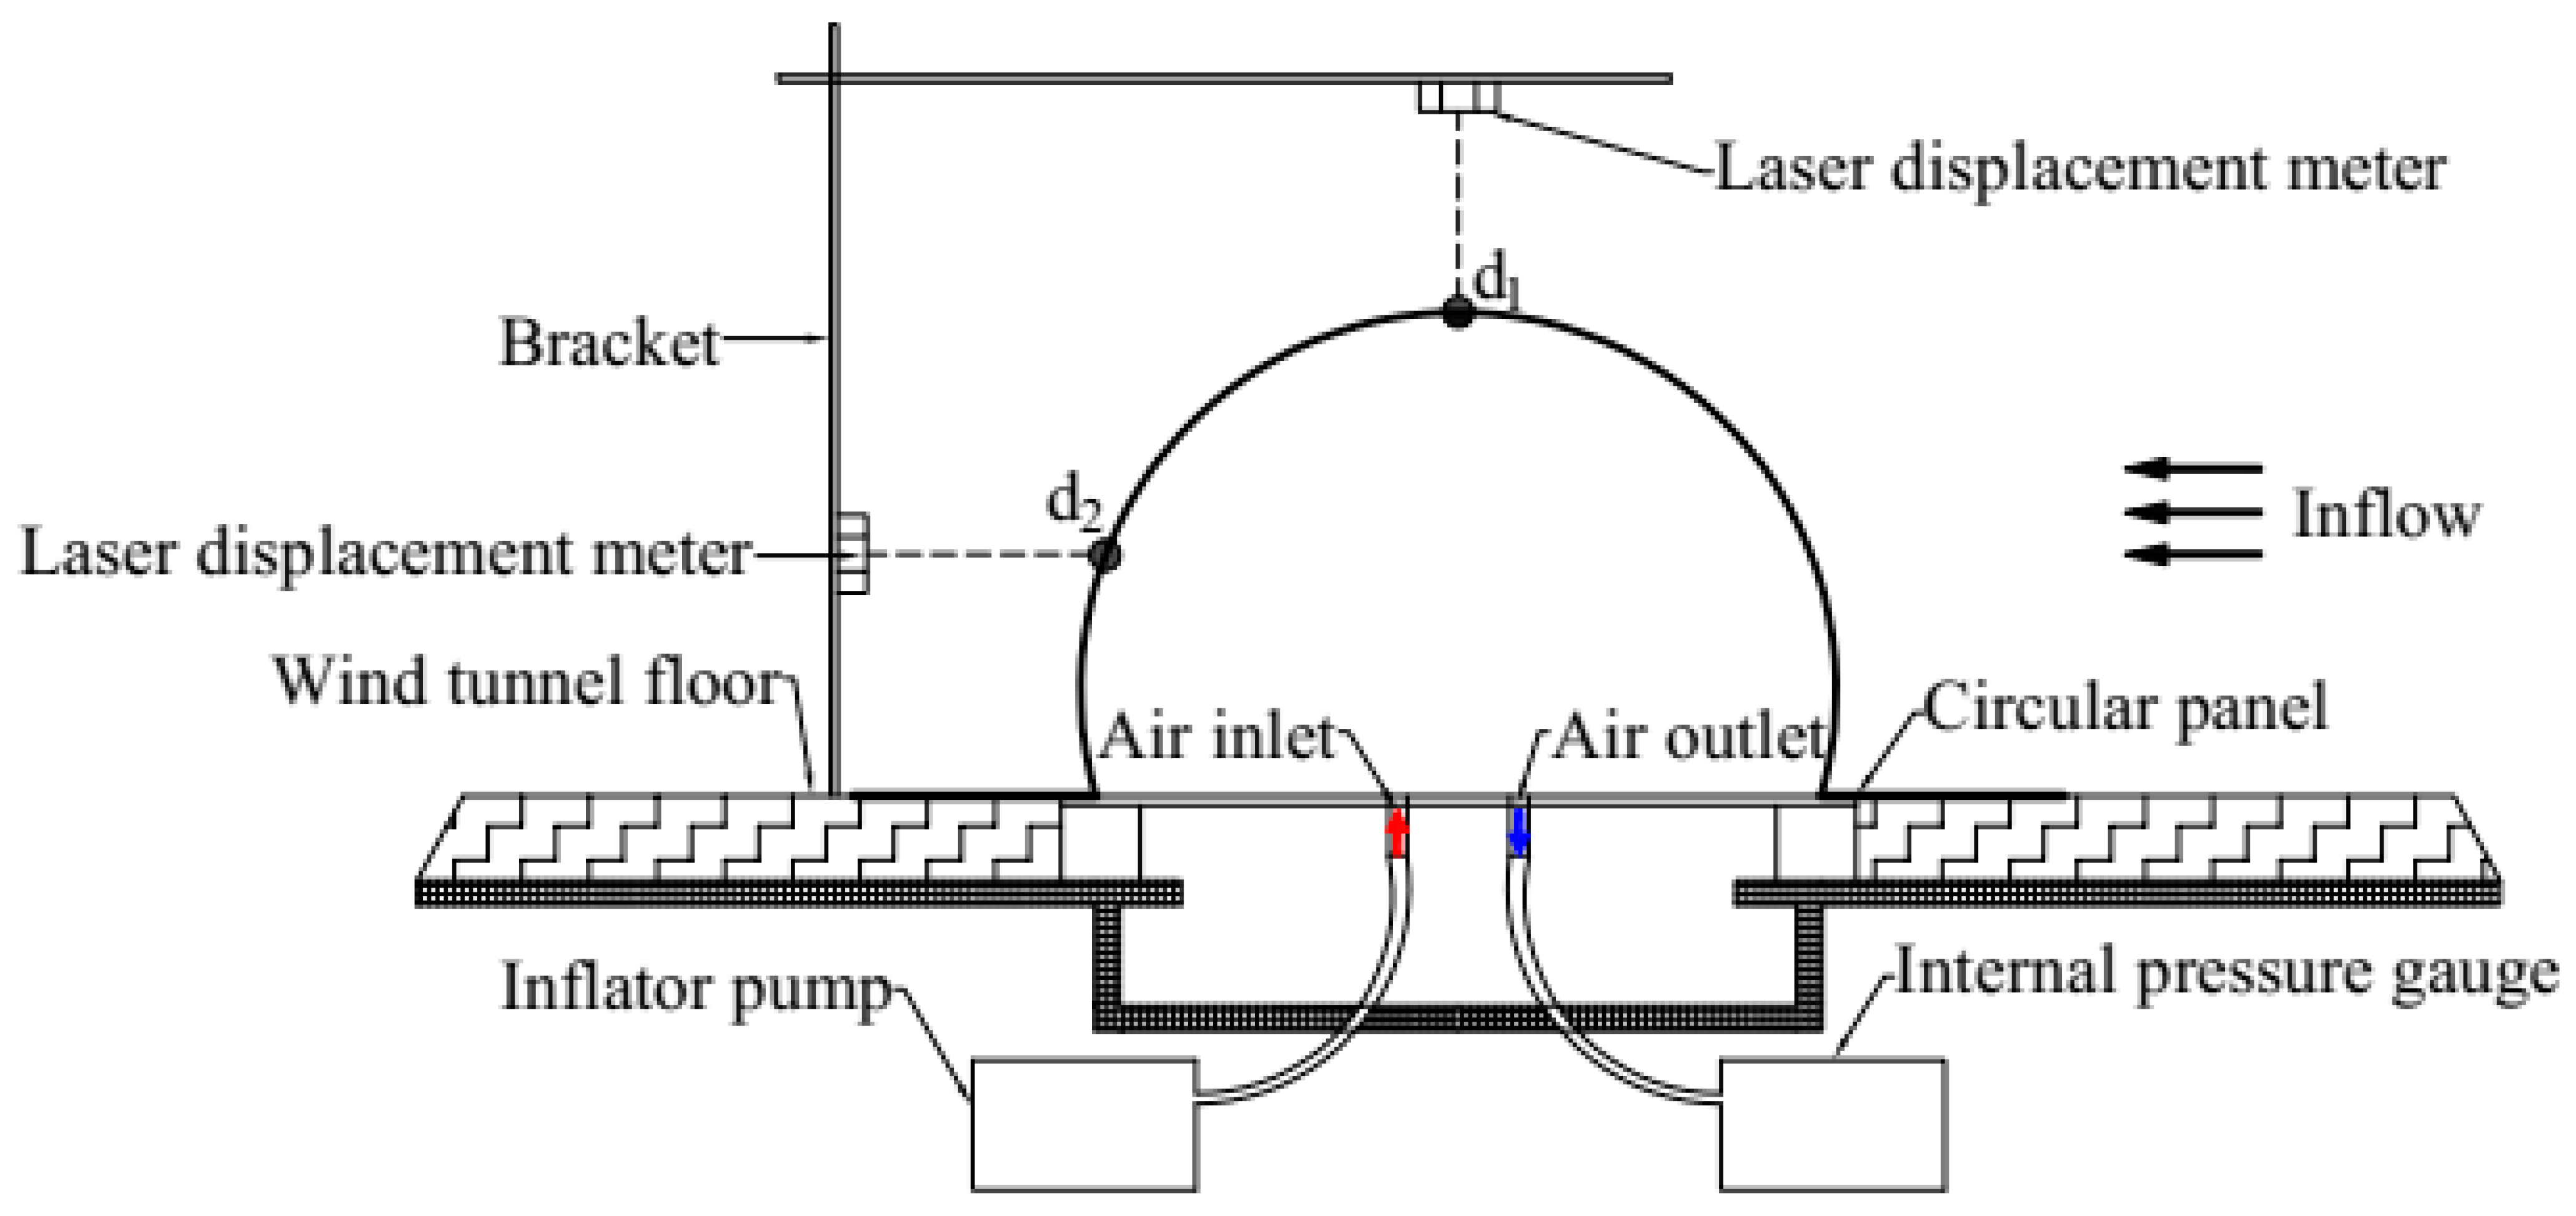
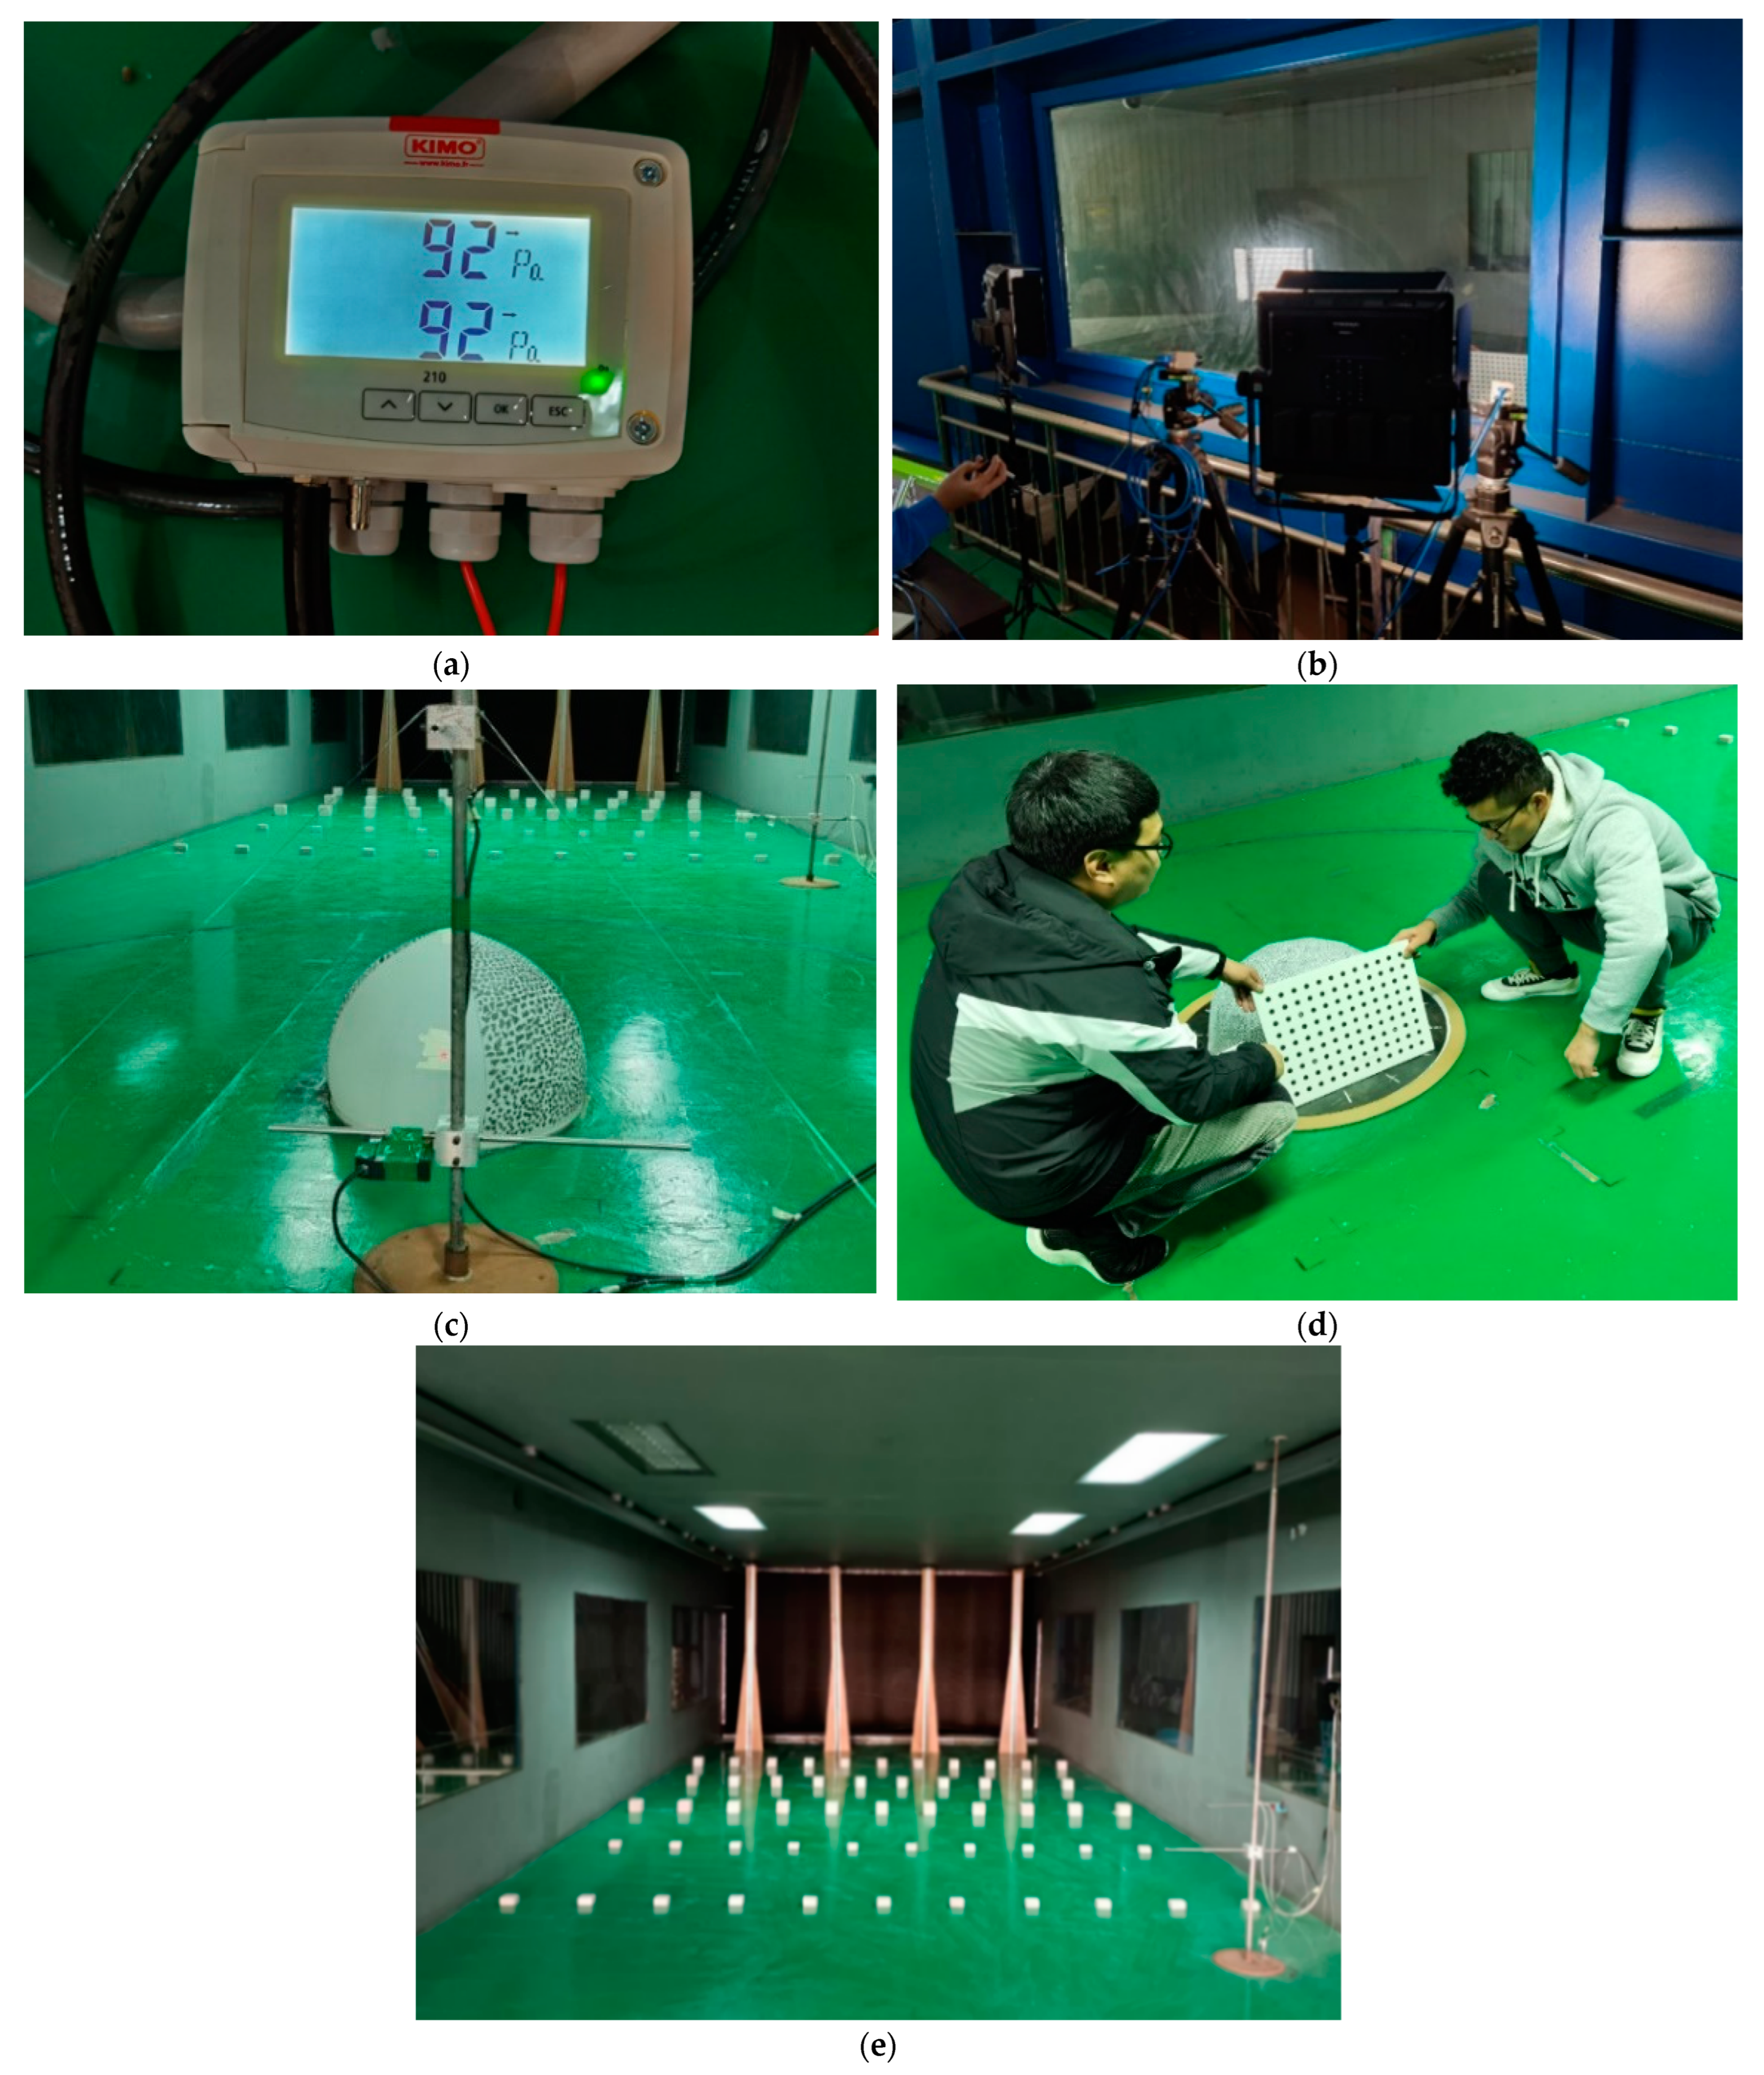
2.3. Measurement Instruments

The air pressure measurement during the inflation process is done by French KIMO (CP200) equipment (Figure 3a), with an air pressure range 0~1000 Pa and reading error ±2 Pa. The model is inflated by an Italian MJF MOBILE 25/10 genesis silent oil-free air compressor. The internal pressure gauge is connected to monitor the internal pressure of the structure in real time during inflation. After inflation, the structure is stationary for 15–20 min, and the air pressure is monitored to see if it matches the target air pressure after the creep has stopped. If the difference does not meet the requirements, repeat the inflation to control the error within 200 ± 2 Pa.
The wind-induced responses are obtained by two means. The first means is through conventional laser displacement meter and the other means is through full-field dynamic displacement and strain measurements based on DIC technology (stereo cameras system) [18,19,25,26,27,28]. DIC technology can measure the full-field dynamic displacement and strain on the surface of the membrane structure, while a laser displacement meter can only measure the unidirectional displacement. Although they are not identical, the measured results can be verified against each other.
The control displacements of the inflatable membrane are the vertical displacement at the top and the downwind displacement at the 1/2 height of the leeward surfaces, as shown at points d1 and d2 in Figure 2. Therefore, two laser displacement meters are fixed above and behind the membrane surface by brackets to measure the unidirectional displacement of the structure. The laser displacement meter is a Panasonic HL-C2 series, with a sampling frequency of 1024 Hz and a sampling time of 30 s. The data collected by the laser displacement meters are used for power spectrum analysis.
The stereo cameras are a Stereo-3D measurement system from Matchid, Belgium, and the camera lens is a Japanese Kombiata FA M2518-MPW2 25 mm focal length industrial lens. It can capture 30 frames per second and captures 10 s at each wind speed. The camera is mounted outside the glass window of the wind tunnel laboratory (Figure 3b), and the full-field displacement and strain of the membrane surface are measured through the glass. The test photos are shown in Figure 3c. Scattering points need to be drawn on the membrane surface before the test measurement, and the camera is calibrated using the calibration plate (Figure 3d), then the initial position of the measurement points is recorded as the reference image.

2.4. Test Cases

The details of test cases are shown in Table 2. The internal pressure of the model is 200 Pa. The wind tunnel test is conducted uniformly using terrain type B in Chinese standard GB50009-2012. The wind field of the terrain is realized by the cleaves and rough elements (Figure 3e). The incoming flow is simulated according to the conditions proposed by the Chinese standard. The targeted power law exponent of the mean wind speed profile is set to α = 0.16 according to the terrain type. The mean wind speed and turbulence intensity profiles are shown in Figure 4a. Moreover, the power spectrum of the longitudinal wind speed fluctuation is consistent with the target von Karman spectrum, as shown in Figure 4b. The wind speed in the test is measured by a Cobra anemometer, which is arranged 3 m away from the front of the model at a height of 400 mm, with a sampling frequency of 1024 Hz. The wind load is applied from low speed until the inflatable membrane undergoes obvious large amplitude oscillations to explore the causes, characteristics, and conditions of the occurrence of aeroelastic instability.
Some errors in the test process may have some influence on the test results. For example, the membrane material selected for the aeroelastic model is difficult to fully satisfy the similar ratio with the material of the prototype structure. The model may have some decrease in the internal pressure of the structure under the continuous wind load compared with the initial state. In addition, the stereo camera may have errors in reading the dynamic coordinates of the scattered spots on the membrane surface. All the above errors are within the controllable range and will not affect the wind vibration characteristics and aeroelastic response pattern of the structure.

3. Wind-Induced Response Characteristics

The wind-induced displacement and strain data of each measurement point on the membrane surface are collected by the stereo cameras at each transient moment. The time-averaged deformation, transient deformation, and the maximum principal strain characteristics of the structure are studied through the analysis of these data, then the wind-induced response characteristics are obtained. Finally, the critical wind speed of the aeroelastic model is defined based on the above study.

3.1. Data Processing

The displacements of the structure are specified to be positive in the upward and along-wind directions (Figure 5), where displacement of the along-wind is U (x direction), the vertical is V (y direction), and the crosswind is W (z direction). The total displacement of each measurement point at each moment is defined as di, calculated as follow:
d i = U 2 + V 2 + W 2
The windward and leeward centers and the top region of the model are selected as the characteristic measurement points to characterize the overall deformation characteristics of the membrane surface, where the top region is d1, the center of the leeward is d2, and the center of the windward is d3. It is shown in Figure 5. During the analysis, d ¯ i is the average value of di with respect to the time series tj (j = 1, 2, …, N) of sampling length N, i denotes the point number. The symbol for the maximum principal strain is ε , ε ¯ is the average value of ε , and σ is the standard deviation of each variable, calculated as follows:
d ¯ i = 1 N j = 1 N d i t j
ε ¯ = 1 N j = 1 N ε i t j
σ i = 1 N 1 j = 1 N d i t j d ¯ i 2
σ = 1 N 1 j = 1 N ε i t j ε ¯ 2
where the stereo cameras system samples 300 moments at each wind speed.

3.2. Distribution Characteristics of Wind-Induced Response

The transient response images collected by the stereo cameras are imported into Stereo-3D software for processing and analysis to obtain the distribution contour for each transient moment. In Figure 6, the transient displacement contours at u = 4 m/s and the transient maximum principal strain contour at 11 m/s are shown, respectively.
It can be seen that the maximum displacement in the along-wind direction occurs at the center of the windward surface. The windward side of the structure is recessed inward. The maximum value of vertical displacement appears at the top of the model. The top of the structure is deformed upwards. The maximum principal strain is distributed in the center of the windward and leeward surfaces, and in a small area at the top of the model.
According to the transient distribution regularity of the maximum principal strain in Figure 6, the data at each moment are averaged in time to obtain the contour of the mean distribution of the maximum principal strain, and it is shown in Figure 7. It can be seen that the maximum principal strain mean distribution contour is consistent with the transient distribution. The most adverse positions of the structure occur at the top of the model, the center of the windward and leeward surfaces.
The total displacement of the inflatable membrane structure is more concerning in the wind-resistant design. The distribution pattern of the total displacement can be obtained by solving the average value of the total displacement at each transient moment in time. Figure 8 shows the contour of the total displacement at u = 11 m/s. It can be seen that the extreme values of the total displacement appear in the center region of the windward side.

3.3. Statistics of Wind-Induced Response

In order to indicate the trend of time–history of displacement for the top region (d1) with the wind speed, it is analyzed in Figure 9. Normally, membrane structures are considered to vibrate at a certain amplitude around their equilibrium position under wind loads [9]. In the figure, d ¯ 1 is caused by the average component of wind load and indicates the average deformation of the membrane surface; σ1 is caused by the pulsating component of wind load and corresponds to the vibration amplitude of the membrane surface. When u = 7.5 m/s, d ¯ 1 =12.83 mm, σ1 = 0.46 mm; when u = 9 m/s, d ¯ 1 =14.3 mm, σ1 = 1.55 mm; and when u = 11 m/s, d ¯ 1 =21.24 mm, σ1 = 2.63 mm. It shows that the time-averaged deformation and the amplitude in the top region of the structure keeps increasing with the growth of wind speed.
To better visualize the trend of the average deformation and amplitude of the membrane surface with wind speed, the time-averaged deformation and the standard deviation of the displacement of each characteristic measurement point (d1, d2, and d3) are used to characterize the overall membrane surface.
Figure 10a shows the trend of the mean value of displacement with wind speed for each measurement point. It can be seen that the structure is dominated by the displacement in the along-wind direction and the upward displacement caused by the wind suction. The displacement of the center of the windward surface is close to exponential growth, and the deformation changes abruptly after the wind speed exceeds 7.5 m/s.
Figure 10b–d show the variation curves of the standard deviation of displacement with wind speed. It can be seen that the overall amplitude of each measurement point increases significantly with the wind speed. The amplitude changes at the top region and the center of the leeward of the model are observed in three directions: along-wind, cross-wind, and vertical. When u < 7.5 m/s, the amplitude increases slowly with the wind speed in each direction; after u ≥ 7.5 m/s, the amplitude increases rapidly. The cross-wind amplitude is always larger than the other two directions, and the change is also more intense after u ≥ 7.5 m/s. It indicates that the FSI leads to the cross-wind vortex-induced vibration of the structure.
The maximum principal strain data at the center of the windward surface and the top region of the model are analyzed. The variation characteristic of the mean and the standard deviation of the maximum principal strain at the selected measurement points under different wind speeds is obtained. It is shown in Figure 11. It can be seen that the mean value of the maximum principal strain gradually increases with wind speed, and the growth rate of the top region is more significant. The standard deviation of the maximum principal strain shown in Figure 11b increases rapidly after u ≥ 7.5 m/s, which corresponds to the variation characteristic of displacement amplitude.
In order to show the average and transient deformation profile of the structure under the wind load more clearly, 31 measurement points are selected uniformly along the symmetry line of the outer profile on the model surface to draw the deformation profile in the xy plane and the yz plane. The deformation is amplified by choosing a = 4 as the amplification factor. The mean values of displacement in x, y, and z directions are divided by the structure span L for dimensionless processing ( a Δ x ¯ / L ,   a Δ y ¯ / L ,   a Δ z ¯ / L ).
Figure 12 shows the average deformation profile of the structure. It can be seen that there is a slight deformation of the structure at low wind speeds. As the wind speed increases, the windward side is obviously concave inward, the top of the model moves upward, and the cross-wind deformation is characterized by the outward projection of both sides of the structure. After u > 7.5 m/s, the deformation increases rapidly and shows a significantly different pattern from that at low wind speeds, which is consistent with the pattern shown in Figure 10a. The upward deformation of the top is caused by the accelerated speed of the fluid at the top of the model, and which leads to an increase in the pressure difference between the internal pressure and the external flow of the structure.
Photos of the model transient deformation during the test are shown in Figure 13. In order to explore the transient deformation characteristics of the structure, Figure 14 plots the transient deformation profile of the structure at u = 4 m/s and 11 m/s when it is at the position of maximum and minimum deformation. It can be seen that the transient deformation of the structure at low wind speeds shows a significant difference from that at high wind speeds.
The amplitude of front-to-back deformation at low wind speeds is large, the amplitude of up-to-down deformation in the top region is small, and the amplitude of deformation in the cross-wind direction is also small. The amplitude of the top region increases significantly from top to bottom at high wind speeds. The amplitude of cross-wind deformation is also more intense. It shows that the windward side is obviously concave inward, and the top region oscillates strongly from top to bottom and protrudes along the sides in the cross-wind direction. By comparing the transient deformation profiles of the structure at high and low wind speeds, it can be concluded that the deformation characteristics with wind speed gradually change from predominantly front-and-back oscillations at low wind speeds to predominantly up-and-down oscillations at high wind speeds.
Combined with the above results of the time-averaged deformation and transient deformation characteristics of the model, it can be seen that the spherical inflatable membrane structure has large deformations under wind load. The cross-wind amplitude is always larger than the other two directions at each wind speed. It indicates that the cross-wind vortex-induced vibration effect of the structure caused by FSI is significant.
After a certain wind speed, the response and amplitude of the structure change drastically, and the vibration pattern is significantly different from that at low wind speeds. It shows that there is a critical wind speed for the FSI vibration between the wind and the structure. After reaching or exceeding the critical wind speed, it shows vortex-induced resonance characteristics, and aeroelastic instability occurs. The aeroelastic instability of membrane structures is usually marked by sudden changes in response and amplitude. Based on the above analysis, the critical wind speed for the instability of the spherical inflatable membrane structure in this paper is ucr = 7.5 m/s.

4. Aeroelastic Instability Analysis

4.1. Modal Identification and Analysis

Previous studies have shown that the actual vibration frequencies of inflatable membranes are lower than those in stationary air, so the general mode analysis methods cannot identify the vibration modes of inflatable membranes under the wind loads [29]. In this study, the displacement at the top of the model (d1) and the center of the leeward surface (d2) are collected simultaneously by a laser displacement meter at different wind speeds, then the power spectrum density (PSD) of the displacements and the finite element method are used to identify the vibration modes.
Figure 15 shows the first 5th modal shapes and frequencies of the structure analyzed by finite element, where fn represents the frequency of the nth mode. As can be seen from the figure, the 1st and 2nd mode frequency values are equal, and the vibration modes are horizontal. The 3rd vibration mode is vertical. The 4th and 5th mode frequency values are equal, and the vibration is characterized as a radial inward contraction along the symmetry axis.
Figure 16 shows the normalized PSDs at the top of the model (d1) and the center of the leeward surface (d2) for different wind speeds, where S(f) and σ denote the PSD and RMS of the displacement, respectively. Combined with the finite element modal analysis in Figure 15, it can be seen that: (1) The power spectrum analysis results are in general agreement with the finite element analysis results and the degree of agreement is well. (2) When u < 7.5 m/s, the 1st and 2nd modes of front-to-back and left-to-right vibration along the horizontal direction dominate, and after u ≥ 7.5 m/s, the dominant vibration mode is changed. The 3rd mode of up-to-down vibration along the vertical dominates, accompanied by the 1st and 2nd vibration patterns. It is consistent with the phenomenon that the up-to-down vibration of the model starts to intensify after the wind speed exceeds 7.5 m/s observed in the test. It is also consistent with the transient pattern of morphological changes from low to high wind speed in Figure 14.
The 1st and 2nd mode frequencies gradually increase with wind speed, probably due to the added aerodynamic force formed by driving the surrounding air to move together as the amplitude of structure vibration and deformation increases. The added air mass can reach several levels of the structure’s own mass and increases with the wind speed. This issue will be developed in detail in the future research of the group.

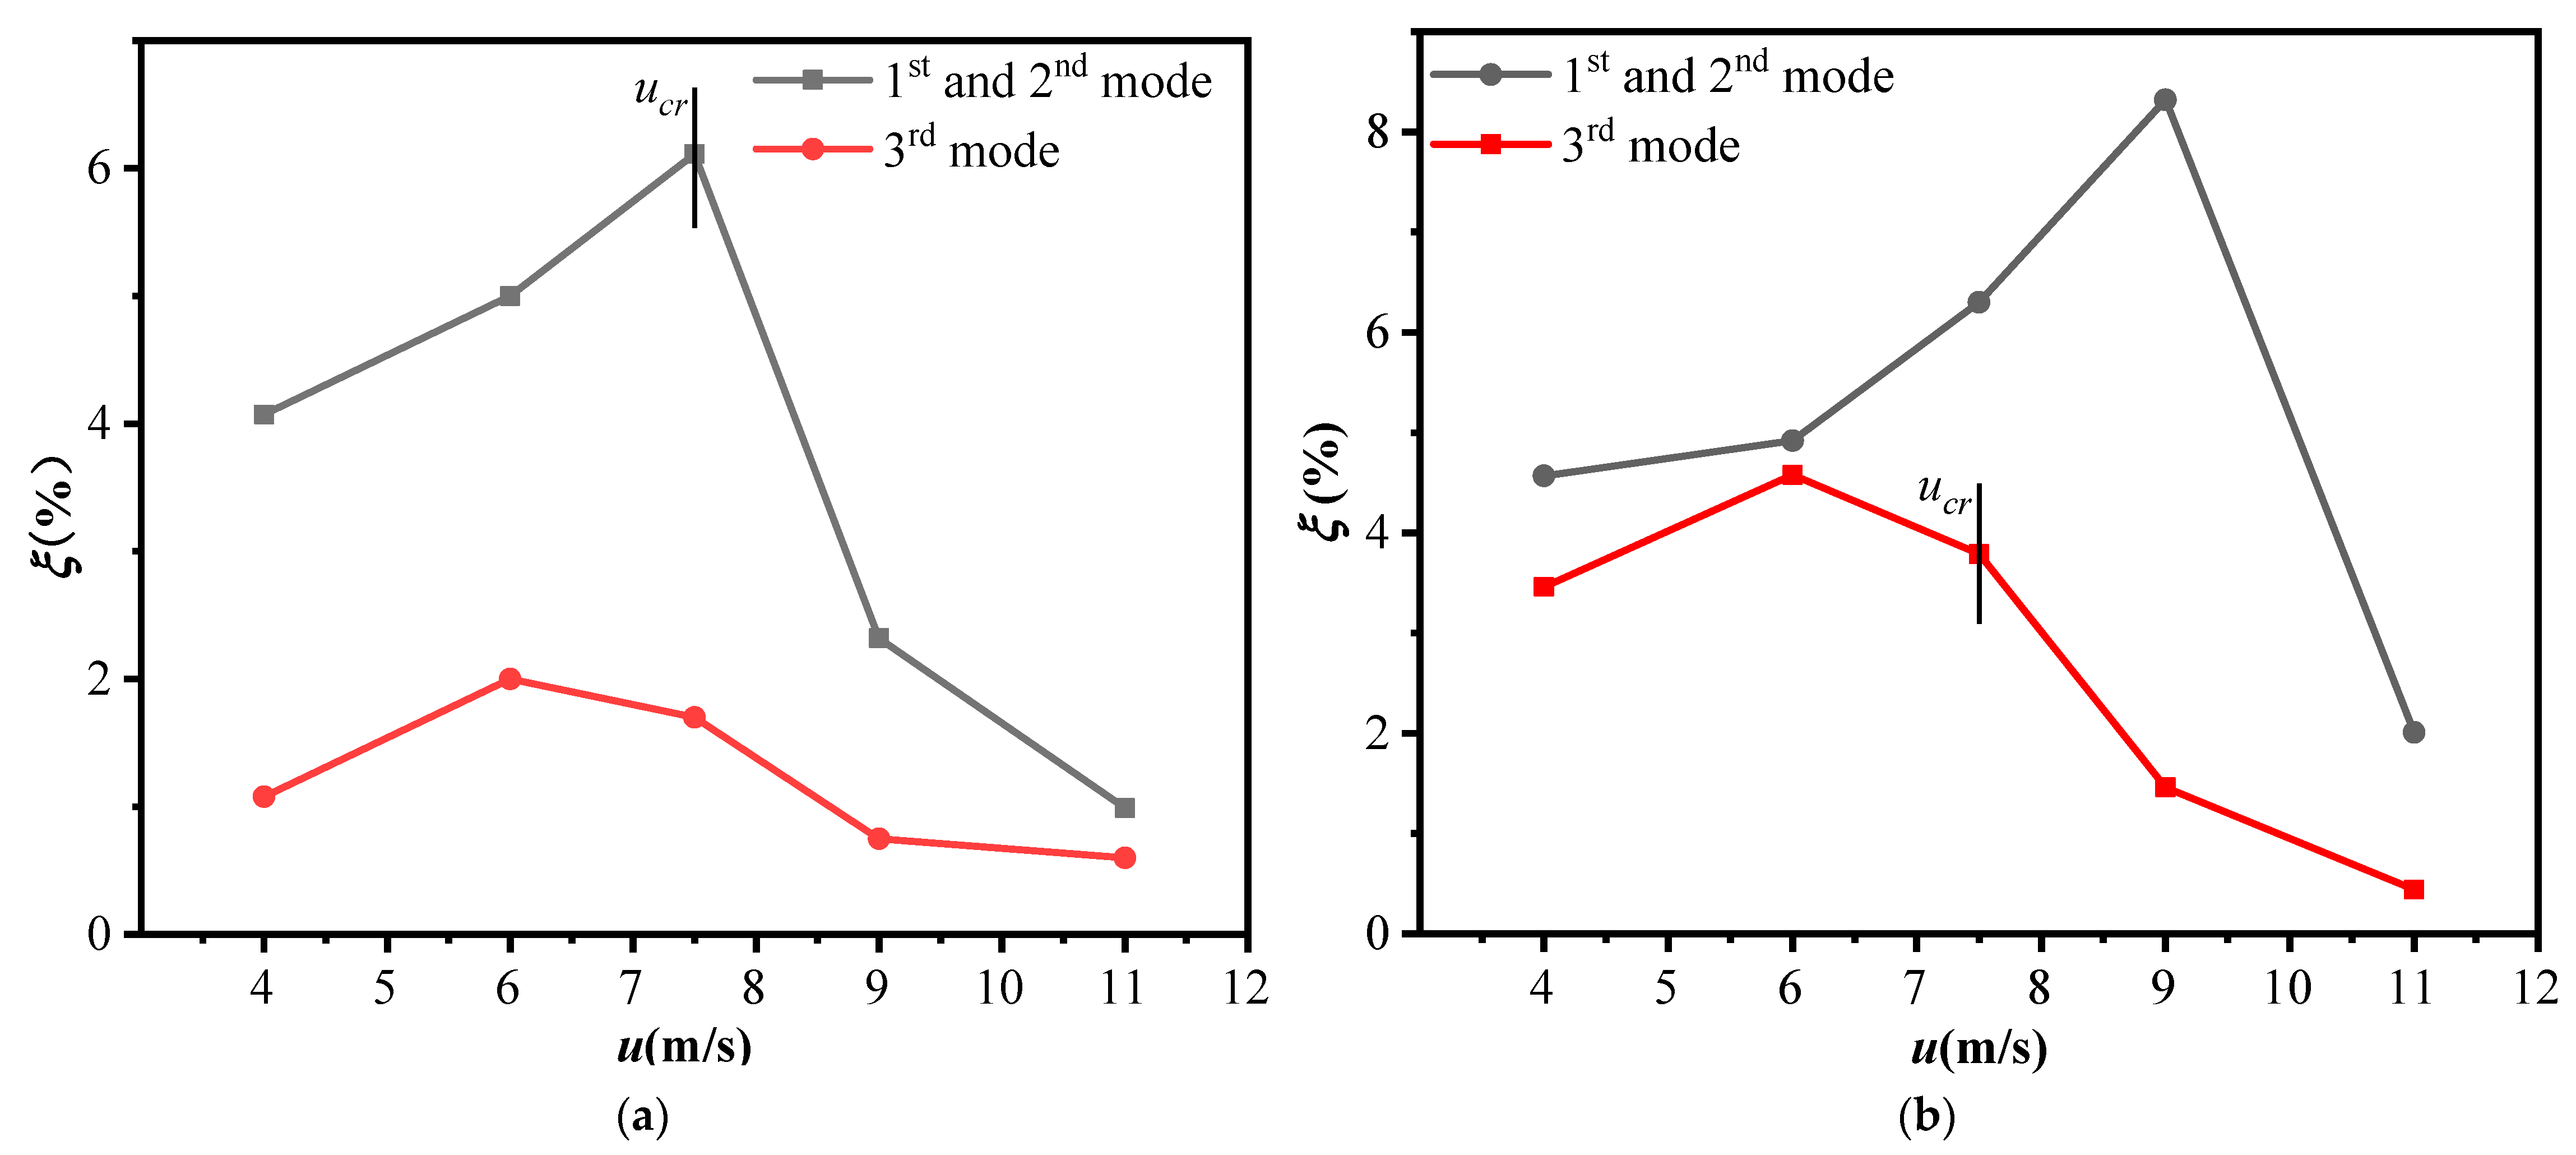
4.2. Damping Ratio Analysis

The random decrement technique (RDT) is used to obtain the damping ratios of the structure for each mode under wind load. The implementation process is as follows: Firstly, the response of each mode is extracted from the total response of the structure by band-pass filtering method; secondly, the RDT is applied to obtain the random decrement curve of each mode; and finally, the logarithmic decay method is applied to evaluate the random decrement curve to obtain the damping ratio of each mode [9,30,31,32]. Figure 17 shows the damping ratio variation characteristic for the first three modes at the top of the model (d1) and the center of the leeward surface (d2). It can be seen that the damping ratio of the low mode of the structure is always larger than that of the high mode, and the overall damping ratio tends to increase before the critical wind speed is exceeded, and after the critical wind speed ucr = 7.5 m/s is exceeded, the damping ratios of the 1st and 2nd modes at d1 and the 3rd mode at d2 decrease rapidly and finally decay close to zero.

4.3. Dimensionless Critical Wind Speed of Aeroelastic Instability

The dimensionless critical wind speed u c r * of the structure is defined as follows:
u c r * = u c r f c r L
where f is the vortex-induced resonance frequency of the structure, and the 3rd mode frequency of the structure is taken in this paper; L is the span of the structure.
The dimensionless critical wind speed of the structure can be obtained from Equation (6) as 1.37.
In this test, the Reynolds number of fluid flow after reaching the instability critical wind speed is Re > 3.1 × 10⁵. The equation is as follows:
R e = 69,000   u c r L

5. Conclusions

This paper describes the process of manufacturing the aeroelastic model, the design of the test, and some of the measurement equipment. The DIC technique is applied to measure the full-field dynamic displacement and strain of the spherical inflatable membrane structure. An aeroelastic model test is conducted in the wind tunnel to investigate the change characteristic of the response under different wind speeds. A preliminary study of the characteristics of aeroelastic instability of such structures and the signs of the occurrence of this phenomenon is carried out. The conclusions are summarized as follows:
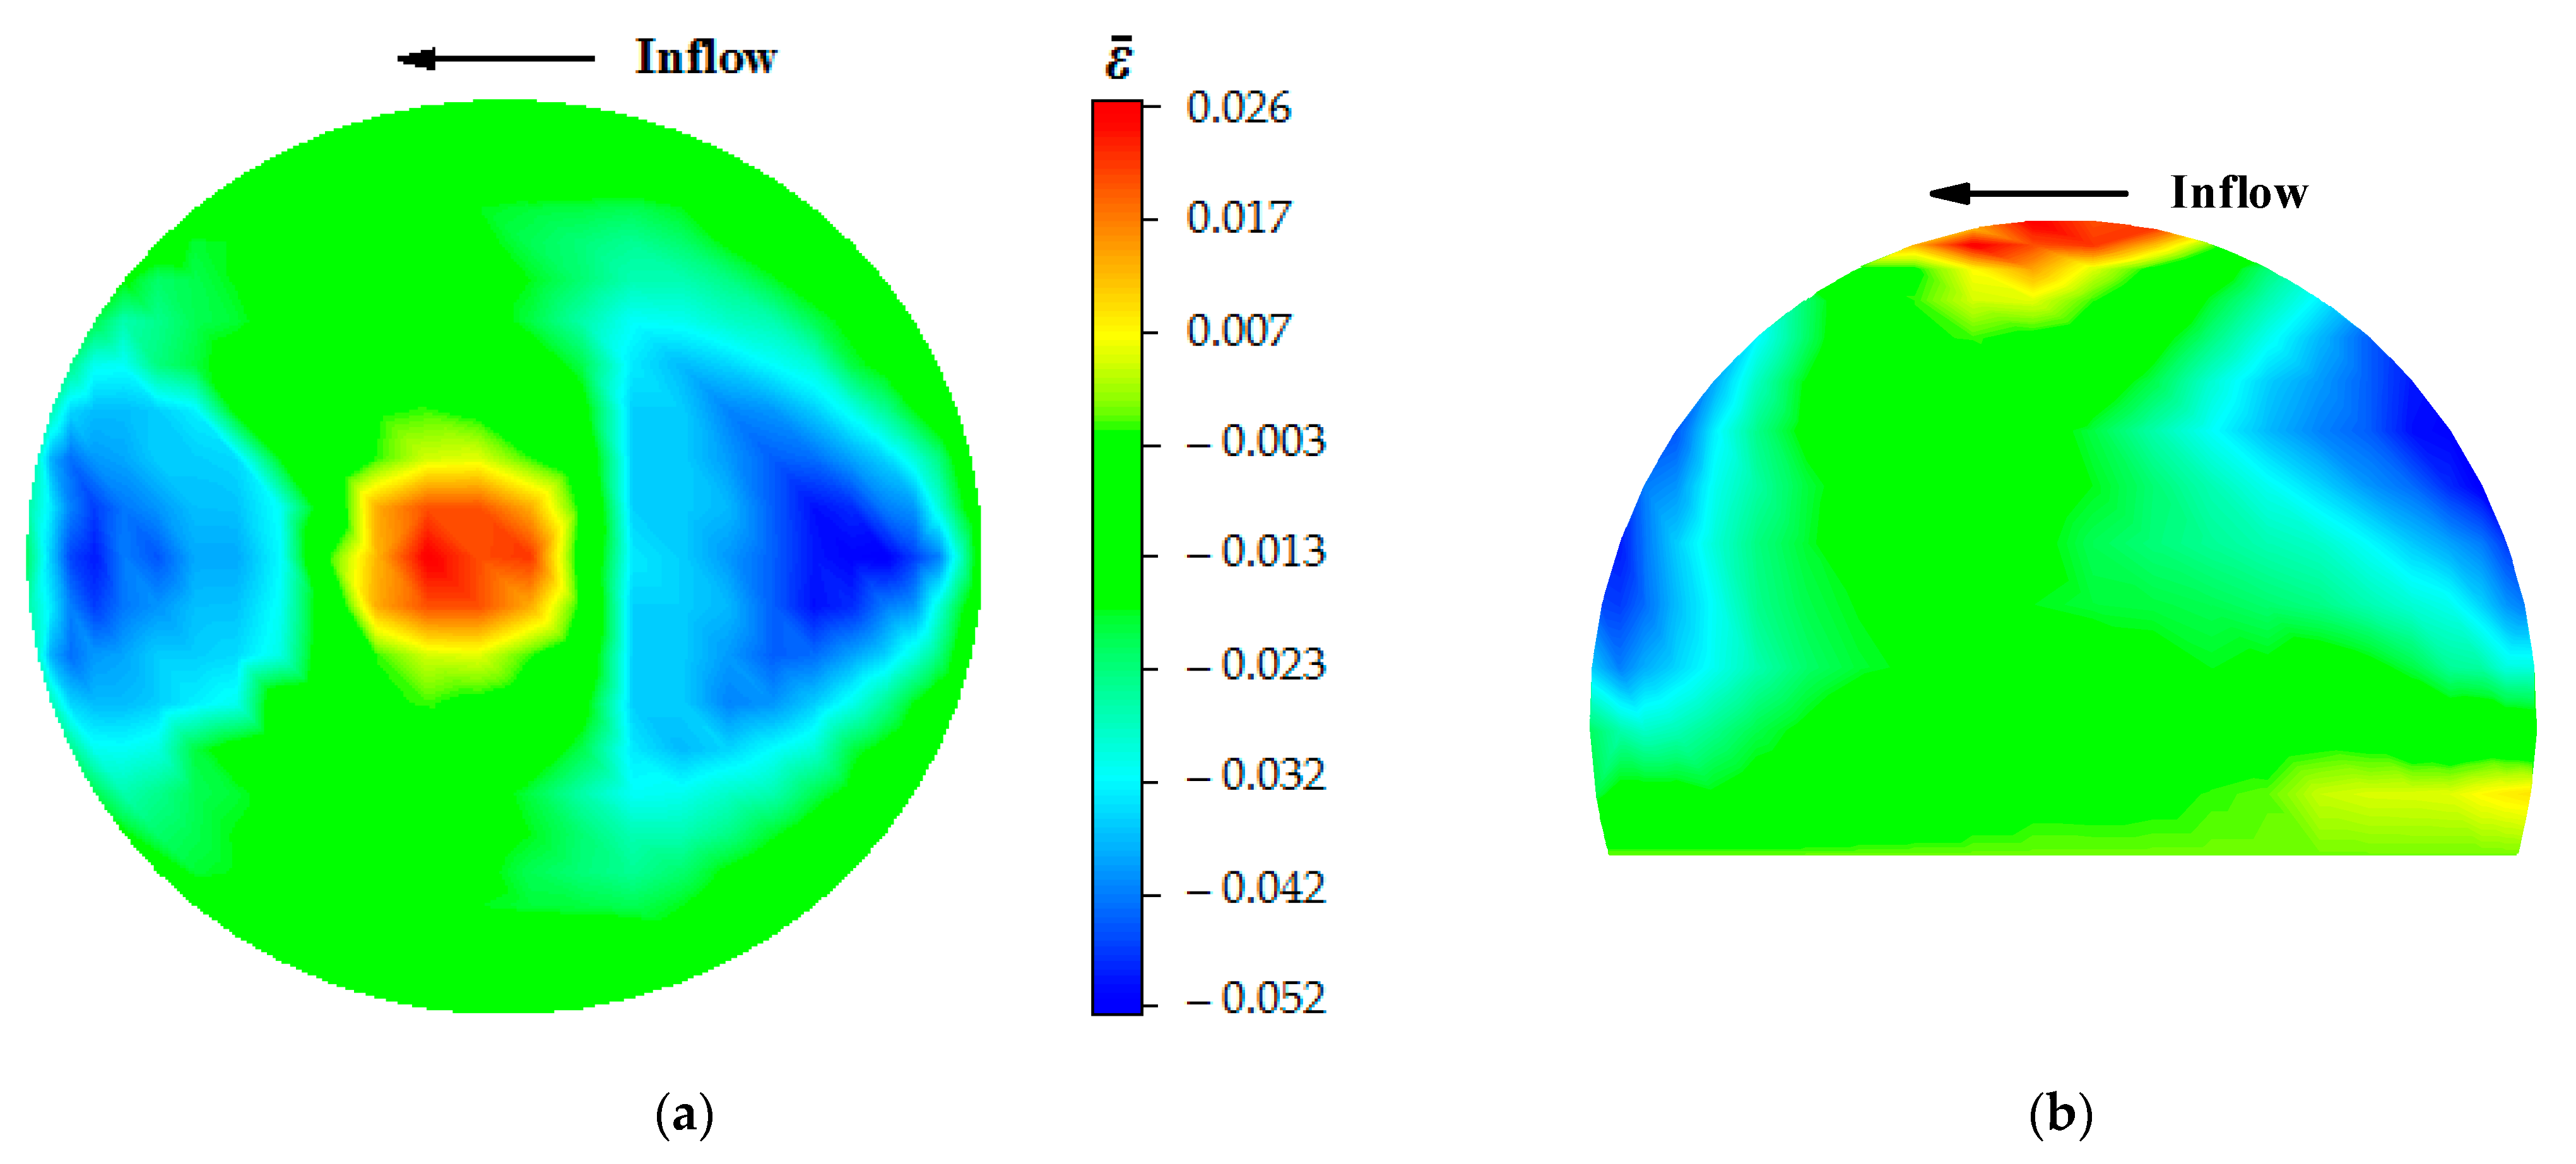
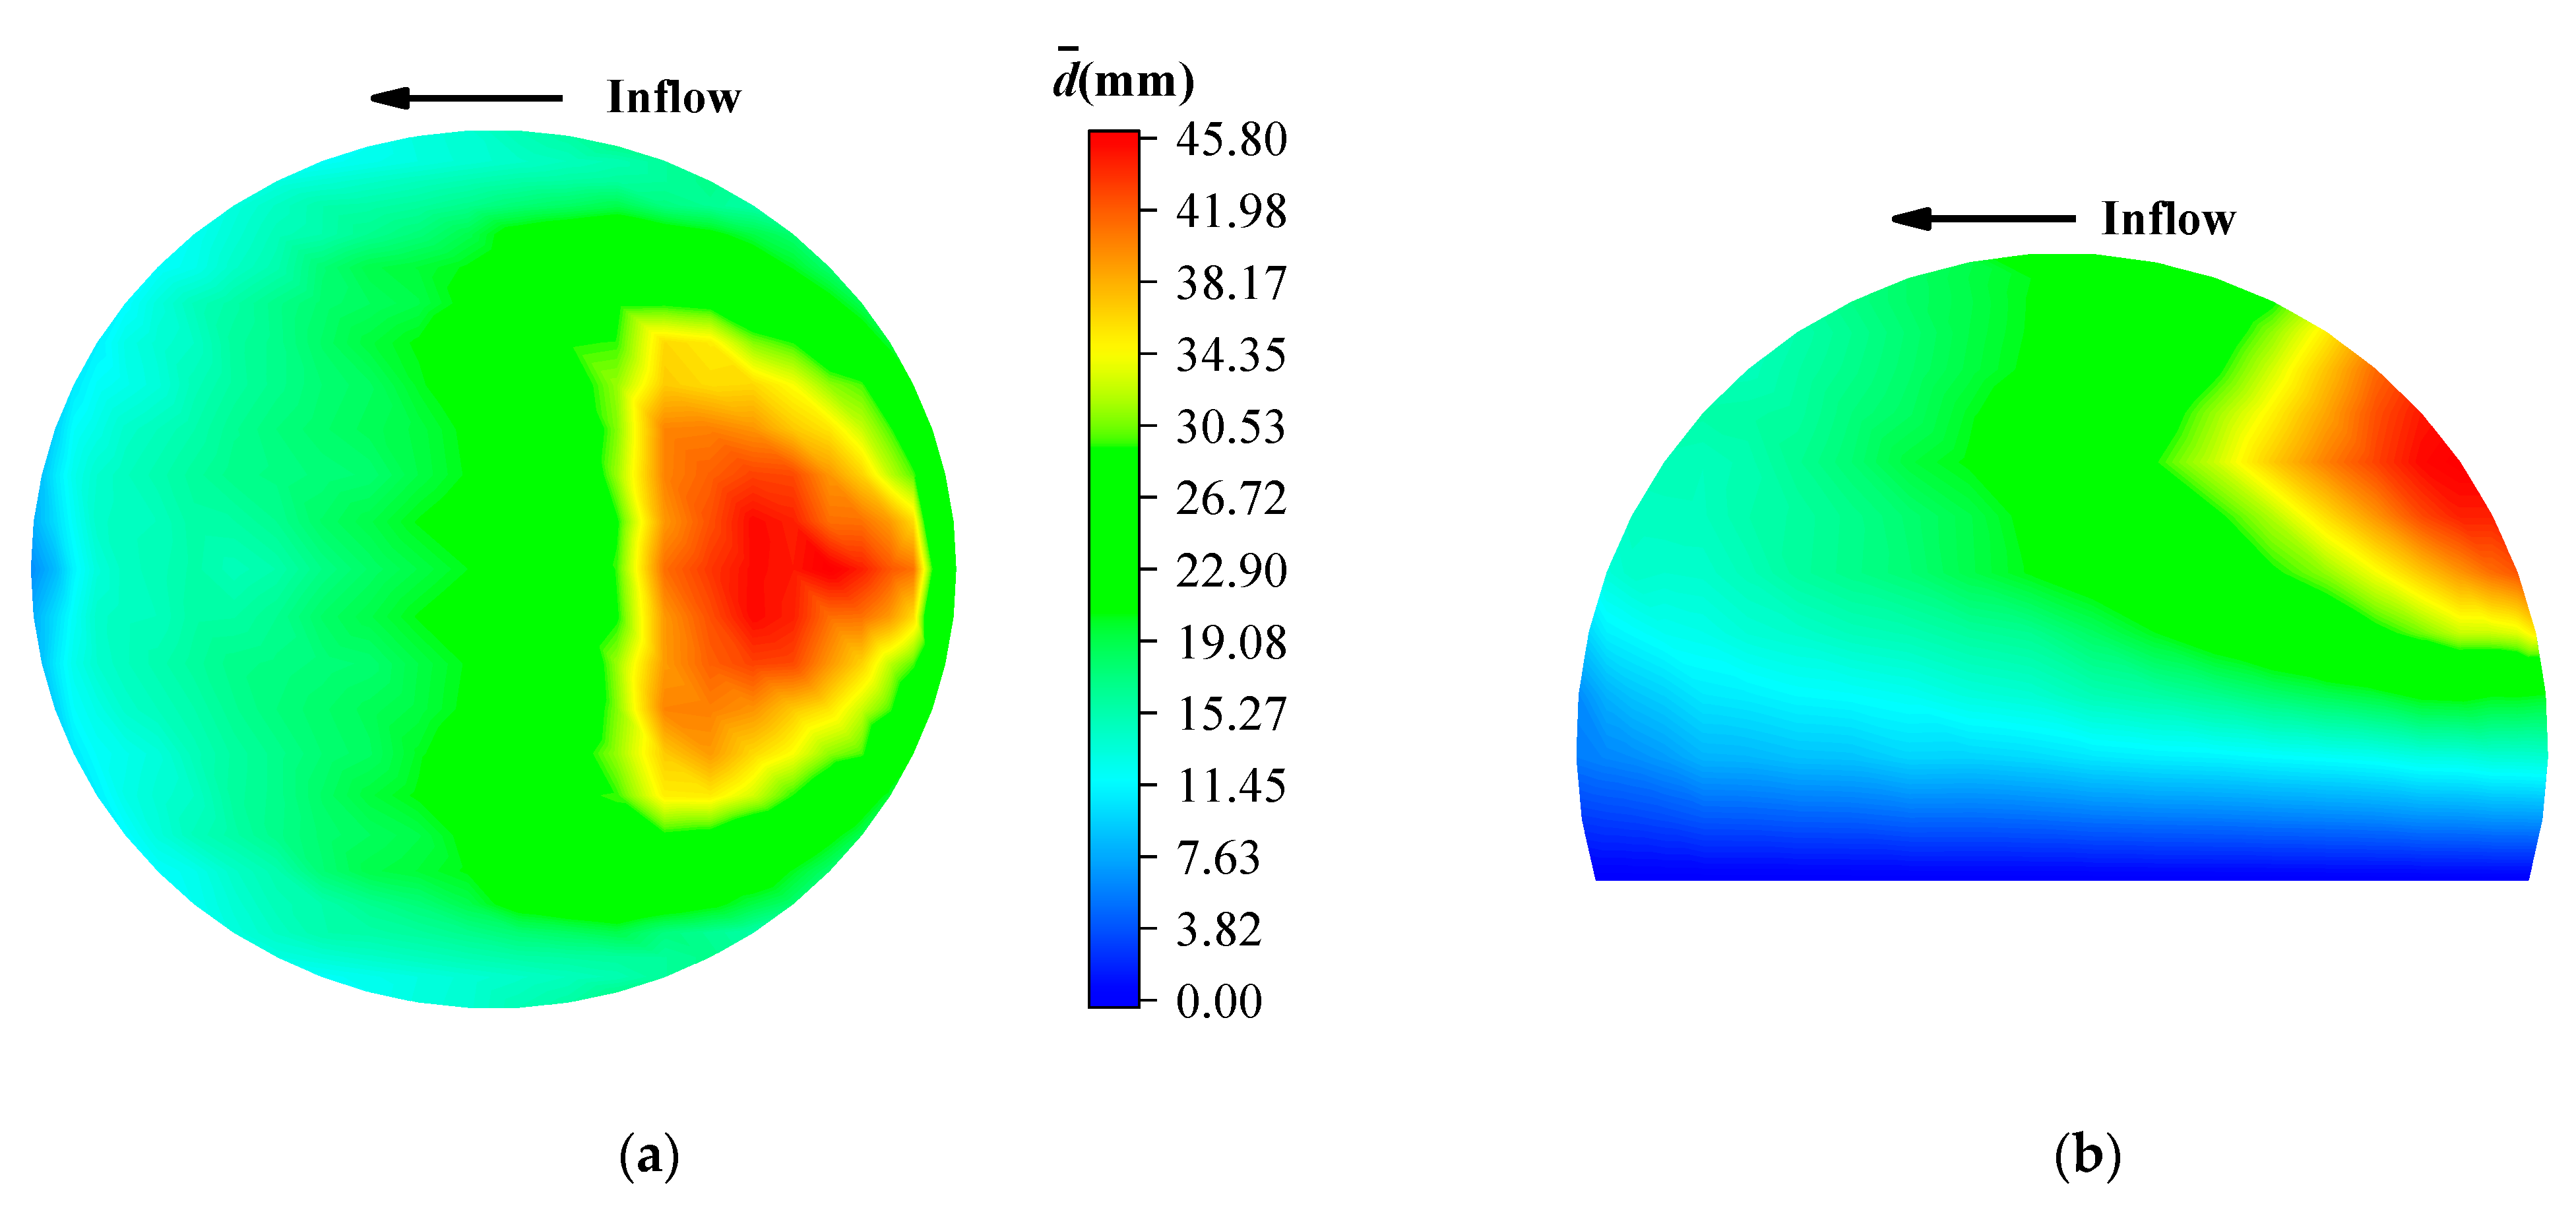
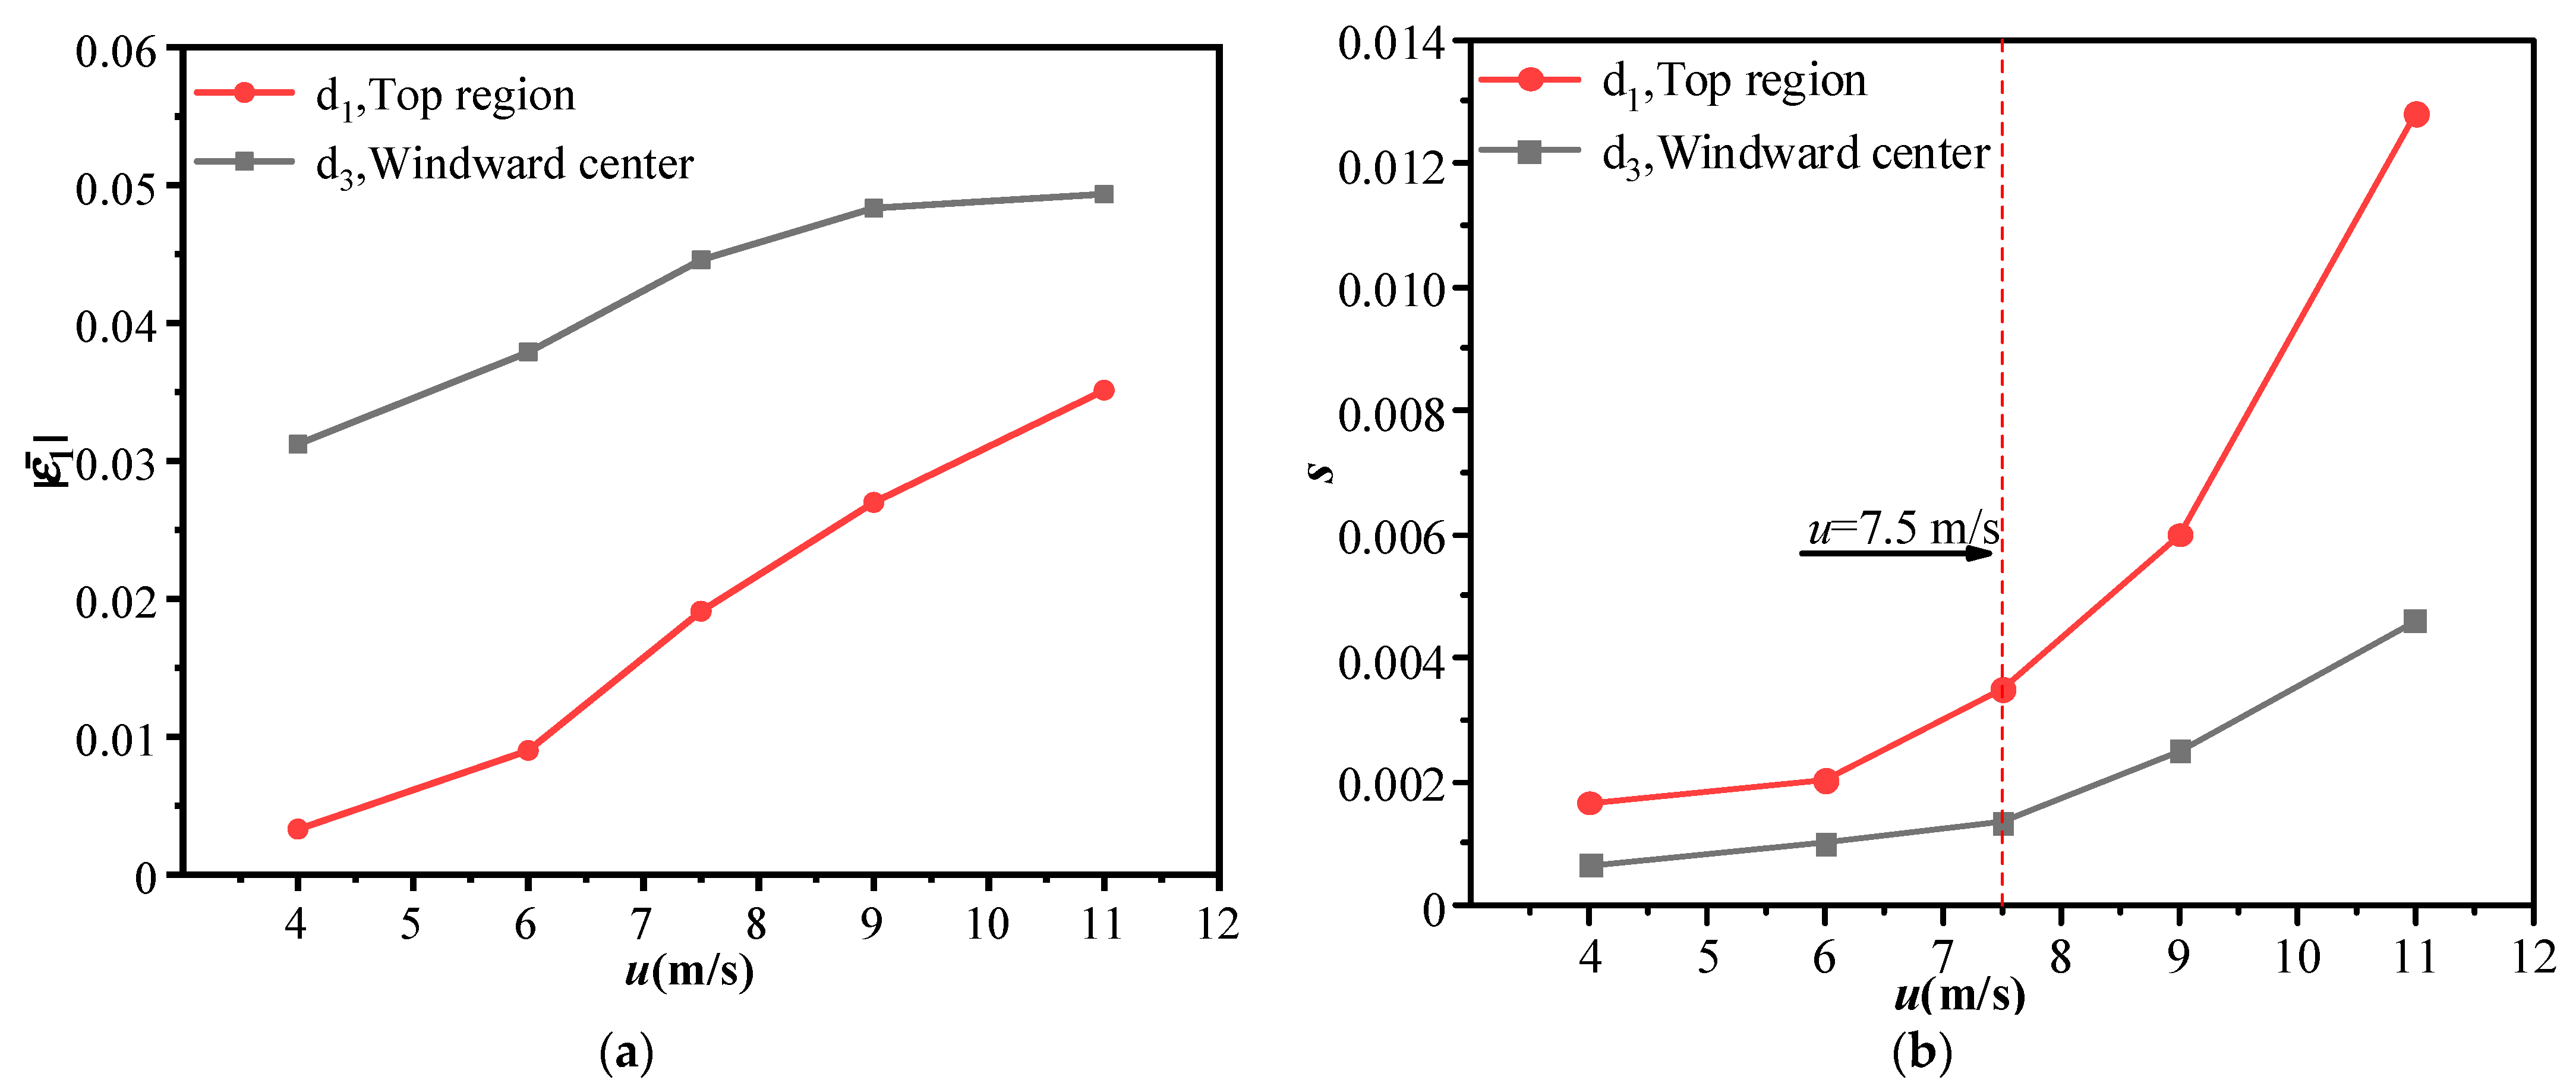
  • The maximum windward displacement of the structure is located at approximately 1/2 of the windward. The extreme value of the mean value of the total displacement occurs at approximately 1/2 of the centerline of the windward. The extreme value of the mean value of the maximum principal strain occurs at the top region of the model and approximately 1/2 of the windward and leeward.
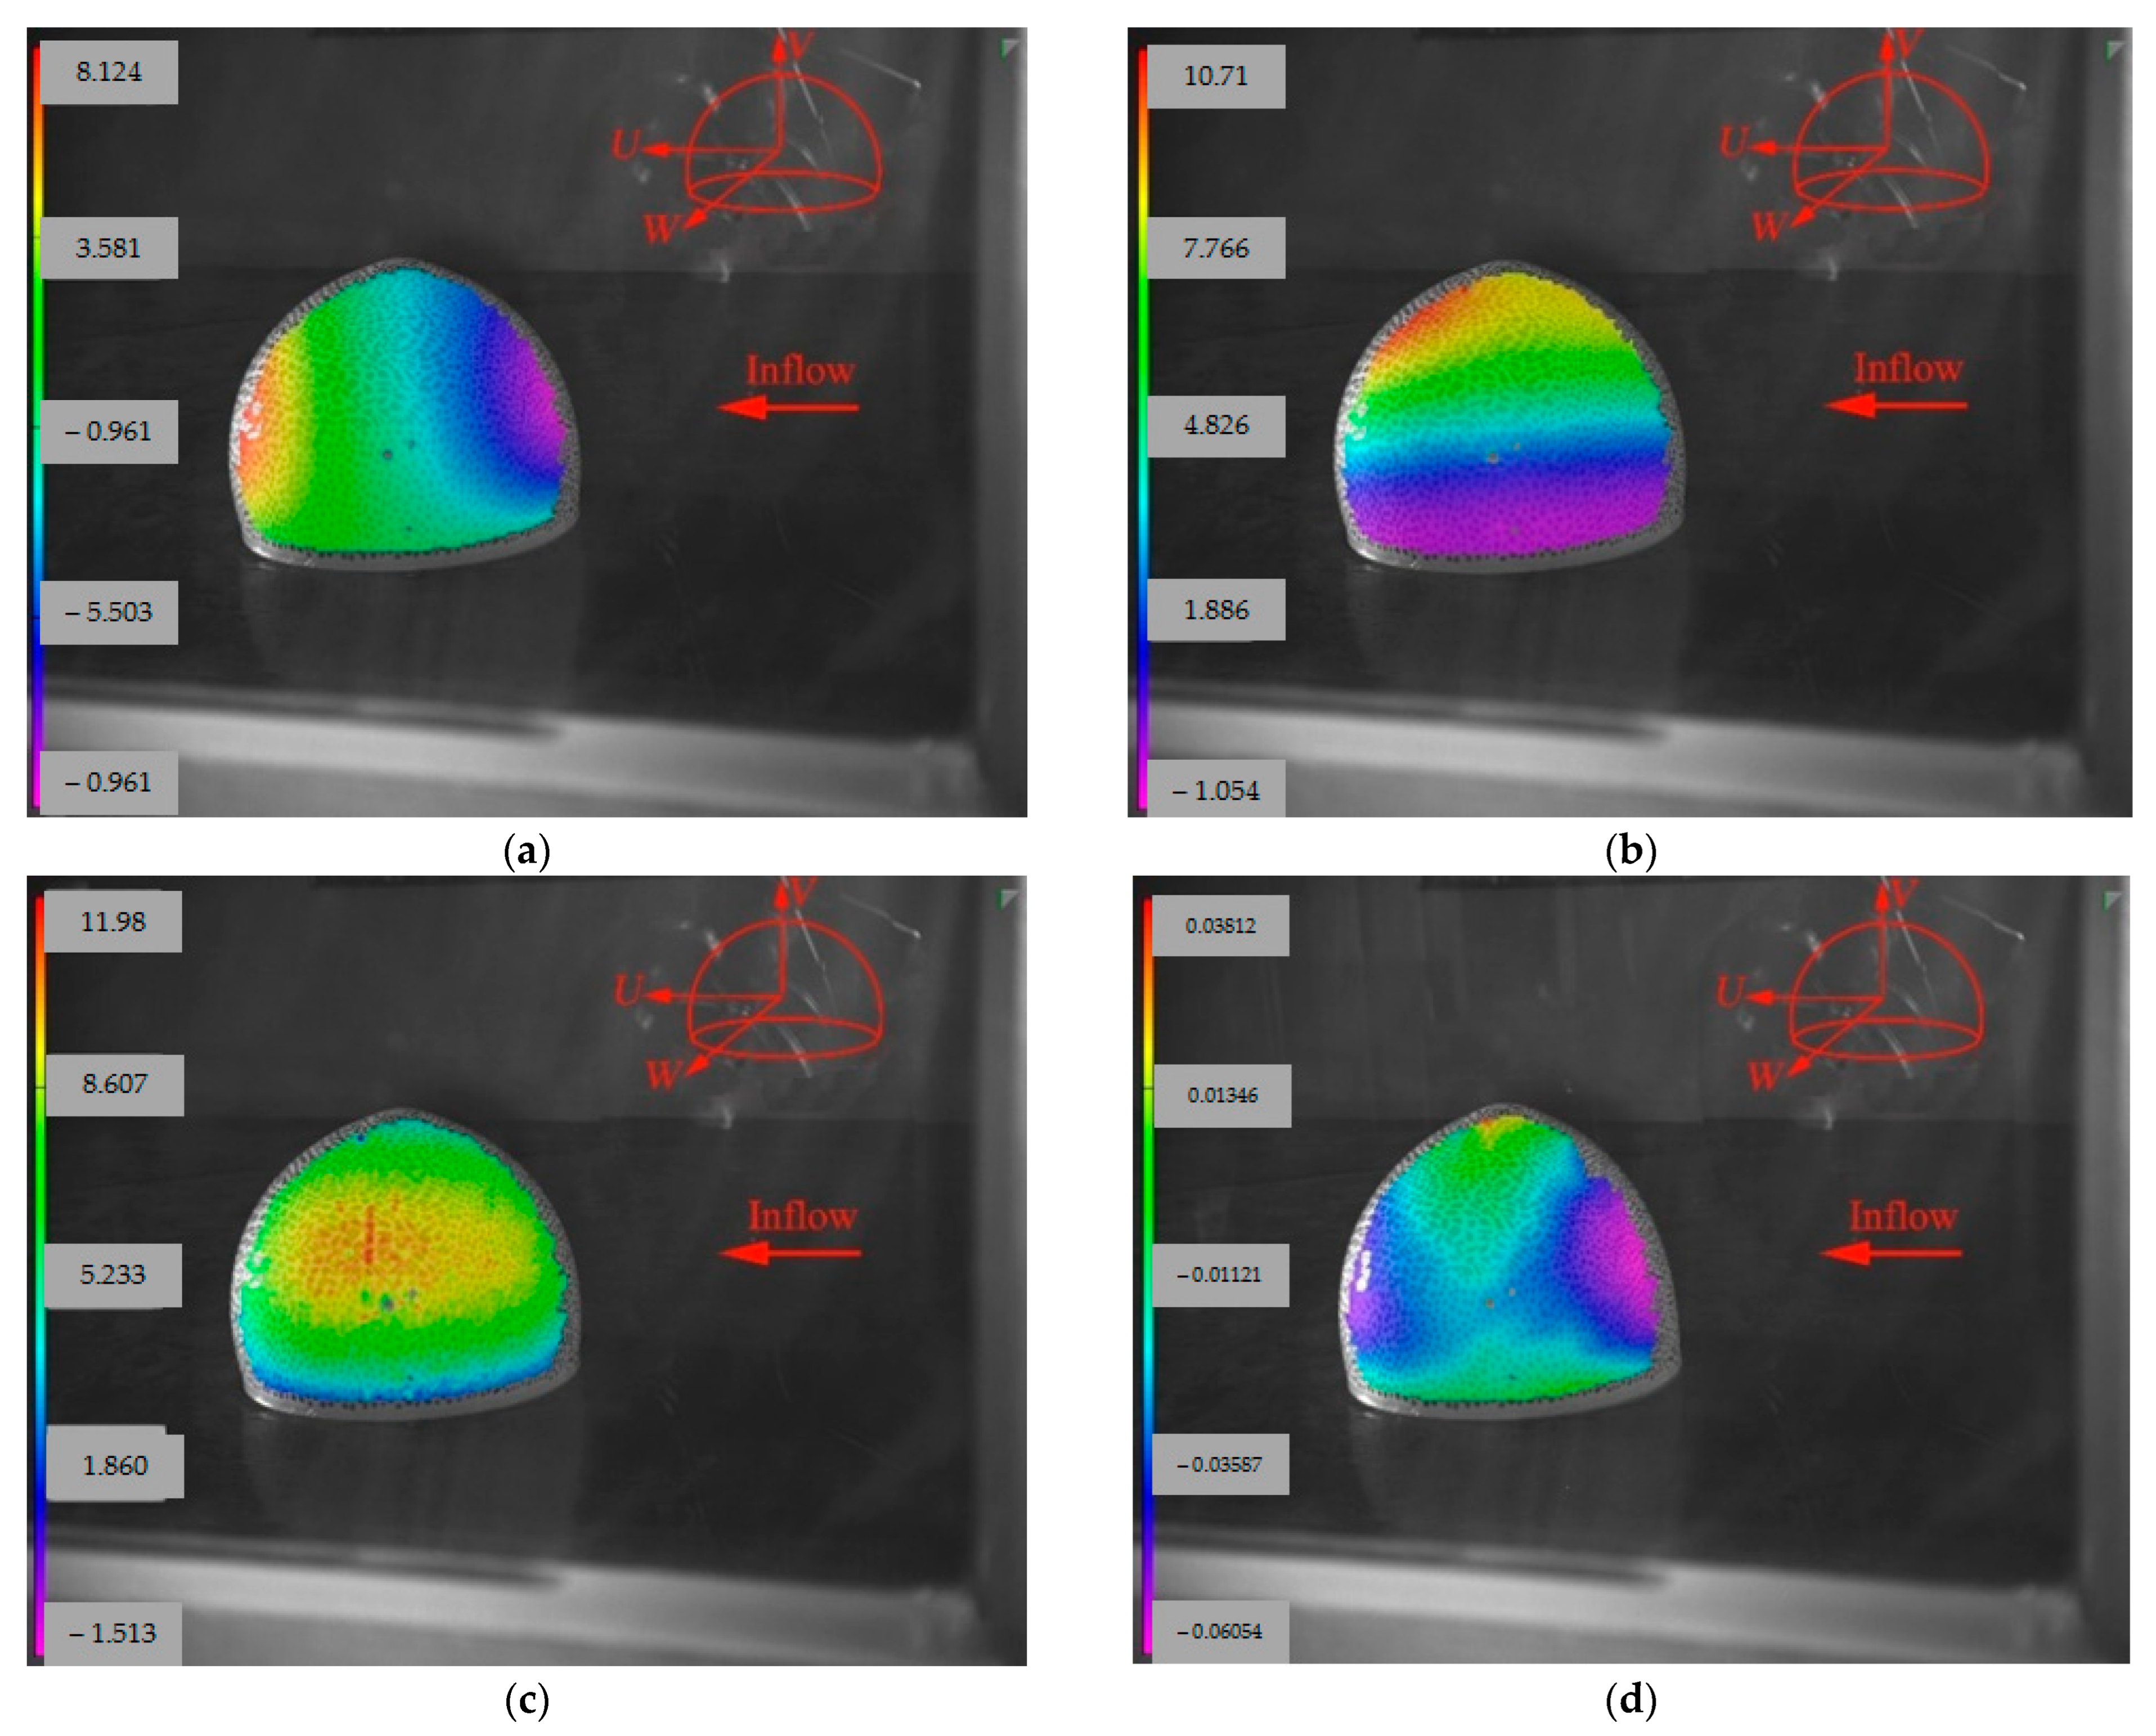
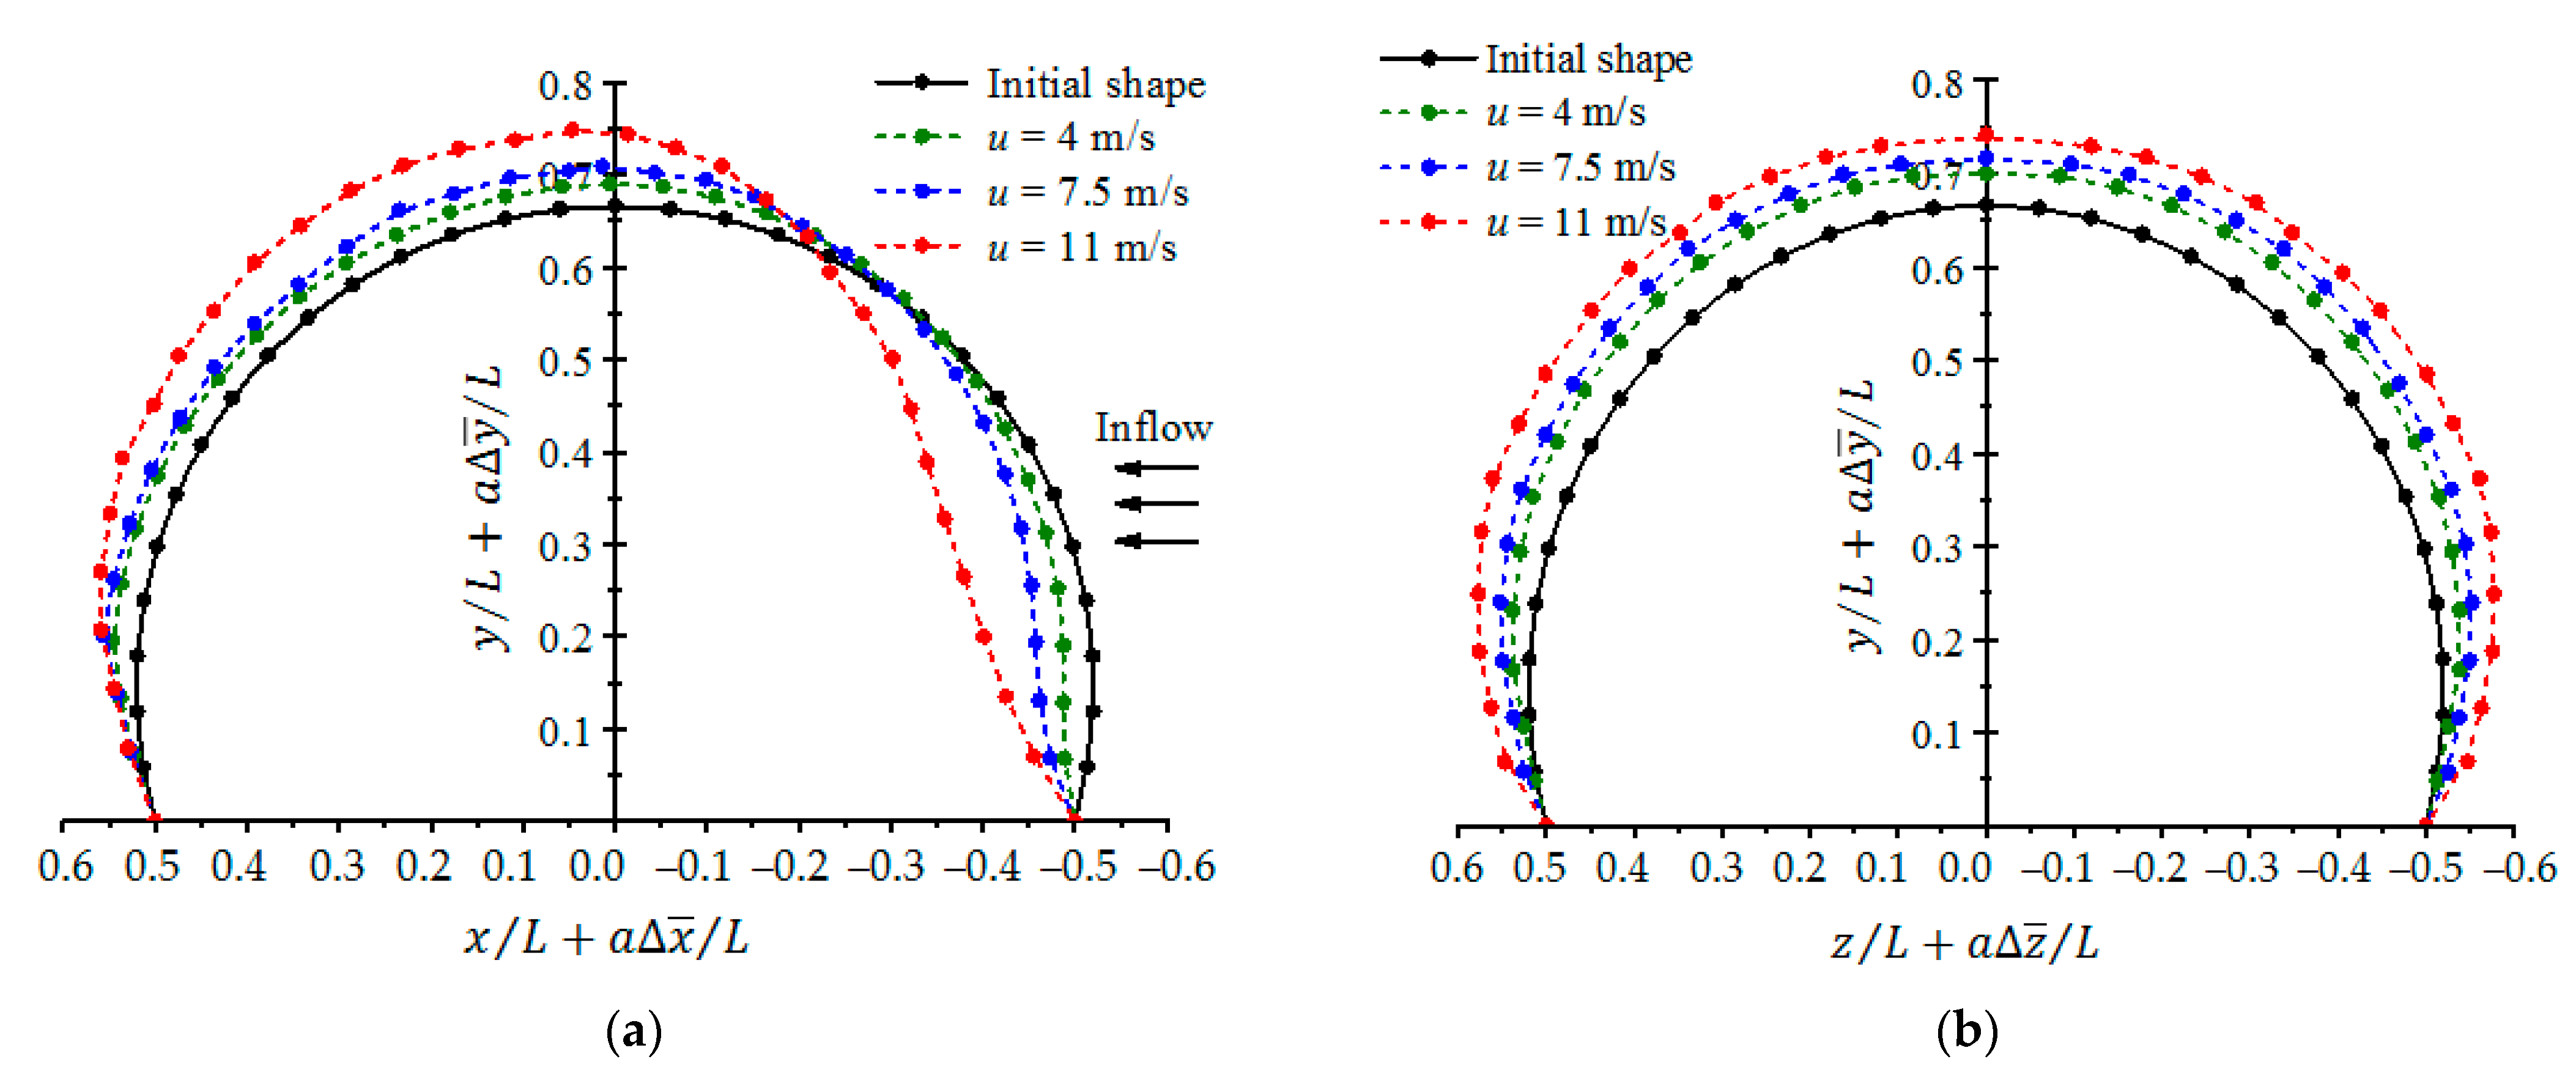
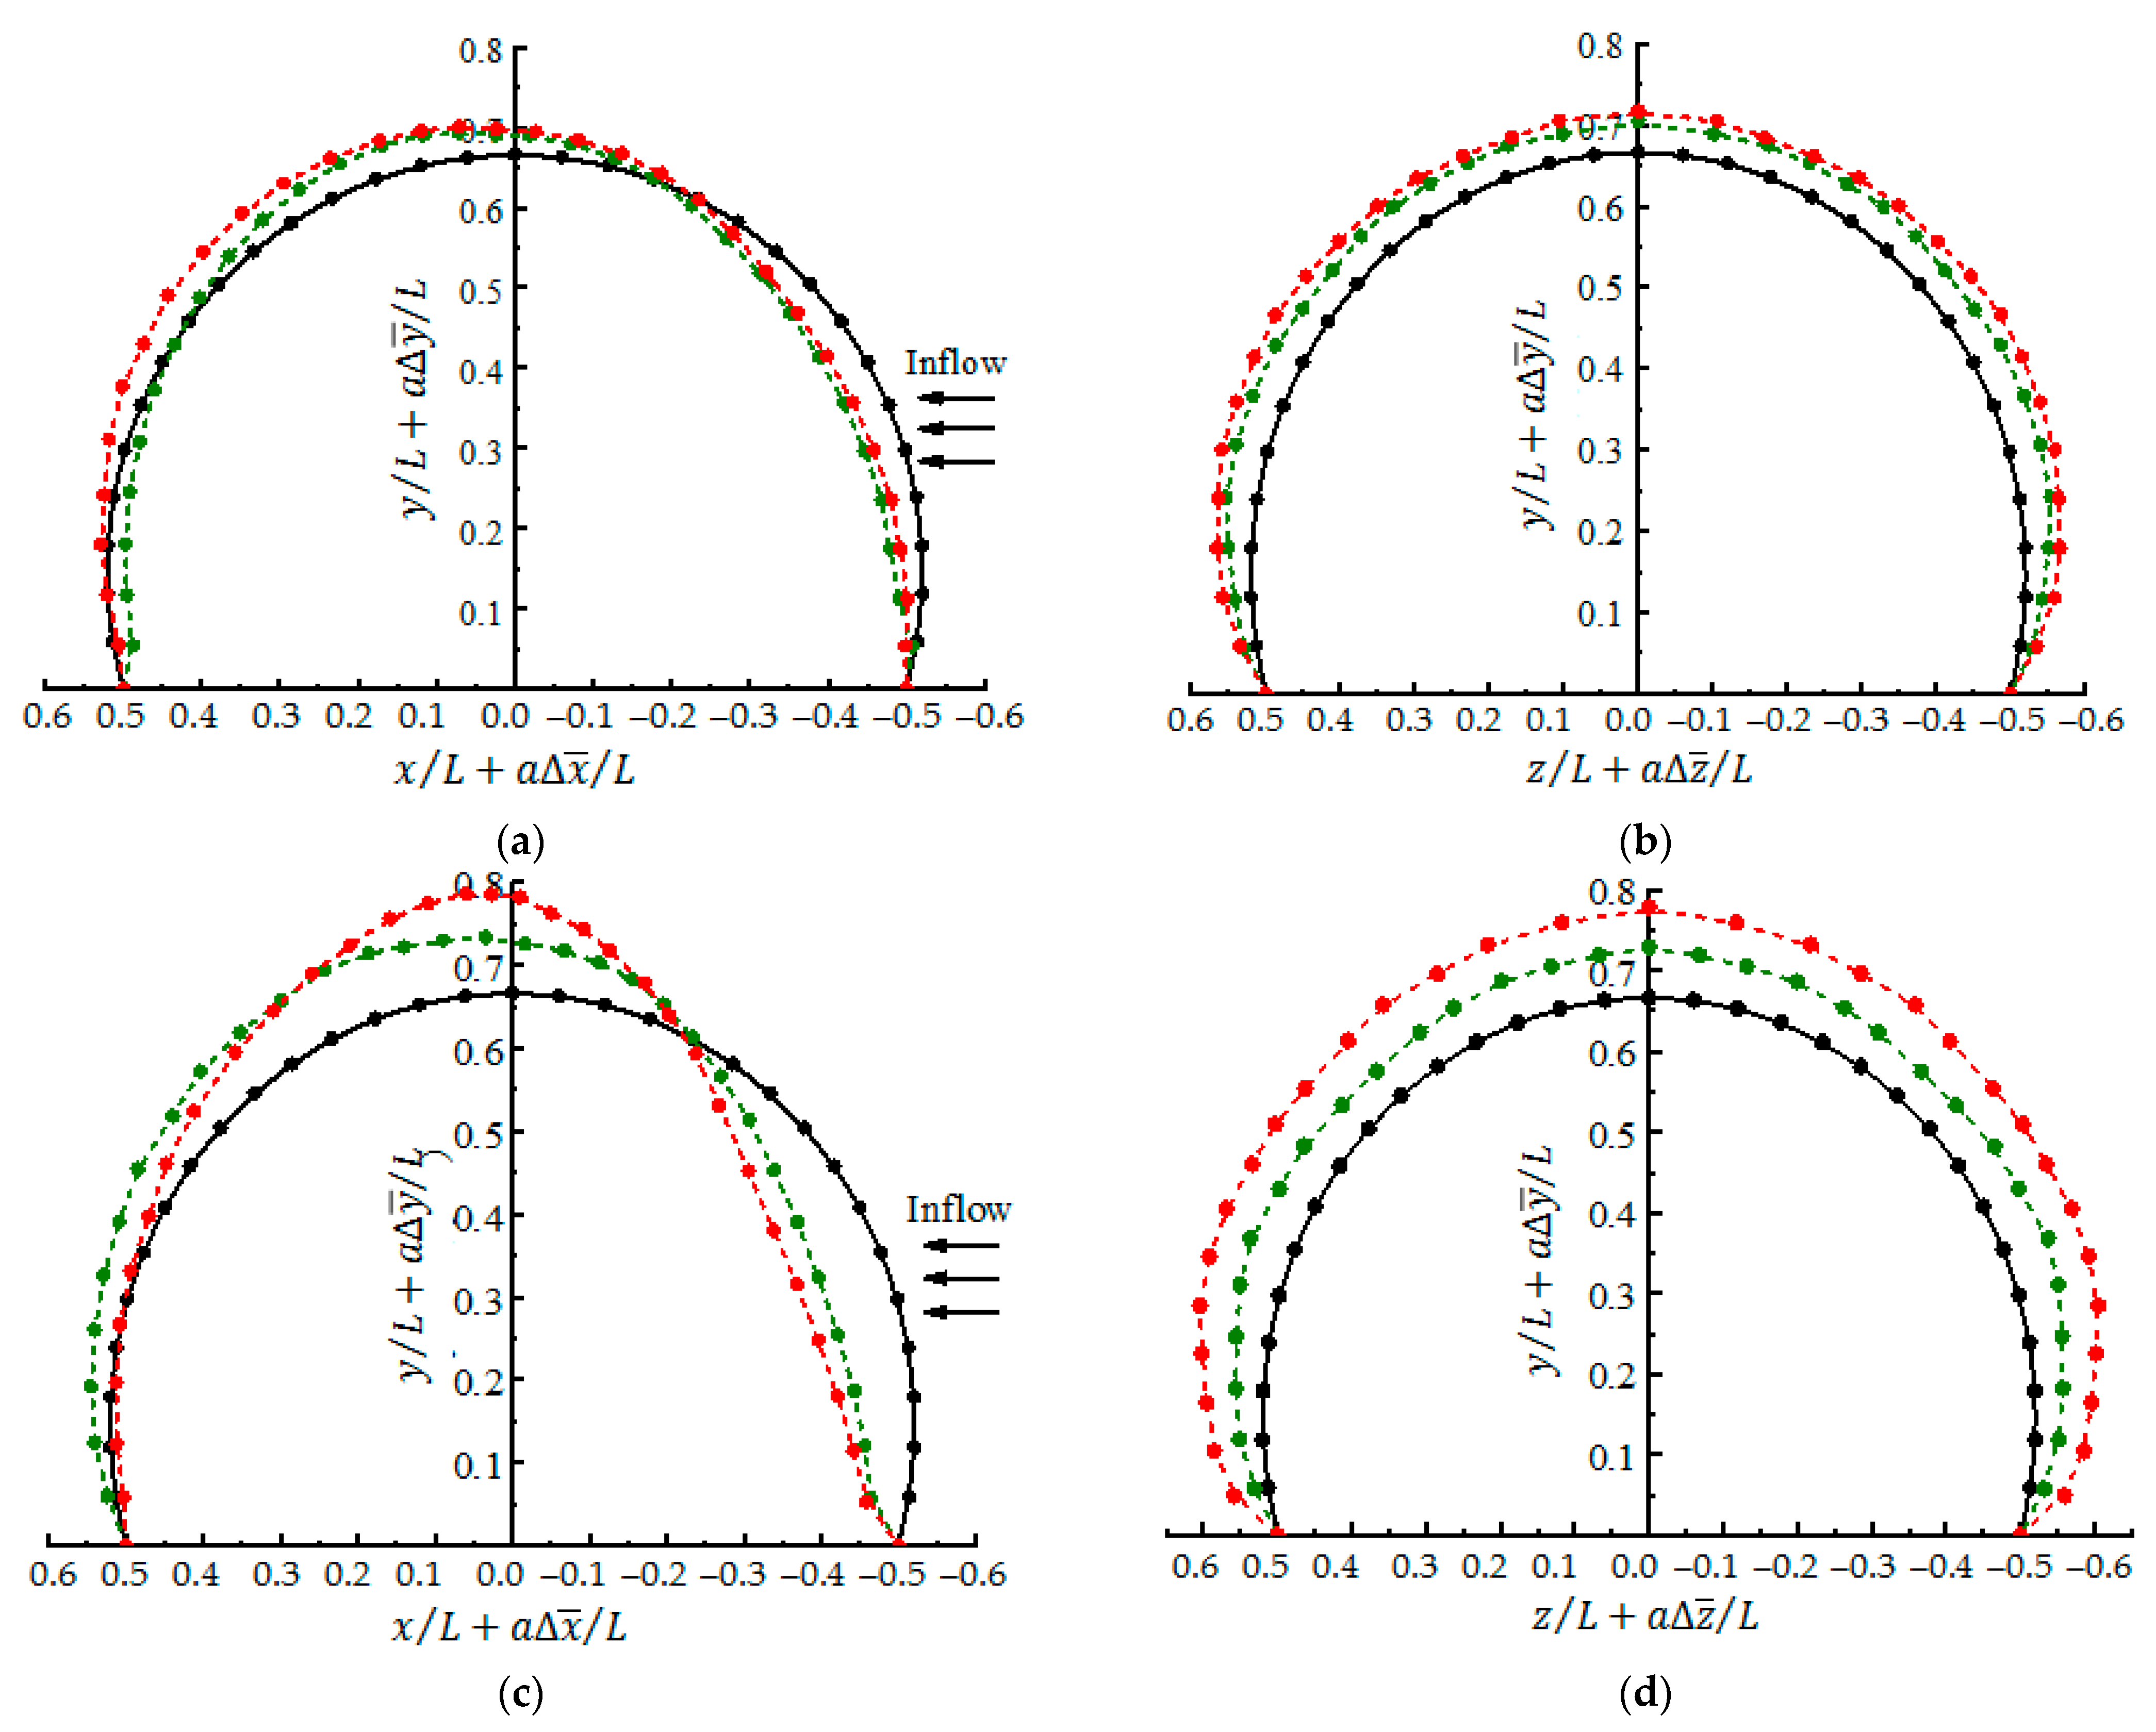
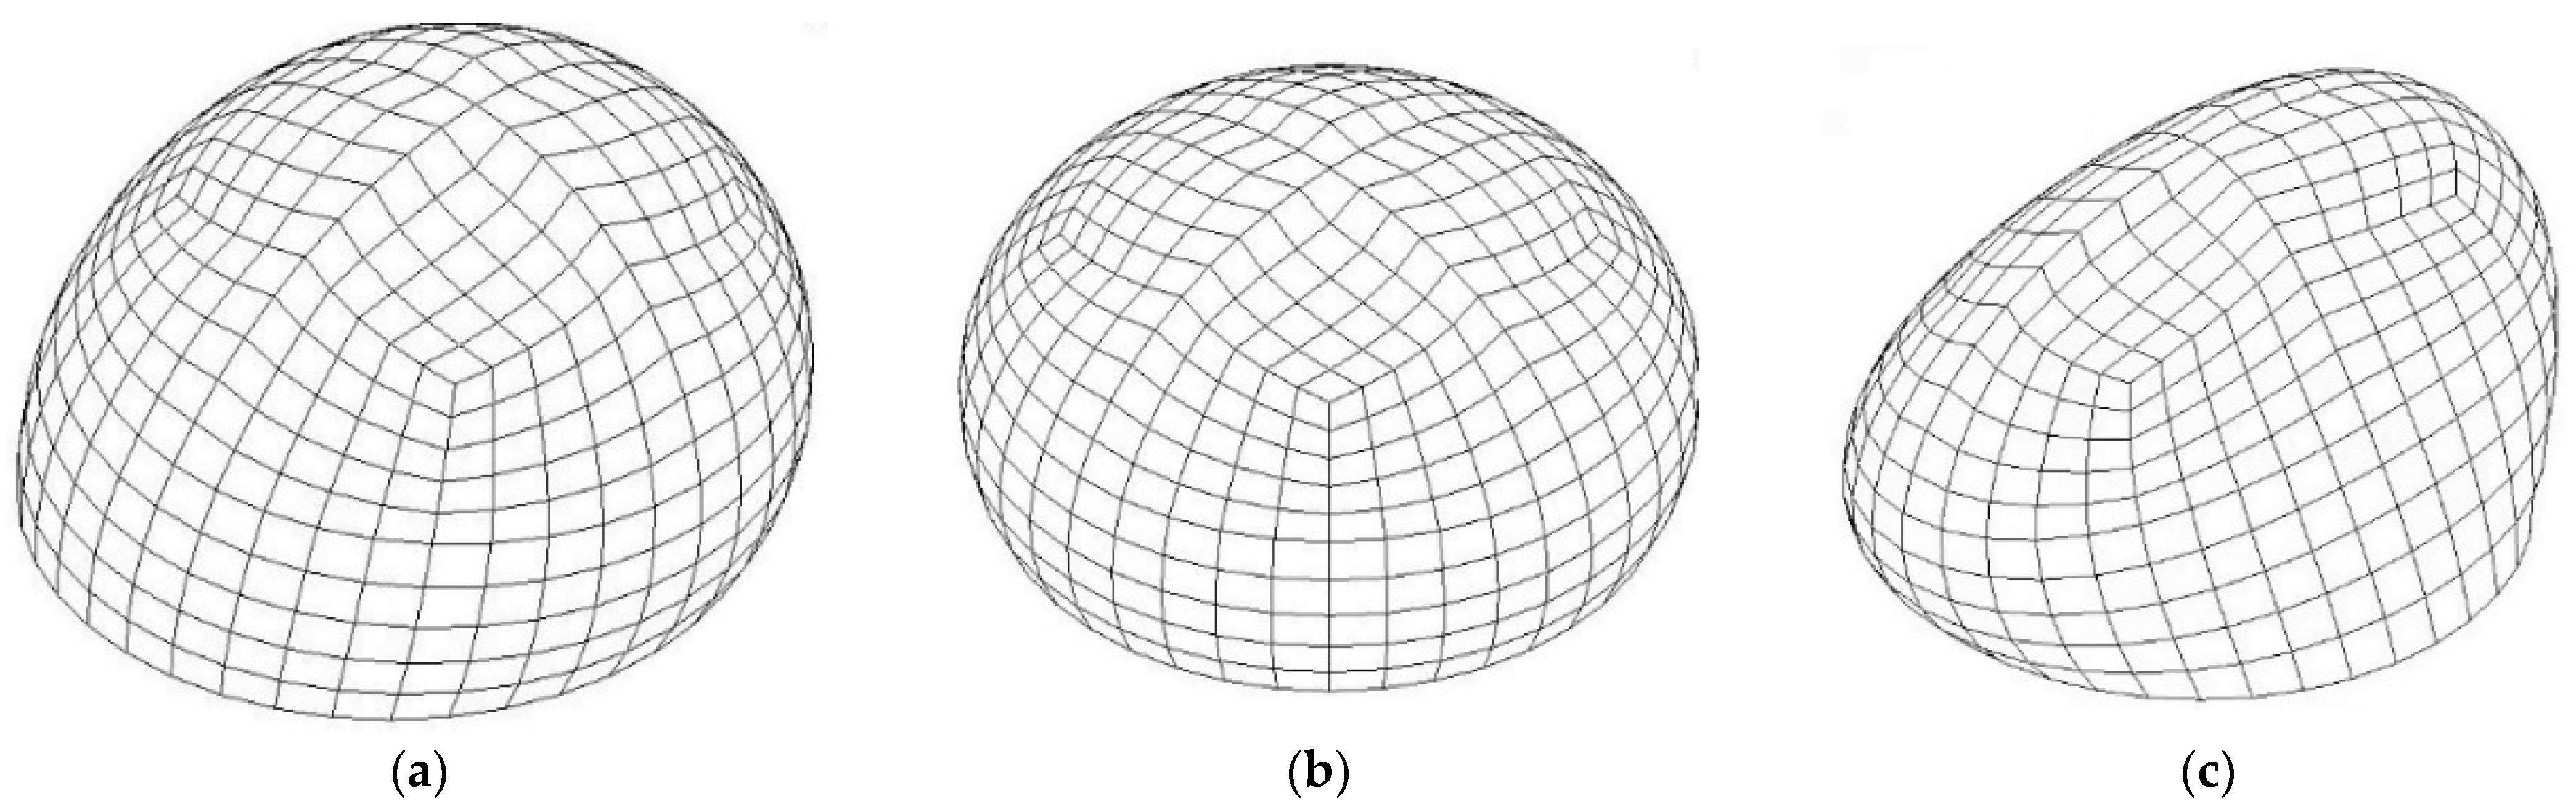
  • The average deformation characteristic of the spherical inflatable membrane is that the top, windward, and side deform upward, downward, and outward. The deformation of the structure is large in the downwind, cross-wind, and vertical directions. The amplitude of the cross-wind direction is always larger than the other two directions. The structure is greatly affected by the vortex-induced vibration caused by the FSI. Therefore, the FSI should be considered in the engineering design of similar structures.
  • The aeroelastic instability of the spherical inflatable membrane structure is caused by the cross-wind vortex-induced resonance, which is marked by the sudden change of the structural response and amplitude when the critical wind speed is reached or exceeded.
  • After reaching the critical wind speed (when u c r / ( f c r L )     1 .37), the structure usually undergoes a change of the dominant vibration mode. Furthermore, as the wind speed continues to increase, the damping ratio decreases rapidly and eventually decays to close to zero.
  • Based on the study in this paper, the dimensionless critical wind speed u c r / ( f c r L ) of the spherical inflatable membrane structure is approximately 1.37. The Reynolds number of fluid flow after reaching the instability critical wind speed is Re > 3.1 × 10⁵.

Author Contributions

Conceptualization, Z.C. and N.S.; methodology, Z.C.; data curation, Y.S.; software, Y.S.; validation, Z.C., N.S. and J.W.; formal analysis, L.T.; investigation, N.S.; resources, Z.C.; writing—original draft preparation, N.S.; writing—review and editing, N.S.; visualization, N.S.; supervision, Z.C.; project administration, Z.C.; funding acquisition, Z.C. All authors have read and agreed to the published version of the manuscript.

Funding

This research was funded by Key R & D plan of Jilin Provincial Department of science and technology, grant number 20210203165SF.

Institutional Review Board Statement

Not applicable.

Informed Consent Statement

Informed consent was obtained from all subjects involved in the study.

Data Availability Statement

The data, models, and code generated or used during the study are available from the corresponding author by reasonable request.

Conflicts of Interest

The authors declare no conflict of interest.

References

  1. Park, M.J.; Yoon, S.W.; Kim, Y.C.; Cheon, D.J. Wind Pressure Characteristics Based on the Rise–Span Ratio of Spherical Domes with Openings on the Roof. J. Build. 2022, 12, 576. [Google Scholar] [CrossRef]
  2. Michalski, A.; Kermel, P.D.; Haug, E.; Löhner, R.; Wüchner, R.; Bletzinger, K.-U. Validation of the computational fluid–structure interaction simulation at real-scale tests of a flexible 29m umbrella in natural wind flow. J. Wind. Eng. Ind. Aerodyn. 2011, 99, 400–413. [Google Scholar] [CrossRef]
  3. Wu, Y.; Chen, Z.-Q.; Sun, X.-Y. Research on the wind-induced aero-elastic response of closed-type saddle-shaped tensioned membrane models. J. Zhejiang Univ. Sci. A 2015, 16, 656–668. [Google Scholar] [CrossRef]
  4. Li, T.; Yang, Q.; Ishihara, T. Unsteady aerodynamic characteristics of long-span roofs under forced excitation. J. Wind Eng. Ind. Aerodyn. 2018, 181, 46–60. [Google Scholar] [CrossRef]
  5. Takadate, Y.; Uematsu, Y. Steady and unsteady aerodynamic forces on a long-span membrane structure. J. Wind Eng. Ind. Aerodyn. 2019, 193, 103946. [Google Scholar] [CrossRef]
  6. Liu, C.; Deng, X.; Zheng, Z. Nonlinear wind-induced aerodynamic stability of orthotropic saddle membrane structures. J. Wind Eng. Ind. Aerodyn. 2017, 164, 119–127. [Google Scholar] [CrossRef]
  7. Ding, W.; Uematsu, Y.; Nakamura, M.; Tanaka, S. Unsteady aerodynamic forces on a vibrating long-span curved roof. J. Wind Struct. 2014, 19, 649–663. [Google Scholar] [CrossRef]
  8. Ding, W.; Uematsu, Y. Large eddy simulation of unsteady aerodynamic behavior of long-span vaulted roofs. J. Zhejiang Univ. Sci. A 2017, 18, 793–806. [Google Scholar] [CrossRef]
  9. Chen, Z.Q.; Wu, Y.; Sun, X.Y. Research on aeroelastic instability mechanism of closed-type one-way tensioned membrane. J. Build. Struct. 2015, 36, 12–19. (In Chinese) [Google Scholar]
  10. Newman, B.; Ganguli, U.; Shrivastava, S. Flow over spherical inflated buildings. J. Wind Eng. Ind. Aerodyn. 1984, 17, 305–327. [Google Scholar] [CrossRef]
  11. He, Y.; Shen, J. The wind response of double layer membrane gas holders when considering the effect of FSI. J. Int. Assoc. Shell Spat. Struct. 2017, 58, 125–135. [Google Scholar] [CrossRef]
  12. Tavakol, M.M.; Yaghoubi, M.; Motlagh, M.M. Air flow aerodynamic on a wall-mounted hemisphere for various turbulent boundary layers. J. Exp. Therm. Fluid Sci. 2010, 34, 538–553. [Google Scholar] [CrossRef]
  13. Tavakol, M.M.; Abouali, O.; Yaghoubi, M. Large eddy simulation of turbulent flow around a wall mounted hemisphere. J. Appl. Math. Model. 2014, 55, 3596–3618. [Google Scholar] [CrossRef]
  14. Mokin, N.A.; Kustov, A.A.; Trushin, S.I. Numerical simulation of an air-supported structure in the air flow. In Proceedings of the Structural Membranes: VIII International Conference on Textile Composites and Inflatable Structures, Munich, Germany, 9–11 October 2017. [Google Scholar]
  15. Wood, J.N.; Breuer, M.; Nayer, G.D. Experimental studies on the transient fluid–structure interaction of an air-inflated flexible membrane in turbulent flow. J. Fluid Struct. 2018, 80, 405–440. [Google Scholar] [CrossRef]
  16. Nayer, G.D.; Apostolatos, A.; Wood, J.N.; Bletzinger, K.U.; Wüchner, R.; Breuer, M. Numerical studies on the transient fluid–structure interaction of an air-inflated flexible membrane in turbulent flow. J. Fluid Struct. 2018, 82, 577–609. [Google Scholar] [CrossRef]
  17. De Nayer, G.; Breuer, M.; Boulbrachene, K. FSI simulations of wind gusts impacting an air-inflated flexible membrane at Re = 100,000. J. Fluid Struct. 2022, 109, 103462. [Google Scholar] [CrossRef]
  18. Zhao, B.; Hu, J.; Chen, W.; Chen, J.; Jing, Z. Dynamic geometrical shape measurement and structural analysis of inflatable membrane structures using a low-cost three-camera system. J. Autom. Constr. 2018, 96, 442–456. [Google Scholar] [CrossRef]
  19. Zhao, B.; Hu, J.; Chen, W.; Chen, J.; Qiu, Z.; Jing, Z. Computational method for in-situ finite element modeling of inflatable membrane structures based on geometrical shape measurement using photogrammetry. J. Comput. Struct. 2019, 224, 106105. [Google Scholar] [CrossRef]
  20. Rizzo, F.; Kopp, G.A.; Giaccu, G.F. Investigation of wind-induced dynamics of a cable net roof with aeroelastic wind tunnel tests. J. Eng. Struct. 2021, 229, 111569. [Google Scholar] [CrossRef]
  21. Tryggvason, B.V. Aeroelastic modeling of pneumatic and tensioned fabric structures. In Proceedings of the 5th International Conference on Wind Engineering, Fort Collins, CO, USA, 8–14 July 1979. [Google Scholar]
  22. Matsumoto, T. Aeroelastic modelling of air-supported roofs. J. Wind Eng. Ind. Aerodyn. 1992, 41–44, 1497–1507. [Google Scholar] [CrossRef]
  23. Cheng, C.M.; Fu, C.L. Characteristic of wind loads on a hemispherical dome in smooth flow and turbulent boundary layer flow. J. Wind Eng. Ind. Aerodyn. 2010, 98, 328–344. [Google Scholar] [CrossRef]
  24. San, B.; Yang, Q.; Yin, L. Stochastic and sensitivity analysis of shape error of inflatable antenna reflectors. J. Acta Astronaut. 2016, 132, 170–176. [Google Scholar] [CrossRef]
  25. Li, D.; Lai, Z.-C.; Wang, Y.; Zheng, Z.-L. A non-contact method for estimating the pre-tension of a rectangular membrane structure. J. Insight Non-Destr. Test. Cond. Monit. 2020, 62, 464–470. [Google Scholar] [CrossRef]
  26. Zheng, Z.-L.; Tian, Y.; Li, D.; Liu, C.-J. Tearing behavior of membrane coated fabrics based on the DIC method under the effect of initial crack length. J. Mater. Test. 2019, 61, 41–48. [Google Scholar] [CrossRef]
  27. Sun, X.; Wu, H.; Shan, B. Application of stereovision on a saddle-shaped membrane structure in aero-elastic wind tunnel test. J. Rev. Sci. Instrum. 2020, 91, 035104. [Google Scholar] [CrossRef] [PubMed]
  28. Sun, X.; Wu, H.; Wu, Y. Vibration monitoring of an open-type one-way tensioned membrane structure based on stereovision. J. Rev. Sci. Instrum. 2019, 90, 075112. [Google Scholar] [CrossRef]
  29. Zhou, Y.; Li, Y.; Shen, Z.; Wang, L.; Tamura, Y. Numerical analysis of added mass for open flat membrane vibrating in still air using the boundary element method. J. Wind Eng. Ind. Aerodyn. 2014, 131, 100–111. [Google Scholar] [CrossRef]
  30. Hao, W.; Yang, Q. Applicability of random decrement technique in extracting aerodynamic damping of crosswind-excited tall buildings. J. Build. Eng. 2021, 38, 102248. [Google Scholar] [CrossRef]
  31. Derife, M.; Atmani, A.; Laasri, E.H.A.; Biallah, A.M.; Agliz, D. Identification of modal parameters by the random decrement method. J. Mater. Today Proc. 2022, 58, 1074–1080. [Google Scholar] [CrossRef]
  32. Derife, M.; Atmani, A.; Laasri, E.H.A.; Balil, J.; Agliz, D. Development of a low cost system for modal parameters identification under ambient vibration: A low rise building as a case study. J. Build. Eng. 2022, 54, 104626. [Google Scholar] [CrossRef]
Figure 1. Spherical inflatable membrane structures: (a) The building in Xinjiang, China, 2020 (Address Source: www.hbjxmo.com/2661.html, accessed on 20 July 2022), (b) The building in Hebei, China, 2021 (Address Source: http://sz.qu114.com/jianzhuweixiu-gongye/15381116.html, accessed on 20 July 2022).
Buildings 12 01336 g001
Figure 2. The diagram of model installation and measuring point.
Buildings 12 01336 g002
Figure 3. Experiment with key pictures: (a) internal pressure gauge, (b) stereo cameras, (c) aeroelastic model, (d) camera calibration, and (e) terrain B wind field simulation in the wind tunnel.
Buildings 12 01336 g003
Figure 4. Characteristics of oncoming flow: (a) mean speed and turbulence intensity profiles, and (b) power spectra of speed fluctuation at H = 0.4 m.
Buildings 12 01336 g004
Figure 5. Diagram of characteristic measurement points for the stereo cameras.
Buildings 12 01336 g005
Figure 6. Transient distribution contours of displacements and maximum principal strain: (a) displacement of U direction at u = 4 m/s, (b) displacement of V direction at u = 4 m/s, (c) displacement of W direction at u = 4 m/s, and (d) maximum principal strain at u = 11 m/s.
Buildings 12 01336 g006
Figure 7. Contour of maximum principal strain: (a) top view and (b) side view.
Buildings 12 01336 g007
Figure 8. Contour of total displacement for the model: (a) top view and (b) side view.
Buildings 12 01336 g008
Figure 9. Time–history curve of displacement of the top region (d1) at each wind speed: (a) u = 7.5 m/s, (b) u = 9 m/s, and (c) u = 11 m/s.
Buildings 12 01336 g009
Figure 10. Time average deformation and standard deviation of displacement at different wind speeds: (a) time-averaged deformation, (b) overall standard deviation of displacement, (c) standard deviation of displacement of d1, and (d) standard deviation of displacement of d2.
Buildings 12 01336 g010
Figure 11. The curve of maximum principal strain with wind speed: (a) mean of maximum principal strain and (b) standard deviation of maximum principal strain.
Buildings 12 01336 g011
Figure 12. Average deformation profile of the model: (a) average deformation profile in xy plane and (b) average deformation profile in yz plane.
Buildings 12 01336 g012
Figure 13. Test photos of transient deformation under different wind speeds: (a) u = 4 m/s and (b) u = 11 m/s.
Buildings 12 01336 g013
Figure 14. Transient deformation profile of the model: (a) in along-wind direction at u = 4 m/s, (b) in cross-wind direction at u = 4 m/s, (c) in along-wind direction at u = 11 m/s, and (d) in cross-wind direction at u = 11 m/s. The black line indicates the initial shape of the model, the green line indicates the minimum transient deformation position, and the red line indicates the maximum transient deformation position in the figure.
Buildings 12 01336 g014
Figure 15. First 5 mode shapes of the model: (a) 1st and 2nd mode (f1 = f2 = 2.4 Hz), (b) 3rd mode (f3 = 9.1 Hz), and (c) 4th and 5th mode (f4 = f5 = 15.5 Hz).
Buildings 12 01336 g015
Figure 16. PSD of displacement at different wind speeds.
Buildings 12 01336 g016
Figure 17. Variation of modal damping ratios with wind speeds: (a) the first 3 modal damping ratio of d1 and (b) the first third modal damping ratio of d2.
Buildings 12 01336 g017
Table 1. Scale ratios of aeroelastic models.
Scale RatioSymbolTheoretical Scale RatioActual Scale Ratio
Length ratio λ L = L m / L p 1:1001:100
Wind speed ratio λ u = u m / u p 1:11:1
Mass ratio of membrane λ m = λ L 1:1001:10.6
Elastic stiffness ratio λ E t = λ u 2 · λ L 1:1001:3.5
Internal pressure ratio λ P = λ u 2 1:11:2
Frequency ratio λ f = λ u / λ L 100:110:1
Displacement ratio λ d = λ L 1:1001:100
Enclosed volume ratio λ Ω = λ L 3 / λ u 2 1 : 10 6 1 : 10 6
Froude number λ F r = λ u 2 / λ L 1 10 2 : 1
Reynolds number λ R e = λ u · λ L 1 1 : 10 2
Table 2. Laser displacement and stereo cameras measurement cases.
MeasurementMeasurement PositionEquipmentFrequency
(Hz)
Wind Speed
(m/s)
Laser displacement meter
vibration measurement
Top and middle of leeward side displacement (denoted as d1 and d2 in Figure 1)Panasonic
HL-C2
1024U = 4, 6,
7.5, 9, 11
Full-field dynamic displacement and strain measurementFull membrane surface strainMatchid
system
30
Publisher’s Note: MDPI stays neutral with regard to jurisdictional claims in published maps and institutional affiliations.

