Article

Study on Stability of Transmission Tower-Line System under a Downburst

1
School of Civil Engineering and Architecture, Chongqing University of Science and Technology, Chongqing 401331, China
2
Chongqing Key Laboratory of Energy Engineering Mechanics & Disaster Prevention and Mitigation, Chongqing University of Science and Technology, Chongqing 401331, China
*
Authors to whom correspondence should be addressed.
Buildings 2022, 12(9), 1338; https://doi.org/10.3390/buildings12091338
Submission received: 11 July 2022 / Revised: 11 August 2022 / Accepted: 29 August 2022 / Published: 31 August 2022

Abstract

:
A downburst is one of the high-intensity winds that cause transmission tower failures. In recent years, downbursts have brought great disasters to the economies and lives of people all around the world. In this paper, the dynamic stability of the transmission tower-line system under a downburst is analyzed. The deterministic-random mixed model is used to generate the downburst wind field and ANSYS software is employed to establish the finite element model of the transmission tower-line system. The response characteristics of the transmission tower-line system in the downburst and the atmospheric boundary layer (ABL) wind fields are compared through time history analysis. The displacement response of the transmission tower is analyzed with different Zmax values and attack angles. Based on the Budiansky–Roth criterion and dynamic incremental method, the dynamic stability of the transmission tower system under the action of the downburst wind field is studied, and the corresponding wind speed conditions when the transmission tower-line system is unstable are obtained. The results show that the top displacement of the tower-line system under the action of a downburst is 1.83 times that under the ABL wind. The tower top acceleration under the downburst is 1.57 times that under ABL wind. The most unfavorable wind attack angle for a transmission tower-line system is 90°. When Zmax is within the height range of the transmission tower, the influence on the displacement of the transmission tower increases with the increase in Zmax. When Zmax exceeds the height range of the transmission tower, the influence on the displacement of the transmission tower decreases. Under the most unfavorable wind attack angle, the influence of the conductor on the stability of the transmission tower is obvious.

1. Introduction

The transmission tower-line system plays a vital role in the transmission of electricity, and the destruction of transmission lines has great economic and social impacts [1]. With the development of the economy, the power supply-demand continues to grow, and the increase in the height of transmission towers and the length of transmission lines makes these structures more sensitive to wind loads [2]. In extreme weather and terrain conditions, the transmission tower-line structure damage probability becomes higher [3]. However, the design of transmission towers in many regions of the world does not consider the impact of high-intensity wind loading such as downbursts [4], which poses a significant potential threat to the transmission tower-line system. Fujita [5] defined the downburst as a strong destructive wind. According to the investigation of transmission tower collapses in the United States, Australia, South Africa, and other countries, more than 80% of weather-related transmission tower collapses are caused by strong winds such as downbursts or tornados formed in thunderstorm weather. Surveys of 94 transmission tower damage accidents in Australia show that more than 90 percent of transmission tower structural damage is caused by downbursts caused by thunderstorms [6]. Downbursts are different from atmospheric boundary layer winds in mean speed profiles. The downburst wind field is a non-stationary process, which includes the rapid change in velocity in the time domain and the strong correlation in space [7,8].
In recent years, scholars have investigated the response of transmission towers under downbursts. Savory et al. [9] conducted an elastic static analysis of transmission tower structures under typhoons and downbursts without considering the influence of the transmission line. Shehata et al. [10] investigated the impact of transmission lines and insulators on the transmission tower, established the nonlinear geometric model of transmission lines and insulators, and calculated the force of transmission lines on the transmission tower under a downburst. Then, the elastic static calculation of the transmission tower was carried out, and the variation law of the internal force of the structural members of the transmission tower was obtained when the downburst wind load took different parameters. Wang et al. [11] studied the action characteristics of the downburst on the transmission tower and obtained the internal force of transmission tower components and its variation with time. Niu et al. [12] studied the response characteristics of the cable-stayed portal tower under the action of a downburst and an ABL by comparing the time-history response analysis. The results showed that the peak value of the column and the ultimate tensile stress of the cable-stayed portal tower under the action of a downburst were much larger than those under the ABL wind.
On the other hand, more and more scholars study the stability of transmission towers. Kitipomchai et al. [13] used the theory of concentrated plasticity and yield surface to analyze the nonlinearity of materials. They analyzed and compared the nonlinear deformation of the transmission tower under static excitation. The relationship between the displacement of the top node of the tower and the load is given. Damatty et al. [14] studied the influence of different downburst parameters such as relative position, attack angle, and size on the internal force of the transmission tower. Zhang and UdoPeil [15] proposed a stability analysis method of the elastic structure under arbitrary excitation. The finite element method was used to track the time-history response process of the structure and the corresponding energy change. According to the change of energy, the stability of the structure in the dynamic response process was judged. It was verified that the method could share and judge all kinds of instability and failure of the elastic structure under arbitrary dynamics. However, this method is not suitable for the study of the dynamic stability of the plastic structure. Deng [16] established the model of the “one tower with two lines” transmission tower-line system, realized the practical application of the dynamic stability discrimination method based on characteristic energy in ABAQUS, and determined the failure time of the transmission tower under the action of a downburst by using this characteristic energy dynamic stability discrimination method. Li et al. [17] studied the nonlinear dynamic analysis of transmission tower-line systems under different disconnection conditions and the influence of different disconnection positions and different disconnection numbers on the dynamic stability of transmission towers. Li [18] used the stability properties of the structure obtained by the artificial intelligence ‘black box’ under a known continuous dynamic action to infer the system’s stability under similar load excitation.
Previous studies show that the destructive effect of the downburst on a transmission tower is much more significant than that of the ABL wind field, and the influence of the transmission line on the transmission tower cannot be ignored. Although researchers have made efforts to study the effects of transmission towers subjected to downburst, there are few studies on the dynamic stability of transmission towers and transmission tower-line systems under downburst. To study the influence of downburst on the dynamic stability of transmission tower-line systems, based on the existing research, the nonlinear buckling analysis and time history analysis of transmission tower and transmission tower-line systems under different intensity horizontal fluctuating wind excitation is carried out with ANSYS, and the nonlinear stability of the transmission tower-line system is studied. Section 2 and Section 3 introduce the finite element model of a transmission tower and downburst wind field model; Section 4 describes the stability criterion; Section 5.1 compares the displacement response and acceleration response of a transmission tower under a downburst and ABL wind field. Section 5.2 compares the response of the transmission tower-line system under a downburst at different wind attack angles. Section 5.3 gives the displacement responses of transmission towers with different heights of downburst wind speed; finally, Section 5.4 compares the stability of the transmission tower and transmission tower-line system under a downburst.

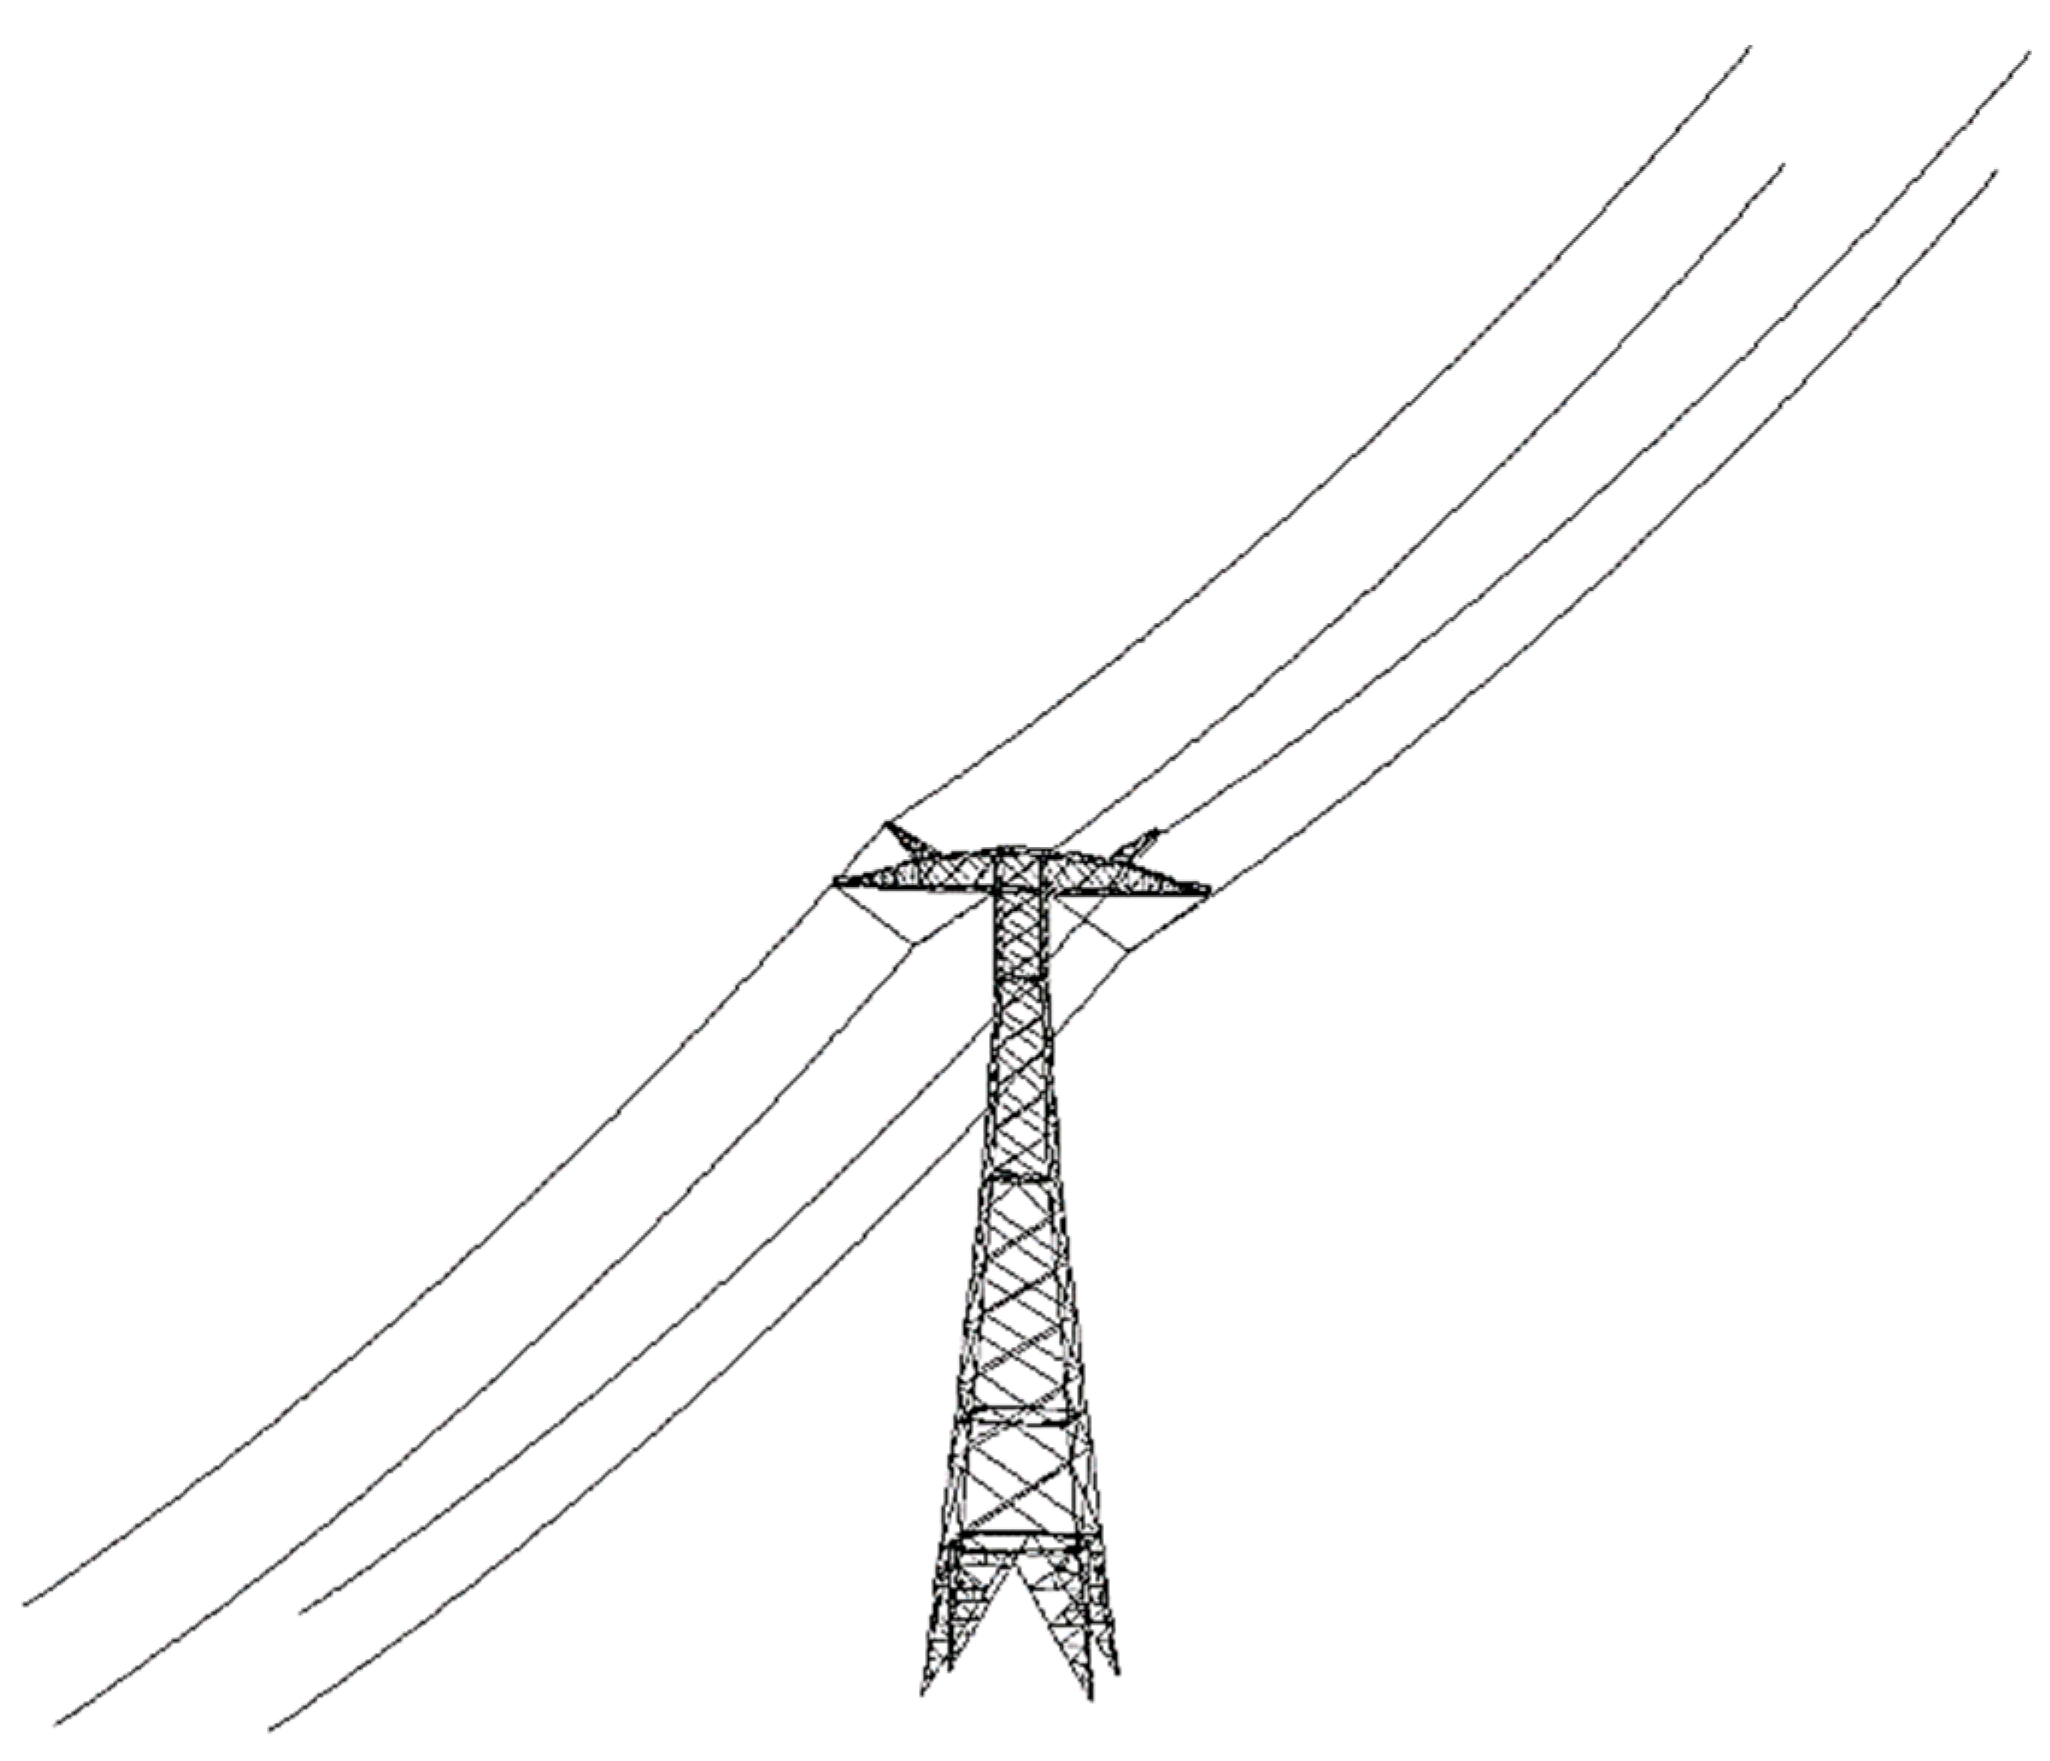
2. Finite Element Model of Transmission Tower

This paper uses ANSYS software for finite element modeling and details of transmission, as shown in Figure 1, and details of the transmission tower-line system, as shown in Figure 2. The transmission tower has strong geometric nonlinearity, so the members of the transmission tower are simulated by the BEAM188 element. BEAM188 supports warpage of thin-walled L-shaped openings. The transmission tower mainly bears the vertical load from the conductor, and the insulator string is hinged with the transmission tower.When the transmission line oscillates, there is a specific hanging effect. In modeling, the insulator string is simplified as a flexible cable, which is stimulated by the LINK10 element. In the current study, the damage to insulators is not considered, so the ideal elastic model is selected for the constitutive model of insulator materials. When using ANSYS for numerical simulation, the wire model is simplified according to the equivalent tensile stiffness to reduce the amount of computation. Since the distance between the two adjacent suspension points of the conductor is considerable and the lateral stiffness is minimal, the lateral stiffness is ignored. In the process of modeling, the conductor is simplified as a flexible cable that only bears axial tension, and the LINK 10 element is selected for simulation. The main material of the tower body and the primary material of the cross arm is Q345 steel, and the inclined material of the tower body and other auxiliary materials is Q235 steel. The transmission tower-line system is divided into 1332 elements, producing 1664 nodes. All degrees of freedom of the four nodes at the bottom of the transmission tower and at both ends of the transmission line are constrained. In this study, the interaction between the foundation and the transmission tower-line structure was not considered.

3. Downburst Wind Load

Wind load is the control load in the design of the transmission tower. To analyze the wind-induced vibration of the structure in the time domain, it is necessary to have wind speed time history records. Due to the lack of measured wind speed time history, the wind field data obtained by the measurement method are limited for structural analysis. In the structural analysis considering a downburst, researchers usually use the harmonic synthesis method to simulate the wind speed time history of a downburst. This paper uses the harmonic superposition method to simulate the fluctuating wind speed time history to study the dynamic stability of the transmission tower-line system under a downburst. most of the investigators use the fluctuating wind speed time history generated by comprehensively considering the structural geometric characteristics and field wind spectrum simulation. in combination with the structural geometric characteristics of the transmission tower in the wind field [19].

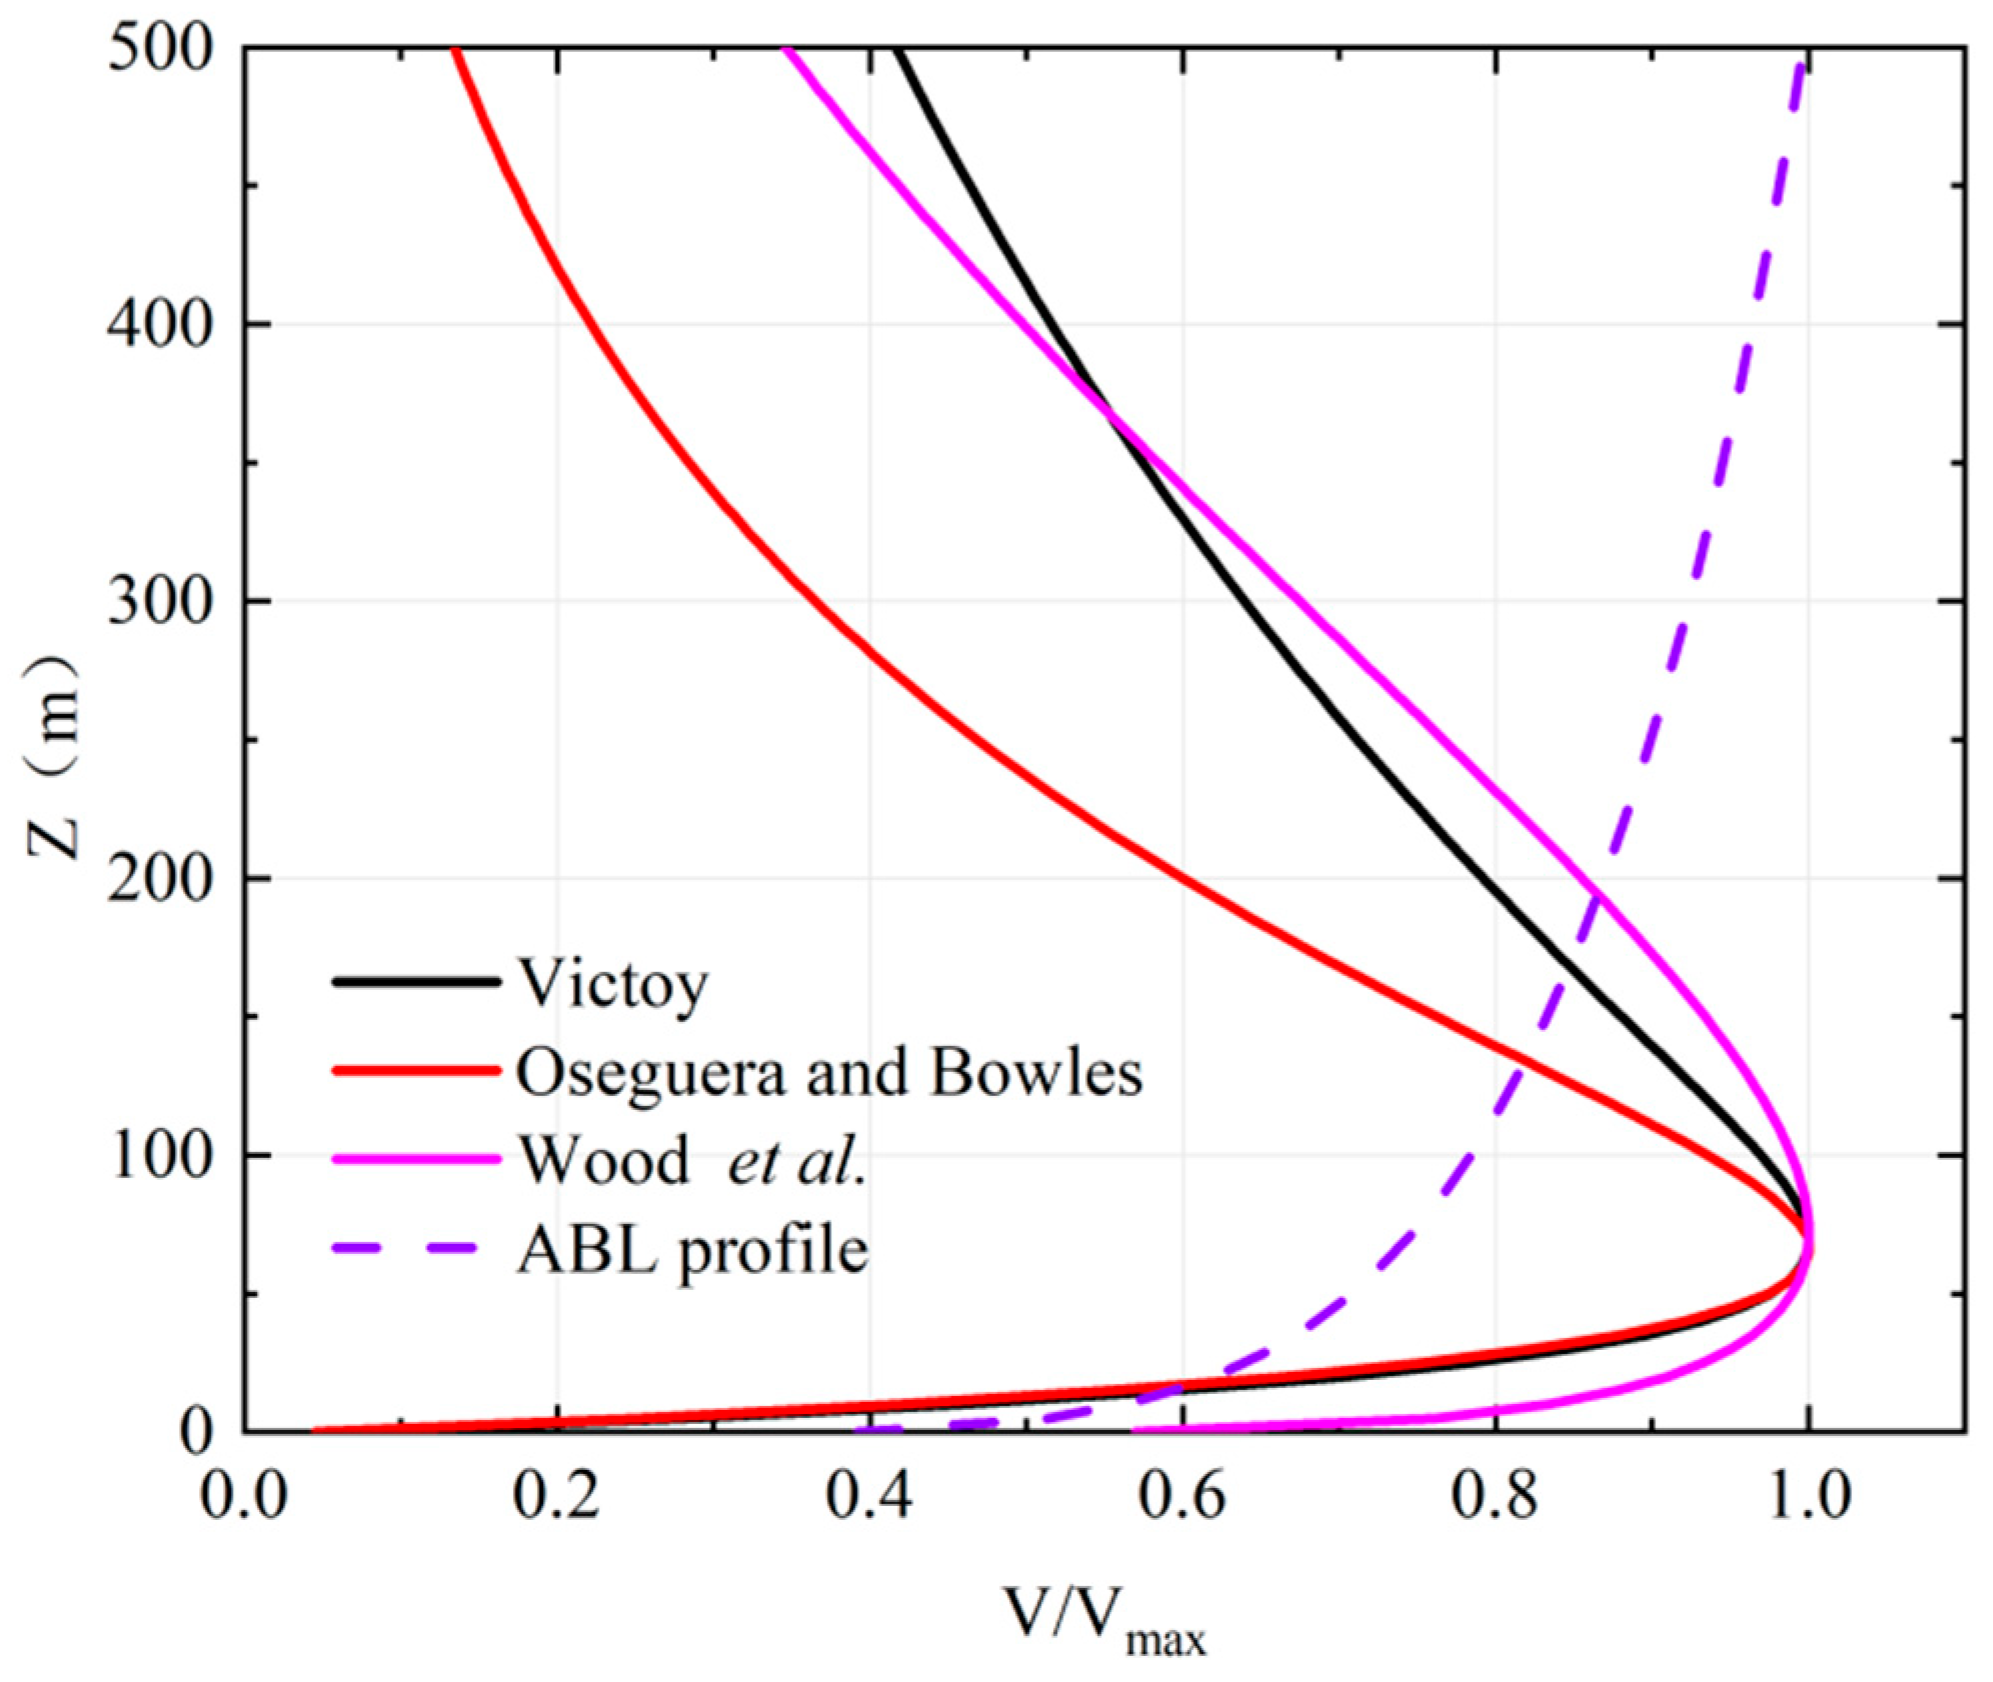
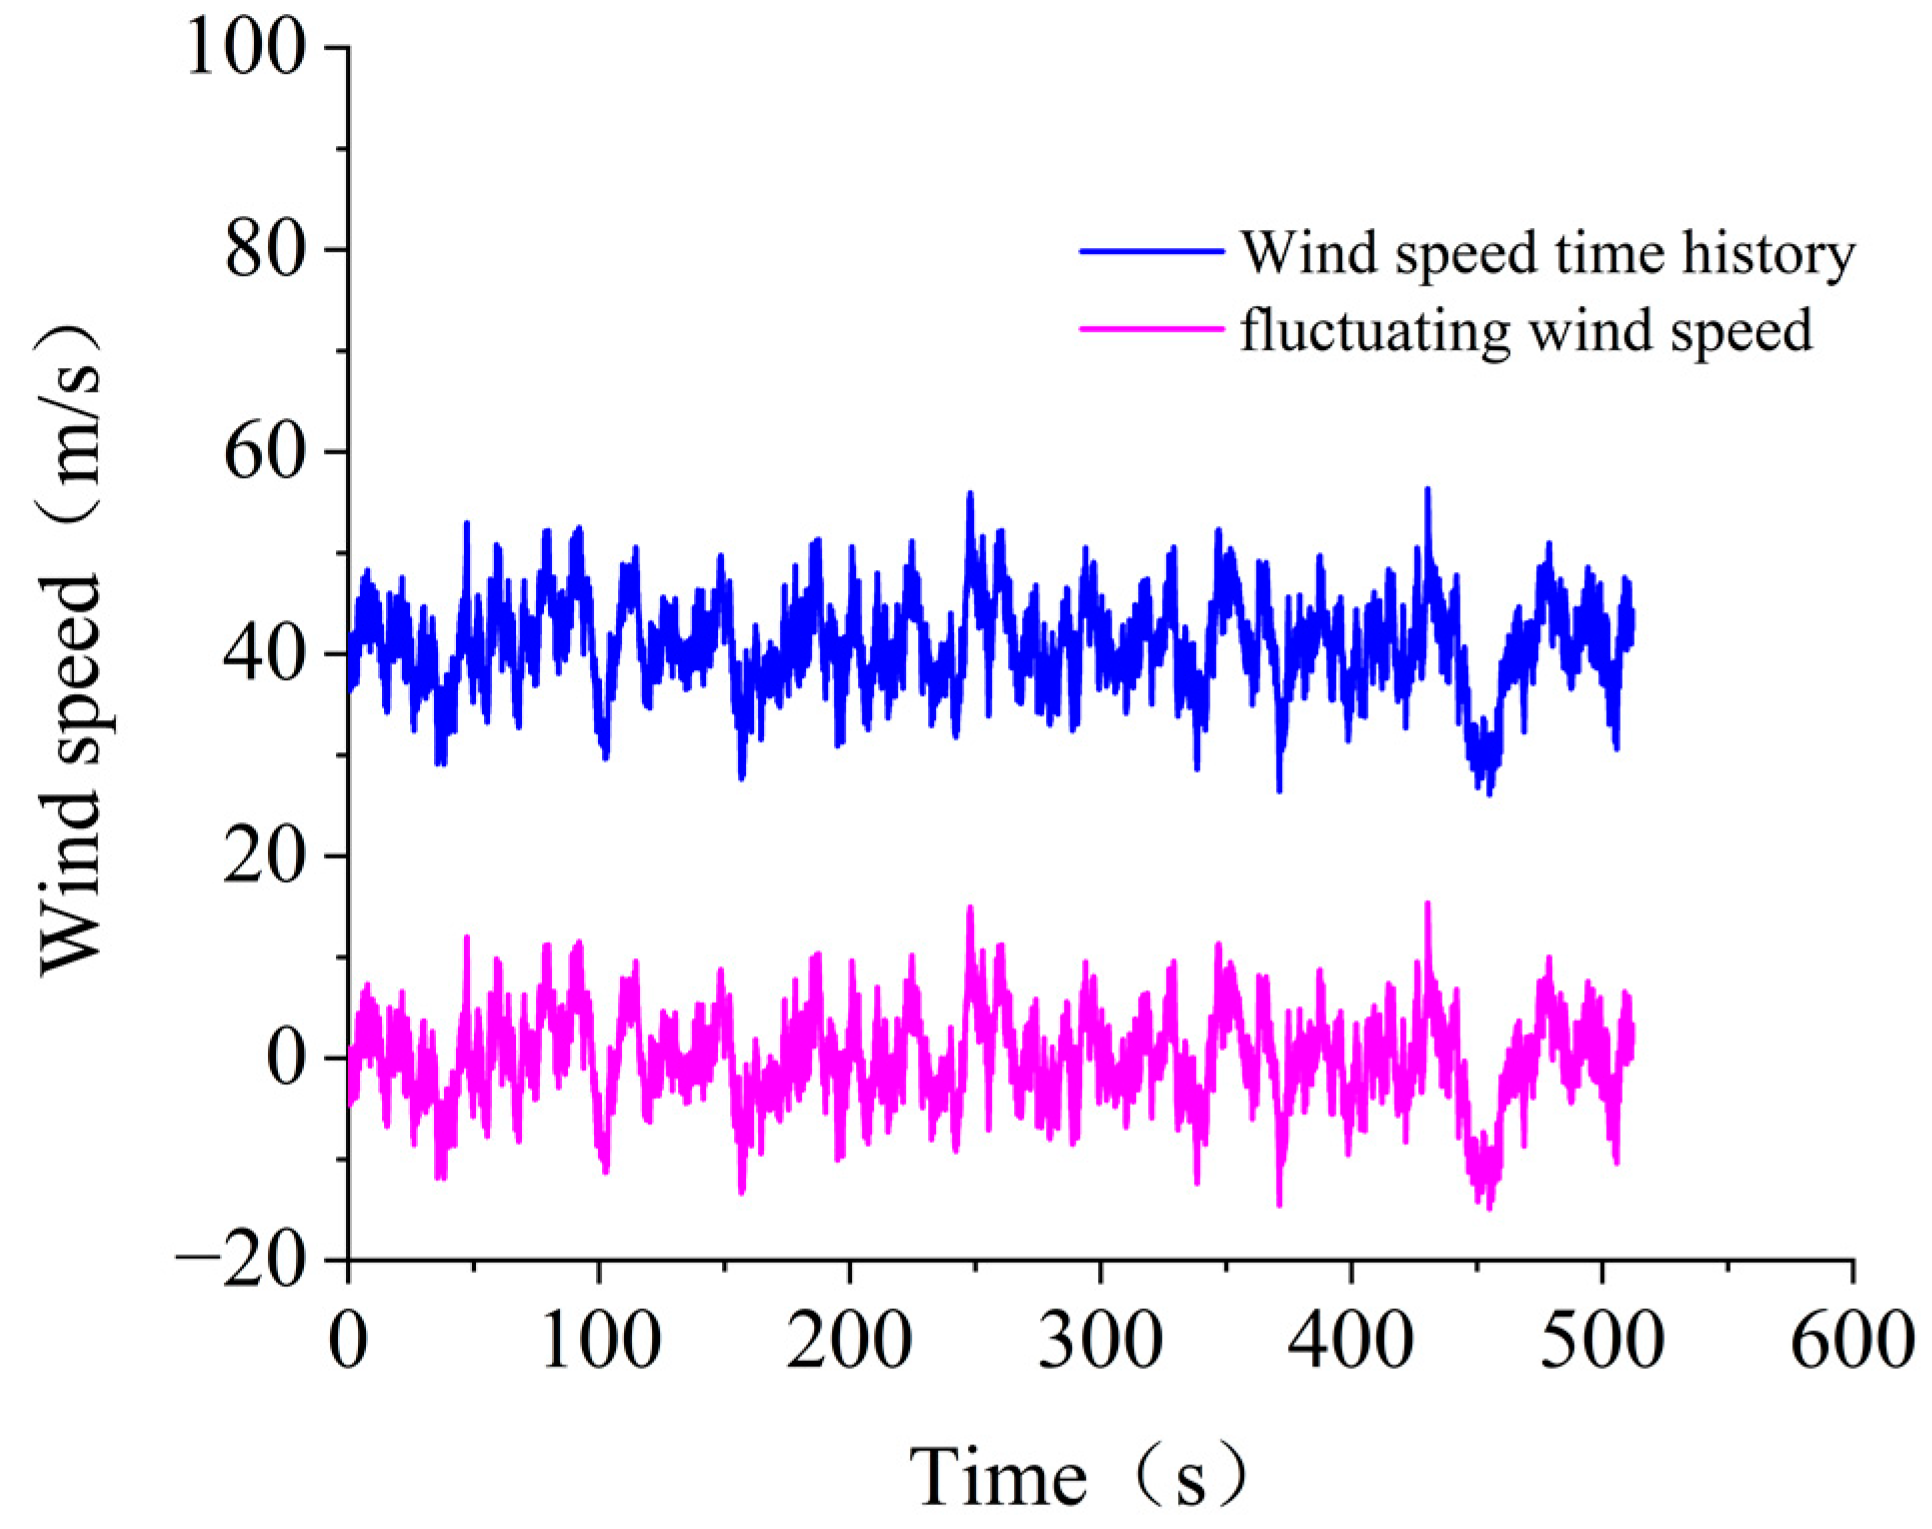
3.1. Mean Wind Simulation of Downburst

Generally, the wind speed of a downburst at any height can be decomposed into a deterministic time-varying mean component and fluctuating component as follows:
U ( z , t ) = U ¯ ( z , t ) + u ( z , t )  
where U ( z , t ) is the wind speed at time t and height z, U ¯ ( z , t ) is a deterministic time-varying mean component, and u ( z , t ) is a stochastic fluctuating component. Different from the ordinary near-earth wind, the downburst load time history is a non-stationary random process. The average wind speed U ¯ ( z , t ) of the downburst is obtained by averaging wind speed data in a certain time step, so it is an instantaneous average time-varying process. Assuming that the maximum time-varying mean wind speed at different heights is reached at the same time, the time-varying mean wind speed can be expressed as the product of a vertical mean wind profile and the time function is as follows:
U ¯ ( z , t ) = V ( z ) × f ( t )
where V ( z ) is the vertical profile of the maximum mean wind speed and f ( t ) is a time function with a maximum value of 1. Vicroy [20], Oseguera and Bowles [21], and Wood et al. [22] proposed three empirical models of horizontal wind speed and vertical wind profile of downburst, respectively. In order to better understand the influence of downburst with different intensities on the stability of transmission towers, the intensity of downburst can be changed by changing the value of Vmax. Therefore, the Vicory model is used for analysis and calculation in this paper. The expression is as follows:
V ( z ) = 1.22 × e 0.15 z z max e 3.2175 z max × V max
where V(z) is the maximum average wind speed of the downburst at height z, Vmax is the maximum horizontal wind speed of the downburst, and Zmax is the height corresponding to the maximum horizontal wind speed. The values of three empirical wind profile parameters are summarized in Table 1.
Figure 3 shows three kinds of downburst wind profiles and atmospheric boundary layer wind profiles. It can be seen from Figure 3 that the horizontal wind speed of the downburst first increases with the increase in height, reaches 30~100 m [24], and then gradually decreases with the increase in height. The maximum wind speed is about 80 m/s, while the atmospheric boundary layer wind speed increases with the increase in height, but the maximum wind speed is far lower than that of a downburst.

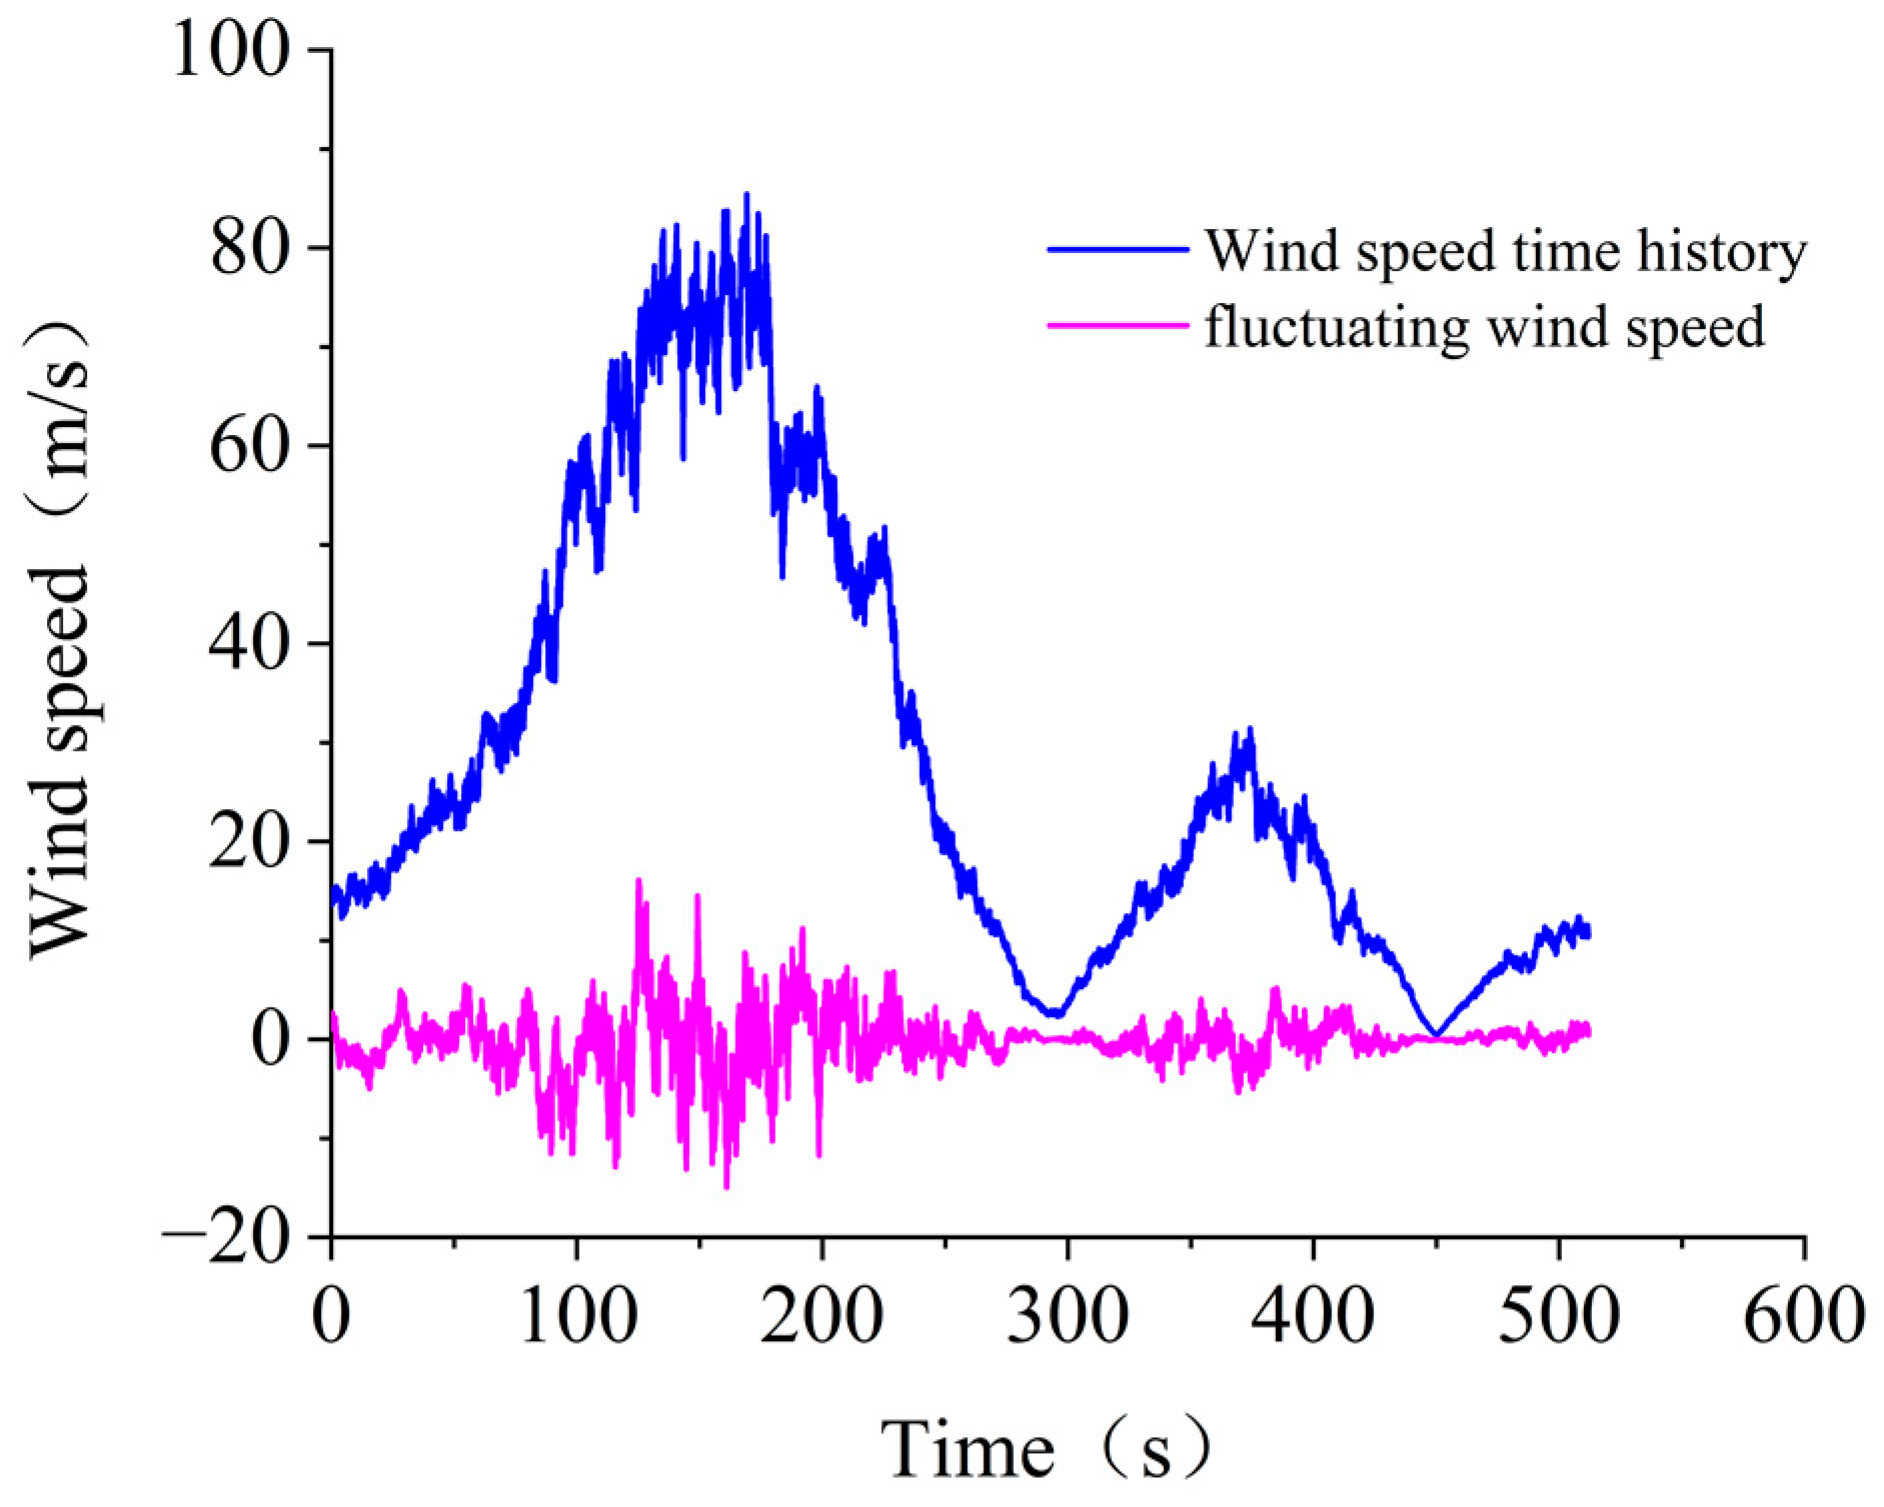
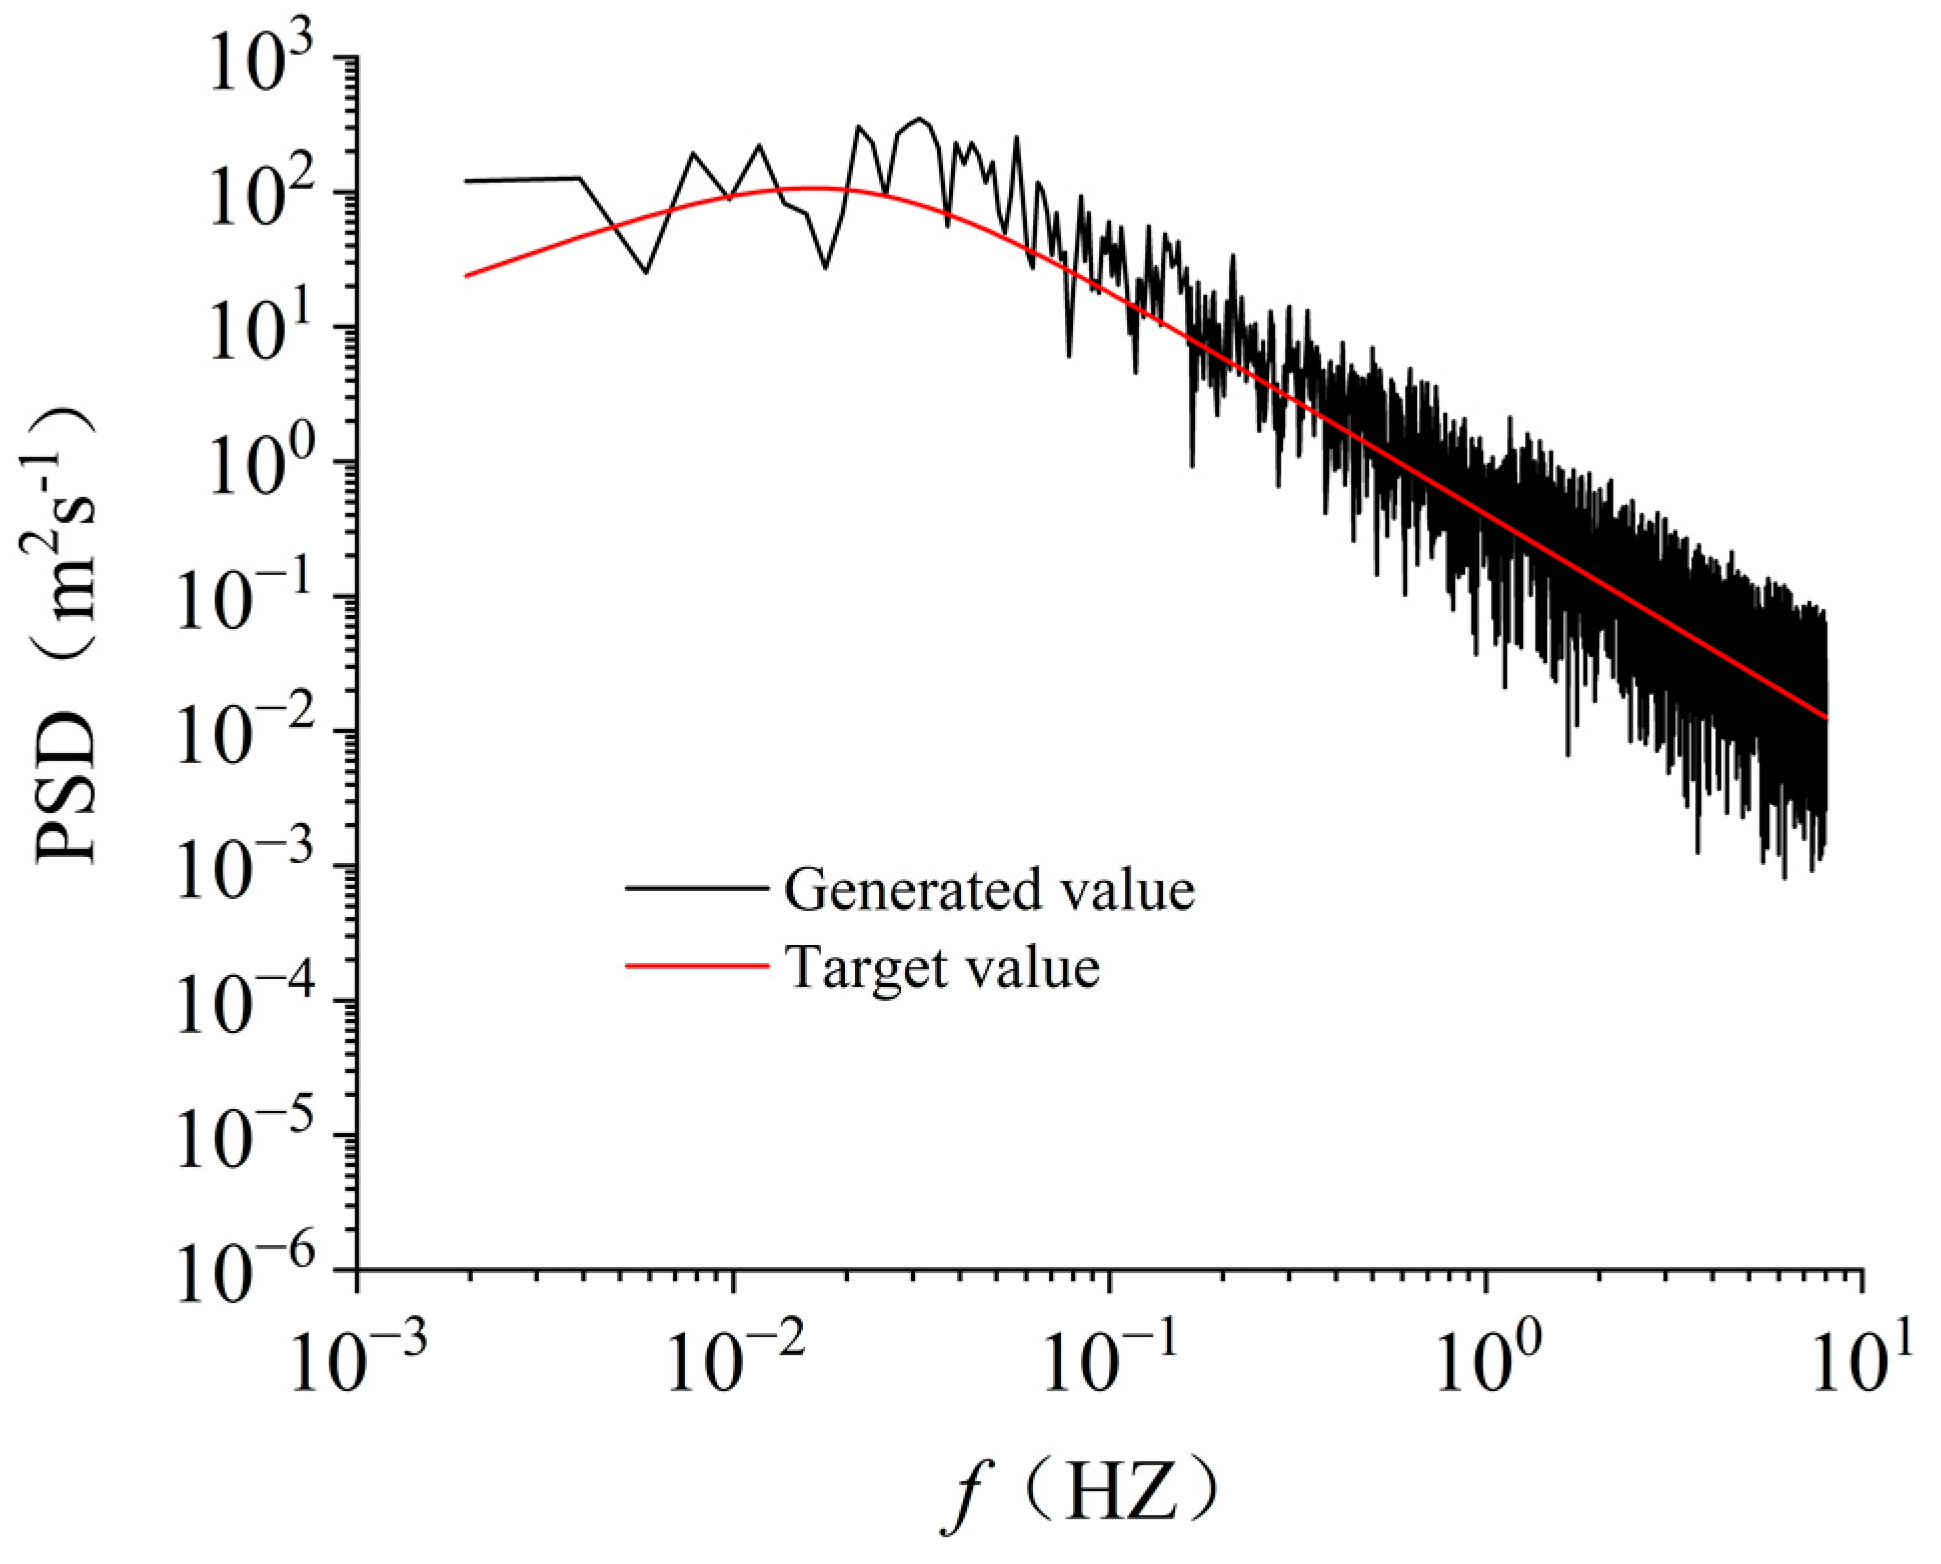
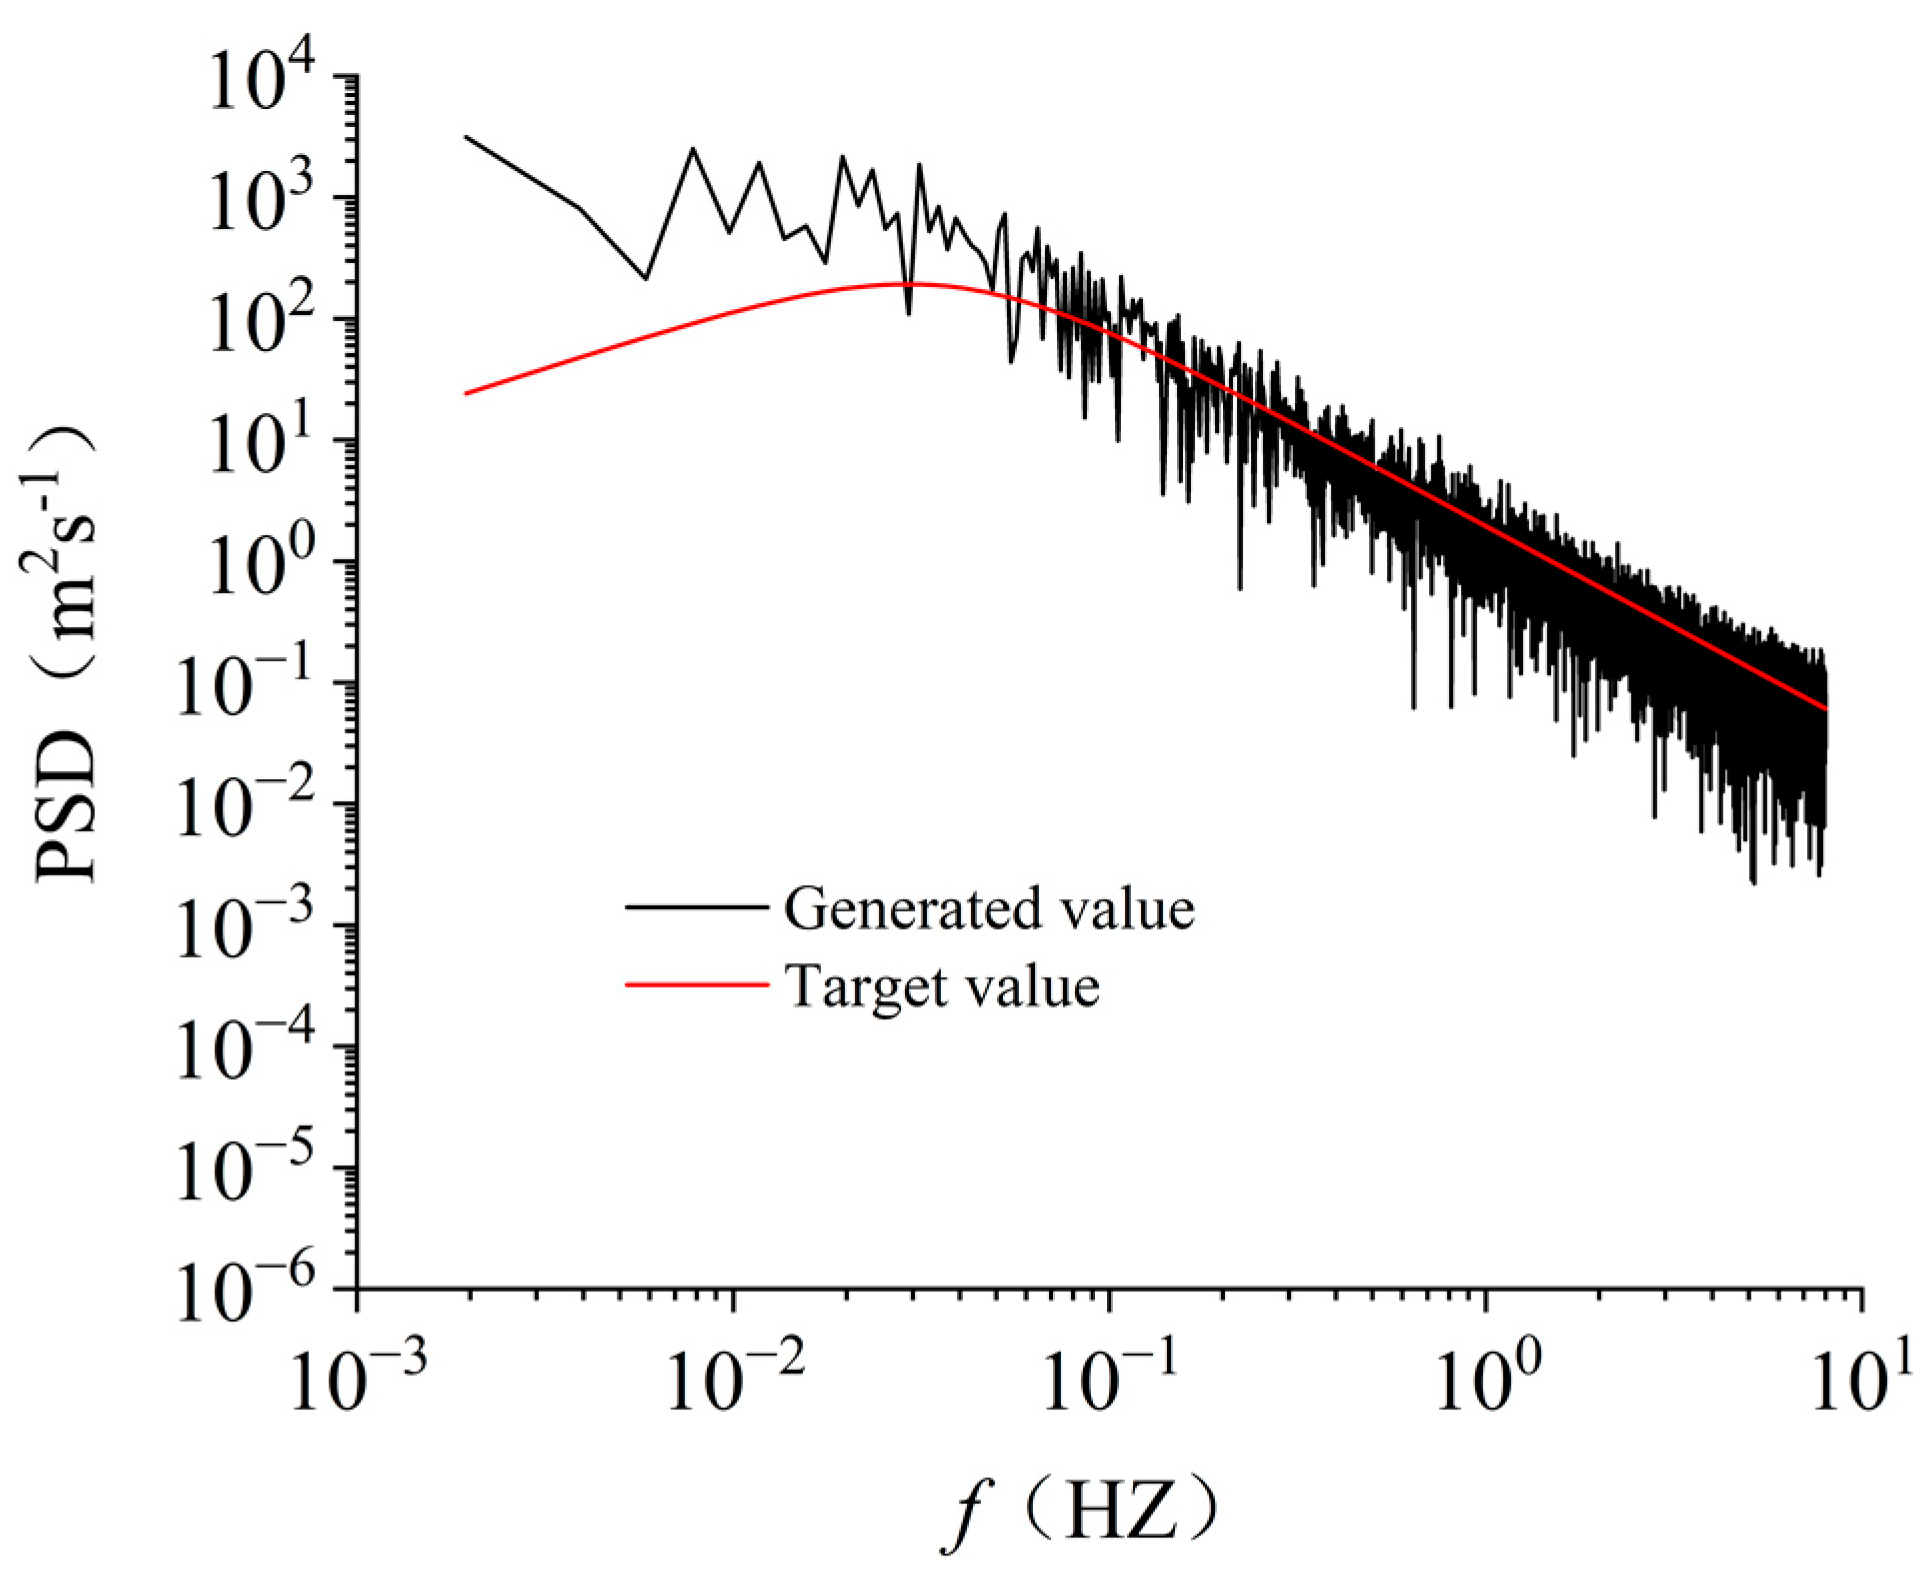
3.2. Fluctuating Wind of Downburst

Because of the non-stationary characteristics of downbursts, Chen [25] suggested that the maximum amplitude of fluctuating wind speed was about 0.25 times the mean wind speed at that time, and Chay [26] suggested that it was 0.08–0.11 times the average wind speed at that time. Therefore, it can be assumed that the frequency domain characteristics of fluctuating wind speed do not change with time. The fluctuating wind speed time history is written as a time-varying amplitude modulation function and a Gaussian random process obeying the standard normal distribution. The expression of the fluctuating wind speed u ( z , t ) of a downburst is as follows:
u ( z , t ) = α ( z , t ) k ( z , t )
where α ( z , t ) is the modulation function, k ( z , t ) is Gaussian stationary random process subject to the standard normal distribution. The fluctuating wind speed of the downburst is transformed into a uniform non-stationary random process. The evolution spectrum spectral density can be written as follows:
S z z ( z , t , ω ) = | α ( z , t ) | 2 × ϕ ( z , ω )
where ϕ ( z , ω ) is the power spectral density function.
According to the above method, the time-history simulation of downburst wind speed is carried out, and the wind field simulation program is written by Matlab software. The main parameters of wind field simulation are as follows: simulation time is T = 512 s, N = 8192, and the time step is ∆t = 0.0625 s. Because the transmission tower-line system is a high-rise structure, the Kaimal spectrum is used as the target spectrum, reflecting height’s influence on the wind spectrum.
Figure 4 and Figure 5 are the time history of downburst wind speed and the comparison of power spectral density and target spectrum at 80 m height respectively. Figure 6 and Figure 7 are the time history of ABL wind speed and the comparison of power spectral density and target spectrum at 80 m height respectively. The power spectral density of the two kinds of wind fields is in good agreement with the target spectrum, which ensures the accuracy of the simulation. Yan et al. [27] proposed a new matrix factorization assisted interpolation method. The method can realize a significant reduction of the number of Cholesky decompositions and acceleration of the harmonic superposition using a small number of FFTs.

3.3. Downburst Wind Loads

Based on the quasi-steady hypothesis and according to ASCE Guidelines [28], the transverse and longitudinal wind loads of downburst wind acting on the transmission tower can be expressed as follows:
F x = 0.5 ρ V 2 cos 2 φ C f t A F y = 0.5 ρ V 2 sin 2 φ C f t A t
where ρ is the air density, V is the downburst wind speed, φ is the wind angle of attack. C f t is the wind force coefficient, A t is the windward area of the transmission tower. The wind load of the conductor can be expressed as follows:
F c = 0.5 ρ V 2 cos 2 φ C f A c
where C f is the wind force coefficient, ASCE Guidelines Recommendation 1.0 [28], A c is the windward area of the conductor.

4. Stability Criterion

The energy criterion is widely used to judge the stability of elastic structures [29]. This method is mainly realized by the total potential energy of the mechanical system; if the total potential energy reaches the minimum, the structure is in a stable state. The mathematical point of view is to determine the total potential energy second-order variation of positive and negative size. If δ 2 > 0, the structure is in a stable state; when δ 2 =0, the structure is in a critical state; when δ 2 < 0, the structure is unstable. Dispersing a continuous structural system into a collection of finite elements, the total potential energy of the system can be expressed as follows:
= i = 1 n 1 2 v ε T D ε d v u i F ¯ λ 0 i
where n is the total number of elements, u is displacement satisfying structural balance, F ¯ is load parameters. After finishing, the second-order variation of total potential energy can be expressed as follows:
δ 2 = 1 2 δ u T K T δ u
According to Equation (9), the structure’s positive and negative tangent stiffness matrix is equivalent to the positive and negative of the total potential energy , so the structure’s stability can be judged by the positive and negative tangent stiffness matrix. The energy criterion can obtain accurate stability boundary points in simple structures with fewer degrees of freedom under simple load excitation. However, obtaining the tangent stiffness matrix of each time history of a large spatial structure such as a transmission tower under a complex load is challenging. Therefore, this paper uses the Budiansky–Roth criterion and the dynamic increment method to analyze the dynamic stability of the transmission tower-line system. The Budiansky–Roth criterion was proposed by Budiansky and Roth [30] when studying the jump buckling of spherical shells. They believed that if a structure had a large deformation due to a small load increment, then the buckling of the structure could be judged. Dynamic incremental analysis was first applied to multi-story frame structures. The structural response under the corresponding load parameters is obtained by applying dynamic loads with different strengths to the structure. The structure’s dynamic stability was judged by studying the relationship between load parameters and structural response.

5. Analysis of Dynamic Stability of Transmission Tower-Line System

The downburst is different from the ABL wind field in the atmospheric boundary layer—the magnitude and direction of the downburst wind speed change with time. The downburst wind speed has two peaks in the process of storm movement, and the two peaks are much larger than the average wind speed ABL wind field. In this section, firstly, the displacement and acceleration response of the transmission tower under the downburst and ABL wind field are compared. Secondly, the response of the transmission tower-line system under the downburst under different wind attack angles is compared, and the most unfavorable wind attack angle is given. Thirdly, the displacement response of the transmission tower under the action of different downburst parameters is given. Finally, the stability of the transmission tower and the transmission tower-line system under the action of a downburst is discussed.

5.1. Response Analysis of Transmission Tower-Line System under Downburst and ABL Wind Loads

Figure 8 and Figure 9 show the displacement of the transmission tower and transmission line system under the action of two different basic wind speeds of ABL wind and downburst. In Figure 8, the basic wind speed V10 is 60 m/s so that the ABL wind can reach the same maximum wind speed as the downburst at the top of the tower. The maximum displacement of ‘ABL (V10 = 60 m/s) wind-tower line system’ is 1.53 m, which is 1.88 times that of ‘ABL (V10 = 60 m/s) wind-tower’ and 1.50 times that of ‘Downburst-Tower line system’. It can be seen that when the basic wind speed V10 is 60 m/s, the ABL wind is more destructive to the transmission tower. However, the basic wind speed V10 = 60 m/s in this case rarely occurs in engineering applications. In Figure 9, according to the ‘Code for design of 110 kV~750 kV overhead transmission line [31]’, transmission tower-line system design basic wind speed V10 takes 30 m/s. The maximum displacement of the ‘Downburst-tower’ is 0.44 m, which is 2.11 times that of the ‘ABL (V10 = 30 m/s) wind-tower’. The maximum displacement of the ‘Downburst-Tower line system’ is 1.03 m, which is 1.83 times that of ‘ABL (V10 = 30 m/s) wind-tower line system’. The maximum displacement in the ‘Downburst-Tower line system’ is 2.34 times that in the ‘Downburst-Tower’; the maximum displacement in the ‘ABL (V10 = 30 m/s) wind-tower line system’ is 0.56 m, which is 2.71 times larger than that in the ‘ABL (V10 = 30 m/s) wind-tower’. Through the above comparative analysis, it can be concluded that the influence of the conductor on the displacement response of the transmission tower cannot be ignored; when the basic wind speed (V10 = 30 m/s) in the design code of the transmission tower is used, the displacement response of the transmission tower under downburst is much larger than that under ABL wind load.
Figure 10 and Figure 11 show the acceleration response of the transmission tower top under the downburst and ABL wind loads. It can be seen that the time history of acceleration response at the top of the tower has the corresponding peak values to the displacement time history, and there are two relative peaks. The acceleration under the action of the downburst has a large fluctuation area from 100 s to 250 s. At about t = 150 s, the peak acceleration appears, which is about 5.03 m/s2, and the acceleration time-history shows the second peak, and the fluctuation amplitude is less than the first one. The peak acceleration under the action of the ABL wind is about 3.19 m/s2. Therefore, the short-term increase in the acceleration of the transmission tower caused by the downburst wind load may cause damage to the transmission tower-line system.

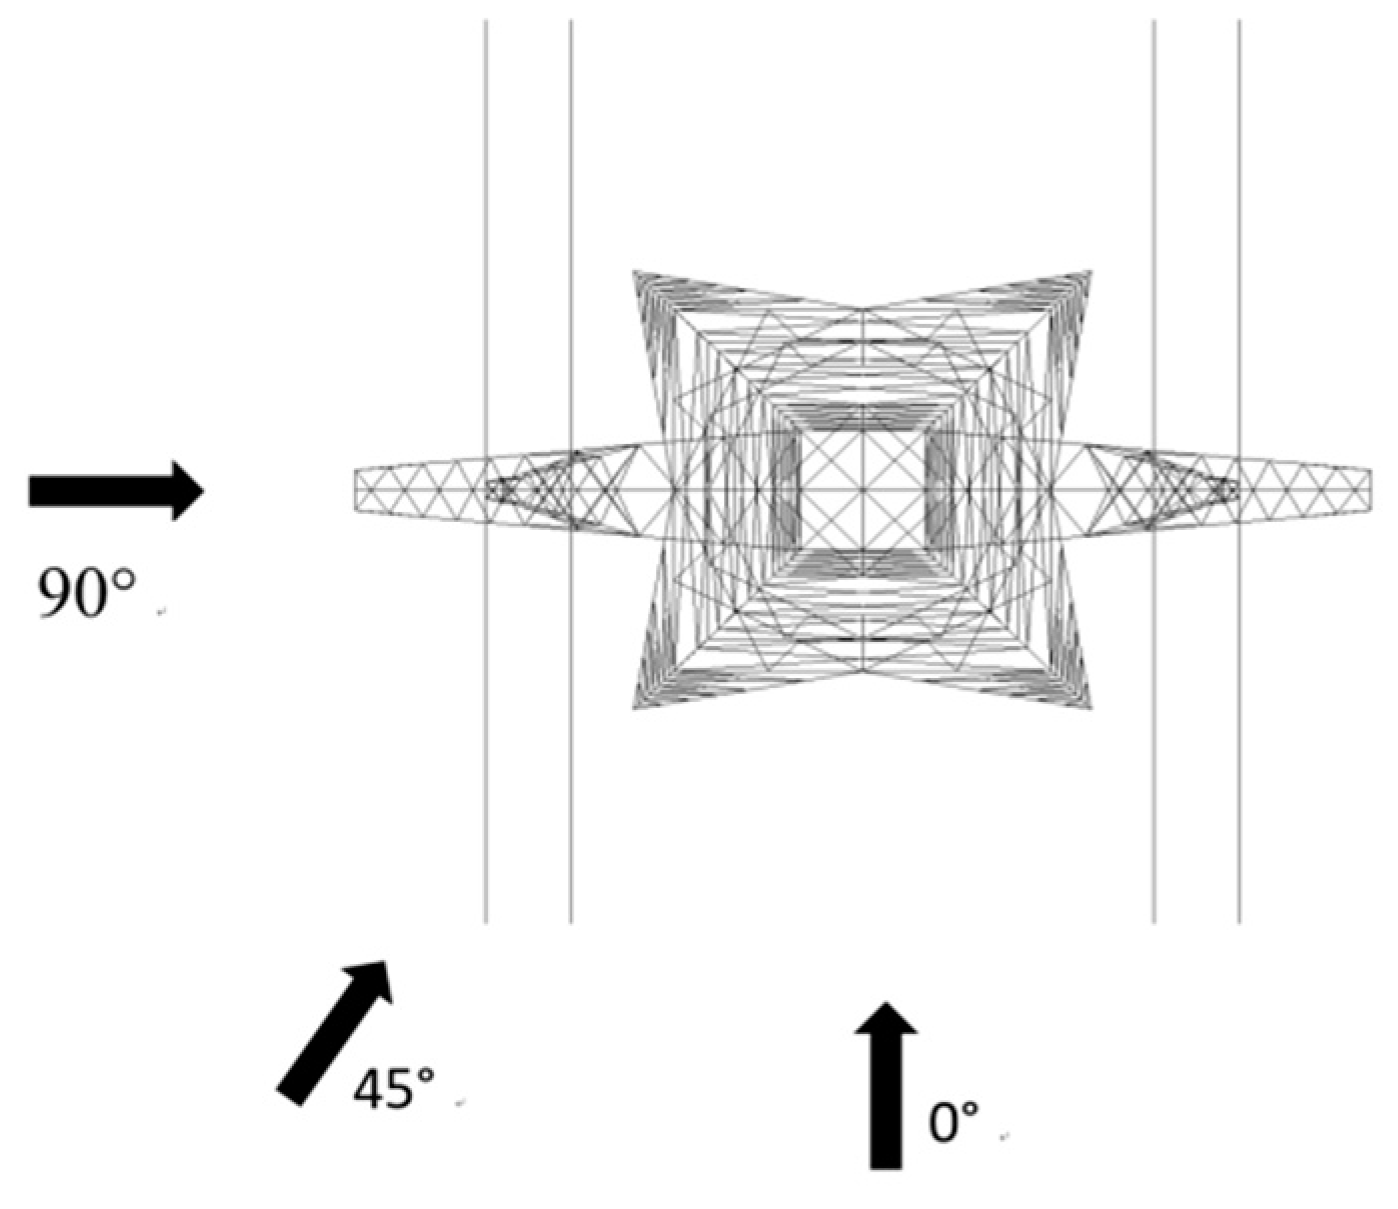
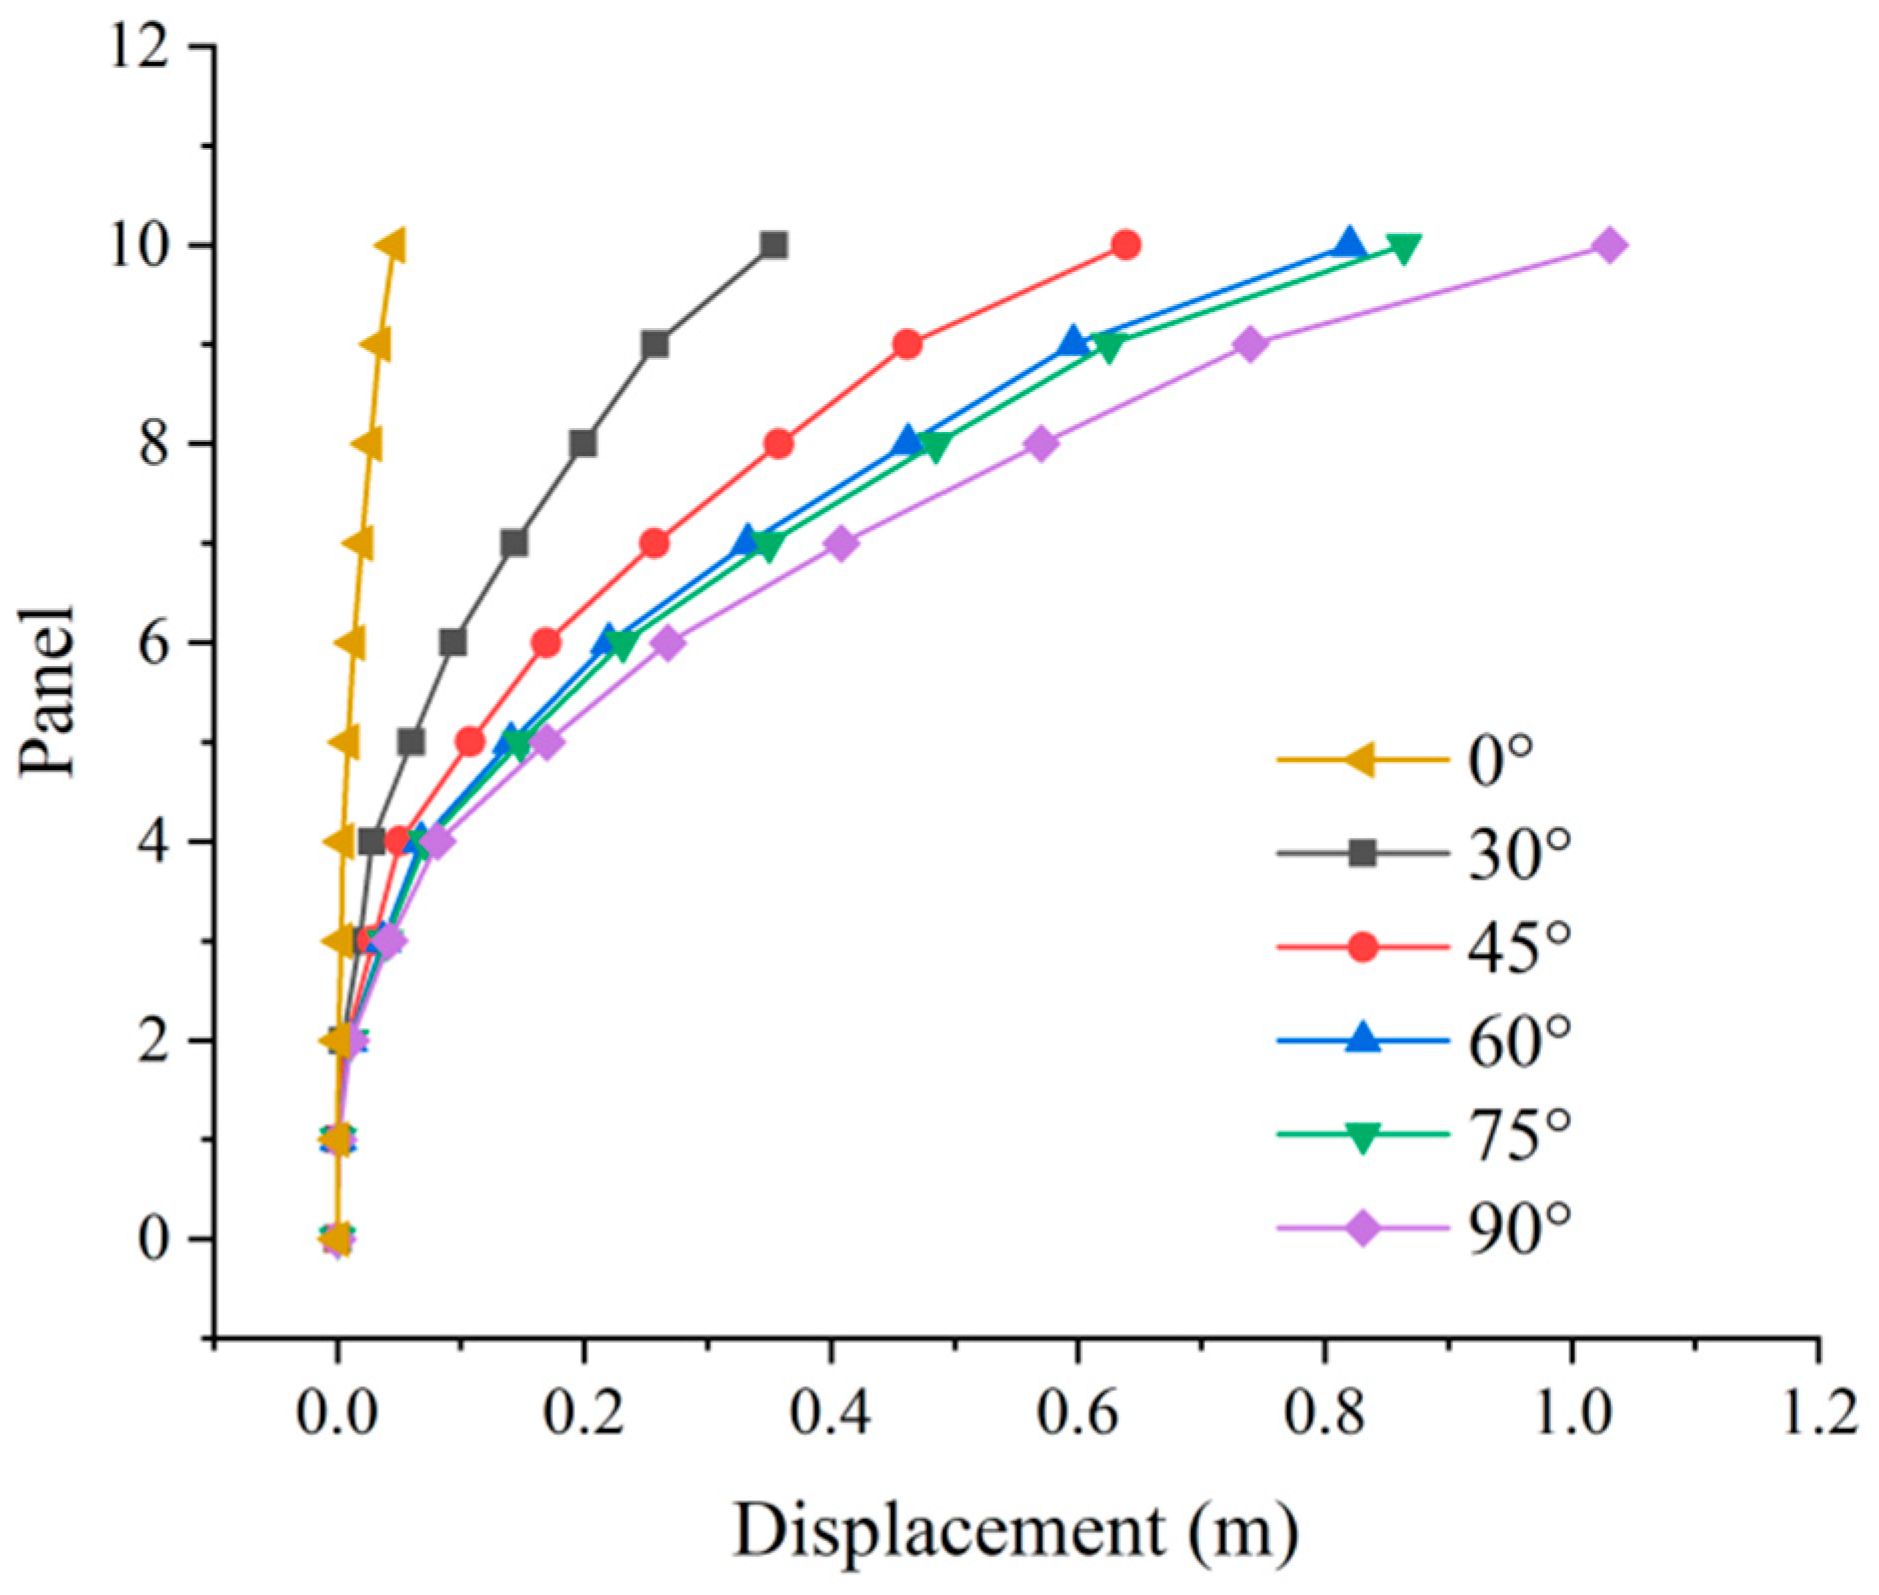
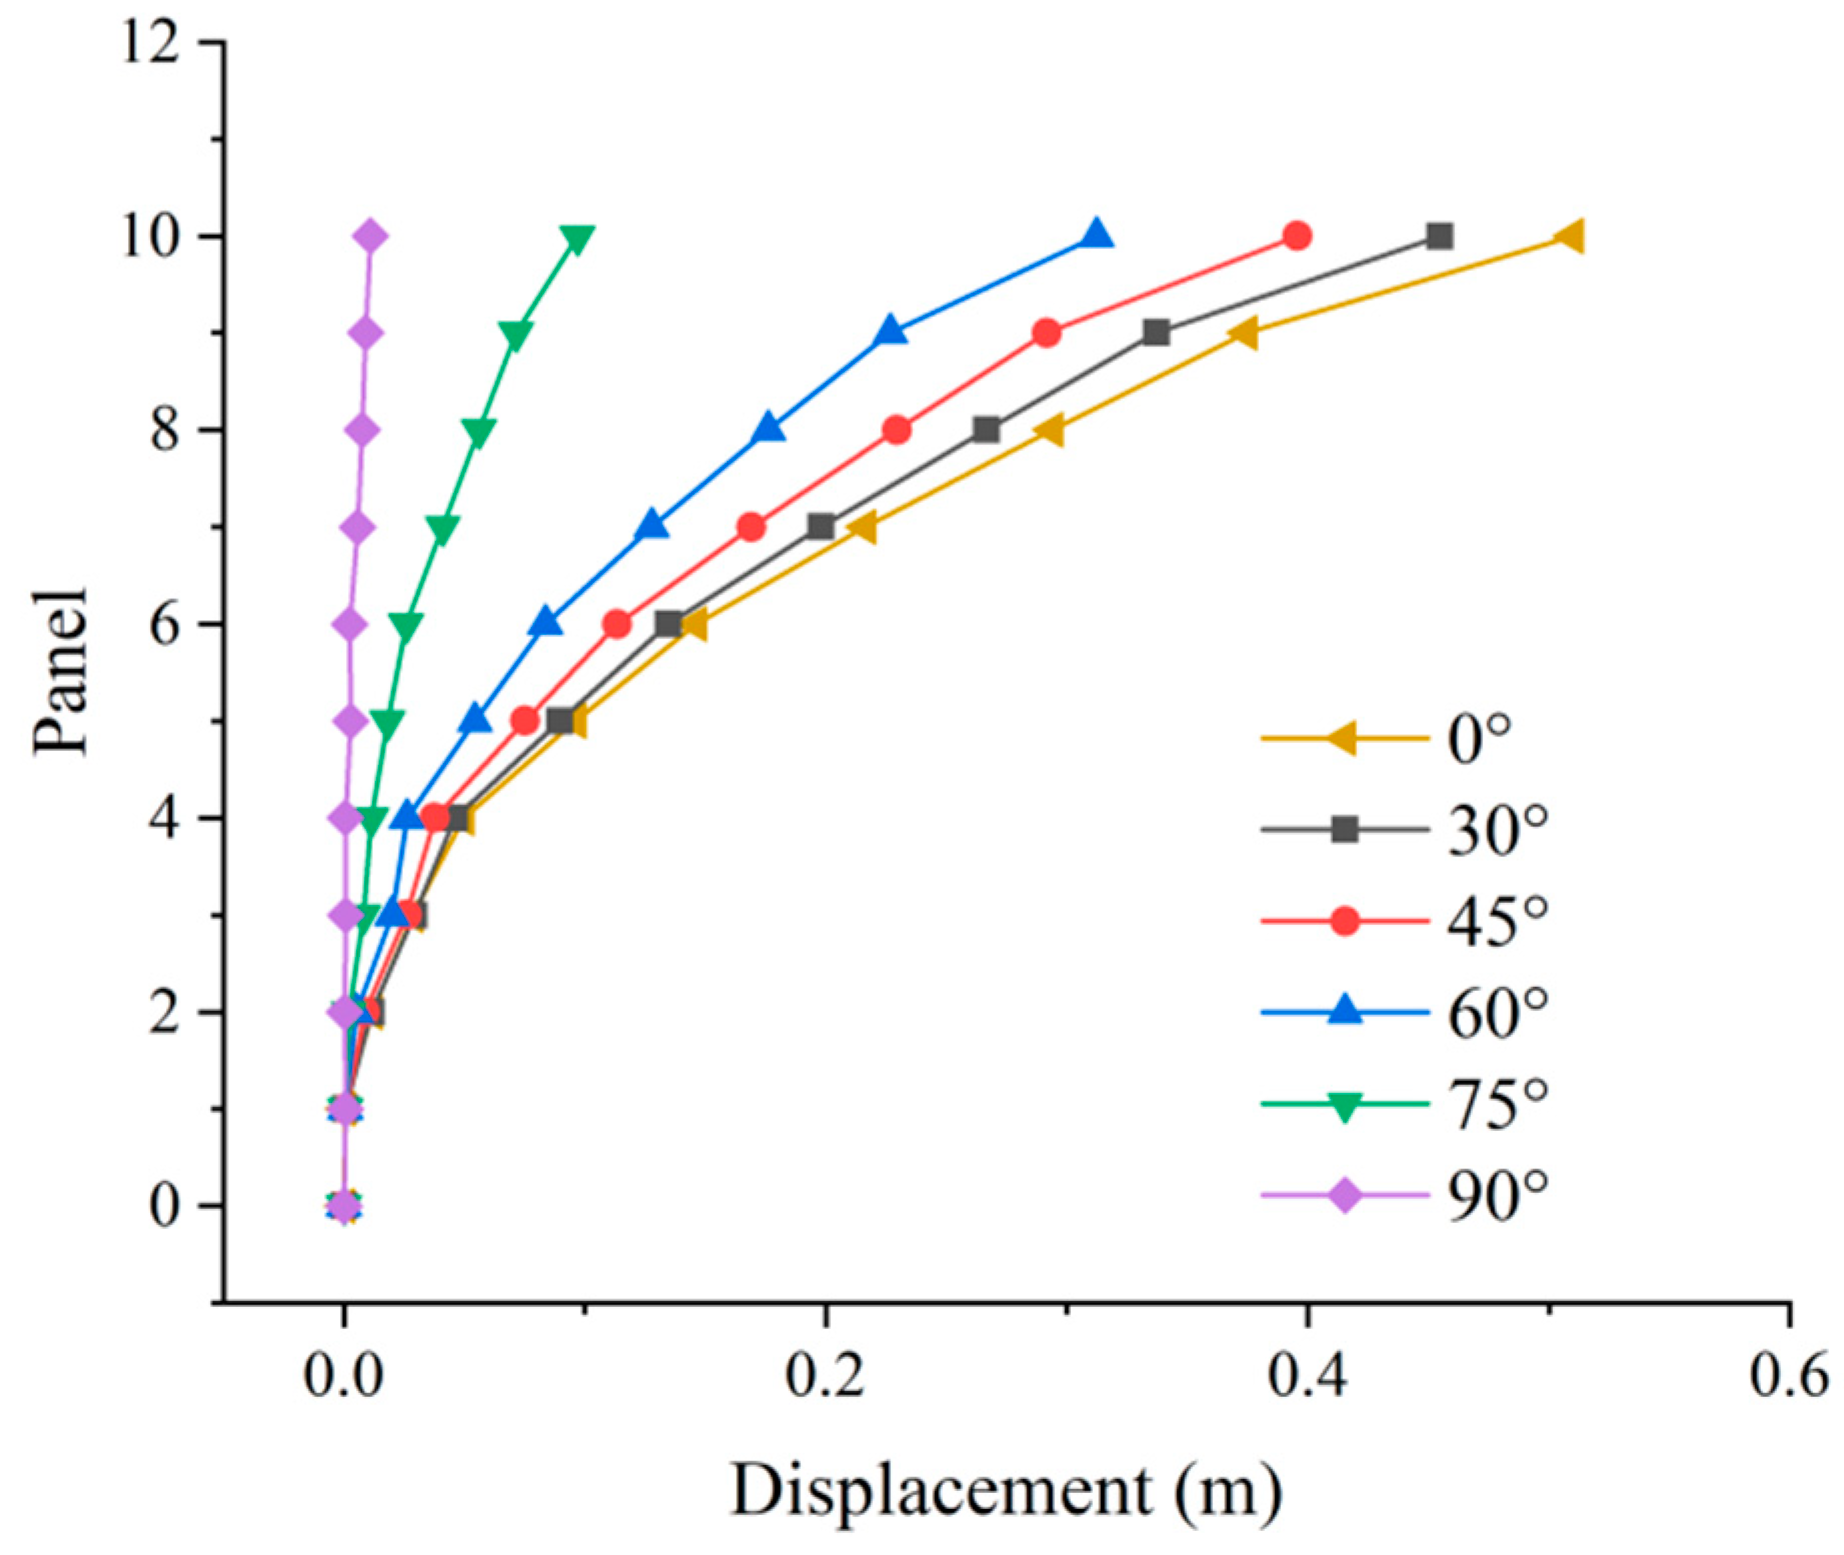
5.2. Response of Transmission Tower-Line System at Different Attack Angles

To analyze the response of the transmission tower under different wind attack angles, the dynamic time history analysis of the transmission tower-line system under different wind attack angles is carried out. Through the time-history analysis, the dynamic response results of the transmission tower-line system under the action of 0°, 30°, 45°, 60°, 75°, and 90° of fluctuating wind are obtained, respectively. Figure 12 is the schematic diagram of the wind attack angle. Figure 13 and Figure 14, respectively, show the top displacement responses of the nodes in the Y-direction (90° wind attack angle) and X-direction (0° wind attack angle) of the transmission tower-line system at different tower heights under the action of fluctuating wind at different wind attack angles. When the height of the transmission tower-line system from the ground remains unchanged, with the wind attack angle from 0° to 90°, the displacement of the transmission tower-line system in the Y-direction gradually increases and reaches its maximum value at the wind attack angle of 90°. At this time, the coupling effect between the transmission tower and the conductor is significant. The conductor increases the windward area and transmits the wind load to the transmission tower through the insulator, which greatly increases the displacement of the transmission tower under the action of a downburst. Then the displacement response also reaches its maximum value. At 0° attack angle, the displacement in the X-direction reaches its maximum. At 90° wind angle of attack, the transmission tower-line system displacement in the Y direction is greater than the displacement in the X direction under 0° wind angle of attack. Thus, the attack angle of 90° is the most unfavorable for the transmission tower-line system.

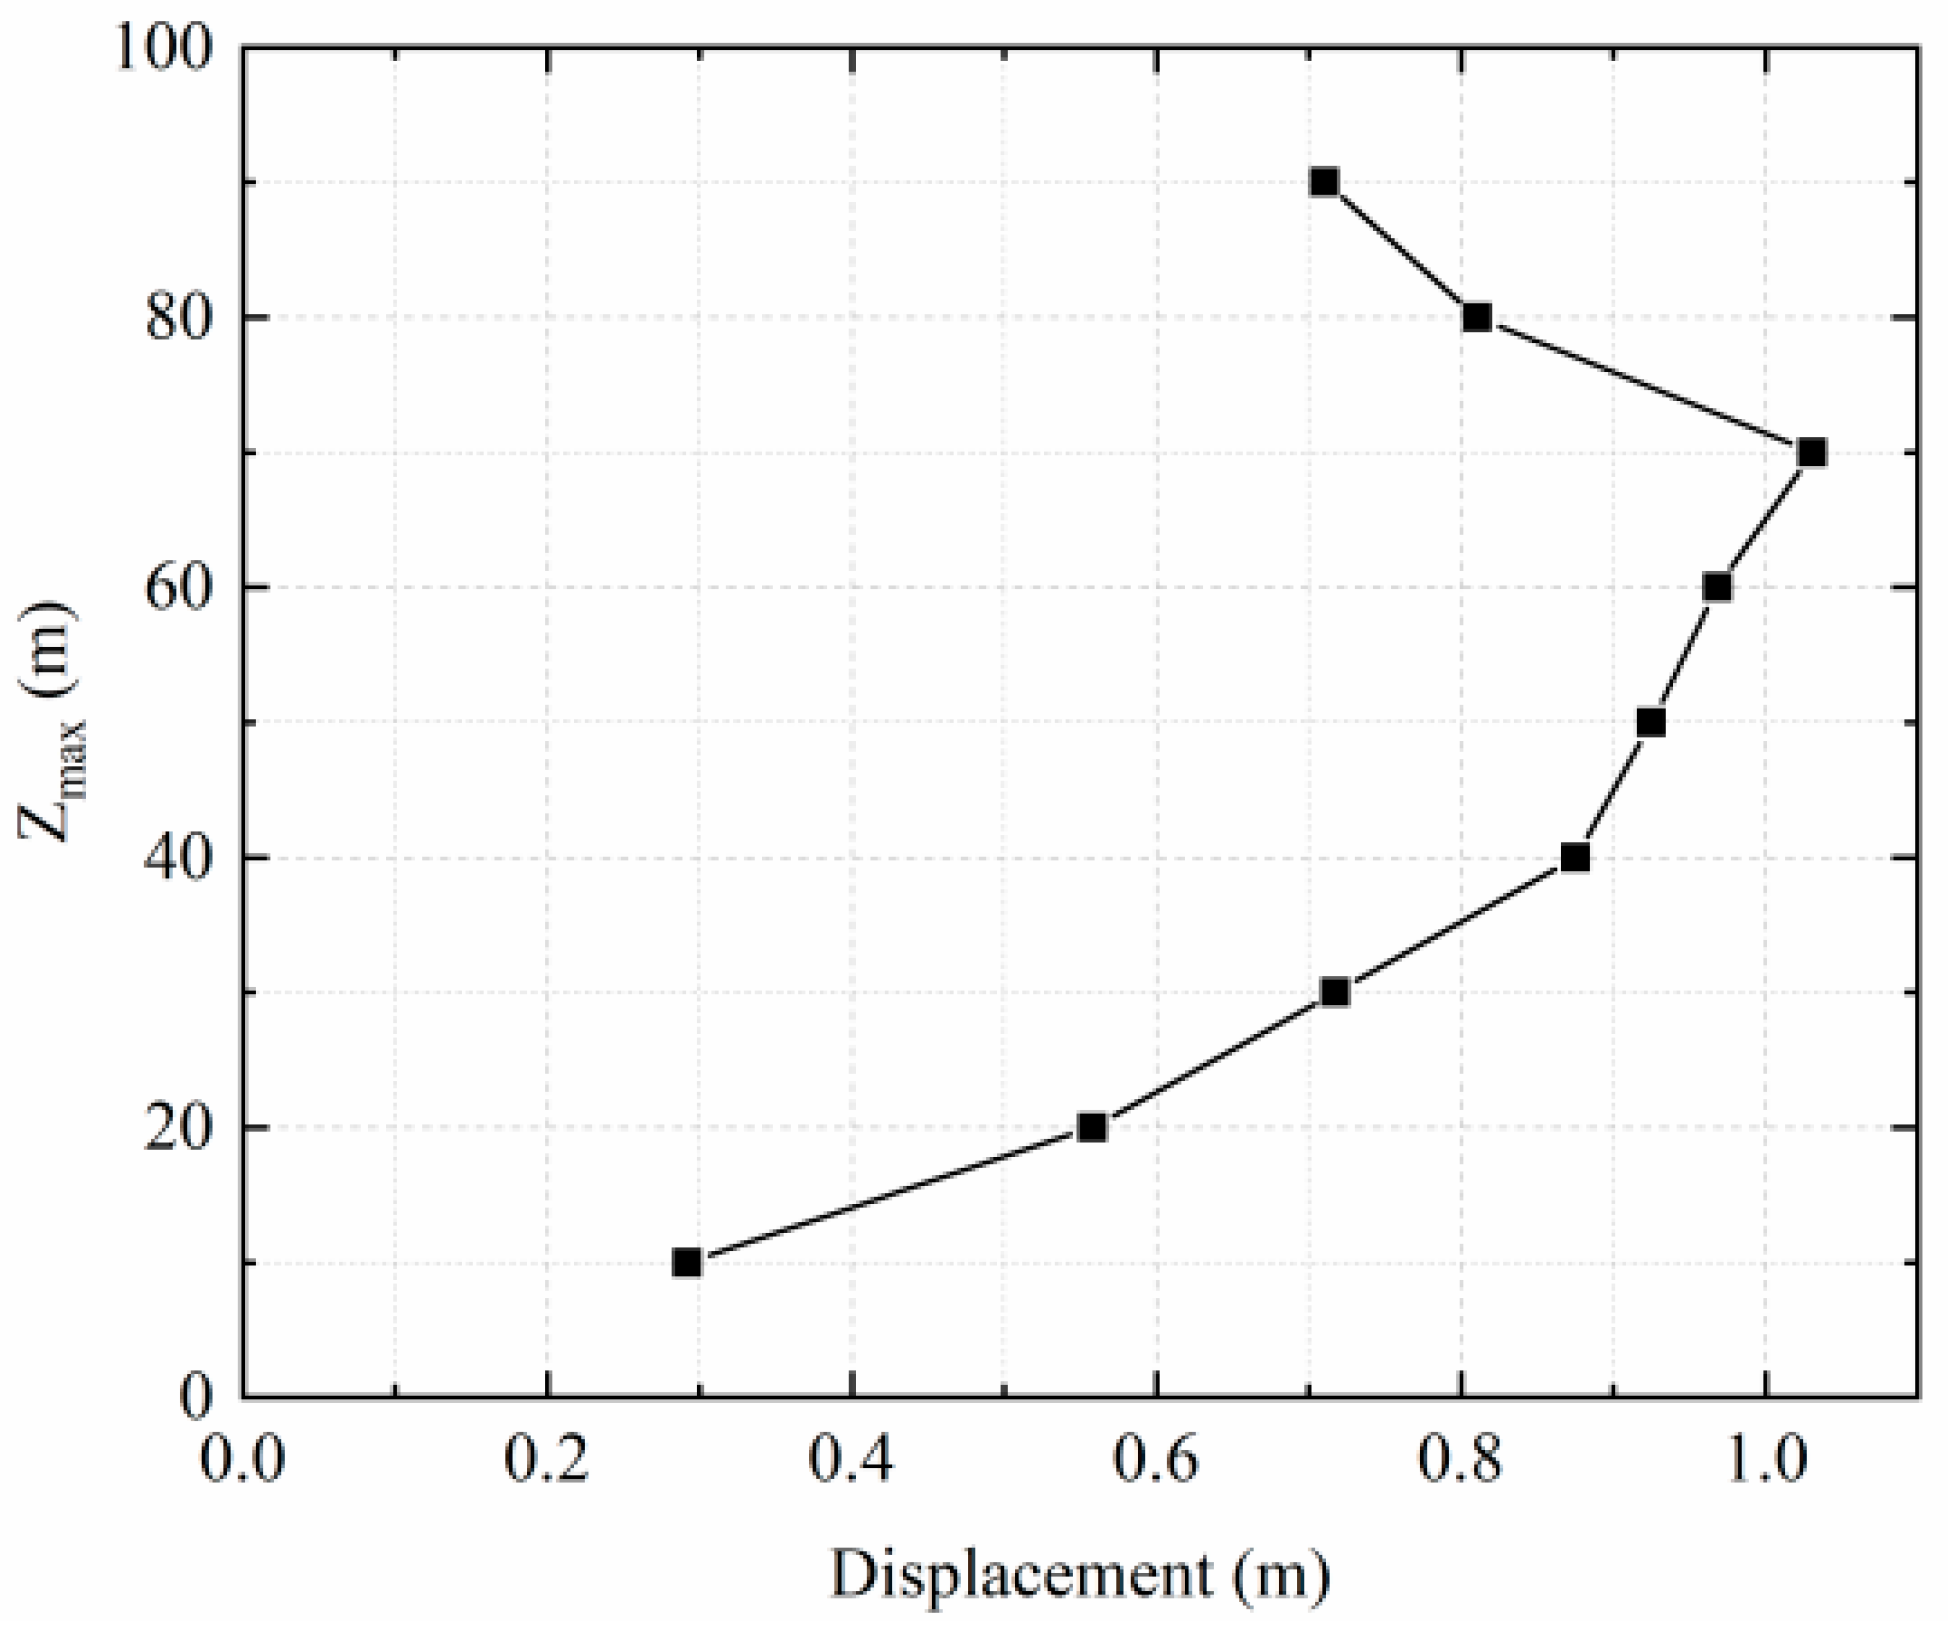
5.3. Influence of Maximum Wind Speed Height of Downburst on Response of Transmission Tower-Line System

To further investigate the effect of the downburst on the transmission tower-line system, different downburst wind loads can be simulated with different Zmax values. Figure 15 is an average wind profile for the Vicory model with different Zmax values. It can be seen from Figure 16 that when Zmax is from 10 m to 70 m, with the increase in Zmax, the maximum displacement of the transmission tower also rises to the maximum at Zmax = 70 m, and then begins to decrease rapidly. This is because when Zmax = 70 m, it is very close to the tower height of the transmission tower. When Zmax = 90 m, the maximum wind speed does not appear in the range of the height of the transmission tower, resulting in a decrease in the displacement of the transmission tower. When Zmax = 10 m ~ 60 m, although the maximum wind speed of a downburst occurs in the height range of the transmission tower, the position is low, and the wind speed above Zmax decays very quickly, so the higher the position of the maximum wind speed, the greater the displacement of the transmission tower. Therefore, it can be concluded that when Zmax is within the height range of the transmission tower, with the increase in Zmax, the greater the influence on the displacement of the transmission tower, and when Zmax exceeds the tower body range, the smaller the influence on the displacement of the transmission tower.

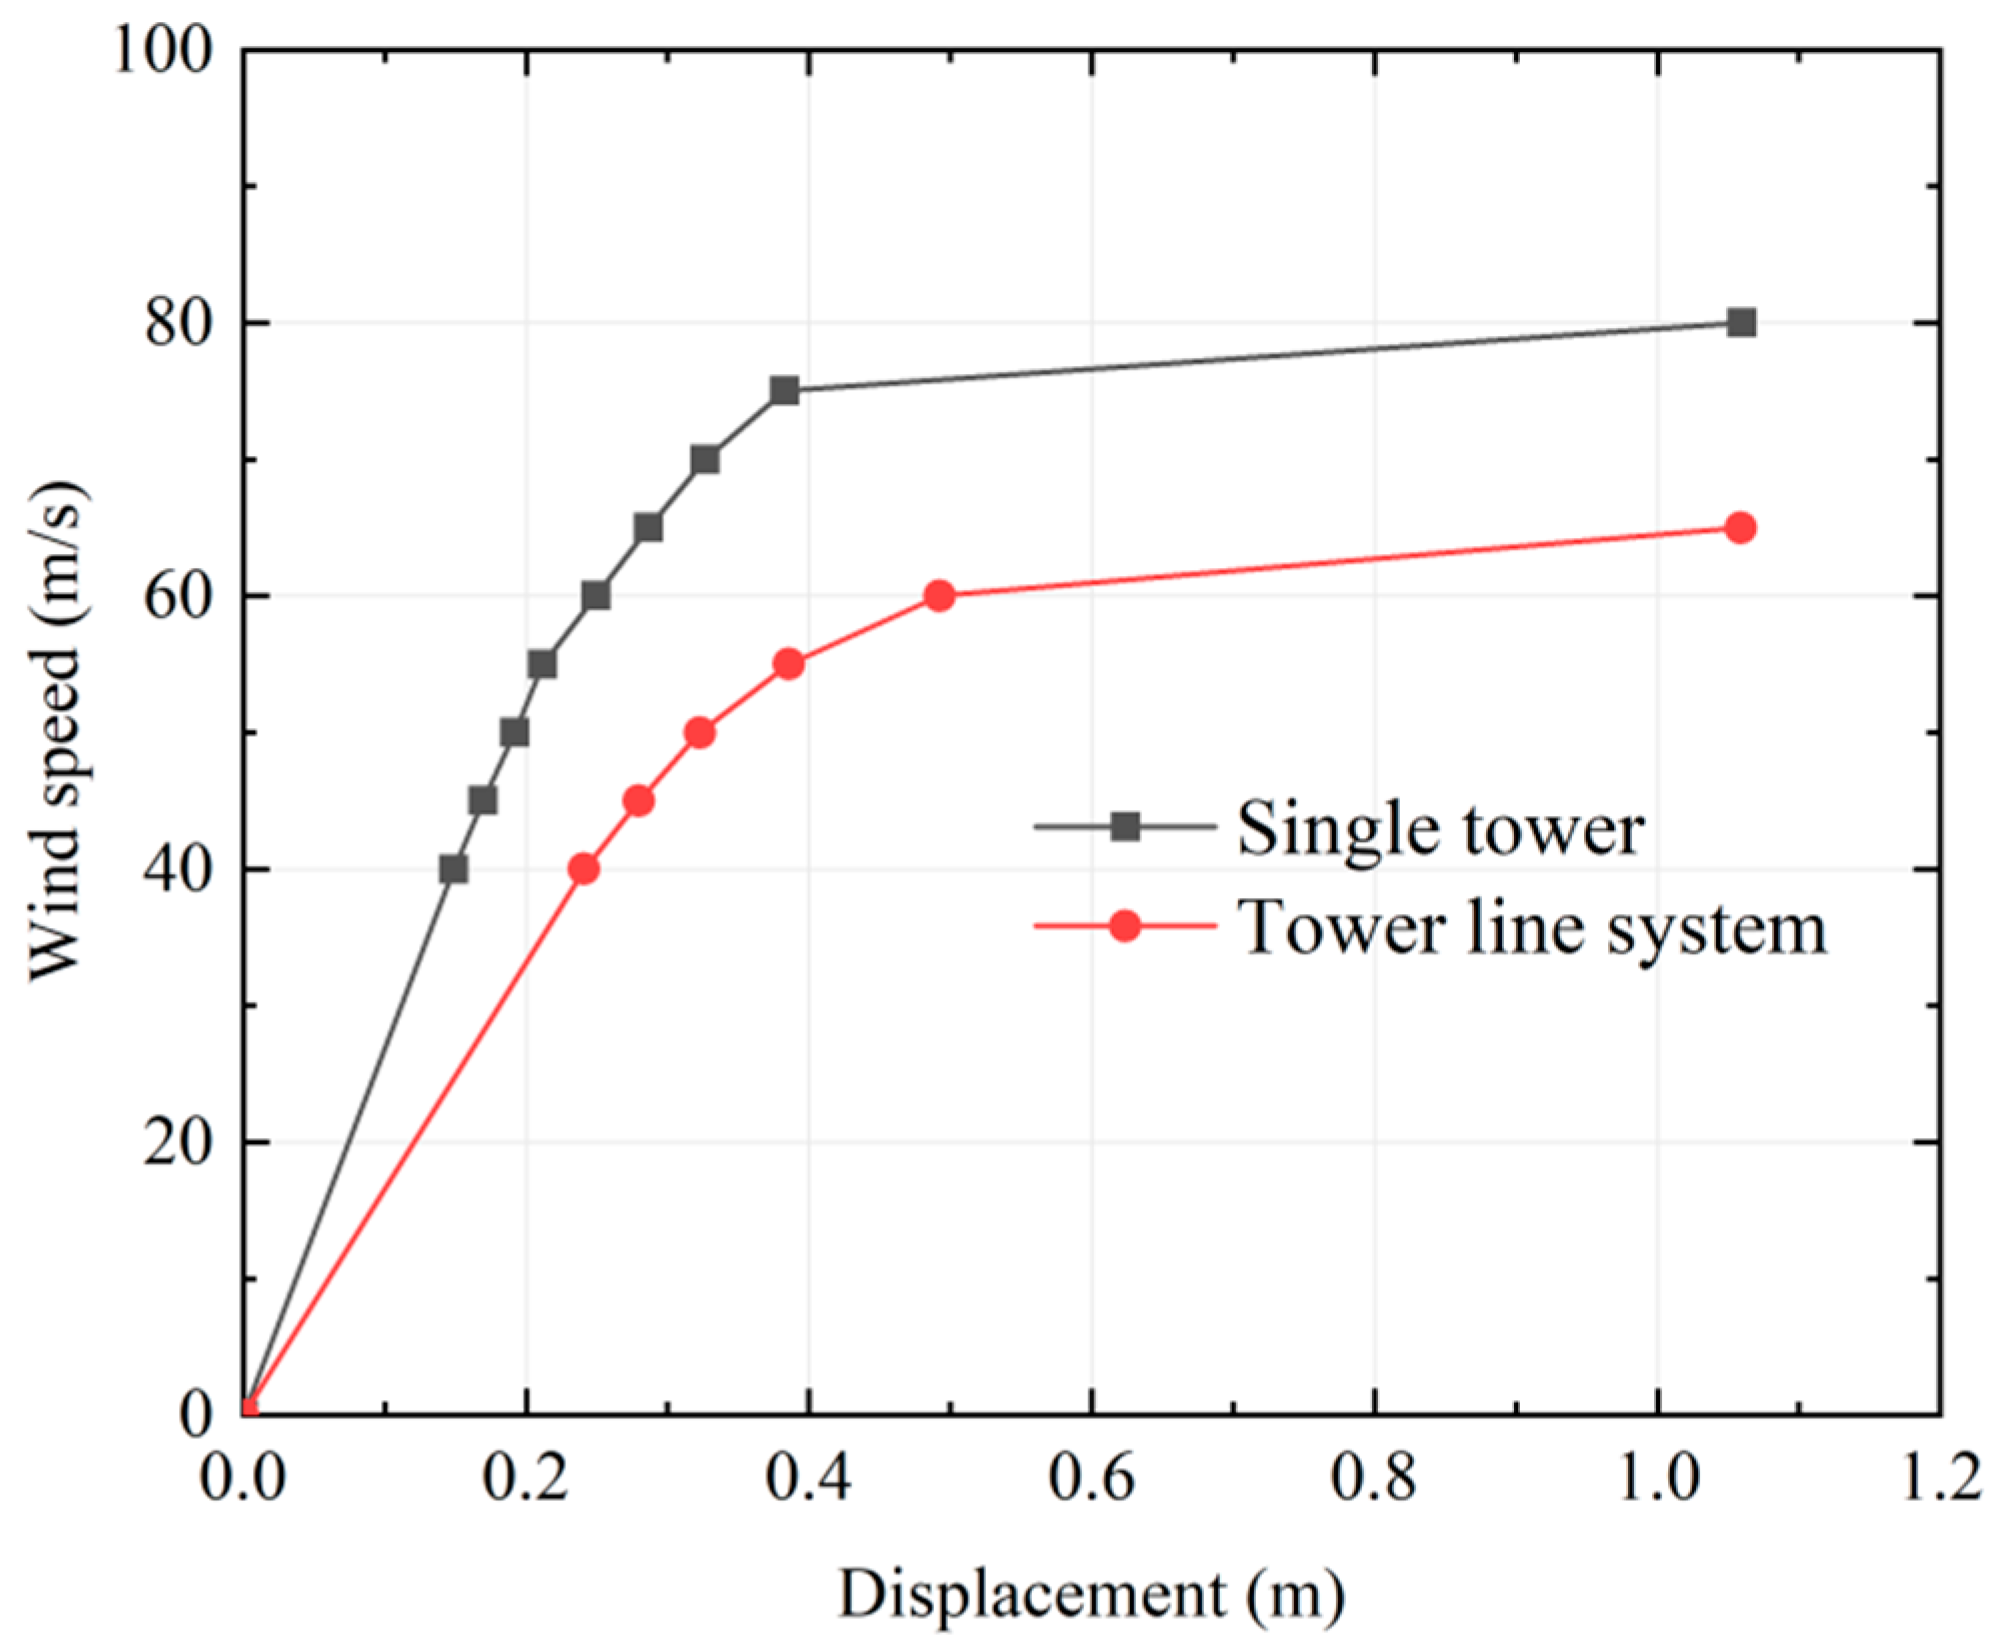
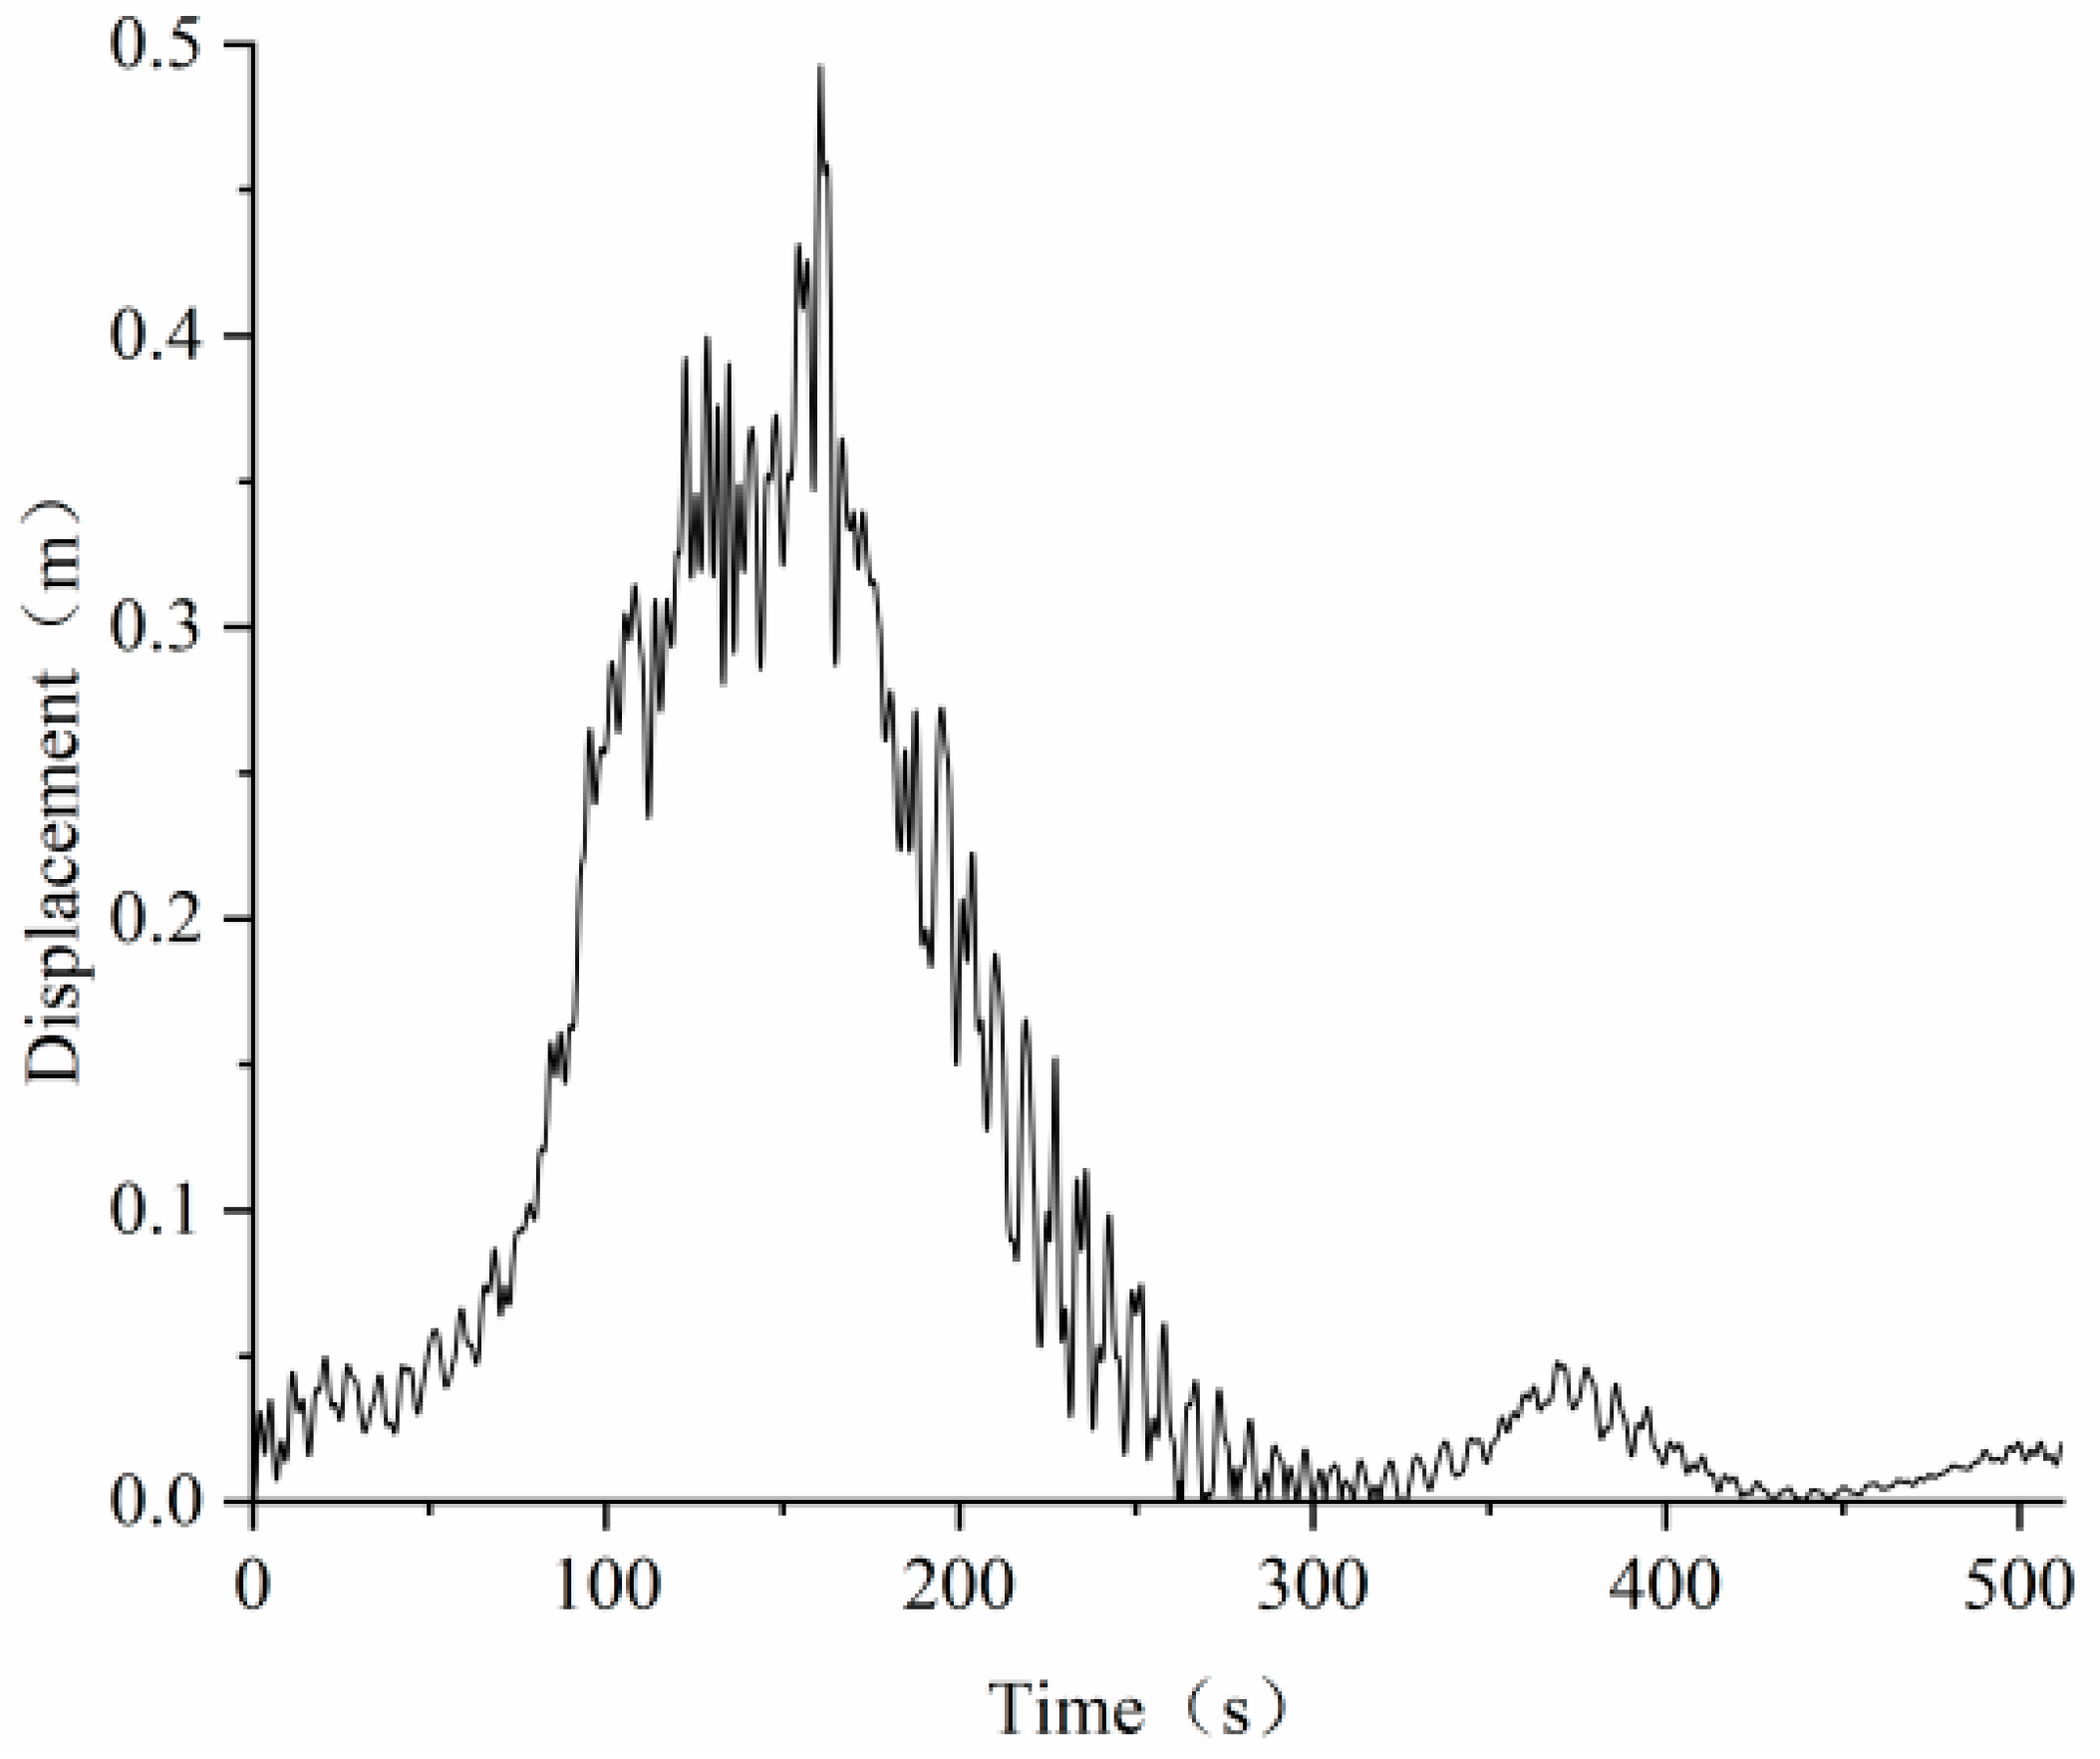
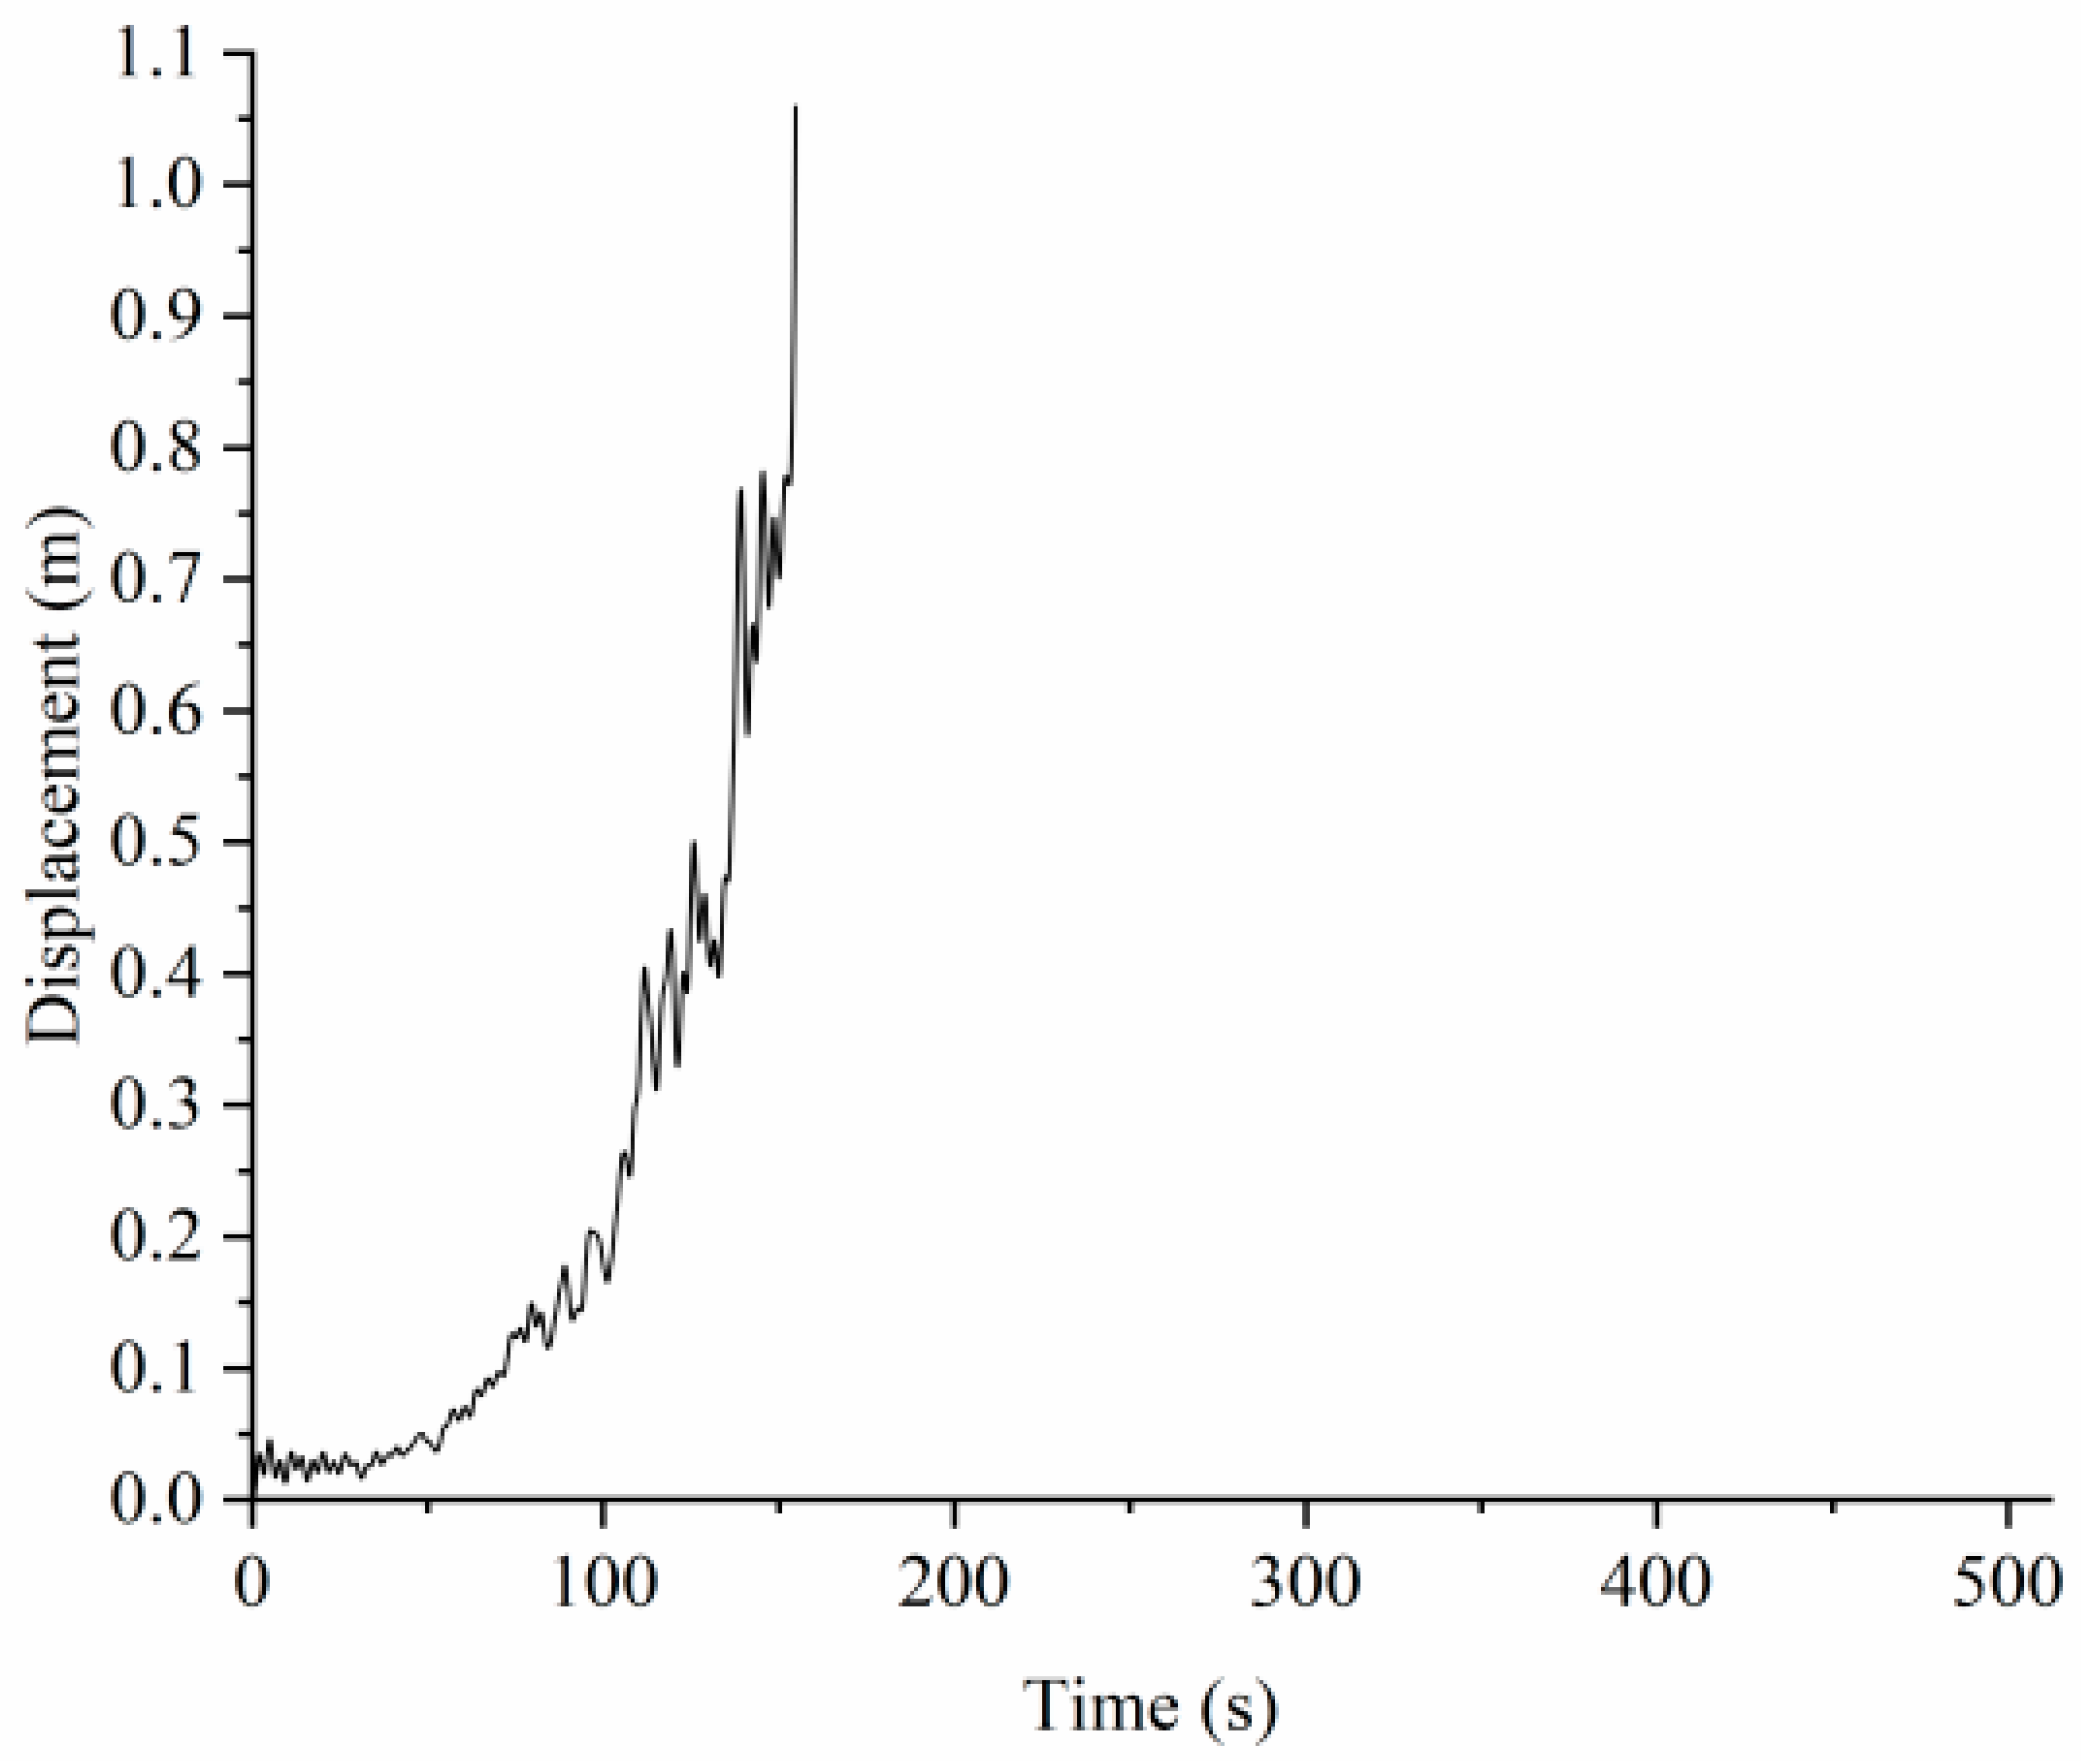
5.4. Comparative Analysis of the Stability of Transmission Tower and Transmission Tower-Line System

In the previous calculation of the transmission tower-line system under downburst wind load, Umax was taken as 80 m/s. Based on the linear assumption of materials, the transmission tower will yield under the action of a downburst under this strength. To obtain the characteristic response of the structure at all levels of wind load, considering the nonlinearity of materials, the harmonic superposition method is used to simulate the fluctuating wind speed time history at each section height of the transmission tower with a maximum average wind speed of 40–80 m/s. The displacement response of the single tower and tower line system at each level of simulated wind speed is analyzed by ANSYS, and the displacement time history of the tower top is obtained. The maximum displacement value can be obtained by comparison. Figure 17 shows the top displacement of the transmission tower and its relationship to the corresponding wind speed.
It can be seen from Figure 17 that the maximum displacement at the top of the transmission tower is 0.38 m with Umax = 75 m/s. In continuing the time course analysis of the structure under the downburst with Umax = 80 m/s. When ANSYS is running for the calculation of 148 s, the displacement of the transmission tower reaches 1.05 m. At this time, the finite element calculation results do not converge. Under the downburst wind load corresponding to Umax = 75 m/s and Umax = 80 m/s, the Umax displacement of the transmission tower is close to the horizontal. According to the dynamic increment method, the dynamic instability of the transmission tower occurs under the condition of Umax =80 m/s. According to the Budiansky–Roth criterion, if the structure responds violently under a small load increment, it can be judged that the dynamic instability of the structure has occurred. Figure 18 and Figure 19 are the displacement time history of the transmission tower-line system under the action of a downburst with Umax = 60 m/s and Umax = 65 m/s., The extreme value appears around 150 s, which is similar to the downburst wind speed time history. Similarly, it can be seen that the tower-line system undergoes dynamic instability under the action of a downburst with Umax = 65 m/s. and conductors greatly reduce the transmission towers’ stability.

6. Conclusions

In this paper, the Budiansky–Roth criterion and the dynamic incremental method are used to study the wind-resistant dynamic stability of transmission tower-line systems by using the nonlinear buckling analysis and time-history analysis module of ANSYS. The conclusions are as follows:
(1)
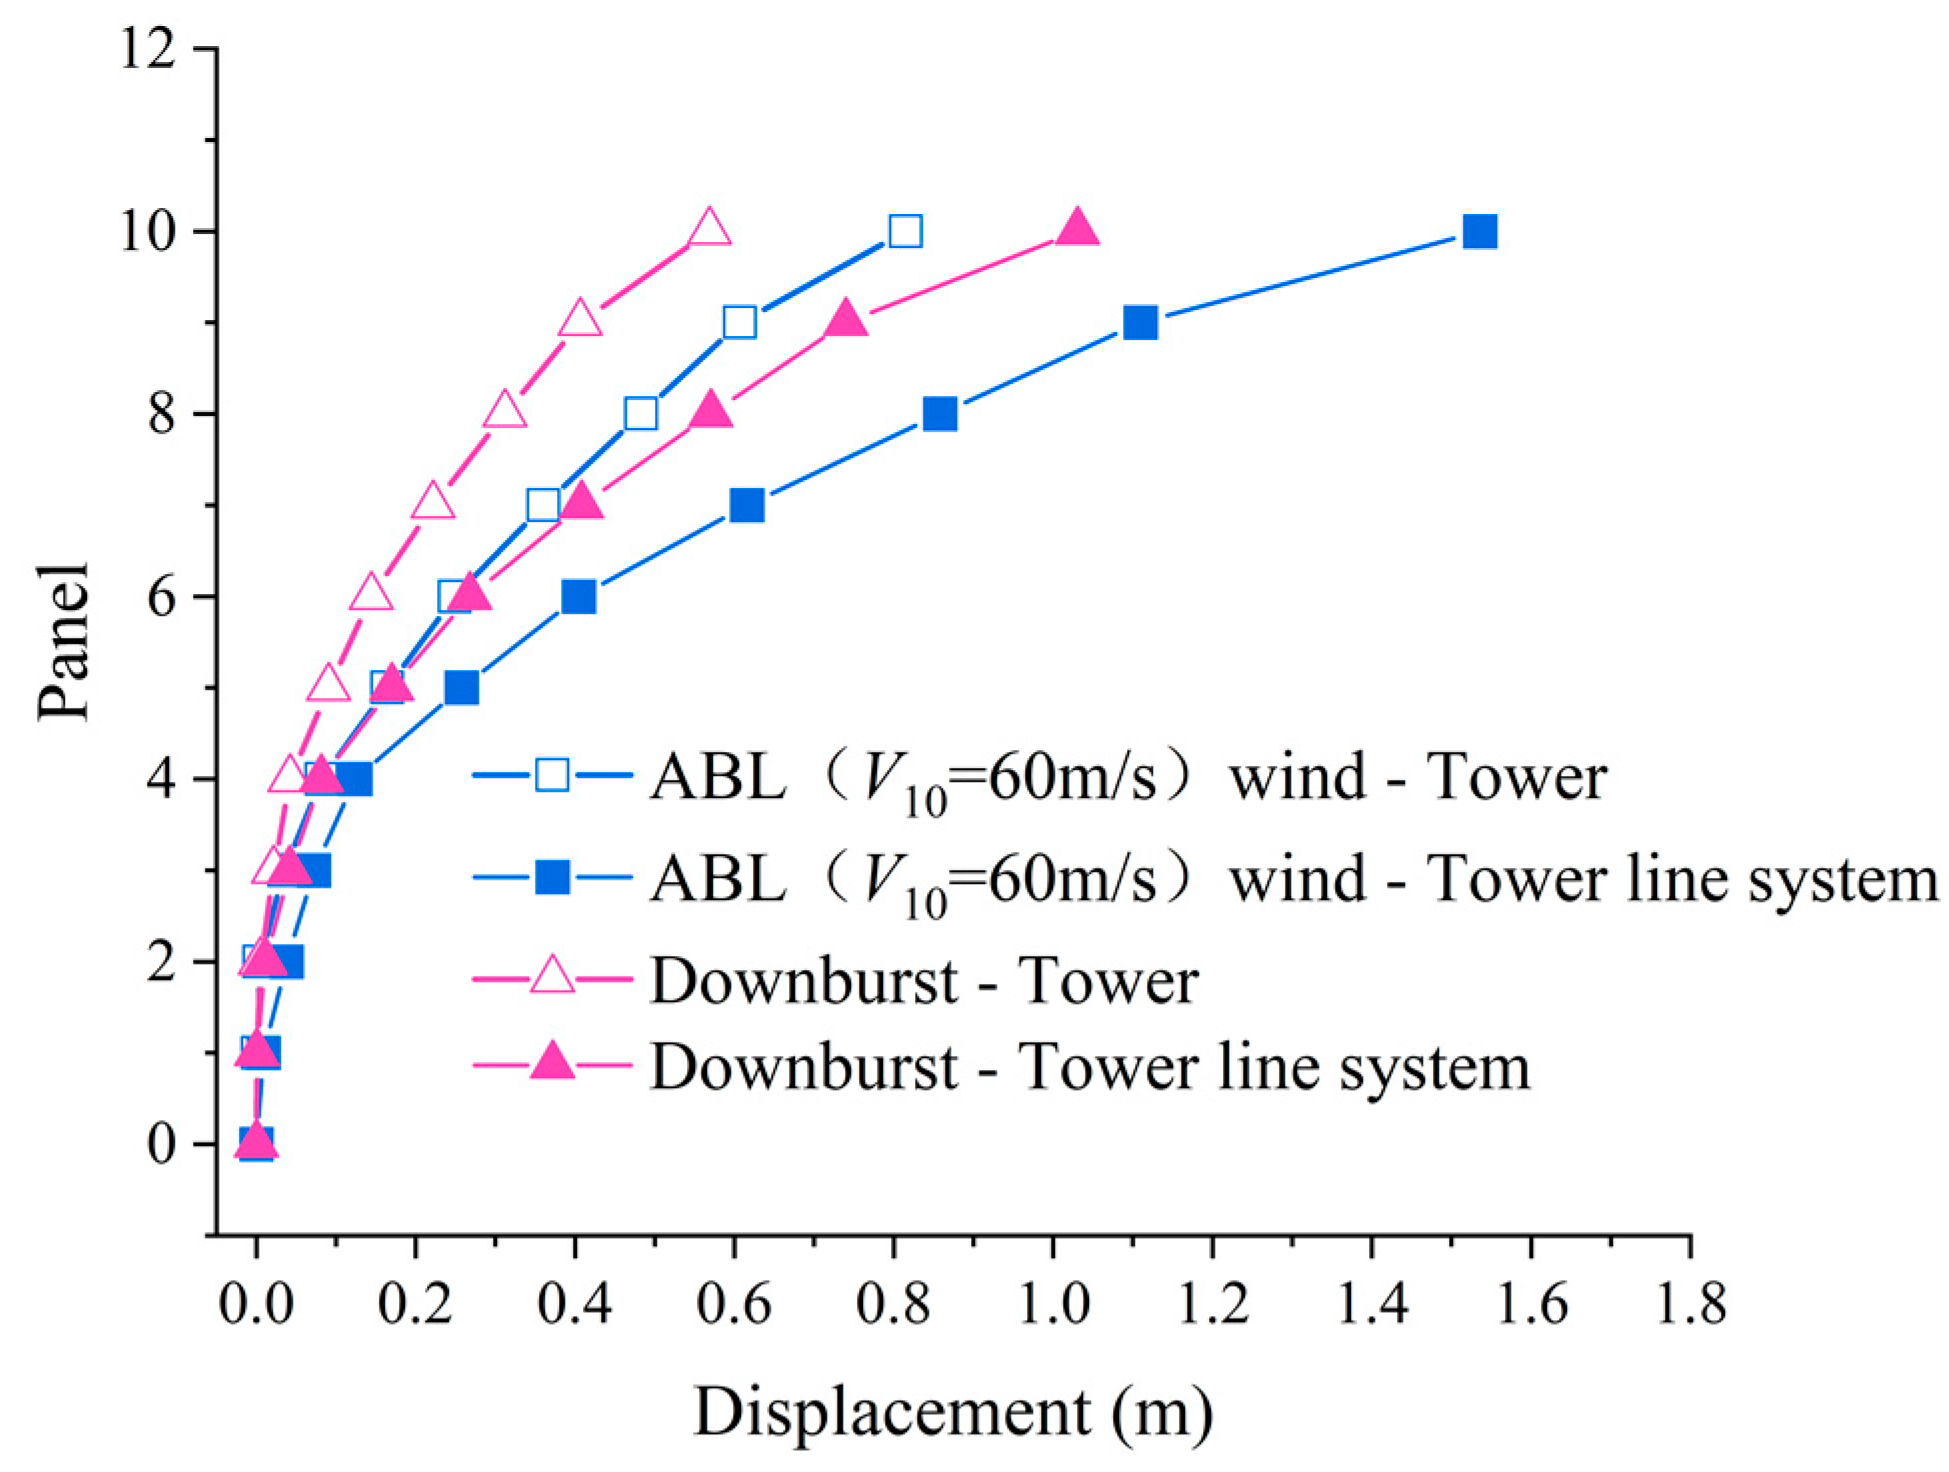
The design base wind speed V10 for transmission towers is taken as 30 m/s. By comparing the displacement of a single tower and a transmission tower-line system under two types of wind fields, the tip displacement of the single tower under the action of a downburst is 2.11 times that under the ABL wind field, and the vertex displacement of the tower-line system under downburst is 1.83 times that under the ABL wind field. On the other hand, the peak acceleration under the action of a downburst is 1.57 times that under the ABL wind, which is highly unfavorable for the transmission tower. The specific numerical results show that the downburst is hugely destructive;
(2)
The tip displacement in the Y-direction of the transmission tower at 90° wind attack angle is significantly higher than that at other wind attack angles because the transmission line increases the windward area, making the tip displacement in the Y-direction of the whole transmission line system maximum under the action of the downburst. It is indicated that the 90° wind attack angle is the most unfavorable wind attack angle of the transmission tower-line system. On the other hand, the X-direction displacement of the transmission tower reaches its maximum under 0° wind attack;
(3)
When Zmax is within the height range of the transmission tower, as Zmax increases for the transmission tower is more unfavorable, when Zmax is out of the tower range, the more up for the transmission tower is more favorable;
(4)
Downburst has great damage to the stability of transmission towers; transmission tower dynamic instability occurs under downburst wind loads with Umax = 80 m/s; the tower line system has dynamic instability under downburst wind loads with Umax = 65 m/s. The conductor will reduce the dynamic stability of the transmission tower under the downburst. The downburst wind loads cannot be ignored in the design of the transmission tower.

Author Contributions

Conceptualization, Y.Z. and Z.Y.; methodology, Y.Z.; software, S.L.; formal analysis, W.J.; data curation, J.L.; writing—original draft preparation, S.L.; writing—review and editing, Y.Z.; visualization, X.L.; project administration, Z.Y.; funding acquisition, Y.Z. and Z.Y. All authors have read and agreed to the published version of the manuscript.

Funding

The work described in this paper was supported by National Natural Science Foundation of China (Grant No. 52008070, 51778097, and 51808088), the Open Fund of Chongqing Key Laboratory of Energy Engineering Mechanics & Disaster Prevention and Mitigation (EEMDPM2021205), the Research Foundation of Chongqing University of Science and Technology (Grant No. ckrc2019039), the Science and Technology Research Program of Chongqing Municipal Education Commission (Grant No. KJQN202001511), and the Foundation of Chongqing Science and Technology Commission (Grant No. cstc2020jcyj-msxmX0530).

Institutional Review Board Statement

Not applicable.

Informed Consent Statement

Not applicable.

Data Availability Statement

Not applicable.

Conflicts of Interest

The authors declare no conflict of interest.

References

  1. Aboshosha, H.; Elawady, A.; El Ansary, A.; El Damatty, A. Review on dynamic and quasi-static buffeting response of transmission lines under synoptic and non-synoptic winds. Eng. Struct. 2016, 112, 23–46. [Google Scholar] [CrossRef]
  2. Sun, Q.; Wu, J.; Wang, D.; Xiang, Y.; Liu, H.; Sun, X. Analysis of the quasi-static buffeting responses of transmission lines to moving downburst. Comput. Modeling Eng. Sci. 2020, 124, 287–302. [Google Scholar] [CrossRef]
  3. Holmes, J.D.; Hangan, H.M.; Schroeder, J.L.; Letchford, C.W.; Orwig, K.D. A forensic study of the Lubbock-Reese downdraft of 2002. Wind Struct. 2008, 11, 137–152. [Google Scholar] [CrossRef]
  4. Yang, T.; Cechet, R.P.; Nadimpalli, K. Local Wind Assessment in Australia: Computation Methodology for Wind Multipliers; Geoscience Australia: Canberra, Australia, 2014. [Google Scholar]
  5. Fujita, T.T. Downbursts: Meteorological features and wind field characteristics. J. Wind Eng. Ind. Aerodyn. 1990, 36, 75–86. [Google Scholar] [CrossRef]
  6. Weilian, Q.; Baifeng, J. Formation and Diffusion of Downburst and Its Disaster Effect on Transmission Tower; Science Press: Beijing, China, 2013. [Google Scholar]
  7. Milford, R.; Goliger, A.M. Tornado risk model for transmission line design. J. Wind Eng. Ind. Aerodyn. 1997, 72, 469–478. [Google Scholar] [CrossRef]
  8. Choi, E.C. Field measurement and experimental study of wind speed profile during thunderstorms. J. Wind Eng. Ind. Aerodyn. 2004, 92, 275–290. [Google Scholar] [CrossRef]
  9. Savory, E.; Parke, G.; Zeinoddini, M. Modeling of tornado and microburst-induced wind loading and failure of a lattice transmission tower. Eng. Struct. 2001, 23, 365–375. [Google Scholar] [CrossRef]
  10. Shehata, A.; El Damatty, A. Behaviour of guyed transmission line structures under downburst wind loading. Wind Struct. 2007, 10, 249–268. [Google Scholar] [CrossRef]
  11. Xin, W.; Wenjuan, L.; Wei, X. Characteristics of Thunderstorm Impact on Transmission Tower. J. Huazhong Univ. Sci. Technol. 2008, 25, 10–14. [Google Scholar]
  12. Huawei, N.; Fei, H.; Kejian, O.; Zhengqing, C. Analysis on Downburst Induced Response of Guyed Portal Tower. J. Hunan Univ. 2018, 45, 72–81. [Google Scholar]
  13. Albermani, F.; Mahendran, M.; Kitipornchai, S. Upgrading of transmission towers using a diaphragm bracing system. Eng. Struct. 2004, 26, 735–744. [Google Scholar] [CrossRef]
  14. El Damatty, A.; Elawady, A. Critical load cases for lattice transmission line structures subjected to downbursts: Economic implications for design of transmission lines. Eng. Struct. 2018, 159, 213–226. [Google Scholar] [CrossRef]
  15. Zhang, Q.; Peil, U. Stability analysis of elastic structures under arbitrary excitation. China Civ. Eng. J. 1998, 31, 26–32. [Google Scholar]
  16. Chen, D. Energy Based Dynamic Stability Analysis of Transmission Tower-Line System under Downburst. Master’s Thesis, Wuhan University of Technology, Wuhan, China, 2019. [Google Scholar]
  17. Yan, L.; Hongjun, L.; Zhengliang, L.; Xuzhang, G. Nonlinear dynamic analysis for a transmission tower-line system subjected to wire breakage. J. Vib. Shock. 2017, 36, 70–79+85. [Google Scholar]
  18. Qi, L. Applications of Artificial Neural Networks in the Prediction of Structural Dynamic Stability under Seismic Excitations. Master’s Thesis, Tongji University, Shanghai, China, 2007. [Google Scholar]
  19. Shinozuka, M.; Jan, C.-M. Digital simulation of random processes and its applications. J. Sound Vib. 1972, 25, 111–128. [Google Scholar] [CrossRef]
  20. Vicroy, D.D. Assessment of microburst models for downdraft estimation. J. Aircr. 1992, 29, 1781–1787. [Google Scholar] [CrossRef]
  21. Oseguera, R.M.; Bowles, R.L. A Simple, Analytic 3-Dimensional Downburst Model Based on Boundary Layer Stagnation Flow; NASA Langley Research Center: Hampton, VA, USA, 1988. [Google Scholar]
  22. Wood, G.S.; Kwok, K.C.; Motteram, N.A.; Fletcher, D.F. Physical and numerical modeling of thunderstorm downbursts. J. Wind Eng. Ind. Aerodyn. 2001, 89, 535–552. [Google Scholar] [CrossRef]
  23. GB 50009–2012; Load Code for the Design of Building Structures. China Architecture and Building Press: Beijing, China, 2012.
  24. Fujita, T.T.; Wakimoto, R.M. Five scales of airflow associated with a series of downbursts on 16 July 1980. Mon. Weather Rev. 1981, 109, 1438–1456. [Google Scholar] [CrossRef]
  25. Chen, L.; Letchford, C.W. A deterministic–stochastic hybrid model of downbursts and its impact on a cantilevered structure. Eng. Struct. 2004, 26, 619–629. [Google Scholar] [CrossRef]
  26. Chay, M.T. Physical Modeling of Thunderstorm Downbursts for Wind Engineering Applications; Texas Tech University: Lubbock, TX, USA, 2001. [Google Scholar]
  27. Jiang, Y.; Zhao, N.; Peng, L.; Xin, J.; Liu, S. Fast simulation of fully non-stationary wind fields using a new matrix factorization assisted interpolation method. Mech. Syst. Signal Processing 2022, 172, 108973. [Google Scholar] [CrossRef]
  28. Wong, C.J.; Miller, M.D. Guidelines for Electrical Transmission Line Structural Loading; American Society of Civil Engineers: Reston, VA, USA, 2009. [Google Scholar]
  29. Como, M.; Grimaldi, A. Theory of Stability of Continuous Elastic Structures; CRC Press: Boca Raton, FL, USA, 1995; Volume 1. [Google Scholar]
  30. Budiansky, B. Axisymmetric dynamic buckling of clamped shallow spherical shells. NASA TN 1962, 1510, 597–606. [Google Scholar]
  31. GB 50545-2010; Code for Design of 110 Kv~750 kV Overhead Transmission Line. China Planning Press: Beijing, China, 2010.
Figure 1. Details of transmission tower.
Buildings 12 01338 g001
Figure 2. Details of Transmission Tower-line System.
Buildings 12 01338 g002
Figure 3. Comparison among three profile models and conventional ABL profile.
Buildings 12 01338 g003
Figure 4. Downburst wind speed time history.
Buildings 12 01338 g004
Figure 5. Wind spectrum comparison.
Buildings 12 01338 g005
Figure 6. ABL wind speed time-history.
Buildings 12 01338 g006
Figure 7. Wind spectrum comparison.
Buildings 12 01338 g007
Figure 8. Displacement comparison of transmission tower (V10 = 60 m/s).
Buildings 12 01338 g008
Figure 9. Displacement comparison of transmission tower (V10 = 30 m/s).
Buildings 12 01338 g009
Figure 10. Acceleration diagram of transmission tower under downburst.
Buildings 12 01338 g010
Figure 11. Acceleration diagram of transmission tower under ABL wind.
Buildings 12 01338 g011
Figure 12. Schematic diagram of the wind attack angle.
Buildings 12 01338 g012
Figure 13. Comparison of displacement of tower top in Y-direction.
Buildings 12 01338 g013
Figure 14. Comparison of displacement of tower top in X-direction.
Buildings 12 01338 g014
Figure 15. The wind profile of the Vicory model under different Zmax..
Buildings 12 01338 g015
Figure 16. Tip displacement under different Zmax.
Buildings 12 01338 g016
Figure 17. Relationship between structural characteristic response and corresponding wind speed.
Buildings 12 01338 g017
Figure 18. Displacement time history of transmission tower under 60 m/s downburst.
Buildings 12 01338 g018
Figure 19. Displacement time history of transmission tower under 65 m/s downburst.
Buildings 12 01338 g019
Table 1. Parameters for the profile models in Figure 1.
ParametersOseguera and Bowles [21]Vicroy [20] Wood et al. [22] ABL [23]
r (m)1200---
R (m)1000---
Z* (m)200---
ε (m)30---
λ (1/s)0.414---
Vmax (m/s)808080-
zmax (m)707070-
δ (m)--400-
α---0.16
Publisher’s Note: MDPI stays neutral with regard to jurisdictional claims in published maps and institutional affiliations.

