1. Introduction
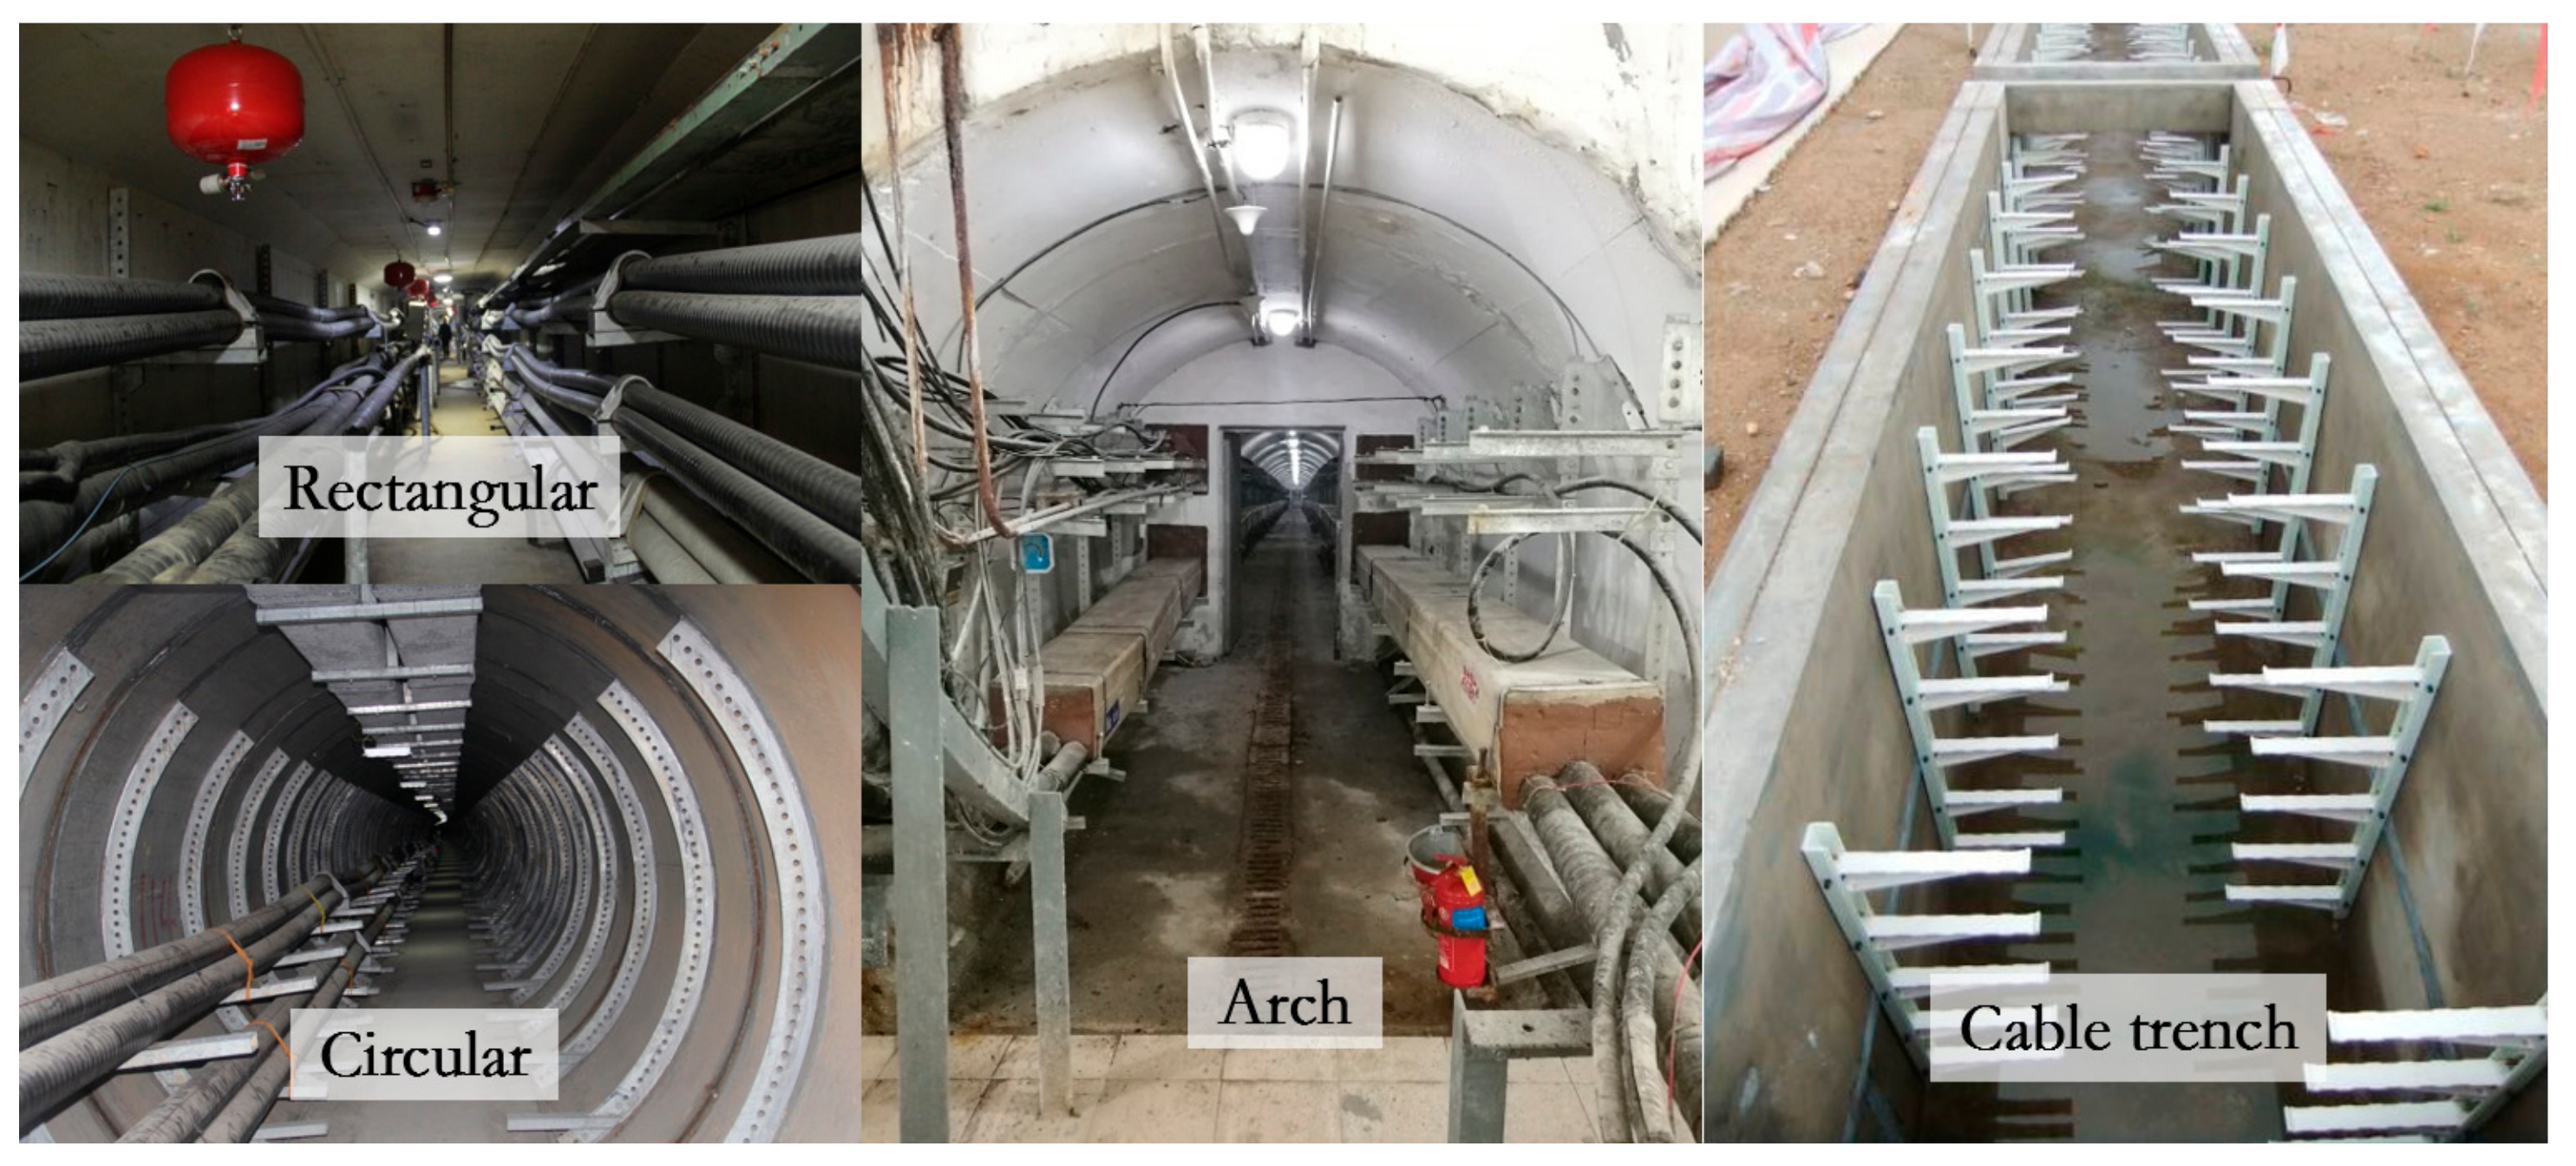
The cable line plays a significant role in keeping the normal and efficient operation of the city, ensuring the normal life of residents and the sustainable development of social economy. In recent years, more and more cities in China have responded to the call of “eliminating overhead power lines in cities”. The underground cable channel has become the preferred laying method for cable lines, which is more safe, stable, sustainable and easier for maintenance. The cross-section forms of cable tunnels are diverse, including a rectangular section, circular section, arch section and cable trench, as shown in
Figure 1, which can adapt well to the geological and civil conditions [
1,
2,
3].
However, as a burial structure, the cable tunnel will inevitably deform and crack under the surface loads. Moreover, the effect of groundwater and various acid-base salts will cause performance degradation of the concrete materials [
4]. At present, cable tunnels in China are still in development, and the mileage of cable tunnels in China is bound to increase in decades. As a result, the hidden danger of structural defective cable channels will also be much greater in the future [
5,
6]. Therefore, it is significant to determine the most destructive defect and develop a targeted rehabilitation plan. However, the various defects within a cable channel structure are often intricate and complex, coupled and synergistic with each other, making it difficult to evaluate the most destructive defect intuitively [
7,
8]. To solve this problem, this paper uses the Finite Element Method (FEM) to study the residual-bearing capacity of a defective cable tunnel model with cracks or concrete deterioration conditions and compare them with the residual-bearing capacity of an intact tunnel model.
For buried structures, most studies focus on the pipe structure including concrete pipe and cast-iron pipe, and many researchers also applied the FEM to study the performance of intact and defective reinforced concrete pipes: Tehrani [
9] studied the mechanical behavior of reinforced concrete pipe (RCP) with reduced steel cage with FEM; Mohamed [
10] introduced an RCP design method assisted with rational finite element; Ferrado [
11] also studied the mechanical behavior of RCP in TEB test condition with FEM; Riahi [
12] evaluated the structural capacity of epoxy-coated concrete pipes with experimental and numerical methods, and Younis [
13] studied the structural capacity of single, double and triple RCPs with FEM. It appears that most previous studies are more concerned about RCPs, which are similar to the cable tunnels with a circular section. However, the performances of defective cable tunnels with other cross-section types (i.e., rectangular, arched and cable trench) are seldom studied.
In light of this background, this paper analyzes the influence of different defect parameters on the structural-bearing capacity of cable tunnels with different section types more comprehensively, which has a good guiding significance and can provide some reference for solving the problem of defective structure evaluation of underground cable tunnels in China.
2. FEM Modelling of Cable Tunnels
ABAQUS is acknowledged as one of the most powerful FEM simulation softwares for analyzing complex solid mechanical and structural mechanical problems and solving highly nonlinear equations. In this paper, ABAQUS is also used for FEM modelling and analysis of different types of defective cable tunnels [
14,
15].
2.1. Geometric Modelling for Defective Cable Tunnels
FEM models of different types of reinforced concrete cable tunnel (i.e., circular, rectangular, arched and cable trench) are established with ABAQUS; the geometric models of intact cable tunnels are shown in
Figure 2. To maintain dimensional consistency, the dimensions of all models are: inner diameter/width of 600 mm, outer diameter/width of 720 mm and length of 1000 mm. Wire elements are used for reinforcement, the equivalent cross-section area of which is 19.63 mm
2 (i.e., the cross-sectional diameter of reinforcement is 5 mm). The reinforcement elements are placed into the solid elements of the cable tunnel by the Embedded Region method, the diameter of the reinforcement ring is 648 mm (i.e., the thickness of inner concrete cover is 24 mm). For the model of cable trench (
Figure 2d), the cover of the trench is set as rigid body without embedded reinforcement, and the interfaces between the cover and the tunnel applied “Hard” and “Rough” as the normal and shear contact, respectively.
2.2. FEM Modelling of Cracked Cable Tunnels
Reinforced concrete cable tunnels with cracks are modelled as shown in
Figure 3a, and the solid parts at the position of cracks are removed from the tunnel model, which was used for simulating cracks of different lengths, widths and depths. Taking the circular tunnel model C3 and C4 as example, the detailed dimensions of the cracked region are shown as
Figure 3b.
The most dangerous points in tunnel structures are chosen as the positions where cracks are set; for circular and rectangular cable tunnels, the cracks are set at the centerlines of roof, floor and the lateral walls; for arched cable tunnels, lateral cracks are set at the joints of the vault and the lateral walls; and for cable trench, the lateral cracks are set at the corners of the floor and the lateral wall. When the buried cable tunnel is subjected to surface loads, the roof and floor will bend inwards and the inner concrete cover is tensioned and cracked, while the lateral walls will bend outwards and the cracks propagate at the external surfaces.
For cracked cable tunnels, the control group (group 1) and four test groups (group 2–5) are included, where group 2–5 are cracked tunnel models with different crack dimensions (length, width and depth), and group 1 is the intact tunnel model. For each group, four types of cable tunnels are included. The codes and crack dimensions are shown as
Table 1.
2.3. FEM Modelling of Material Deteriorated Cable Tunnels
Material deterioration is also one of the most common structural defects in cable tunnels. In this paper, the material properties (i.e., compressive strength, elastic modulus, etc.) of concrete are reduced to simulate the deterioration. A C50-level concrete property presented in Chinese Standard GB50010 [
16] is applied for intact tunnel models. According to previous studies [
17,
18], the compressive strength and elastic modulus of C50 concrete soaked in 10% HCl for sufficient time are similar to those of C30 concrete. Therefore, this paper selects C30 concrete as the fully deteriorated status and take C40 concrete as the median status of material deterioration. On the other hand, the depth of deterioration is also considered as a variable.
Taking the circular tunnel with a deterioration depth of half-thickness as example, the FEM model is shown as
Figure 4, where the grey part represents the deteriorated concrete, and the green part indicates the original concrete. It should be noted that the two parts are separated by a nominal column shell rather than a real one (the material properties are given respectively), but geometrically they are actually an integral part with no interface in between. The C50-level concrete damage plastic (CDP) models are applied for original concrete, C40 and C30 levels are applied for deteriorated concrete, and the elastic-plastic constitutive model of HPB300 steel is applied for the reinforcement [
19]. The detailed constitutive models will be introduced in
Section 2.4.
For concrete deteriorated cable tunnels, three test groups (group 6–8) are included, with which the degree and depth of concrete deterioration are studied. For each group, four types of cable tunnels are included. The codes and crack dimensions are shown as
Table 2.
2.4. Constitutive Modelling
The concrete and the steel are two major materials involved in the cable tunnel FEM modelling. For the concrete material, the C50-, C40- and C30-level concretes are involved to simulate the cable tunnel with different degrees of deterioration, the elasto-plastic constitutive model is applied for the concrete materials. For the elastic part, parameters include the elastic modulus (
) and the Poisson’s ratio (
); and for the plastic part, the concrete damage plastic (CDP) model is applied, which is used to describe the characteristics of concrete stiffness degradation and restoration—it can better reflect the deflecting and cracking process of the concrete. The CDP model includes five major parameters: (1) the dilation angle (ψ), which is ranged from 30° to 40° for concrete, the dilation angle of 38° is used in this paper; (2) the viscosity (μ), which has a great impact on the material behavior; (3) the flow potential eccentricity (ϵ), which is a small positive number that defines the rate at which the hyperbolic flow potential approaches its asymptote, and the default value is 0.10; (4) the ratio of initial equiaxial compressive yield stress to initial uniaxial compressive yield stress (
), and the default value is 1.16; and (5) the ratio of the second stress invariant on the tensile meridian to that on the compressive meridian (K), and the default is 2/3. For these parameters, there are several suggested values from previous studies [
9,
13], which are shown in
Table 3. According to the suggested values, the parameters applied in this study are also given in
Table 3.
The elasto-plastic constitutive model is also applied for the steel material of reinforcement, where the parameters of HPB300 reinforcement are applied. The properties of concrete and steel materials applied in the constitutive model are shown in
Table 3 [
20,
21]:
The concrete tensile and compressive stresses for the CDP model can be calculated with following equations [
22,
23]:
where,
and
indicate the principal compressive and tensile stress, respectively;
and
indicate the principal compressive and tensile strain, respectively;
and
indicate the compressive and tensile damage factor of concrete material, respectively;
and
indicate the plastic compressive and tensile strain respectively; and
indicates the elastic modulus.
The compressive and tensile damage factor of concrete material can be calculated as follows:
where,
and
indicate feature coefficients for compressive and tensile strain of concrete, respectively; they are determined as 0.7 and 0.1 in this paper [
24].
Basic constitutive parameters of C30-C50-level concrete materials are given in Chinese standard GB50010 [
16], with Equations (1)–(4), the stress-strain curves of C30–C50 concrete materials are established in
Figure 5.
2.5. Boundary and Loading Conditions
Since this paper is more concerned with the impact of different defects on the structural performance of the cable tunnel, the interactions of the soil–structure system are ignored. TEB (Three-edge-bearing) test conditions are applied to test the residual-bearing capacities of defective tunnels. Taking circular cable tunnel as example, the boundary condition is shown in
Figure 6.
Considering that the TEB test is the standard test for circular and rectangular reinforced concrete culverts [
25], the FEM models in this paper also applied the boundary and loading conditions of the TEB test. As shown in
Figure 6, two linear zones at the bottom of the model are set as rigid constraints, where the degrees of freedom in all directions are constrained; the two linear zones are 100 mm apart, according to Chinese standard GB/T 16752 [
25]. At the crown of the structure, a linear D-load (i.e., the failure load in a TEB test) is conducted as the loading condition; to avoid mesh distortion caused by large deflection, the loading is processed by controlling the vertical displacement, which is set to 60 mm (10% inner diameter, which is considered as the failure displacement) as the loading condition.
For arched and trenched tunnels, there are no specific test methods for them, and in order to keep the consistency of modelling method, the boundary and loading conditions of arched and trenched tunnels are set the same as the conditions of circular and rectangular tunnel models.
2.6. Meshing and Solving
For the concrete tunnel parts, the solid element C3D8R (linear reduced integral unit) was applied for meshing, which has advantages as follows: (1) The C3D8R element can weaken the shear self-locking phenomenon under bending load; (2) The solutions of displacement and stress are accurate; (3) When the mesh is distorted, the calculation accuracy will not be greatly affected. For the reinforcement parts, the truss element T3D2 was applied for meshing. The meshed models of concrete parts are shown as
Figure 7. The approximate overall mesh size of the C3D8R units is 40 mm, and 25 mm for T3D2 units. The mesh sizes in all modelling groups are consistent, in order to make the final simulation results more comparable.
The general static step was chosen for the analysis, since that TEB test is a static loading test. Moreover, the direct equation solve method and full-newton solution technique were applied for the analysis. The full-newton solution technique is to update the stiffness matrix once after each iteration, which is more suitable for concrete structures, because concrete is a rigid material; using the full-newton method can update the stiffness matrix more quickly to adapt to the stiffness changes of concrete materials in the TEB test, so as to obtain better accuracy. The full-newton method also has disadvantages, such as slower calculation speed and higher chance of non-convergence.
3. Result Analysis
3.1. Impact of Cracks on the Residual Bearing Capacity of Cable Tunnels
3.1.1. Crack Length
By comparing groups 1, 3 and 4 of each type of cable tunnel, the effect of crack length is clarified. As shown in
Figure 8, where (a)–(d) are load–displacement curves for circular, rectangular, arched and trenched tunnel models respectively. For circular models, the failure loads of models with half-length and full-length cracks are 91.34% and 86.05% of the intact model respectively; for rectangular models, the failure loads of models with half-length and full-length cracks are 93.31% and 89.14% of the intact model respectively; for arched models, the failure loads of models with half-length and full-length cracks are 85.62% and 82.05% of the intact model respectively; and for trenched models, the failure loads of models with half-length and full-length cracks are 86.90% and 85.34% of the intact model respectively.
It can be learnt that the average reduction of the failure load among all types of tunnels is 3.65% when the crack length increases to full length of the model (1 m) from half length of the model (0.5 m), while the average failure load reduction is 10.71% from intact model to half-length cracked model. This means the appearance of cracks shows greater influence to the residual-bearing capacity of tunnel, and the effect of crack length development is less significant.
3.1.2. Crack Width
The impact of crack width can be learnt from the comparison of groups 1, 2 and 5; their load–displacement curves are shown as
Figure 9, where (a)–(d) represent the circular, rectangular, arched and trenched tunnel models, respectively, and the defective tunnels with 1 mm and 2 mm wide cracks are compared.
It can be read from
Figure 9 that, for circular models, the failure loads of models with 1 mm wide and 2 mm wide cracks are 99.02% and 98.44% of the intact model, respectively; for rectangular models, the failure loads of models with 1 mm wide and 2 mm wide cracks are 93.76% and 88.90% of the intact model, respectively; for arched models, the failure loads of models with 1 mm wide and 2 mm wide cracks are 88.76% and 81.63% of the intact model, respectively; and for trenched models, the failure loads of models with 1 mm wide and 2 mm wide cracks are 92.19% and 90.75% of the intact model, respectively.
It can be learnt from the results that the increasing of crack width also reduced the failure loads of tunnel models, but the influence is also quite limited: from 1 mm to 2 mm wide cracks, the reductions of failure loads are 0.59%, 4.86%, 7.12% and 1.44%, respectively, while the average reduction is 3.5%.
3.1.3. Crack Depth
The load–displacement curves of group 1, 2 and 3 are compared to analyze the effect of crack depth on failure loads of tunnel models, as shown in
Figure 10. Cracked tunnel models with crack depths of 12 mm (i.e., half concrete cover thickness) and 24 mm (i.e., full concrete cover thickness) are compared with the intact tunnel model.
It is shown that, for circular models, the failure loads of models with 12 mm and 24 mm crack depths are 99.02% and 86.05% of the intact model, respectively; for rectangular models, the failure loads of models with 12 mm and 24 mm crack depths are 93.76% and 89.14% of the intact model, respectively; for arched models, the failure loads of models with 12 mm and 24 mm crack depths are 88.76% and 82.05% of the intact model, respectively; and for trenched models, the failure loads of models with 12 mm and 24 mm crack depths are 92.19% and 85.34% of the intact model, respectively.
The average reduction of failure loads is 7.79% while the crack depth increased from 12 mm to 24 mm, and the maximum reduction reaches 12.97%, which suggests that the effect of crack depth is greater than that of crack length and width.
3.2. Impact of Material Deterioration on the Residual Bearing Capacity of Cable Tunnels
3.2.1. Degree of Deterioration
By comparing the 1, 7 and 8 groups of each type of cable tunnel, the effect of deteriorated degree is clarified, as shown in
Figure 11, where (a)–(d) are load–displacement curves for circular, rectangular, arched and trenched tunnel models, respectively. For circular models, the failure loads of C40-deteriorated and C30-deteriorated models are 96.68% and 92.18% of the intact model, respectively; for rectangular models, the failure loads of C40-deteriorated and C30-deteriorated models are 98.90% and 93.54% of the intact model, respectively; for arched models, the failure loads of C40-deteriorated and C30-deteriorated models are 96.97% and 94.24% of the intact model, respectively; and for trenched models, the failure loads of C40-deteriorated and C30-deteriorated models are 95.65% and 91.51% of the intact model, respectively.
When the concrete strength deteriorated from C40 to C30 level, the reductions of failure load for circular, rectangular, arched and trenched tunnel models are 4.51%, 5.36%, 2.73% and 4.13%, respectively, and the average reduction is 4.18%.
3.2.2. Depth of Deterioration
The load–displacement curves of groups 1, 6 and 7 are compared, as shown in
Figure 12, where (a)–(d) represent the circular, rectangular, arched and trenched tunnel models, respectively, and the impact of deterioration depth can be drawn as follows: For circular models, the failure loads of half-deteriorated and full-deteriorated models are 99.63% and 92.18% of the intact model, respectively; for rectangular models, the failure loads of half-deteriorated and full-deteriorated models are 95.93% and 93.54% of the intact model, respectively; for arched models, the failure loads of half-deteriorated and full-deteriorated models are 97.47% and 94.24% of the intact model, respectively; and for trenched models, the failure loads of half-deteriorated and full-deteriorated models are 95.84% and 91.51% of the intact model, respectively.
Comparing the load–displacement curves of tunnel models with half-wall thick and full-wall thick deterioration, as the deteriorated depth increases, the reductions of failure loads are 7.45%, 2.39%, 3.24% and 4.33% for circular, rectangular, arched and trenched tunnel models, and the average reduction is 4.35%. The effect of deterioration depth and deterioration degree are at the same level.
3.3. Impact of Different Defects on Cable Tunnel Structures
For all defective parameters, an ultimate status and a median status are chosen for the analysis to make all these different types of defects comparable. For example: for a single longitudinal crack in RCP, its ultimate length is as long as the pipe, the max width is around 2 mm according to TEB tests, and for material deterioration, the worst situation is that the whole part is deteriorated to C30 strength. As a result, these conditions are set as the worst defective conditions, and the median parameters (i.e., 1 mm crack width; half length; half deteriorating depth; median parameters of concrete materials, etc.) are chosen as the secondary defective conditions. Moreover, to eliminate the uncertainty of specific loading capacity and gain better uniformity, all these conditions are then compared with the intact tunnels, and the reduction ratio was applied to characterize the residual-bearing capacity of defective tunnels. The defective-model failure load to intact-model failure load ratios of all groups were shown in
Table 4 and
Figure 13.
According to the modelling results, the failure load of the intact circular cable tunnel model is 55.2 kN/m, while Chinese Standard GB11836 [
26] suggested that for level II reinforced concrete pipe with the same inner diameter of 600 mm, which is widely used for municipal buried structures, its failure load should reach 60 kN/m. Therefore, the tunnel model established in this paper is credible and it can meet the criteria of application in practice.
Comparing the groups of different types with the same defections, it can be learnt that the trenched type of cable tunnel has the highest failure load, as shown in
Figure 13a. This is because the rigid cover distributes the D-load to the two surfaces of lateral walls, and the gravity of rigid cover is not considered.
The defective-model failure load to intact-model failure load ratios from 80% to 100% are divided into three zones, which are represented as red (80–90%), yellow (90–95%) and green (95–100%), as shown in
Figure 12b. It can be learnt that groups with material deterioration defects are all distributed in yellow and green zones, while part or all of the cracked models are distributed in the red zone in groups 1–5.
By calculating the ratio of the failure load of the intact model to the failure load of the defective model and taking the average value of the four types of cross sections, an average reduction ratio of the failure load of tunnel model can be inferred for each group. It can be found from the results that the failure load reduction ratio caused by crack defects is 6.57% at the lowest and 14.35% at the highest; however, the failure load reduction ratio caused by the deterioration of concrete materials is only 2.78% at the lowest and 7.13% at the highest. This result suggested that the cracks more significantly influenced the residual-bearing capacities of the tunnel models than material deteriorations, especially the crack development towards the depth.
4. Conclusions and Discussion
The following conclusions can be drawn from this study:
In this study, FEM models of four common types of cable tunnels are established, in which the concrete damage plasticity (CDP) model is used to characterize the failure process of concrete materials. The constitutive models of C30-, C40- and C50-level concrete materials are established. With the constitutive model of C50 concrete, the failure load of the intact circular model reached to 55.2 kN/m, which can meet the criteria of application in practice, according to the Chinese design charts.
For crack defects, this paper investigates the effect of crack development in three dimensions: length, width and depth, on the residual-bearing capacity of defective tunnels. The average decrease in the failure load of the four types of cable tunnel models was 7.79% when the cracks developed along the depth direction, and 3.50% and 3.65% along the width and length directions, respectively. It can be learnt that the crack depth is the main factor affecting the residual-bearing capacity of the structure.
For concrete deterioration defects, this paper investigates the effect of the degree and the depth of concrete deterioration on the residual-bearing capacity of the cable tunnels. When the degree of deterioration gets worse, the failure loads of four types of cable tunnel models decreased by an average of 4.18%, while when the depth of deterioration increased, the failure loads of the four types of cable tunnel model decreased by an average of 4.35%. Overall, the degree of concrete deterioration and the depth of deterioration had a comparable effect on the residual-bearing capacity of cable tunnel structures.
According to the average reduction ratio of the failure load of the tunnel model of each group, it can be learnt that the failure load reduction ratio caused by crack defects is 6.57% at the lowest and 14.35% at the highest, whereas the failure load reduction ratio caused by the deterioration of concrete materials is only 2.78% at the lowest and 7.13% at the highest, which suggests that the loading capacity reduction caused by concrete deteriorating is more insignificant comparing to that caused by cracking defects.
In general, the impact of concrete cracking on the residual-bearing capacity of cable tunnel structures is greater than that of concrete deterioration, and the impact of crack depth on the failure load of defective structure is particularly obvious, because concrete deterioration is a long-term process which can be effectively resisted by a concrete protection layer. However, once the cracks propagate at the dangerous sections of the structure, they will rapidly penetrate the structure and cause the decrease of the compression zone height and sharp reduction in the stiffness of the section, which is fatal to the performance of tunnel structures.
There are still many shortcomings in this paper, for example, in order to focus on the structural behavior of tunnel models, their interactions with surrounding soils are not considered in burial conditions, and this can be a research direction in the future. Moreover, constrained by the single-variable control method, this paper only studies the influence of each defect parameter individually, and it could be a promising research direction to combine advanced non-destructive testing and digital modelling techniques for tunnel structures, restoring the defective structure situation in the actual project and evaluating the load-carrying capacity of the structure under the coupled action of multiple defects by combining the intrinsic structure model and modelling methods in this paper.
Author Contributions
Conceptualization, Z.Z. and P.Z.; Data curation, H.L. Formal analysis, J.L. (Junbo Liu) Funding acquisition, Z.W.; Investigation, Y.Z., Z.W. and L.J.; Methodology, J.L. (Jingyao Luan) and H.L.; Project administration, J.L. (Junbo Liu); Supervision, H.L. and J.L. (Junbo Liu); Writing–original draft, H.L.; Writing–review & editing, Z.Z. and P.Z. All authors have read and agreed to the published version of the manuscript.
Funding
This research is supported by the technology program of State Grid Co., Ltd. of China. Project Code: SGTYHT/19-JS-215.
Institutional Review Board Statement
Not applicable.
Informed Consent Statement
Not applicable.
Data Availability Statement
Some or all data, models, or code that support the findings of this study are available from the corresponding author upon reasonable request.
Conflicts of Interest
The authors declare no conflict of interest.
References
- Ma, B.S. Trenchless Pipeline Rehabilitation and Renewal Technology; China Communications Press: Beijing, China, 2014. [Google Scholar]
- Chen, X.X.; Li, G.F.; Wu, Q. Classification and Prevent Method of Common Diseases in the Electric Power Tunnel. Electr. Power Surv. Des. 2015, 2, 10–14. (In Chinese) [Google Scholar]
- Zhu, Z.; Ma, B.; Zeng, Z.; Gong, C.; Mei, Z.; Hu, J.; Zhang, P. Discussion on the Defects and Its Inspection and Evaluation Methods for Power Cable Tunnels. Chin. J. Undergr. Space Eng. 2019, 15, 311–318. (In Chinese) [Google Scholar]
- Zhu, Z.; Ma, B.; Zeng, Z.; Gong, C.; Mei, Z.; Hu, J.; Zhang, P. Development Present Situation and the Analysis of Common Disasters of Existing Electric Power Tunnel in Beijing. Constr. Qual. 2016, 34, 75–78. (In Chinese) [Google Scholar]
- Ma, B.S. The Science of Trenchless Engineering; China Communications Press: Beijing, China, 2008. [Google Scholar]
- Ming, L.; Lei, H.; Baosong, M.; Tianyu, W.; Zihao, Z. Structure Failure and Rehabilitation Technologies of the Cable Tunnel. Bull. Geol. Sci. Technol. 2020, 39, 31–37. (In Chinese) [Google Scholar]
- Najafi, M. Trenchless Technology Piping; ASCE Press: Reston, VA, USA, 2010. [Google Scholar]
- Moore, I.D. Buried pipes and culverts. In Geotechnical and Geo-Environmental Engineering Handbook; Springer: Boston, MA, USA, 2001; pp. 541–567. [Google Scholar]
- Tehrani, A.D. Finite Element Analysis for ASTM C-76 Reinforced Concrete Pipes with Reduced Steel Cage; University of Texas Arlington: Arlington, TX, USA, 2016. [Google Scholar]
- Mohamed, N.; Nehdi, M.L. Rational finite element assisted design of precast steel fiber reinforced concrete pipes. Eng. Struct. 2016, 124, 196–206. [Google Scholar] [CrossRef]
- Ferrado, F.L.; Escalante, M.R.; Rougier, V.C. Numerical simulation of the three-edge bearing test of steel fiber reinforced concrete pipes. Mecánica Comput. 2016, 34, 2329–2341. [Google Scholar]
- Riahi, E. Evaluation of Structural Capacity of Epoxy-Coated Concrete Pipes and Its Interaction with Soil; University of Texas Arlington: Arlington, TX, USA, 2016. [Google Scholar]
- Younis, A.-A.; Shehata, A.; Ramadan, A.; Wong, L.S.; Nehdi, M.L. Modeling structural behavior of reinforced-concrete pipe with single, double and triple cage reinforcement. Eng. Struct. 2021, 240, 112374. [Google Scholar] [CrossRef]
- Ge, S.; Sinha, S. Effect of mortar coating’s bond quality on the structural integrity of prestressed concrete cylinder pipe with broken wires. J. Mater. Sci. Res. 2015, 4, 59–75. [Google Scholar] [CrossRef]
- Zarghamee, M.S.; Moharrami, M. Experimental study and numerical simulation of three-edge bearing test of large diameter prestressed concrete cylinder pipes. In Pipelines 2018: Condition Assessment, Construction, and Rehabilitation; American Society of Civil Engineers: Reston, VA, USA, 2018; pp. 776–787. [Google Scholar]
- GB 50010-2010; Code for Design of Concrete Structures. Ministry of Housing and Urban-Rural Development of the People’s Republic of China (MOHURD): Beijing, China, 2010.
- Wang, T.; Zhao, Y.; Ma, B.; Zeng, C. Durability Study on High-Performance Fiber-Reinforced Mortar under Simulated Wastewater Pipeline Environment. Materials 2021, 14, 3781. [Google Scholar] [CrossRef] [PubMed]
- Wang, F.; Wang, S.; Wang, J.; Zhuang, W. Experimental Analysis of Mechanical Deterioration Behavior of Concrete with Different strength. Concrete 2020, 5, 12–13+18. (In Chinese) [Google Scholar]
- Li, Q.; Kuang, Y.; Guo, W. CDP model parameters calculation and value method verification. J. Zhengzhou Univ. 2021, 42, 43–48. (In Chinese) [Google Scholar]
- Liu, W.; Xu, M.; Chen, Z. Parameters calibration and verification of concrete damage plasticity model of ABAQUS. Ind. Constr. 2014, 44 (Suppl. S1), 167–171+213. (In Chinese) [Google Scholar]
- Zhao, Y.; Ma, B.; Ariaratnam, S.T.; Zeng, C.; Yan, X.; Wang, F.; Zhu, Z. Structural performance of damaged rigid pipe rehabilitated by centrifugal spray on mortar liner. Tunn. Undergr. SpaceTechnol. 2021, 116, 104117. [Google Scholar] [CrossRef]
- Kmiecik, P.; Kamiński, M. Modelling of reinforced concrete structures and composite structures with concrete strength degradation taken into consideration. Arch. Civil Mech. Eng. 2011, 11, 623–636. [Google Scholar] [CrossRef]
- Ramadan, A.; Shehata, A.; Younis, A.-A.; Wong, L.S.; Nehdi, M.L. Modeling structural behavior of precast concrete pipe with single elliptical steel cage reinforcement. Structures 2020, 27, 903–916. [Google Scholar] [CrossRef]
- Birtel, V.; Mark, P. Parameterised finite element modelling of R.C. beam shear failure. In Proceedings of the ABAQUS Users’ Conference, Boston, MA, USA, 23–25 May 2006; pp. 95–108. [Google Scholar]
- GB/T 16752-2017; Test Methods of Concrete and Reinforced Concrete Sewer Pipes. Standardization Administration of the P.R.C.: Beijing, China, 2017.
- GB/T 11836-2009; Concrete and Reinforced Concrete Sewer Pipes. Standardization Administration of the P.R.C.: Beijing, China, 2009.
Figure 1.
Different types of cable tunnel.
Figure 1.
Different types of cable tunnel.
Figure 2.
Geometric models of (a) Circular; (b) Rectangular; (c) Arched and (d) Cable trench type cable tunnels.
Figure 2.
Geometric models of (a) Circular; (b) Rectangular; (c) Arched and (d) Cable trench type cable tunnels.
Figure 3.
(a) FEM models of cracked cable tunnels and (b) detailed dimensions of cracks.
Figure 3.
(a) FEM models of cracked cable tunnels and (b) detailed dimensions of cracks.
Figure 4.
FEM model of half-deteriorated cable tunnel.
Figure 4.
FEM model of half-deteriorated cable tunnel.
Figure 5.
Stress-strain curves for (a) compressive and (b) tensile behaviors of C30–C50 concrete materials.
Figure 5.
Stress-strain curves for (a) compressive and (b) tensile behaviors of C30–C50 concrete materials.
Figure 6.
Boundary and loading conditions of the FEM model.
Figure 6.
Boundary and loading conditions of the FEM model.
Figure 7.
Meshed FEM models of (a) circular, (b) rectangular and (c) arched sections.
Figure 7.
Meshed FEM models of (a) circular, (b) rectangular and (c) arched sections.
Figure 8.
Effect of crack length on (a) circular; (b) rectangular; (c) arched; and (d) trenched cable tunnels.
Figure 8.
Effect of crack length on (a) circular; (b) rectangular; (c) arched; and (d) trenched cable tunnels.
Figure 9.
Effect of crack width on (a) circular; (b) rectangular; (c) arched; and (d) trenched cable tunnels.
Figure 9.
Effect of crack width on (a) circular; (b) rectangular; (c) arched; and (d) trenched cable tunnels.
Figure 10.
Effect of crack depth on (a) circular; (b) rectangular; (c) arched; and (d) trenched cable tunnels.
Figure 10.
Effect of crack depth on (a) circular; (b) rectangular; (c) arched; and (d) trenched cable tunnels.
Figure 11.
Effect of degree of deterioration on (a) circular; (b) rectangular; (c) arched; and (d) trenched cable tunnels.
Figure 11.
Effect of degree of deterioration on (a) circular; (b) rectangular; (c) arched; and (d) trenched cable tunnels.
Figure 12.
Effect of depth of deterioration on (a) circular; (b) rectangular; (c) arched; and (d) trenched cable tunnels.
Figure 12.
Effect of depth of deterioration on (a) circular; (b) rectangular; (c) arched; and (d) trenched cable tunnels.
Figure 13.
(a) Failure loads of all groups; (b) The defective model failure load to intact model failure load ratios.
Figure 13.
(a) Failure loads of all groups; (b) The defective model failure load to intact model failure load ratios.
Table 1.
Groups of cracked cable tunnel modelling.
Table 1.
Groups of cracked cable tunnel modelling.
| 1 | 2 | 3 | 4 | 5 |
|---|
| C1 * | R1 | A1 | T1 | C2 | R2 | A2 | T2 | C3 | R3 | A3 | T3 | C4 | R4 | A4 | T4 | C5 | R5 | A5 | T5 |
|---|
| Crack length/Tunnel length | 0 | 100% | 100% | 50% | 100% |
| Crack depth | 0 | 12 mm | 24 mm | 24 mm | 12 mm |
| Crack Width | 0 | 1 mm | 1 mm | 1 mm | 2 mm |
Table 2.
Groups of concrete deteriorated cable tunnel modelling.
Table 2.
Groups of concrete deteriorated cable tunnel modelling.
| | 6 | 7 | 8 |
|---|
| C6 | R6 | A6 | T6 | C7 | R7 | A7 | T7 | C8 | R8 | A8 | T8 |
|---|
| Degree of concrete deterioration | C30 | C30 | C40 |
| Deterioration depth/Wall thickness | 50% | 100% | 100% |
Table 3.
Properties of concrete and steel materials applied in the constitutive model.
Table 3.
Properties of concrete and steel materials applied in the constitutive model.
| | | | | | | | | |
|---|
| Riahi, 2016 [12] | Concrete | - | - | 38 | 0.1 | 1.16 | 0.667 | 10−7 |
| Tehrani, 2016 [9] | Concrete | - | - | 30–40 | 0.1 | 1.16 | 0.667 | 0.001 |
| This study | C30 concrete | 30 | 0.25 | 38 | 0.1 | 1.16 | 0.667 | 0.001 |
| C40 concrete | 32.5 |
| C50 concrete | 34.5 |
| HPB300 reinforcement | 210 | 0.3 | - |
Table 4.
Defective-model failure load to intact-model failure load ratios and failure loads of all groups.
Table 4.
Defective-model failure load to intact-model failure load ratios and failure loads of all groups.
| | C * (kN) | Ci/C1% ** | R(kN) | Ri/R1% | A(kN) | Ai/A1% | T(kN) | Ti/T1% | rfl,ave *** |
|---|
| 1 | 55.15 | 100 | 47.02 | 100 | 44.57 | 100 | 84.74 | 100 | 100 |
| 2 | 54.61 | 99.02 | 44.08 | 93.76 | 39.56 | 88.76 | 78.13 | 92.19 | 93.43 |
| 3 | 47.44 | 86.05 | 41.91 | 89.14 | 36.57 | 82.05 | 72.33 | 85.34 | 85.65 |
| 4 | 50.38 | 91.34 | 43.87 | 93.31 | 38.16 | 85.62 | 73.64 | 86.90 | 89.29 |
| 5 | 54.30 | 98.44 | 41.80 | 88.90 | 36.38 | 81.63 | 76.91 | 90.75 | 89.93 |
| 6 | 54.95 | 99.63 | 45.10 | 95.93 | 43.44 | 97.47 | 81.23 | 95.84 | 97.22 |
| 7 | 50.84 | 92.18 | 43.98 | 93.54 | 42.00 | 94.24 | 77.56 | 91.51 | 92.87 |
| 8 | 53.33 | 96.68 | 46.50 | 98.90 | 43.21 | 96.97 | 81.05 | 95.65 | 97.05 |
| Publisher’s Note: MDPI stays neutral with regard to jurisdictional claims in published maps and institutional affiliations. |
© 2022 by the authors. Licensee MDPI, Basel, Switzerland. This article is an open access article distributed under the terms and conditions of the Creative Commons Attribution (CC BY) license (https://creativecommons.org/licenses/by/4.0/).


 ,
, 


