Article

Degradation Mechanisms of Early Strength for High-Fluidization Cement Mortar under Magnesium Sulfate Corrosion

1
School of Civil and Architectural Engineering, Shandong University of Technology, Zibo 255000, China
2
School of Fine Art, Shandong University of Technology, Zibo 255000, China
*
Author to whom correspondence should be addressed.
Buildings 2022, 12(9), 1376; https://doi.org/10.3390/buildings12091376
Submission received: 18 July 2022 / Revised: 27 August 2022 / Accepted: 31 August 2022 / Published: 3 September 2022
(This article belongs to the Section Building Materials, and Repair & Renovation)

Abstract

:
High-fluidization and early strength cement mortar (HECM) has been widely adopted in various fields of civil engineering. Due to the complexity of the engineering environment, sulfate corrosion cannot be ignored for the HECM. Although the effect of sulfate on the properties of the cement-based materials has been addressed, the degradation mechanisms of the HECM in the case of sulfate corrosion are not clear because of the distinct characteristics of the HECM (e.g., early strength and high fluidization) compared with conventional cement-based materials. Hence, considering the more complex corrosion process of magnesium sulfate, the early flexural and compressive strength of the HECM in the case of different magnesium sulfate concentrations and testing ages are investigated in this study. Moreover, the effects of magnesium sulfate concentrations and corrosion times on the microstructure and hydration products of the HECM are analyzed via a Scanning Electron Microscope (SEM) test, an X-ray diffraction (XRD) test, and a Differential Scanning Calorimeter (DSC) test. Finally, the influence mechanisms of the magnesium sulfate on the early strength formation of the HECM are analyzed to reveal the degradation mechanisms of the HECM.

1. Introduction

Due to complex service conditions, some diseases (e.g., crack, void, etc.) will invariably occur in civil engineering structures [1]. The grouting is one of the most efficient and common methods for the rapid repairment and reinforcement of the civil engineering structures [2]. High-fluidization and early strength cement mortar (HECM) is one type of grouting material, which has been widely used in repairment and reinforcement engineering [3].
On the other hand, due to the complicacy of the engineering environments in which the infrastructures are located, civil engineering structures are inevitably corroded by sulfates [4]. For instance, the constructions near the ocean or salt lakes are corroded by chloride ions, magnesium ions, sulfate ions, etc. [5]. Cement-based materials are more susceptible to sulfate corrosion, owing to the sulfates taking part in hydration reactions. Hence, degradation mechanisms of cement-based materials under the action of sulfate have been widely addressed in previous studies.
Ding et al. [6] investigated the chemical corrosion resistance of magnesium phosphosilicate cement in magnesium sulfate solutions. Li et al. [7] indicated that the corrosion resistance of the concrete to sulfate can be dramatically improved by the magnesium phosphate cement protective layer. The same conclusion was addressed by Li et al. [8]. Cheng et al. [9] demonstrated that the presence of magnesium ion accelerates chloride ingress into the concrete construction, while sulfate ion can inhibit the chloride diffusion. Zhao et al. [10] simulated the corrosion process of partially exposed concrete in the environment of internal sulfate, external sulfate–magnesium multiple combined attack. Pinto et al. [11] revealed that the super sulfated cements mortar showed good durability against sodium sulfate attack but presented expansive behavior when exposed to magnesium sulfate. Cheng et al. [12] addressed that the presence of sulfate and magnesium ion in the chloride environment increases the porosity and pore volume of cement mortar, which accelerates the ingress of corrosive ions. Yu et al. [13] investigated the microstructural evolution process of concrete under chemical attack by magnesium sulfate solution, salt crystallization attack through dry–wet cycles, and bending stress. Wang et al. [14] analyzed the hydration products, microstructure, and mechanical properties of cement-based materials to clarify the role of limestone powder (LP) in cement mortars under a magnesium sulfate solution. Yao et al. [15] and Lee et al. [16] found that Mg2+ or Mg2+ and Cl could enhance the corrosion effect of SO42− on cement materials. It can be found that sulfate corrosion plays an important role in the performance of cement-based civil structure. Particularly, the influence mechanisms of magnesium sulfate are more significant and complex than other sulfates. Hence, it is more representative to analyze the corrosion mechanisms of magnesium sulfate on cement-based civil materials. Obviously, as the repair material used in civil engineering structure, the degradation process of the HECM under magnesium sulfate corrosion is also worthy of investigation.
Hydration products are the main source for the strength of cement-based materials. The corrosion of magnesium sulfate will adversely affect the formation of hydration products, so as to weaken the mechanical strength of cement-based materials. Wang et al. [14] introduced that the main hydration products of cement mortar immersed in 5% MgSO4 solution for up to 9 months are gypsum, ettringite, and calcium hydroxide. Li et al. [17] employed the GEMS model to simulate the influence of magnesium ion on cement hydration in the salt corrosion environment and found that magnesium ion delayed the formation of Aft and CH crystals. Xu et al. [18] and Li et al. [19] also carried out similar research. Zhang et al. [20] showed that SO42−, Na+, Mg2+, and Cl had an effect on the stability of ettringite. Wu et al. [21] proved that the corrosion products of Portland cement blended with limestone powder immersed in a scenario of magnesium sulfate solution were gypsum coupled with thaumasite. Sun et al. [22] investigated the potential synergistic effects between chloride and sulfate ions on the deterioration of reinforced cement-based materials. Zhang et al. [23] demonstrated that reducing the pH value of sulfate solution facilitates the formation and precipitation of columnar and platelet gypsum crystals in cement paste, whereas it inhibits the ettringite formation.
According to the above literature review, the previous studies mainly focus on the conventional cement-based civil materials. Considering the characteristics of high-fluidization and early strength of the HECM, the hydration process and strength formation of the HECM under the magnesium sulfate corrosion are consequentially different from the conventional cement-based materials, though there are few studies on this. Hence, the objective of this study is to reveal the degradation mechanisms of strength formation of the HECM under the magnesium sulfate corrosion.
Hence, the flexural and compressive strength of the HECM in the case of different magnesium sulfate concentrations and corrosion times are investigated in this study. Moreover, the influence of magnesium sulfate concentrations and corrosion times on the microstructure and hydration products of the HECM are analyzed via SEM test, XRD test, and DSC test. Finally, the degradation mechanisms of the early strength formation for the HECM under the magnesium sulfate corrosion are revealed. This study is useful to specifically optimize the composition design of the HECM to ensure early strength formation, aiming at some special engineering conditions.

2. Materials and Methods
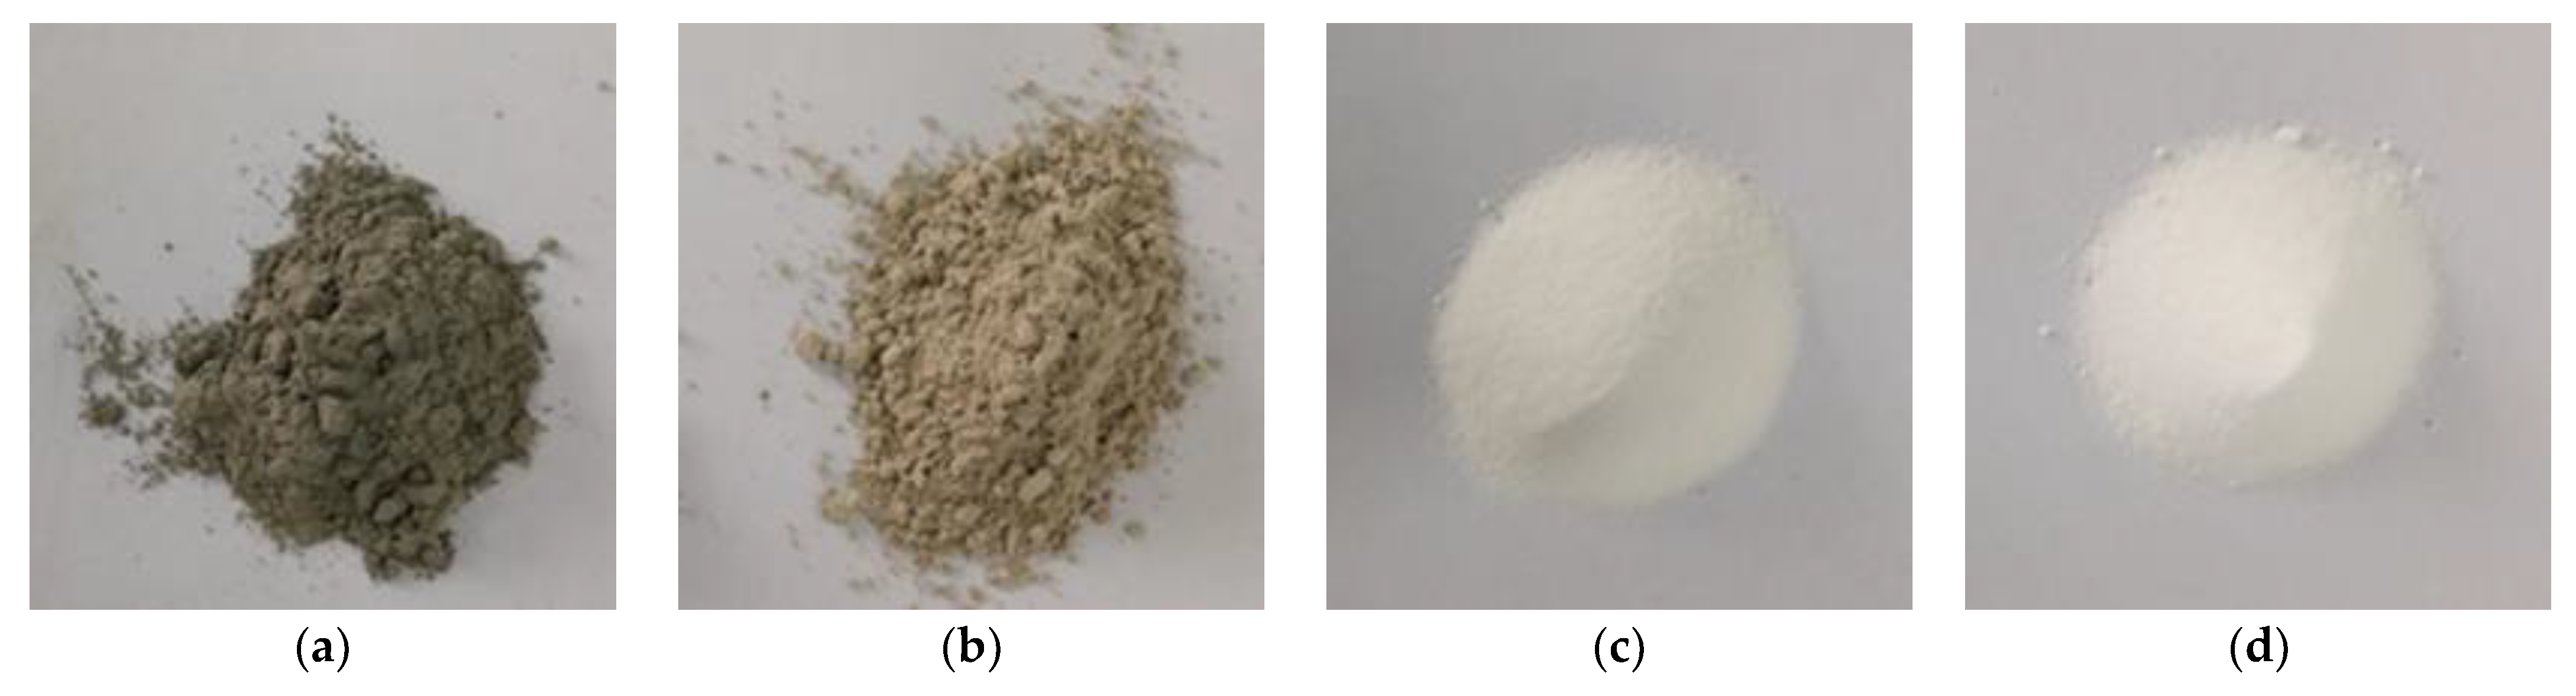
2.1. Materials

2.1.1. Cement and Admixture

Shanlv P. O. 42.5R cement, accelerating agent, water-reducing agent, and UEA expansion agent are adopted to prepare the HECM in this study, which are provided by the manufacturers. The cement is provided by Shandong Shanlv Cement Co., Ltd., Zibo, China. The other three admixtures are all produced by Laiyang Hongxiang Construction Admixture Factory. Their macro morphology is shown in Figure 1. Their properties can be found in our previous study [3].
The technological parameters of the HECM are listed in Table 1, which are measured via laboratory experiments. The performance standard comes from the Chinese standard [24]. It can be found that the performance of the HECM is significantly higher than the performance standard.

2.1.2. Chemical Reagent

The water required for corrosion solution is tap water. The chemical reagent used is magnesium sulfate (MgSO4), which was produced by Tianjin Guangfu Fine Chemical Research Institute. The technical parameters of MgSO4 are presented in Table 2. The macroscopic morphology and the SEM microscopic image are shown in Figure 2.

2.2. Methods

2.2.1. Preparation of the HECM

The HECM is prepared according to the following steps. The base mix ratio of the HECM is 0.56 water cement ratio, 2.5% accelerating agent, 5% UEA expansion agent, and 1.2% water-reducing agent. The size of the HECM strength specimen is 40 mm × 40 mm × 160 mm.
  • Calculate and weigh the quality of water, cement, accelerating agent, expansion agent, and water-reducing agent according to the base mix ratio.
  • Mix the accelerating agent, expansion agent, and water-reducing agent evenly, and then mix evenly with cement. Pour in the water while stirring. Before pouring the mold, stir the cement mortar for two minutes.
  • Pour the cement mortar into a mold that has been brushed with kerosene. Vibrate the mold to discharge bubbles and scrape the surface of the mold with a scraper.
  • Put the test specimens into the curing box for one day.

2.2.2. Preparation and Corrosion Methods of MgSO4 Solution

The corrosion test includes the corrosion of microscopic test specimens and the corrosion of macroscopic mechanical strength test specimens. When preparing the solution, it is necessary to configure the corrosion solution in 10 mL bottles and barrels. The concentration of MgSO4 is 3%, 6%, 9%, and 12%. The preparation and corrosion methods of MgSO4 solution are as follows.
  • Calculate and weigh the MgSO4 powder mass and water volume that correspond to different concentrations.
  • Pour the MgSO4 powder into the water and stir until the powder is dissolved. MgSO4 solution is prepared.
  • Pour the prepared solution into the plastic bottle which corroded the microscopic specimens and the bucket which corroded the macroscopic specimens.
  • Put the test specimens into the MgSO4 solution and record the corrosion time.

2.2.3. Preparation of the Microscopic Test Specimens

The microscopic test specimens are prepared according to the following steps.
  • Prepare the standard cuboid specimens (4 cm × 4 cm × 16 cm) according to the Chinese test standard “Test Method of Cement and Concrete for Highway Engineering” (JTG E30-2005) [25].
  • Cut the cuboid specimens into some cubic specimens (1 cm × 1 cm × 1 cm) and put the cubic specimens into the corrosion solution until they reach the target corrosion age.
  • Put the cubic specimens after corrosion into anhydrous ethanol for seven days to stop the hydration. The anhydrous ethanol must be replaced at least three times in seven days.
  • Break the cubic specimens into pieces. The outer and inner specimens of SEM tests can be prepared via selection from these pieces. The outer and inner specimens of XRD and DSC tests can be prepared by pulverizing the selected pieces.
  • The prepared SEM, XRD, and DSC specimens should be placed in the oven at 60 °C for at least 48 h.

2.2.4. Strength Test

The DYE-300S fully automatic flexural and compressive machine is adopted to carry out the flexural and compressive strength test of the HECM specimens. The strength tests are in accordance with the Chinese test standard “Test Method of Cement and Concrete for Highway Engineering (JTG E30-2005)” [25]. In the standard, strength tests are stipulated for implementation based on the force-controlled mode using specified loading speed. In the flexural test, the specimen is a cuboid of 160 mm × 40 mm × 40 mm, and the loading speed is 50 N/s. In the compressive test, the specimen adopts the broken specimen after flexural test, and the loading speed is 2.4 kN/s. Note that the effective contact area between specimen and indenter must be more than 40 mm × 40 mm in the compressive test. In addition, there is a difference between strength tests with force-controlled mode and displacement-controlled mode. This will be discussed in detail in future studies.

2.2.5. SEM Experiment

The TFiS Thermo Scientific Apreo S HiVac high-resolution field emission Scanning Electron Microscope is adopted in this study to observe the microscopic morphology of the HECM specimens at a magnification of 20,000 times. Its performance indicators are high vacuum resolution (SE secondary electron) and ultra-low-voltage resolution (0.9 nm @ 500 kV).

2.2.6. XRD Experiment

The Bruker AXS D8-02 Advance Polycrystalline X-ray Diffractometer from Karlsruhe, Germany is employed in this study, which is applied to conduct the XRD microscopic test. Performance indexes of the instrument: scanning range 2θ-4-152°, measurement accuracy 2θ ≤ ± 0.01°, angular resolution FWHM ≤ ±0.1, angle reproducibility ± 0.0001°. The scanning speed is 10 °/min and the scanning angle is 10–65° in this study.

2.2.7. DSC Experiment

In this study, SDT650 Differential Scanning Calorimeter from TA Company in the Newcastle, US is adopted to test the weight and heat changes in the HECM. The temperature range of the instrument is −90~450 °C, and the temperature accuracy is ±0.1 °C. The heating atmosphere is nitrogen in this study. The specimens of the DSC are the same as those of the XRD.

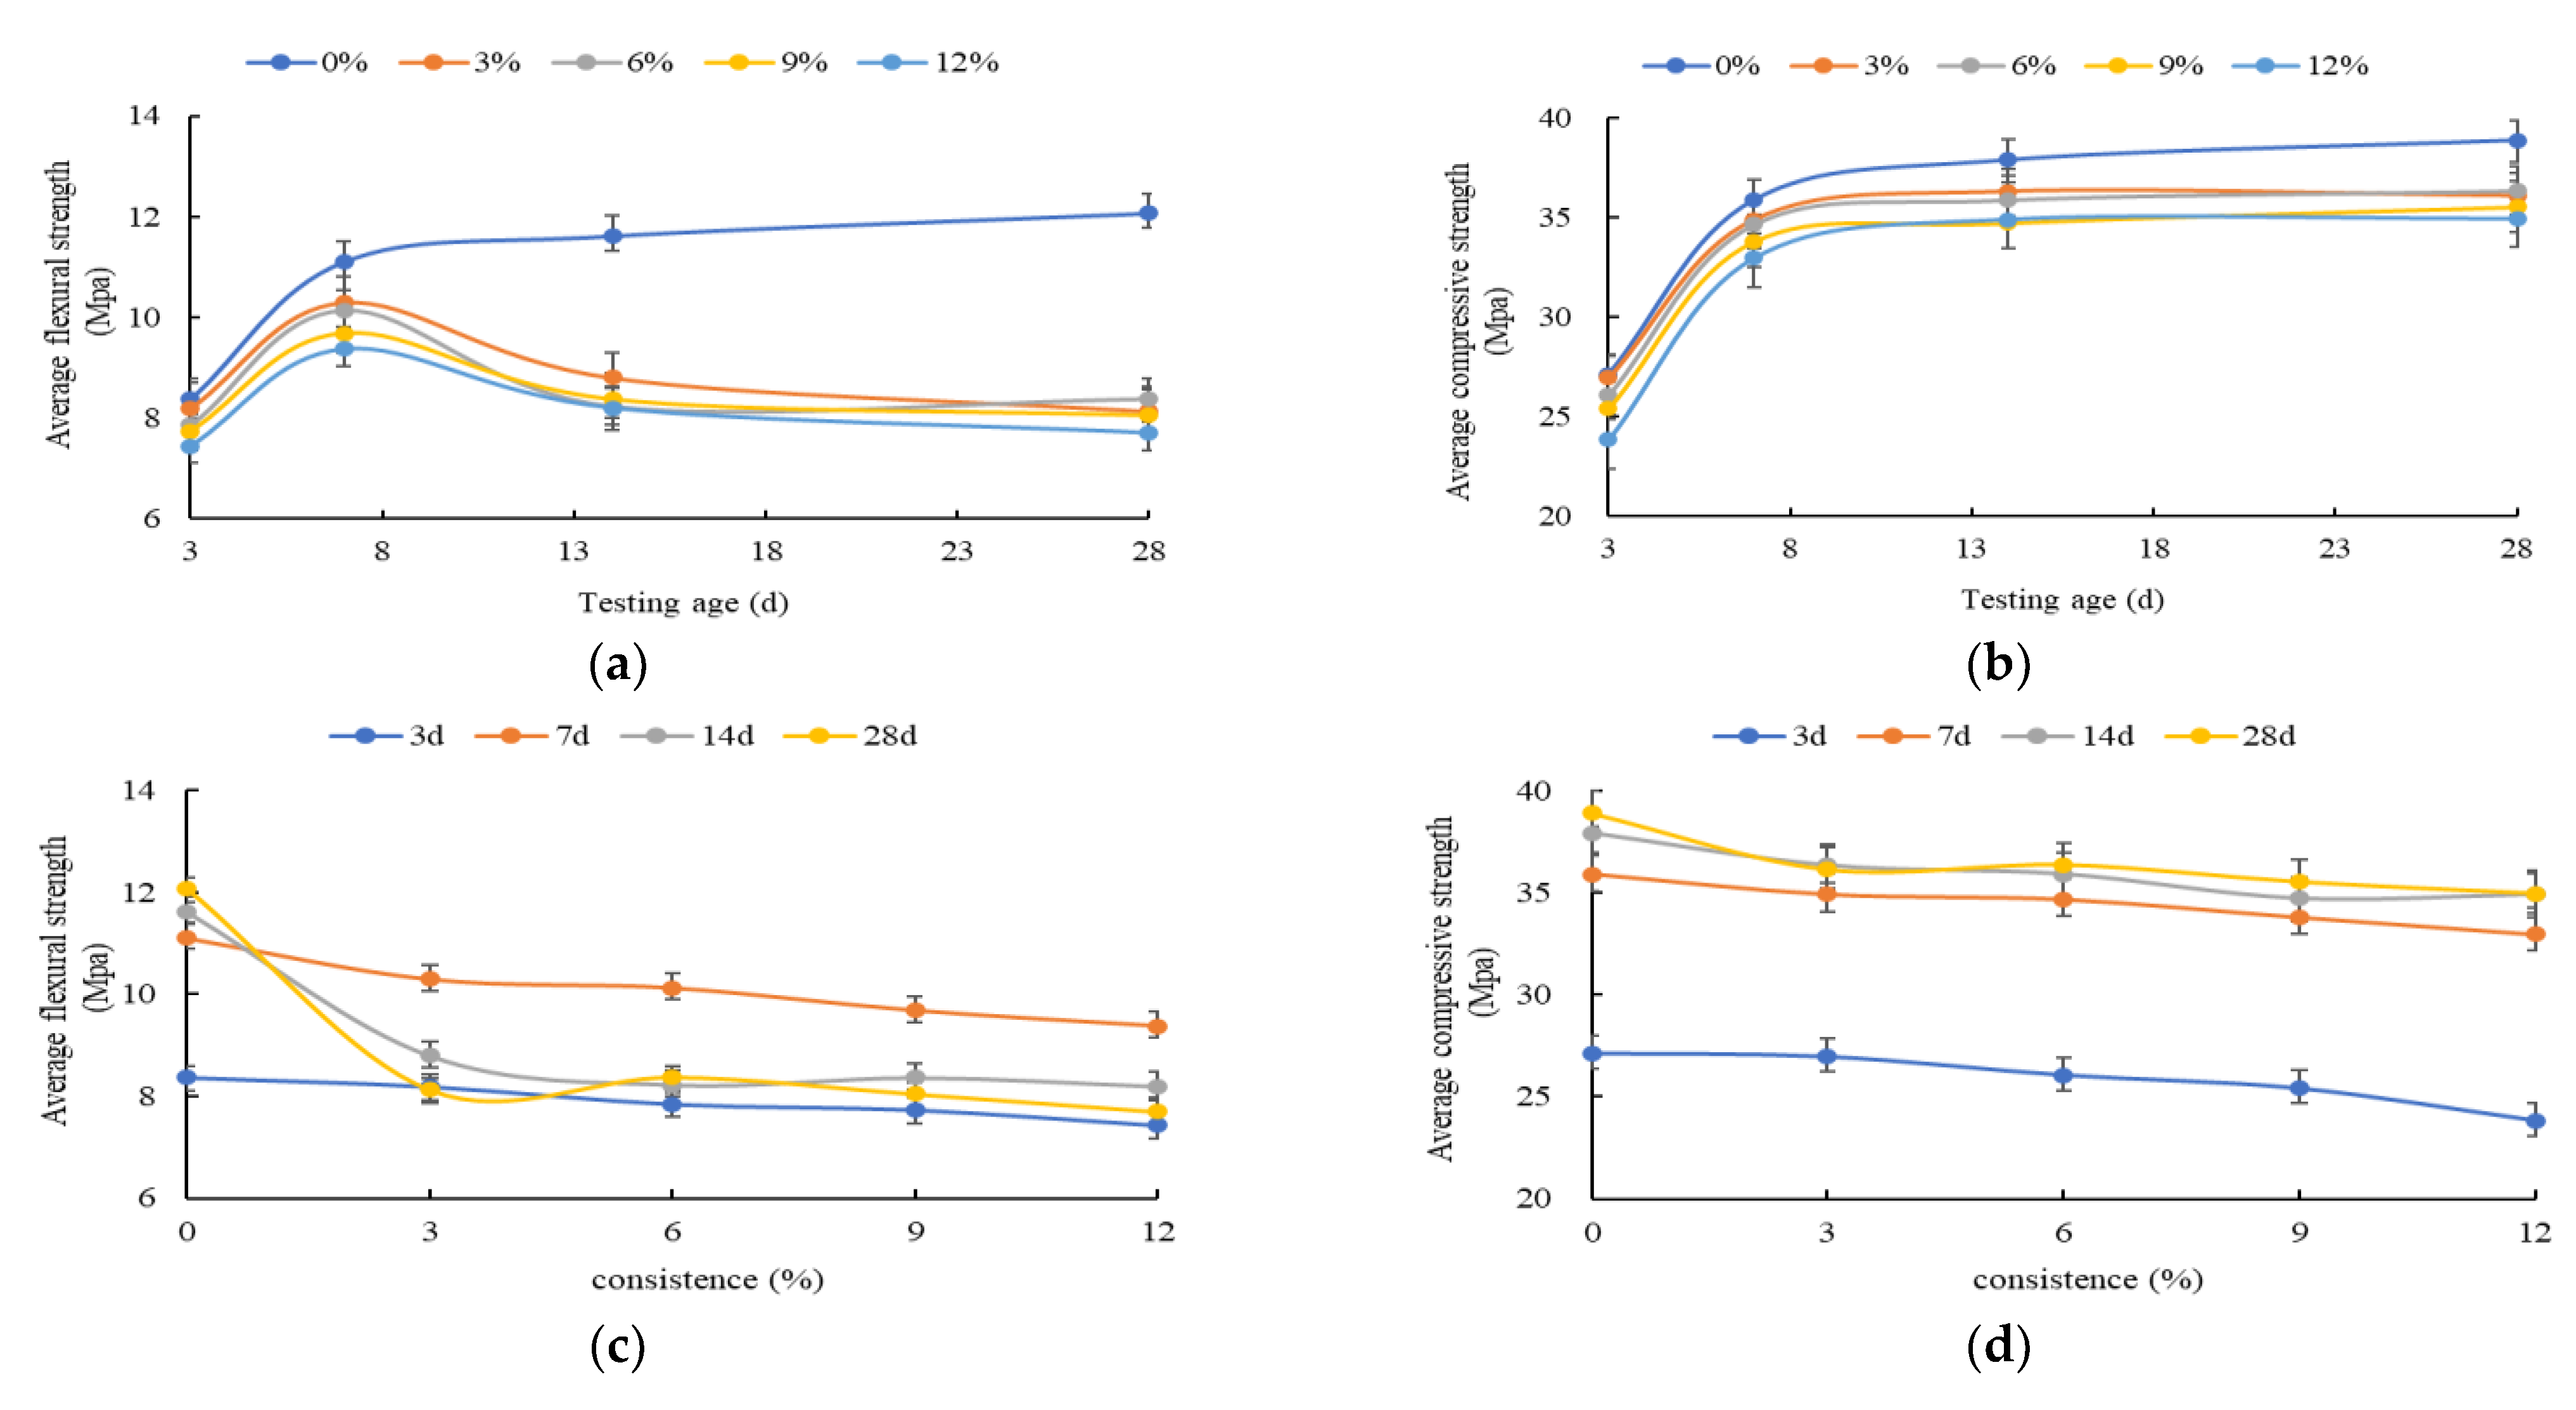
3. The Mechanical Strength Variation Law of the HECM

The flexural and compressive test results of the HECM are shown in Table 3.
The flexural and compressive strength curves are presented to display the strength variation with testing age and solution concentration, respectively, as shown in Figure 3.
As shown in Figure 3a,b, the flexural strength first increases and then decreases with the increases in testing age in the case of the same magnesium sulfate concentration. It reaches its maximum when the corrosion time reaches 7 days. The compressive strength keeps increasing, but gradually flattens out after 7 days. This is due to the fact that the corrosion is weaker than the hydration reaction of the HECM in the 7 days. The CH crystals and C-S-H gels generated by hydration reaction constitute the main source of the HECM strength [26]. Hence, the flexural strength and compressive strength increase rapidly. With the increase in the testing age, the hydration reaction of the HECM gradually terminates and corrosion takes the dominant role. Accordingly, the flexural strength of the HECM at the same solution concentration gradually decreases.
As shown in Figure 3c,d, the flexural strength and compressive strength of the HECM at different testing age gradually decrease with the increase in the concentration of magnesium sulfate solution. Simultaneously, the attenuation of the compressive strength is obviously weaker than the flexural strength at 7 days, 14 days, and 28 days of corrosion time. The reason is that in the corrosion condition of magnesium sulfate, in addition to the reaction between sulfate ion and CH crystal to produce gypsum, magnesium ion will also react with CH crystal to produce magnesium hydroxide with poor solubility. It will not only consume CH crystal and affect the hydration process, but it will also promote the transformation of C-S-H gel into M-S-H gel with weak cementation. Therefore, in the case of the dual effect of M-S-H gel and gypsum, the flexural strength and compressive strength of the HECM continue to decrease with the increase in magnesium sulfate solution concentration. However, the M-S-H gel still has a certain contribution to the compressive strength, which will offset the adverse effect of gypsum in the case of long corrosion time. Hence, the attenuation of the compressive strength is weaker than the flexural strength.

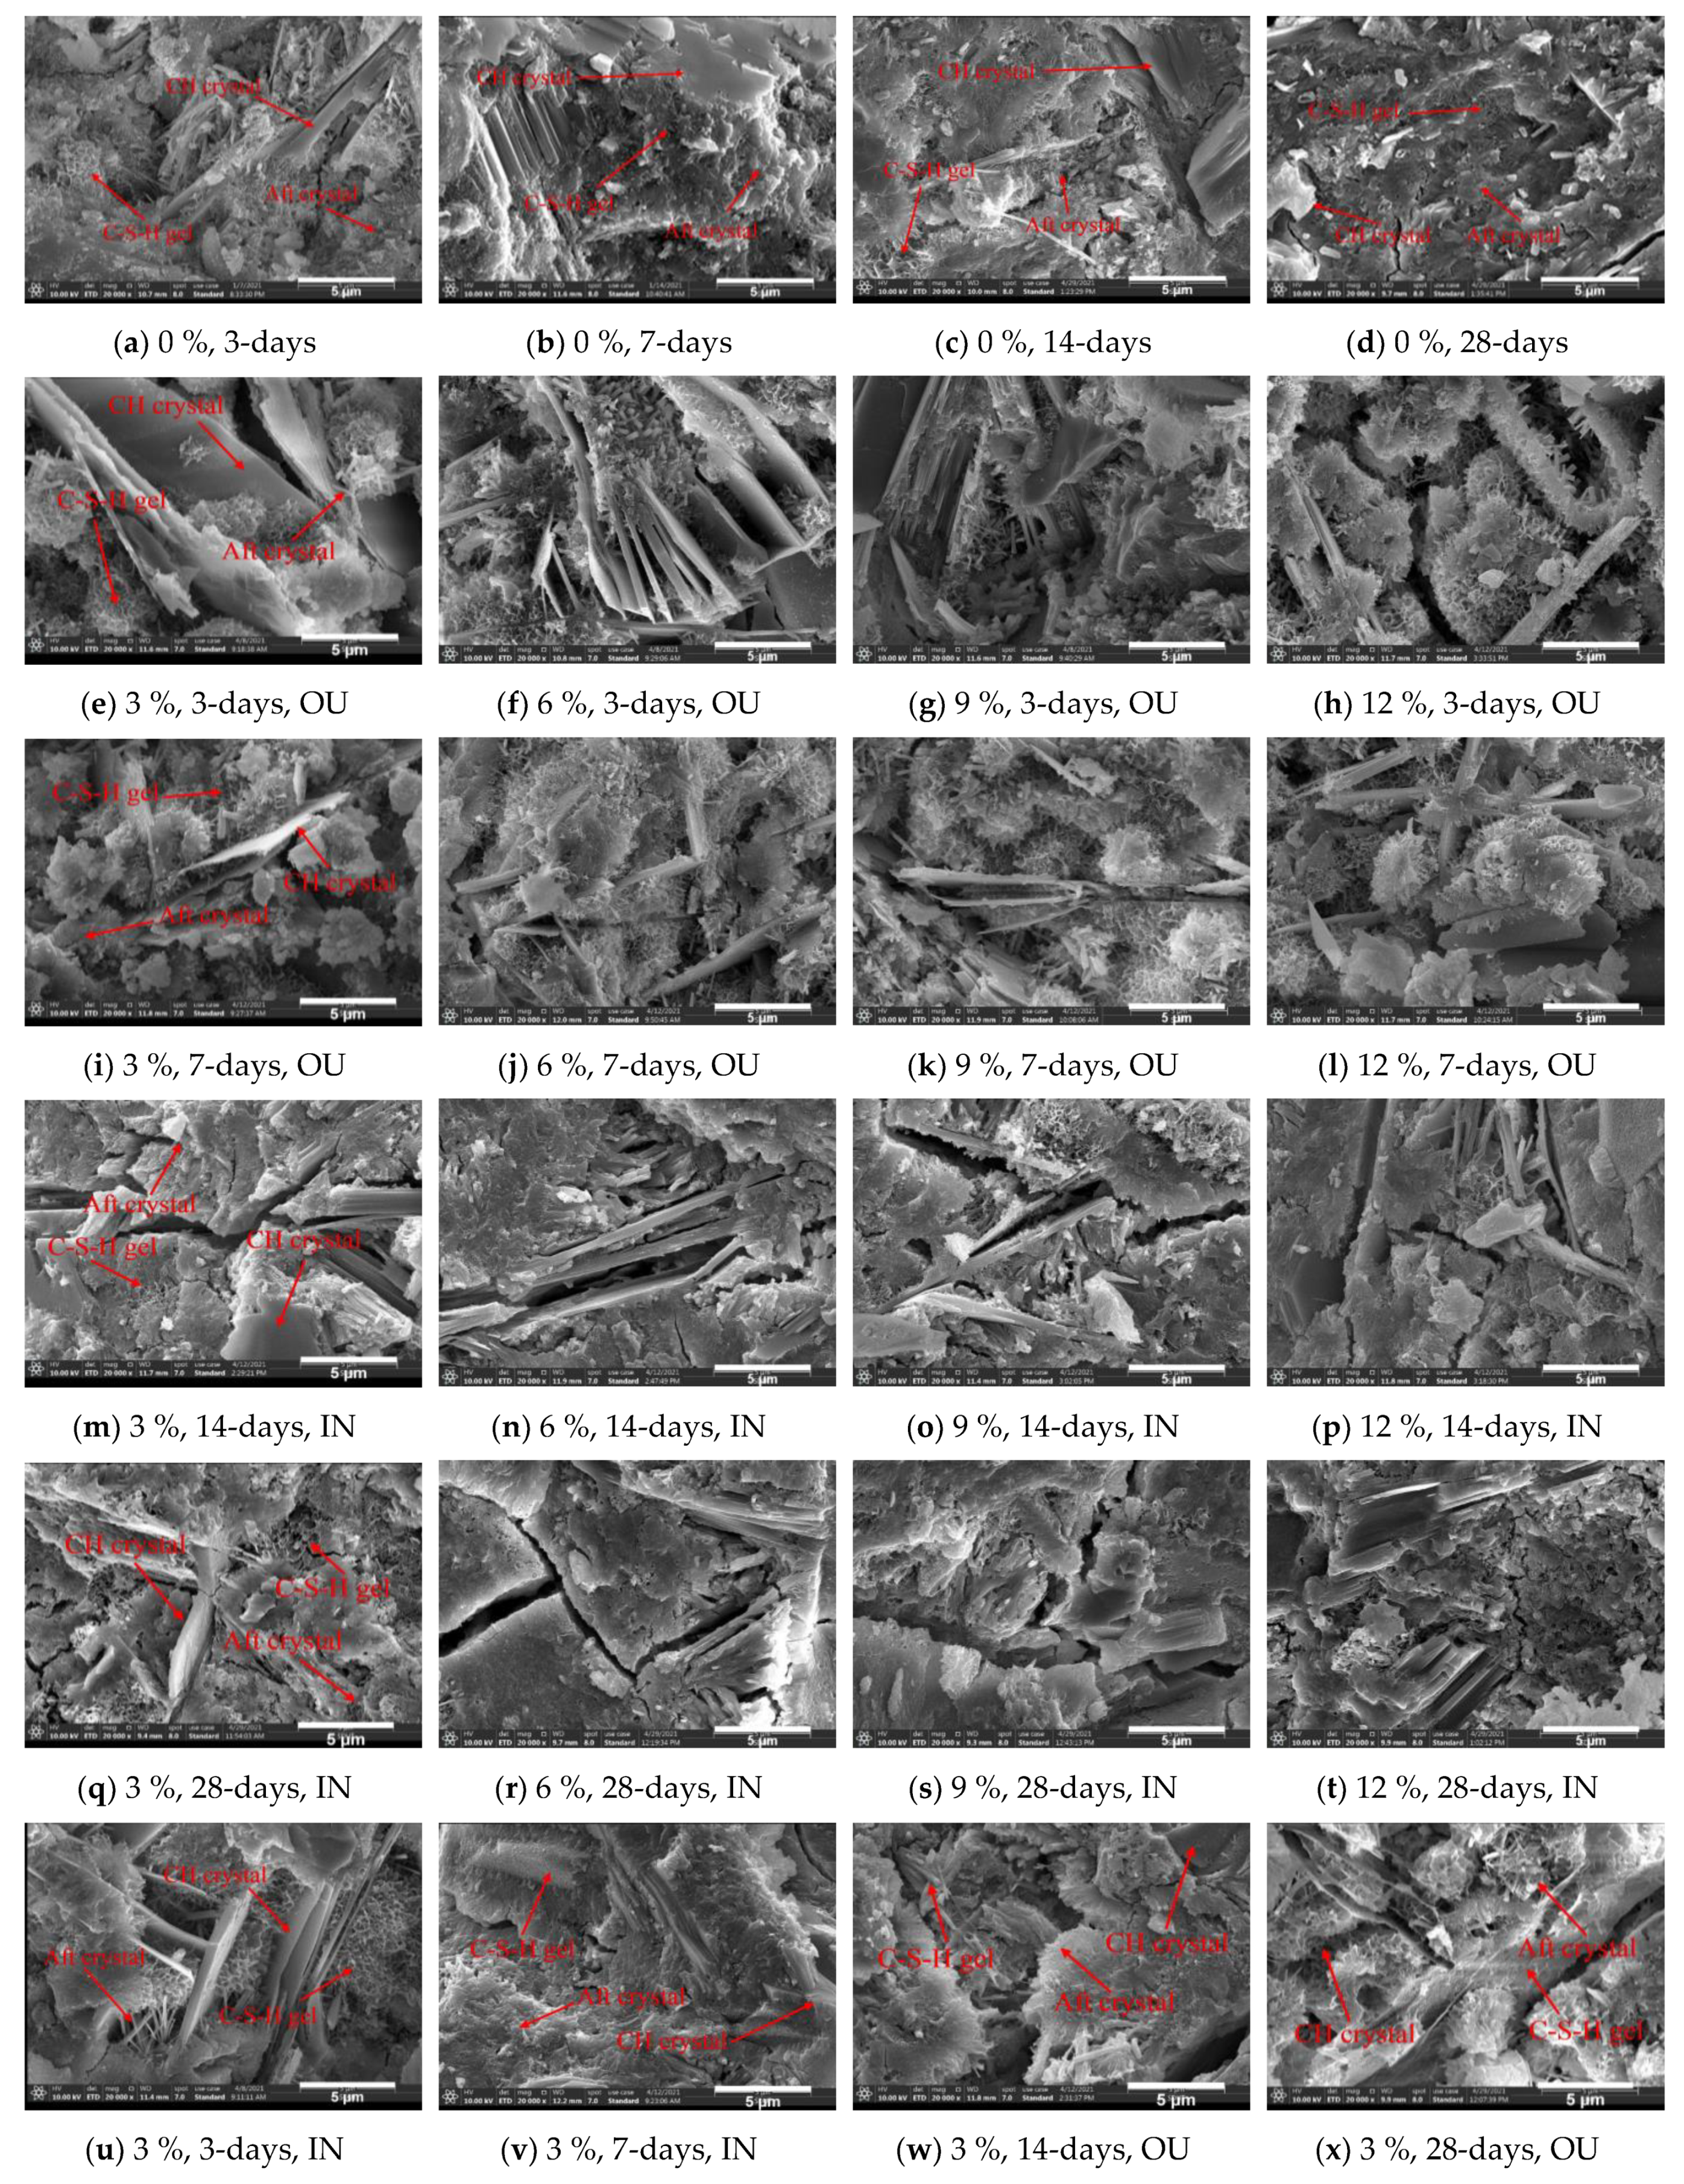
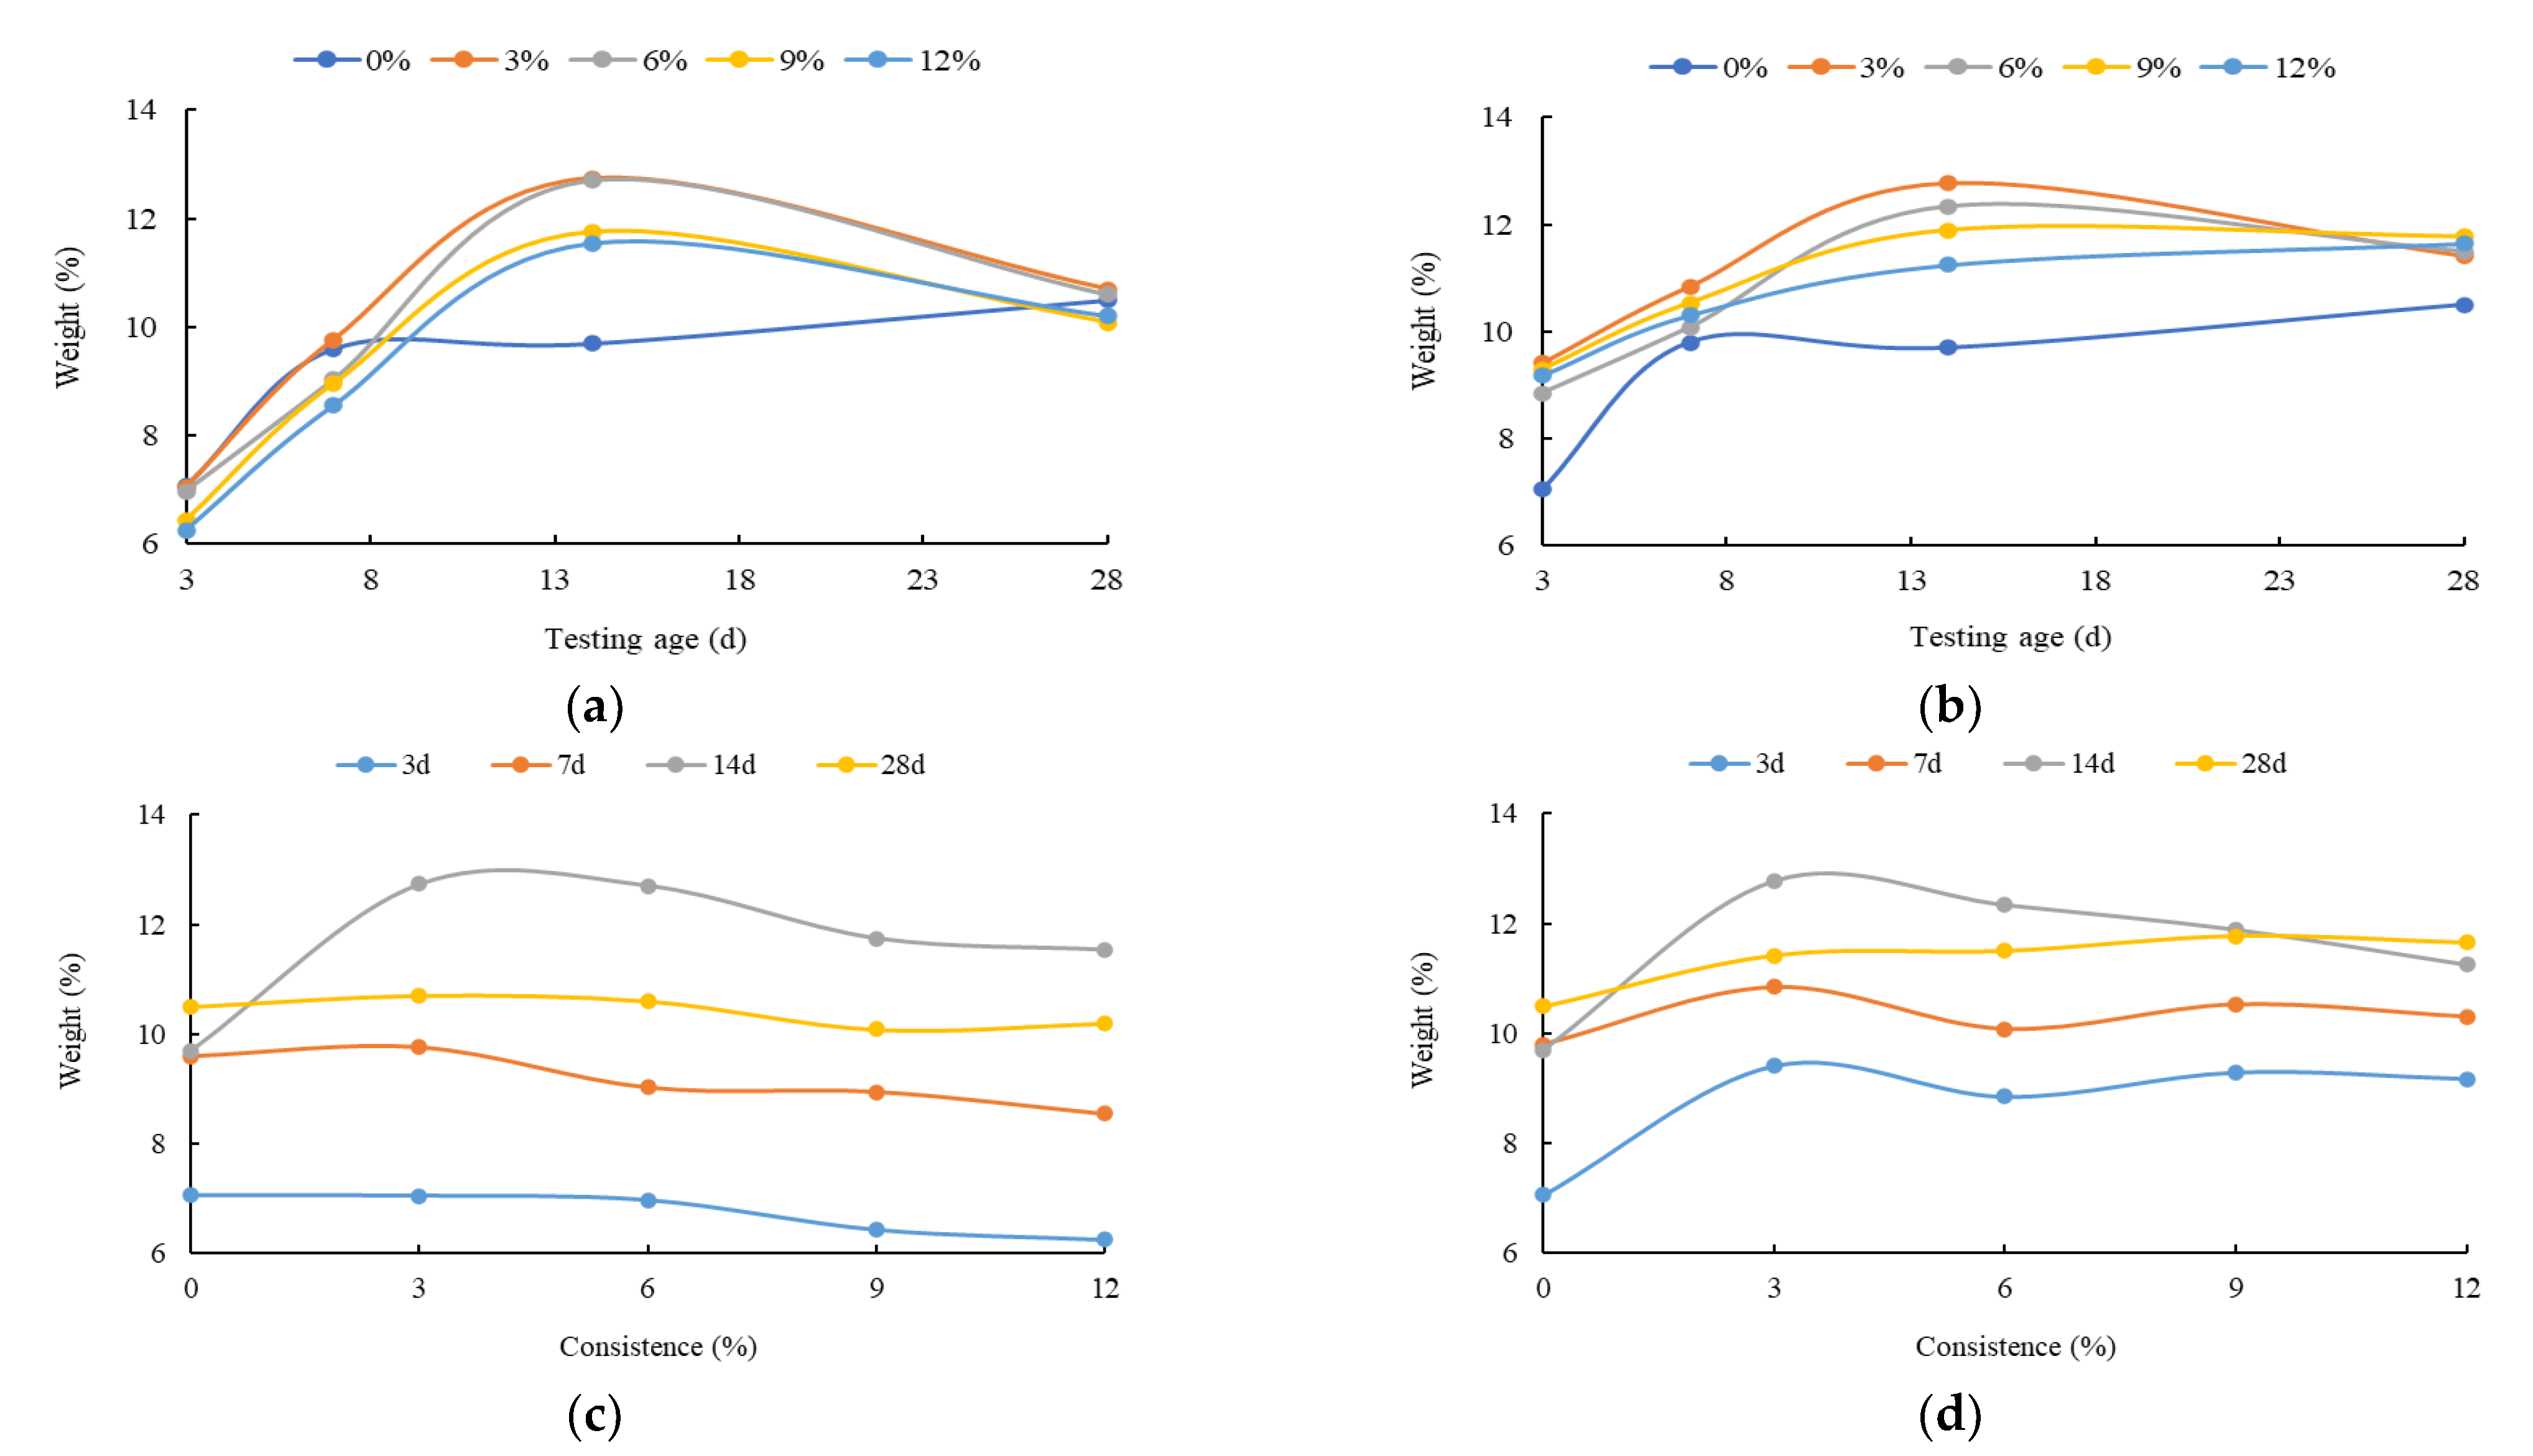
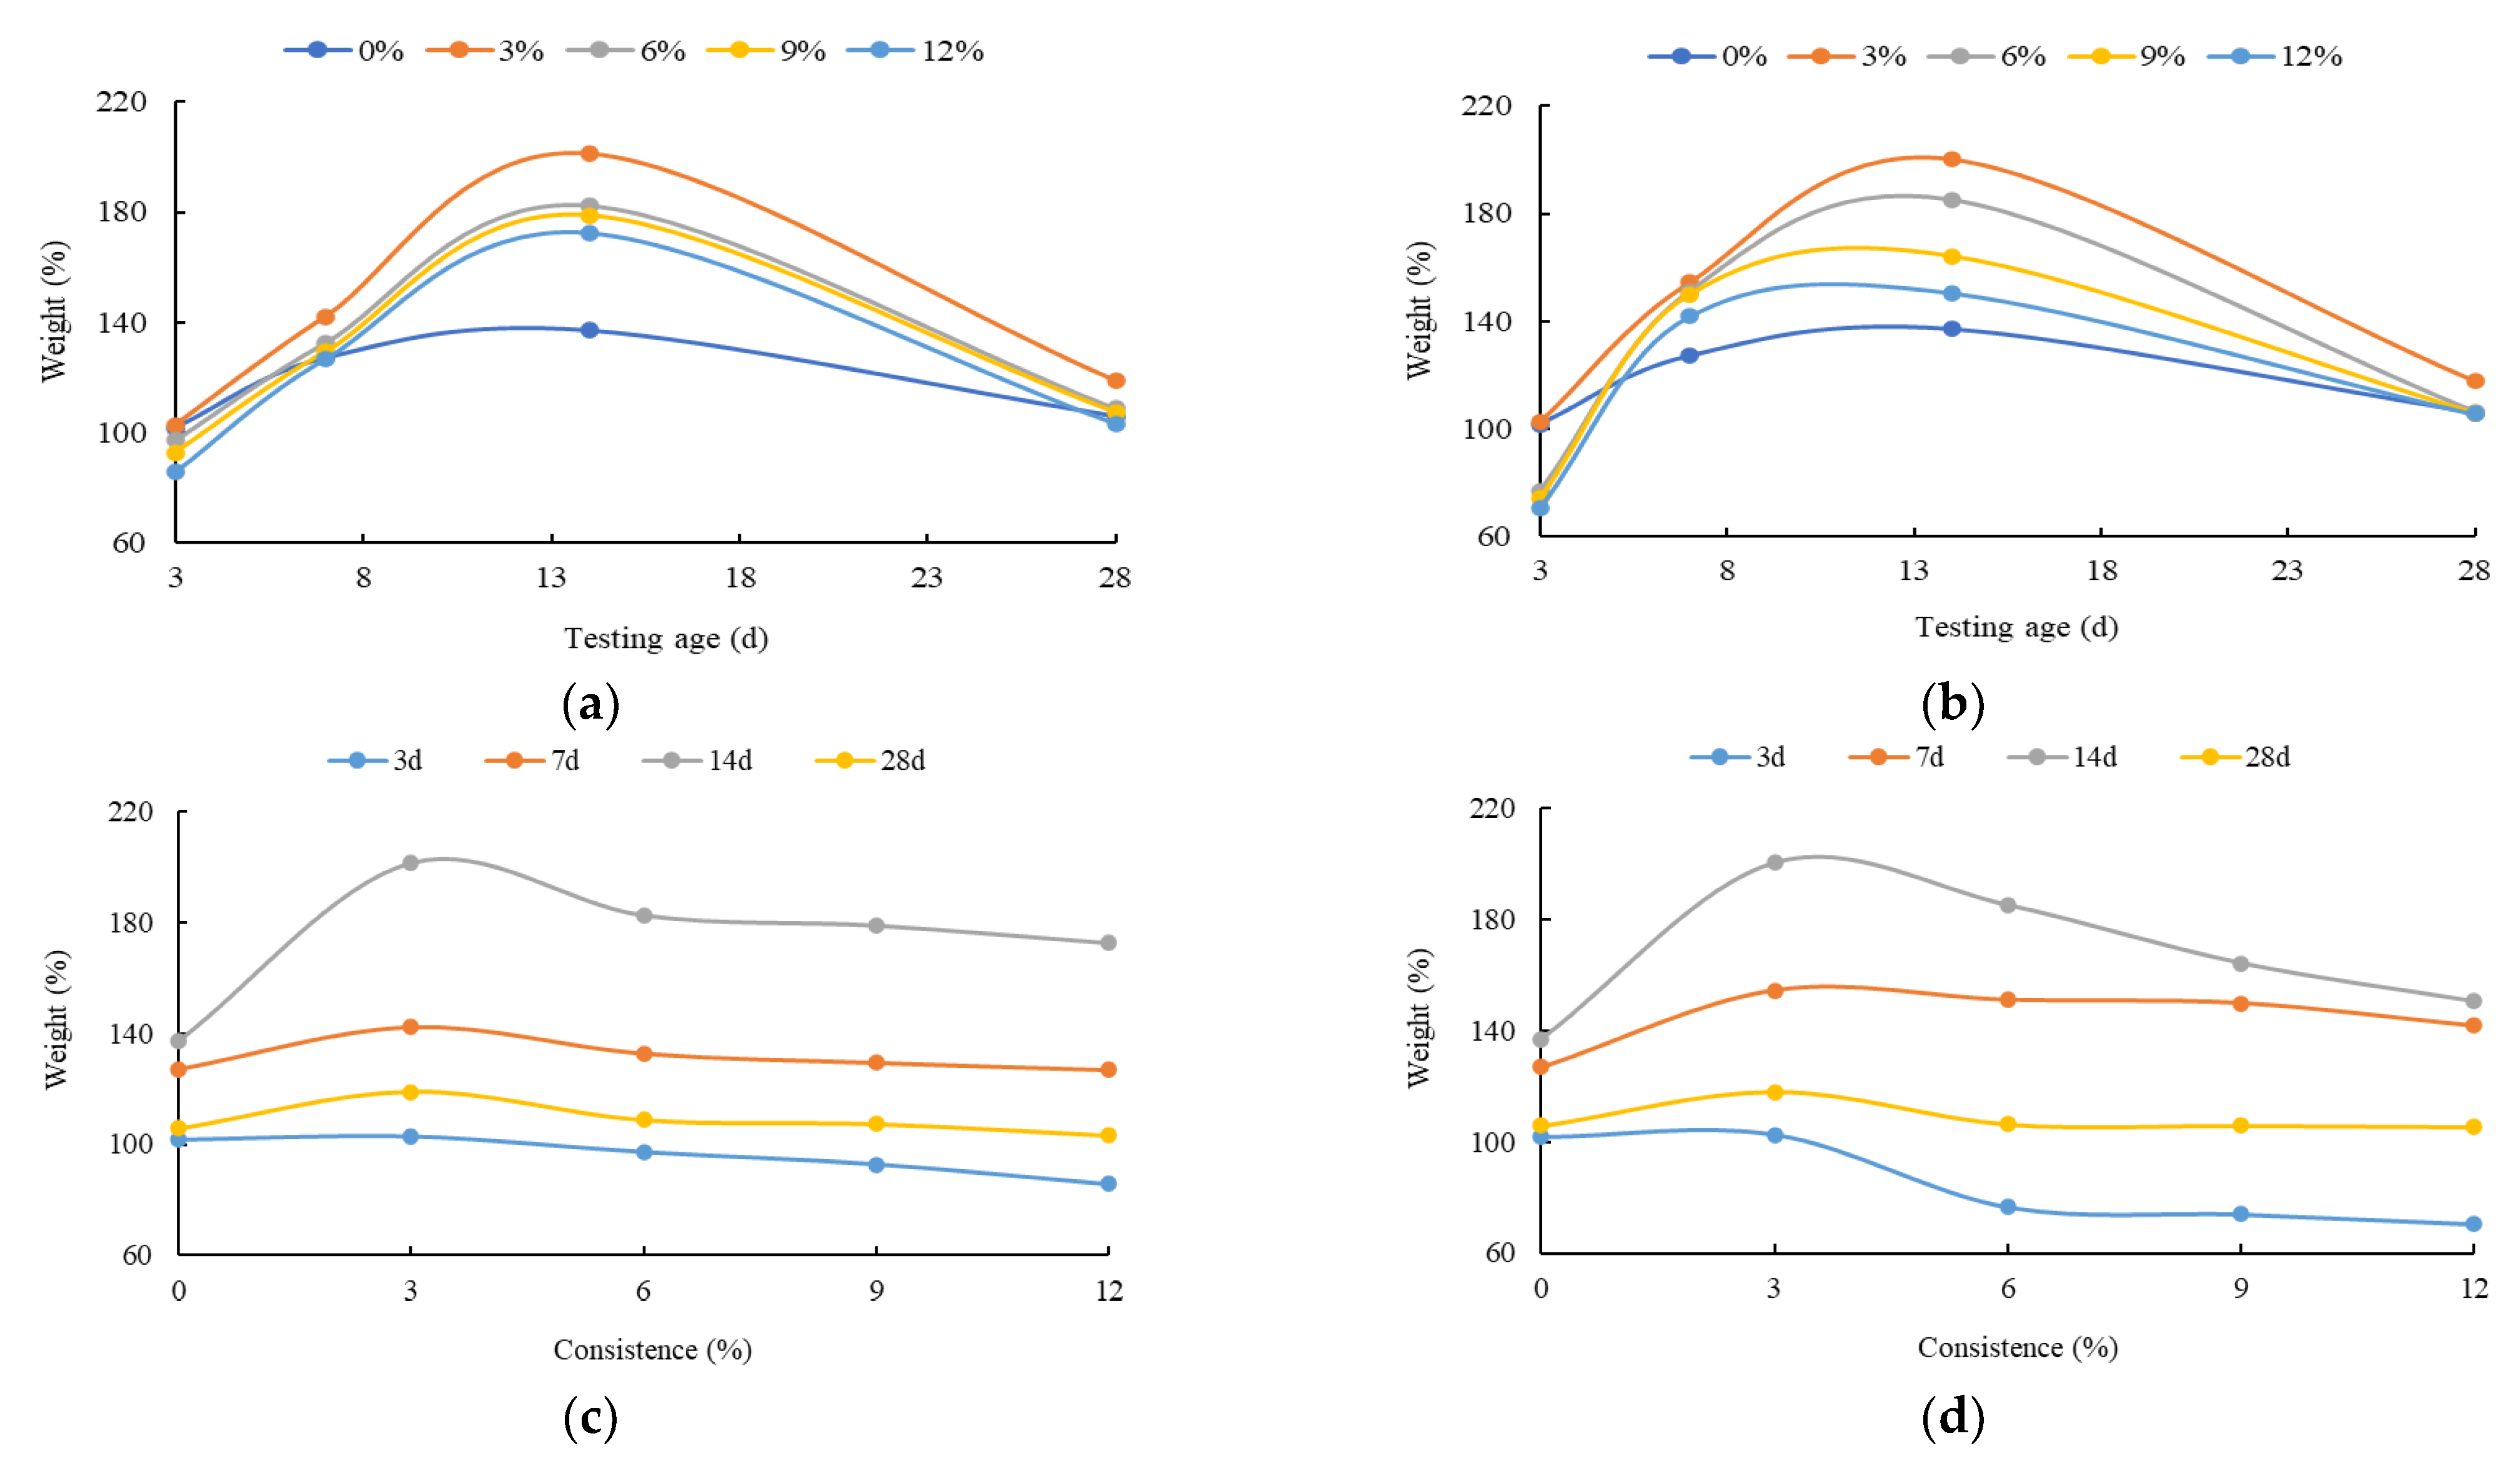
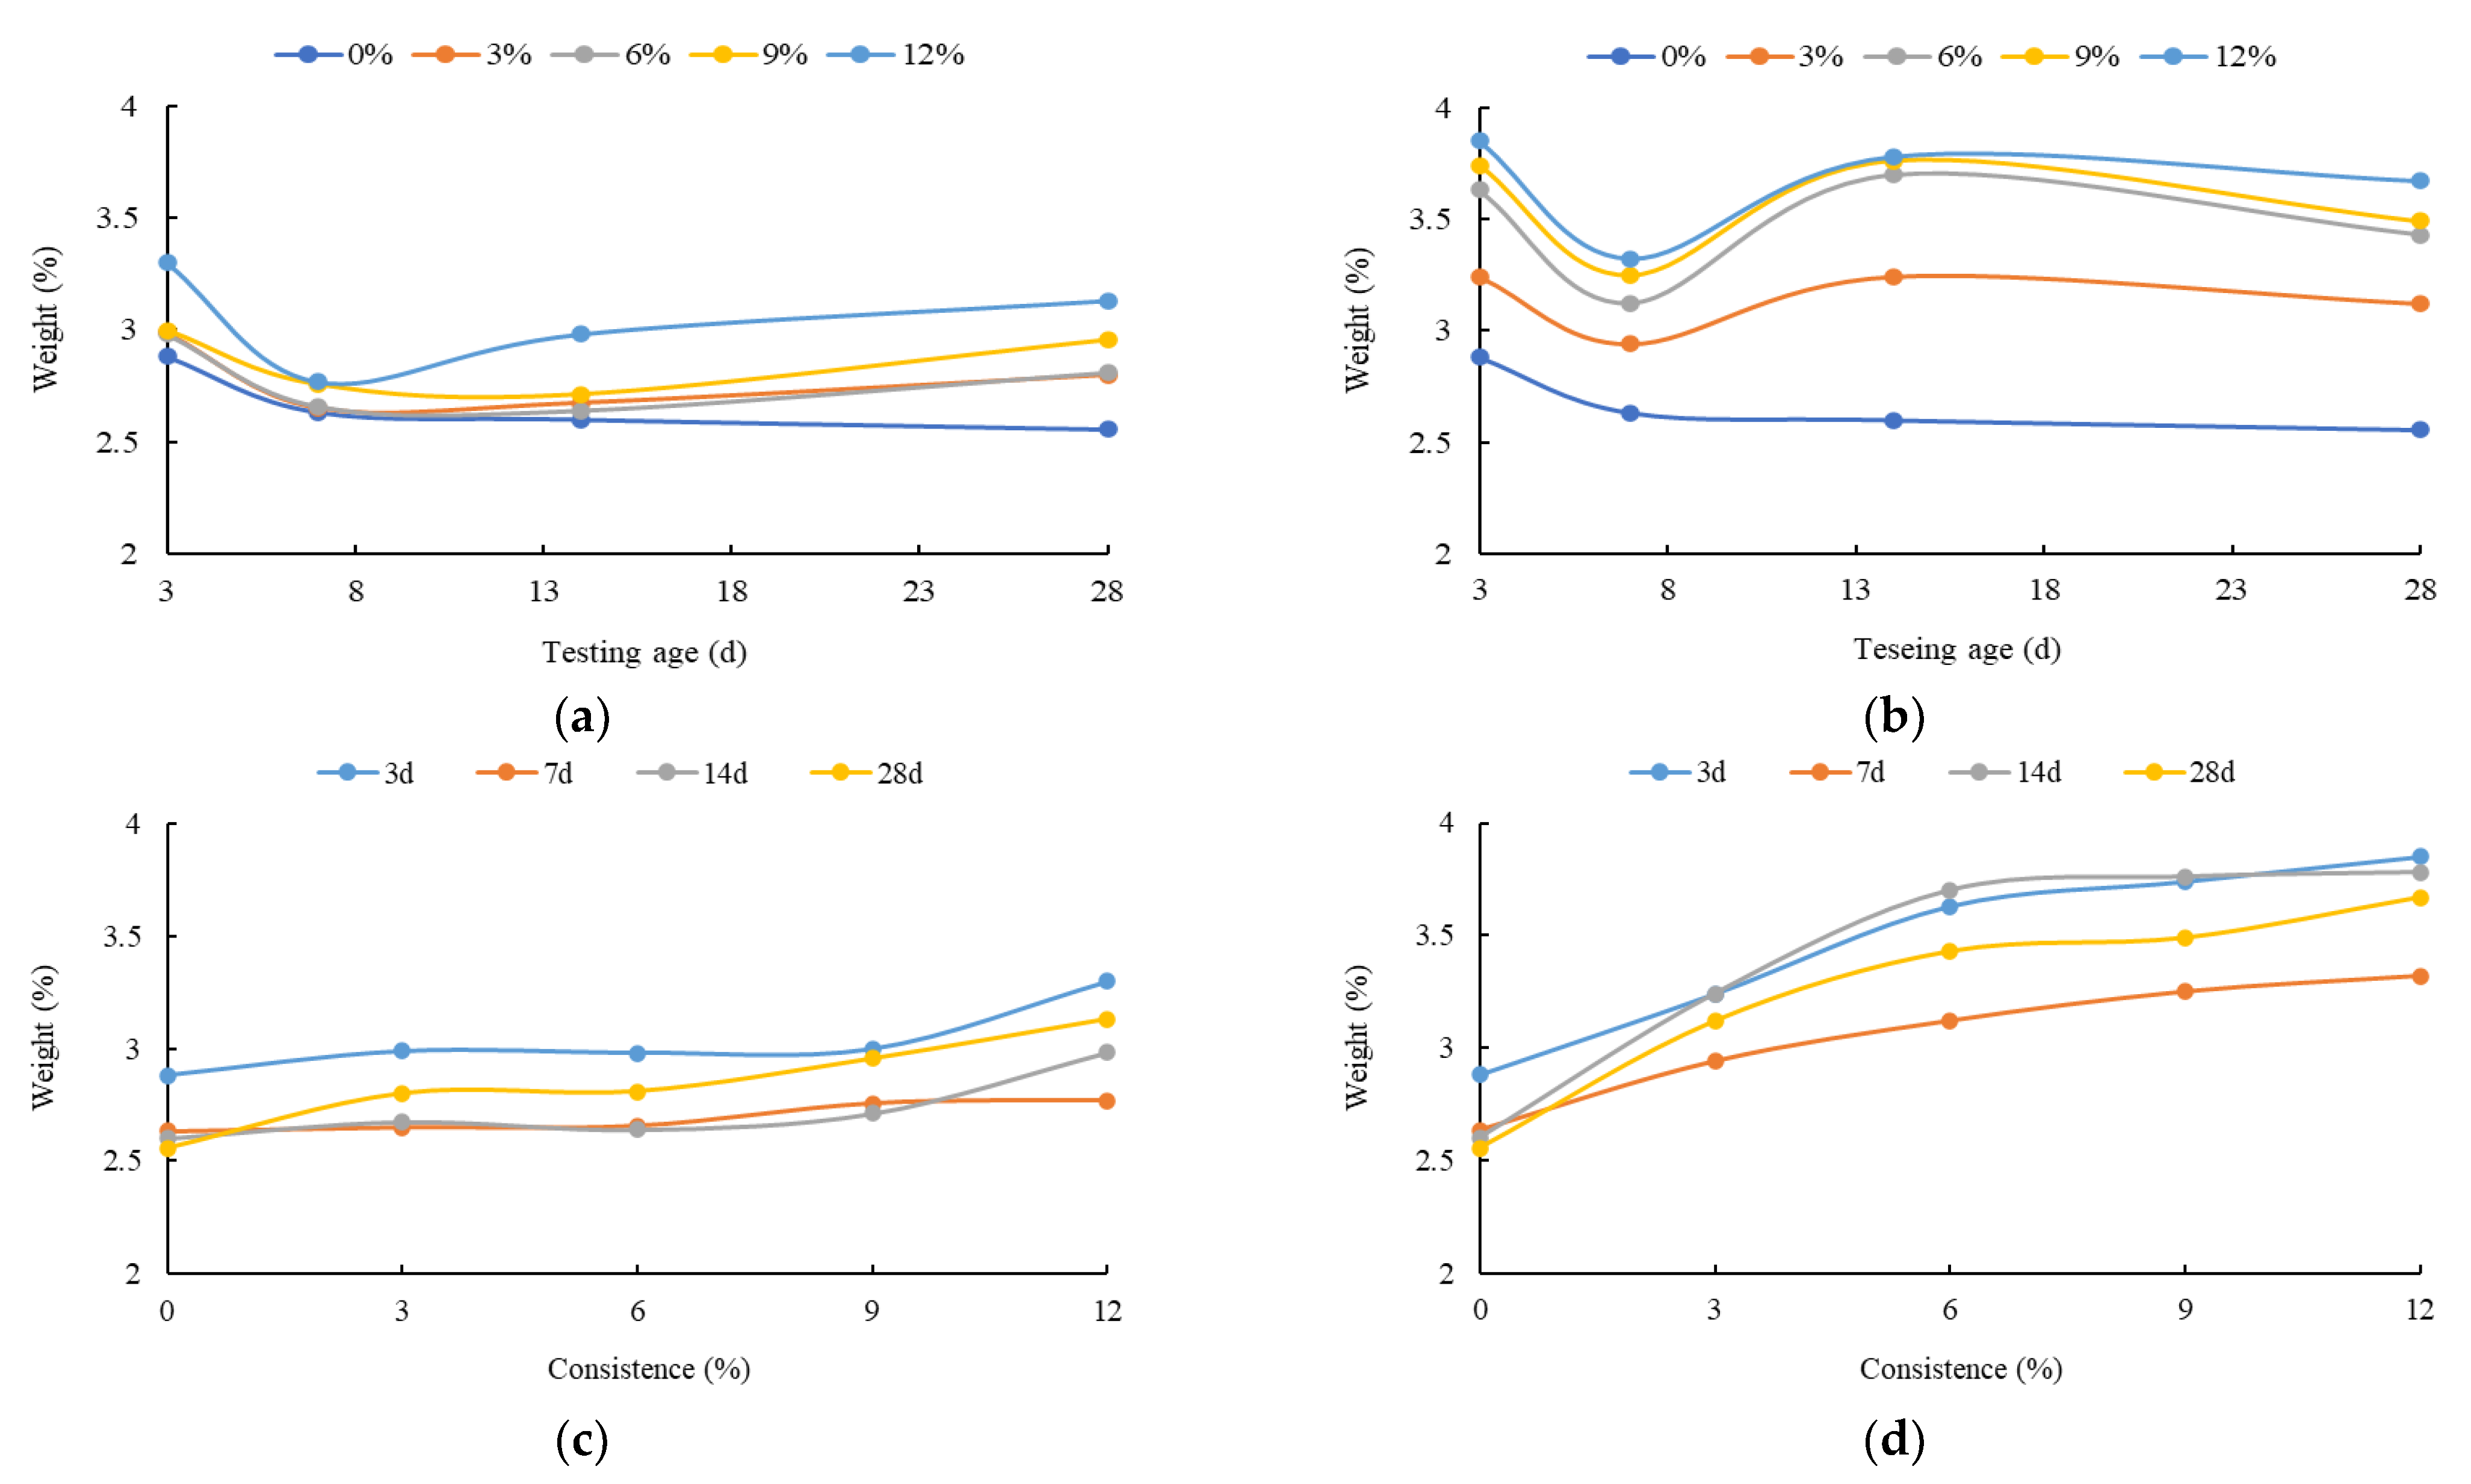
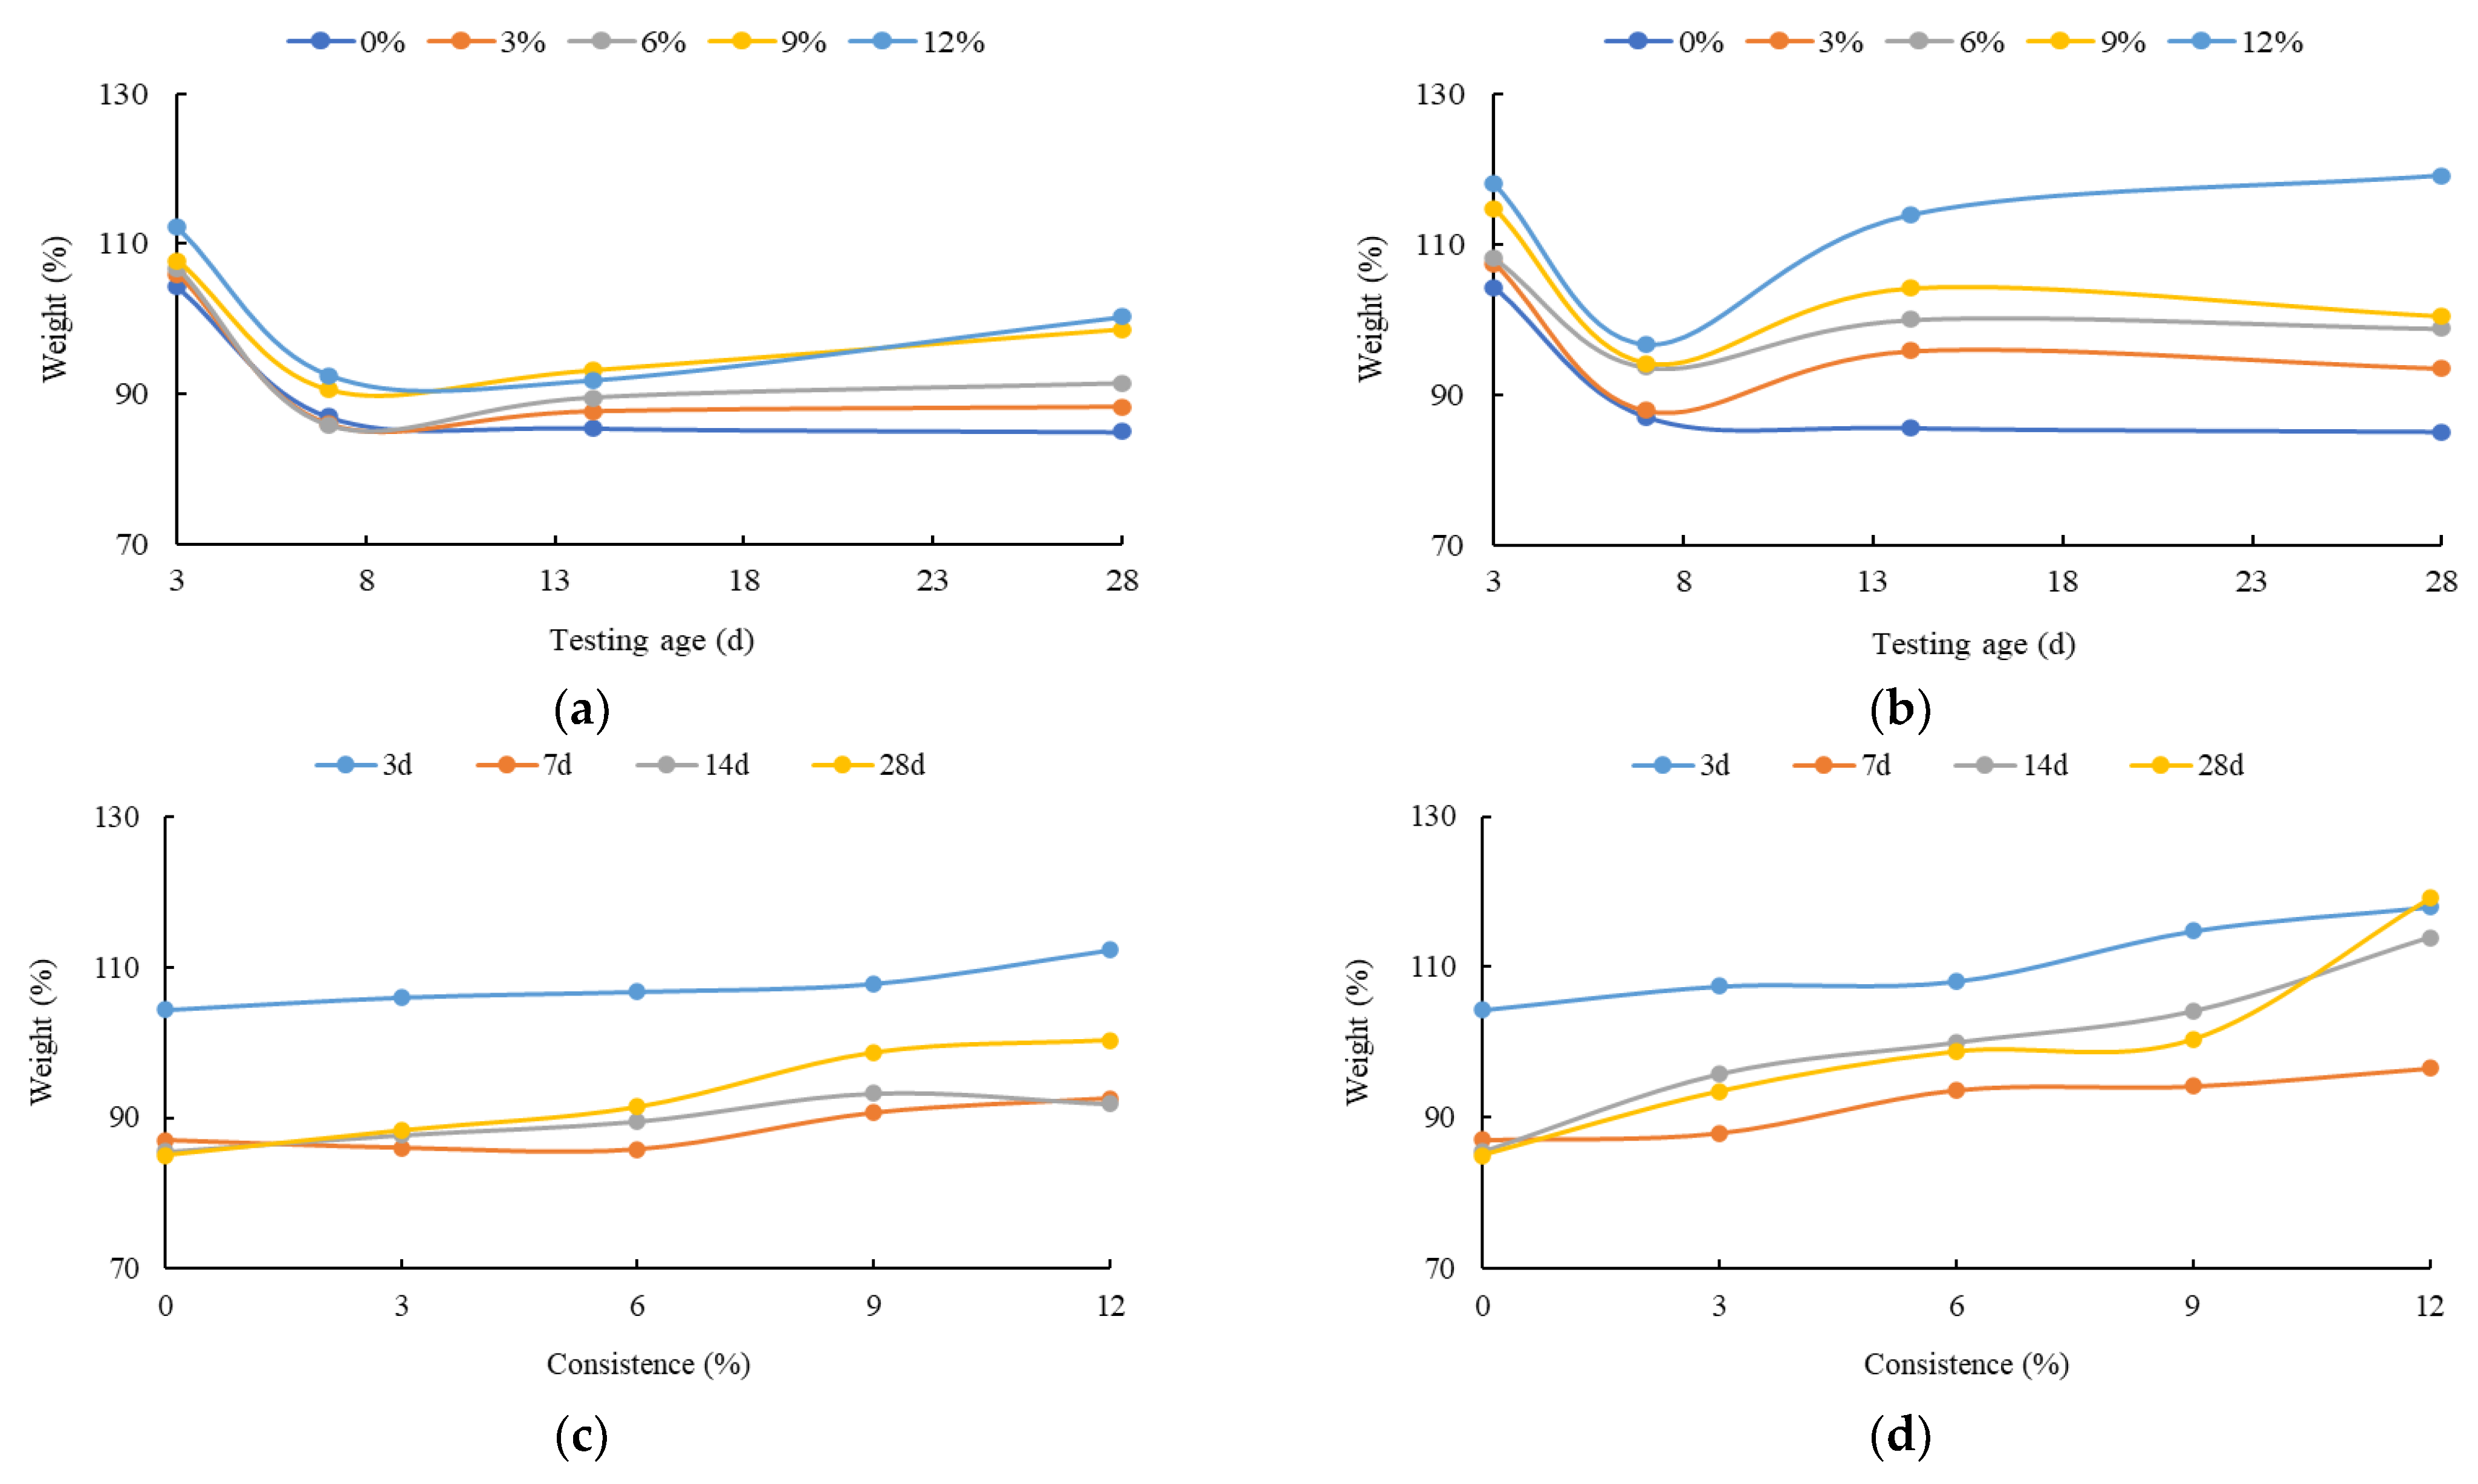
4. The Microstructure Changes in the HECM

The evolution process of hydration products under different corrosion conditions can be preliminarily explored by observing the changes in the microstructure of the HECM through SEM tests. As the hydration process of the HECM goes on, the C-S-H gel crosses and clings to connect the dispersed cement particles and their hydration products to form a solid and compact whole in three-dimensional space, which is the main reason for the strength formation of the HECM. When the concentration reaches saturation, they precipitate into lamellar or plate-shaped square crystals, which are vulnerable to corrosion due to weak interlayer connection and poor stability. As a result, the change in the microstructure of C-S-H gel and CH crystal should be paid more attention.
Figure 4 shows the inside (IN) and outside (OU) SEM images of the HECM in the case of different MgSO4 concentrations and testing ages. It should be explained that the SEM images have less difference in microstructure features under different conditions, as simplified in Figure 4. For example, the SEM features of inner structures of the HECM at 3 days and 7 days have a certain similarity under different concentrations; thus, only two SEM images are retained (Figure 4u,v). The same is true for the outer structures of the HECM at 14 days and 28 days (Figure 4w,x).
When the corrosion time is 3 days, the flocculent C-S-H gel and needlestick ettringite in the HECM have basically formed. The C-S-H gel cross clings to form a dense and solid three-dimensional space structure, providing early strength for the HECM. This indicates that the early hydration effect of the HECM is significant, and the effect of early strength is achieved. In addition, it can be seen from the outside structure of the HECM that massive gypsum solid is generated and the ettringite form becomes shorter and thicker. The CH crystal produces tiny cracks, which become more obvious with the increase in the solution concentration. This indicates that magnesium sulfate solution has a corrosion effect on the HECM and is intensified with the increase in the solution concentration. The difference between outer microstructure (Figure 4e–h) and inner microstructure (Figure 4u) in the case of 3 days of corrosion is obvious, indicating that magnesium sulfate solution has not corroded the inside of the material at this time.
Compared with corrosion for 3 days, more C-S-H gels and ettringite Aft crystals are observed in the SEM images of the HECM corroded for 7 days. The densification of the microstructure is further strengthened, and the pores are almost invisible. This indicates that the hydration of the HECM is further completed and the strength of the HECM has basically formed. Hence, the flexural and compressive strength gradually increases from 3 days to 7 days corrosion time (see Figure 3a,b). As can be seen from the outside microstructure of the HECM when the corrosion time is 7 days, the damage of sulfate ions on layered and CH crystals is further intensified. At this stage, the difference between the inside microstructure (Figure 4v) and outside microstructure (Figure 4i–l) becomes smaller, indicating that magnesium sulfate solution has begun to corrode the inside of the specimen. In addition, the number of C-S-H gels decreases while the number of CH crystals increases compared with the HECM under standard curing conditions. Hence, it can be speculated that the effect mechanism of magnesium sulfate solution on the formation of the HECM strength is mainly reflected in delaying the transformation of CH crystal into C-S-H gel and destroying the existing CH crystal structure.
The microscopic structure of the HECM at standard curing for 14 days is not much different from that at standard curing for 7 days, indicating that the hydration of the HECM at this stage is approaching completion. In the corrosive environment, the microstructure damage of the HECM is more obvious. Furthermore, significant transverse and vertical cracks can be observed. This leads to the decay of the flexural strength of the HECM (see Figure 3b). Therefore, magnesium sulfate solution only delays, but does not prevent the hydration process of the HECM. Even in the case of the interference of magnesium sulfate solution corrosion, the hydration reaction of the HECM is completed at 14 days. However, its flexural strength continues to decrease due to serious microstructure damage. In addition, the microstructure damage at this stage mainly occurs on the inside and intensifies with the increase in solution concentration. There is no obvious difference between the outer microstructure (Figure 4w) and the inner microstructure (Figure 4m–p) in the case of 14 days corrosion for the same concentration, indicating that magnesium sulfate solution has invaded the inside of the HECM and reaches saturation externally.
Compared with corrosion for 14 days, the corrosion damage of microstructure after 28 days of corrosion is further intensified. At this moment, the hydration products are basically stable. The corrosion damage of magnesium sulfate solution to the inside structure of the HECM is the main reason for its macroscopic strength reduction. However, it is worth noting that physical corrosion phenomenon (e.g., nibbling edge, holes, etc.) becomes more and more obvious at this moment. This is due to the hydration process at this stage having terminated. The magnesium sulfate solution basically no longer participates in the chemical reaction, but begins to carry out physical corrosion on the microstructure.

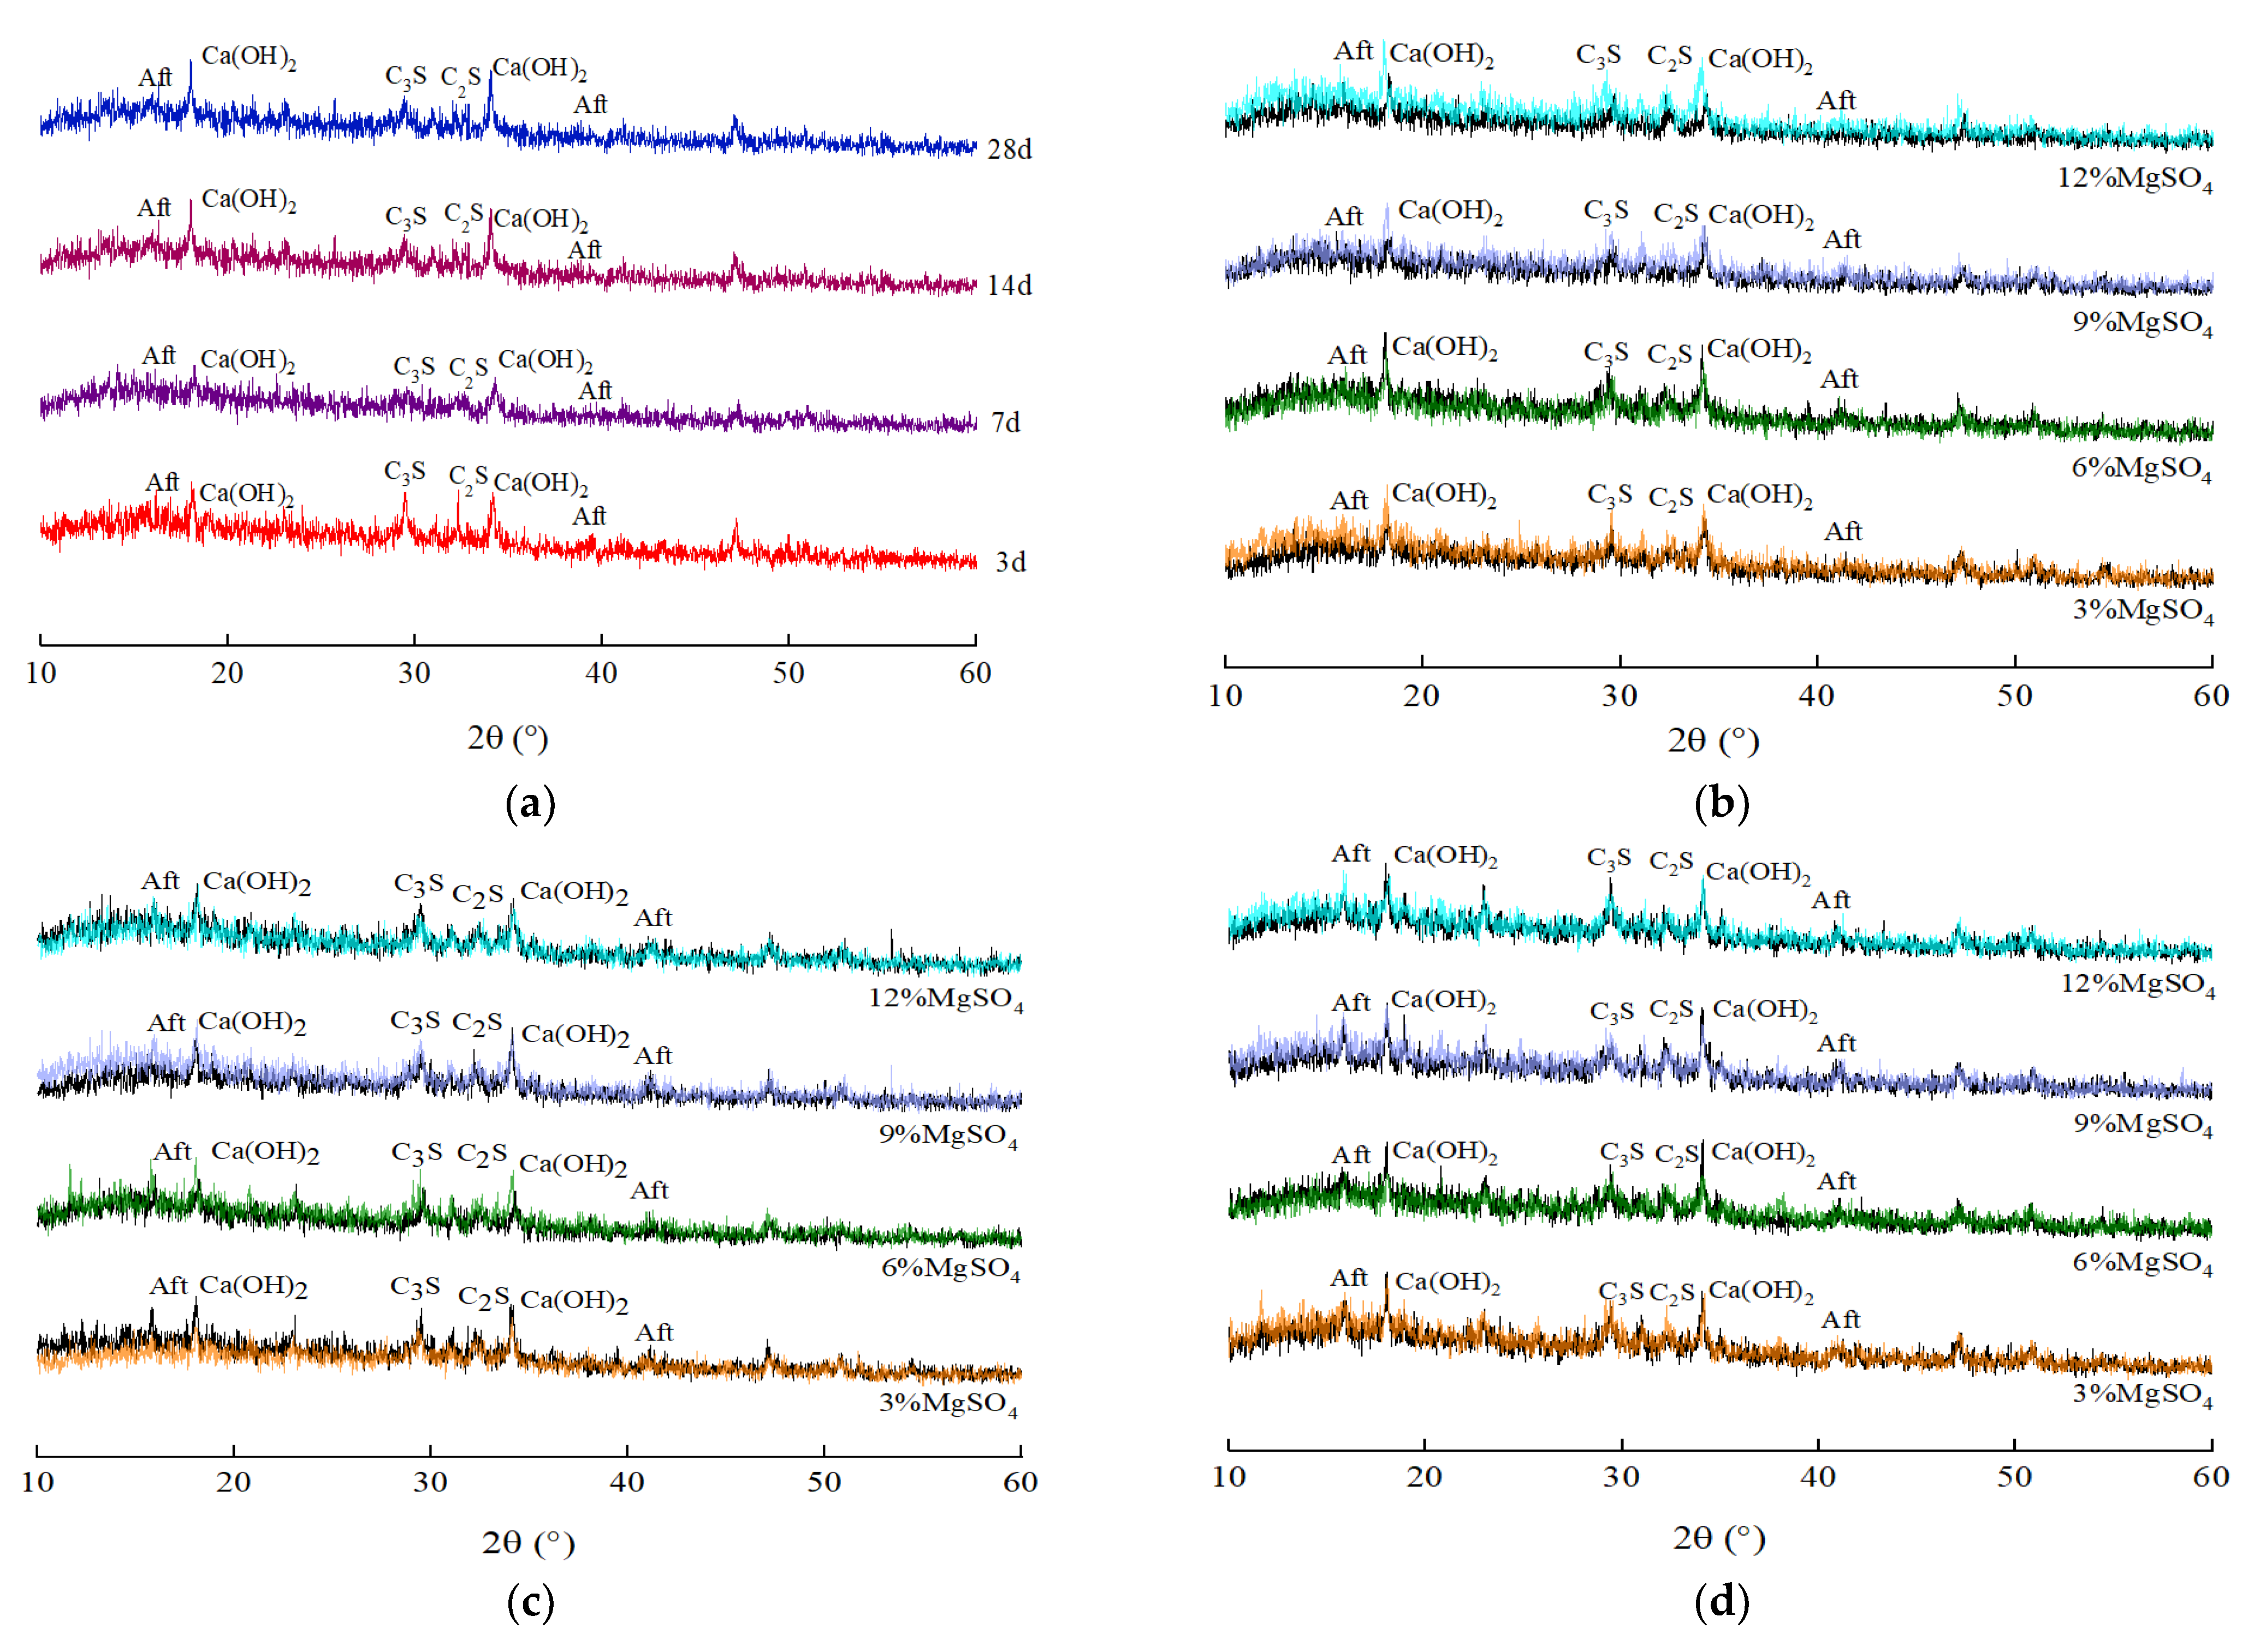
5. The Changes in Hydration Products in the HECM

5.1. XRD

Since the diffraction peak intensity represents the content of each substance in the specimen, the XRD test can analyze the changes in the diffraction peak intensity of calcium hydroxide and ettringite generated by hydration of the HECM. Simultaneously, the changes in the diffraction peak intensity of un-hydrated cement clinker 2CaO·SiO2 (C2S) and 3CaO·SiO2 (C3S) during corrosion are also analyzed. In addition, the changes in calcium hydroxide content in the HECM can reflect the hydration process of cement. The diffraction pattern of the HECM in the case of different corrosion time and MgSO4 solution concentration is shown in Figure 5.
In order to quantitatively analyze the variation of CH crystal content and the hydration process of the HECM in the case of different corrosion conditions, the diffraction peak intensity of CH crystal is extracted. Figure 6 shows the variation curves of the diffraction peak intensity of CH crystals inside (IN) and outside (OU) the HECM with the change in testing age and MgSO4 solution concentration.
As shown in Figure 6a,b, the diffraction peak intensity of CH crystals in the uncorroded HECM decreases with the increase in testing age owing to most CH crystals generated after 7 days of hydration having been converted into C-S-H gel. At the same time, there is a rapid decline in the early stage and a slow decline in the late stage. In the case of the corrosion condition, the diffraction peak intensity of CH crystals first decreases and then increases with the increase in corrosion time. This is due to CH crystals being consumed by magnesium ion, sulfate ion, and early strength components in the HECM. Hence, its diffraction peak intensity decreases. Simultaneously, the content of insoluble magnesium hydroxide and weakly cemented M-S-H gel increases continuously with the increase in corrosion time. This restricts the transformation of CH crystals, reducing its loss and gradually accumulating, resulting in the increase in diffraction peak intensity.
As shown in Figure 6c,d, the diffraction peak intensity of CH crystals basically shows a trend of continuous increases with the increase in magnesium sulfate solution concentration. This is due to the transformation process of CH crystals into C-S-H gel being hindered in the case of the corrosive action of magnesium sulfate solution. The higher the concentration of magnesium sulfate, the stronger the hindrance effect. This results in the accumulation of CH crystals, causing the diffraction peak intensity to increase continuously.

5.2. DSC

Figure 7 is a typical DSC curve that includes mass loss curve (red) and heat flow curve (black). It can be found that there are two obvious endothermic peaks in the feat flow curve. Correspondingly, there are two stages of significant mass loss in the mass loss curve. The peak and mass loss of the first stage represent the dehydration effect of C-S-H gel, M-S-H gel, ettringite, and gypsum (if present). The peak and mass loss of the second stage represent the decomposition of CH crystal and magnesium hydroxide. The peak area is the heat required for decomposition. The detailed DSC results of the HECM in different testing ages and concentrations can be found in the support file.
In order to further intuitively analyze the effects of corrosion time and MgSO4 solution concentration on the HECM hydration process, Figure 8, Figure 9, Figure 10 and Figure 11 are presented to compare the changes in mass loss and enthalpy of C-S-H gel, M-S-H gel, ettringite, and gypsum in the case of different corrosion conditions.
Figure 8 and Figure 9 show the mass loss and peak area variation curves of hydration products in the endothermic peak of the first stage with the change in testing age and magnesium sulfate solution concentration.
As shown in (a) and (b) in Figure 8 and Figure 9, the mass loss and peak area of C-S-H gel, ettringite, and gypsum in the magnesium sulfate corrosion environment first increases and then decreases with the increase in testing age. They reach the maximum value at 14 days corrosion time. This indicates that the intensity of hydration is higher than that of corrosion before the 14 day corrosion time. Hence, the mass loss and peak area of hydration products continue to increase. When the corrosion time is longer than 14 days, the number of hydration products decreases due to the corrosion damage of magnesium sulfate solution on the microstructure.
As shown in (c) and (d) in Figure 8 and Figure 9, the mass loss and peak area first increase and then decrease with the increase in magnesium sulfate solution concentration. They reach the maximum value when the solution concentration is 3%. This is mainly because the corrosion effect of low-concentration solution on hydration products is relatively weak, while magnesium sulfate will react with CH crystal to produce calcium sulfate (gypsum) and promote the hydration of 3CaO·Al2O3 (C3A) to produce ettringite. Hence, the mass loss and peak area of hydration products increases. With the increase in solution concentration, the corrosion gradually increases. However, the amount of gypsum produced does not significantly increase, because 3CaO·Al2O3·3H2O (C3AH3) can continue to react with ettringite to produce single sulfur calcium sulfoaluminate after gypsum consumption. Accordingly, the mass loss and peak area decrease.
Figure 10 and Figure 11 show the mass loss and peak area variation curves of hydration products in the endothermic peak of the second stage with the change in corrosion time and magnesium sulfate solution concentration.
As shown in (a) and (b) in Figure 10 and Figure 11, the mass loss and peak area of CH crystal first decrease and then increase with the increase in testing age. They reach the minimum when the corrosion time is 7 days. This is due to the coexistence of hydration and corrosion within 7 days of corrosion. On the one hand, CH crystal participates in the hydration reaction to transform into C-S-H gel. On the other hand, it reacts with magnesium sulfate to form gypsum. Therefore, the mass loss and peak area of CH crystals decrease sharply during 7 days of corrosion. The hydration reaction tends to terminate and the consumption of CH crystal gradually decreases with the increase in corrosion time. Simultaneously, the presence of gypsum can promote the ettringite generated by hydration of C3A to adhere to the surface of CH crystals. Hence, the transformation of CH crystals into C-S-H gel is blocked, resulting in the accumulation of CH crystals after 7 days of corrosion. Consequently, its mass loss and peak area continue to increase.
As shown in (c) and (d) in Figure 10 and Figure 11, the mass loss and peak area of hydration products corresponding to the endothermic peak of the second stage increase continuously with the increase in magnesium sulfate solution concentration in the case of different testing age. This is mainly due to the additional consumption of magnesium ions on CH crystals and the formation of magnesium hydroxide at the initial stage of corrosion. In addition, the rapid increase in mass loss as shown in Figure 10d is mainly due to the dehydration of magnesium sulfate crystals outside the specimen.
Moreover, Figure 12 visually presents the relationship between mass loss of hydration products and strength change in the HECM. Although the relationship between flexural/compressive strength and mass loss is not linear, there is basically a positive correlation between them. This shows that the evolution of hydration products directly influences the strength information of the HECM.

6. Conclusions

In this study, the early flexural and compressive strength of the HECM in the case of different magnesium sulfate concentrations and corrosion times are investigated. Moreover, the effects of magnesium sulfate concentrations and corrosion times on the microstructure and hydration products of the HECM are analyzed via SEM test, XRD test, and DSC test. Finally, the influence mechanisms of the magnesium sulfate on the early strength formation of the HECM are analyzed to reveal the degradation mechanisms of the HECM in the case of magnesium sulfate corrosion. The main conclusions are as follows:
  • The flexural and compressive strength of the HECM steadily decrease as the solution concentration increases. This is due to the CH crystal generating the insoluble magnesium hydroxide with Mg2+. The insoluble magnesium not only consumes the CH crystal to influence the hydration process, but also prompts the C-S-H gel to transform into the M-S-H gel. The contribution to the macro strength of the M-S-H gel is lower than that of the C-S-H gel, because the cementitious of the M-S-H gel is weaker than the C-S-H gel. In addition, the SO42− will also interfere with the generation of the C-S-H gel and destroy the CH crystal. The negative impact of the insoluble magnesium, M-S-H gel, and SO42− on the macro strength of the HECM becomes more significant as the solution concentration increases.
  • The flexural and compressive strength of the HECM first increase and then decrease as the corrosion time increases, especially for the flexural strength. The increased strength at the early hydration stage comes from the gypsum generated by CH crystal and SO42− and the insoluble magnesium attached to the outside of the HECM. With the increase in corrosion time, the above composite impact of the insoluble magnesium, M-S-H gel, and SO42− becomes more superior to weaken the strength.
  • This study is conducive for pinpointing the evolution process of mechanical strength and hydration products of the HECM under magnesium sulfate corrosion. It is helpful to specifically adjust and control the composition of the HECM during the material design, aiming at some special engineering conditions.
Finally, it should be explained that this study mainly focuses on the analysis of corrosion mechanisms, while it does not yet face industrialization. Hence, the economic parameters will be analyzed in future studies and are not discussed in this study. On the other hand, the compositions of the HECM are all common raw materials (i.e., ordinary Portland cement, water-reducing agent, accelerating agent, and expansion agent). The cost of the HECM is not too expensive to restrict the application of the HECM.
Magnesium sulfate is not the only corrosion medium in construction environment [27]. In future studies, more varieties of corrosion mediums will be investigated to determine the mechanisms of strength formation of the HECM, especially for combined corrosion of different corrosion mediums.

Author Contributions

Conceptualization, X.Z. and J.R.; methodology, X.Z., J.R. and S.W.; software, X.Z. and S.W.; validation, X.Z. and L.Z.; formal analysis, X.Z. and G.T.; investigation, X.Z. and J.R.; resources, J.R., S.W. and L.Z.; data curation, X.Z. and J.R.; writing—original draft preparation, X.Z., J.R. and S.W.; writing—review and editing, X.Z., J.R. and L.Z.; visualization, J.R., G.T. and C.W.; supervision, X.Z. and J.R.; project administration, X.Z. and S.W.; funding acquisition, J.R. and C.W. All authors have read and agreed to the published version of the manuscript.

Funding

This research was funded by the National Natural Science Foundation of China under grant 51808326, the Key Technology Research and Development Program of Shandong under grant 2019GHY112076, and the Natural Science Foundation of Shandong Province under grant ZR2020ME269, to which the authors are very grateful.

Institutional Review Board Statement

Not applicable.

Informed Consent Statement

Not applicable.

Data Availability Statement

The data presented in this study are available in the article.

Conflicts of Interest

The authors declare no conflict of interest.

References

  1. Ren, J.; Zhao, H.; Zhang, L.; Zhao, Z.; Xu, Y.; Cheng, Y.; Wang, M.; Chen, J.; Wang, J. Design optimization of cement grouting material based on adaptive boosting algorithm and simplicial homology global optimization. J. Build. Eng. 2022, 49, 104049. [Google Scholar] [CrossRef]
  2. Stewart, M.G.; Mullard, J.A. Spatial time-dependent reliability analysis of corrosion damage and the timing of first repair for RC structures. Eng. Struct. 2007, 29, 1457–1464. [Google Scholar] [CrossRef]
  3. Ren, J.; Zhao, Z.; Xu, Y.; Wang, S.; Chen, H.; Huang, J.; Xue, B.; Wang, J.; Chen, J.; Yang, C. High-fluidization, early strength cement grouting material enhanced by Nano-SiO2: Formula and mechanisms. Materials 2021, 14, 6144. [Google Scholar] [CrossRef]
  4. Yang, Y.; Zhang, Y.; She, W.; Liu, N.; Liu, Z. In situ observing the erosion process of cement pastes exposed to different sulfate solutions with X-ray computed tomography. Constr. Build. Mater. 2018, 176, 556–565. [Google Scholar] [CrossRef]
  5. Liu, J.; Zhang, W.; Li, Z.; Jin, H.; Tang, L. Influence of deicing salt on the surface properties of concrete specimens after 20 years. Constr. Build. Mater. 2021, 295, 123643. [Google Scholar] [CrossRef]
  6. Ding, Z.; Li, Z.; Xing, F. Chemical durability investigation of magnesium phosphosilicate cement. Environ. Ecol. Technol. Concr. 2006, 302, 275–281. [Google Scholar]
  7. Li, J.; Ji, Y.; Huang, G.; Zhang, L. Microstructure evolution of a magnesium phosphate protective layer on concrete structures in a sulfate environment. Coatings 2018, 8, 140. [Google Scholar] [CrossRef]
  8. Li, J.; Ji, Y.; Zhang, L.; Liu, B. Resistance to sulfate attack of magnesium phosphate cement-coated concrete. Constr. Build. Mater. 2019, 195, 156–164. [Google Scholar]
  9. Cheng, S.; Shui, Z.; Sun, T.; Gao, X.; Guo, C. Effects of sulfate and magnesium ion on the chloride transportation behavior and binding capacity of Portland cement mortar. Constr. Build. Mater. 2019, 204, 265–275. [Google Scholar] [CrossRef]
  10. Zhao, G.; Guo, M.; Cui, J.; Li, J.; Xu, L. Partially-exposed cast-in-situ concrete degradation induced by internal-external sulfate and magnesium multiple coupled attack. Constr. Build. Mater. 2021, 294, 123560. [Google Scholar] [CrossRef]
  11. Pinto, S.R.; da Luz, C.A.; Munhoz, G.S.; Medeiros, R.A. Durability of phosphogypsum-based supersulfated cement mortar against external attack by sodium and magnesium sulfate. Constr. Build. Mater. 2020, 136, 106172. [Google Scholar] [CrossRef]
  12. Cheng, S.; Shui, Z.; Gao, X.; Yu, R.; Sun, T.; Guo, C.; Huang, Y. Degradation mechanisms of portland cement mortar under seawater attack and drying-wetting cycles. Constr. Build. Mater. 2020, 230, 116934. [Google Scholar] [CrossRef]
  13. Yu, H.; Tan, Y.; Yang, L. Microstructural evolution of concrete under the attack of chemical, salt crystallization, and bending stress. J. Mater. Civ. Eng. 2007, 29, 7. [Google Scholar] [CrossRef]
  14. Wang, D.; Liu, G.; Wang, Z.; Jia, X.; Luo, S. The role of limestone powder in the corrosion products of cement mortars under magnesium sulfate solution. J. Mater. Civ. Eng. 2022, 34, 04022021. [Google Scholar] [CrossRef]
  15. Yao, J.; Chen, J. Sensitivity analysis of the deterioration of concrete strength in marine environment to multiple corrosive ions. Front. Struct. Civ. Eng. 2022, 16, 175–190. [Google Scholar] [CrossRef]
  16. Lee, S.T.; Park, D.W.; Ann, K.Y. Mitigating effect of chloride ions on sulfate attack of cement mortars with or without silica fume. Can. J. Civ. Eng. 2008, 35, 1210–1220. [Google Scholar] [CrossRef]
  17. Li, X.; Shui, Z.; Yu, R.; Wang, X. Magnesium induced hydration kinetics of ultra-high performance concrete (UHPC) served in marine environment: Experiments and modelling. Constr. Build. Mater. 2019, 224, 1056–1068. [Google Scholar] [CrossRef]
  18. Xu, J.; Mo, R.; Wang, P.; Zhou, J.; Dong, X.; She, W. Coupled transport of sulfate and chloride ions with adsorption effect: A numerical analysis. Front. Mater. 2020, 7, 536517. [Google Scholar] [CrossRef]
  19. Li, J.; Xu, Y.; Tian, Z.; Ma, J.; Jing, P.; Song, Z. Study on leaching damage mechanism of calcium ions of reactive powder concrete (RPC) under ion corrosion. Constr. Build. Mater. 2021, 269, 121303. [Google Scholar] [CrossRef]
  20. Zhang, W.; Gong, S.; Kang, B. Surface Corrosion and microstructure degradation of calcium sulfoaluminate cement subjected to wet-dry cycles in sulfate solution. Adv. Mater. Sci. Eng. 2017, 2017, 1464619. [Google Scholar] [CrossRef]
  21. Wu, M.; Zhang, Y.; Ji, Y.; She, W.; Yang, L.; Liu, G. A comparable study on the deterioration of limestone powder blended cement under sodium sulfate and magnesium sulfate attack at a low temperature. Constr. Build. Mater. 2020, 243, 118279. [Google Scholar] [CrossRef]
  22. Sun, H.; Jiang, C.; Cao, K.; Yu, D.; Liu, W.; Zhang, X.; Xing, X.; Zhao, D. Monitoring of steel corrosion and cracking in cement paste exposed to combined sulfate-chloride attack with X-ray microtomography. Constr. Build. Mater. 2021, 302, 124345. [Google Scholar] [CrossRef]
  23. Zhang, G.; Wu, C.; Hou, D.; Yang, J.; Sun, D.; Zhang, X. Effect of environmental pH values on phase composition and microstructure of portland cement paste under sulfate attack. Compos. Part B-Eng. 2021, 216, 108862. [Google Scholar] [CrossRef]
  24. T\CECS G:D51-01-2019; Technical Specification for Road Semi-Flexible Pavement. China Association for Engineering Construction Standardization: Beijing, China, 2019.
  25. JTG E30-2005; Test Method of Cement and Concrete for Highway Engineering. Ministry of Transport of the People’s Public of China: Beijing, China, 2005.
  26. Kong, D.; Pan, H.; Wang, L.; Corr, D.J.; Yang, Y.; Shah, S.P.; Sheng, J. Effect and mechanism of colloidal silica sol on properties and microstructure of the hardened cement-based materials as compared to nano-silica powder with agglomerates in micron-scale. Cem. Concr. Compos. 2019, 98, 137–149. [Google Scholar] [CrossRef]
  27. Zhu, N.; Jin, F.; Kong, X.; Xu, Y.; Zhou, J.; Wang, B.; Wu, H. Interface and anti-corrosion properties of sea-sand concrete with fumed silica. Constr. Build. Mater. 2018, 188, 1085–1091. [Google Scholar] [CrossRef]
Figure 1. Cement and admixture: (a) cement, (b) accelerating agent, (c) water-reducing agent, and (d) expansion agent.
Buildings 12 01376 g001
Figure 2. MgSO4 and its SEM image: (a) MgSO4 powder; (b) SEM microscopic image.
Buildings 12 01376 g002
Figure 3. The flexural and compressive strength curves: (a) Flexural strength; (b) Compressive strength; (c) Flexural strength; (d) Compressive strength.
Buildings 12 01376 g003
Figure 4. The SEM images of the HECM: (a) 0%, 3 days; (b) 0%, 7 days; (c) 0%, 14 days; (d) 0%, 28 days; (e) 3%, 3 days, OU; (f) 6%, 3 days, OU; (g) 9%, 3 days, OU; (h) 12%, 3 days, OU; (i) 3%, 7 days, OU; (j) 6%, 7 days, OU; (k) 9%, 7 days, OU; (l) 12%, 7 days, OU; (m) 3%, 14 days, IN; (n) 6%, 14 days, IN; (o) 9%, 14 days, IN; (p) 12%, 14 days, IN; (q) 3%, 28 days, IN; (r) 6%, 28 days, IN; (s) 9%, 28 days, IN; (t) 12%, 28 days, IN; (u) 3%, 3 days, IN; (v) 3%, 7 days, IN; (w) 3%, 14 days, OU; (x) 3%, 28 days, OU.
Buildings 12 01376 g004
Figure 5. The diffraction pattern of the HECM: (a) Corrosion for 0-day; (b) Corrosion for 3 days; (c) Corrosion for 7 days; (d) Corrosion for 14 days; (e) Corrosion for 28 days.
Buildings 12 01376 g005aBuildings 12 01376 g005b
Figure 6. The diffraction peak intensity of CH crystals: (a) IN; (b) OU; (c) IN; (d) OU.
Buildings 12 01376 g006
Figure 7. Typical DSC curve.
Buildings 12 01376 g007
Figure 8. Mass loss rule of hydration products in the first stage of endothermic peak: (a) IN; (b) OU; (c) IN; (d) OU.
Buildings 12 01376 g008
Figure 9. Changes in the peak area of hydration products in the first stage of endothermic peak: (a) IN; (b) OU; (c) IN; (d) OU.
Buildings 12 01376 g009
Figure 10. Mass loss rule of hydration products in the second stage of endothermic peak: (a) IN; (b) OU; (c) IN; (d) OU.
Buildings 12 01376 g010
Figure 11. Changes in the peak area of hydration products in the second stage of endothermic peak: (a) IN; (b) OU; (c) IN; (d) OU.
Buildings 12 01376 g011
Figure 12. The relationship between strength and mass loss.
Buildings 12 01376 g012
Table 1. Technological parameters of the HECM.
TypeFluidity
(s)
Flexural Strength (MPa)Compressive Strength (MPa)Shrinkage Rate (%)
1 day 3 days7 days14 days28 days1 day 3 days7 days14 days28 days7 days28 days
HECM11.33.898.3711.1011.6112.0613.9727.1135.8937.9038.890.0170.088
Standard9–13----≥2--------≥30------<0.5
Table 2. Technical parameters of MgSO4..
Molecular FormulaMolecular WeightContentPurity Level
MgSO4·7H2O246.47>99%Industrial-grade
Table 3. The data of flexural and compressive test.
Testing Age (Days) Concentration (%)Flexural Strength (MPa)Compressive Strength (MPa)
308.3727.11
38.1926.95
67.8526.04
97.7325.39
127.4323.82
7011.1035.89
310.2934.91
610.1234.66
99.6833.79
129.3732.96
14011.6137.90
38.7936.33
68.2235.90
98.3634.71
128.1934.91
28012.0638.89
38.1236.12
68.3736.36
98.0435.52
127.6934.95
Publisher’s Note: MDPI stays neutral with regard to jurisdictional claims in published maps and institutional affiliations.

