Article

Numerical Investigations on Axial Compressive Behavior of Opening Cold-Formed Thin-Wall C-Steel Combined Double-Limb Column

Department of Structural Engineering, School of Civil Engineering, Central South University, Changsha 410075, China
*
Author to whom correspondence should be addressed.
Buildings 2022, 12(9), 1378; https://doi.org/10.3390/buildings12091378
Submission received: 8 August 2022 / Revised: 26 August 2022 / Accepted: 31 August 2022 / Published: 4 September 2022
(This article belongs to the Special Issue Advances in Design and Disaster Mitigation of Engineering Structures)

Abstract

:
To investigate the axial compressive behavior of an opening cold-formed thin-wall C-steel combined double-limb column, C-steel combined I-section columns were modeled in this paper, and the models were validated by experiments on axial-compressed combined columns. Parametric analyses were carried out on the combined columns. The effects of slenderness ratio, height to thickness ratio, width to thickness ratio, bolt spacing, and opening in the web on the ultimate compressive bearing capacity of the combined columns were investigated. It was observed that the slenderness ratio had the most significant effects on the combined column. Furthermore, the formulas predicting the compressive bearing capacity in the Chinese and AISI standards were compared, and the accuracy of the formulas was studied. Afterward, the formulas with higher accuracy and applicability for the ultimate compressive bearing capacity for the C-steel combined I-section column were proposed. The compression stability factor and reduction factor were fitted in this paper. The proposed formulas and factors can predict the ultimate compressive bearing capacity of the C-steel combined I-section column.

1. Introduction

Steel structures and composite structures have been widely used in civil and industrial engineering [1,2,3]. Due to its advantages of light weight, high strength, energy saving, environmental protection, and rapid construction [4,5], the cold-formed thin-walled steel structure has been widely used in engineering structures [6,7,8,9]. In applications of the columns, two or more U-shaped and C-shaped cold-formed thin-walled steel members are usually connected with self-tapping screws, rivets, or bolts to form combined columns with better mechanical properties. The combined components are suitable for multistorey buildings [10,11,12,13]. Compared with a single section, a cold-formed thin-walled steel combined column has the advantages of greatly improving the bearing capacity, bending and torsional stiffness, and convenient manufacturing and construction [14,15]. Among all kinds of combined cross-sections, the I-shaped cross-section with two C-shaped cross-sections assembled back-to-back is the most widely used, and its structural schematic diagram is shown in Figure 1. In this paper, this type of combined column is called a C-steel combined I-section column.
In recent decades, much research has been conducted on cold-form thin-walled combined columns. Bae et al. carried out experiments on combined columns with U-shaped, 2U-shaped, and 2U + C-shaped combined cross sections, and proved that steel columns with combined cross sections have higher compressive bearing capacity [16]. Whittle and Ramseyer conducted experimental studies on a C-shaped thin-walled steel combined box section with double limb, and found that the reasonable spacing of connectors can effectively avoid the instability of members [17]. Zhou et al. carried out numerical analyses on the cold-formed thin-walled combined columns to investigate the influence of the sectional form, size, and slenderness ratio on the combination effects, and suggested that the stable bearing capacity of the combined column should be set as 0.7 times that of the overall sectional stability bearing capacity to ensure the reliability of the connector [18]. Chen et al. investigated the influence of the thickness of the backing plate and the spacing of the backing plate on the mechanical properties of the combined column through experiments and numerical studies, and proposed a formula for calculating the bearing capacity of the columns with the effective width method [19,20,21]. Li et al. proposed a formula for calculating the elastic distortion buckling stress of the combined box-section columns [22]. Dabaon and Ellobody studied the failure mode and deformation behavior of combined columns through experiments, and found that the European code and Australian code were not conservative for the destruction of the combined columns with local buckling [23,24]. Abbasi and Khezri analyzed the elastic buckling of the combined columns, and proposed an element with adjustable stiffness characteristics to simulate connectors between the combined columns [25]. Recently, Rahnavard also carried out numerical analyses on the box-section combined columns, and investigated the influence of the form and spacing of the batten plate on the buckling behavior of combined members [26]. Zhou et al. carried out axial compression tests on long columns with C-shaped cross-section and box-shaped cross-section combined with the C-steel. It was found that the failure mode of the specimens was mainly global bending [27,28,29,30].
Since the I-shaped cross section column has been widely adopted in building engineering, many studies have been conducted on the C-steel combined I-section column with double limb. Stone and Laboube analyzed the buckling form and ultimate bearing capacity of 32 assembled I-section members connected by self-drilling screws under axial compression, and proved that the ultimate bearing capacity calculated by the American code was conservative [31]. Yao studied the effects of the slenderness ratio and screw spacing on the mechanical properties of I-section steel columns. The experiments showed that the slenderness ratio had a great influence on the compressive bearing capacity of I-section steel columns [32]. Fratamicoa carried out buckling and failure tests and numerical analyses on I-shaped cross-section columns with double-limb open-ended grooved steel. It was found that local–global mutual buckling and bending–torsional buckling are common failure modes of open-ended assembled specimens [33,34]. In addition, through Southwell’s method [35] to obtain the end stiffness, the design method based on direct strength was proposed. Roy and Ting focused on the influence of the member thickness and slenderness ratio on the compression performance of the combined I-shaped members. The results showed that the thickness and slenderness ratio were important factors affecting the bearing capacity of the composite column [36,37]. In previous research, it was observed that the lateral torsional buckling occurred at the beam or column [38,39,40,41]. The lateral torsional buckling of the C-steel combined I-section column should be investigated.
In summary, in previous research, the connection form of cold-formed thin-walled steel I-section columns was mostly screw connection. There are few studies on the bolt-connected combined I-section column. Furthermore, the research was mostly concentrated on the combined I-section column with complete section form. There are few studies on I-section combined column with opening web. The openings in the web may affect the compressive bearing capacity of the I-section combined column. To investigate the axial compressive behavior of the C-steel combined I-section column, the finite element models of the columns were established in this paper. The finite element models were validated by experiments. In addition, parametric analyses were conducted on the I-section combined columns with complete and opening webs to investigate the mechanical behaviors. Moreover, the design formulas of the I-section combined column were proposed, and the applicability and accuracy of the proposed formulas were verified in this paper.

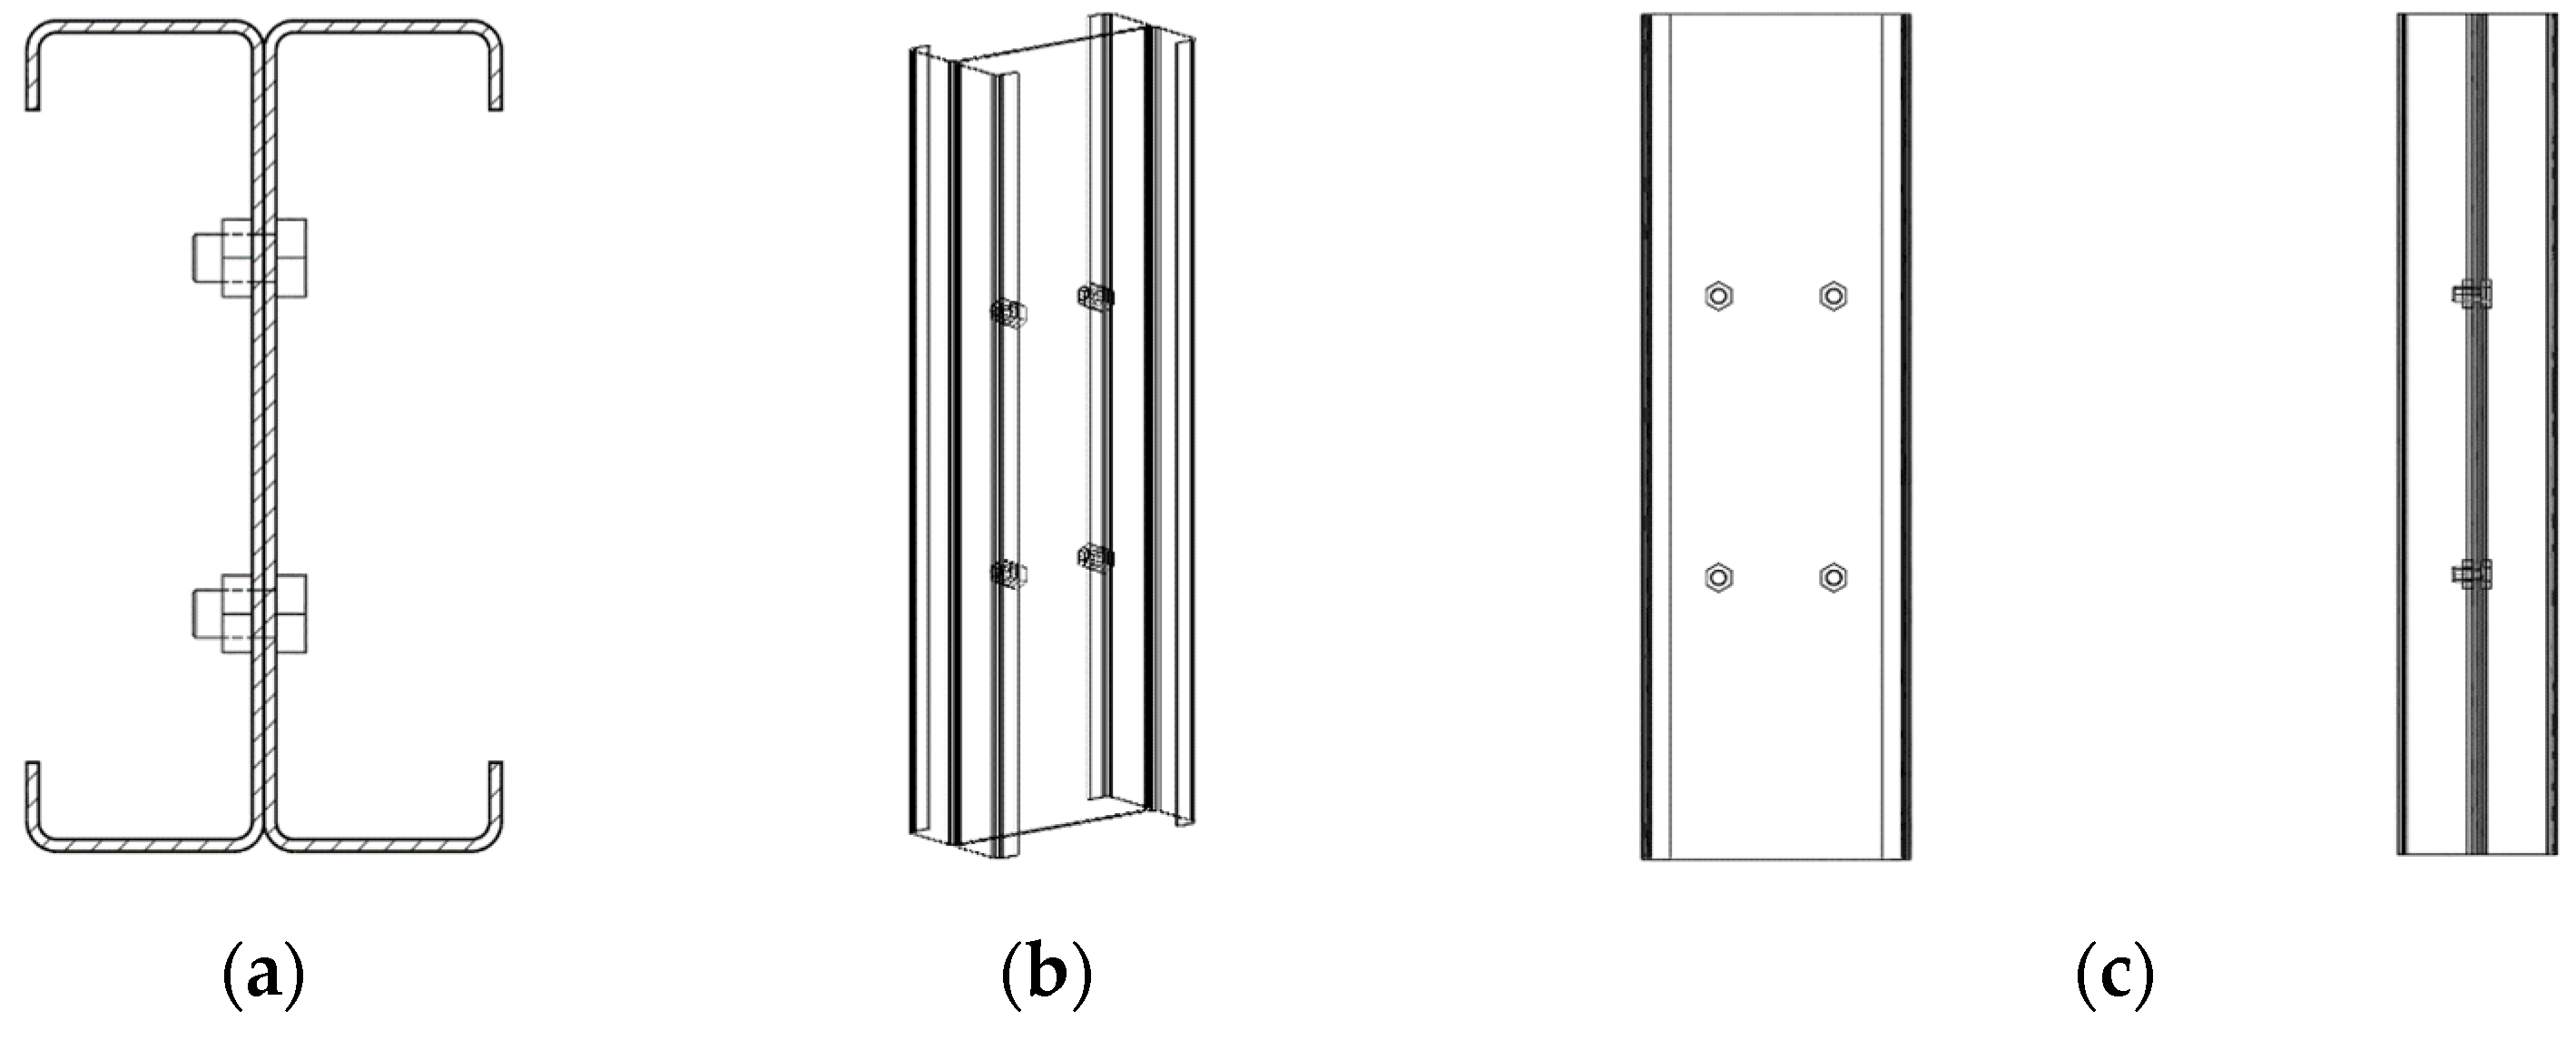
2. Numerical Simulations on C-Steel Combined I-Section Columns

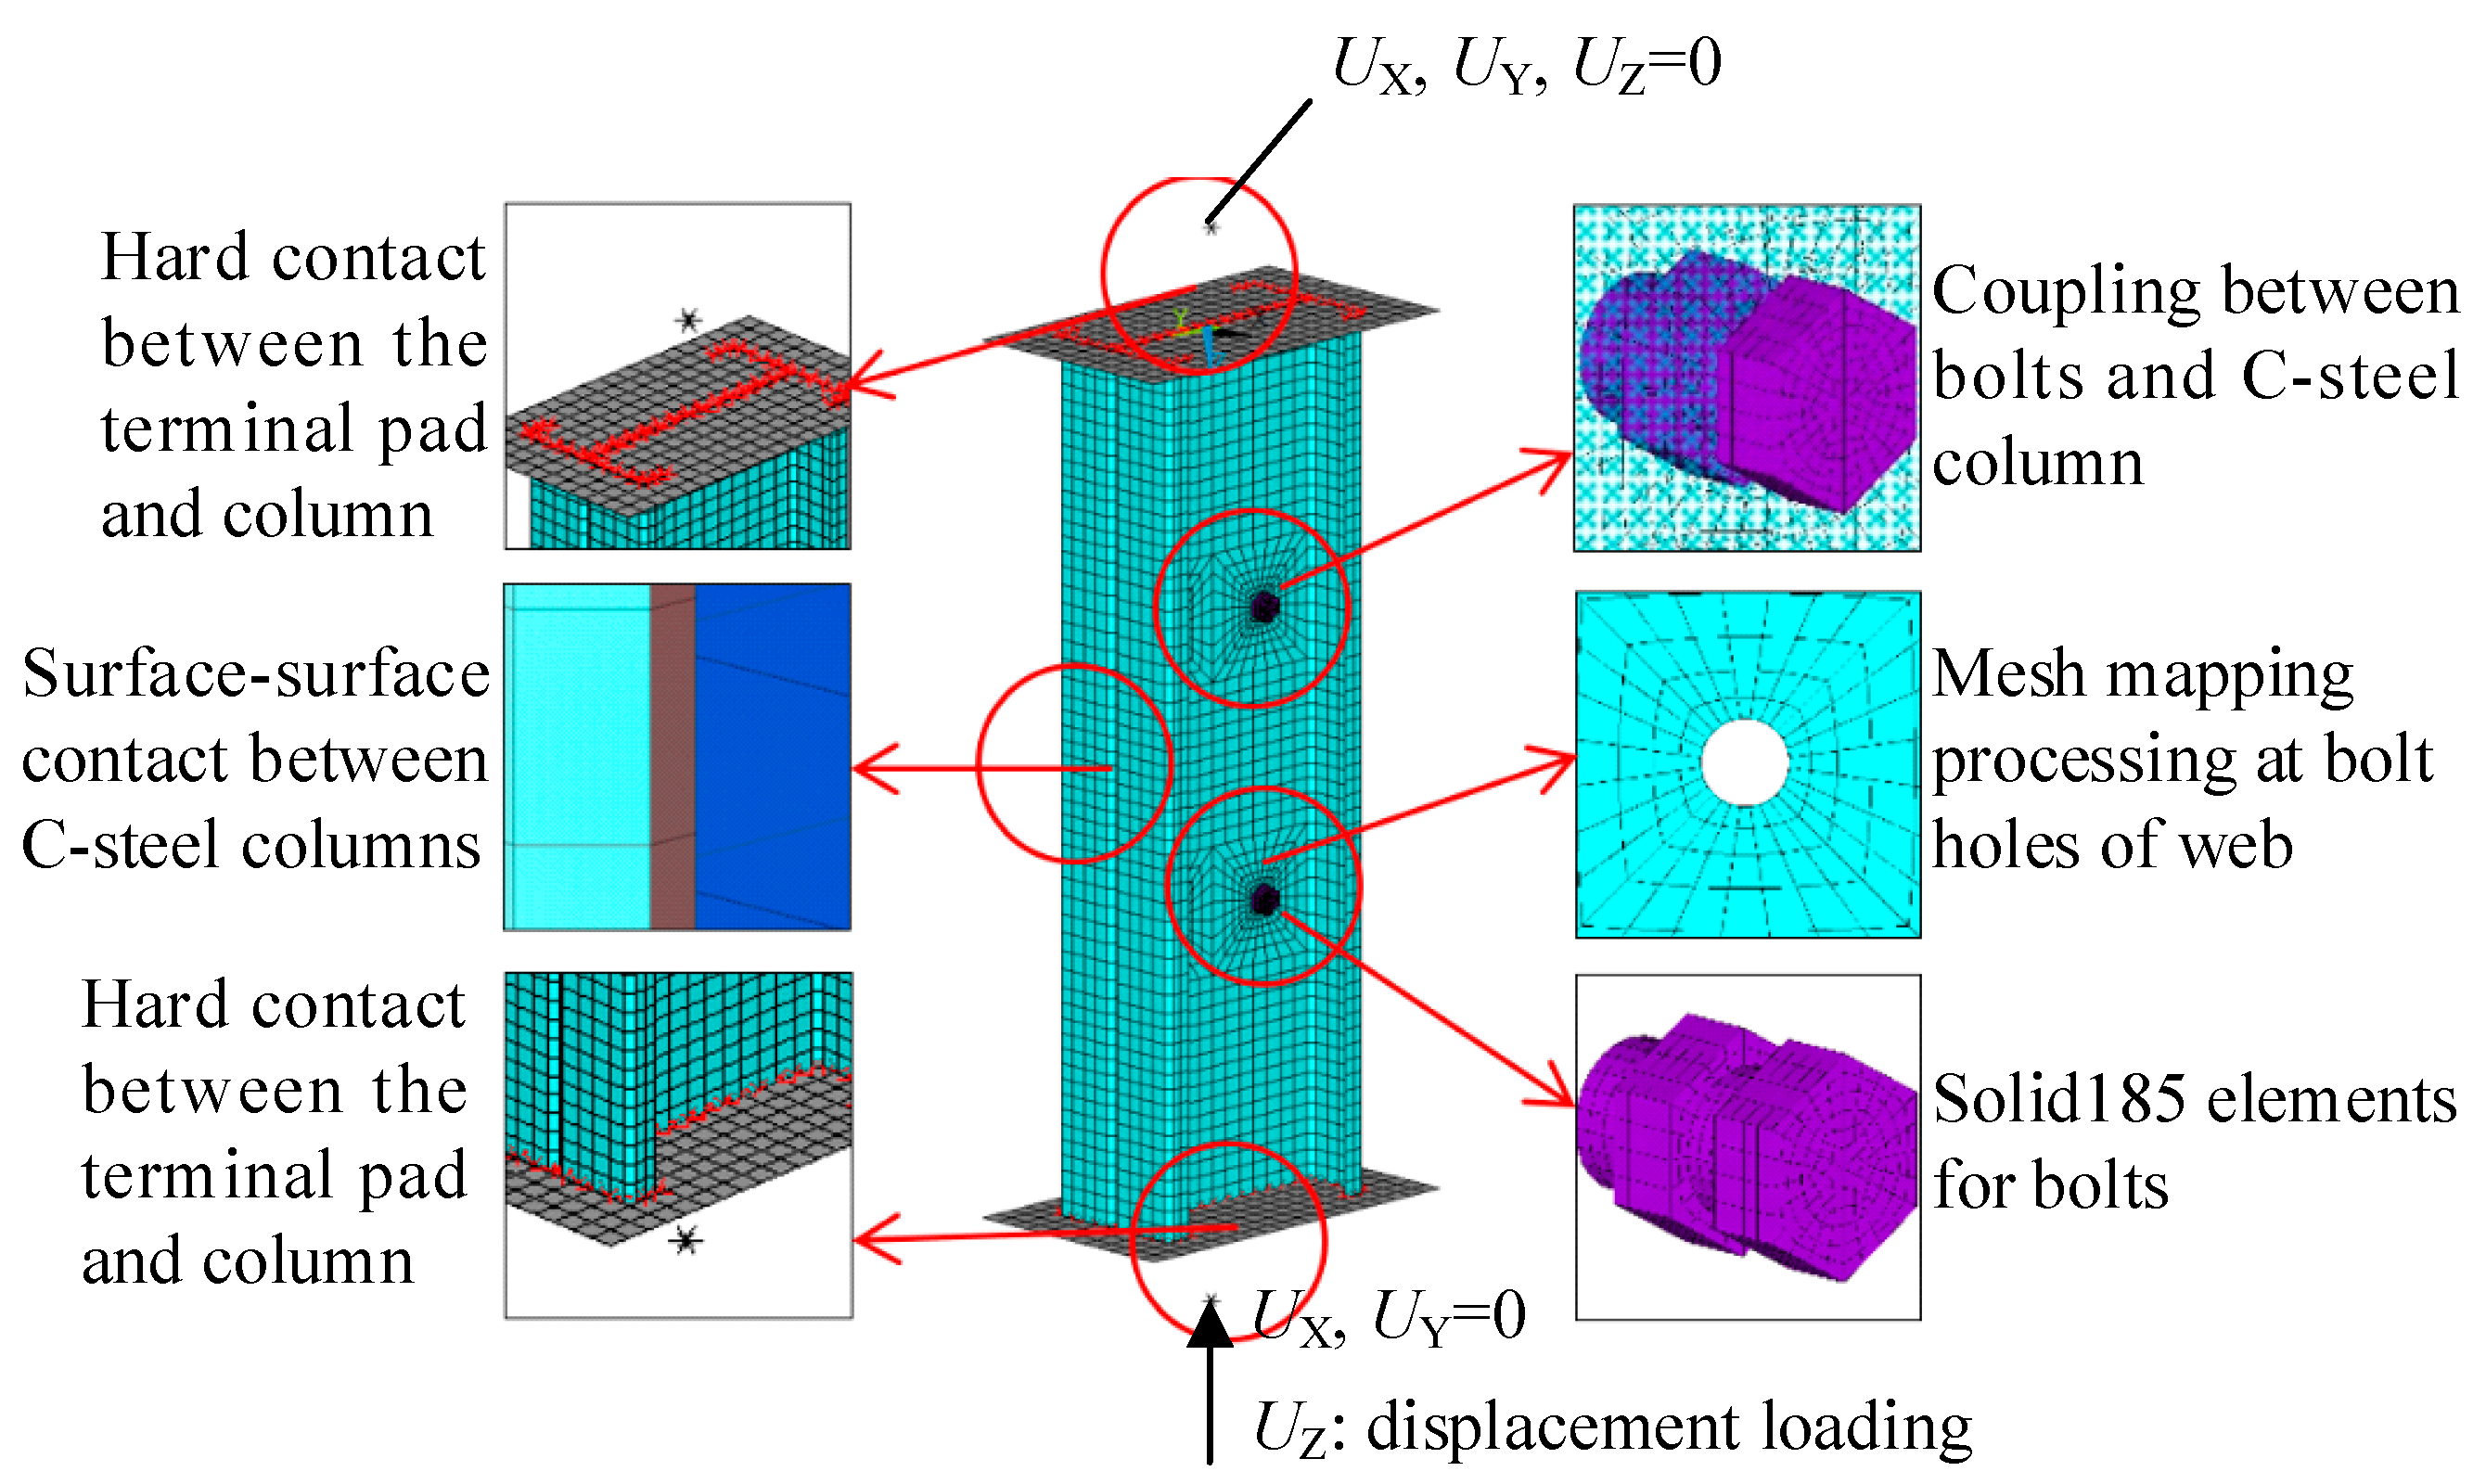
2.1. Finite Element Models

To investigate the compressive performance of the cold-formed thin-walled C-steel combined I-section columns with double limbs and the factors affecting their buckling mode, the C-steel combined I-section columns were simulated in Ansys [42]. In the combined column, the C-steel and terminal pad were simulated by Shell 181 elements, and the bolts in the web were modeled by Solid 185 elements. Since the two C-shaped steels were combined, the interactions between the two C-shaped steels were set as Targel 70 and Contal 174, respectively. Furthermore, the interactions between the C-shaped steels and terminal pads were surface-to-line interaction. Thus, the interactions between the terminal pad and C-shaped steels were set as Targel 70 and Contal 175, which can obtain better simulation effects in surface-to-line interaction [42]. In the finite element models, the pre-tension was set as 125 kN. The combined specimens in [43] were simulated in this paper, and the parameters of the specimens are listed in Table 1. The meanings of the notations in Table 1 are shown in Figure 2. Moreover, δ0, λy, and A denote the initial geometric defect, slenderness ratio of a single limb component in the weak axis direction, and sectional area of the combined column, respectively. The naming rules of the specimens are shown in Figure 3. In Figure 3, the prefixes S, M, and L denote the short, medium, and long columns, respectively.
According to the material tests in [43], the elastic modulus, Poisson’s ratio and yield strength of the steel were set as 2.05 × 10⁵ N/mm2, 0.303 and 305.4 N/mm2, respectively. In the finite element simulations, the von Mises yield rule was used. To simulate the boundary conditions, in the finite element models, the translation displacements ux, uy, and uz of the upper terminal pad were constrain, and the ux and uy displacements of the bottom terminal pad were fixed. The finite element model of the C-steel combined I-section column is shown in Figure 4.

2.2. Finite Element Model Validations

The ultimate compressive bearing capacities of the combined columns in experiments and simulations are listed in Table 2. In Table 2, NFE and NTE denote the compressive bearing capacities obtained by the finite element analyses and experiments. According to Table 2, the compressive bearing capacities obtained by the simulations and experiments were similar, and the average error was 2.6%. Furthermore, the failure mode obtained by the simulations were the same as those observed in the tests. Figure 5 shows the load–vertical displacement (F-Δ) relationship curves of the specimens. For the short, medium, and long combined columns, the curves obtained by tests and simulations were similar. Moreover, the failure modes of the C-steel combined I-section columns are compared in Figure 6. The failure modes observed in the tests and predicted in the numerical analyses were the same. Therefore, the finite element modeling method was validated and can be adopted to investigate the ultimate compressive bearing capacity of the C-steel combined I-section columns.

3. Parametric Analyses on C-Steel Combined I-Section Columns

To investigate the effects of different parameters on the ultimate compressive bearing capacity of the combined columns, 171 combined columns were analyzed in this section. In the analyses, the initial defect mode was set as the first-order buckling mode shape, and the defect value was set as L/1000 [44], where L is the length of the column. In this section, the effects of the holes on the web were also studied, and the naming rule of the combined columns in the parametric analyses is shown in Figure 7.

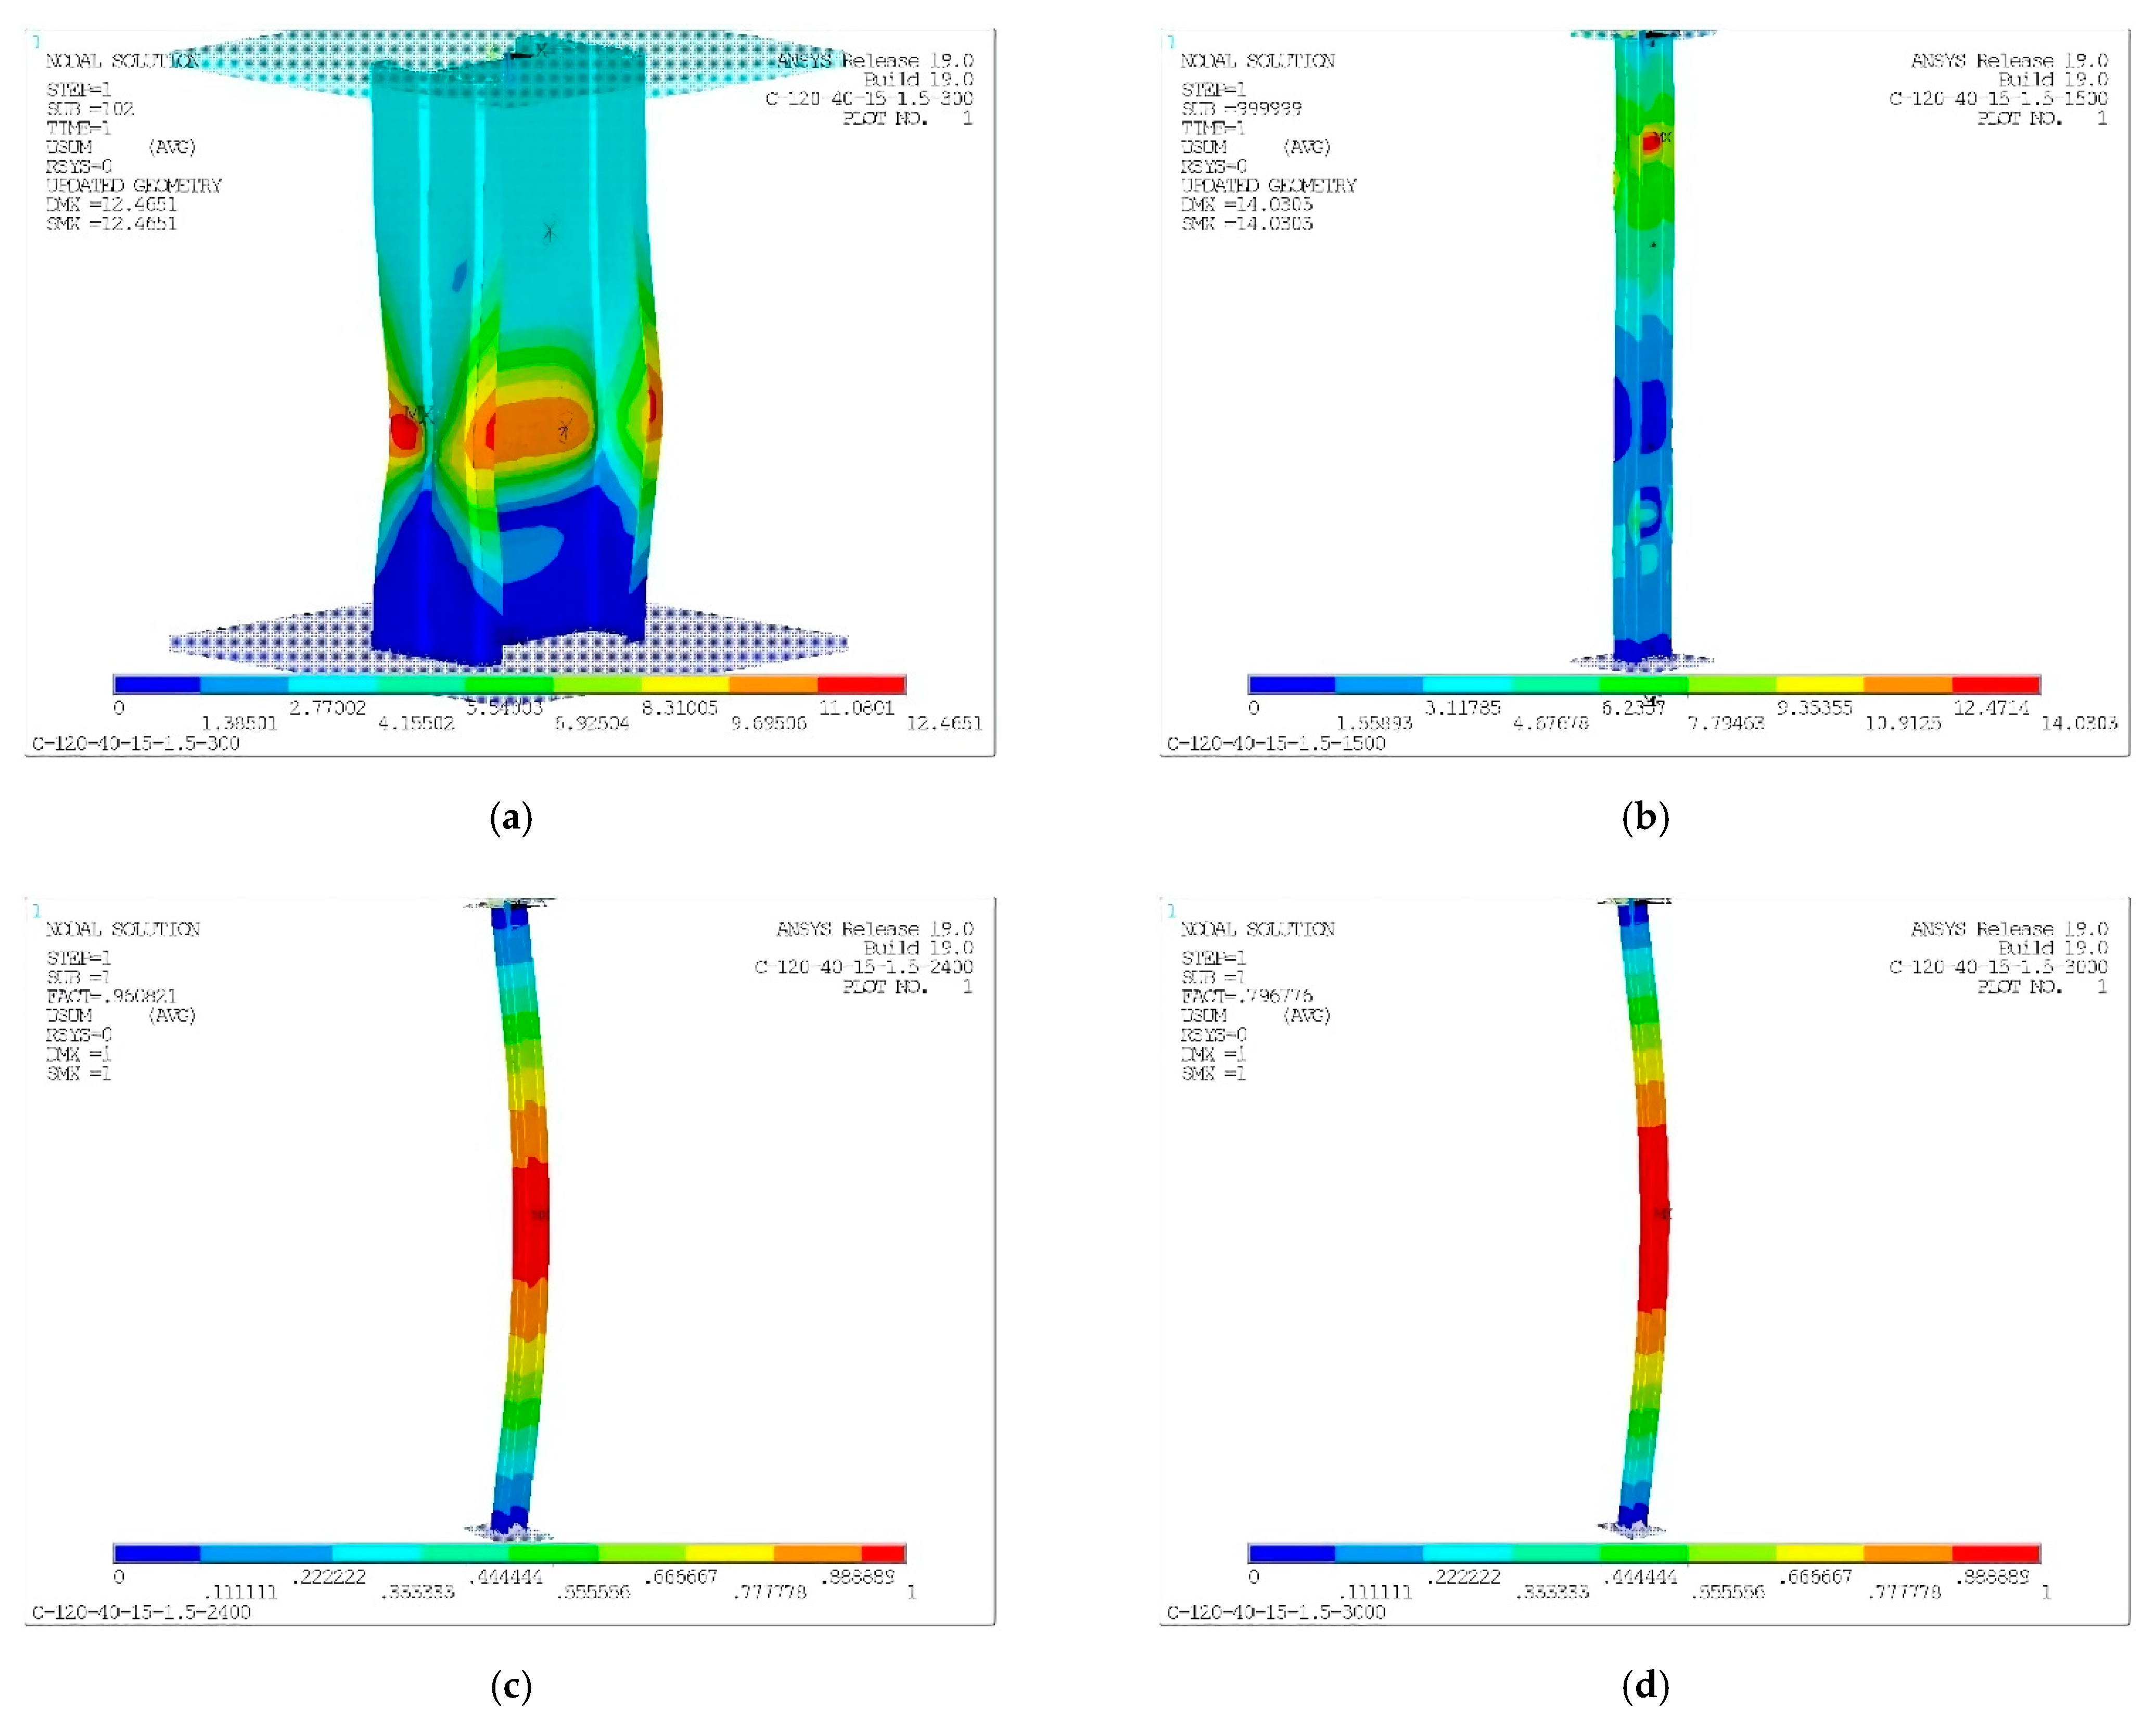
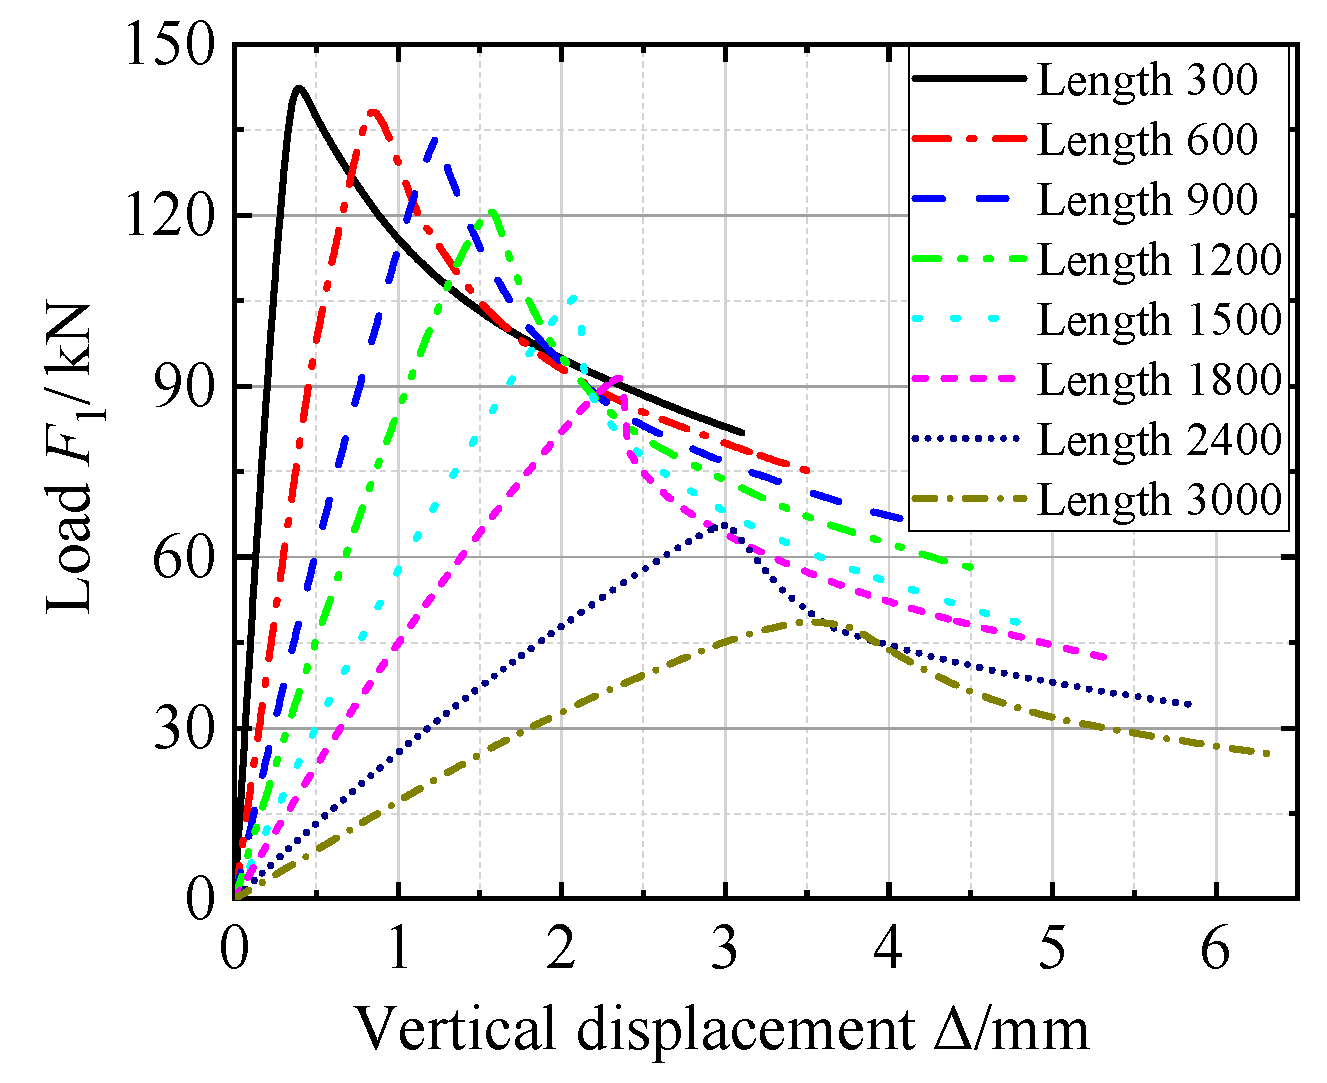
3.1. Effects of Slenderness Ratio

To investigate the effects of the slenderness ratio on the ultimate compressive bearing capacity, the combined columns, C90-40-15-1.5, C120-40-15-1.5, C140-40-15-1.5, and C160-40-15-1.5, with different lengths (300, 600, 900, 1200, 1500, 1800, and 3000 mm) were modeled in this section. Taking C120-40-1.5 combined columns as examples, with different length, the failure modes of the columns are shown in Figure 8, and the load–vertical displacement relationship curves of C120-40-1.5 combined columns are shown in Figure 9. For the short, medium, and long columns, the failure modes were local, local buckling–distortion, and overall buckling, respectively.
With different slenderness ratios, the ultimate compressive bearing capacities of the four series combined columns are shown in Figure 10. The compressive bearing capacity decreased with the increase in the slenderness ratio. When the slenderness ratios ranged from 10 to 75 and 150 to 210, the compressive bearing capacity decreased slowly. With the slenderness ratios lower than 75, the two C steels in the combined columns constrained with each other, and only local buckling could be observed. When the slenderness ratios were 75~150, the compressive bearing capacity decreased rapidly, caused by the distortion in the combined columns. When the slenderness ratios were greater than 150, overall buckling occurred. Thus, the compressive bearing capacity decreased rapidly.

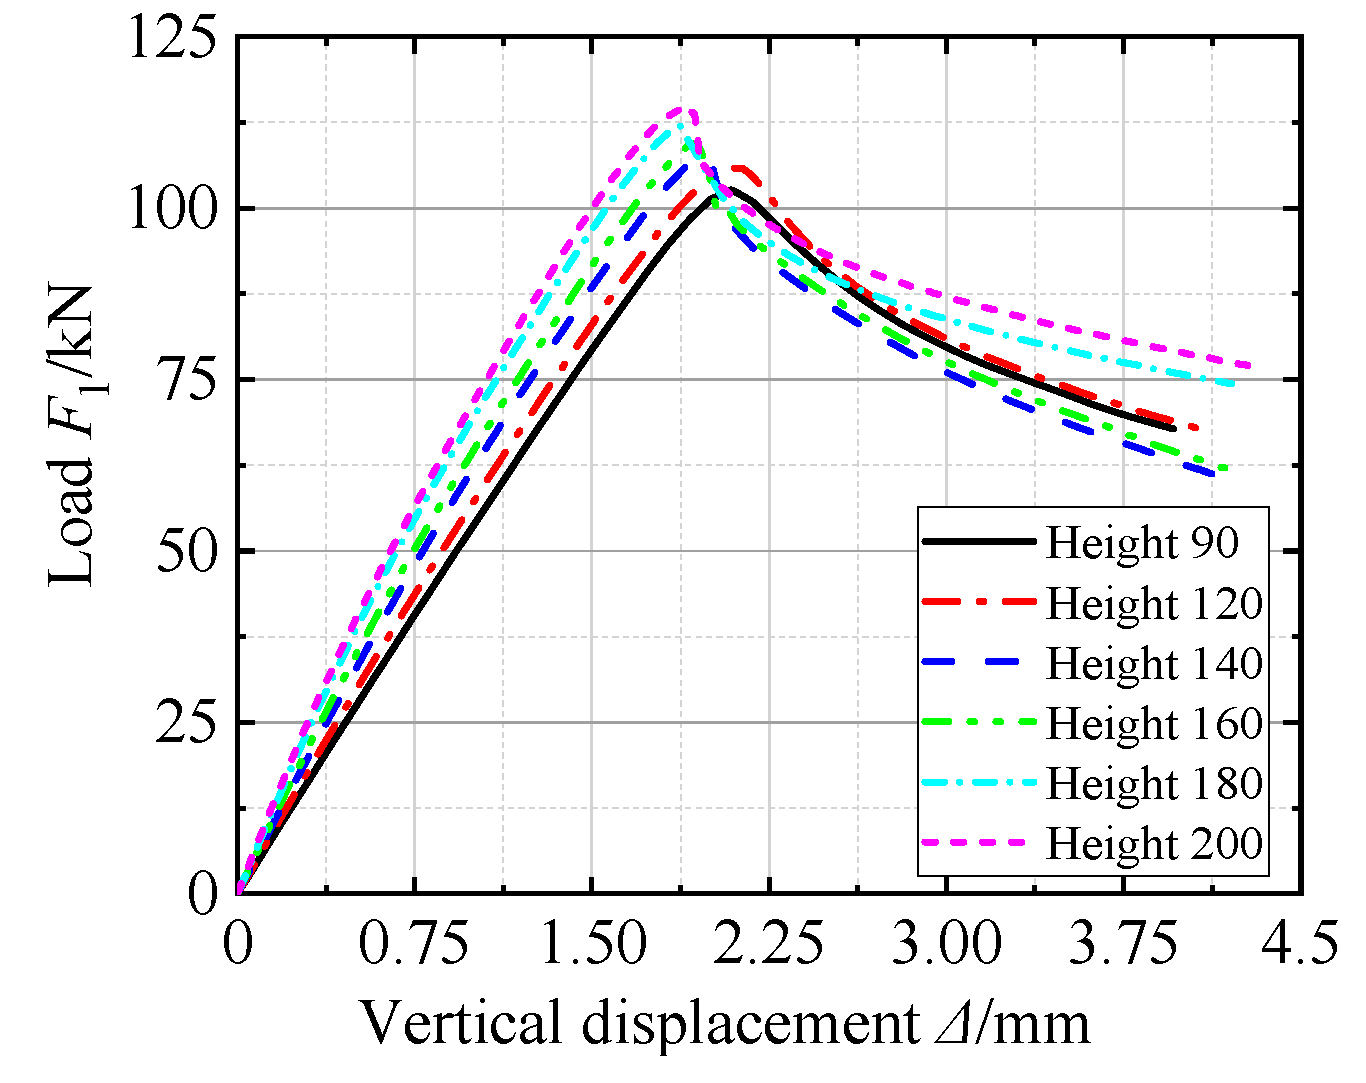
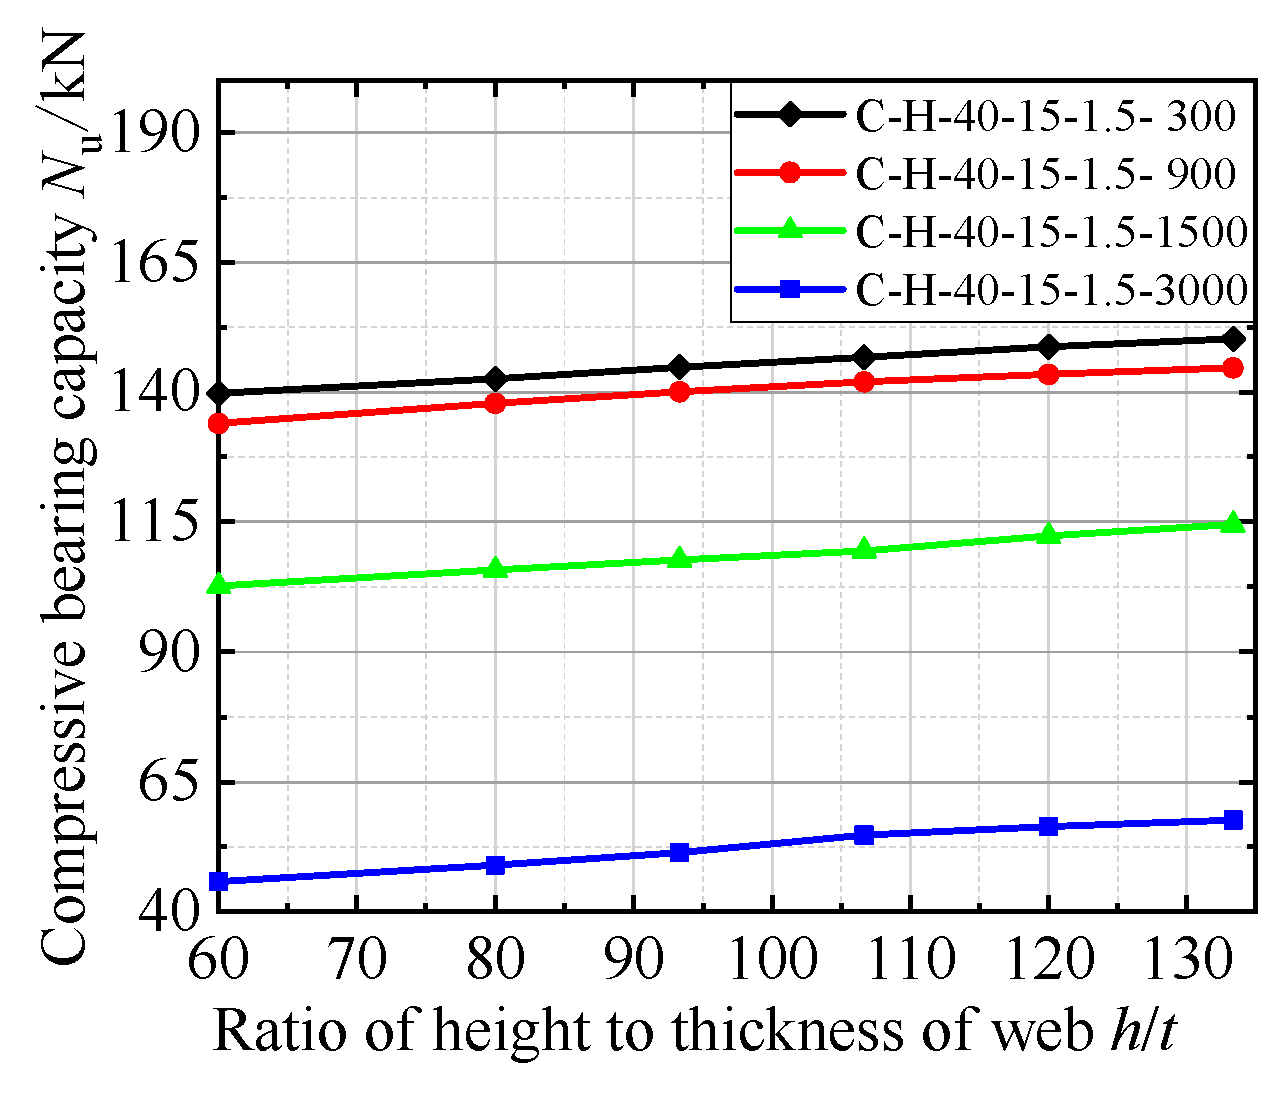
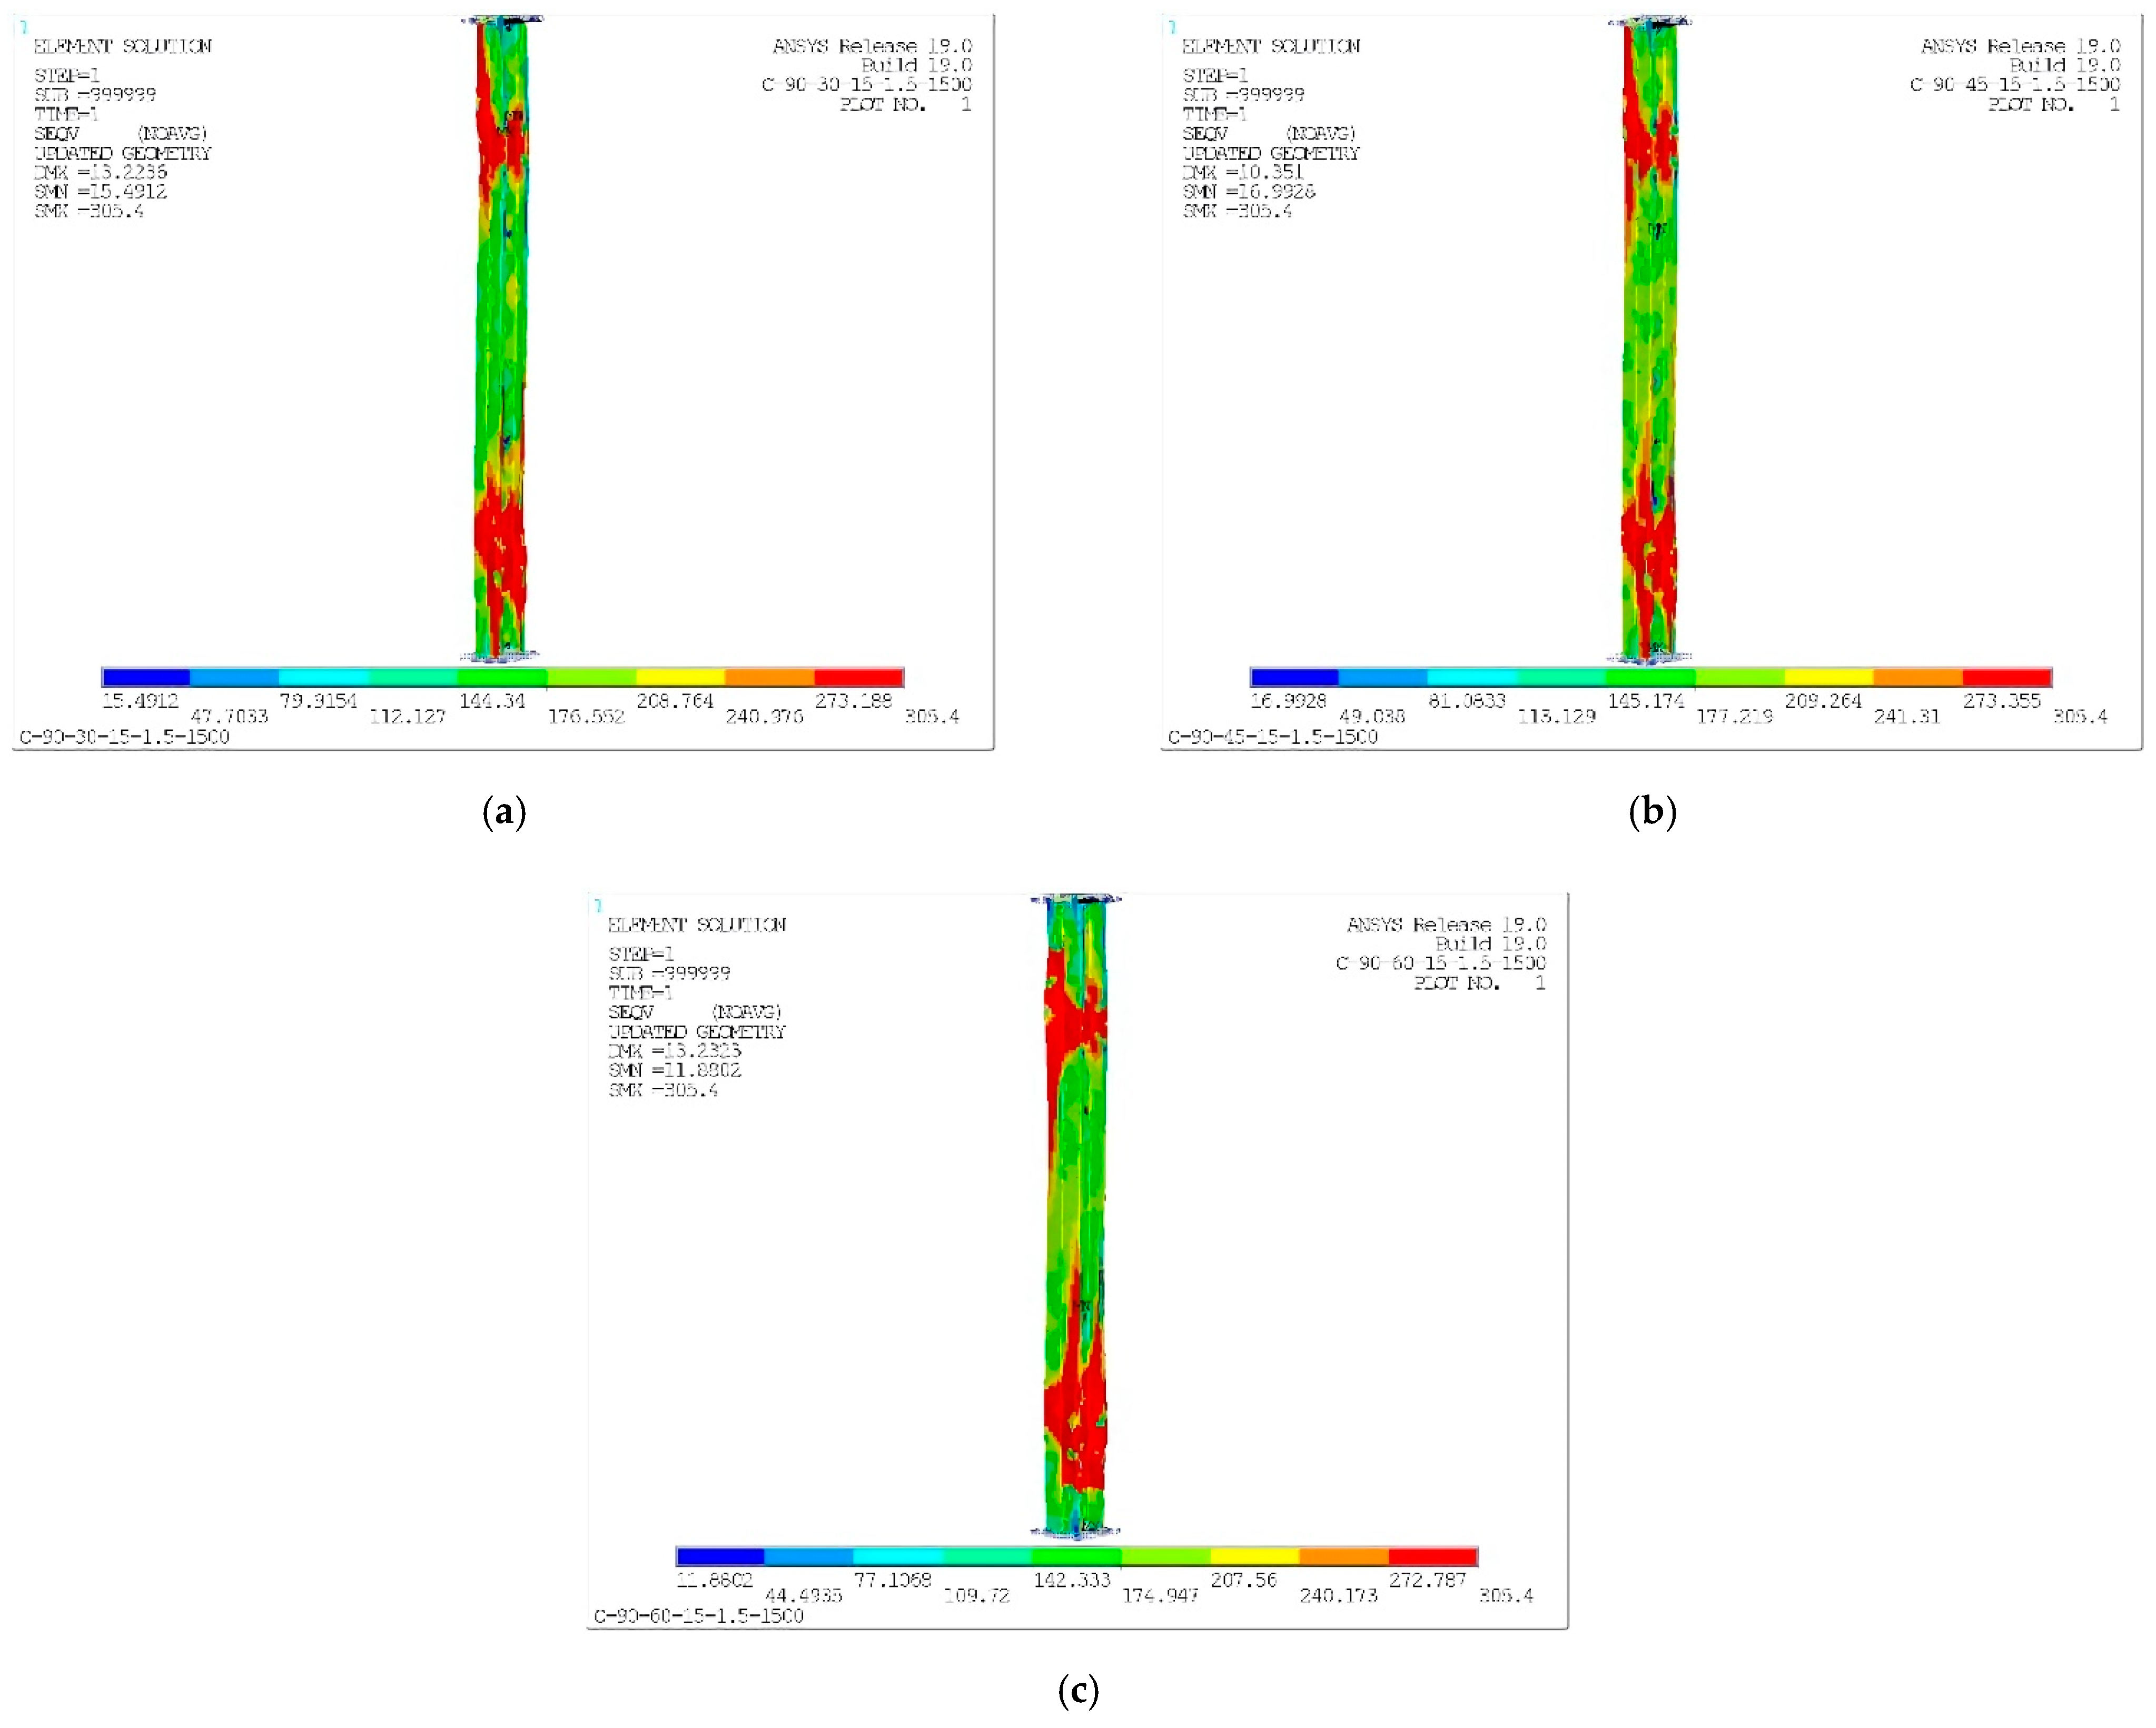
3.2. Effects of Height to Thickness Ratio of Web

To investigate the effects of height to thickness ratio of the web on the ultimate compressive bearing capacity of the C-steel combined I-section columns, parametric analyses were carried out on the columns with a width of flange, height of the curling, and thickness of the steel of 40 mm, 15 mm, and 1.5 mm, respectively. Furthermore, the columns with length of 300 mm, 900 mm, 1500 mm, and 3000 mm were analyzed. By changing the height of the C steels, the stress distributions of the 1500 mm-length combined columns are shown in Figure 11. With different height of the web, the load–vertical displacement relationship curves are shown in Figure 12. According to Figure 11 and Figure 12, with the increase in the height to thickness ratio, the vertical displacement decreased, and the ultimate bearing capacity increased. The maximum stresses gradually shifted to the web of the component. The ultimate compressive bearing capacity versus height to thickness ratio of the web relationship curves are shown in Figure 13. With the increase in height to thickness ratio of the web, the bearing capacity increased slowly. For the four series of combined columns, the increasing ratio of the height to thickness ratio was 122.2%, and the increasing ratios of the compressive bearing capacity were 7.5%, 8.0%, 11.5%, and 25.8%, respectively. In the models of the combined columns, with the increase in the height to thickness ratio of the web, the cross-sectional areas of the columns increased. Additionally, it further reduced the effect of height to thickness ratio of the web. Moreover, the direction of the web was in the major axis of the combined columns, and the failure of the columns was mainly in the weak axis. Thus, the effects of the height to thickness ratio of the web was not so obvious.

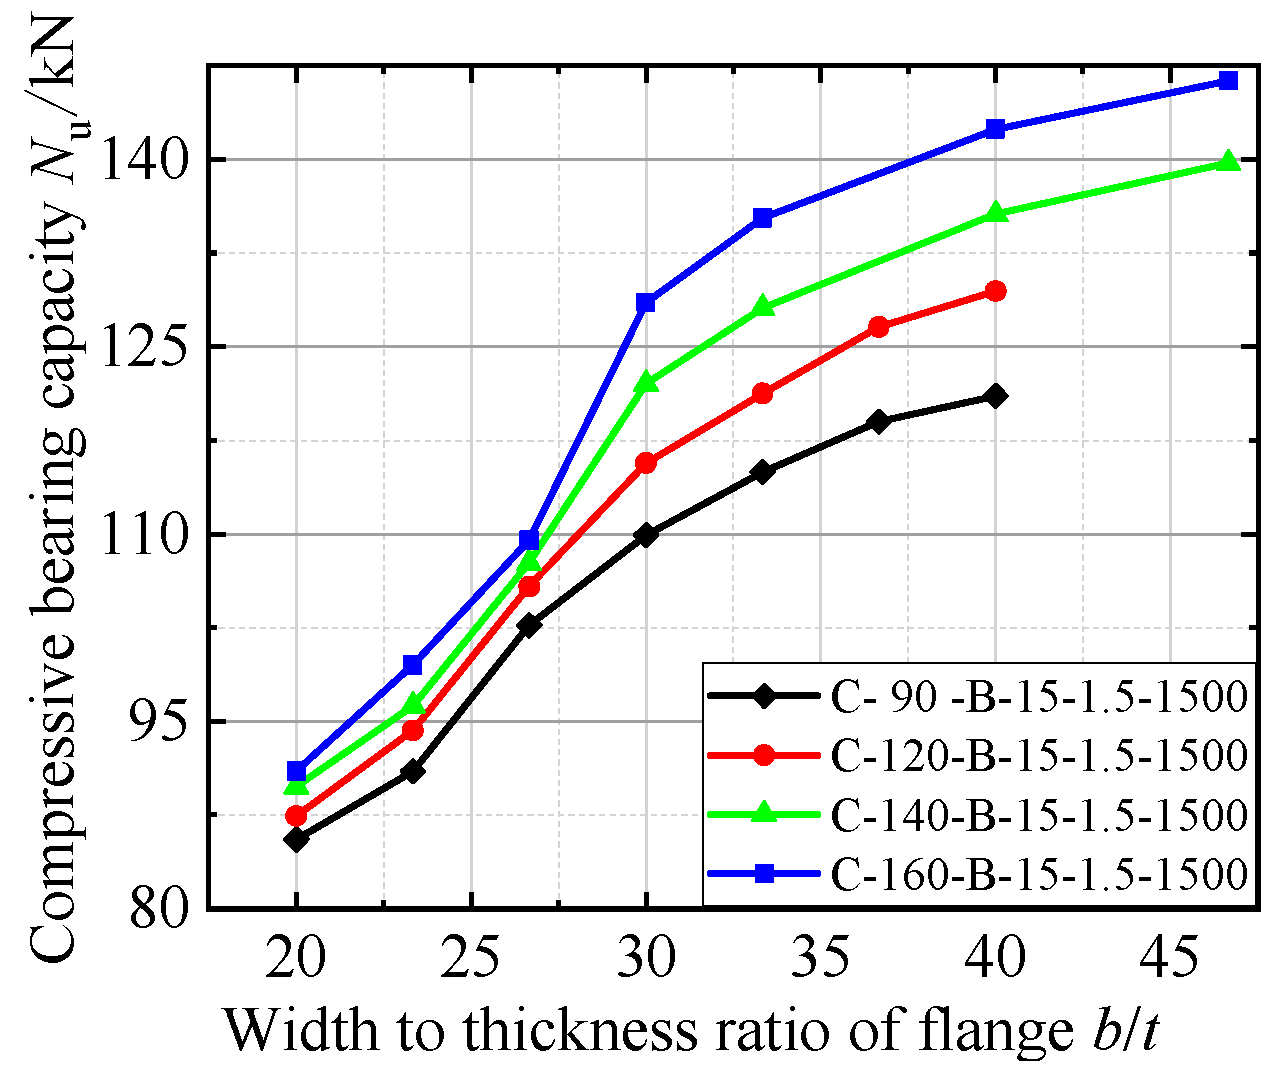
3.3. Effects of Width to Thickness Ratio of Flange

In the parametric analyses, the thickness of the thin-walled steel plate was set as 1.5 mm, and the height of the curling and the length of the column were 15 mm and 1500 mm, respectively. The combined columns with a height of 90 mm, 120 mm, 140 mm, and 160 mm were analyzed in this section. For the C90 series combined columns, under the ultimate compressive load, the stress distributions are shown in Figure 14. With the increase in the width to thickness ratio of the flange, the maximum stress gradually distributed on the flanges, which means that the loads bore by the flanges increased. Figure 15 shows the load–vertical displacement relationship curves of C90 series combined columns. The large width to thickness ratio of the flanges constrained the deformation. The ultimate compressive bearing capacity versus width to thickness ratio of the flange are shown in Figure 16. With the increase in the width to thickness ratio, the ultimate compressive bearing capacity increased. Furthermore, when the width to thickness of the flange was in the range of 22.5 to 30, the compressive bearing capacity increased rapidly. The direction of the flange was along the weak axis of the C-steel combined I-section column. Therefore, the effects of the width to thickness ratio of the flange were more obvious than those of the height to thickness ratio of the web. In this section, the parametric analyses were carried out on the medium columns. The large flange constrained the distortion of the columns effectively. It was the reason why the ultimate compressive bearing capacity increased with the increasing width to thickness ratio of the flange.

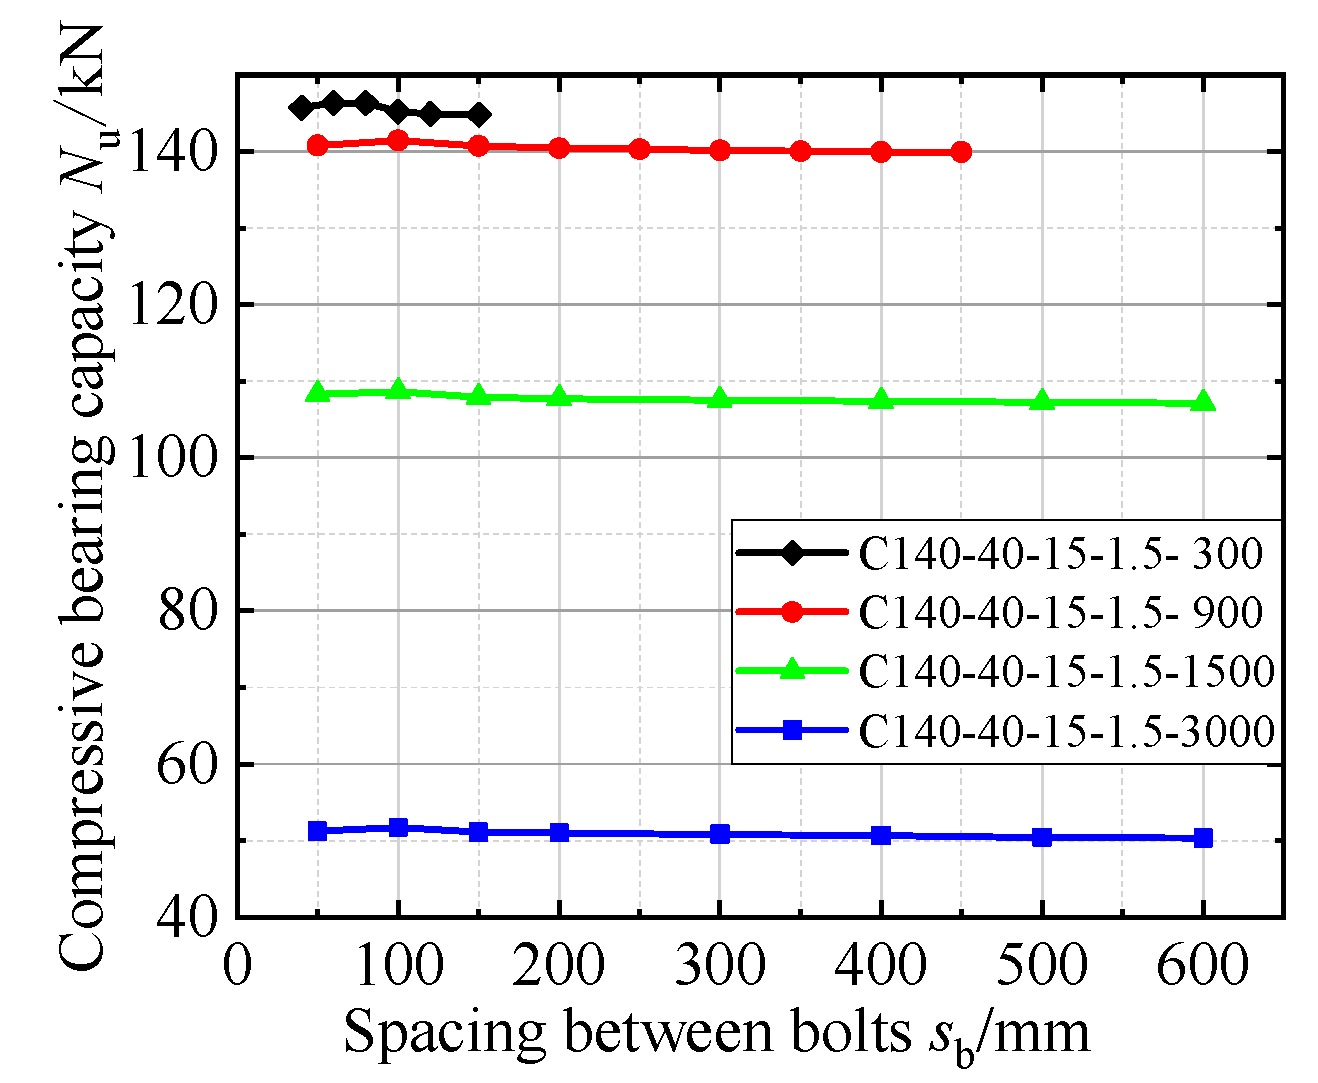
3.4. Effects of Bolt Spacing

The two C-steels were combined by the bolts on the webs to form an I-section column. The bolt spacing affects the combined effects. Li et al. recommended that the bolt spacing of the combined column should not be greater than 600 mm, and the number of bolts should be greater than three (when the length of the column is greater than 600 mm) [45]. In this section, parametric analyses were carried out on C140-40-15-1.5 combined columns to investigate the effects of the bolt spacing on the ultimate compressive bearing capacity. The lengths of the columns were set as 300 mm, 900 mm, 1500 mm, and 3000 mm. In the parametric analyses, the bolt spacings of the columns with different length can be found in Table 3. With different bolt spacing, the ultimate compressive bearing capacity of the I-section combined columns are shown in Figure 17. According to Figure 17, the bolt spacing had less influence on the compressive bearing capacity. For the four series of combined columns with different length, the bolt spacing increasing ratios were 275%, 800%, 1100%, and 1100%, respectively. However, the ultimate bearing capacity only increased by 0.6%, 0.6%, 1.1%, and 1.8%, respectively.

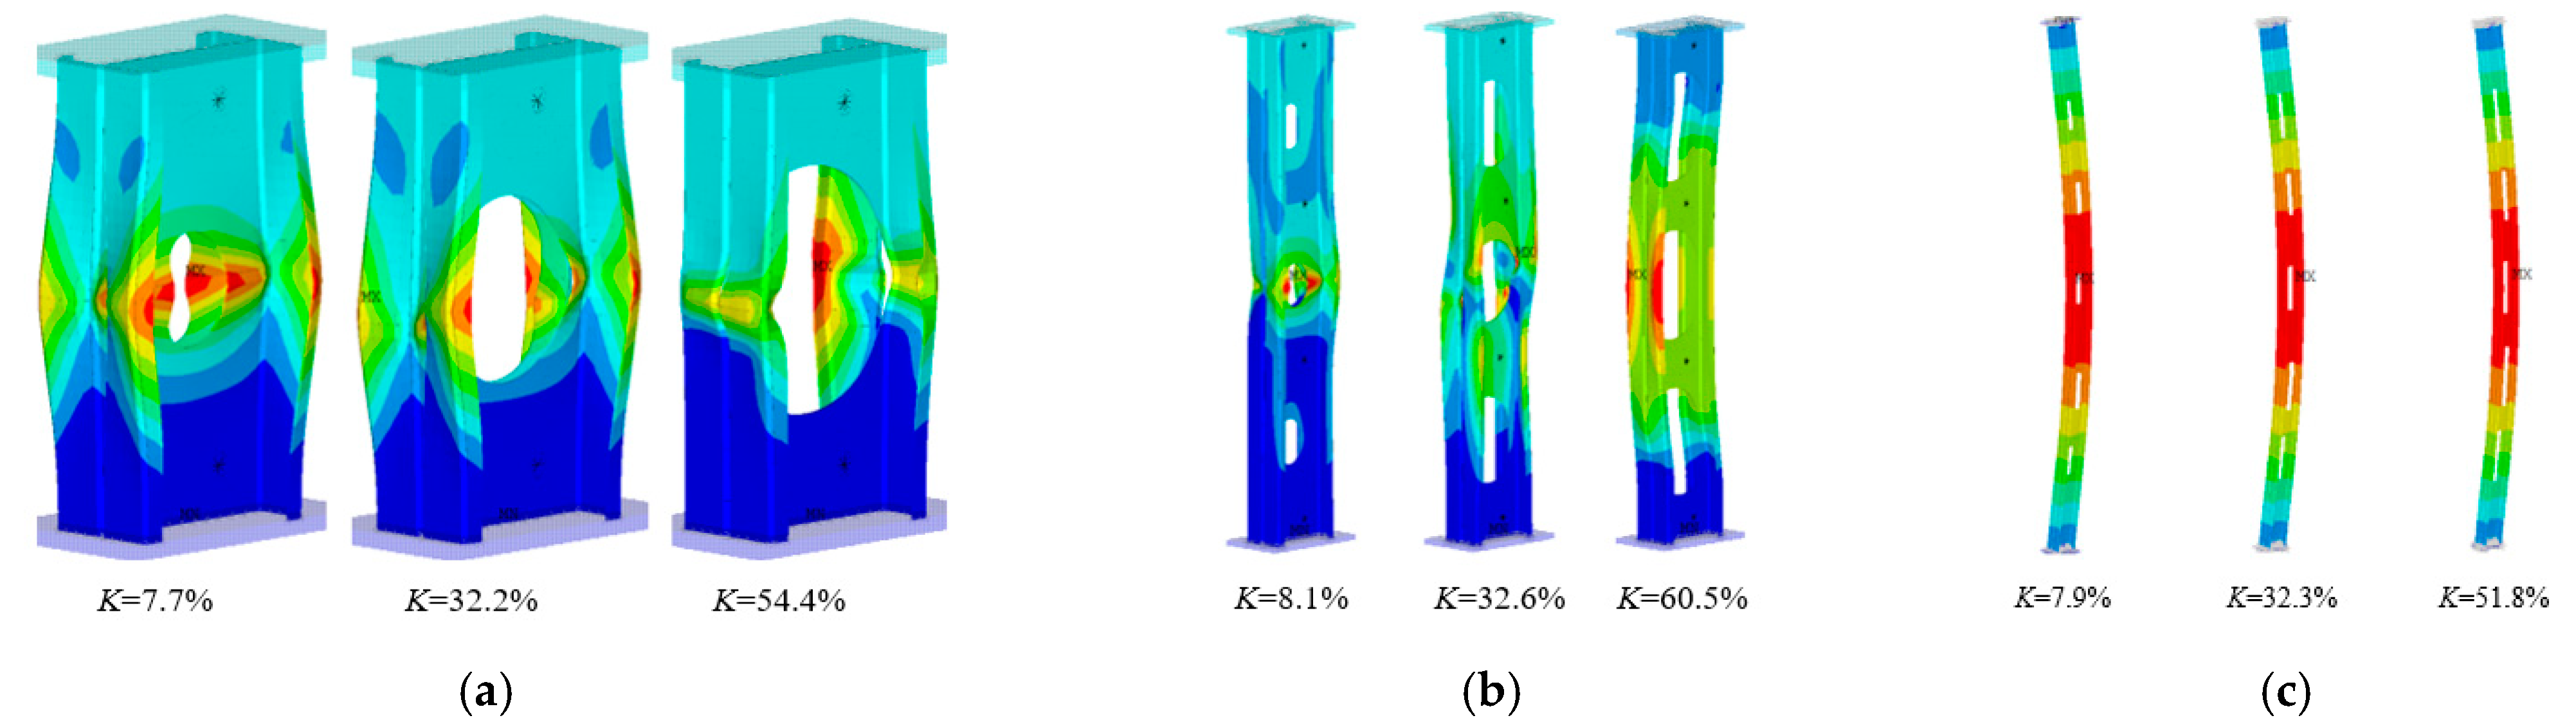
3.5. Effects of Opening in the Web

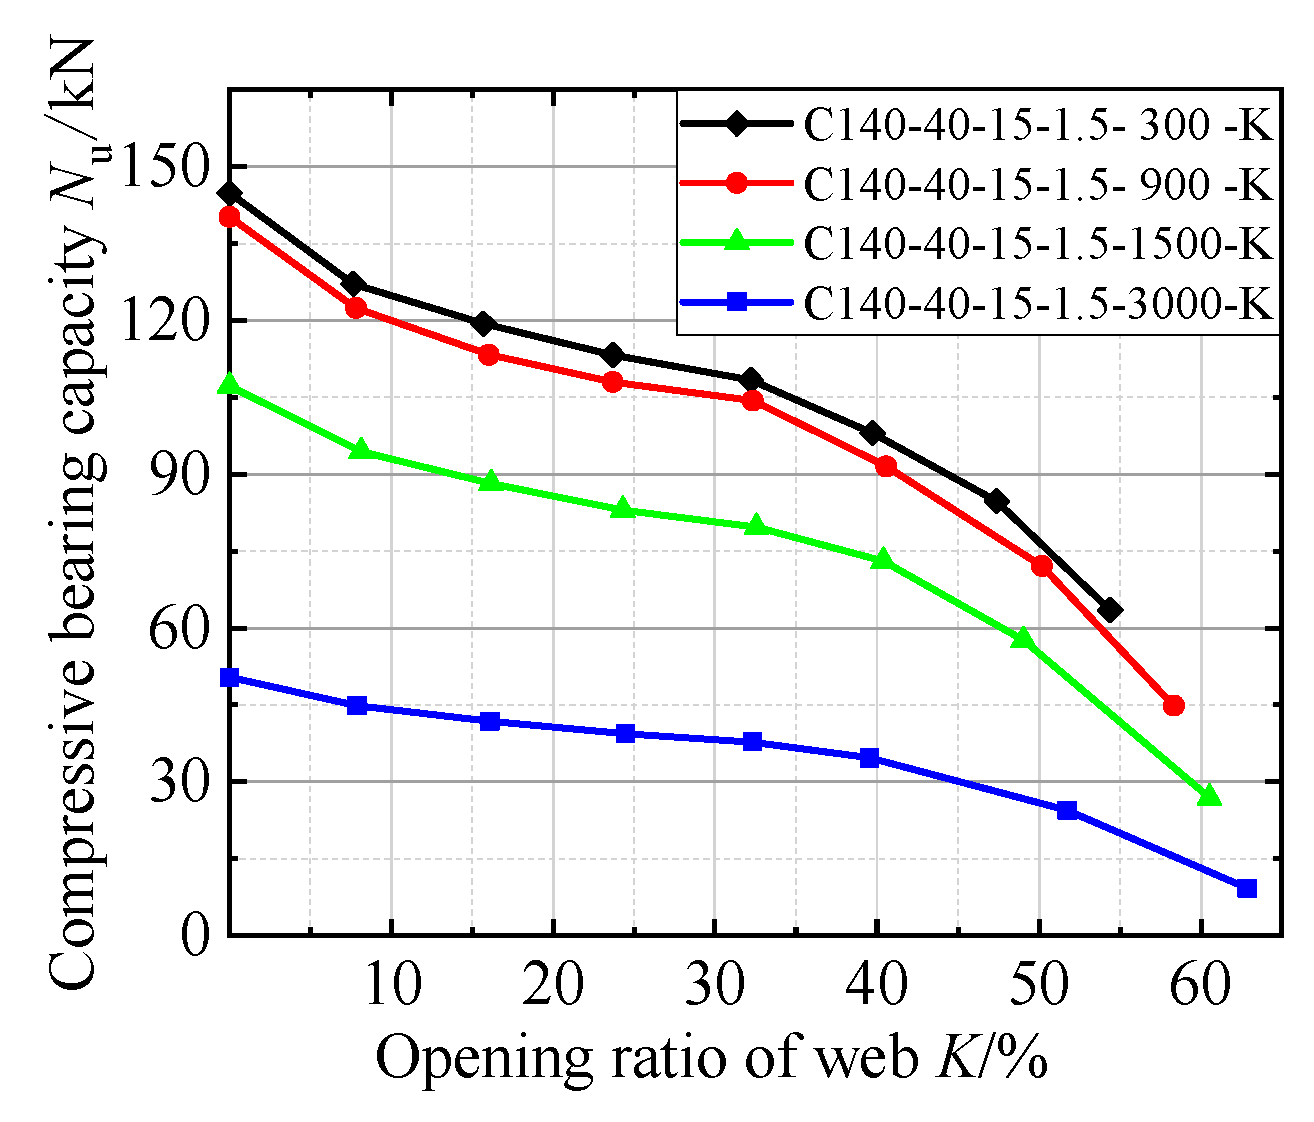
3.5.1. Effects of Opening Ratio of the Web

The openings in the web reduce the sectional area of the web and affect the failure mode of the combined columns. To investigate the effects of the opening ratios of the web on the ultimate compressive bearing capacity, parametric analyses were carried out on C140-40-15-1.5 combined columns. The opening ratios were defined as the ratio of area of the openings to that of the web. In the parametric analyses, the oval openings were set in the web, and the spacing between the openings was fixed. The opening ratio increased from 0 to 60%, and the increasing ratio was about 8%.
With different lengths and opening ratios, the failure modes of the C-steel combined I-section columns are shown in Figure 18. With the increase in the opening ratio, the deformation of the columns was greater, and the local failure was more obvious in the middle of the combined columns. The relationship between the ultimate compressive bearing capacity and the opening ratios are shown in Figure 19. With the increase in the opening ratio, the compressive bearing capacity decreased. The decreasing ratios of the columns with 0~15% and 35~60% opening ratios were much greater than the columns with opening ratios of 15~35%. For the four series of combined columns with different length, the maximum increasing ratios of the opening ratio were 54.4%, 58.3%, 60.5%, and 62.9%, respectively, and the corresponding ultimate compressive bearing capacity decreased by 56.1%, 68.0%, 74.9%, and 81.7%, respectively. Except in the case that the openings reduced the sectional area of the web, the opening affected the half-wave length of the short column when the distortion happened, which reduced the compressive bearing capacity. For the medium and long combined columns, the openings aggravated the buckling of members and reduced the bearing capacity of the combined columns.

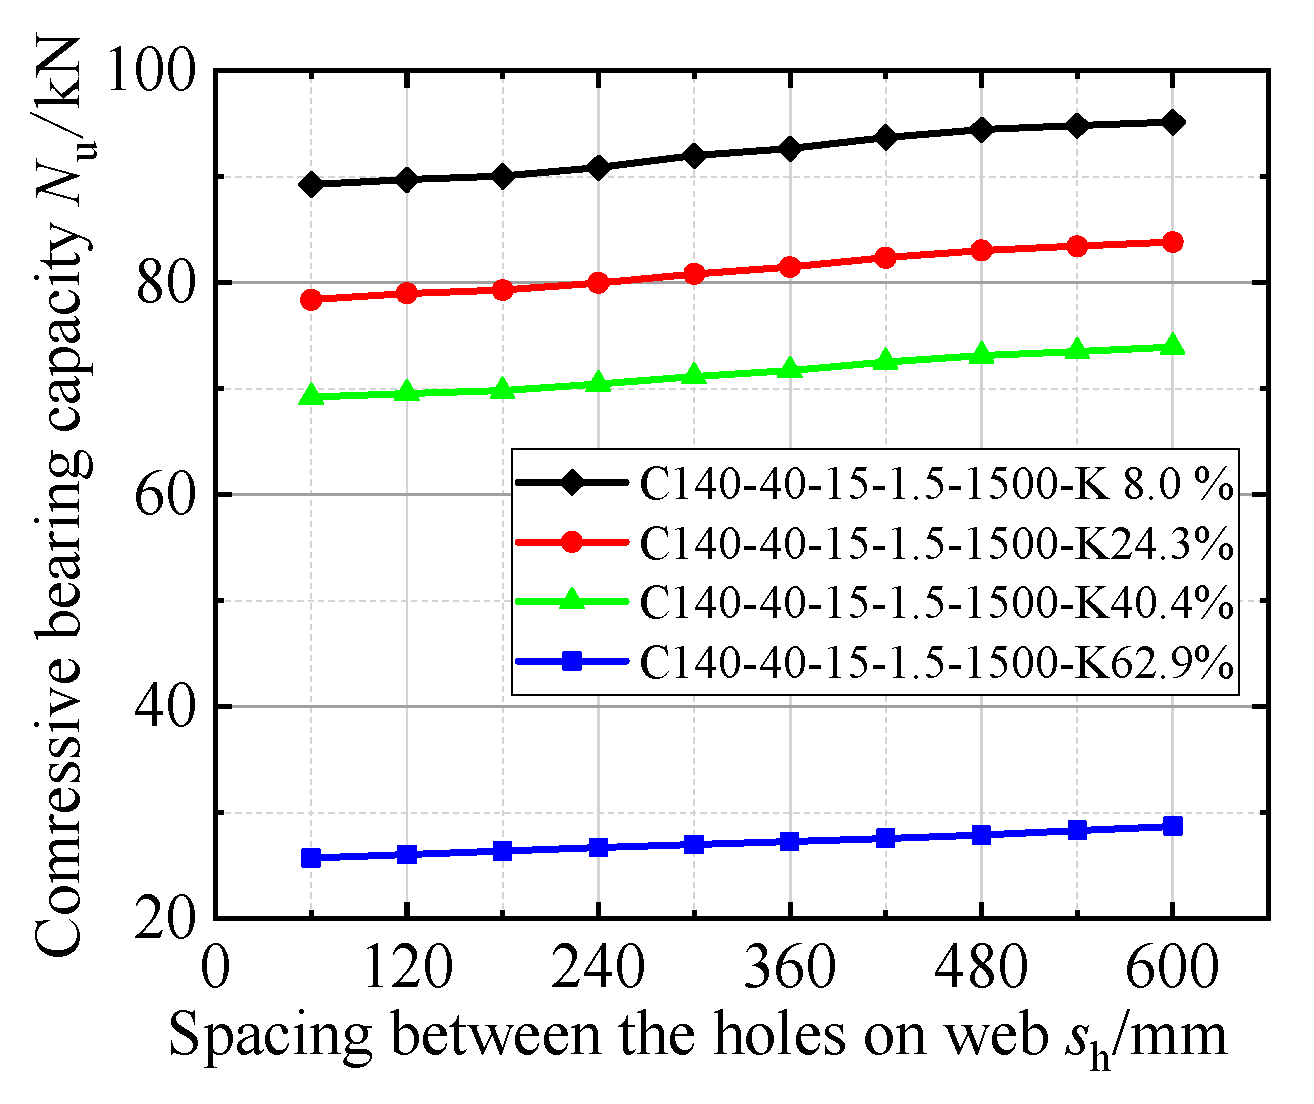
3.5.2. Effects of Opening Spacing

In the last section, it was found that the location of the opening in the web affected the half-wave length of the columns. Therefore, in this section, parametric analyses were conducted to investigate whether the opening spacing has an influence on the ultimate compressive bearing capacity. Four series of C140-40-15-1.5 combined columns, with a length of 1500 mm, were modeled, and the opening ratios were set as 8.0%, 24.3%, 40.4%, and 62.9%, respectively. The opening spacings were in the range of 60~600 mm, with an increasing step of 60 mm. The relationship between the ultimate compressive bearing capacity and opening ratios are shown in Figure 20. According to Figure 20, the compressive bearing capacity increased with the increasing opening spacing, but the effects of the opening were not so obvious. When the opening spacing increased by 900%, the ultimate compressive bearing capacities of the four groups of combined columns increased by 6.5%, 6.9%, 6.8%, and 11.7%, respectively.

4. Formulas for Ultimate Compressive Bearing Capacity

4.1. Formulas in Standards

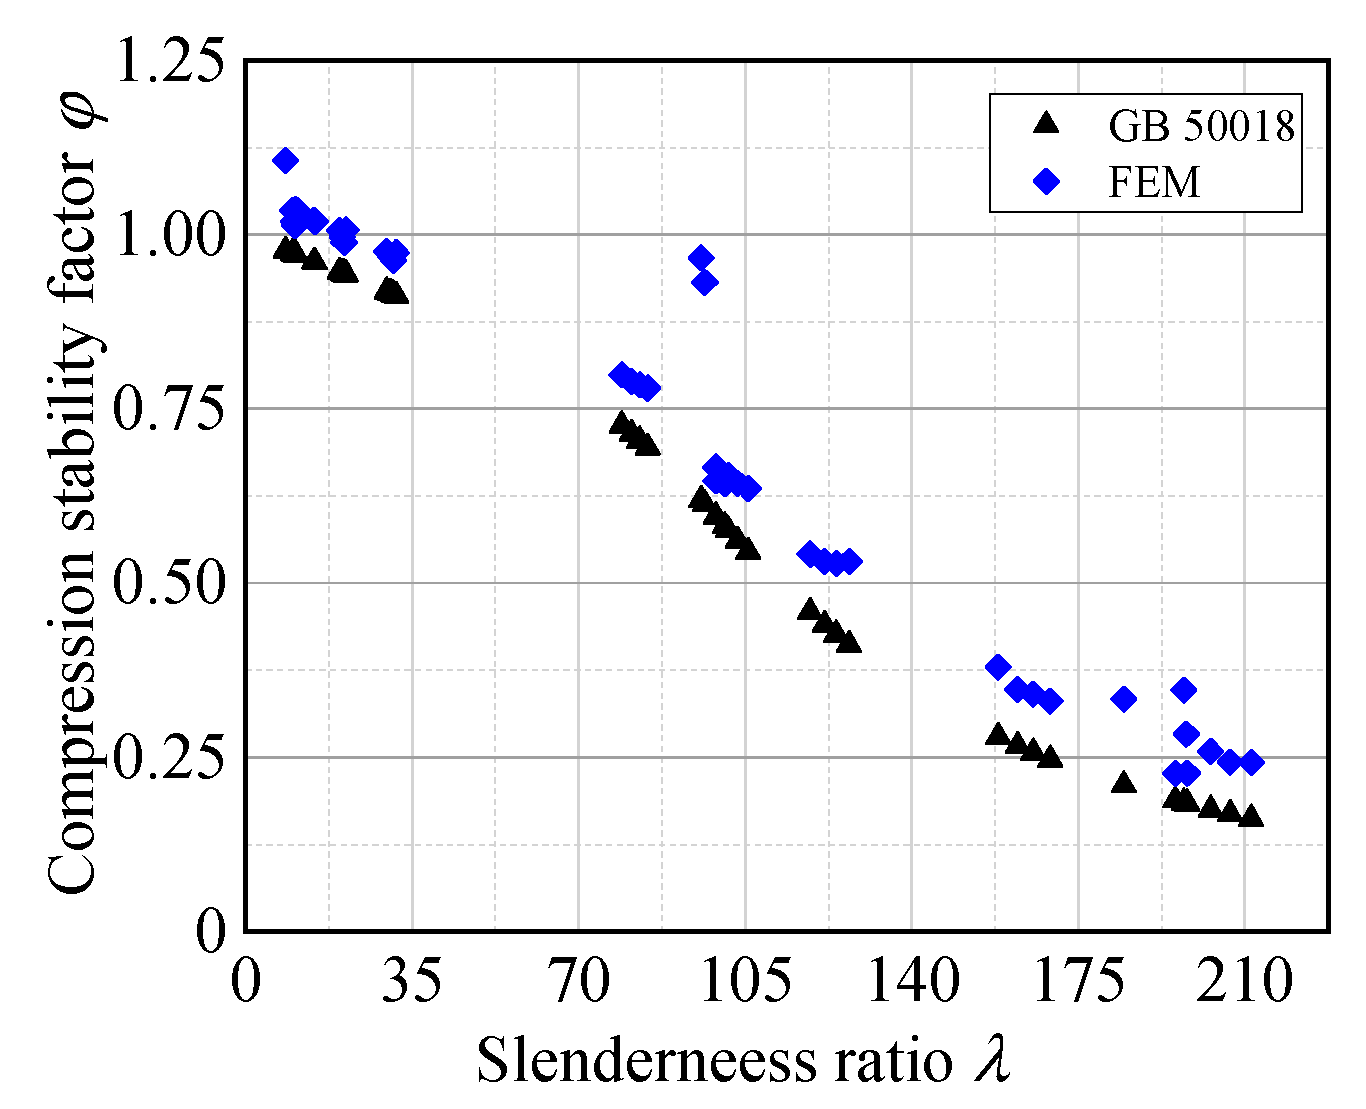
4.1.1. Formulas in Chinese GB 50018 Standard

In the Chinese GB 50018 standard [46], there is no detailed recommended formula for the compressive bearing capacity of the combined column. In this standard, the C-steel combined I-section columns was seen as two individual C-section columns, and the method of effective width was adopted. According to the Chinese GB 50018 standard, the ultimate compressive bearing capacity of the combined column is:
N u = φ A e f y
where φ is the compression stability factor. Ae (mm2) denotes the effective area of the cross section and fy (N/mm2) is the yield strength of the steel. The compression stability factor φ can be found in Appendix B for Section B in this standard [46].
The effective area of the cross section is:
A e = ( b ew + b ef + b ec ) t
In Equation (2), bew, bef, and bec are the effective width of the web, flange, and curling, respectively. When b / t 18 α ρ ,
b e = b c
In Equation (3), b and t are the width and thickness of the plate, respectively. Furthermore, when 18αρ < b/t < 38αρ,
b e = ( 21 . 8 α ρ b / t 0.1 ) b c
and when b / t 38 α ρ ,
b e = 25 α ρ b / t b c
In Equations (4) and (5), α is a coefficient, and
α = 1.15 - 0.15 ψ
In Equation (6), ψ is the coefficient of inhomogeneity of compressive stress, and
ψ = σ min / σ max
when ψ < 0, α = 1.15. In Equations (4) and (5),
ρ = 205 k 1 k 2 / σ 1
In Equation (8), σ1 = φf and k and k1 denote the stability coefficient and constraint coefficient of the compressed plate, respectively. be is the width of the compressive area of the plate. When ψ < 0, bc = b. Otherwise, bc = b/(1 − ψ).

4.1.2. Formulas in AISI S100-2016 Standard

In the AISI S100-2016 standard [47], the direct strength method was adopted to calculate the compressive bearing capacity of the combined column. Since there is relative deformation between the two connected components at the conditions, in this method, the slenderness ratio of the combined columns was modulated as follows:
λ m = λ 0 2 + ( s a / i y ) 2
where λm and λ0 denote the slenderness ratios of the combined columns before and after the modulation, respectively. iy is the radius of gyration of the individual component alone its weak axis, and sa is the distance between two connected components.
According to AISI S100-2006 standard, first, the compressive bearing capacity Pne with overall buckling should be obtained. When λ c 1.5 ,
P ne = 0.658 λ c 2 A g f y
Otherwise,
P ne = ( 0.877 / λ c 2 ) A g f y
In Equations (10) and (11), λc is the influence coefficient of flexibility with overall buckling, and λ c = f y / f cre . Ag denotes the area of the cross section, and fcre is the elastic buckling stress.
Second, the compressive bearing capacity Pnl with local–overall coupled buckling should be determined. When λ 1 0.776 ,
P n l = A g f n e
When λ 1 > 0.776 ,
P n l = [ 1 0.15 ( 1 λ l 2 ) 0.4 ] ( 1 λ l 2 ) 0.4 A g f n e
In Equations (12) and (13), λ1 is the influence coefficient of flexibility with local buckling, and λ 1 = f ne / f o 1 . fne and fol are the critical elastic buckling stress with overall and local buckling, respectively, and f ne = P ne / A g .
Moreover, the compressive bearing capacity Pnd with distortion–overall coupled buckling can be calculated. When λ d 0.561 ,
P nd = A g f y
Otherwise,
P nd = [ 1 0.25 ( 1 λ d 2 ) 0.6 ] ( 1 λ d 2 ) 0.6 A g f y
In Equations (14) and (15), λd is the influence coefficient of flexibility with distortion and fod the critical stress of the distortion.
The ultimate bearing capacity of the combined columns is the minimum value of three values above, as shown in Equation (16).
P n = min ( P ne , P nl , P nd )

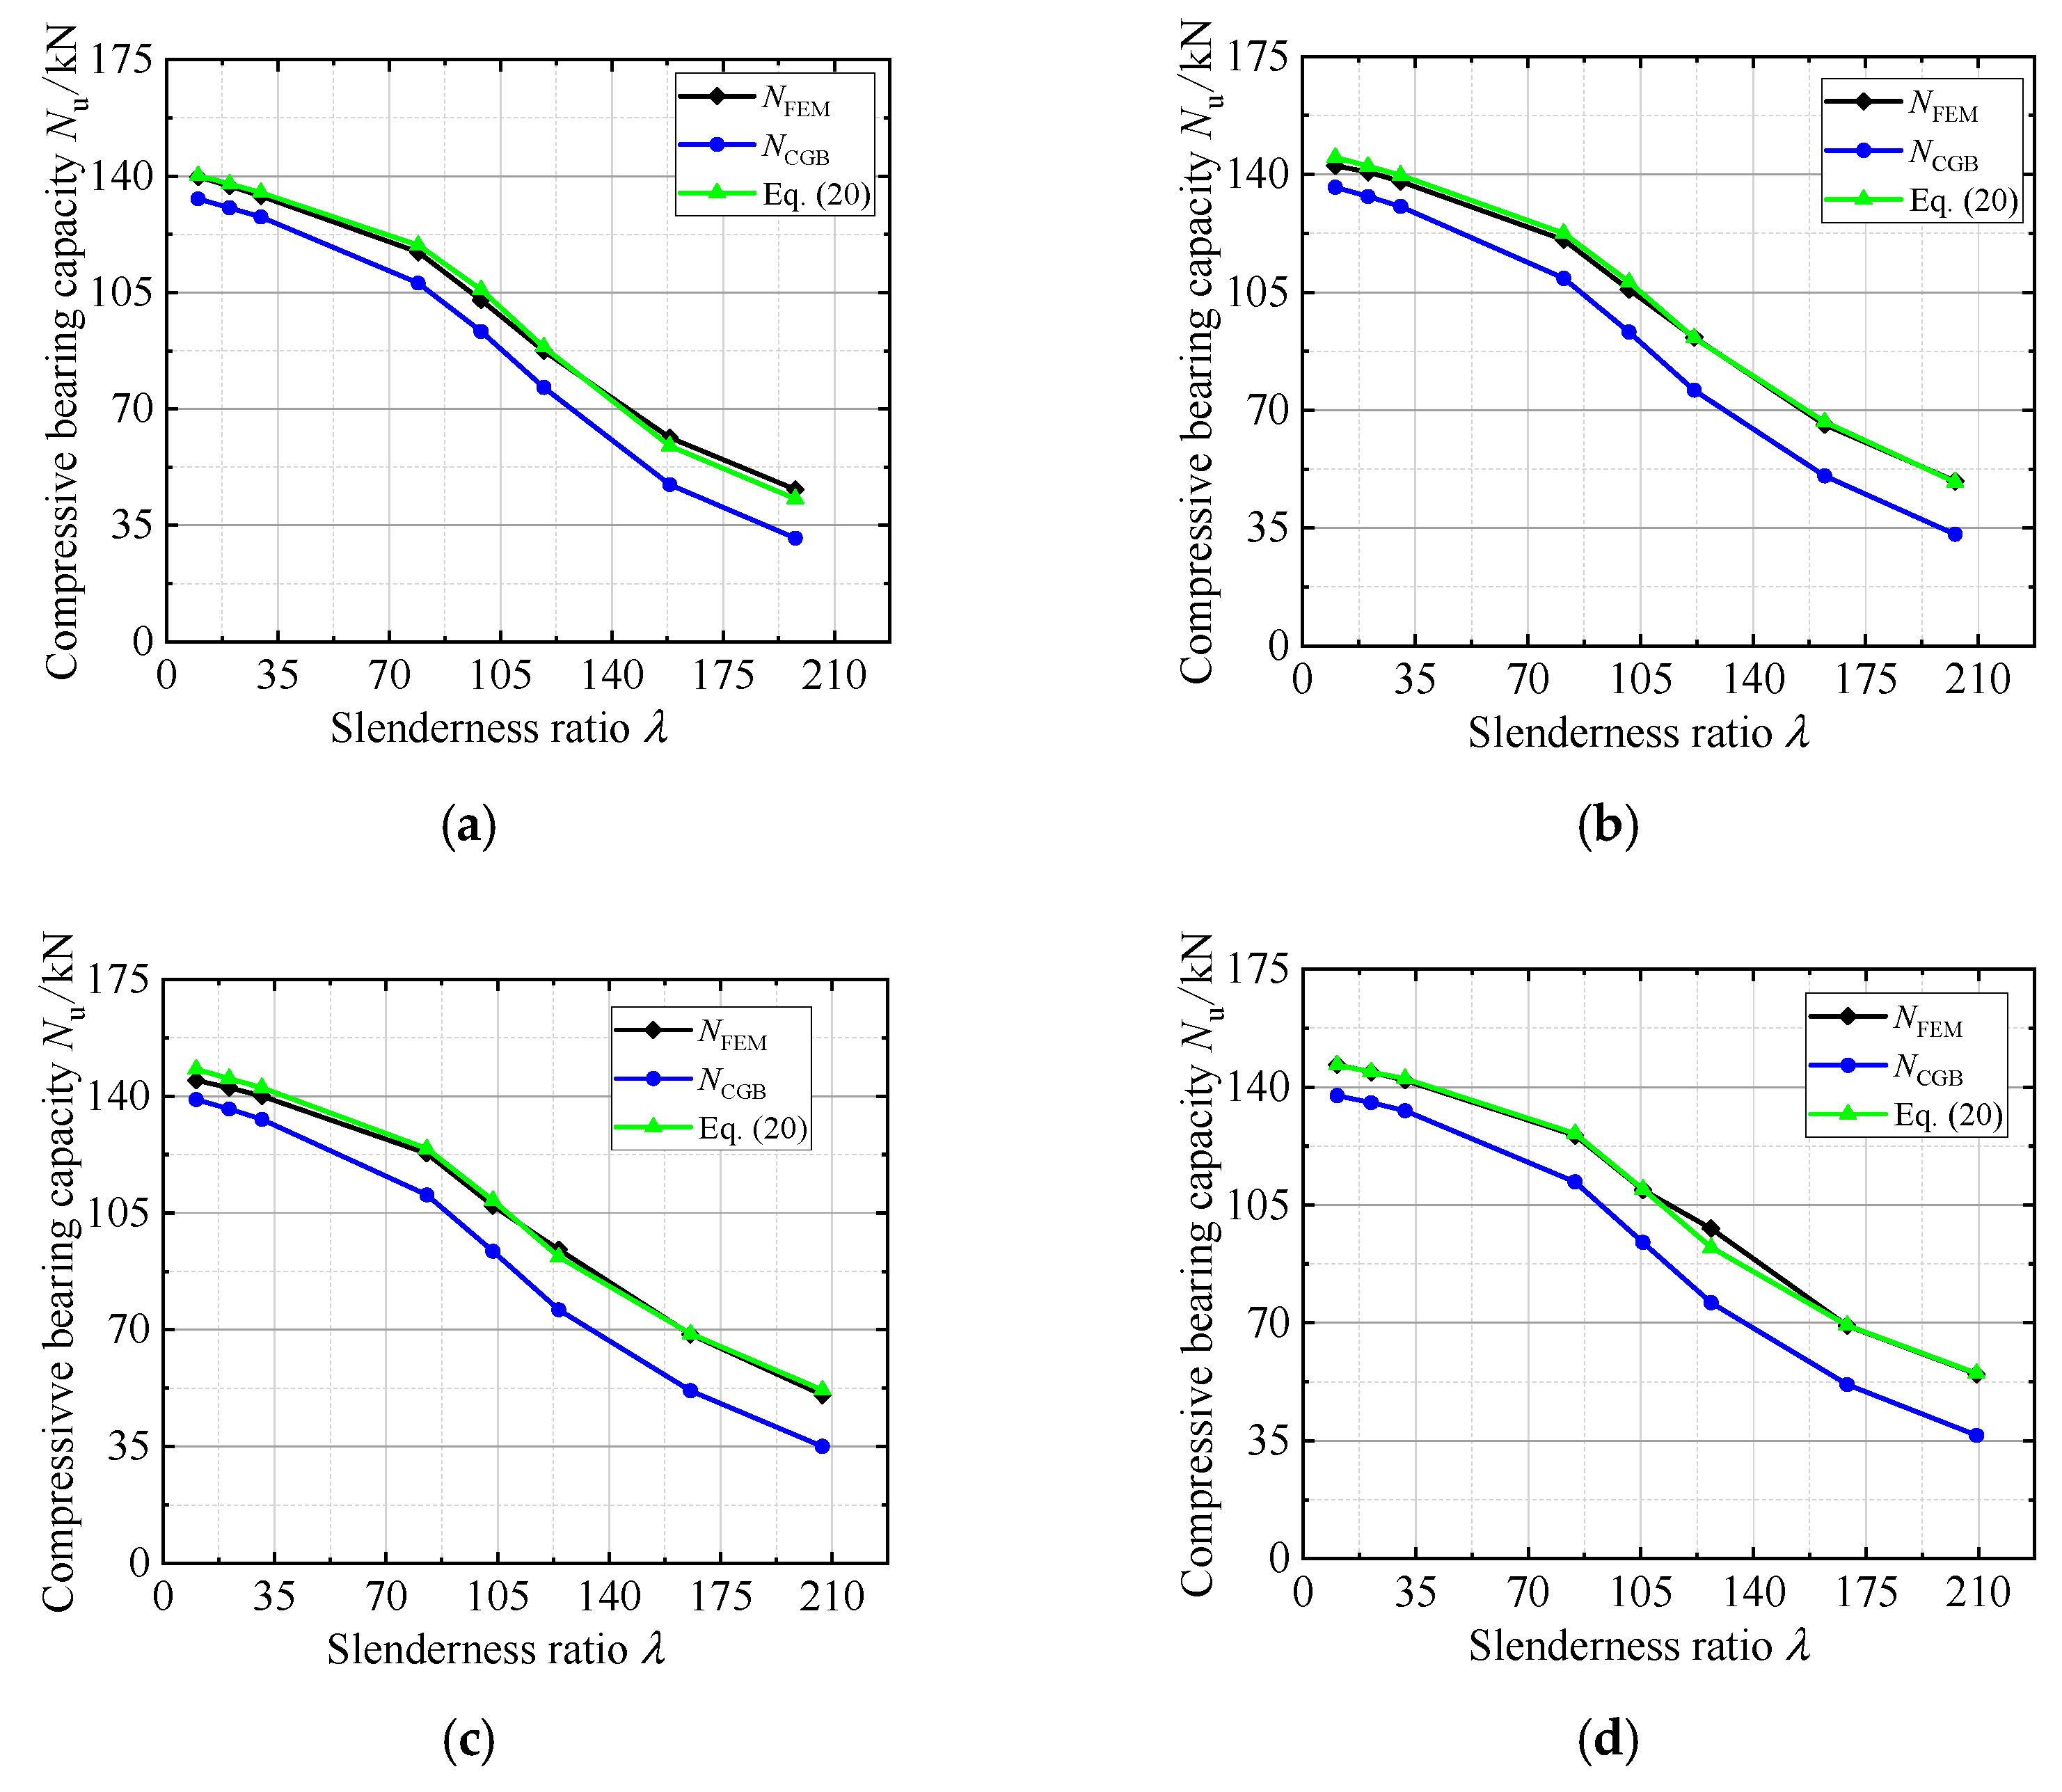
4.2. Comparisons between the Results of Numerical Analyses and Standards

In this section, the ultimate bearing capacities of the C-steel combined I-section columns obtained by the parametric analyses and formulas in standards were compared. The comparing results of all the combined columns in the parametric analyses are listed in Table A1 in Appendix A and some of the results are shown in Figure 21. In Table A1 and Figure 21, NFEM, NCGB, and NNAS denote the ultimate compressive bearing capacity obtained by numerical analyses, the Chinese GB 50018 standard, and the AISI S100-2016 standard, respectively. According to Table A1 and Figure 21, the effective width method in the GB 50018 standard was conservative, and the maximum error was 60.26%, and the errors increased with greater slenderness ratio. Furthermore, the maximum error for the AISI S100-2016 standard was 21.49%.
For the effective width method in the Chinese GB 50018 standard, the constraint effects between the plates, affecting the effective width, were considered. However, the interactions between the two C steels were ignored. With the increase in the slenderness ratio, the errors between the standard factors and slenderness ratios were greater. Therefore, with greater slenderness ratio, the formulas in Chinese GB 50018 standard were more conservative. Considering the influences of the bolt spacing on the slenderness ratio, the slenderness ratios in the AISI S100 standard were modulated. Thus, the accuracy of the method in the AISI S100 standard was higher than that of GB 50018 standard. However, with greater slenderness ratio, the influence of the bolt spacing on the slenderness ratio can be ignored. Additionally, the errors of the direct strength method in the AISI S100 standard increased.

4.3. Proposed Formulas for Compressive Bearing Capacity of C-Steel Combined I-Section Column

4.3.1. Combined Column without Opening

Since the slenderness ratio has the most significant effects on the ultimate bearing capacity of the combined column, and the combination’s effects are not considered in the Chinese GB 50018 standard, the stability factor can be modulated to increase the accuracy of the formulas.
According to the Chinese GB 50018 standard, the stability factor φ and the effective area Ae of the cross section can be obtained. Thus, the stability factor in the numerical analyses φFEM should be:
φ FEM = N FEM / A e f y
and the correction factor for the stability factor is:
ξ = φ FEM / φ
The compression stability factors obtained by Equation (17) and the GB 50018 standard are shown in Figure 22 and Table A2 in Appendix B. Moreover, the relationship between the correction factors and slenderness ratios is shown in Figure 23. With the increase in the slenderness ratio, the correction factors increased rapidly. This is in accordance with the errors obtained by the numerical analyses and formulas in the GB 50018 standard. The formulas in the GB 50018 standard were more conservative with a greater slenderness ratio. The correction factor of the compression stability factor in Figure 23 was fitted as:
ξ = 1.0528 × 10 5 λ 2 1.5318 × 10 4 λ + 1.0661
Therefore, the ultimate compressive bearing capacity of the C-steel combined I-section column is:
N u = ξ φ A e f y
To validate the formulas proposed in this paper, the ultimate compressive bearing capacity obtained by Equation (20), numerical analyses, and formulas in the GB 50018 standard are compared in Figure 24. In Figure 24, the ultimate bearing capacity obtained by Equation (20) and numerical analyses were similar. The proposed formula can be used to predict the ultimate compressive bearing capacity of the C-steel combined I-section column.

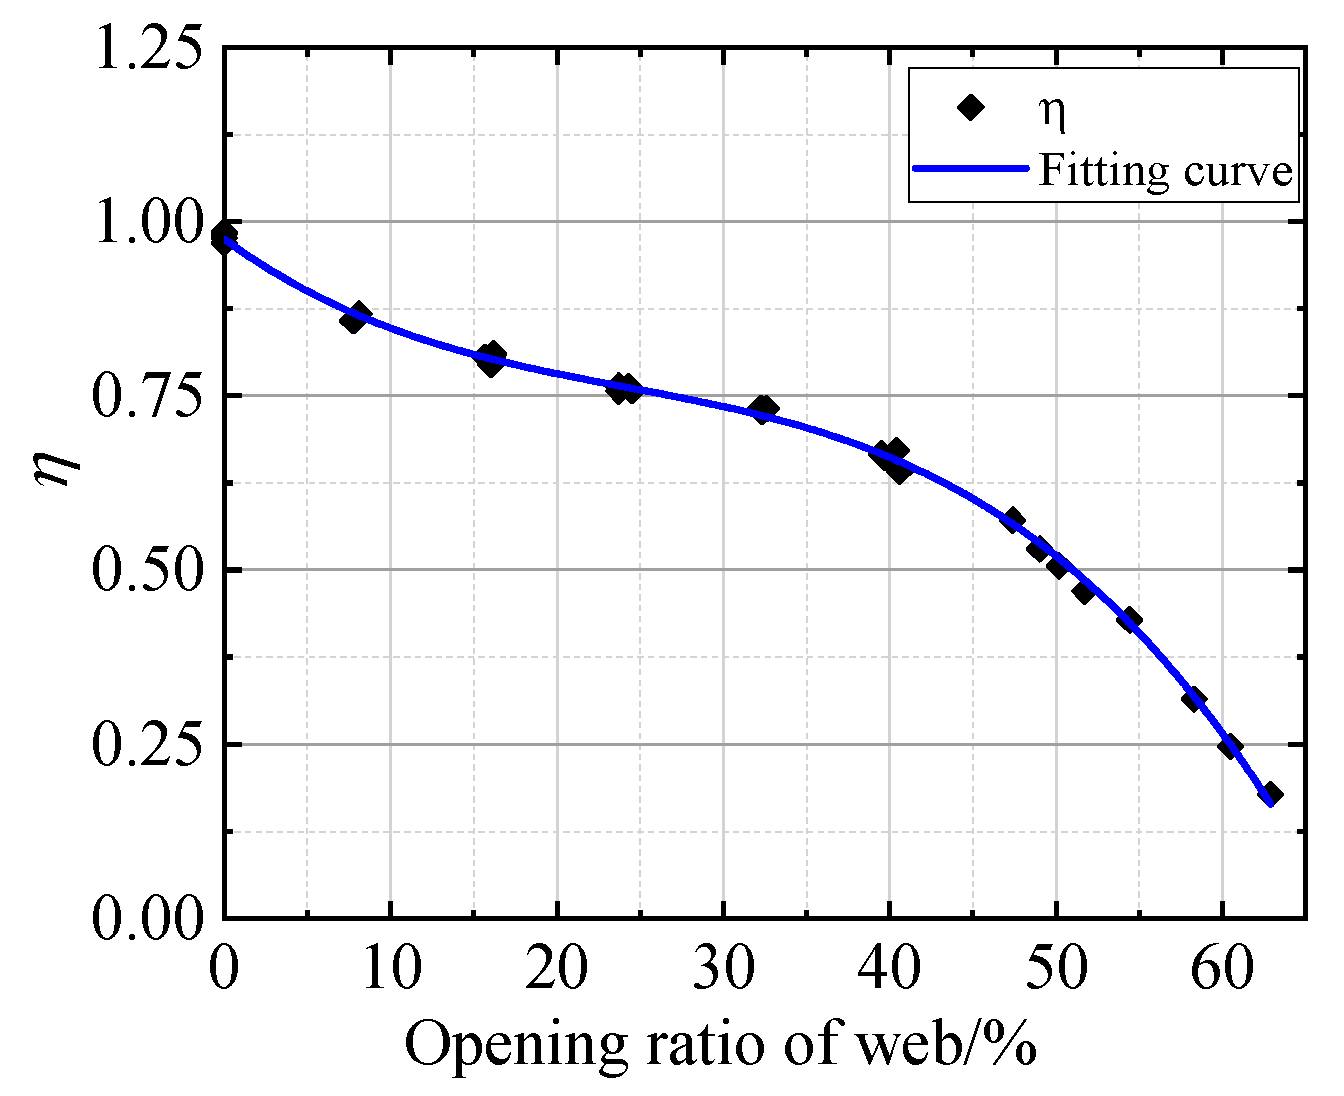
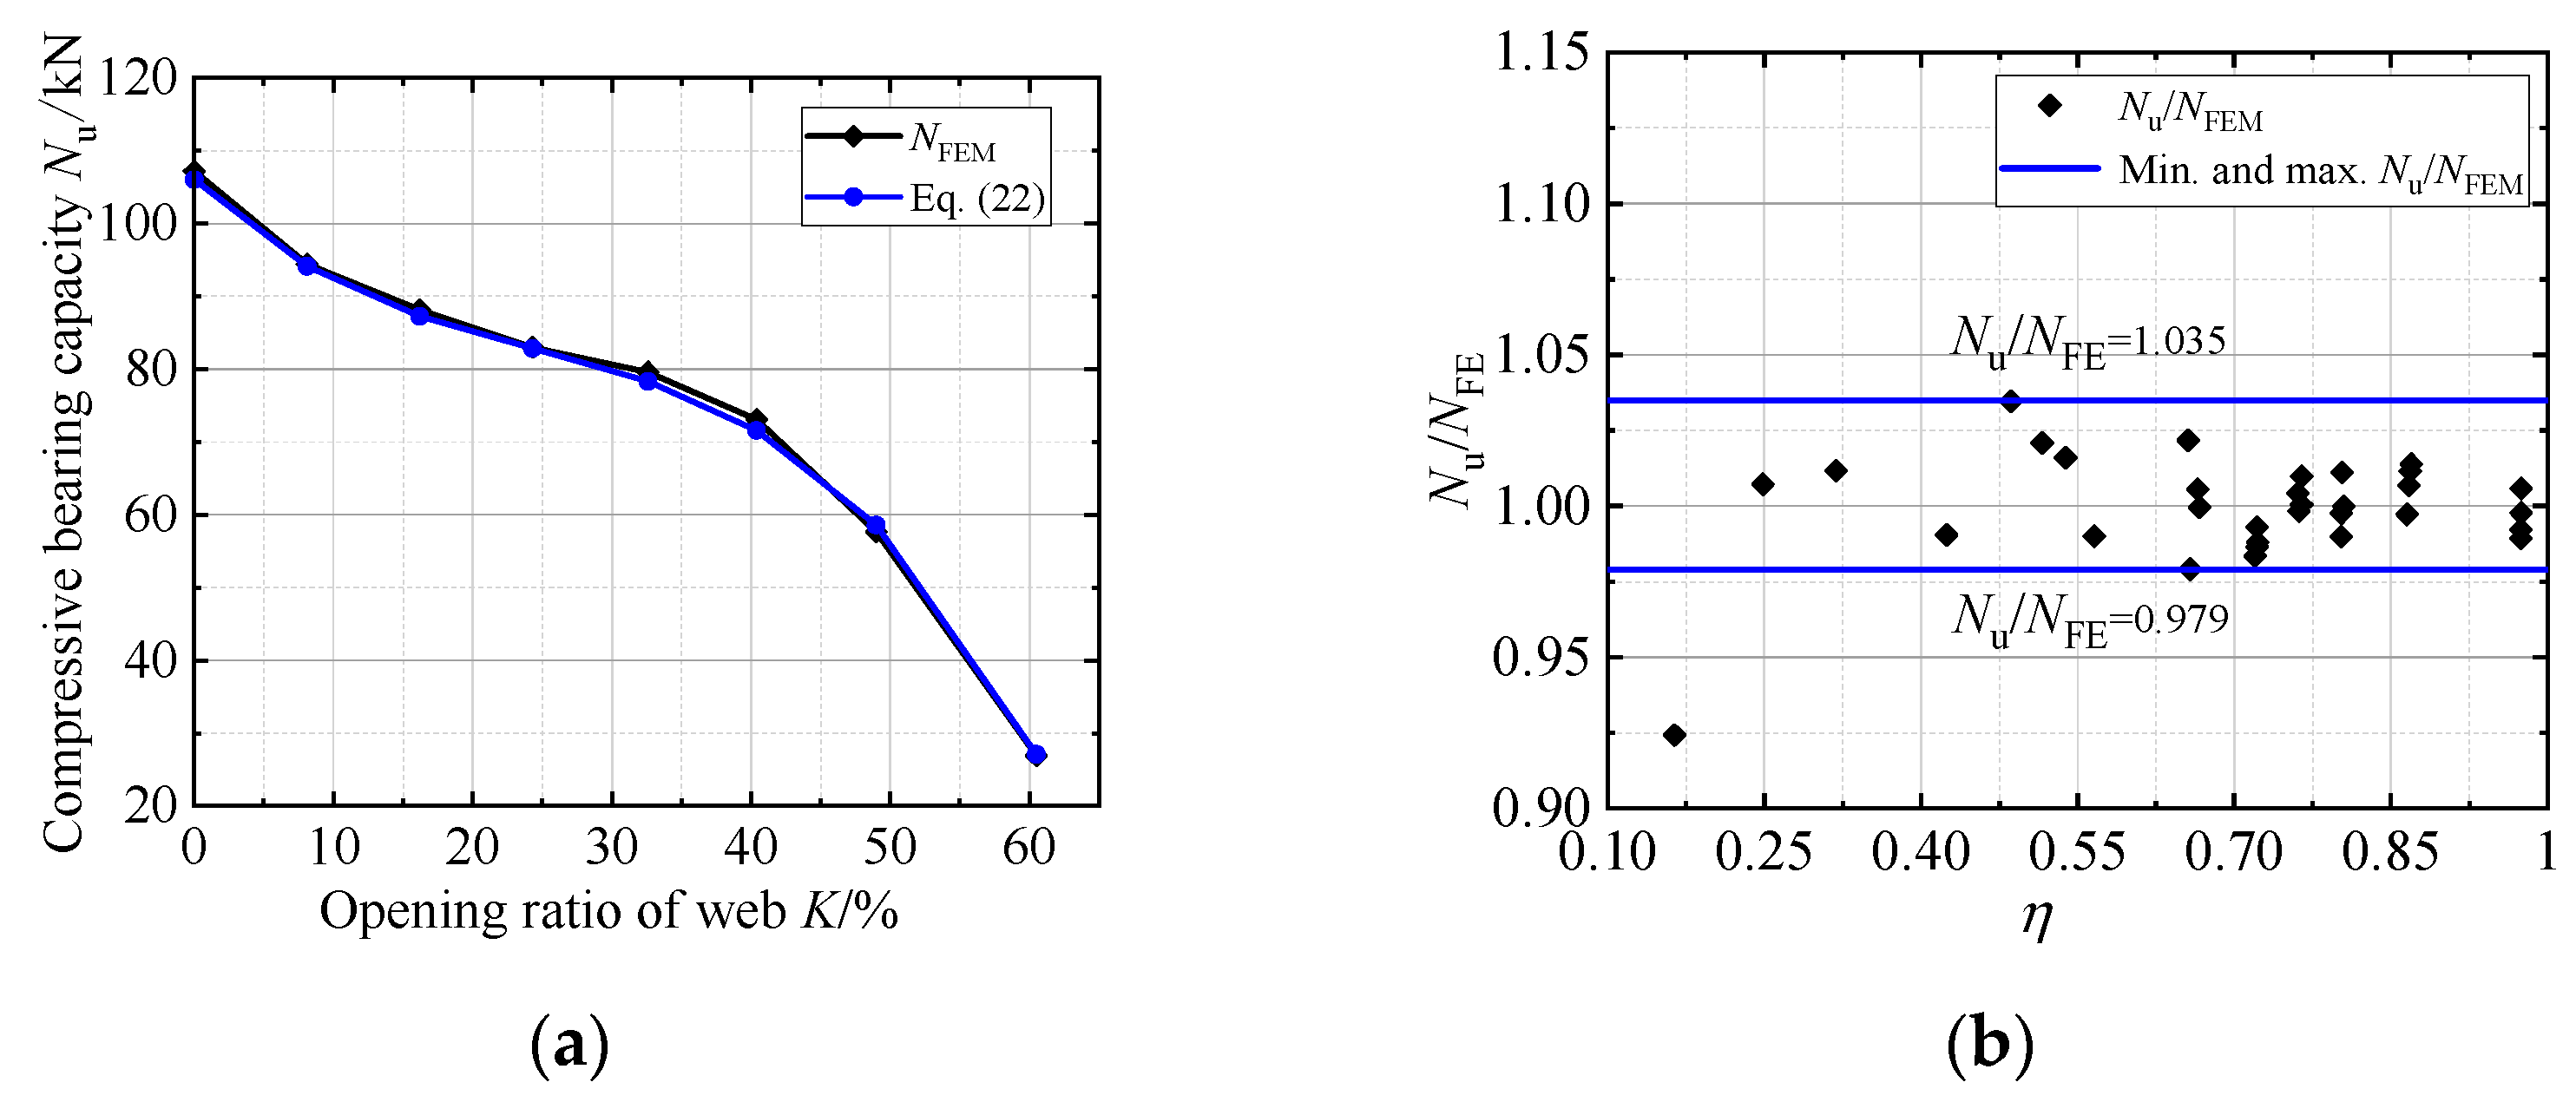
4.3.2. Combined Column with Openings

For the combined columns with openings, according to the parametric analyses, the slenderness ratio and opening ratio both have significant effects on the ultimate compressive bearing capacity. Comparing the ultimate compressive bearing capacities obtained by Equation (20) and numerical analysis, the reduction factor is:
η = N u / N FEM
and the ultimate bearing capacity of the C-steel combined I-section column is:
N u = η ξ φ A e f y
According to Equations (21) and (22) and the parametric analyses, the reduction factor η can be obtained and is shown in Figure 25 and Table A3 in Appendix B. In Figure 25, the reduction factor was fitted as:
η = 7.29 K 3 + 5.2892 K 2 1.7316 K + 0.9748
To validate Equation (22), the ultimate compressive bearing capacity obtained by the numerical analyses and Equation (22) are shown in Figure 26. In Figure 26a, the two curves are similar. In Figure 26b, Nu/NFEM is in the range from 0.924 to 1.035, and the average value and variance are 0.999 and 0.018, respectively. Therefore, Equation (22) can be used to predict the ultimate compressive bearing capacity of the C-steel combined I-section column with opening in the web.

5. Conclusions and Future Work

In this paper, the C-steel combined I-section columns were modeled. The numerical models were validated by experiments. Parametric analyses were carried out on the combined columns and the effects of slenderness ratio, height to thickness ratio, width to thickness ratio, bolt spacing, and opening were investigated. Afterward, the formulas for the ultimate compressive bearing capacity of the combined columns were proposed. The following conclusions can be drawn:
(1)
The slenderness ratio has the most significant effect on the ultimate compressive bearing capacity of the combined column. With the increase in the height to thickness ratio and width to thickness ratio, the bearing capacity increases. The bolt spacing has less effect on the bearing capacity.
(2)
The openings in the web decrease the ultimate compressive bearing capacity of the combined column. The opening in the web should be considered.
(3)
The proposed formulas in this paper can predict the ultimate compressive bearing capacity of the combined columns with or without opening. The accuracy of the proposed formulas is higher than those of the Chinese and AISI S100 standard.
In our future work, experiments on the combined columns with openings in the web will be conducted. In addition, we will try to investigate the eccentric compressive behavior of the C-steel combined I-section columns. The combination effects of the column under eccentric compression will be investigated. The formulas for eccentric compressed C-steel combined I-section columns should be proposed. Furthermore, in our next step of research, we will try to take retrofitting countermeasures to increase the bearing capacity of the combined columns. Experiments and numerical analyses will be conducted, and the design method of the retrofitting countermeasures should be proposed.

Author Contributions

Conceptualization, C.H. and Y.C.; methodology, Y.C. and C.H.; validation, H.C.; formal analysis, C.H. and Y.C.; investigation, C.H.; resources, C.H.; data curation, H.C.; writing—original draft preparation, C.H.; writing—review and editing, Y.C.; visualization, C.H.; supervision, C.H.; project administration, Y.C. All authors have read and agreed to the published version of the manuscript.

Funding

This research was funded by the Natural Science Foundation of Hunan Province, grant number 2021JJ40737, and National Natural Science Foundation of China, grant number 52008406.

Institutional Review Board Statement

Not applicable.

Informed Consent Statement

Not applicable.

Data Availability Statement

The data provided in this study could be released upon reasonable request.

Conflicts of Interest

The authors declare no conflict of interest.

Appendix A. Comparisons of the Bearing Capacities between Numerical Analyses and Standards

Table A1. Comparisons of the bearing capacities between numerical analyses and standards.
λyNFEM/kNNCGB/kNNNAS/kNNCGB/NFEMNNAS/NFEM
C90-40-15-1.5-3009.9139.8131.5136.30.9410.975
C90-40-15-1.5-60019.8137128.9133.10.9410.971
C90-40-15-1.5-90029.7134126.1129.40.9410.966
C90-40-15-1.5-120079.1117.1106.5113.40.9090.968
C90-40-15-1.5-150098.9102.791.899.60.8940.970
C90-40-15-1.5-1800118.687.574.184.10.8470.961
C90-40-15-1.5-2400158.261.445.258.80.7360.957
C90-40-15-1.5-3000197.745.829.740.70.6480.890
C120-40-15-1.5-30010.1142.6136.2139.60.9550.979
C120-40-15-1.5-60020.3140.7133.4136.20.9480.968
C120-40-15-1.5-90030.4137.9130.5132.30.9460.959
C120-40-15-1.5-120081.1120.6109.1114.30.9050.948
C120-40-15-1.5-1500101.4105.893.2101.70.8810.961
C120-40-15-1.5-1800121.791.676.087.30.8300.953
C120-40-15-1.5-2400162.365.750.460.20.7670.917
C120-40-15-1.5-3000202.848.933.241.40.6790.847
C140-40-15-1.5-30010.4144.8139.0140.20.9600.968
C140-40-15-1.5-60020.7142.6136.2136.80.9550.959
C140-40-15-1.5-90031.0140.1133.1132.70.9500.948
C140-40-15-1.5-120082.8122.9110.4115.10.8980.937
C140-40-15-1.5-1500103.5107.293.5103.80.8720.968
C140-40-15-1.5-1800124.294.176.084.70.8080.900
C140-40-15-1.5-2400165.568.651.856.50.7550.823
C140-40-15-1.5-3000206.950.435.043.50.6940.864
C160-40-15-1.5-30010.6146.7137.5142.40.9370.971
C160-40-15-1.5-60021.1144.5135.4141.30.9370.978
C160-40-15-1.5-90031.7142133.0137.00.9370.965
C160-40-15-1.5-120084.5125.7111.9119.90.8900.954
C160-40-15-1.5-1500105.7109.593.996.00.8580.877
C160-40-15-1.5-1800126.89876.081.00.7760.827
C160-40-15-1.5-2400169.169.251.767.00.7470.969
C160-40-15-1.5-3000209.354.736.651.60.6690.944
C92.8-41.8-14.8-1.19-2708.5133.6118.0125.60.8830.940
C93.8-41.8-14.7-1.19-2708.5133.5117.9124.90.8830.936
C93.5-41.5-15-1.18-153396.5102.384.597.60.8260.954
C92.5-42-14.5-1.2-153195.7106.784.698.10.7930.919
C91.8-43.2-14.4-1.19-3033184.644.532.740.80.7340.916
C92.8-40.2-15-1.18-3038197.244.928.041.30.6240.920
C142.7-42.9-15.1-1.47-45114.5142.7134.4140.30.9420.983
C144.2-42.8-14.8-1.48-45114.6143.1135.0137.10.9430.958
C142-42.5-15.5-1.48-153298.8106.297.8102.70.9210.967
C142-42-15-1.48-1533100.7105.195.2102.20.9060.972
C140.8-42-15.5-1.49-3034198.04833.843.70.7040.910
C141.5-42.3-16-1.47-3033195.447.733.642.90.7050.899
Mean value--------0.8470.939
Variance--------0.1010.041

Appendix B. Correction Factors of Compression Stability Factor

Table A2. Comparison of stability factor and correction factor of combined factor.
λyA/mm2Ae/mm2φFEMφξ
C90-40-15-1.5-3009.9562.2442.30.9741.0351.063
C90-40-15-1.5-60019.8562.2445.70.9471.0071.063
C90-40-15-1.5-90029.7562.2449.50.9190.9761.062
C90-40-15-1.5-120079.1562.2479.90.7260.7991.100
C90-40-15-1.5-150098.9562.2504.70.5950.6661.119
C90-40-15-1.5-1800118.6562.2529.20.4590.5411.180
C90-40-15-1.5-2400158.2562.2529.50.2790.3801.360
C90-40-15-1.5-3000197.7562.2529.50.1840.2831.540
C120-40-15-1.5-30010.1652.2458.20.9731.0191.047
C120-40-15-1.5-60020.3652.2461.90.9460.9971.054
C120-40-15-1.5-90030.4652.2466.00.9170.9691.057
C120-40-15-1.5-120081.1652.2499.90.7150.7901.105
C120-40-15-1.5-1500101.4652.2529.60.5760.6541.135
C120-40-15-1.5-1800121.7652.2564.70.4400.5311.206
C120-40-15-1.5-2400162.3652.2619.50.2670.3471.303
C120-40-15-1.5-3000202.8652.2619.50.1750.2581.475
C140-40-15-1.5-30010.4712.2468.10.9731.0131.042
C140-40-15-1.5-60020.7712.2472.00.9450.9891.047
C140-40-15-1.5-90031.0712.2476.30.9150.9631.053
C140-40-15-1.5-120082.8712.2513.00.7050.7841.113
C140-40-15-1.5-1500103.5712.2545.90.5610.6431.146
C140-40-15-1.5-1800124.2712.2583.40.4260.5281.239
C140-40-15-1.5-2400165.5712.2659.80.2570.3401.325
C140-40-15-1.5-3000206.9712.2679.50.1690.2431.440
C160-40-15-1.5-30010.6772.2463.30.9721.0371.067
C160-40-15-1.5-60021.1772.2469.80.9441.0071.067
C160-40-15-1.5-90031.7772.2477.20.9130.9741.068
C160-40-15-1.5-120084.5772.2527.70.6940.7801.123
C160-40-15-1.5-1500105.7772.2564.10.5450.6361.166
C160-40-15-1.5-1800126.8772.2604.20.4120.5311.290
C160-40-15-1.5-2400169.1772.2684.90.2470.3311.339
C160-40-15-1.5-3000209.3772.2739.50.1620.2421.496
C92.8-41.8-14.8-1.19-2708.5466.5318.70.9781.1071.132
C93.8-41.8-14.7-1.19-2708.5468.4318.50.9781.1071.132
C93.5-41.5-15-1.18-153396.5464.0359.50.7700.9321.211
C92.5-42-14.5-1.2-153195.7469.0361.50.7670.9671.261
C91.8-43.2-14.4-1.19-3033184.6468.9436.70.2450.3341.363
C92.8-40.2-15-1.18-3038197.2456.2424.10.2160.3471.603
C142.7-42.9-15.1-1.47-45114.5724.3457.80.9621.0211.061
C144.2-42.8-14.8-1.48-45114.6731.1459.80.9611.0191.060
C142-42.5-15.5-1.48-153298.8726.9537.70.5960.6471.086
C142-42-15-1.48-1533100.7721.0535.60.5820.6421.104
C140.8-42-15.5-1.49-3034198.0725.0692.30.1600.2271.420
C141.5-42.3-16-1.47-3033195.4722.5689.70.1600.2261.418
Table A3. Comparison of opening ratio and reduction factor of combined factor.
λyOpening Ratio K/%NFEMNuη
C140-40-15-1.5-300-K0%10.40.0144.8148.20.977
C140-40-15-1.5-300-K7.7%10.47.7127.1148.20.858
C140-40-15-1.5-300-K15.7%10.415.7119.3148.20.805
C140-40-15-1.5-300-K23.7%10.423.7113.2148.20.764
C140-40-15-1.5-300-K32.2%10.432.2108.3148.20.731
C140-40-15-1.5-300-K39.7%10.439.798.0148.20.661
C140-40-15-1.5-300-K47.4%10.447.484.7148.20.572
C140-40-15-1.5-300-K54.4%10.454.463.5148.20.429
C140-40-15-1.5-900-K0%31.00.0140.1142.60.982
C140-40-15-1.5-900-K7.8%31.07.8122.4142.60.859
C140-40-15-1.5-900-K16%31.016.0113.3142.60.794
C140-40-15-1.5-900-K23.7%31.023.7108.0142.60.757
C140-40-15-1.5-900-K32.3%31.032.3104.3142.60.732
C140-40-15-1.5-900-K40.6%31.040.691.5142.60.642
C140-40-15-1.5-900-K50.2%31.050.272.1142.60.506
C140-40-15-1.5-900-K58.3%31.058.344.9142.60.315
C140-40-15-1.5-1500-K0%103.50.0107.2108.80.985
C140-40-15-1.5-1500-K8.1%103.58.194.4108.80.868
C140-40-15-1.5-1500-K16.2%103.516.288.2108.80.810
C140-40-15-1.5-1500-K24.3%103.524.383.0108.80.763
C140-40-15-1.5-1500-K32.6%103.532.679.6108.80.732
C140-40-15-1.5-1500-K40.4%103.540.473.1108.80.672
C140-40-15-1.5-1500-K49%103.549.057.7108.80.530
C140-40-15-1.5-1500-K60.5%103.560.526.9108.80.247
C140-40-15-1.5-3000-K0%206.90.050.452.00.969
C140-40-15-1.5-3000-K7.9%206.97.944.852.00.862
C140-40-15-1.5-3000-K16.1%206.916.141.852.00.805
C140-40-15-1.5-3000-K24.5%206.924.539.452.00.758
C140-40-15-1.5-3000-K32.3%206.932.337.852.00.727
C140-40-15-1.5-3000-K39.5%206.939.534.752.00.667
C140-40-15-1.5-3000-K51.7%206.951.724.452.00.470
C140-40-15-1.5-3000-K62.9%206.962.99.252.00.178

References

  1. Ding, F.X.; Ding, H.; He, C.; Wang, L.P.; Lyu, F. Method for flexural stiffness of steel-concrete composite beams based on stiffness combination coefficients. Comput. Concr. 2022, 29, 127–144. [Google Scholar]
  2. He, C.; Xie, Q.; Jiang, L.Z.; Jiang, L.Q. Seismic terminal displacement of UHV post electrical equipment considering flange rotational stiffness. J. Constr. Steel Res. 2021, 183, 106701. [Google Scholar] [CrossRef]
  3. He, C.; Wei, M.M.; Xie, Q.; Jiang, L.Z. Seismic responses of bundled conductor interconnected electrical equipment. Structures 2021, 33, 3107–3121. [Google Scholar] [CrossRef]
  4. Hu, Y.; Jiang, L.Q.; Ye, J.H.; Zhang, X.; Jiang, L.Z. Seismic responses and damage assessment of a mid-rise cold-formed steel building under far-fault and near-fault ground motions. Thin Walled Struct. 2021, 163, 107690. [Google Scholar] [CrossRef]
  5. Abou-Rayan, A.; Khalil, N.; Youssef, A.; Eldeib, M. Flexural Behavior of Encased Beam Flat or Perforated steel Cold Formed Sections. Int. J. Steel Struct. 2021, 21, 1465–1477. [Google Scholar] [CrossRef]
  6. Zhang, J.F.; Li, B.; Li, A.Q.; Pang, S.Y. Critical stress determination of local and distortional buckling of lipped angle columns under axial compression. Buildings 2022, 12, 712. [Google Scholar] [CrossRef]
  7. Thirunavukkarasu, K.; Kanthasamy, E.; Gatheeshgar, P.; Poologanathan, K.; Rajanayagam, H.; Suntharalingam, T.; Dissanayake, M. Sustainable performance of a modular building system made of built-up cold-formed steel beams. Buildings 2021, 11, 460. [Google Scholar] [CrossRef]
  8. Dar, M.A.; Yusuf, M.; Dar, A.R.; Raju, J. Experimental study on innovative sections for cold formed steel beams. Steel Compos. Struct. 2015, 19, 1599–1610. [Google Scholar] [CrossRef]
  9. Shaker, F.M.F.; Mamdooh, Z.; Deifalla, A.; Yehia, M.M. Experimental investigations of the behavior of stiffened perforated cold-formed steel sections subjected to axial compression. Buildings 2022, 12, 812. [Google Scholar] [CrossRef]
  10. Jiang, L.Q.; Yu, K.; Ye, J.H.; Hu, Y.; Jiang, L.Z. Seismic Damage Assessment and Shaking-Table Test Validation of Midrise Cold-Formed Steel Composite Shear Wall Buildings. J. Struct. Eng. 2022, 148, 04022093. [Google Scholar] [CrossRef]
  11. Jiang, L.Q.; Ye, J.H. Quantifying the effects of various uncertainties on seismic risk assessment of CFS structures. Bull. Earthq. Eng. 2019, 18, 241–272. [Google Scholar] [CrossRef]
  12. Jiang, L.Q.; Ye, J.H. Redundancy of a mid-rise CFS composite shear wall building based on seismic response sensitivity analysis. Eng. Struct. 2019, 200, 109647. [Google Scholar] [CrossRef]
  13. Zhou, X.H. Research progress on cold-formed steel structural framing. Steel Constr. 2020, 35, 1–19. [Google Scholar]
  14. Li, Y.Q.; Li, Y.L.; Wang, S.K.; Shen, Z.Y. Investigation on ultimate capacity of built-up columns with double channel sections under axial compression. J. Build. Struct. 2014, 35, 104–113. [Google Scholar] [CrossRef]
  15. Chen, M.; Huang, J.H.; Zhao, G.T. Research progress of compound section cold-formed thin-wall steel structures. Eng. Mech. 2016, 33, 1–11. [Google Scholar] [CrossRef]
  16. Bae, S.-W.; Laboube, R.A.; Belarbi, A.; Ayoub, A. Progressive collapse of cold-formed steel framed structures. Thin Walled Struct. 2008, 46, 706–719. [Google Scholar] [CrossRef]
  17. Whittle, J.; Ramseyer, C. Buckling capacities of axially loaded, cold-formed, built-up C-channels. Thin Walled Struct. 2009, 47, 190–201. [Google Scholar] [CrossRef]
  18. Zhou, X.H.; Li, Z.; Liu, Y.J.; Shi, Y. Calculation method for bearing capacity of cold-formed steel built-up columns under axial compression. J. Archit. Civil. Eng. 2012, 29, 1–6. [Google Scholar]
  19. Chen, M.; Sun, F.F.; Sun, Y. Analysis on load-carring behavior of axial compression short column with double cold-formed C steel. Constr. Technol. 2012, 41, 684–686. [Google Scholar]
  20. Chen, M.; Bian, W.; Sun, F.F.; Chen, Y. Analysis on load-carrying behavior of axial compression short column with gusset plate between double back-to-back C steel. Build. Struct. 2013, 43, 1447–1450. [Google Scholar]
  21. Chen, M.; Lu, W.W.; Liu, K. Aanlysis of bearing capacity of double cold-formed thin-walled C steel back-to-back composite column with plate coupled. Ind. Constr. 2014, 44, 124–127. [Google Scholar]
  22. Li, Y.Q.; Li, Y.L.; Wang, S.K.; Shen, Z.Y. Ultimate load-carrying capacity of cold-formed thin-walled columns with built-up box and I section under axial compression. Thin Walled Struct. 2014, 79, 202–217. [Google Scholar] [CrossRef]
  23. Dabaon, M.; Ellobody, E.; Ramzy, K. Experimental investigation of built-up cold-formed steel section battened columns. Thin Walled Struct. 2015, 92, 137–145. [Google Scholar] [CrossRef]
  24. Dabaon, M.; Ellobody, E.; Ramzy, K. Nonlinear behaviour of built-up cold-formed steel section battened columns. J. Constr. Steel Res. 2015, 110, 16–28. [Google Scholar] [CrossRef]
  25. Abbasi, M.; Khezri, M.; Rasmussen, K.J.R.; Schafer, B.W. Elastic buckling analysis of cold-formed steel built-up sections with discrete fasteners using the compound strip method. Thin Walled Struct. 2018, 124, 58–71. [Google Scholar] [CrossRef]
  26. Rahnavard, R.; Craveiro, H.D.; Laím, L.; Simões, R.A.; Napolitano, R. Numerical investigation on the composite action of cold-formed steel built-up battened columns. Thin Walled Struct. 2021, 162, 107553. [Google Scholar] [CrossRef]
  27. Zhou, T.H.; Wang, L.; Wang, Q. Experimental research on bearing capacity of cold-formed steel double-shaft built-up long columns. The 6th National Civil Engineering Graduate Academic Forum; Atlantis Press: Amsterdam, The Netherlands, 2008; p. 65. [Google Scholar]
  28. Zhou, T.H.; Nie, S.F.; Liu, X.B. Experimental study on cold-formed steel three limbs built-up section members under axial compression. J. Build. Struct. 2012, 33, 22–29. [Google Scholar]
  29. Zhou, T.H.; Yang, D.H.; Nie, S.F.; Wu, H.H. Experimental study and numerical analysis of the behavior of cold-formed steel quadruple-C built-up section members under axial compression. China Civ. Eng. J. 2012, 45, 77–85. [Google Scholar]
  30. Zhou, T.H.; Li, Y.C.; Wu, H.H.; Lu, Y.; Ren, L. Analysis to determine flexural buckling of cold-formed steel built-up back-to-back section columns. J. Constr. Steel Res. 2020, 166, 105898. [Google Scholar] [CrossRef]
  31. Stone, T.A.; Laboube, R.A. Behavior of cold-formed steel built-up I-sections. Thin Walled Struct. 2005, 43, 1805–1817. [Google Scholar] [CrossRef]
  32. Yao, X.Y.; Li, X. Tests and direct strength method on the distortional buckling and interactive buckling of cold-formed thin-walled steel built-up I-section columns under axial compression. Prog. Steel Build. Struct. 2021, 23, 33–46. [Google Scholar]
  33. Fratamico, D.C.; Torabian, S.; Zhao, X.; Rasmussen, K.J.; Schafer, B.W. Experimental study on the composite action in sheathed and bare built-up cold-formed steel columns. Thin Walled Struct. 2018, 127, 290–305. [Google Scholar] [CrossRef]
  34. Fratamico, D.C.; Torabian, S.; Zhao, X.; Rasmussen, K.J.; Schafer, B.W. Experiments on the global buckling and collapse of built-up cold-formed steel columns. J. Constr. Steel Res. 2018, 144, 65–80. [Google Scholar] [CrossRef]
  35. Southwell, R.V. On the analysis of experimental observations in problems of elastic stability. Proc. R. Soc. Lond. 1932, 135, 601–616. [Google Scholar] [CrossRef]
  36. Roy, K.; Ting, T.C.H.; Lau, H.H.; Lim, J.B. Effect of thickness on the behaviour of axially loaded back-to-back cold-formed steel built-up channel sections-Experimental and numerical investigation. Structures 2018, 16, 327–346. [Google Scholar] [CrossRef]
  37. Roy, K.; Ting, T.C.H.; Lau, H.H.; Lim, J.B. Nonlinear behaviour of back-to-back gapped built-up cold-formed steel channel sections under compression. J. Constr. Steel Res. 2018, 147, 257–276. [Google Scholar] [CrossRef]
  38. Barszcz, A.M.; Giżejowski, M.A.; Stachura, Z. On elastic lateral-torsional buckling analysis of simply supported I-shape beams using Timoshenko’s energy method. In Modern Trends in Research on Steel, Aluminium and Composite Structures; Routledge: Leiden, The Netherlands, 2021; pp. 92–98. [Google Scholar]
  39. Kuś, J.; Maleska, T. Lateral torsional buckling of tapered steel I-beams with stiffner ribs. In Modern Trends in Research on Steel, Aluminium and Composite Structures; Giżejowski, M.A., Kozłowski, A., Chybiński, M., Rzeszut, K., Studziński, R., Szumigała, M., Eds.; Routledge: Leiden, The Netherlands, 2021; pp. 428–434. [Google Scholar]
  40. Trahair, N.S. Bending and buckling of tapered steel beam structures. Eng. Struct. 2014, 59, 229–237. [Google Scholar] [CrossRef]
  41. Tankova, T.; Martins, J.P.; da Silva, L.S.; Simões, R.; Craveiro, H.D. Experimental buckling behaviour of web tapered I-section steel columns. J. Constr. Steel Res. 2018, 147, 293–312. [Google Scholar] [CrossRef]
  42. Ansys® Academic Research Mechanical, Release 19.0, Help System, Coupled Field Analysis Guide; ANSYS, Inc.: Canonsburg, PA, USA, 2018.
  43. Lu, Y.; Zhou, T.H.; Li, W.C.; Wu, H. Experimental investigation and a novel direct strength method for cold-formed built-up I-section columns. Thin Walled Struct. 2017, 112, 125–139. [Google Scholar] [CrossRef] [Green Version]
  44. GB 50017–2017; Ministry of Housing and Urban-Rural Development of the People’s Republic of China. Standard for design of steel structures. Architecture and Building Press: Beijing, China, 2017.
  45. Li, Y.C.; Zhou, T.H.; Ding, J.H.; Li, C.Y.; Zhang, X.C. Investigation on distortion buckling behavior of cold-formed thin-walled steel built-up box-section columns. J. Hunan Univ. Nat. Sci. 2021, 48, 10–21. [Google Scholar]
  46. GB 50018–2002; Ministry of Housing and Urban-Rural Development of the People’s Republic of China. Technical Code of Cold-Formed Thin-Wall Structures. Planing Press: Beijing, China, 2002.
  47. AISI-S100–16; AISI. North American Specification for the Design of Cold-Formed Steel Structural Members. American Iron and Steel Institute: Washington, DC, USA, 2016.
Figure 1. Diagram of the C-steel combined I-section column (a) Cross section; (b) 3D diagram; (c) Side-view and front view diagram.
Buildings 12 01378 g001
Figure 2. Parameters in the combined column.
Buildings 12 01378 g002
Figure 3. Naming rules of the combined column.
Buildings 12 01378 g003
Figure 4. Finite element models of the C-steel combined I-section columns.
Buildings 12 01378 g004
Figure 5. Load–vertical displacement relationship curves of the C-steel combined I-section columns (a) SC-90-300-A1; (b) MC-140-1500-A1; (c) LC-90-3000-A1.
Buildings 12 01378 g005
Figure 6. Comparisons of the failure modes of the combined columns (a) SC-90-A2; (b) MC-140-A1; (c) LC-90-A2.
Buildings 12 01378 g006
Figure 7. Naming rules of the combined columns in parametric analyses.
Buildings 12 01378 g007
Figure 8. Deformation of the C120-40-15-1.5-L combined columns (a) C120-40-15-1.5-300; (b) C120-40-15-1.5-1500; (c) C120-40-15-1.5-2400; (d) C120-40-15-1.5-3000.
Buildings 12 01378 g008
Figure 9. F-Δ relationship curves of C120-40-15-1.5-L.
Buildings 12 01378 g009
Figure 10. Nu-λ relationship curves of the combined columns.
Buildings 12 01378 g010
Figure 11. Stress distortions of the combined columns with different height to thickness ratios of web (a) C90-40-15-1.5-1500; (b) C160-40-15-1.5-1500; (c) C200-40-15-1.5-1500.
Buildings 12 01378 g011aBuildings 12 01378 g011b
Figure 12. F-Δ relationship curves of CH-40-15-1.5-1500.
Buildings 12 01378 g012
Figure 13. Nu-h/t relationship curves of the combined columns.
Buildings 12 01378 g013
Figure 14. Stress distortions of the combined columns with different width to thickness ratios of flange (a) C90-30-15-1.5-1500; (b) C90-45-15-1.5-1500; (c) C90-60-15-1.5-1500.
Buildings 12 01378 g014
Figure 15. F-Δ relationship curves of C90-B-15-1.5-1500.
Buildings 12 01378 g015
Figure 16. Nu-b/t relationship curves of the combined columns.
Buildings 12 01378 g016
Figure 17. Nu-Sb relationship curves of the combined columns.
Buildings 12 01378 g017
Figure 18. Failure modes of the combined columns with different opening ratios (a) L300; (b) L1500; (c) L3000.
Buildings 12 01378 g018
Figure 19. Nu-K relationship of combined columns.
Buildings 12 01378 g019
Figure 20. Nu-Sh relationship of combined columns.
Buildings 12 01378 g020
Figure 21. Comparisons of the bearing capacities between numerical analyses and standards (a) C90-40-15-1.5-L; (b) C140-40-15-1.5-L.
Buildings 12 01378 g021
Figure 22. Stability factor of standard and numerical analyses.
Buildings 12 01378 g022
Figure 23. ξ–λ relationship.
Buildings 12 01378 g023
Figure 24. Comparisons of the ultimate compressive bearing capabilities (a) C90-40-15-1.5; (b) C120-40-15-1.5; (c) C140-40-15-1.5; (d) C160-40-15-1.5.
Buildings 12 01378 g024
Figure 25. Relationship between reduction factor and opening ratio.
Buildings 12 01378 g025
Figure 26. Validation of the proposed formulas for the combined column with opening (a) Comparisons of the bearing capacity of C-250-40-15-1.5-1900; (b) Nu/NFEM.
Buildings 12 01378 g026
Table 1. Parameters of the C-steel combined I-section columns in Ref [43].
L/mmh/mmb/mmc/mmt/mmδ0/mmλyA/mm2
SC-90-A127092.841.814.81.190.4128.45466.5
SC-90-A227093.841.814.71.190.5218.47468.4
MC-90-A1153393.541.515.01.180.56596.51464.0
MC-90-A2153192.542.014.51.200.43395.73469.0
LC-90-A1303391.843.214.41.190.521184.56468.9
LC-90-A2303892.840.215.01.180.374197.15456.2
SC-140-A1451142.742.915.11.470.64614.47724.3
SC-140-A2451144.242.814.81.480.53514.59731.1
MC-140-A11532142.042.515.51.480.65298.82726.9
MC-140-A21533142.042.015.01.480.443100.66721.0
LC-140-A13034140.842.015.51.490.656197.96725.0
LC-140-A23033141.542.316.01.470.661195.37722.5
Table 2. Comparisons between the simulated and tested compressive bearing capacities.
SimulationExperimentNFE/NTEError/%
NFE/kNFailure ModeNTE/kNFailure Mode
SC-90-A1133.6Local buckling127.7Local buckling1.0464.62
SC-90-A2133.5Local buckling132.8Local buckling1.0050.53
MC-90-A1102.3Local + overall buckling + distortion97.7Local + overall buckling + distortion1.0474.71
MC-90-A2106.7Local + overall buckling + distortion103.0Local + overall buckling + distortion1.0363.59
LC-90-A144.5Overall buckling42.6Overall buckling1.0454.46
LC-90-A244.9Overall buckling39.9Overall buckling1.12512.53
SC-140-A1142.7Local buckling + distortion130.7Local buckling + distortion1.0929.18
SC-140-A2143.1Local buckling + distortion139.6Local buckling + distortion1.0252.51
MC-140-A1106.2Local + overall buckling + distortion105.8Local + overall buckling + distortion0.8560.38
MC-140-A2105.1Local + overall buckling + distortion101.0Local + overall buckling + distortion1.0414.06
LC-140-A148.0Overall buckling49.2Overall buckling0.976−2.44
LC-140-A247.7Overall buckling46.9Overall buckling1.0171.71
Mean value----1.0263.82
Variance----0.0633.98
Table 3. Bolt spacings and ultimate compressive bearing capacity of combined columns.
Bolt Spacing/mmIncreasing RatioIncreasing Bearing Capacity
C140-40-1.5-30040, 60, 80, 100, 120, 150275%0.6%
C140-40-1.5-90050-450, step: 50800%0.6%
C140-40-1.5-150050-200, step: 5; 200-600, step: 1001100%1.1%
C140-40-1.5-300050-200, step: 50; 200-600, step: 1001100%1.8%
Publisher’s Note: MDPI stays neutral with regard to jurisdictional claims in published maps and institutional affiliations.

