


Innovation District Typology Classification via Performance Framework: Insights from Sydney, Melbourne, and Brisbane


Abstract
:1. Introduction
2. Literature Background
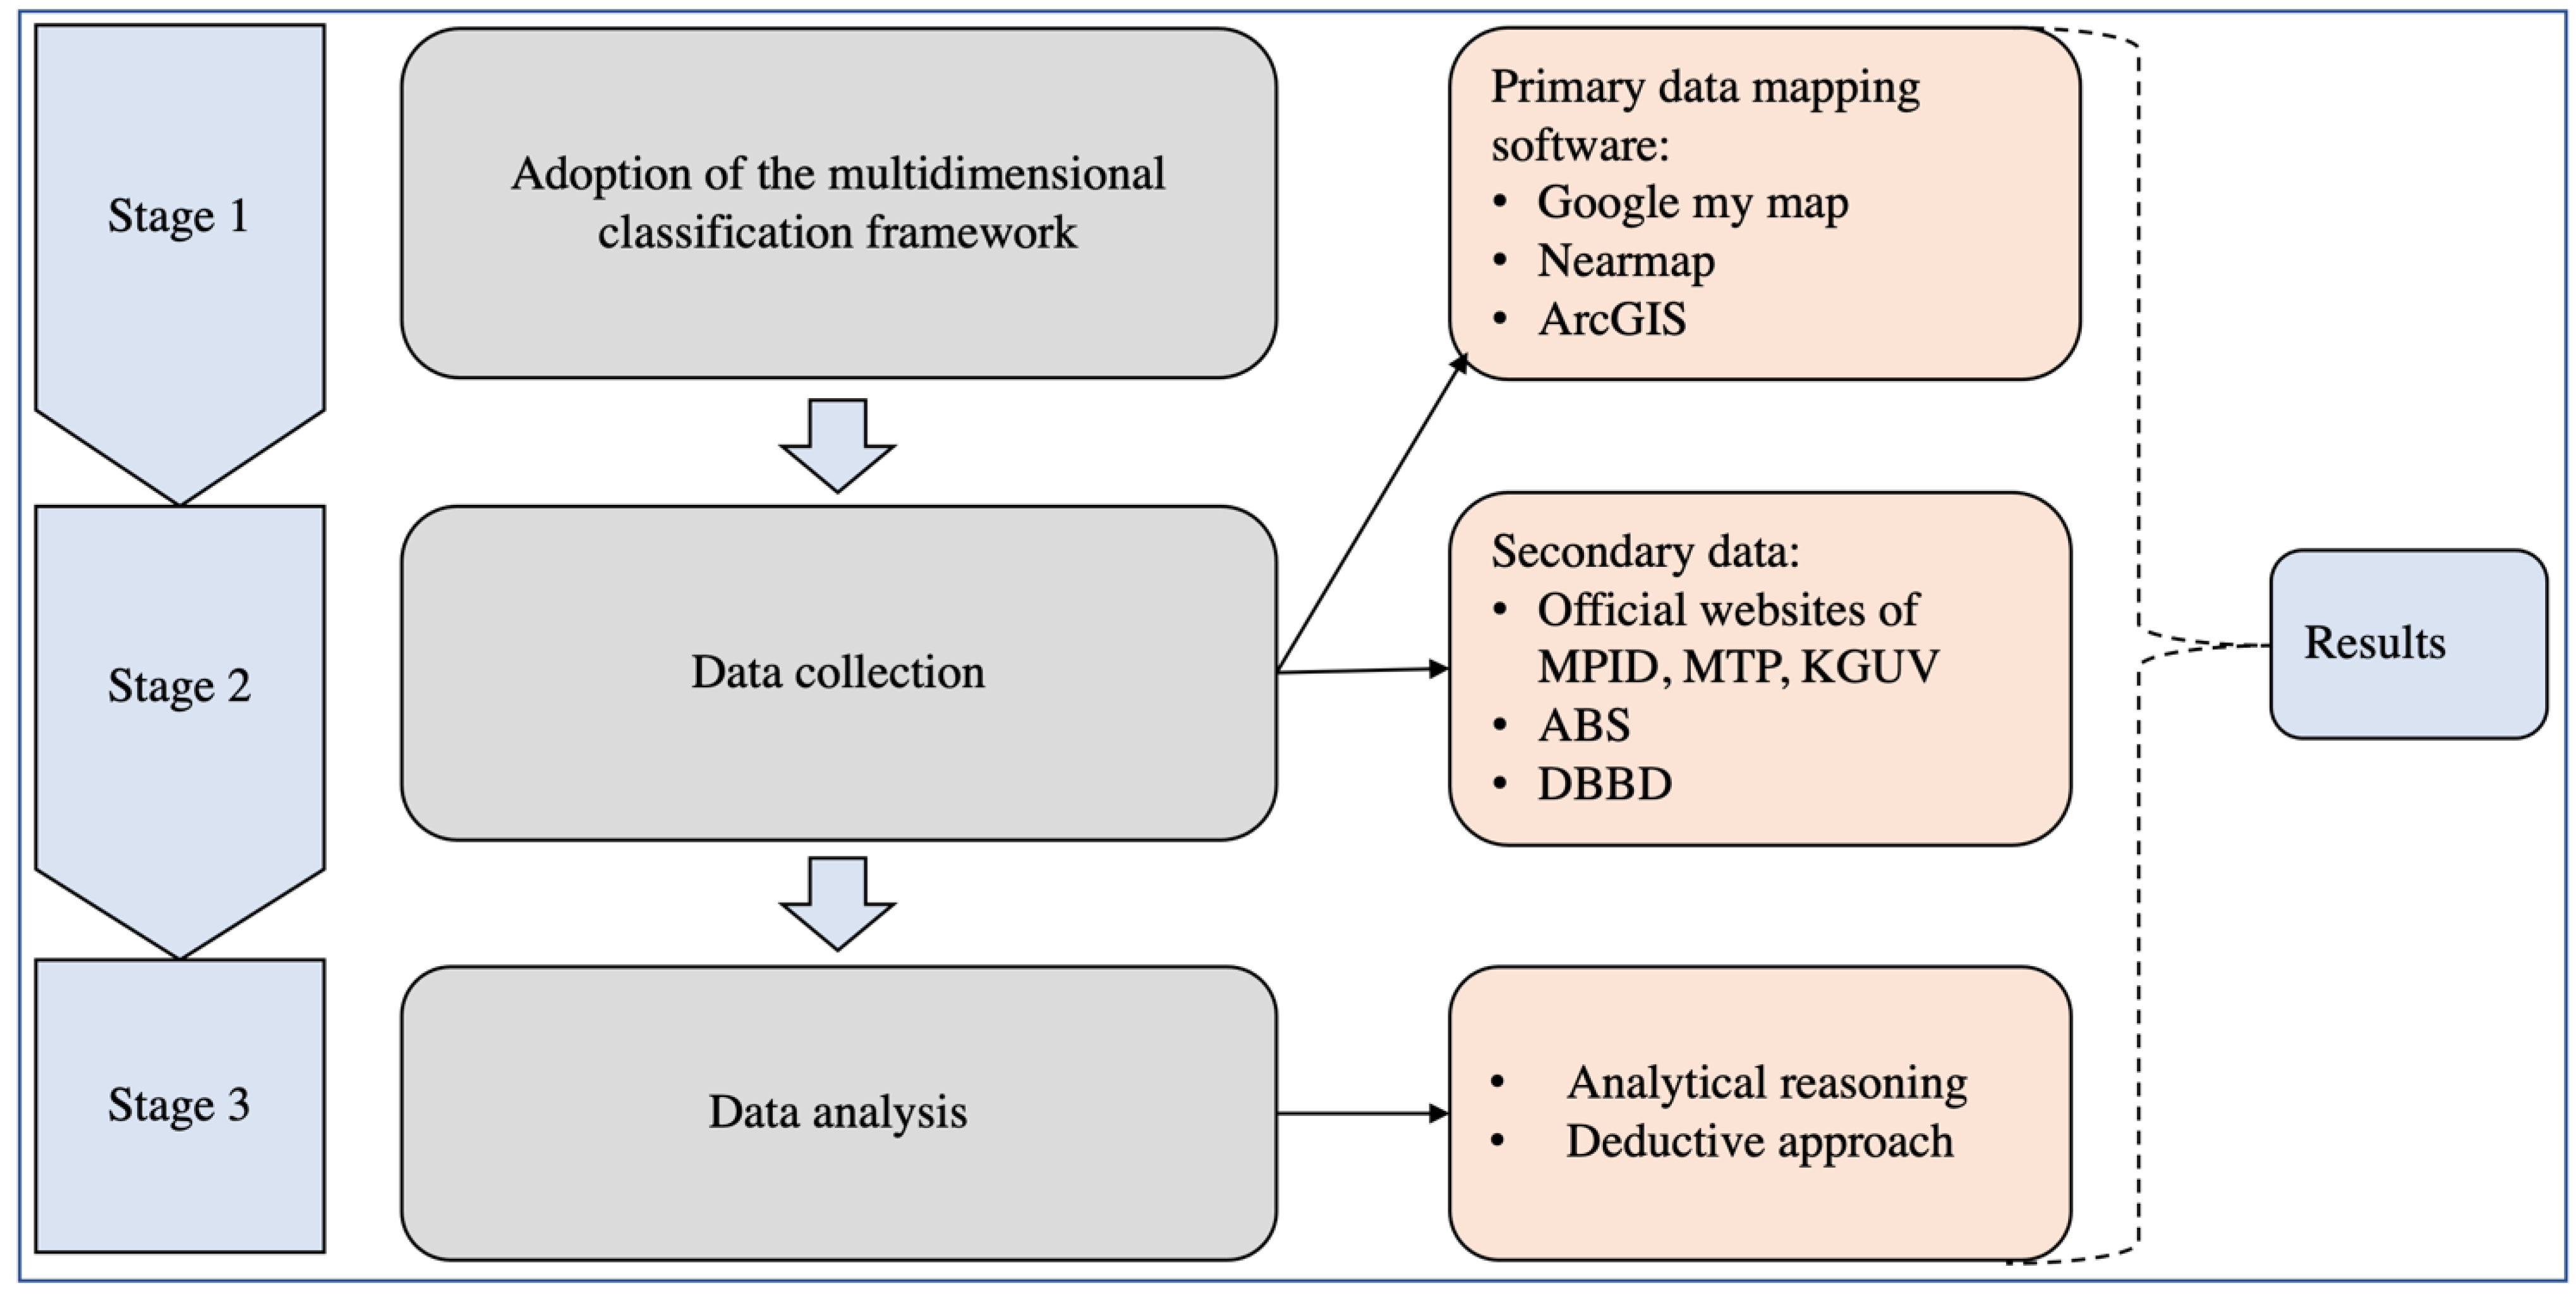
3. Materials and Methods
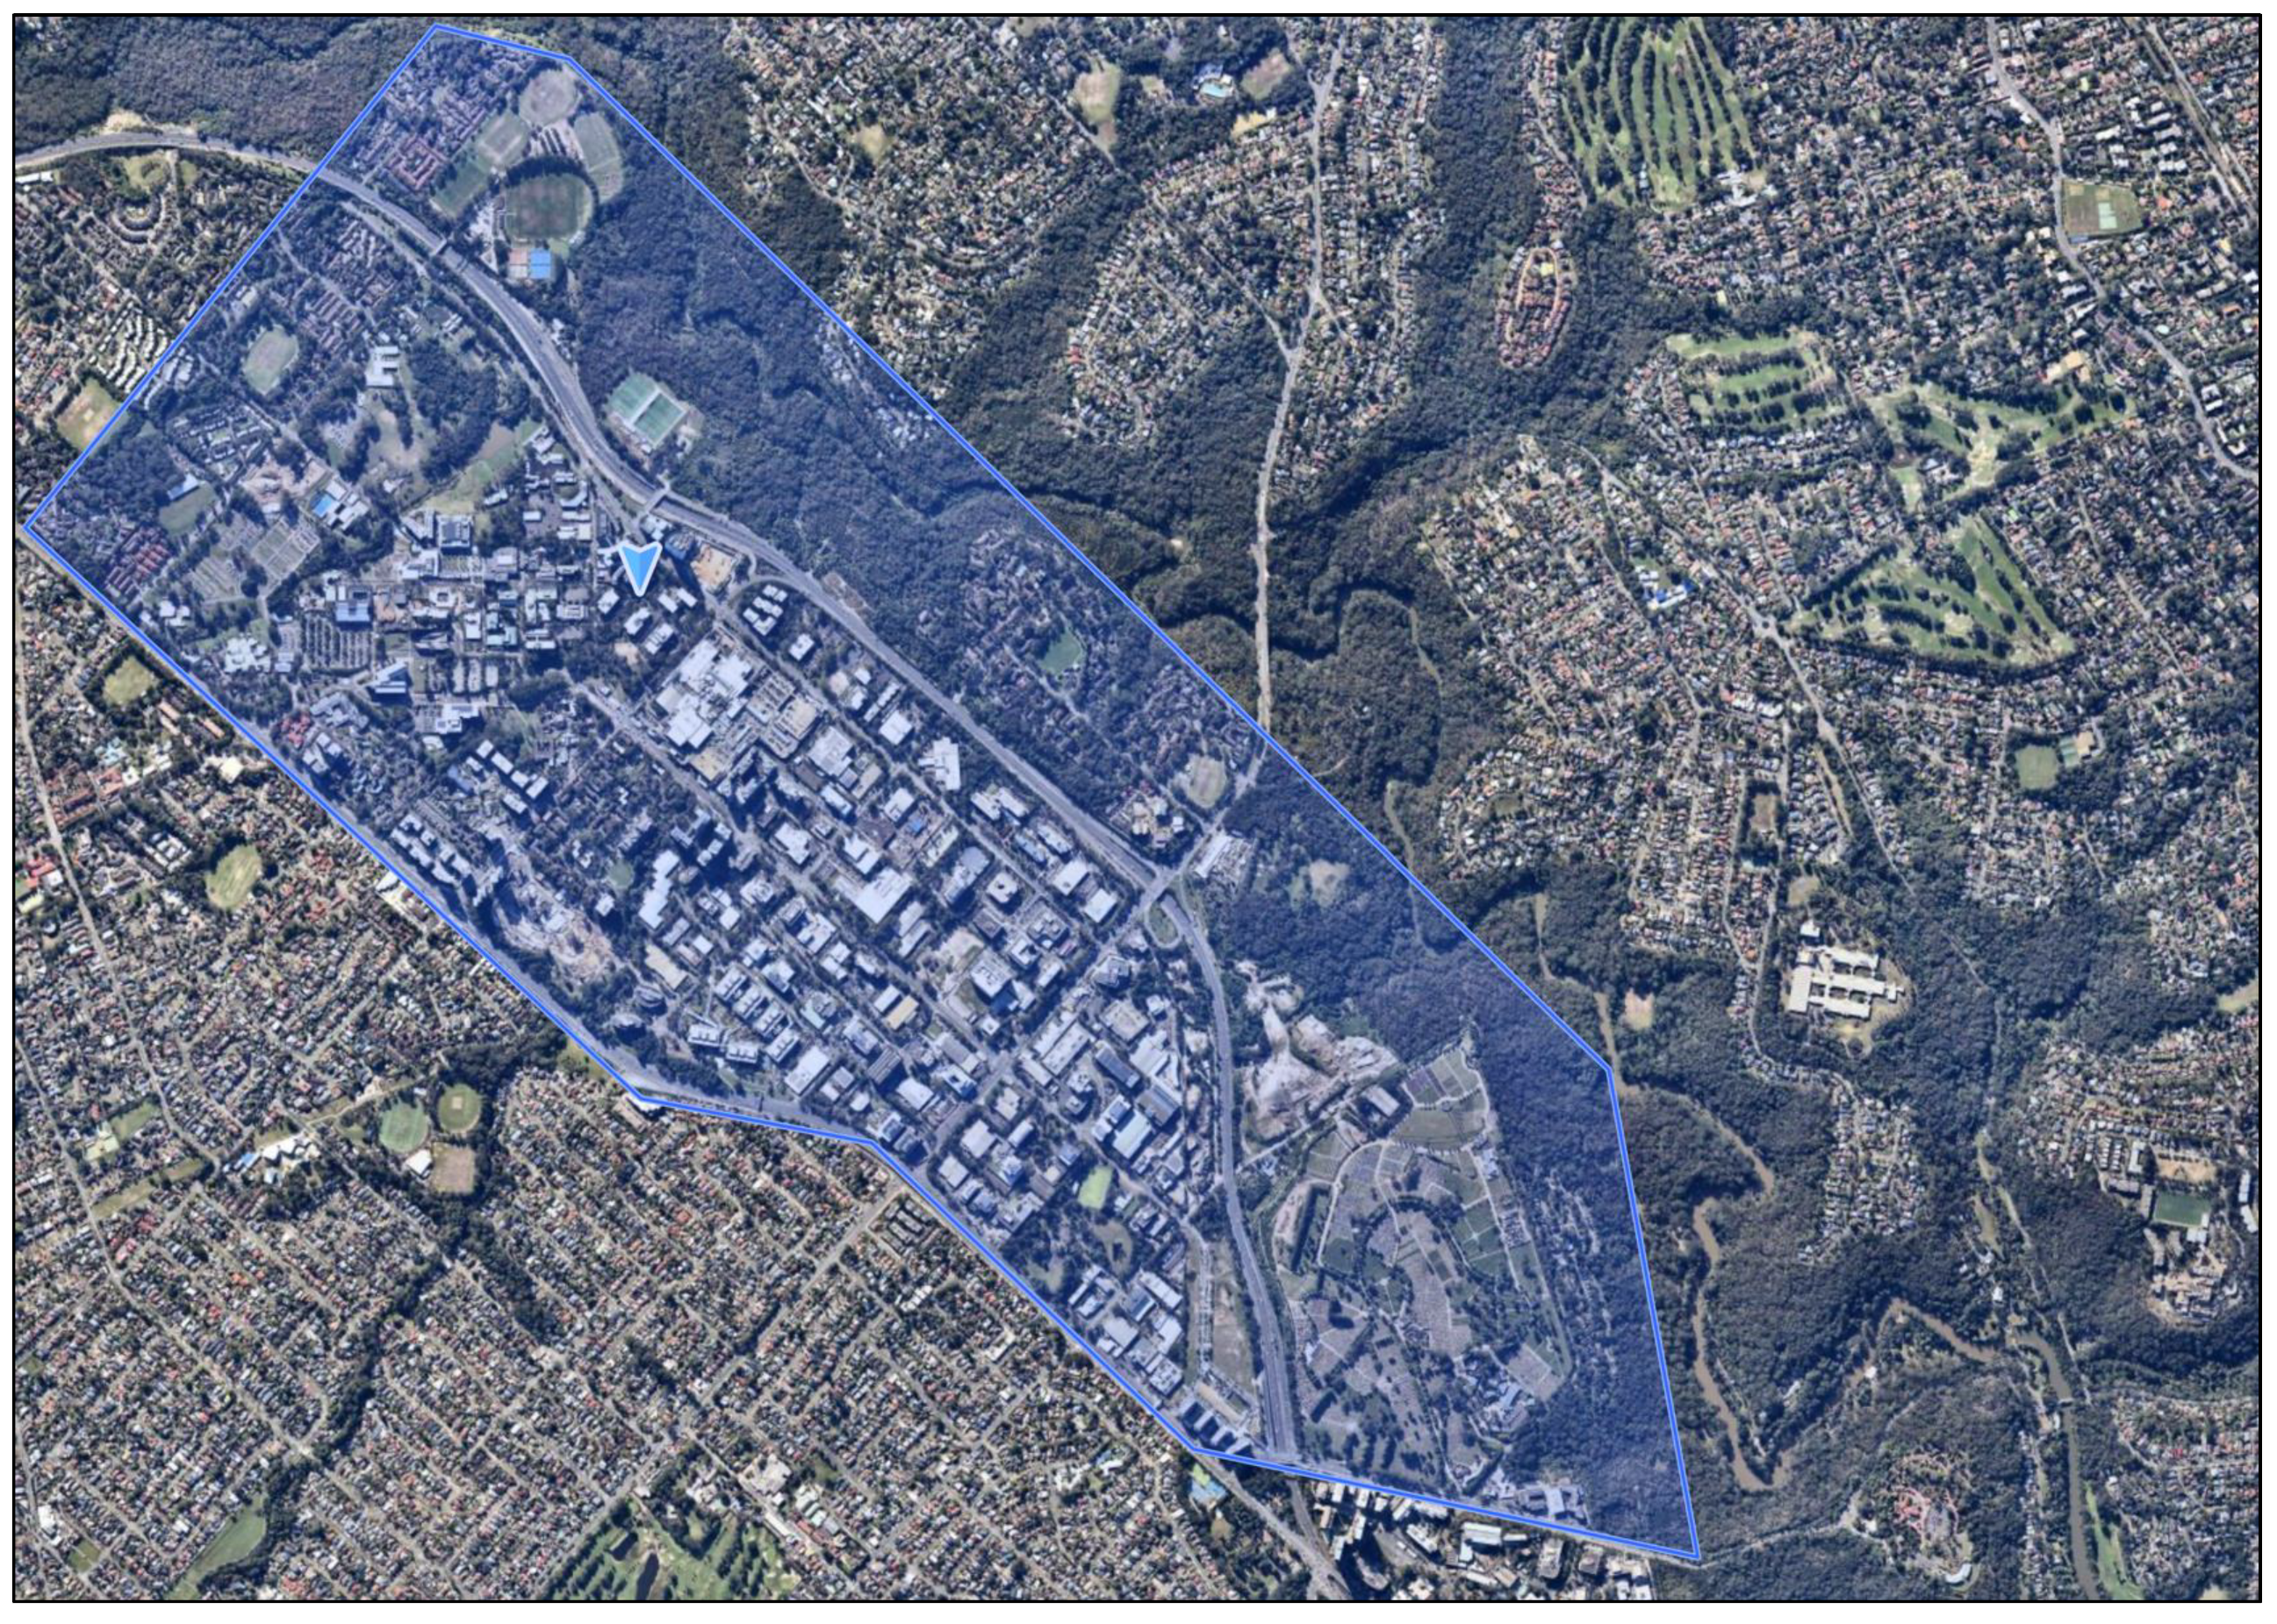
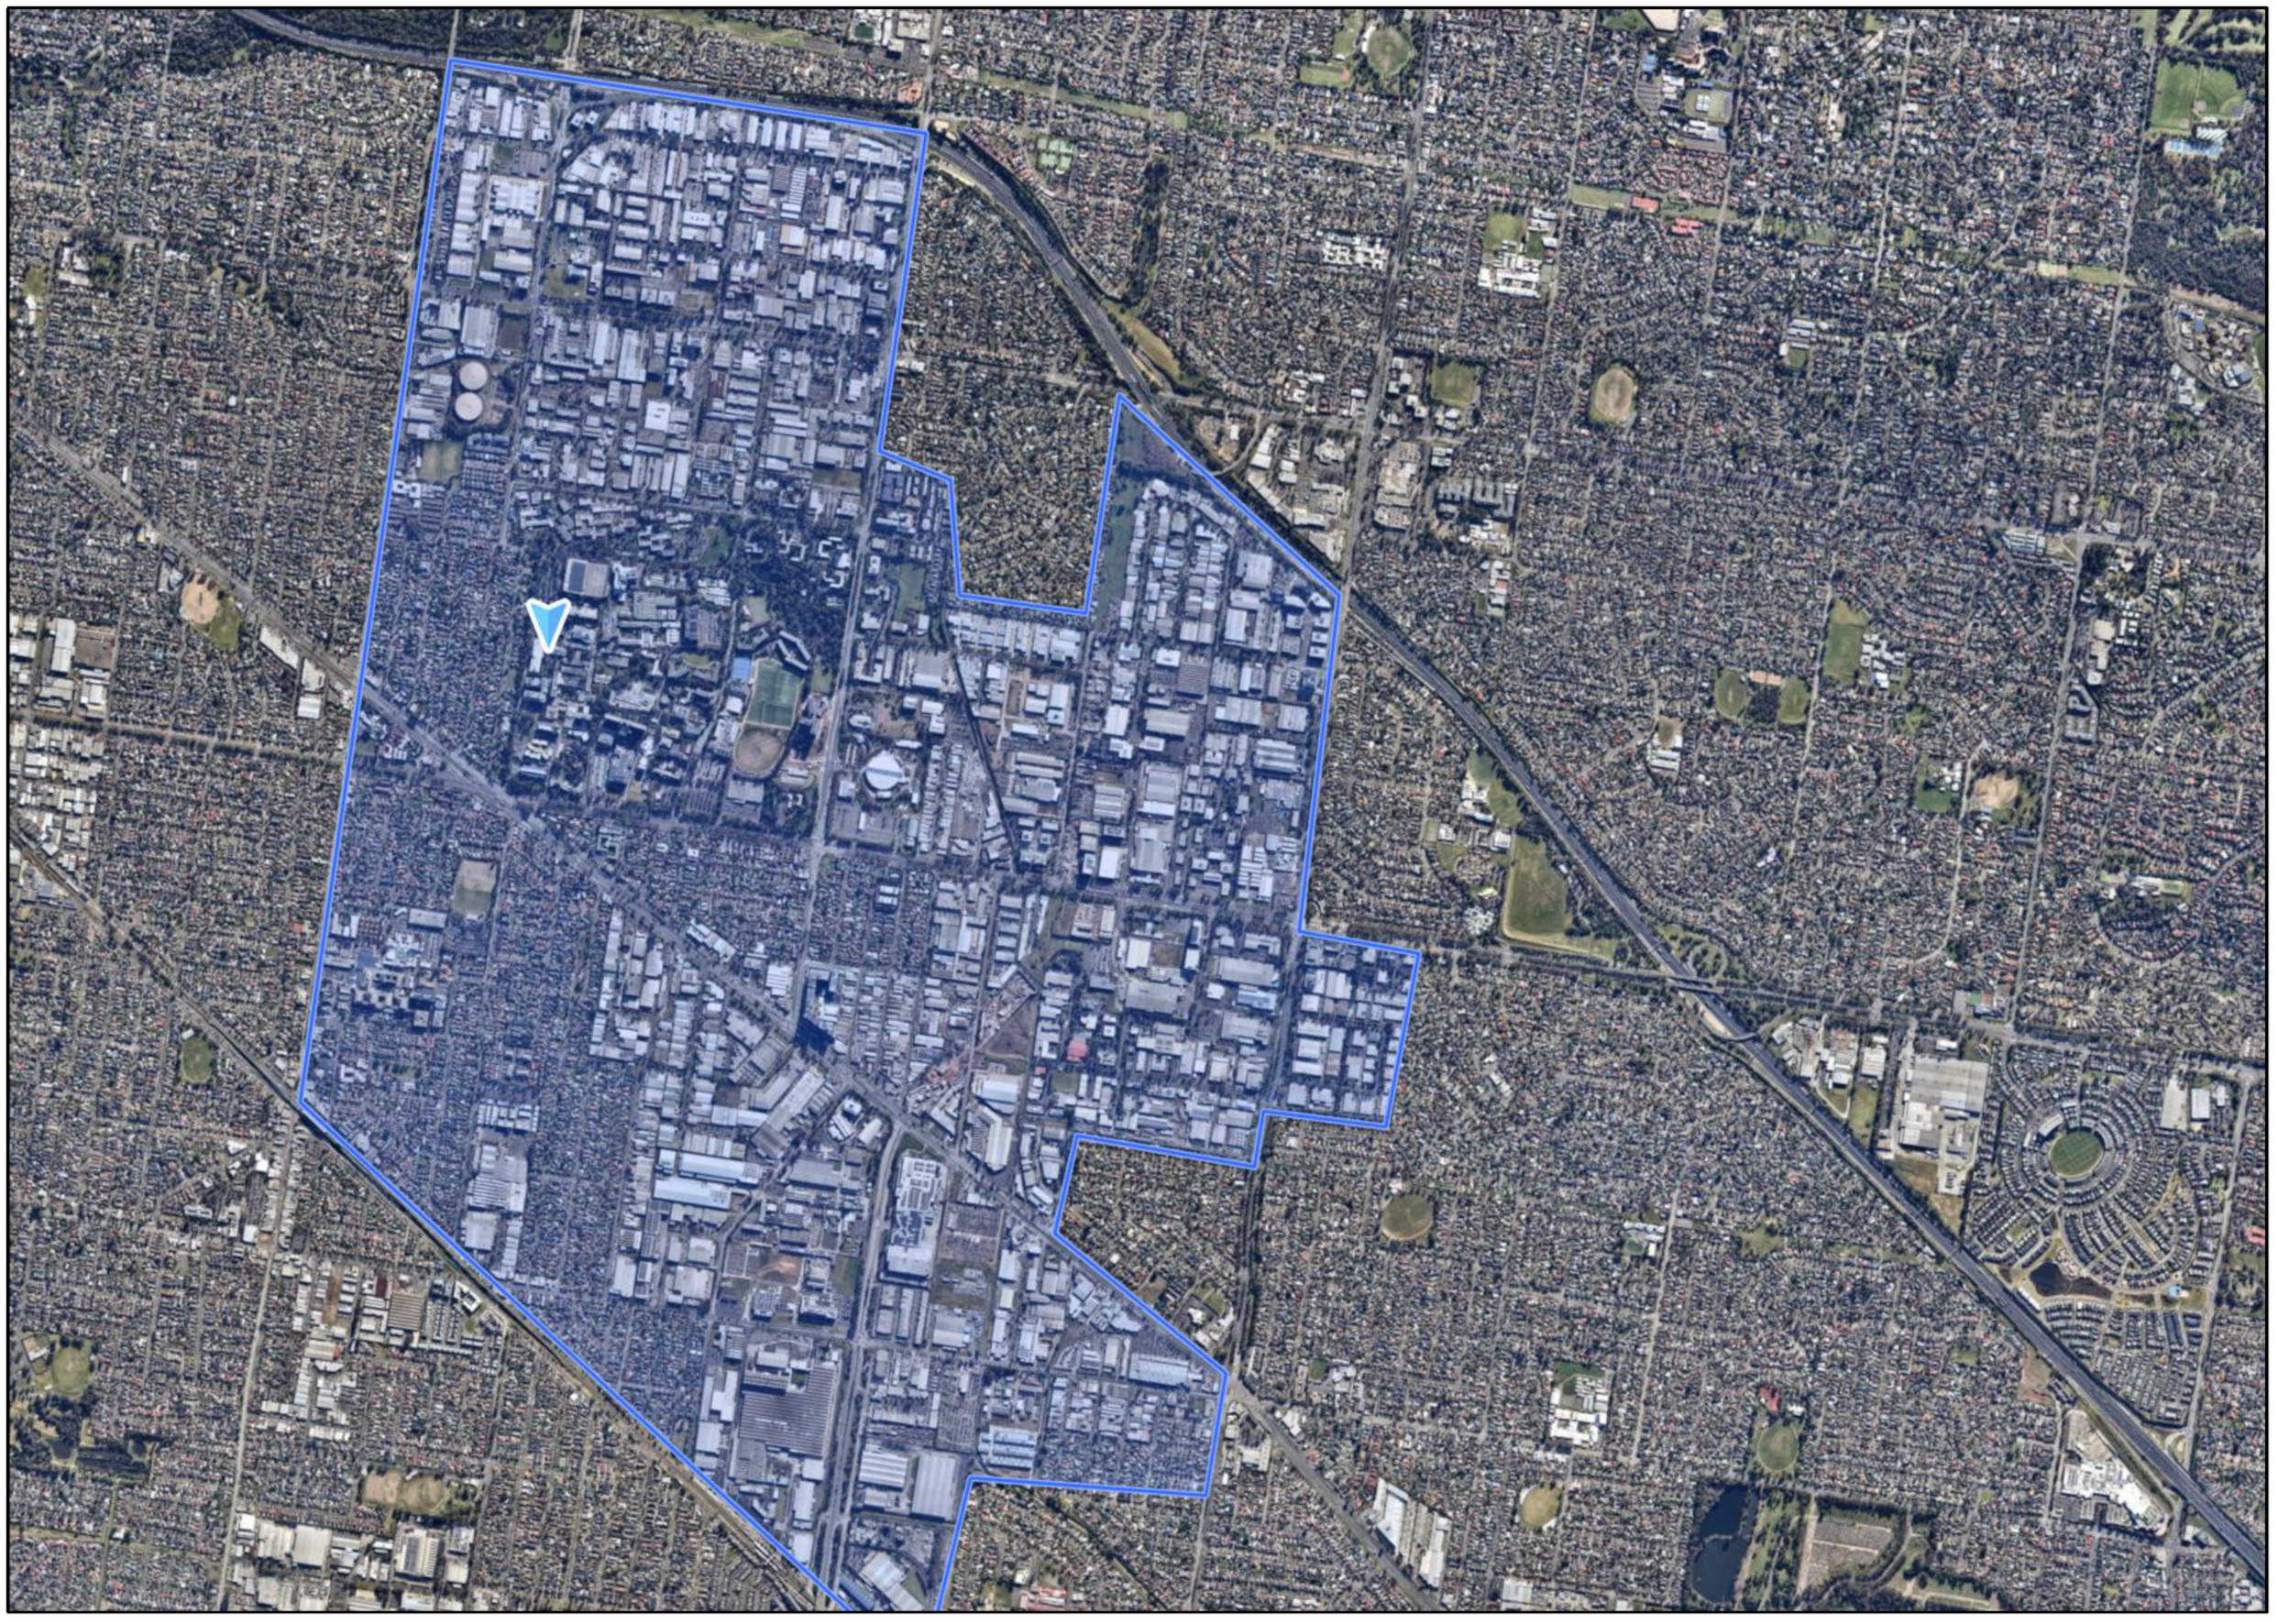
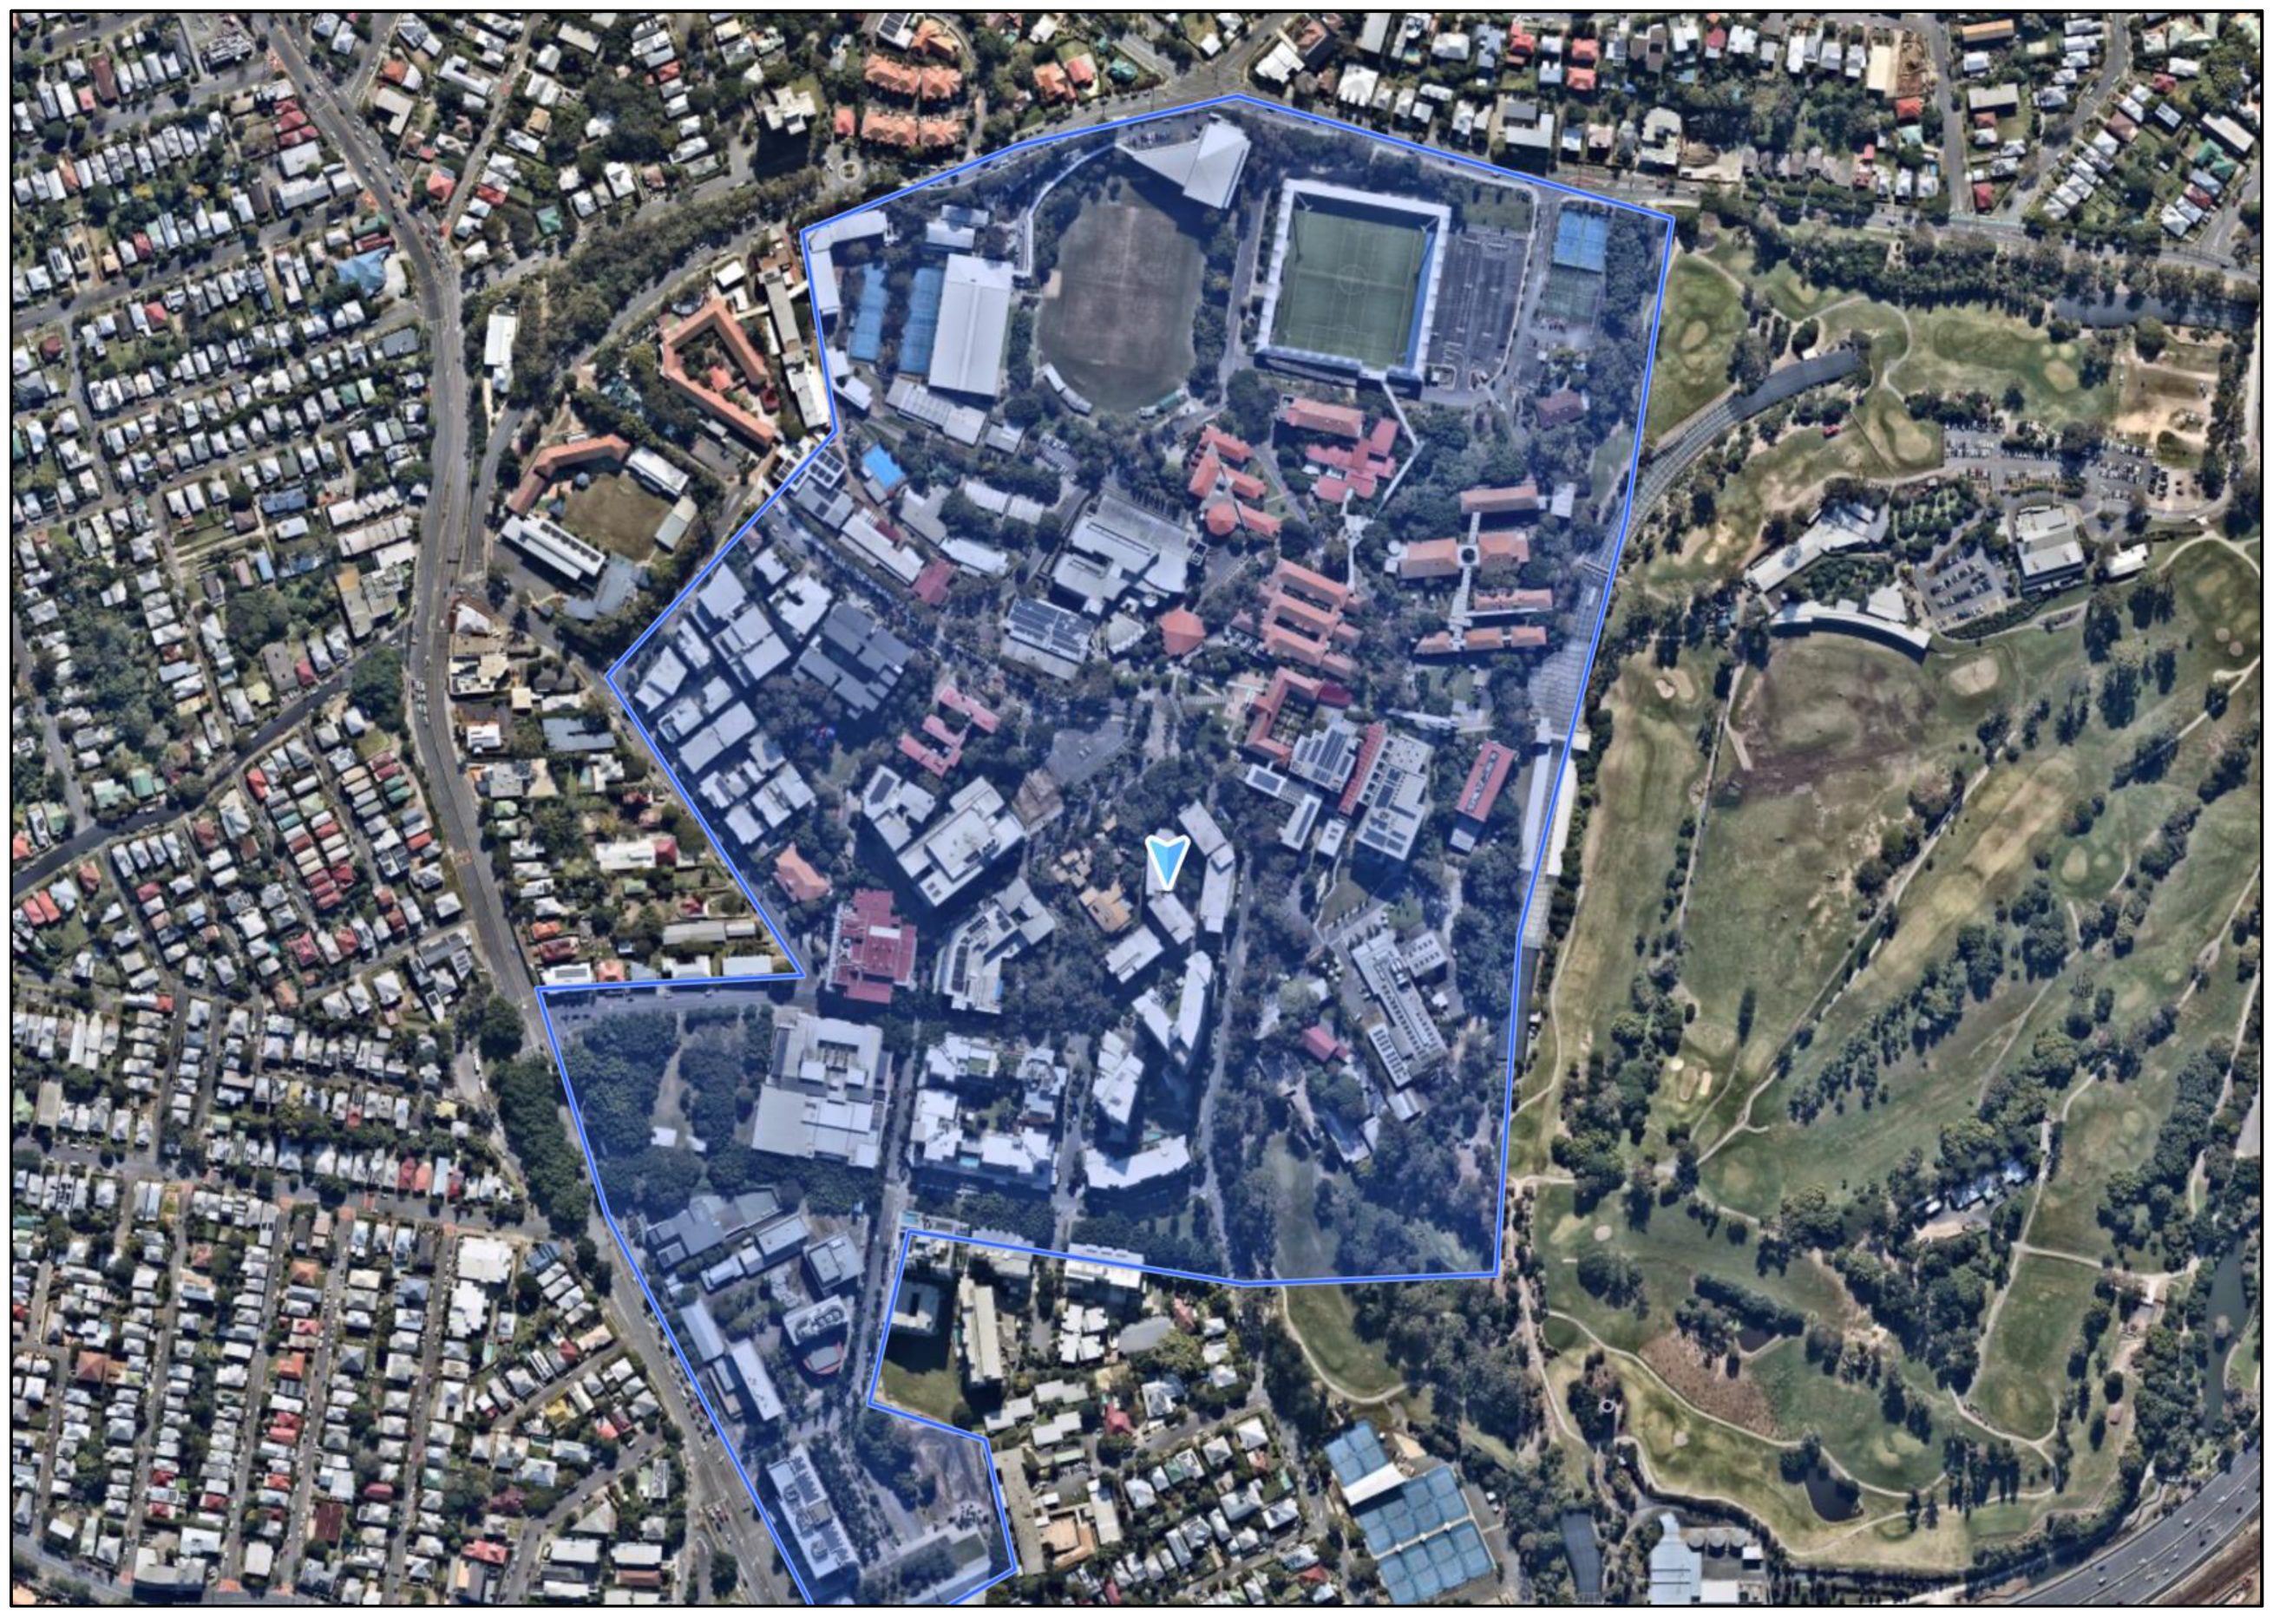
3.1. Case Studies
3.2. Data Collection
3.2.1. Context
3.2.2. Form
3.2.3. Feature
3.2.4. Function
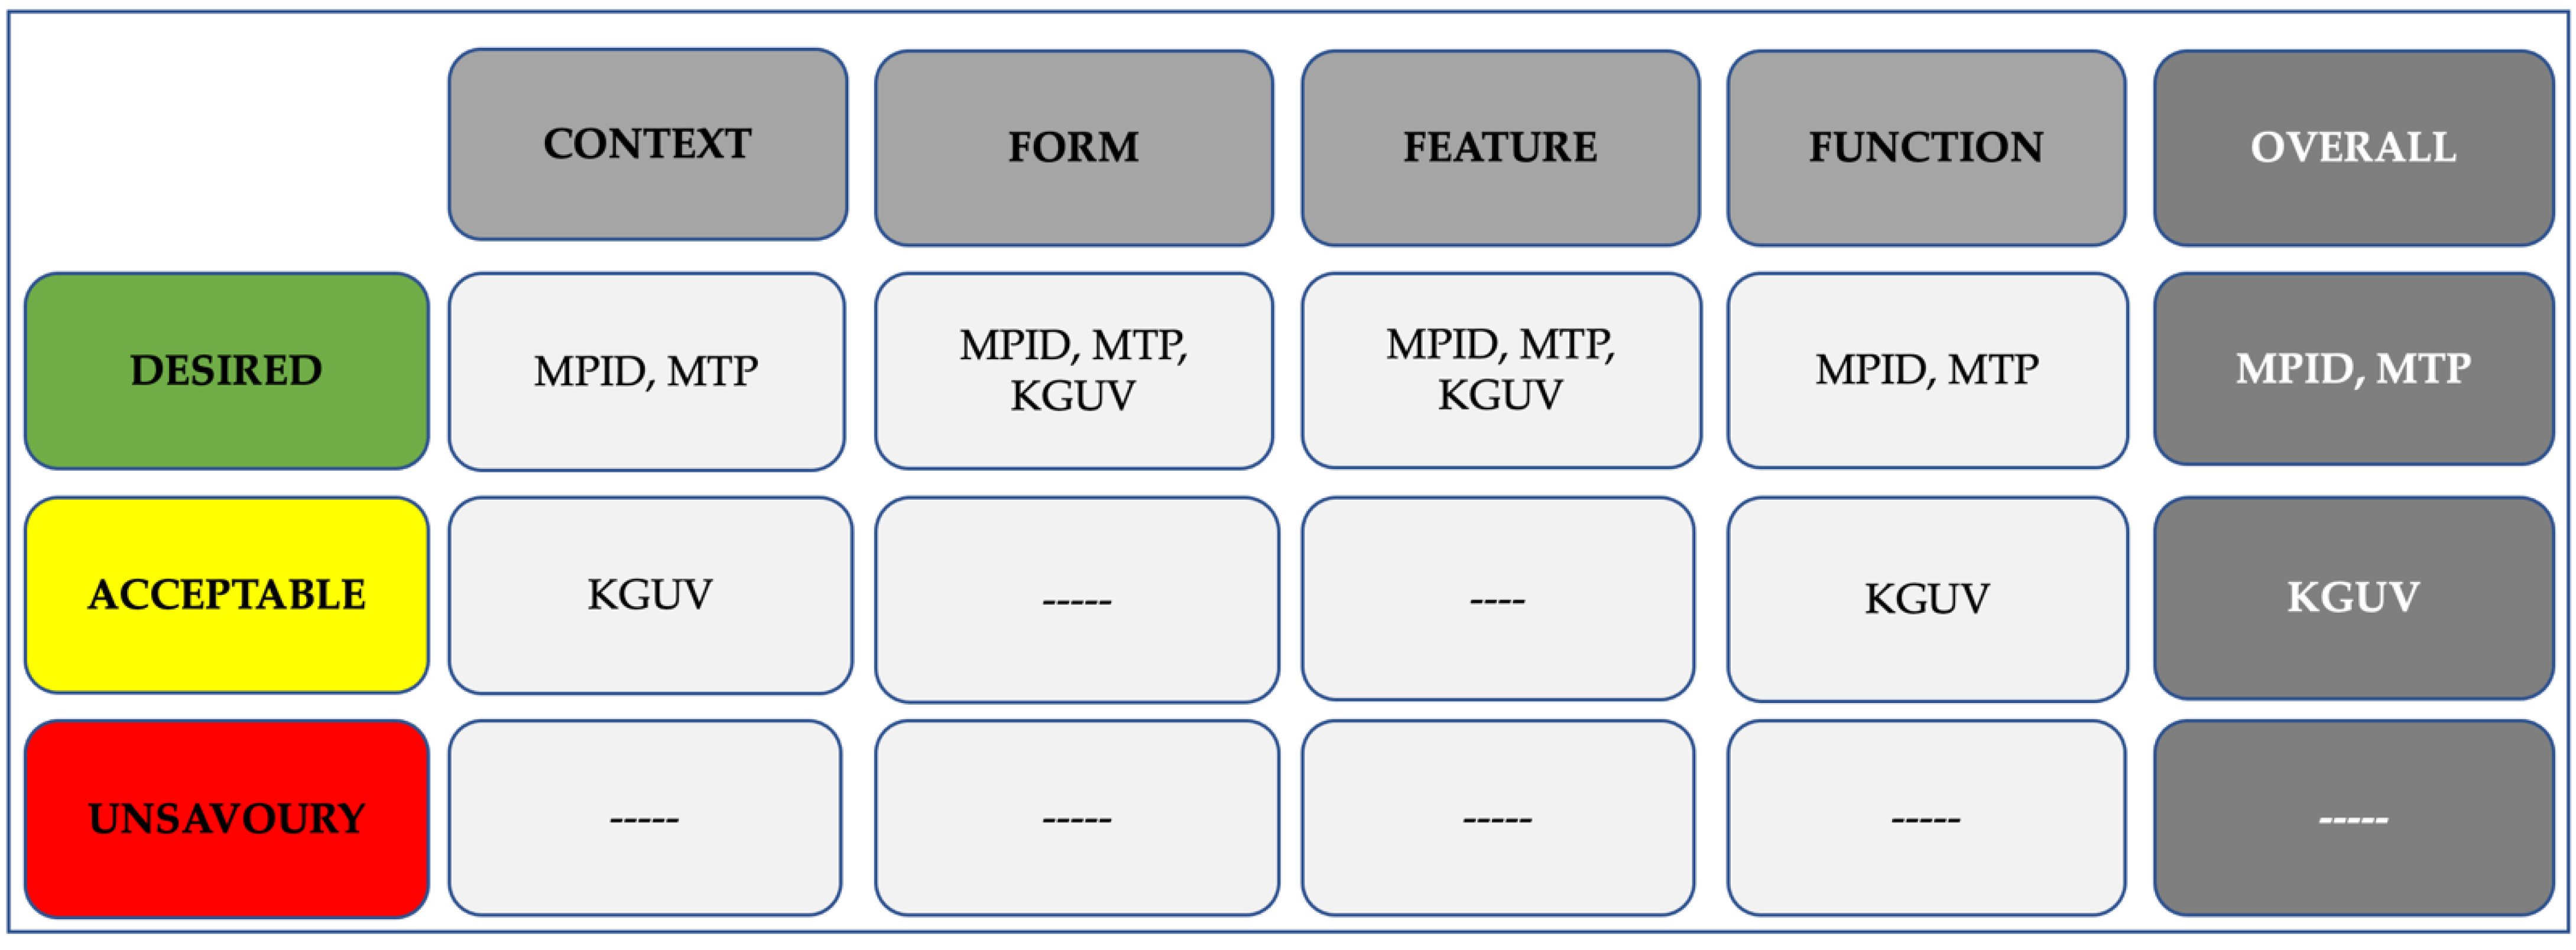
4. Analysis and Results
5. Findings and Discussion
- Complex mixed-use, semi-open space designs highly connected to external public spaces.
- Strong built environment and green and blue infrastructure.
- Strong human capital and skilled labor.
- Moderate social networking assets (social amenities).
- Technology-intensive firms.
- Macro (district-level) property management.
- Complex mixed-use, open designs highly connected to external public spaces.
- Strong built environment and green and blue infrastructure.
- Strong human capital and skilled labor.
- Moderate social networking assets (social amenities).
- Business support services.
- Macro (district-level) property management.
6. Conclusions
Author Contributions
Funding
Institutional Review Board Statement
Informed Consent Statement
Data Availability Statement
Acknowledgments
Conflicts of Interest
References
- Yigitcanlar, T.; Inkinen, T. Geographies of Disruption; Springer International Publishing: Singapore, 2019. [Google Scholar]
- Yigitcanlar, T.; Corchado, J.M.; Mehmood, R.; Li, R.Y.M.; Mossberger, K.; Desouza, K. Responsible Urban Innovation with Local Government Artificial Intelligence (AI): A Conceptual Framework and Research Agenda. J. Open Innov. Technol. Mark. Complex. 2021, 7, 71. [Google Scholar] [CrossRef]
- Lawrence, S.; Hogan, M.; Brown, E.G. Planning for An Innovation District; RTI Press: London, UK, 2019. [Google Scholar]
- Morawska, I.; Anielska, K.; Gądecki, J.; Afeltowicz, L. Changes in urban fabric–A cause or a result of an innovation district? J. Urban. Int. Res. Placemaking Urban Sustain. 2021, 1–22. [Google Scholar] [CrossRef]
- Cohendet, P.; Chenier, R.; Simon, L.; Stojak, L. Centech, a world-class business incubator based in the Montréal innovation district, inspired by Barcelona 22@. J. Evol. Stud. Bus. 2022, 7, 40–69. [Google Scholar] [CrossRef]
- Kayanan, C.M. A critique of innovation districts: Entrepreneurial living and the burden of shouldering urban development. Environ. Plan. A Econ. Space 2022, 54, 50–66. [Google Scholar] [CrossRef]
- Morisson, A.; Bevilacqua, C. Balancing gentrification in the knowledge economy: The case of Chattanooga’s innovation district. Urban Res. Pract. 2019, 12, 472–492. [Google Scholar] [CrossRef]
- Sisi, L. Streets place-making in Beijing’s innovative districts: From the perspective of public assets and property rights. China City Plan. Rev. 2019, 28, 28–36. [Google Scholar]
- Morisson, A. A framework for defining innovation districts: Case study from 22@ Barcelona. In Urban and Transit Planning; Springer: Cham, Switzerland, 2020; pp. 185–191. [Google Scholar]
- Spirou, C. Anchoring Innovation Districts: The Entrepreneurial University and Urban Change; JHU Press: London, UK, 2021. [Google Scholar]
- Borsi, K.; Schulte, C. Universities and the City: From islands of knowledge to districts of innovation. J. Arch. 2018, 23, 1143–1180. [Google Scholar] [CrossRef]
- Pancholi, S.; Yigitcanlar, T.; Guaralda, M. Place making for innovation and knowledge-intensive activities: The Australian experience. Technol. Forecast. Soc. Chang. 2019, 146, 616–625. [Google Scholar] [CrossRef]
- Wong, P.K. An Evolutionary Analysis of the Development of the One North Innovation District in Singapore. J. Evol. Stud. Business-JESB 2022, 7, 70–99. [Google Scholar] [CrossRef]
- Adu-McVie, R.; Yigitcanlar, T.; Erol, I.; Xia, B. Classifying innovation districts. Delphi validation of a multidimen-sional framework. Land Use Policy 2021, 111, 105779. [Google Scholar] [CrossRef]
- Markusen, A. Sticky Places in Slippery Space: A Typology of Industrial Districts. Econ. Geogr. 1996, 72, 293. [Google Scholar] [CrossRef]
- SGS. From Alleys to Valleys: Creating Innovation Precincts through Inclusive Policy; SGS Economics & Planning: Sydney, Australia, 2020. [Google Scholar]
- Díez-Vial, I.; Fern’andez-Olmos, M. Knowledge spill overs in science and technology parks: How can firms benefit most? J. Technol. Transf. 2015, 40, 70–84. [Google Scholar] [CrossRef]
- Jones, A.L. Regenerating urban waterfronts-creating better futures- from commercial and leisure marketplaces to cul-tural quarters and innovation districts. Plan. Pract. Res. 2017, 32, 333–334. [Google Scholar]
- Esmaeilpoorarabi, N.; Yigitcanlar, T.; Guaralda, M.; Kamruzzaman, M. Evaluating place quality in innovation dis-tricts: A Delphic hierarchy process approach. Land Use Policy 2018, 76, 471–486. [Google Scholar] [CrossRef]
- Esmaeilpoorarabi, N.; Yigitcanlar, T.; Kamruzzaman, M.; Guaralda, M. How does the public engage with innovation districts? Societal impact assessment of Australian innovation districts. Sustain. Cities Soc. 2020, 52, 101813. [Google Scholar] [CrossRef]
- Collier, D.; Laporte, J.; Seawright, J. Putting typologies to work concept formation, analysis, and rigor. Political Res. Q. 2012, 65, 217–232. [Google Scholar] [CrossRef]
- Dahl, R.A. Polyarchy: Participation and Opposition; Yale University Press: New Haven, CT, USA, 1971. [Google Scholar]
- Koc, C.B.; Osmond, P.; Peters, A. A Green Infrastructure Typology Matrix to Support Urban Microclimate Studies. Procedia Eng. 2016, 169, 183–190. [Google Scholar] [CrossRef]
- Klein, R. How To Create A Building Typology? Typological matrix for mapping 19th century synagogues. J. Fac. Civ. Eng. 2014, 30, 57–68. [Google Scholar] [CrossRef]
- Pozas, M.; Gonzalez, F.J. Housing building typology definition in a historical area based on a case study: The Valley, Spain. Cities 2018, 72, 1–7. [Google Scholar] [CrossRef]
- Sarzynski, A.; Galster, G.; Stack, L. Typologies of sprawl: Investigating United States metropolitan land use patterns. Urban Geogr. 2013, 35, 48–70. [Google Scholar] [CrossRef]
- Benefoh, D.T.; Villamor, G.B.; van Noordwijk, M.; Borgemeister, C.; Asante, W.A.; Asubonteng, K.O. Assessing land-use typologies and change intensities in a structurally complex Ghanaian cocoa landscape. Appl. Geogr. 2018, 99, 109–119. [Google Scholar] [CrossRef]
- De Groot, R.S.; Wilson, M.A.; Boumans, R.M.J. A typology for the classification, description and valuation of ecosystem functions, goods and services. Ecol. Econ. 2002, 41, 393–408. [Google Scholar] [CrossRef] [Green Version]
- Roelandt, T.J.; Hertog, P.D. Assessing the knowledge distribution power of national innovation systems. In Proceedings of the OECD Conference on the New S&T Indicators for the Knowledge-Based Economy, Paris, France, 19–21 June 1996. [Google Scholar]
- Boix, R.; Galletto, V. Innovation and Industrial Districts: A First Approach to the Measurement and Determinants of the I-District Effect. Reg. Stud. 2009, 43, 1117–1133. [Google Scholar] [CrossRef]
- Metaxiotis, K.; Carrillo, F.; Yigitcanlar, T. (Eds.) Knowledge-Based Development for Cities and Societies: Integrated Multi-Level Approaches. Premier Reference Source; IGI Global: Hershey, PA, USA, 2010. [Google Scholar]
- Leon, N. Attract and connect: The 22@ Barcelona innovation district and the internationalization of Barcelona business. Innovation 2008, 10, 235–246. [Google Scholar] [CrossRef]
- Turkina, E.; Van Assche, A. Global connectedness and local innovation in industrial clusters. J. Int. Bus. Stud. 2018, 49, 706–728. [Google Scholar] [CrossRef]
- Wu, Y.; Yang, Y.; Xu, W.; Chen, Q. The Influence of Innovation Resources in Higher Education Institutions on the Development of Sci-Tech Parks’ Enterprises in the Urban Innovative Districts at the Stage of Urbanization Transformation. Land 2020, 9, 396. [Google Scholar] [CrossRef]
- Lee, K.-R. From Fragmentation to Integration: Development Process of Innovation Clusters in Korea. Sci. Technol. Soc. 2001, 6, 305–327. [Google Scholar] [CrossRef]
- Heaphy, L.; Wiig, A. The 21st century corporate town: The politics of planning innovation districts. Telemat. Inform. 2020, 54, 101459. [Google Scholar] [CrossRef]
- Hansasooksin, S.T.; Tontisirin, N. Placemaking as an urban development strategy for making the Pattaya Innovation District. Reg. Sci. Policy Pract. 2021, 13, 1930–1950. [Google Scholar] [CrossRef]
- Komninos, N.; Kakderi, C.; Mora, L.; Panori, A.; Sefertzi, E. Towards High Impact Smart Cities: A Universal Architecture Based on Connected Intelligence Spaces. J. Knowl. Econ. 2022, 13, 1169–1197. [Google Scholar] [CrossRef]
- Katz, B.; Wagner, J. The Rise of Innovation Districts: A New Geography of Innovation in America; Brookings Institution: New York, NY, USA, 2014. [Google Scholar]
- Yigitcanlar, T.; Sabatini-Marques, J.; da-Costa, E.; Kamruzzaman, M.; Ioppolo, G. Stimulating technological inno-vation through incentives: Perceptions of Australian and Brazilian firms. Technol. Forecast. Soc. Change 2019, 146, 403–412. [Google Scholar] [CrossRef]
- Forsyth, A. Alternative Forms of the High-Technology District: Corridors, Clumps, Cores, Campuses, Subdivisions, and Sites. Environ. Plan. C Gov. Policy 2014, 32, 809–823. [Google Scholar] [CrossRef] [Green Version]
- Zainal, Z. Case study as a research method. J. Kemanus. 2007, 9, 1–6. [Google Scholar]
- Rashid, Y.; Rashid, A.; Warraich, M.A.; Sabir, S.S.; Waseem, A. Case Study Method: A Step-by-Step Guide for Business Researchers. Int. J. Qual. Methods 2019, 18, 1–13. [Google Scholar] [CrossRef]
- Cacar, K.; Aykol, S. Case study as a research method in hospitality and tourism research: A systematic literature review (1974–2020). Cornell Hosp. Q. 2020, 62, 21–31. [Google Scholar] [CrossRef]
- DIIS. Stocktake of Australian Innovation Precincts; Australian Government: Canberra, Australia, 2019. [Google Scholar]
- Monash Technology Precinct. Available online: https://www.monashprecinct.com.au/about-us (accessed on 7 August 2022).
- Wardner, P.; Hefferan, M. Kelvin Grove Urban Village, Brisbane post implementation: Lessons for new urbanism. Australas. J. Reg. Stud. 2015, 21, 373–395. [Google Scholar]
- NSW-IPC. NSW Innovation Precincts: Lessons from International Experience; NSW Government: Sydney, Australia, 2018. [Google Scholar]
- Pancholi, S.; Yigitcanlar, T.; Guaralda, M. Public space design of knowledge and innovation spaces: Learnings from Kelvin Grove Urban Village, Brisbane. J. Open Innov. Technol. Mark. Complex. 2015, 1, 1–17. [Google Scholar] [CrossRef]
- Esmaeilpoorarabi, N.; Yigitcanlar, T.; Guaralda, M.; Kamruzzaman, M. Does place quality matter for innovation districts? Determining the essential place characteristics from Brisbane’s knowledge precincts. Land Use Policy 2018, 79, 734–747. [Google Scholar] [CrossRef]
- Business South Bank. Precinct. 2017. Available online: https://businesssouthbank.com.au/precinct (accessed on 7 August 2022).
- BCC. Global Precincts. 2019. Available online: https://www.brisbane.qld.gov.au/about-council/governance-and-strategy/business-in-brisbane/growing-brisbanes-economy/opportunity-brisbane/opportunity-global-precincts (accessed on 7 August 2022).
- Advance Queensland. Advancing Regional Innovation Program. 2021. Available online: https://advance.qld.gov.au/entrepreneurs-and-startups-industry-investors-small-business-universities-and-researchers/advancing-regional-innovation-program (accessed on 7 August 2022).
- BCC. Opportunity: Kelvin Grove-Herston. 2020. Available online: https://www.brisbane.qld.gov.au/about-council/governance-and-strategy/business-in-brisbane/growing-brisbanes-economy/opportunity-brisbane/opportunity-inner-city/kelvin-grove-herston (accessed on 7 August 2022).
- ABS. Australian Bureau of Statistics Data by Region. 2016. Available online: https://dbr.abs.gov.au/region.html?lyr=sa2&rgn=305031126 (accessed on 7 August 2022).
- Macquarie Park Innovation District. Available online: https://www.connectmpid.com.au/about-us (accessed on 7 August 2022).
- BCC. Brisbane’s Key Economic Facts. 2022. Available online: https://www.brisbane.qld.gov.au/about-council/governance-and-strategy/business-in-brisbane/growing-brisbanes-economy/brisbanes-key-economic-facts (accessed on 7 August 2022).
- Baum, S.; Yigitcanlar, T.; Horton, S.; Velibeyoglu, K.; Gleeson, B. The Role of Community and Lifestyle in the Making of a Knowledge City; Griffith University: Brisbane, Australia, 2007. [Google Scholar]
- Yang, T.; Wang, N. The Cultivation of Cluster’s Sustainable Competence Based on Knowledge Management. Int. J. Bus. Manag. 2008, 3, p83. [Google Scholar] [CrossRef]
- Cravo, T.A.; Piza, C. The impact of business-support services on firm performance: A meta-analysis. Small Bus. Econ. 2019, 53, 753–770. [Google Scholar] [CrossRef]
- Durmaz, B.; Platt, S.; Yigitcanlar, T. Creativity, culture tourism and place-making: Istanbul and London film in-dustries. Int. J. Cult. Tour. Hosp. Res. 2010, 4, 198–213. [Google Scholar] [CrossRef]
- Zheng, J. Creative industry clusters and the entrepreneurial city of Shanghai. Urban Stud. 2011, 48, 3561–3582. [Google Scholar] [CrossRef]
- Schmahmann, L. Industry clusters and knowledge spill-overs-a comparative study of creative industry clusters in Sydney. Plan. News 2019, 45, 10–12. [Google Scholar]
- Yigitcanlar, T.; Adu-McVie, R.; Erol, I. How can contemporary innovation districts be classified? A systematic review of the literature. Land Use Policy 2020, 95, 104595. [Google Scholar] [CrossRef]
- Watson, C. Difference between the Mean & the Average. 2020. Available online: https://sciencing.com/difference-between-mean-average-6461324.html (accessed on 31 August 2022).
- Esmaeilpoorarabi, N.; Yigitcanlar, T.; Guaralda, M. Towards an urban quality framework: Determining critical measures for different geographical scales to attract and retain talent in cities. Int. J. Knowledge-Based Dev. 2016, 7, 290. [Google Scholar] [CrossRef] [Green Version]
- Yun, J.J.; Zhao, X.; Yigitcanlar, T.; Lee, D.; Ahn, H. Architectural Design and Open Innovation Symbiosis: Insights from Research Campuses, Manufacturing Systems, and Innovation Districts. Sustainability 2018, 10, 4495. [Google Scholar] [CrossRef]
- NSW Health. Healthy Built Environments. 2021. Available online: https://www.health.nsw.gov.au/urbanhealth/pages/default.aspx (accessed on 7 August 2022).
- Victoria Walks. Urban Design for Walking. 2021. Available online: https://www.victoriawalks.org.au/urban_design (accessed on 7 August 2022).
- Gehrels, H.; Meulen, S.; Schasfoort, F.; Bosch, P.; Brolsma, R.; Dinther, D.; Geerling, G.; Goossen, M.; Jacobs, C.; Jong, M.; et al. Designing Green and Blue Infrastructure to Support Healthy Urban Living. Utrecht. 2016. Available online: https://www.adaptivecircularcities.com/designing-green-and-blue-infrastructure-to-support-healthy-urban-living (accessed on 7 August 2022).
- Taylor, B.T.; Fernando, P.; Bauman, A.E.; Williamson, A.; Craig, J.; Redman, S. Measuring the Quality of Public Open Space Using Google Earth. Am. J. Prev. Med. 2011, 40, 105–112. [Google Scholar] [CrossRef]
- Morais, P.; Camanho, A. Evaluation of performance of European cities with the aim to promote quality of life improvements. Omega 2011, 39, 398–409. [Google Scholar] [CrossRef]
- Audretsch, B.D.; Belitski, M. The limits to open innovation and its impact on innovation performance. Technovation 2022, 102519. [Google Scholar] [CrossRef]
- Baehre, S.; O’Dwyer, M.; O’Malley, L.; Story, V.M. Customer mindset metrics: A systematic evaluation of the net promoter score (NPS) vs. alternative calculation methods. J. Bus. Res. 2022, 149, 353–362. [Google Scholar] [CrossRef]
- Zuo, J.; Xia, B.; Chen, Q.; Pullen, S.; Skimore, M. Green building rating for office building-lessons learnt. J. Green Build. 2016, 11, 131–146. [Google Scholar] [CrossRef]
- Green Building Council Australia. Green Star Rating System. 2021. Available online: https://new.gbca.org.au/green-star/rating-system (accessed on 7 August 2022).
- Reichheld, F.F. The one number you need to grow. Harv. Bus. Rev. 2003, 81, 46–54. [Google Scholar] [PubMed]
- Rocks, B. Interval estimation for the “Net Promoter Score”. Am. Stat. 2016, 70, 365–372. [Google Scholar] [CrossRef]
- Retently. What Is a Good Net Promoter Score? 2022. Available online: https://www.retently.com/blog/good-net-promoter-score/ (accessed on 14 August 2022).
- Tariq, M.A.U.R.; Faumatu, A.; Hussein, M.; Shahid, M.L.U.R.; Muttil, N. Smart City-Ranking of Major Australian Cities to Achieve a Smarter Future. Sustainability 2020, 12, 2797. [Google Scholar] [CrossRef] [Green Version]
- JLL. Australia’s Got Talent: JLL Ranks World’s Most Innovative Cities. 2019. Available online: https://www.jll.com.au/en/newsroom/australias-got-talent-jll-ranks-worlds-most-innovative-cities (accessed on 7 August 2022).
- Bateman, K. Cities and Urbanization. Which is the World’s Most Innovative Cities in 2022? World Economic Forum. 2022. Available online: https://www.weforum.org/agenda/2022/02/innovative-global-cities-talent-property (accessed on 7 August 2022).
- Pratchett, L.; Hu, R.; Walsh, M.; Tuli, S. The Knowledge City Index A Tale of 25 Cities in Australia. 2017. Available online: https://www.researchgate.net/publication/319472356_The_Knowledge_City_Index_A_tale_of_25_Cities_In_Australia_2017 (accessed on 7 August 2022).
- BCC. Benchmarking Brisbane a Snapshot of Our Global Performance. 2018. Available online: https://www.brisbane.qld.gov.au/about-council/governance-and-strategy/business-inbris-bane/growing-brisbanes-economy/opportunity-brisbane/how-brisbane-compares (accessed on 7 August 2022).


| Dimension | Indicator | Description | Measure |
|---|---|---|---|
| Context | Spatial system | City-wide spatial layout and architecture qualities including physical environment | Strong |
| Moderate | |||
| Weak | |||
| Societal system | Societal progress of the city including diversity and age structure | Strong | |
| Moderate | |||
| Weak | |||
| Governance system | Political progress of the city including political institution effectiveness, transparency, and accountability | Strong | |
| Moderate | |||
| Weak | |||
| Economic system | Macroeconomic progress of the city including monetary and fiscal performance | Strong | |
| Moderate | |||
| Weak | |||
| Feature | Social amenity | Presence/availability of social amenities for public use within the innovation district | Strong |
| Moderate | |||
| Weak | |||
| Human capital | Inventory of skilled people | Strong | |
| Moderate | |||
| Weak | |||
| Skilled labor | Skilled employment outcome of the innovation districts activities | Strong | |
| Weak | |||
| Moderate | |||
| Locality setting | Location of the district within the metropolitan area | Inner city | |
| Suburban | |||
| Regional | |||
| Function | Company size | Relative size of the firms within the innovation district | Multinational enterprises (MNE) anchored |
| Large national enterprises (LNE) dominated | |||
| Small and medium enterprises (SME) dominated | |||
| Industry type | Dominant business activity operating within the innovation district | Creativity-intensive businesses | |
| Technology-intensive businesses | |||
| Business support services | |||
| Investment type | Principle support and funding body for the development of the innovation district | Public–private–community partnership | |
| Public–private partnership | |||
| Public or private sector driven | |||
| Property management | Management model of the innovation districts’ properties and activities | District-wide body corporate | |
| Building-based body corporate | |||
| None | |||
| Form | Green–blue infrastructure | Aesthetic qualities of urban green and blue | Strong |
| Moderate | |||
| Weak | |||
| Land-use mix | Main land use types within the innovation district | Complex mix | |
| Mixed-use | |||
| Single use | |||
| Built environment | Architectural design of built forms and functions encouraging open innovation systems, connectivity, and mobility within the innovation district | Strong | |
| Moderate | |||
| Weak | |||
| Space design | Spatial layout design encouraging open innovation system within the innovation district | Open layout | |
| Semi-open layout | |||
| Closed layout |
| Dimension | Indicator | Description | Parameter | Measure | MPID (Sydney) | MTP (Melbourne) | KGUV (Brisbane) |
|---|---|---|---|---|---|---|---|
| Feature | Social amenity | Presence or availability of social amenities for public use | Strong presence of social amenities Moderate presence of social amenities Weak presence of social amenities | Mean composite score Strong > 50, Moderate > 40, Weak < 40 | Moderate | Moderate | Moderate |
| Human capital | Inventory of skilled people (i.e., information about education and skilled level of the population and potential stock of qualified people) | Strong human capital Moderate human capital Weak human capital | Percentage of knowledge workers with BA or higher qualification Strong > 50%, Moderate > 25%, Weak < 25% | Strong | Strong | Strong | |
| Skilled labor | Skilled employment outcome of the innovation district activities | Strong skilled employment Moderate skilled employment Weak skilled employment | Ratio of knowledge worker jobs to total innovation district jobs Strong > 50%, Moderate > 25%, Weak < 25% | Strong | Strong | Strong | |
| Locality setting | Location of the district metropolitan area | Inner city Suburban Regional | Location of the innovation district Inner city, Suburban, Regional | Suburban | Suburban | Inner city | |
| Function | Company size | Relative size of the firms within the innovation district | MNE anchored LNE dominated SME dominated | Ratio of number of firm types to total firms within the innovation district MNE anchored if > 50%, LNE dominated > 50%, SME dominated if > 50% | MNE | LNE | SME |
| Industry type | Dominant business activity operating within the innovation district | Technology-intensive business Creativity-intensive business Business support services | Dominant business activity of the district Technology-intensive if > 50%, Creativity-intensive if > 50%, Business support services if > 50% | Technology-intensive business | Technology-intensive business | Business support services | |
| Investment type | Principle support and funding body for the development of the innovation district | Public–private–community partnership Public–private partnership Public or private sector | Multiple sectors Two sectors Single sector | Multiple sector | Multiple sector | Multiple sector | |
| Property management | Management model of the innovation district’s properties and activities | Managed by a district management Managed by a building management No form of management | District wide Building level None | District wide | District wide | District wide | |
| Form | Urban green and blue infrastructure | Aesthetic qualities of urban green and blue infrastructure within/out the innovation district (i.e., all natural and semi-natural landscape elements that form a green–blue network | Strong presence of ecosystem services Moderate presence of ecosystem services Weak presence of ecosystem services | Based on design principles of green–blue infrastructure innovation district level (green infrastructure), city level (blue infrastructure)Strong > 50%, Moderate > 25%, Weak, 25% | Strong | Strong | Strong |
| Land-use mix | Main land-use types within the innovation districts | Complex mixed Mixed use Single use | Work–learn–live–play Work–learn, live or play Work or learn | Complex mixed | Complex mixed | Complex mixed | |
| Built environment | Architectural designs of built forms encouraging connectivity and mobility within the innovation districts | Strong internal connectivity Moderate internal connectivity Weak internal connectivity | Based on healthy built environment guidelines Composite scores Strong > 60, Moderate > 50, Weak < 50 | Strong | Strong | Strong | |
| Space design | Spatial layout design encouraging open innovation system within the innovation districts | Open layout Semi-open layout Closed layout | Based on three element cluster model to determine whether the spatial design encourages knowledge generation within the innovation district Open layout, semi-open layout, closed layout | Semi-open layout | Semi-open layout | Open layout | |
| Context | Spatial system | City-wide spatial layout and architectural qualities (i.e., physical environment, spatial conditions, and urban development) | Strong spatial design Moderate spatial design Weak spatial design | Composite index of quality of physical environment, unique natural environment, and physical patterns based on mean value Strong >1.8, Moderate <1.7, Weak < 1.7 | Strong | Strong | Strong |
| Societal system | Societal progress of the city (i.e., diversity, tolerance, equality, age structure, and participation in cultural/community activities) | Strong social assets Moderate social assets Weak social assets | Diversity and inclusiveness measured by composite scores based on Brookings’s audit guide Strong > 70, Moderate >66, Weak < 66 | Strong | Strong | Moderate | |
| Governance system | Political progress of the city (i.e., political institution effectiveness, accountability, transparency, and participation) | Strong governance effectivenessModerate governance effectiveness Weak governance effectiveness | Composite index of quality public services, civil services, quality of policy formulation and implementation, and credibility of the government’s commitment to such policies of the city Strong >0.75, Moderate <0.75, Weak < 0.7 | Strong | Strong | Strong | |
| Economy system | Macroeconomic progress of the city (i.e., monetary and fiscal performance to maintain stability of economic growth) | Strong economic performance Moderate economic performance Weak economic performance | Composite index of governance net debt, real GDP growth, inflation rate, and unemployment rate of the city based on composite median scores Strong<8.46, Moderate>8.46, Weak >9.22 | Strong | Strong | Moderate |
| Form | ||||
| A | B | C | ||
| Land-use mix | o1 | Complex mixed | Mixed use | Single use |
| Space design | o2 | Open | Semi-open | Closed |
| Built environment | o3 | Strong | Moderate | Weak |
| Urban green and blue infrastructure | o4 | Strong | Moderate | Weak |
| Feature | ||||
| A | B | C | ||
| Human capital | e1 | Strong | Moderate | Weak |
| Skilled labor | e2 | Strong | Moderate | Weak |
| Social amenity | e3 | Strong | Moderate | Weak |
| Locality setting | e4 | Inner city | Suburban | Regional |
| Function | ||||
| A | B | C | ||
| Investment type | u1 | Multiple sectors | Two sectors | Single sector |
| Industry type | u2 | Technology-intensive | Creativity-intensive | Business support |
| Company size | u3 | Multinational | Large national | Small and medium |
| Property management | u4 | District wide | Building level | None |
| Context | ||||
| A | B | C | ||
| Economic system | c1 | Strong | Moderate | Weak |
| Societal system | c2 | Strong | Moderate | Weak |
| Spatial system | c3 | Strong | Moderate | Weak |
| Governance system | c4 | Strong | Moderate | Weak |
| Dimension | Category | Indicator | MPID (Sydney) | MTP (Melbourne) | KGUV (Brisbane) |
|---|---|---|---|---|---|
| Form | Complexity and Layout | Land-use mix | A | A | A |
| Space design | B | B | A | ||
| Connectivity and Space Design | Built environment | A | A | A | |
| Urban green–blue infrastructure | A | A | A | ||
| Feature | Centrality and Amenity | Social amenity | B | B | B |
| Locality setting | B | B | A | ||
| Intelligence and Concentration | Human capital | A | A | A | |
| Skilled labor | A | A | A | ||
| Function | Specialization and Diversity | Investment type | A | A | A |
| Industry type | A | A | C | ||
| Scale and Support | Company size | A | B | C | |
| Property management | A | A | A | ||
| Context | Social and Economic | Economic system | A | A | B |
| Societal system | A | A | B | ||
| Spatial and Governance | Spatial system | A | A | A | |
| Governance system | A | A | A | ||
| Total number of categorical values | 16 | 16 | 16 | ||
| Percentage of ‘A’ dimensions | (n = 13, n = 12, n = 11) | 81% | 75% | 69% | |
| Percentage of ‘C’ dimensions | (n = 0, n = 0, n = 2) | 0 | 0 | 13% | |
| Net score | 81 | 75 | 56 |
| Type | Name | Context | Function | Form | Feature | Overall | District |
|---|---|---|---|---|---|---|---|
| Type 1 | Diverse, complex, and centrally located in a highly favorable context | Highly favorable | Diverse | Complex | Central | Desired | MPID MTP |
| Type 2 | Diverse, complex, and centrally located in a favorable context | Favorable | Diverse | Complex | Central | Acceptable | KGUV |
Publisher’s Note: MDPI stays neutral with regard to jurisdictional claims in published maps and institutional affiliations. |
© 2022 by the authors. Licensee MDPI, Basel, Switzerland. This article is an open access article distributed under the terms and conditions of the Creative Commons Attribution (CC BY) license (https://creativecommons.org/licenses/by/4.0/).
Share and Cite
Adu-McVie, R.; Yigitcanlar, T.; Xia, B.; Erol, I. Innovation District Typology Classification via Performance Framework: Insights from Sydney, Melbourne, and Brisbane. Buildings 2022, 12, 1398. https://doi.org/10.3390/buildings12091398
Adu-McVie R, Yigitcanlar T, Xia B, Erol I. Innovation District Typology Classification via Performance Framework: Insights from Sydney, Melbourne, and Brisbane. Buildings. 2022; 12(9):1398. https://doi.org/10.3390/buildings12091398
Chicago/Turabian StyleAdu-McVie, Rosemary, Tan Yigitcanlar, Bo Xia, and Isil Erol. 2022. "Innovation District Typology Classification via Performance Framework: Insights from Sydney, Melbourne, and Brisbane" Buildings 12, no. 9: 1398. https://doi.org/10.3390/buildings12091398