
Study on Dynamic Response Characteristics of Stepped Reinforced Retaining Wall

Abstract
:1. Introduction
2. Finite Element Model
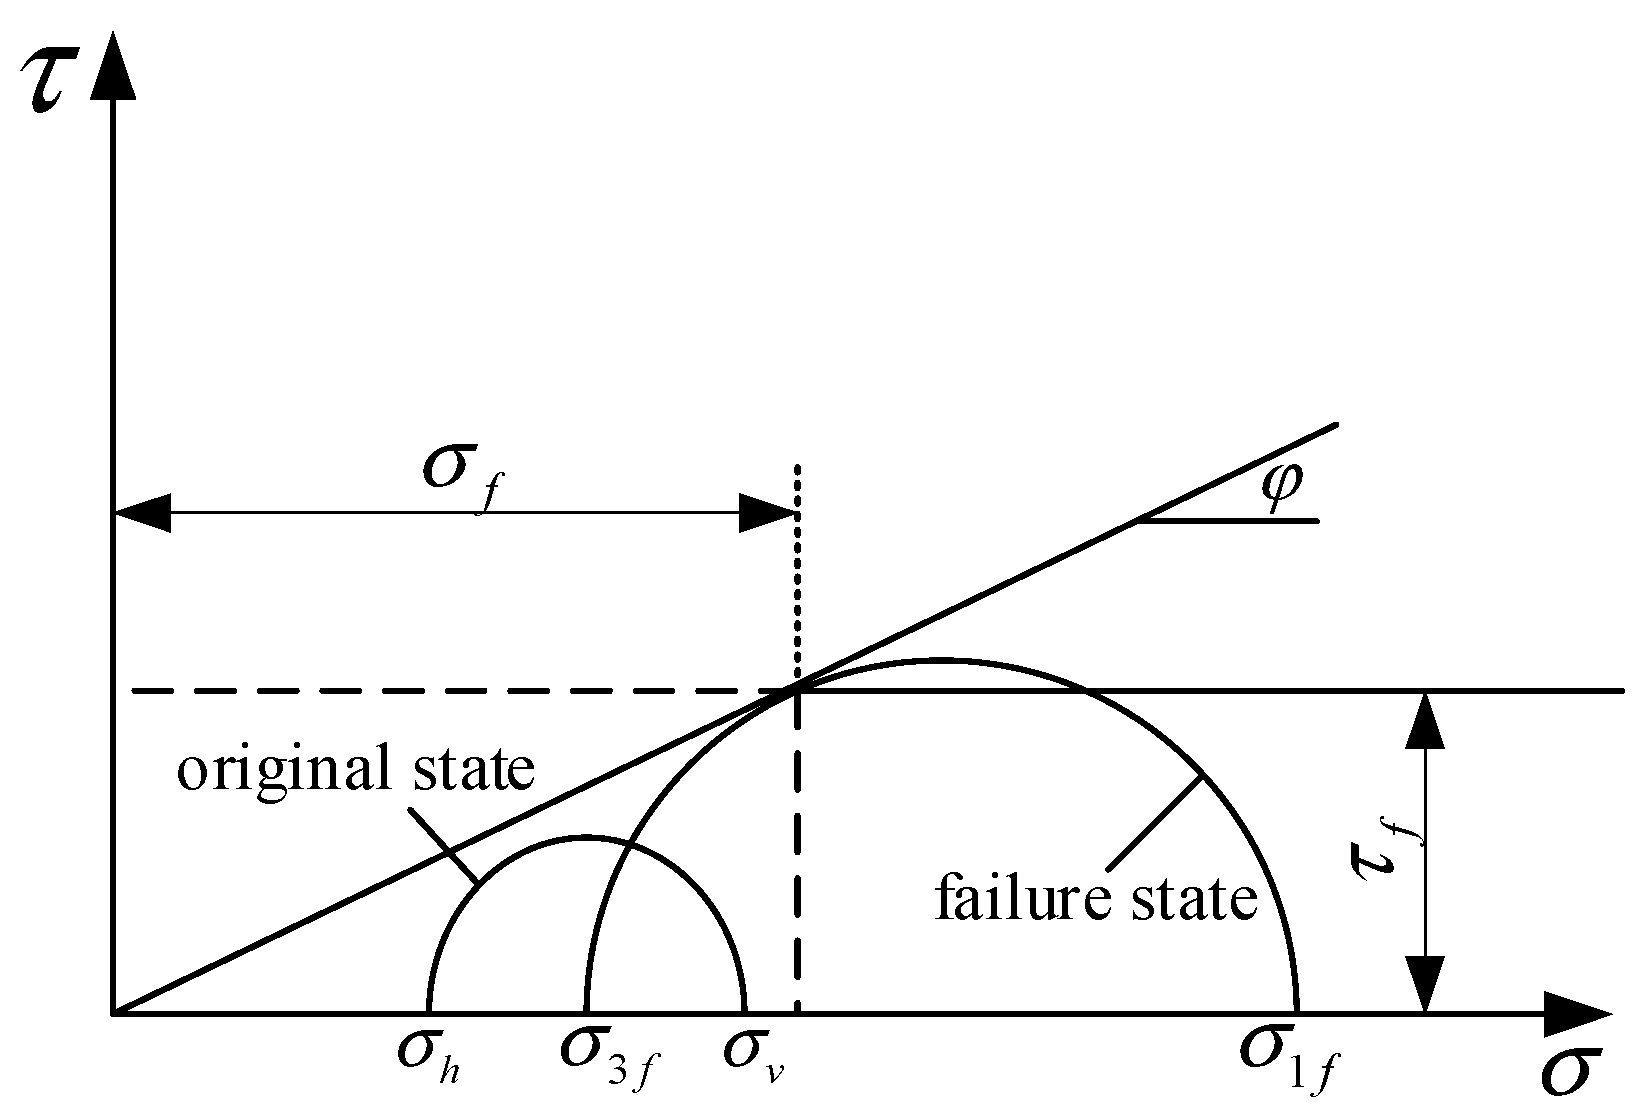
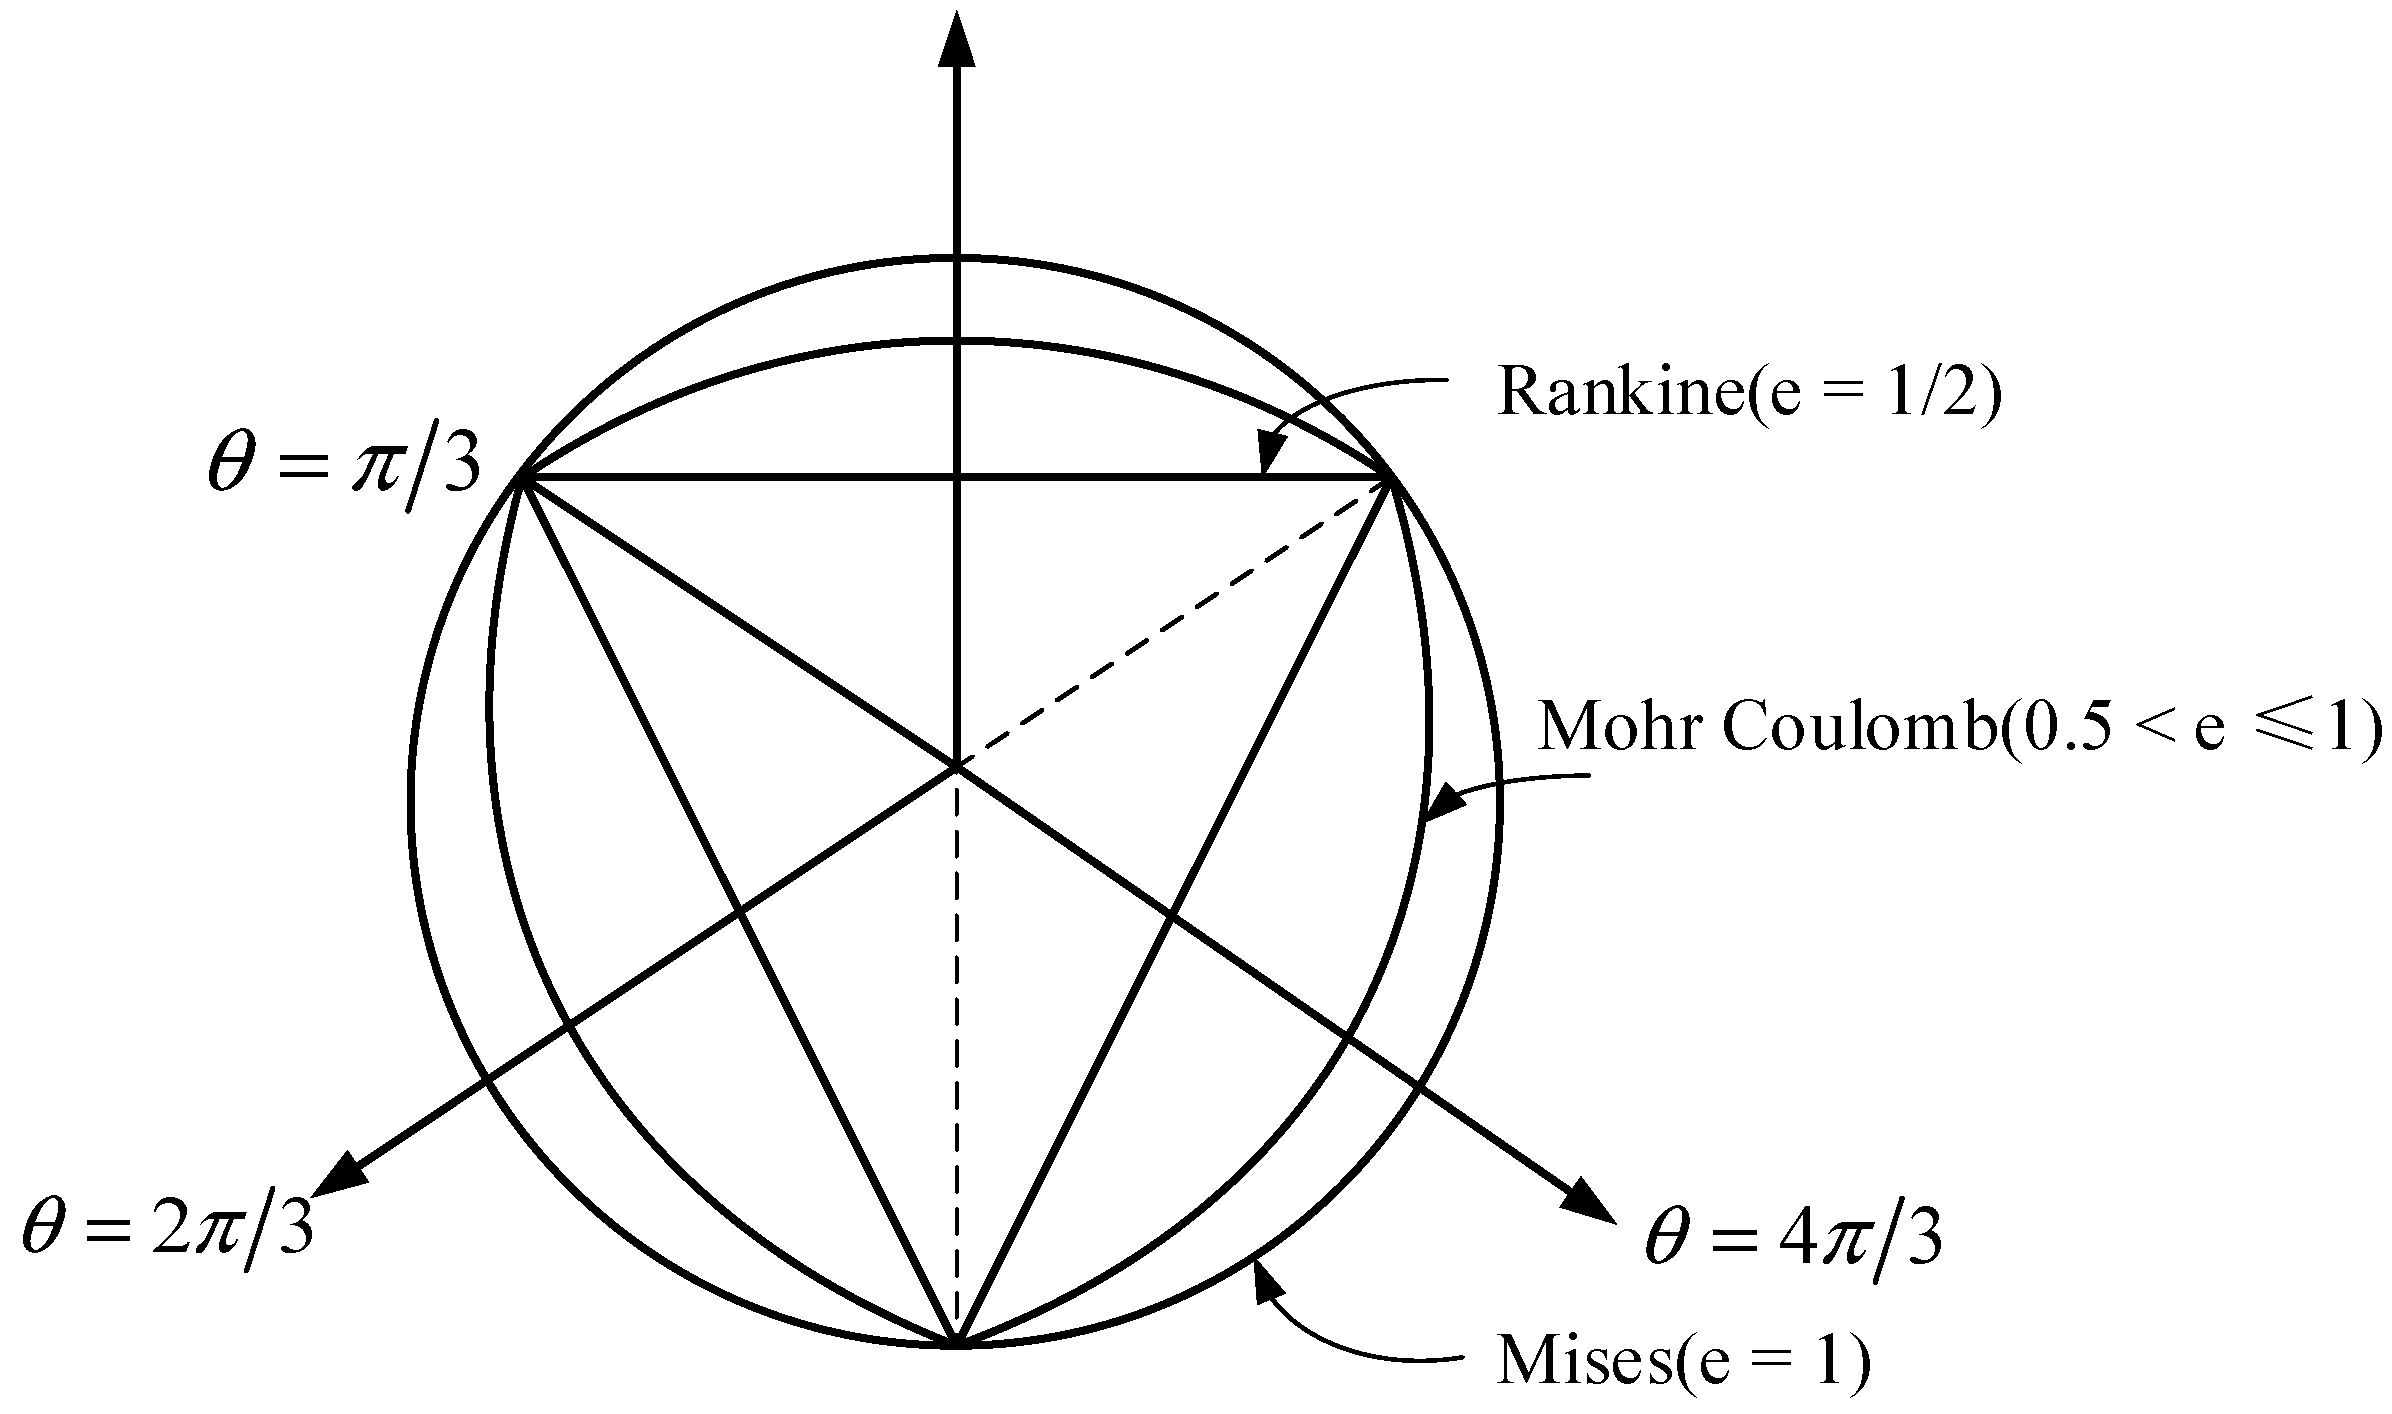
2.1. Constitutive Model Selection of Soil and Panel
- (1)
- The principal stress has no effect on the strength of soil.
- (2)
- The strength envelope of soil is a straight line, that is, the internal friction angle is constant and has nothing to do with the confining pressure.
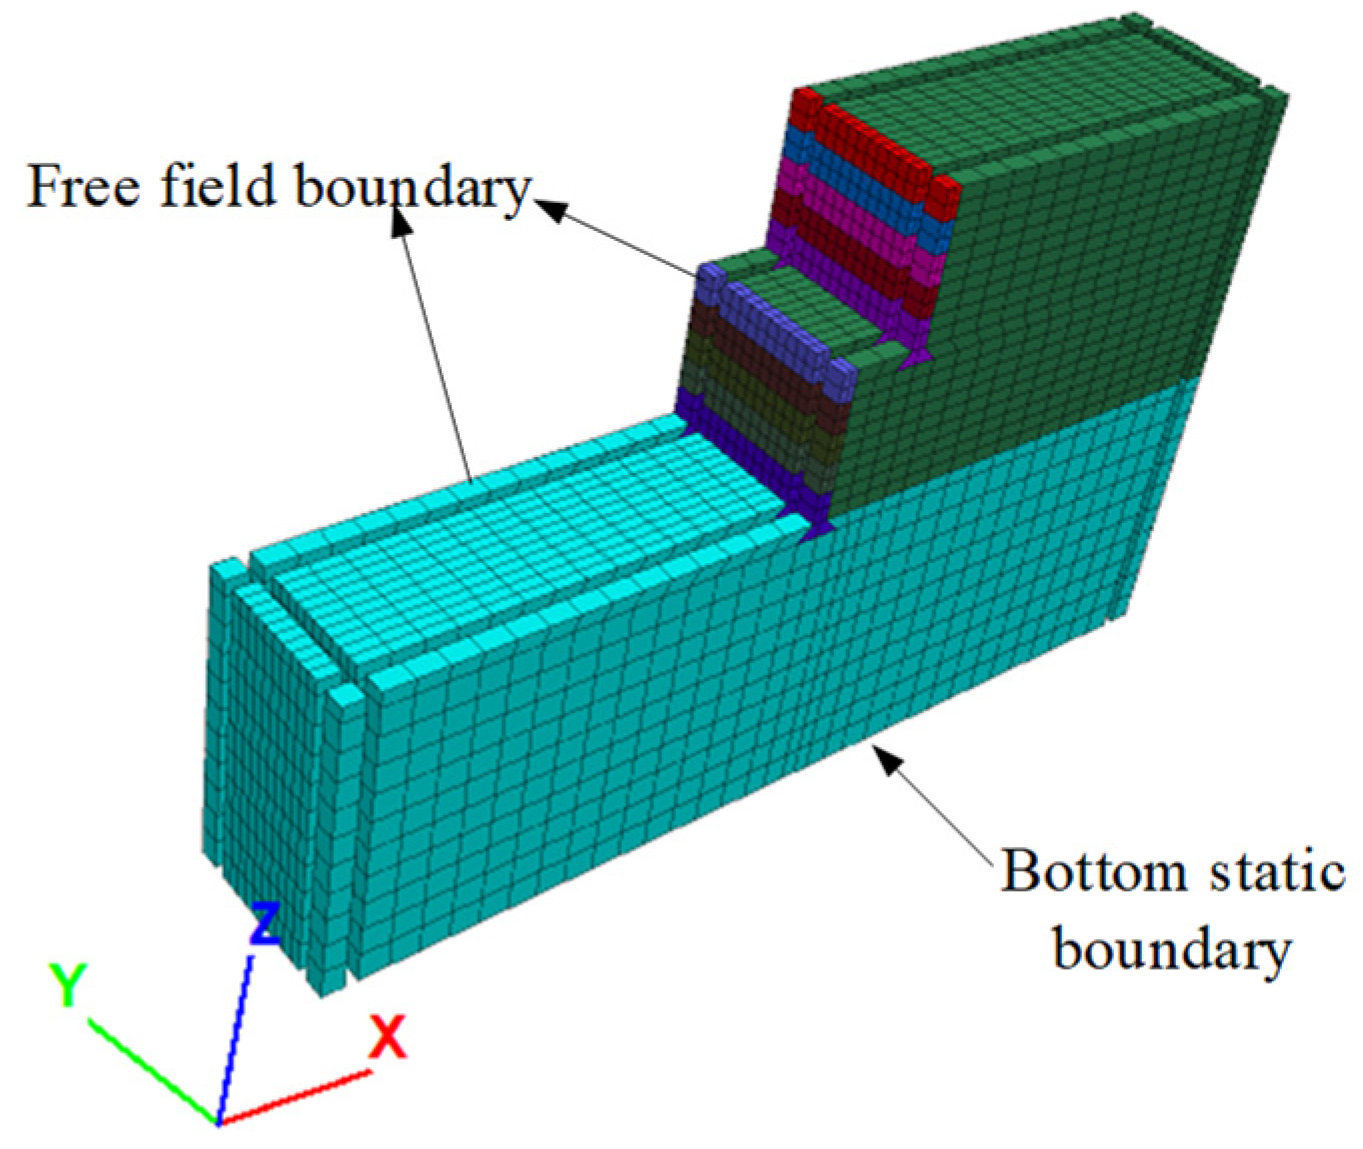
2.2. Modeling
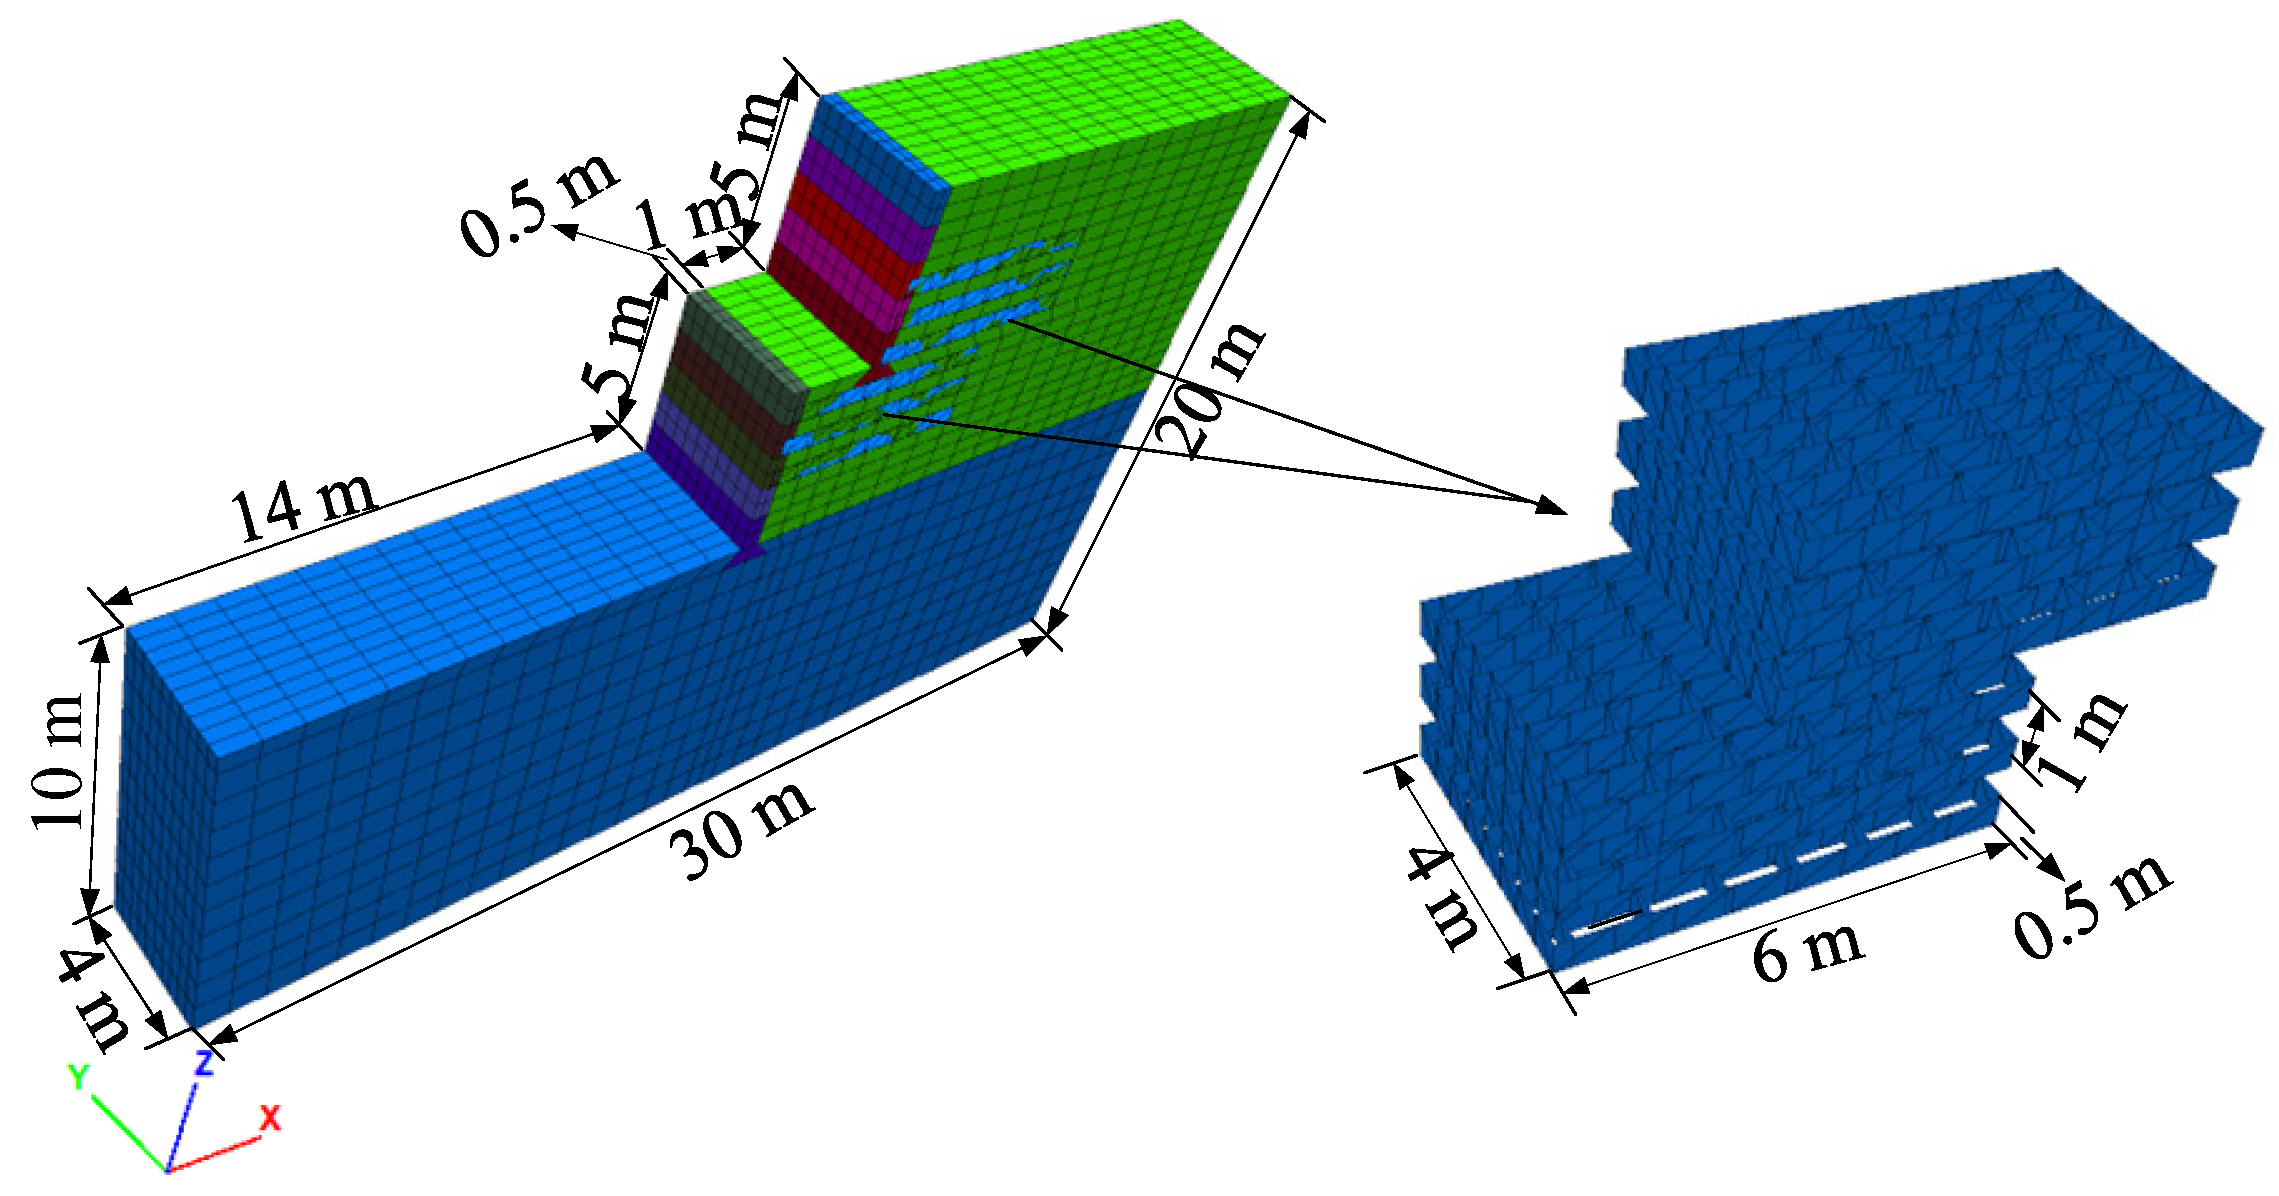
2.2.1. Geometric Model
2.2.2. Material Parameters
- (1)
- Soil and face plate
- (2)
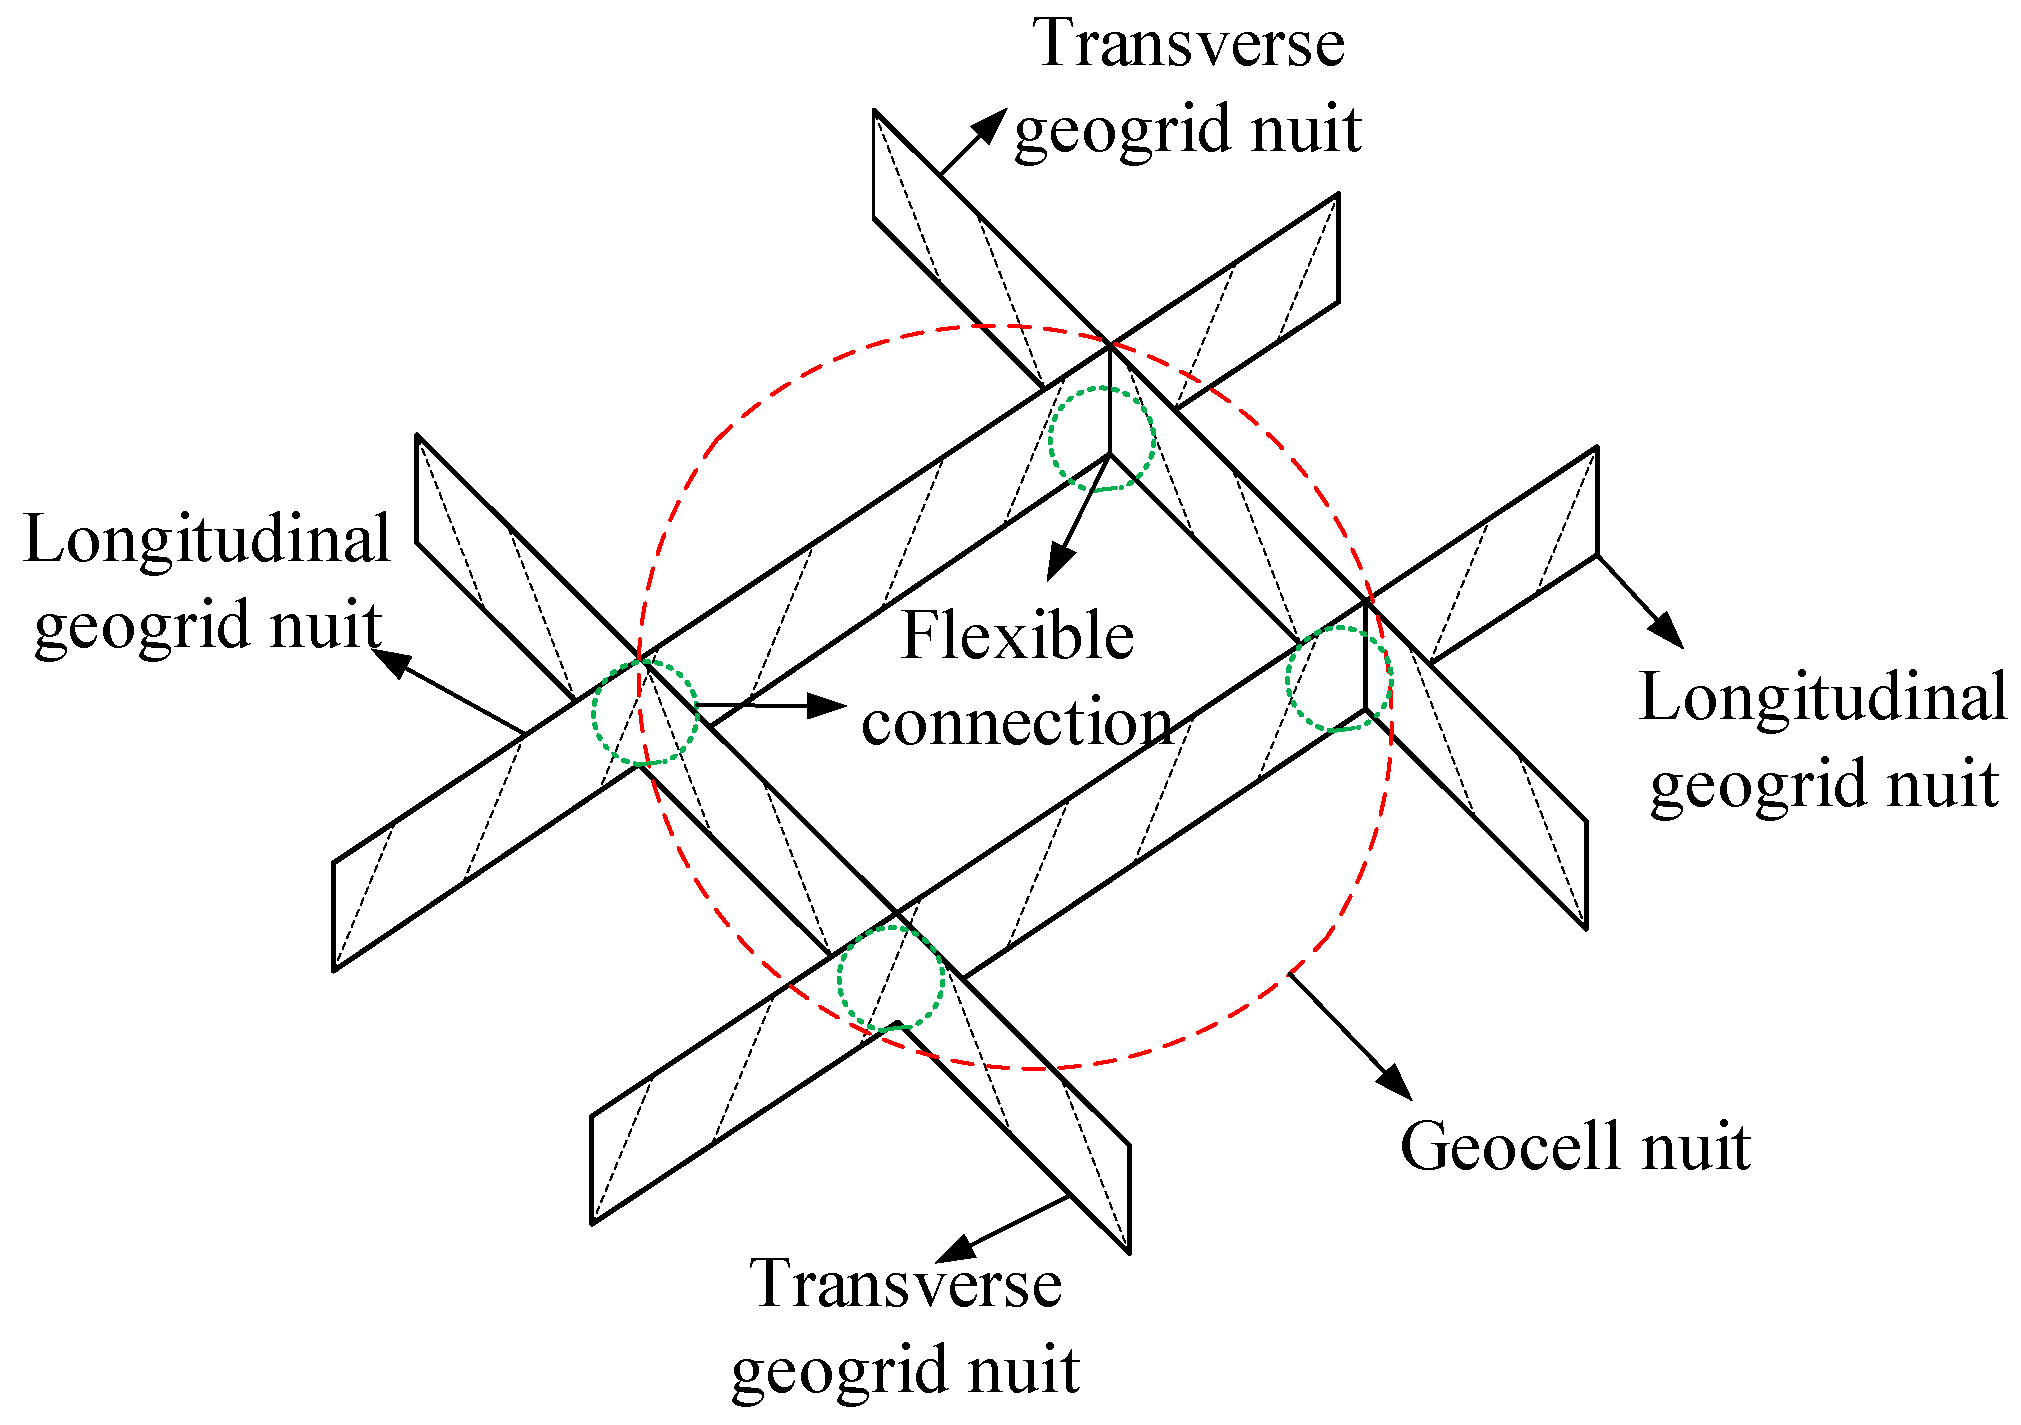
- Geocell
- (3)
- Contact surface
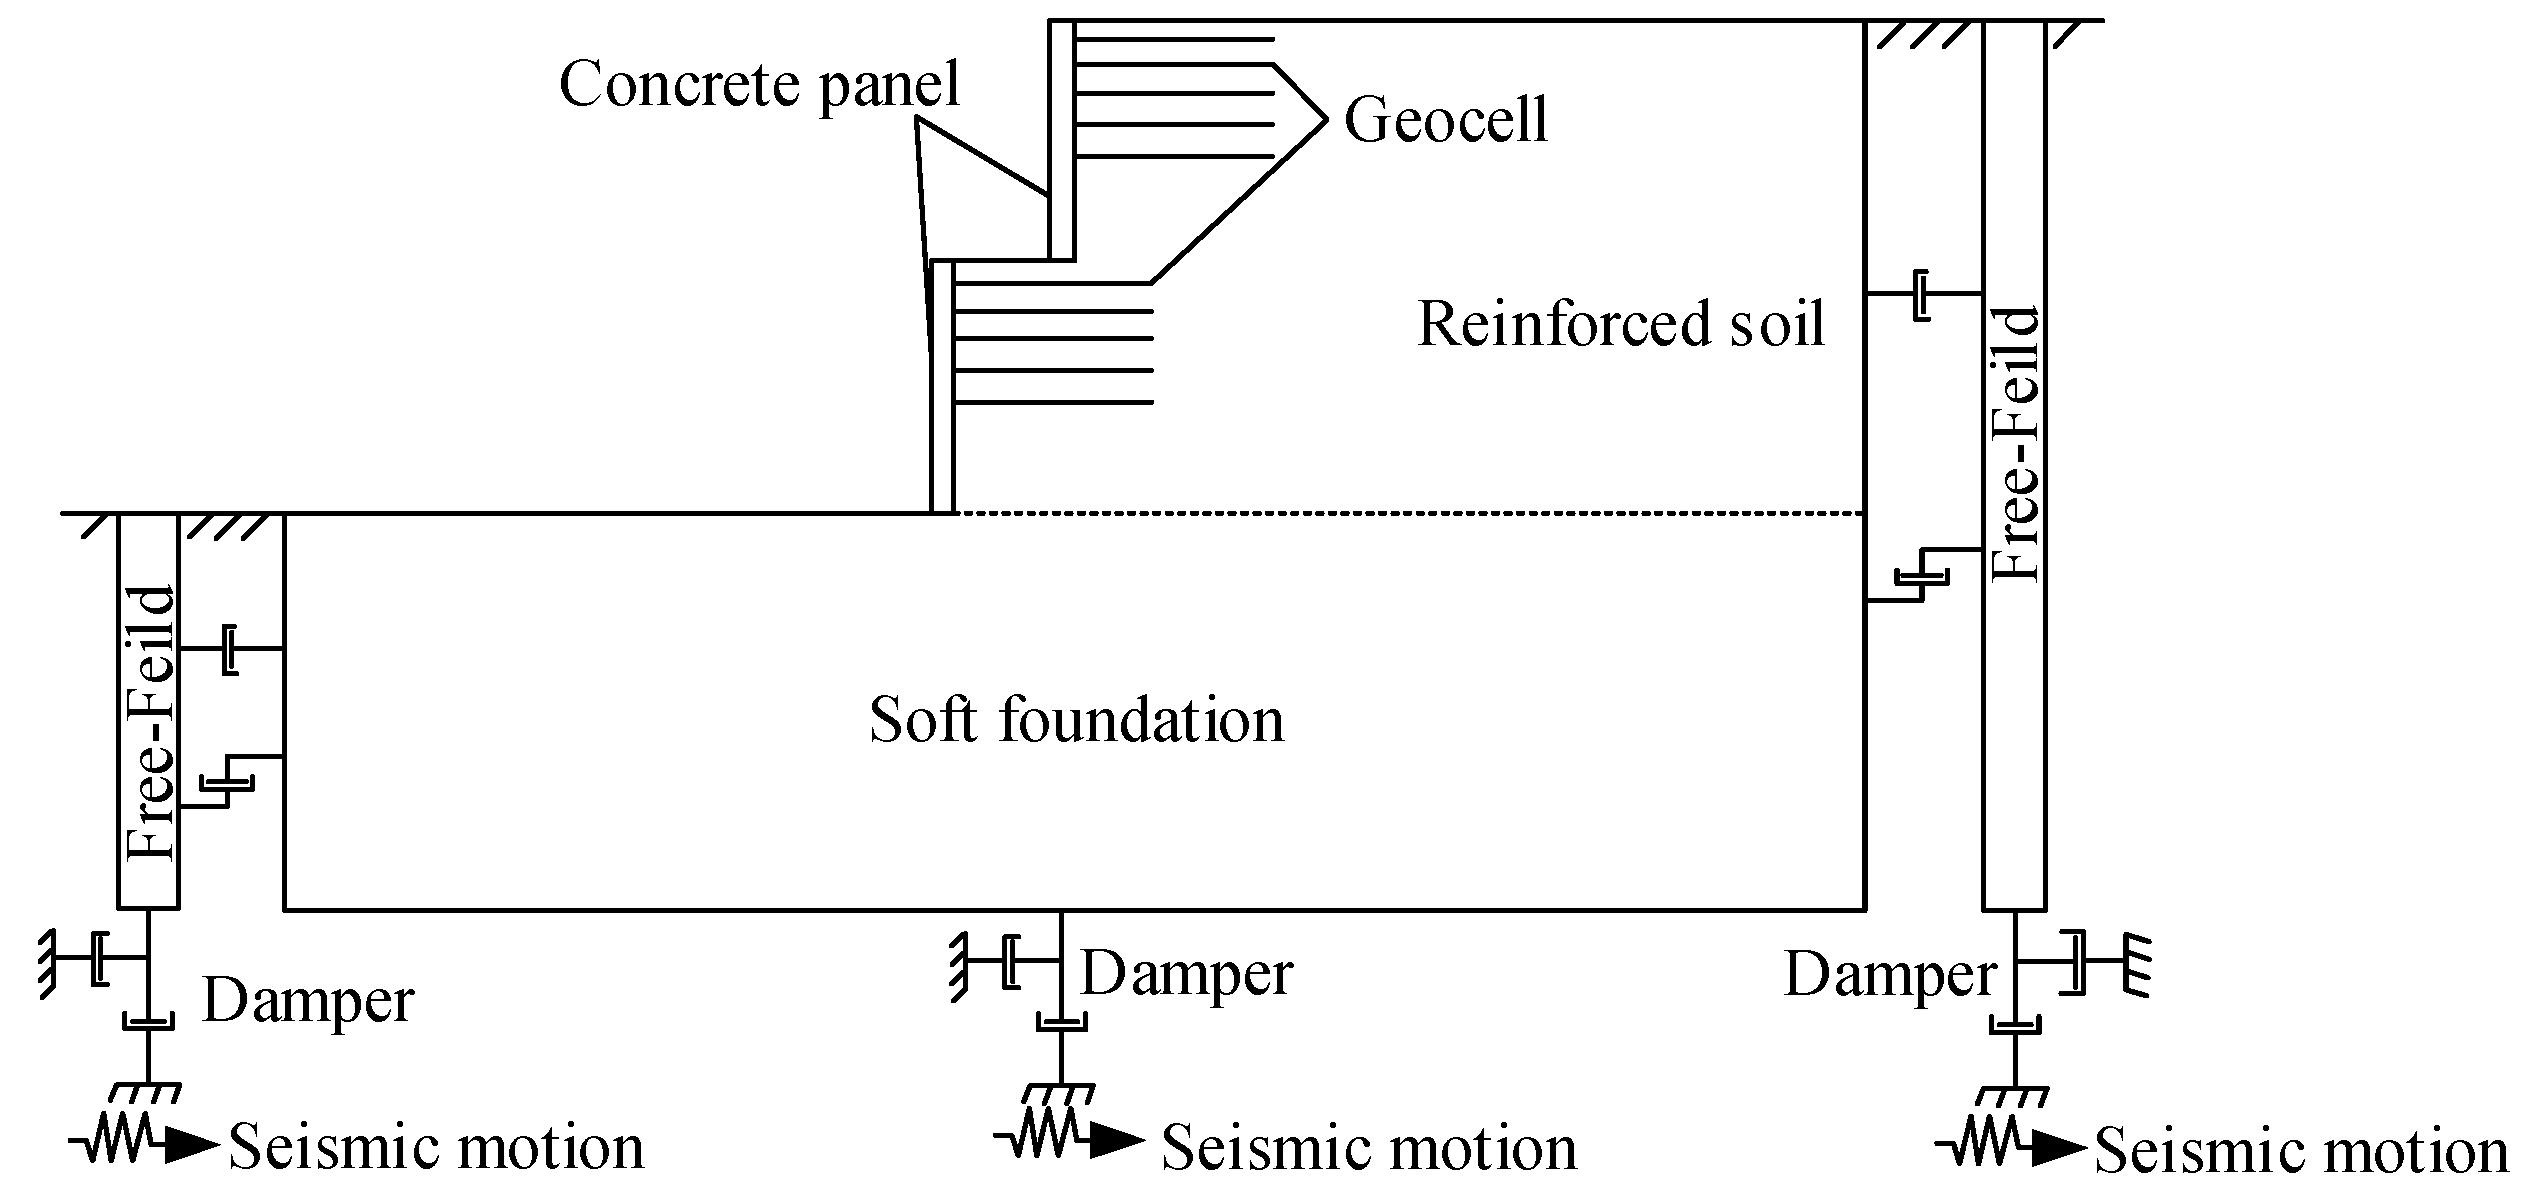
2.3. Load Input
2.3.1. Seismic Load
2.3.2. Boundary Condition
2.3.3. Damping
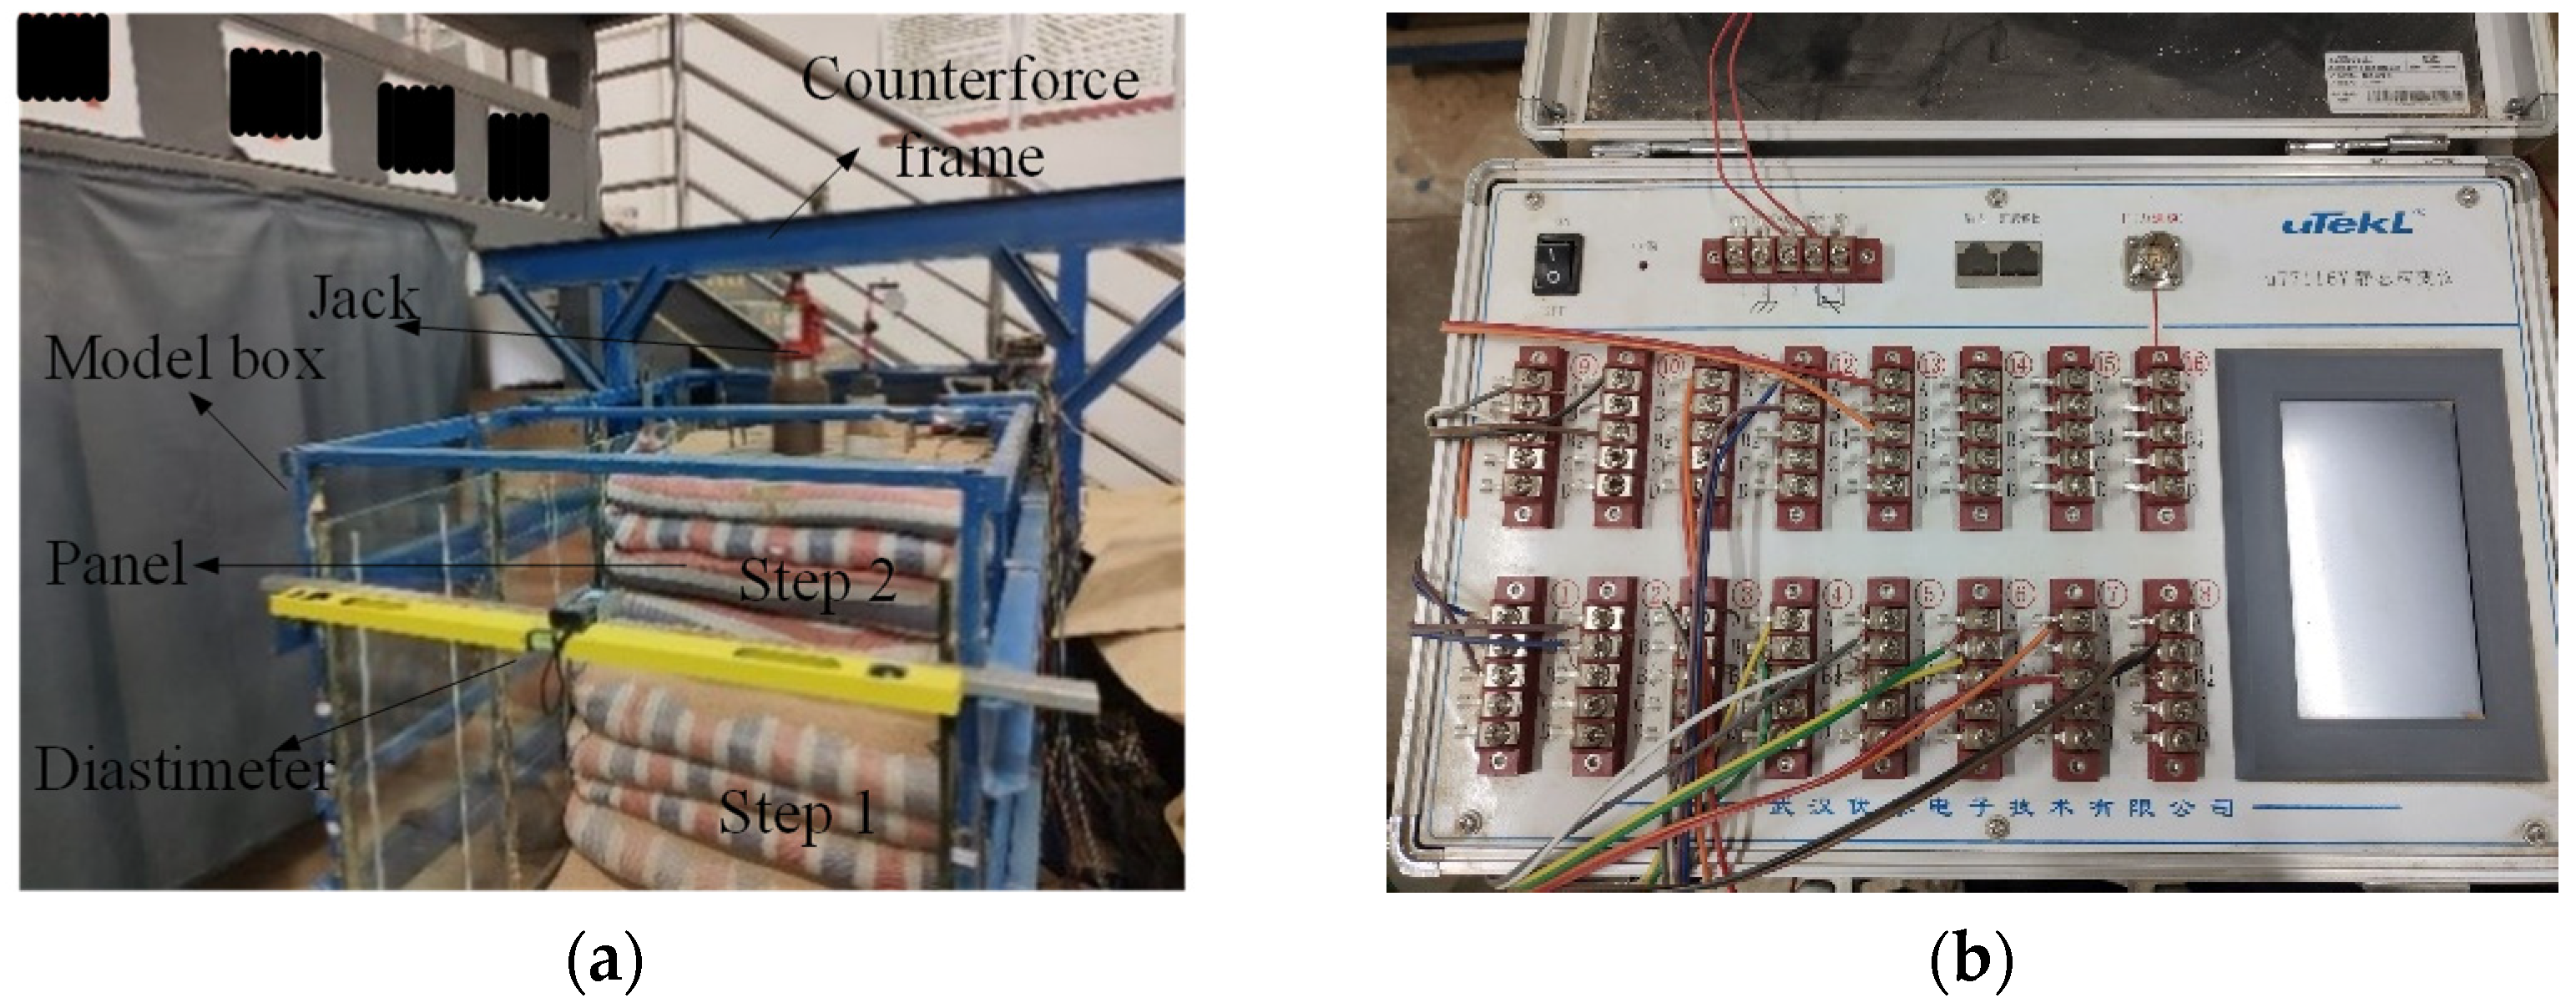
3. Test Principle and Case Demonstration
3.1. Test Principle
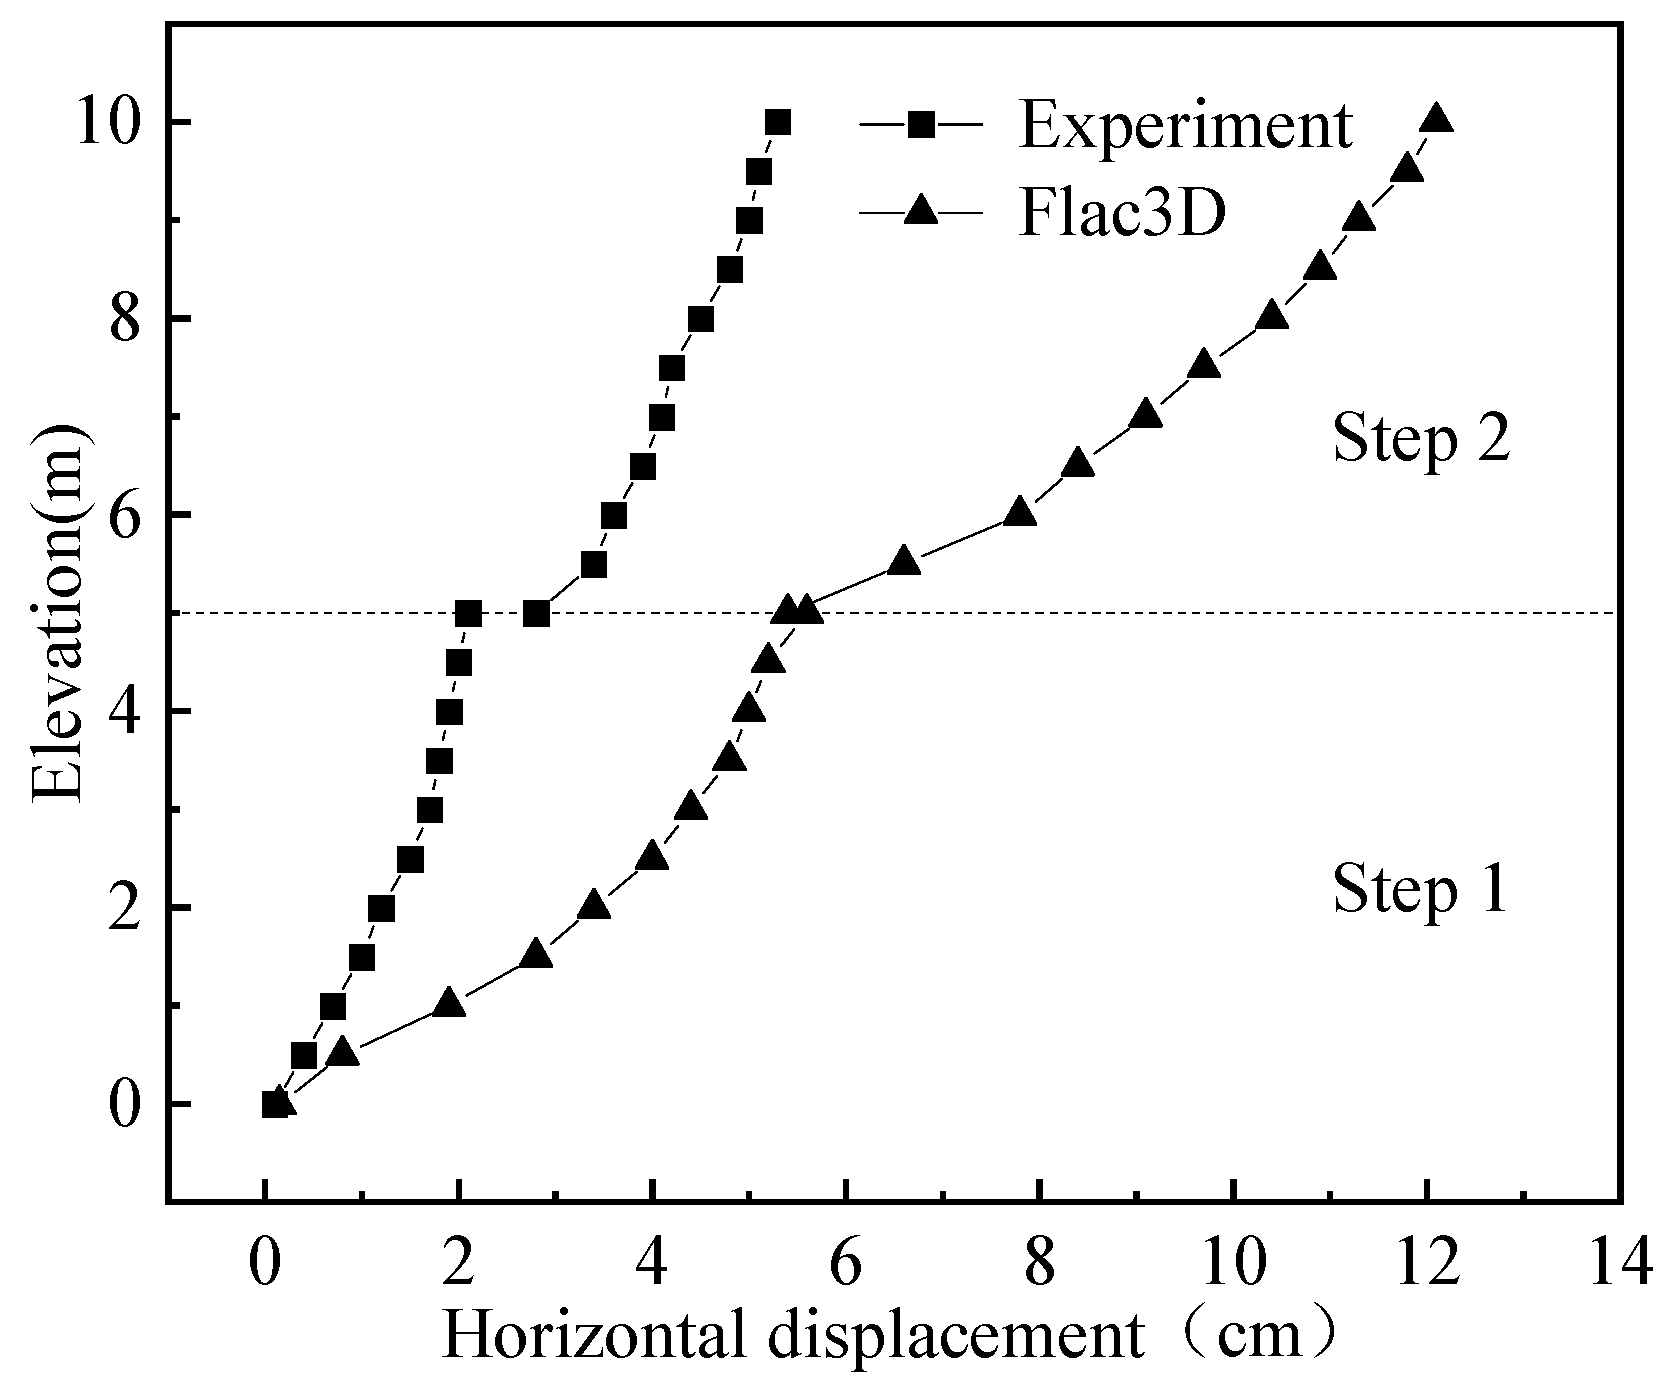
3.2. Model Verification
4. Results and Discussion
4.1. Effect of on Reinforcement Effect of Retaining Wall
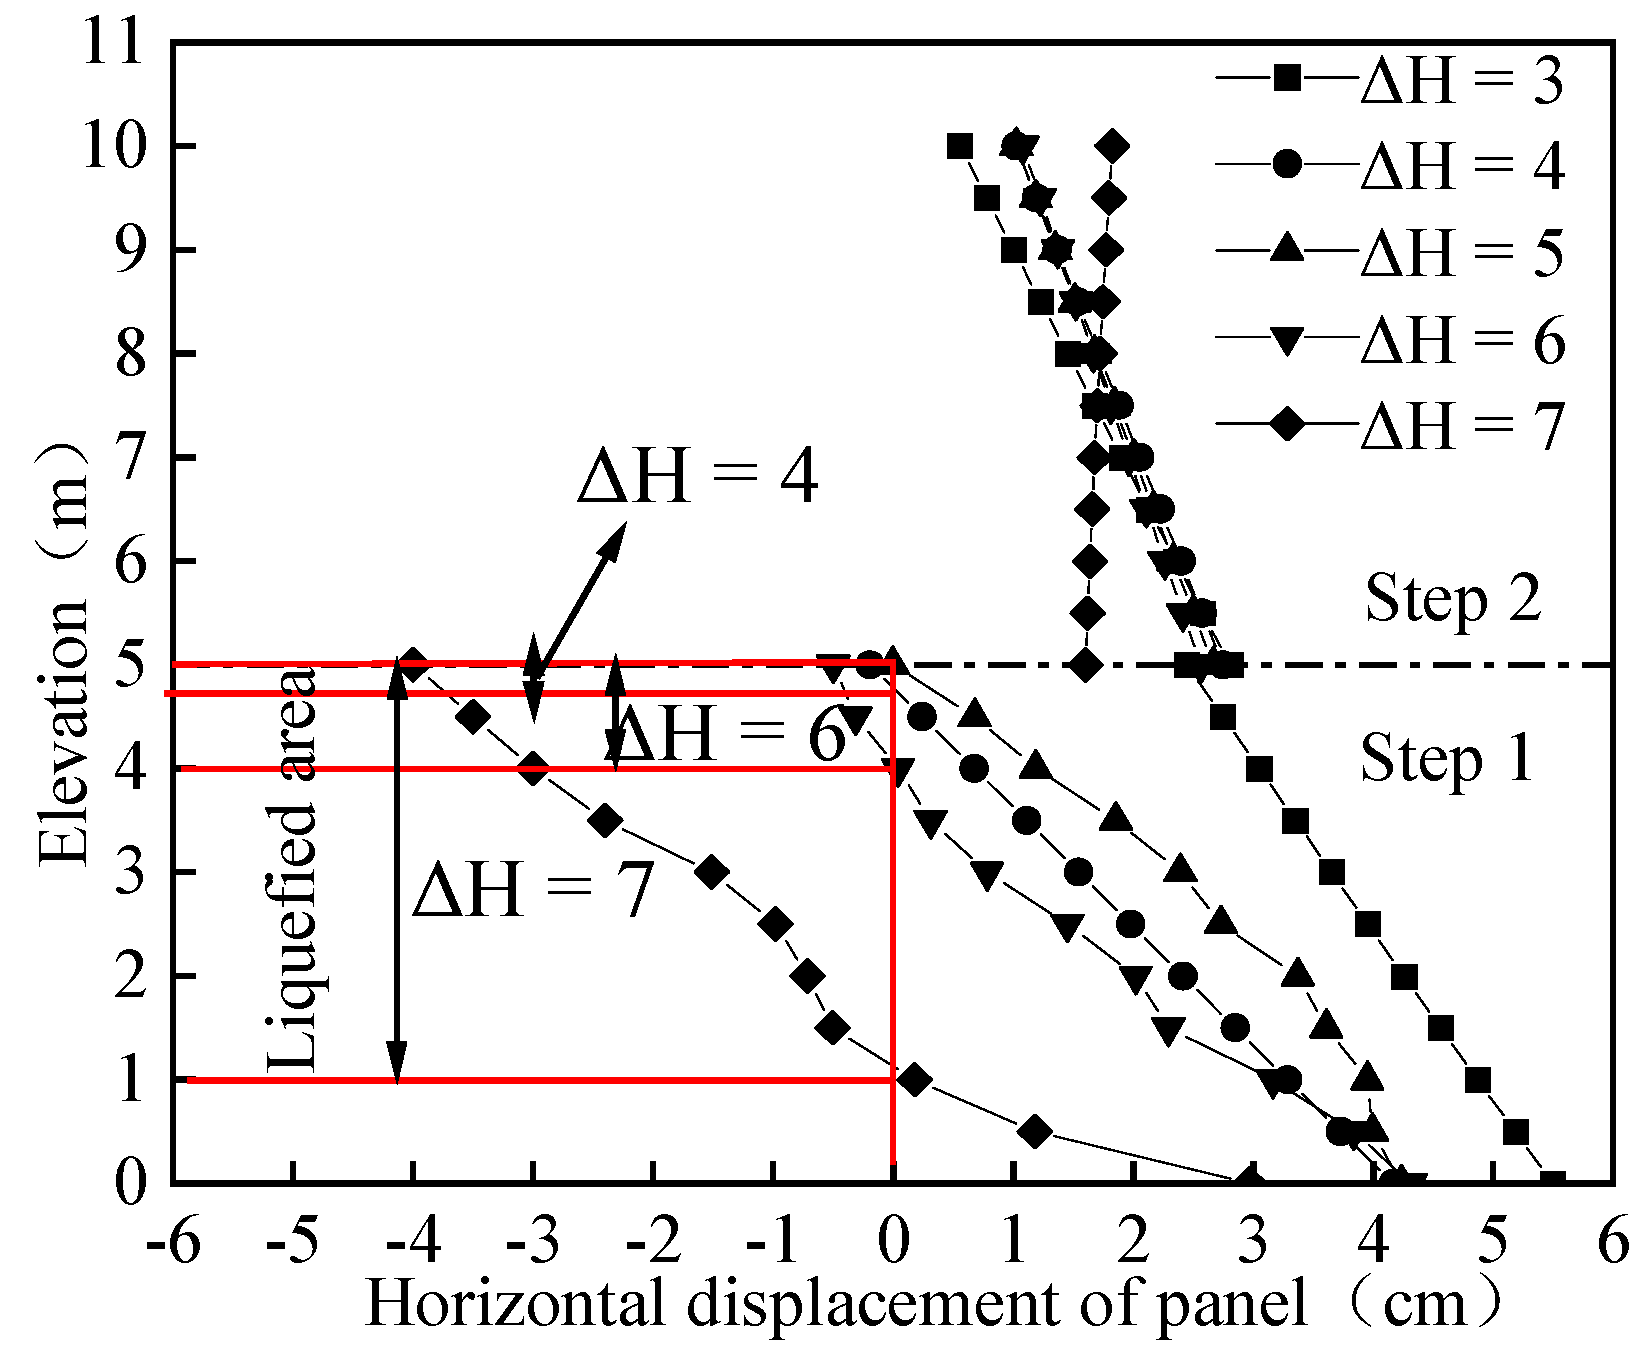
4.1.1. Horizontal Displacement of Panel
4.1.2. Wall Top Displacement Time History
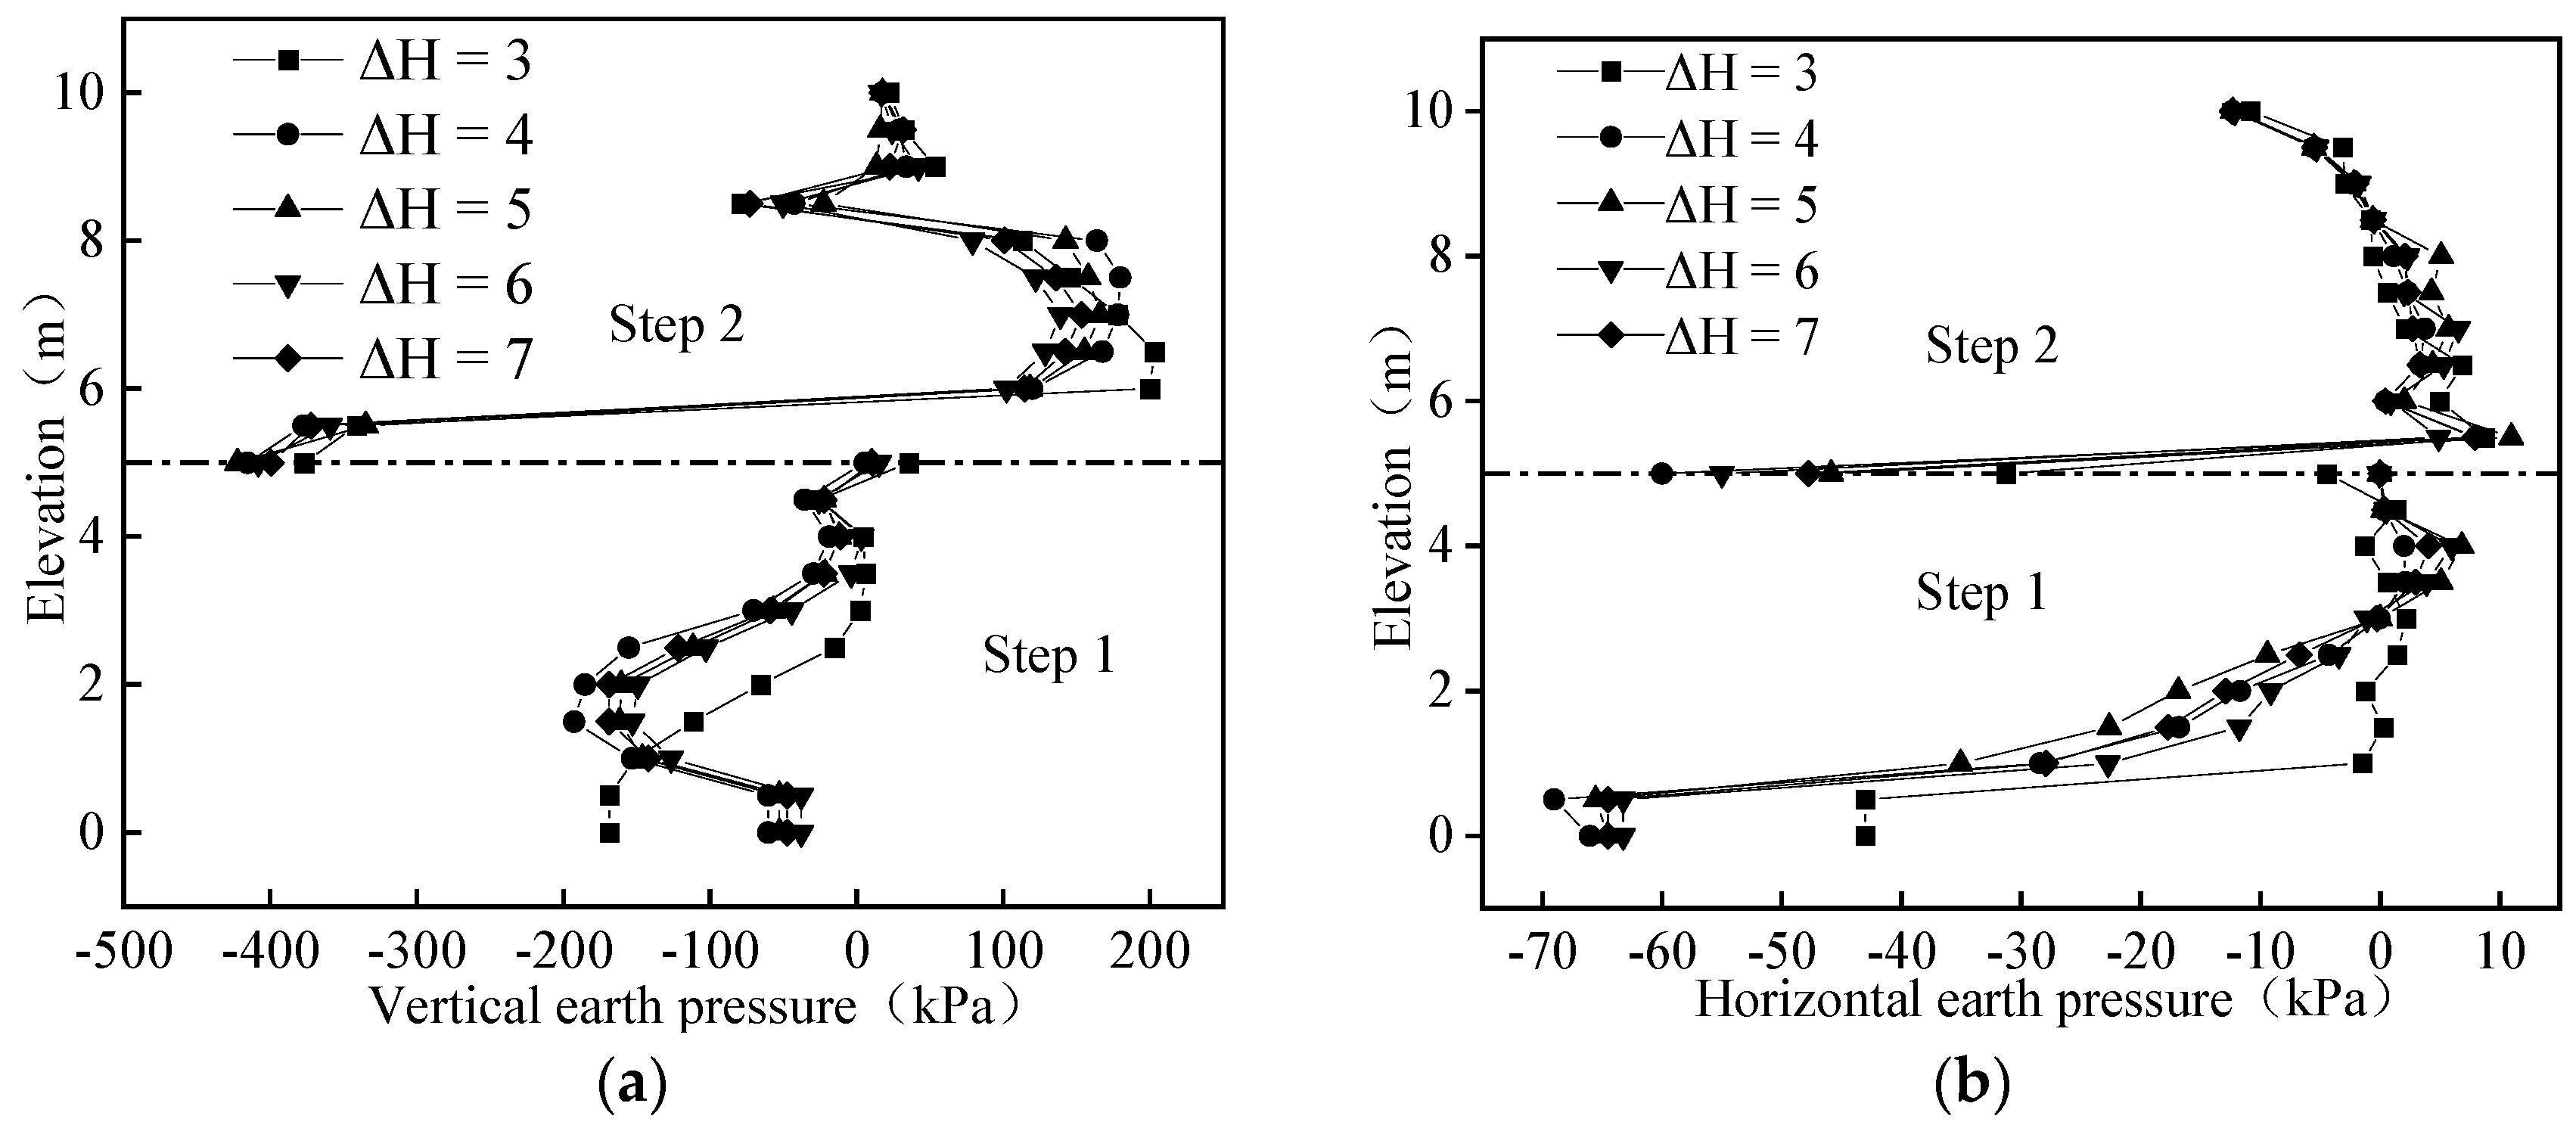
4.1.3. Earth Pressure Distribution
4.1.4. Slip Plane
4.2. Influence of on Reinforcement Effect of Retaining Wall
4.2.1. Horizontal Displacement of Panel
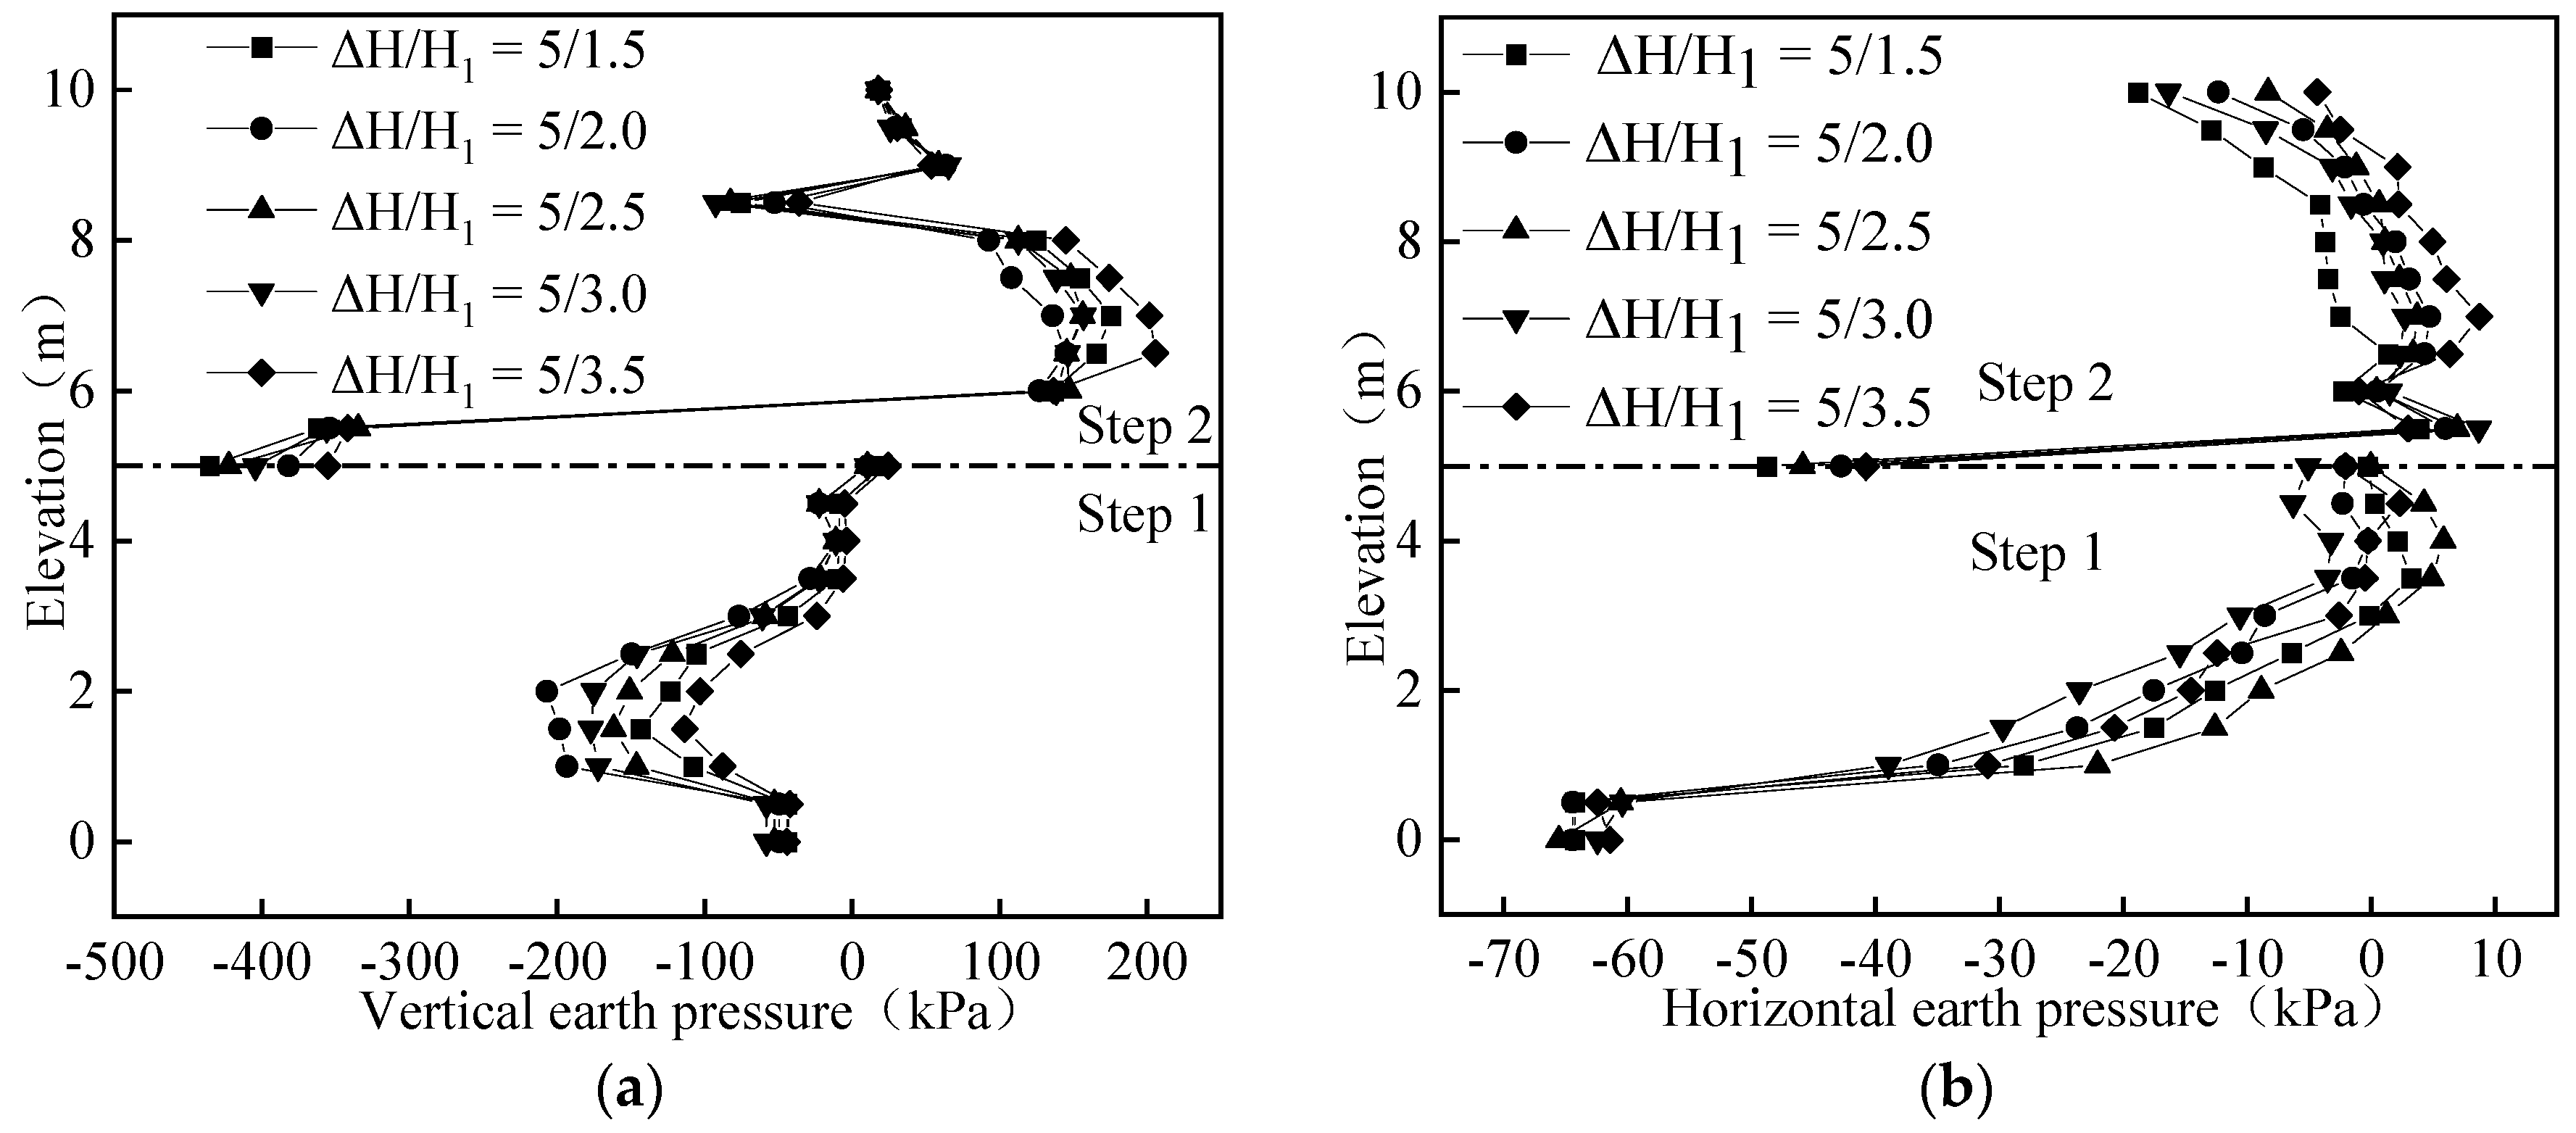
4.2.2. Earth Pressure Distribution
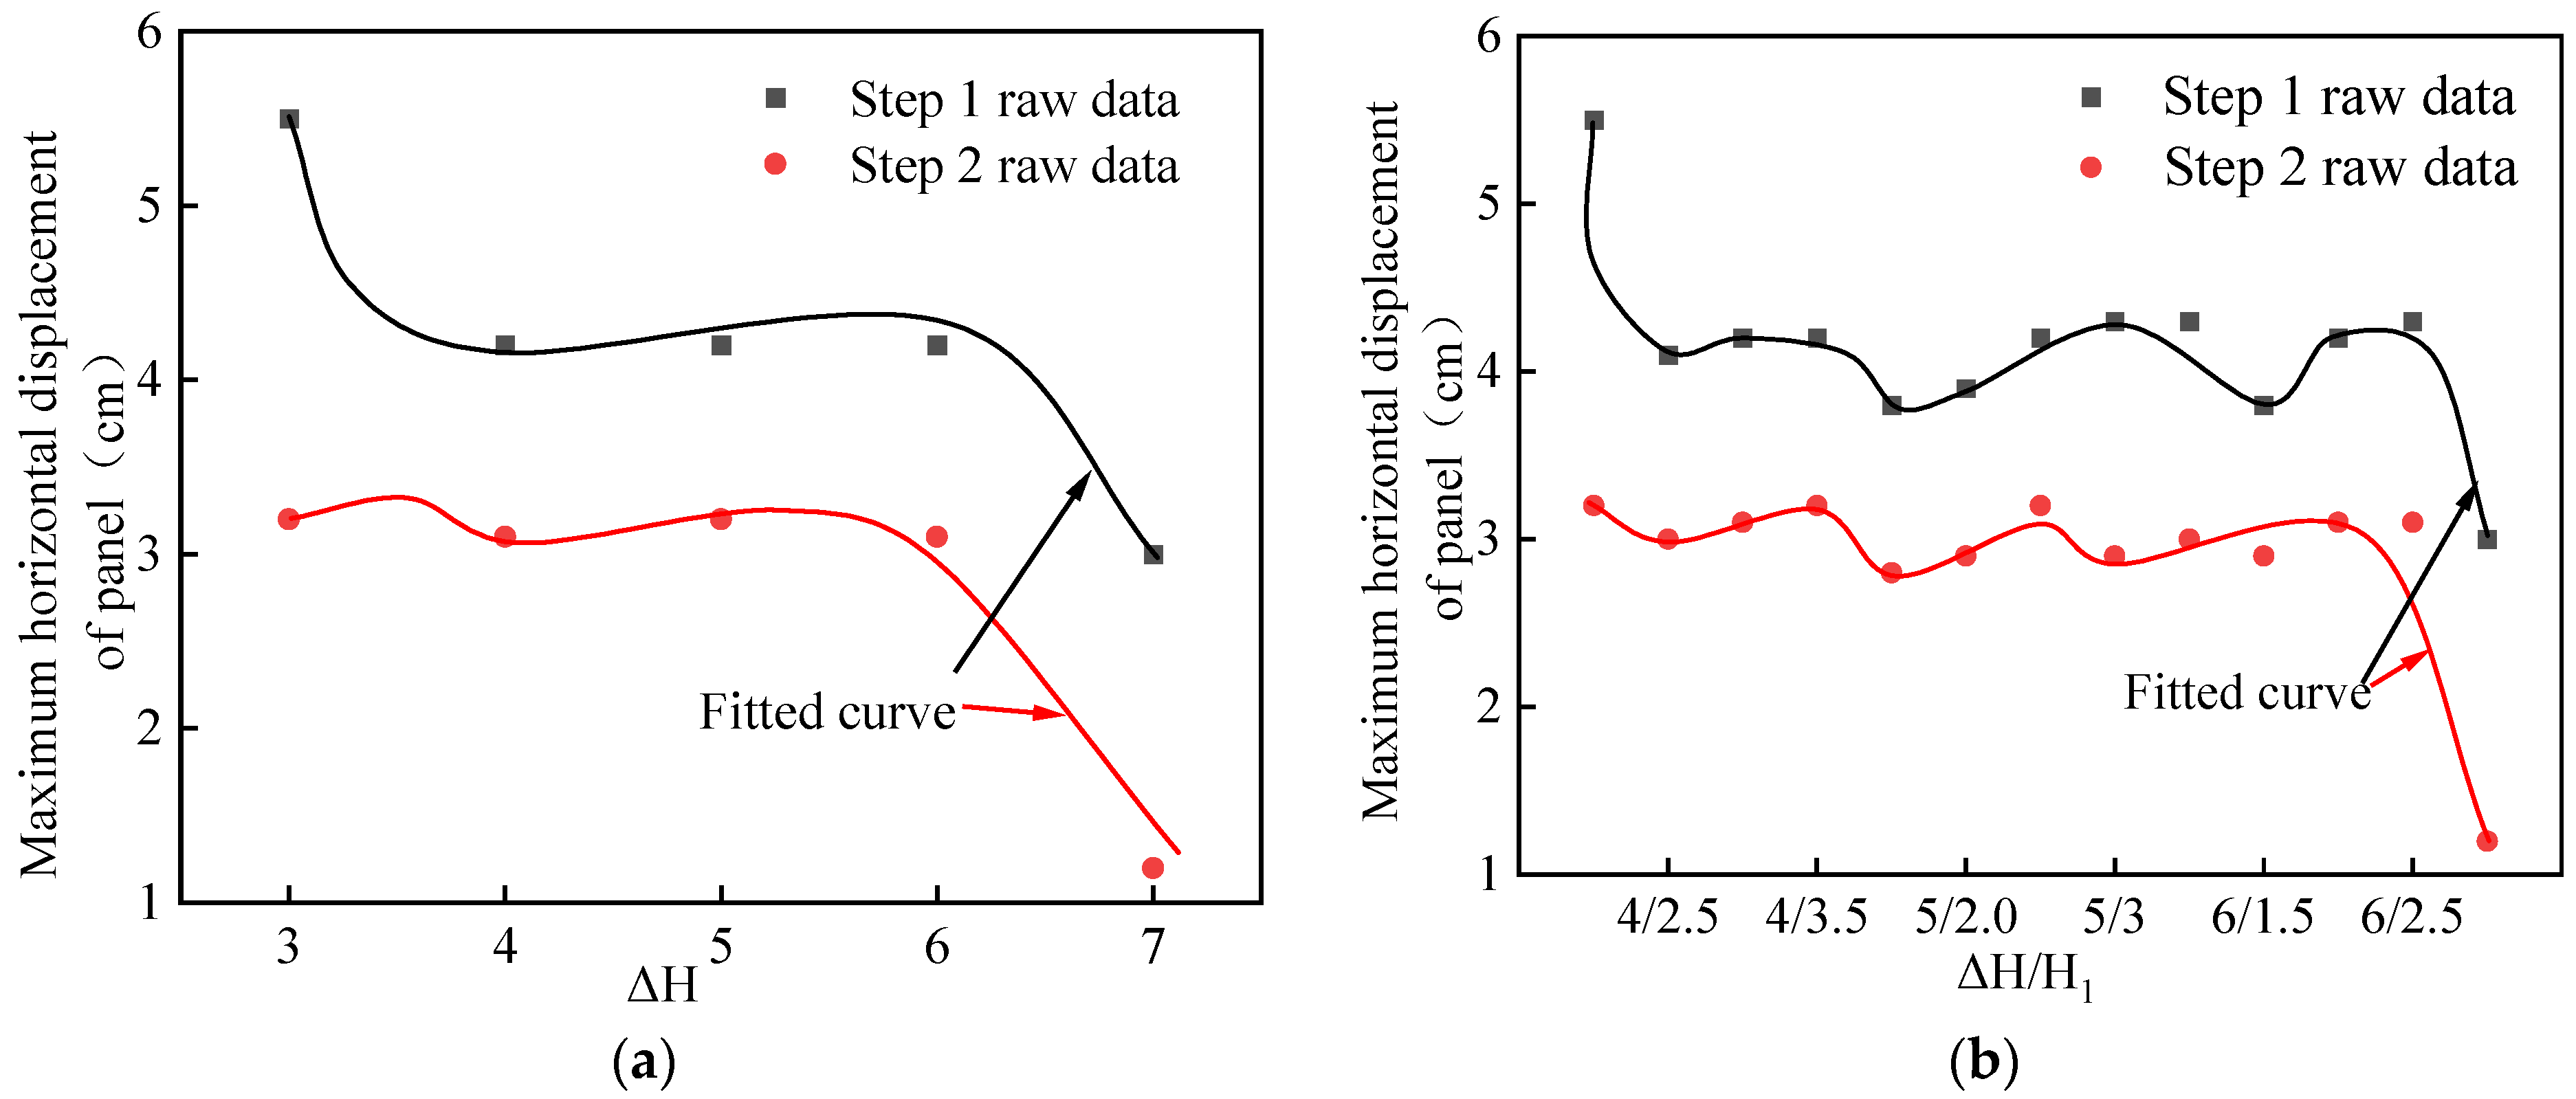
4.3. Influence of and on Maximum Horizontal Displacement of Retaining Wall
5. Conclusions
- (1)
- The position of reinforcement material has significant influence on the horizontal displacement pattern and earth pressure distribution of stepped reinforced retaining wall. Reinforcement laying in the upper layer can effectively reduce the horizontal displacement of the step 1 panel and laying in the upper layer can minimize the horizontal displacement of the step 2 panel. Under the condition of certain , the horizontal displacement of the panel in step 1 is 15% higher than the other four conditions when the reinforcement is arranged on the upper layer, and the horizontal displacement of the panel in step 2 is 61.3% lower when the reinforcement is arranged on the top of the wall than at the bottom of the wall. Secondly, the reinforcement laid in the upper layer is the most favorable to reduce the displacement of the top of the step 1, and the control effect of the horizontal displacement of the top of the step 2 is the best when laid on the lower layer. In addition, when the reinforcement is arranged at the bottom of step 1 and step 2, the vertical and horizontal earth pressures of the retaining wall are small, and when = 3, the vertical earth pressure and horizontal earth pressure are about 19% lower than the other four conditions. At a certain time, the vertical earth pressure and horizontal earth pressure under the condition of parameter = 5/3.5 decrease by about 16% on average compared with other conditions. The negative value of vertical earth pressure is caused by soil uplift inside the wall, while the negative value of horizontal earth pressure is caused by soil liquefaction.
- (2)
- The location of the fracture surface of the retaining wall changes with the change of parameters. When = 3, no obvious slip surface appears, while when = 6, the fracture surface only exists in the step 1 area. The position change of the sliding surface has no obvious regularity with respect to the parameters, but the reinforcement layout at the step classification is obviously due to other conditions.
- (3)
- Through the formula fitting of the maximum horizontal displacement of step 1 and step 2 panels, it is shown that there is a certain quantitative relationship between the maximum horizontal displacement of step 1 panel and parameters and , which has certain reference value for relevant practical projects.
- (4)
- In this paper, the consideration of the variable of reinforcement location is not comprehensive enough, and it does not involve all possible locations of reinforcement laying. In the future, correlation functions may be introduced to describe the position of reinforcement materials in retaining walls, but this study is still of considerable significance for the construction of reinforced retaining walls.
Author Contributions
Funding
Data Availability Statement
Conflicts of Interest
References
- Fu, J.; Li, J.; Chen, C.; Rui, R. DEM-FDM Coupled Numerical Study on the Reinforcement of Biaxial and Triaxial Geogrid Using Pullout Test. Appl. Sci. 2021, 11, 9001. [Google Scholar] [CrossRef]
- Ma, K.; Wang, L.; Long, L.; Peng, Y.; He, G. Discrete Element Analysis of Structural Characteristics of Stepped Reinforced Soil Retaining Wall. Geomat. Nat. Hazards Risk 2020, 11, 1447–1465. [Google Scholar] [CrossRef]
- Kiersnowska, A.; Koda, E.; Fabianowski, W.; Kawalec, J. Effect of the Impact of Chemical and Environmental Factors on the Durability of the High Density Polyethylene (HDPE) Geogrid in a Sanitary Landfill. Appl. Sci. 2017, 7, 22. [Google Scholar] [CrossRef]
- Kim, Y.-J.; Kotwal, A.R.; Cho, B.-Y.; Wilde, J.; You, B.H. Geosynthetic Reinforced Steep Slopes: Current Technology in the United States. Appl. Sci. 2019, 9, 2008. [Google Scholar] [CrossRef]
- Koda, E.; Kiersnowska, A.; Kawalec, J.; Osiński, P. Landfill Slope Stability Improvement Incorporating Reinforcements in Reclamation Process Applying Observational Method. Appl. Sci. 2020, 10, 1572. [Google Scholar] [CrossRef]
- Hosamo, H.; Sliteen, I.; Ding, S. Numerical Analysis of Bearing Capacity of a Ring Footing on Geogrid Reinforced Sand. Buildings 2021, 11, 68. [Google Scholar] [CrossRef]
- Ding, G.; Zhou, L.; Wang, J.; Xu, Y.; Geng, X.; Li, X. Shaking table tests on gravel slopes reinforced by concrete canvas. Geotext. Geomembr. 2020, 48, 539–545. [Google Scholar] [CrossRef]
- Lin, Y.L.; Leng, W.M.; Yang, G.L.; Li, L.; Yang, J.S. Seismic response of embankment slopes with different reinforcing measures in shaking table tests. Nat. Hazards 2015, 76, 791–810. [Google Scholar] [CrossRef]
- Liu, J.; Liu, F.; Kong, X.; Yu, L. Large-scale shaking table model tests of aseismic measures for concrete faced rock-fill dams. Soil Dyn. Earthq. Eng. 2014, 61–62, 152–163. [Google Scholar] [CrossRef]
- Panah, A.K.; Yazdi, M.; Ghalandarzadeh, A. Shaking table tests on soil retaining walls reinforced by polymeric strips. Geotext. Geomembr. 2015, 43, 148–161. [Google Scholar] [CrossRef]
- Wang, Y.Q.; Liu, K.; Li, X.; Ren, Q.B.; Li, L.L.; Zhang, Z.H.; Li, M.C. Experimental and upper-bound study of the influence of soil bag tail length on the reinforcement effect in soil slopes. Geotext. Geomembr. 2019, 47, 610–617. [Google Scholar] [CrossRef]
- El-Emam, M.M.; Bathurst, R.J. Influence of reinforcement parameters on the seismic response of reduced-scale reinforced soil retaining walls. Geotext. Geomembr. 2007, 25, 33–49. [Google Scholar] [CrossRef]
- Rahman, A.; Ueda, T. In-Plane Shear Performance of Masonry Walls after Strengthening by Two Different FRPs. J. Compos. Constr. 2016, 20, 04016019. [Google Scholar] [CrossRef]
- Wu, Y.; Li, J.; Shi, Y.; Jin, H.; Hu, X. Dynamic characteristics of reinforced soil retaining wall under seismic load. J. Earthq. Eng. 2017, 39, 475–480. [Google Scholar]
- Sitar, N.; Nova-Roessig, L.A. Review of experimental studies of seismic behavior of reinforced soil structures. In Proceedings of the Second International Conference on Earthquake Geotechnical Engineering, Lisboa, Portugal, 21–25 June 1999; pp. 1083–1088. [Google Scholar]
- Konthesingha, K.M.C.; Masia, M.J.; Petersen, R.B.; Page, A.W. Experimental evaluation of static cyclic in-plane shear behavior of unreinforced masonry walls strengthened with NSM FRP strips. J. Compos. Constr. 2015, 19, 04014055. [Google Scholar] [CrossRef]
- Leng, J.; Gabr, M.A. Characteristics of Geogrid-Reinforced Aggregate under Cyclic Load. Transp. Res. Rec. 2002, 1786, 29–35. [Google Scholar] [CrossRef]
- Nair, A.; Latha, G.M. Cyclic loading behaviour of reinforced soil-aggregate bases. Proc. Inst. Civ. Eng. Ground Improv. 2014, 167, 88–98. [Google Scholar] [CrossRef]
- Ren, F.; Xu, H.; Huang, Q. Study on deformation and failure mechanism of reinforced soil retaining wall under horizontal static and dynamic loads. Chin. J. Rock Mech. Eng. 2021, 40, 1248–1257. [Google Scholar]
- Latha, G.M.; Manju, G.S. Seismic response of geocell retaining walls through shaking table tests. Int. J. Geosynth. Ground Eng. 2016, 2, 7. [Google Scholar] [CrossRef]
- Sun, Z.; Zhang, M.; Jiang, S. Model test of geocell reinforced sand embankment under strip load. Chin. J. Geotech. Eng. 2015, 37, 170–175. [Google Scholar]
- Xiao, C.; Li, H.; Gao, S.; Wang, Z. Experimental study on mechanical and deformation behavior of stepped reinforced soil retaining wall under cyclic loading. Chin. J. Rock Mech. Eng. 2021, 40, 802–813. [Google Scholar]
- Liu, F.; Wang, X.; Li, J. Dynamic characteristics of composite reinforced earth retaining wall under earthquake. J. Disaster Prev. Mitig. Eng. 2021, 41, 612–621. [Google Scholar]
- Song, F.; Xu, W.; Zhang, L.; Peng, Y. Numerical analysis of deformation behavior of geocell flexible retaining wall. Rock Soil Mech. 2011, 32, 738–742. [Google Scholar] [CrossRef]
- Ganbaatar, A.; Mori, T.; Matsumoto, S.; Inoue, R. Reinforced Effect on Brick Wall Using Timber Wall as a Retrofitting Method. Buildings 2022, 12, 978. [Google Scholar] [CrossRef]
- Zeng, X. Dynamic Stability Analysis of Anti-Slip Pile Reinforcement Slope under Seismic Load. Master’s Thesis, Southwest Jiaotong University, Chengdu, China, 2017. [Google Scholar]
- Zhu, Y.; Tan, K.; Hong, Y.; Tan, T.; Song, M.; Wang, Y. Deformation of the Geocell Flexible Reinforced Retaining Wall under Earthquake. Adv. Civ. Eng. 2021, 2021, 8897009. [Google Scholar] [CrossRef]
- Chen, Y.; Xu, D. FLAC/FLAC3D Foundation and Engineering Example; China Water Resources and Electric Power Press: Beijing, China, 2013. [Google Scholar]
- Li, D. Dynamic Analysis of High Earth-Rock Dam Based on Generalized Plasticity Theory. Master’s Thesis, Hefei University of Technology, Hefei, China, 2017. [Google Scholar]
- Guler, E.; Enunlu, A.K. Investigation of dynamic behavior of geosynthetic reinforced soil retaining structures under earthquake loads. Bull. Earthq. Eng. 2009, 7, 737–777. [Google Scholar] [CrossRef]
- Iai, S. Similitude for shaking table tests on soil-structure-fluid models in 1 g gravitational field. Soils Found. 1989, 29, 105–118. [Google Scholar] [CrossRef] [Green Version]
- Wang, X.; Liu, H.; Song, E. Influence of earthquake type on dynamic response of reinforced earth retaining wall after long-term creep. J. Hohai Univ. (Nat. Sci. Ed.) 2011, 39, 528–535. [Google Scholar]
- Wang, J. Research on Design Method and Application of Reinforced Gabion Retaining Wall. Master’s Thesis, Chongqing Jiaotong University, Chongqing, China, 2013. [Google Scholar]


| Type | Bulk/MPa | Density/(kg/m3) | Friction/(°) | Cohesion/kPa | Shear/MPa |
|---|---|---|---|---|---|
| Retaining wall | 16.8 | 1720 | 28 | 25,000 | 7.2 |
| Foundation | 20.9 | 1520 | 23 | 35,000 | 9.8 |
| Elastic/MPa | Porosity | Density/(kg/m3) | Thickness/mm |
|---|---|---|---|
| 30 × 103 | 0.2 | 2400 | 0.5 |
| Elastic/MPa | Porosity | Density/(kg/m3) | Coupling Cohesion /kPa | Coupling Friction /(°) | Thickness/mm |
|---|---|---|---|---|---|
| 5.5 × 10² | 0.3 | 1000 | 12,000 | 27 | 3 |
| Elastic/MPa | Porosity | Density/(kg/m3) | Thickness/mm |
|---|---|---|---|
| 30 × 103 | 0.2 | 2300 | 0.5 |
| Contact Type | Shear Stiffness/ | Normal Stiffness/ | Cohesion/kPa | Internal Friction Angle/(°) |
|---|---|---|---|---|
| Foundation-wall | 4.53 | 4.53 | 56 | 26 |
| Panel-panel | 7.35 | 7.35 | 1000 | 45 |
| Panel-wall | 5.25 | 5.25 | 53 | 31 |
| 3 | 3/3.5 | 5.5 | 3.2 |
| 4 | 4/2.5 | 4.1 | 3.0 |
| 4/3.0 | 4.2 | 3.1 | |
| 4/3.5 | 4.2 | 3.2 | |
| 5 | 5/1.5 | 3.8 | 2.8 |
| 5/2.0 | 3.9 | 2.9 | |
| 5/2.5 | 4.2 | 3.2 | |
| 5/3.0 | 4.3 | 2.9 | |
| 5/3.5 | 4.3 | 3.0 | |
| 6 | 6/1.5 | 3.8 | 2.9 |
| 6/2.0 | 4.2 | 3.1 | |
| 6/2.5 | 4.3 | 3.1 | |
| 7 | 7/1.5 | 3.0 | 1.2 |
Publisher’s Note: MDPI stays neutral with regard to jurisdictional claims in published maps and institutional affiliations. |
© 2022 by the authors. Licensee MDPI, Basel, Switzerland. This article is an open access article distributed under the terms and conditions of the Creative Commons Attribution (CC BY) license (https://creativecommons.org/licenses/by/4.0/).
Share and Cite
Zhu, Y.; Chen, R.; Wang, Y.; Chen, J. Study on Dynamic Response Characteristics of Stepped Reinforced Retaining Wall. Buildings 2022, 12, 1464. https://doi.org/10.3390/buildings12091464
Zhu Y, Chen R, Wang Y, Chen J. Study on Dynamic Response Characteristics of Stepped Reinforced Retaining Wall. Buildings. 2022; 12(9):1464. https://doi.org/10.3390/buildings12091464
Chicago/Turabian StyleZhu, Yalin, Renyi Chen, Yixian Wang, and Juxiang Chen. 2022. "Study on Dynamic Response Characteristics of Stepped Reinforced Retaining Wall" Buildings 12, no. 9: 1464. https://doi.org/10.3390/buildings12091464