Article

Non-Destructive Evaluation of Preload Loss of Bolted Spherical Joints Based on Time Reversal Acoustics: A Numerical Simulation

1
School of Transportation and Civil Engineering, Nantong University, Nantong 226019, China
2
Shanghai Tobacco Group Co., Ltd., Shanghai 200082, China
3
College of Civil Engineering, Tongji University, Shanghai 200092, China
*
Authors to whom correspondence should be addressed.
Buildings 2023, 13(1), 127; https://doi.org/10.3390/buildings13010127
Submission received: 22 November 2022 / Revised: 22 December 2022 / Accepted: 29 December 2022 / Published: 4 January 2023
(This article belongs to the Section Building Structures)

Abstract

:
Bolted spherical joints are widely used in space grid structures. However, the preload loss, which may arise from fabrication error, insufficient twist of the screw and some other unknown reasons can undermine the structural integrity and even lead to the collapse of the whole structure. Therefore, a method for evaluating the preload status of bolted spherical joints is vital to the structural health monitoring of the space grid structures. To this end, a non-destructive evaluation of the preload loss of bolted spherical joints based on time reversal acoustics (TRA) is presented. In this method, an excited signal generated by a lead zirconate titanate (PZT) patch at the bolted sphere is reconstructed after the signal recorded by another PZT patch at the bar is time-reversed and re-emitted. The deviation of the reconstructed signal from the initial signal allows identification of preload loss of the bolted spherical joint. This method is demonstrated to be effective by a finite element simulation. Furthermore, the effect of preload loss of the bolted spherical joint on its ultimate flexural capacity is studied, which highlights the necessity for the non-destructive evaluation.

1. Introduction

Bolted spherical joints (BSJs) are widely used in space grid structures. Similar to planar frame structures [1,2], the joints play an important role in the behavior of space grid structures. Neglecting the joint effects makes a considerable difference in its real response [3]. Preload loss will undermine the structural integrity and even lead to the collapse of the whole structure [4]. The preload loss may arise from fabrication error, insufficient twist of the screw and some other unknown reasons and is difficult to avoid. A number of studies have been performed to investigate the effect of bolt tightness on the behavior of the joint [5,6,7]. It is also well established that damage detection is important for ensuring the long-term performance of infrastructure [8]. Therefore, it is necessary to develop an effective technique to evaluate the tightness of the BSJ.
Time reversal acoustics (TRA) were first proposed by Fink [9,10]. In TRA, an original input signal can be reconstructed at the source when the response signal recorded by a receiver is reversed in the time domain and re-emitted. This time reversibility is based on linear reciprocity of elastic waves. Hence, any types of nonlinearity (e.g., damage) will bring a deviation of the reconstructed signal from the initial signal. By comparing the waveform of the reconstructed signal with that of the original input signal, the damage will be detected. A number of studies on the application of the concept of TRA in the structural health monitoring have been reported [11,12,13,14,15,16,17,18]. Leutenegger and Dual [11] proposed a method for the detection of defects in cylindrical structures. The scattered field arising from the interaction between the excited guided wave and the defect is measured experimentally with a laser vibrometer at various locations around the circumference at a selected axial coordinate. The recorded signals were time-reversed and re-emitted using a numerical model, whereby the determination of the positions and orientations of the defects is achieved. Du et al. [12] performed an experimental study on the pipeline corrosion pit detection, in which a hole is artificially drilled to mimic the corrosion pit. The test based on the TRA concept showed that a drilled hole in the pipeline reduced the energy of the reconstructed signal. The results indicate the potential to apply the TRA concept in monitoring the damage degree of corrosion pits on pipelines in real time. Parvasi et al. [14] proposed an approach to monitoring the preload of bolted joint connections. The TRA technique was used to focus the energy of a lead zirconate titanate (PZT)-generated ultrasound wave, and a tightness index was defined and used to correlate the peak amplitude of the signal to the bolt preload. Based on a similar principle, Zhang et al. [16] reported an investigation into the health monitoring of cuplok scaffold joint connections using the TRA technique. More recently, Xu et al. [17] carried out an experimental study on the health monitoring of BSJs based on the active sensing technique using PZT transducers. Both the wavelet packet analysis and the time reversal method were adopted in their study. The experimental results showed that the wavelet packet analysis and the time reversal method are effective in detecting the tightness of such types of connections. Sun et al. [18] conducted concrete damage detection by using the time reversal focusing imaging algorithm and found that time reversal focusing can improve the spatial focusing quality and has better damage localization than the forward algorithm.
In this paper, the non-destructive evaluation of preload loss of bolted spherical joints based on TRA is simulated using the finite element (FE) method. The propagation of the excited and re-emitted waves generated by PZT patches are simulated by a coupled electro-mechanical analysis. The correlation between the preload status of the BSJ and the amplitude of the time-reversed signal is established from the FE results. Finally, the effect of preload loss of the bolted spherical joint on its ultimate flexural capacity is examined numerically, which also highlights the necessity for non-destructive evaluation.

2. Non-Destructive Evaluation Based on Time Reversal Acoustics

2.1. Principle

As shown in Figure 1, a bolted spherical joint consists of four parts: a bolted sphere, a high-strength bolt, a sleeve and a bar with a sealing plate.
The principle of the non-destructive evaluation of preload loss of BSJs based on TRA is illustrated in Figure 2. PZT-A, which is mounted on the sphere, generates elastic waves that travel through the joint. The signal recorded by PZT-B, which is mounted on the bar, is then reversed in the time domain and re-emitted. The re-emitted signal is finally recorded/focused at PZT-A. Based on the concept of TRA, the peak amplitude of the focused signal is proportional to the energy of the impulse response function. The time-reversal process also improves the signal-to-noise ratio. For the studied case, the impulse response between PZT-A and PZT-B is affected by the preload of the bolted joint.

2.2. FE Model

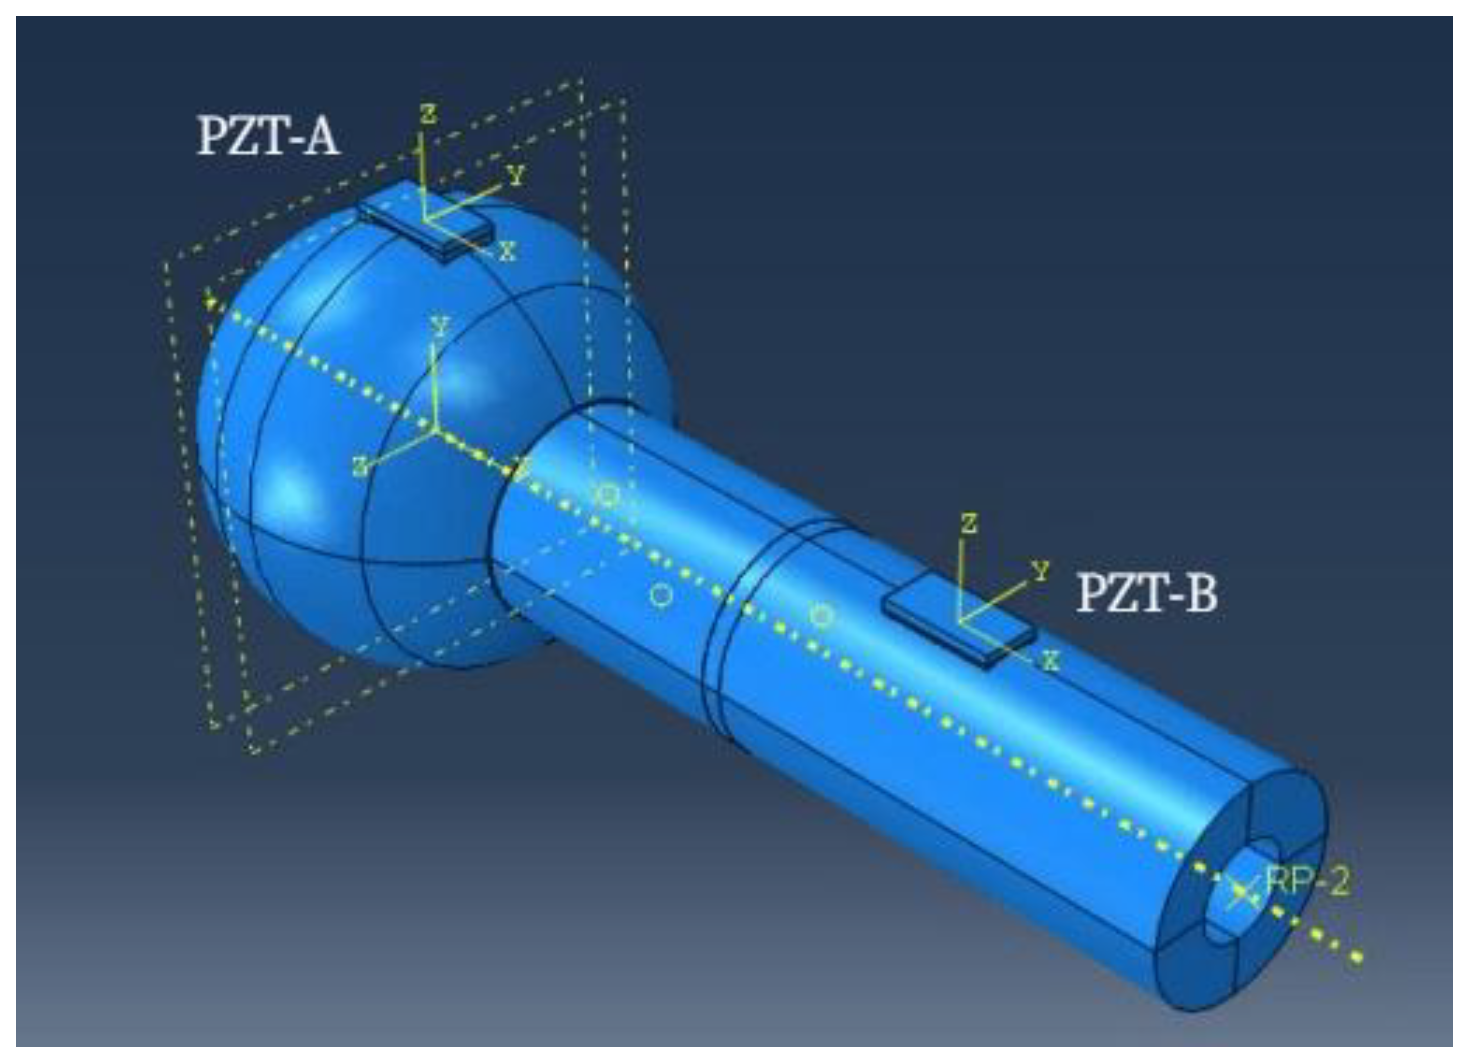
The FE simulation was implemented using the general-purpose FE software ABAQUS. All the four parts of the bolted spherical joint are modelled by the 8-node solid element C3D8R. The diameter of the sphere is 46 mm. The outer diameters of the sleeve, the sealing plate and the bar are the same (i.e., 22 mm). Both the sleeve and the sealing plate have an inner diameter of 8 mm, while the bar has an inner diameter of 10 mm. The thickness of the sealing plate is 2 mm. The length of the bolt, sleeve and bar are 48 mm, 28 mm and 50 mm, respectively. The diameter of the bolt is 8 mm. The material parameters of the steel are as follows: density ρ = 7860 kg/m3; elastic modulus E = 209 GPa; Poisson’s ratio ν = 0.3; yield stress fy = 345 MPa; and ultimate stress fu = 551 MPa. The stress–strain curve of steel is assumed to be bilinear. The nominal element size is taken as 5 mm. To eliminate the rigid body motion, the degree of freedoms of the right half of the bolted sphere are constrained (see Figure 2)
The surface-to-surface contact model provided by ABAQUS is used to describe the behavior of the sphere–sleeve interface, sleeve–sealing plate interface, bolt–sleeve interface and bolt-sealing plate interface. “Hard contact” is assumed for the normal behavior, while the friction coefficient for the tangential behavior is taken as 0.15. For the sake of simplicity, no slip is assumed between the bolt and the sphere.
The PZT transmitter and receiver (i.e., PZT-A and PZT-B) are modelled using PZT devices provided by ABAQUS. The mechanical and electrical parameters of PZT materials as suggested by Yan et al. [19] are given in Table 1. The dimensions of the PZT patch are 12 mm × 6 mm × 1 mm. Perfect bond was assumed between the PZT patch and the surface of the BSJ. The FE model is illustrated in Figure 3.
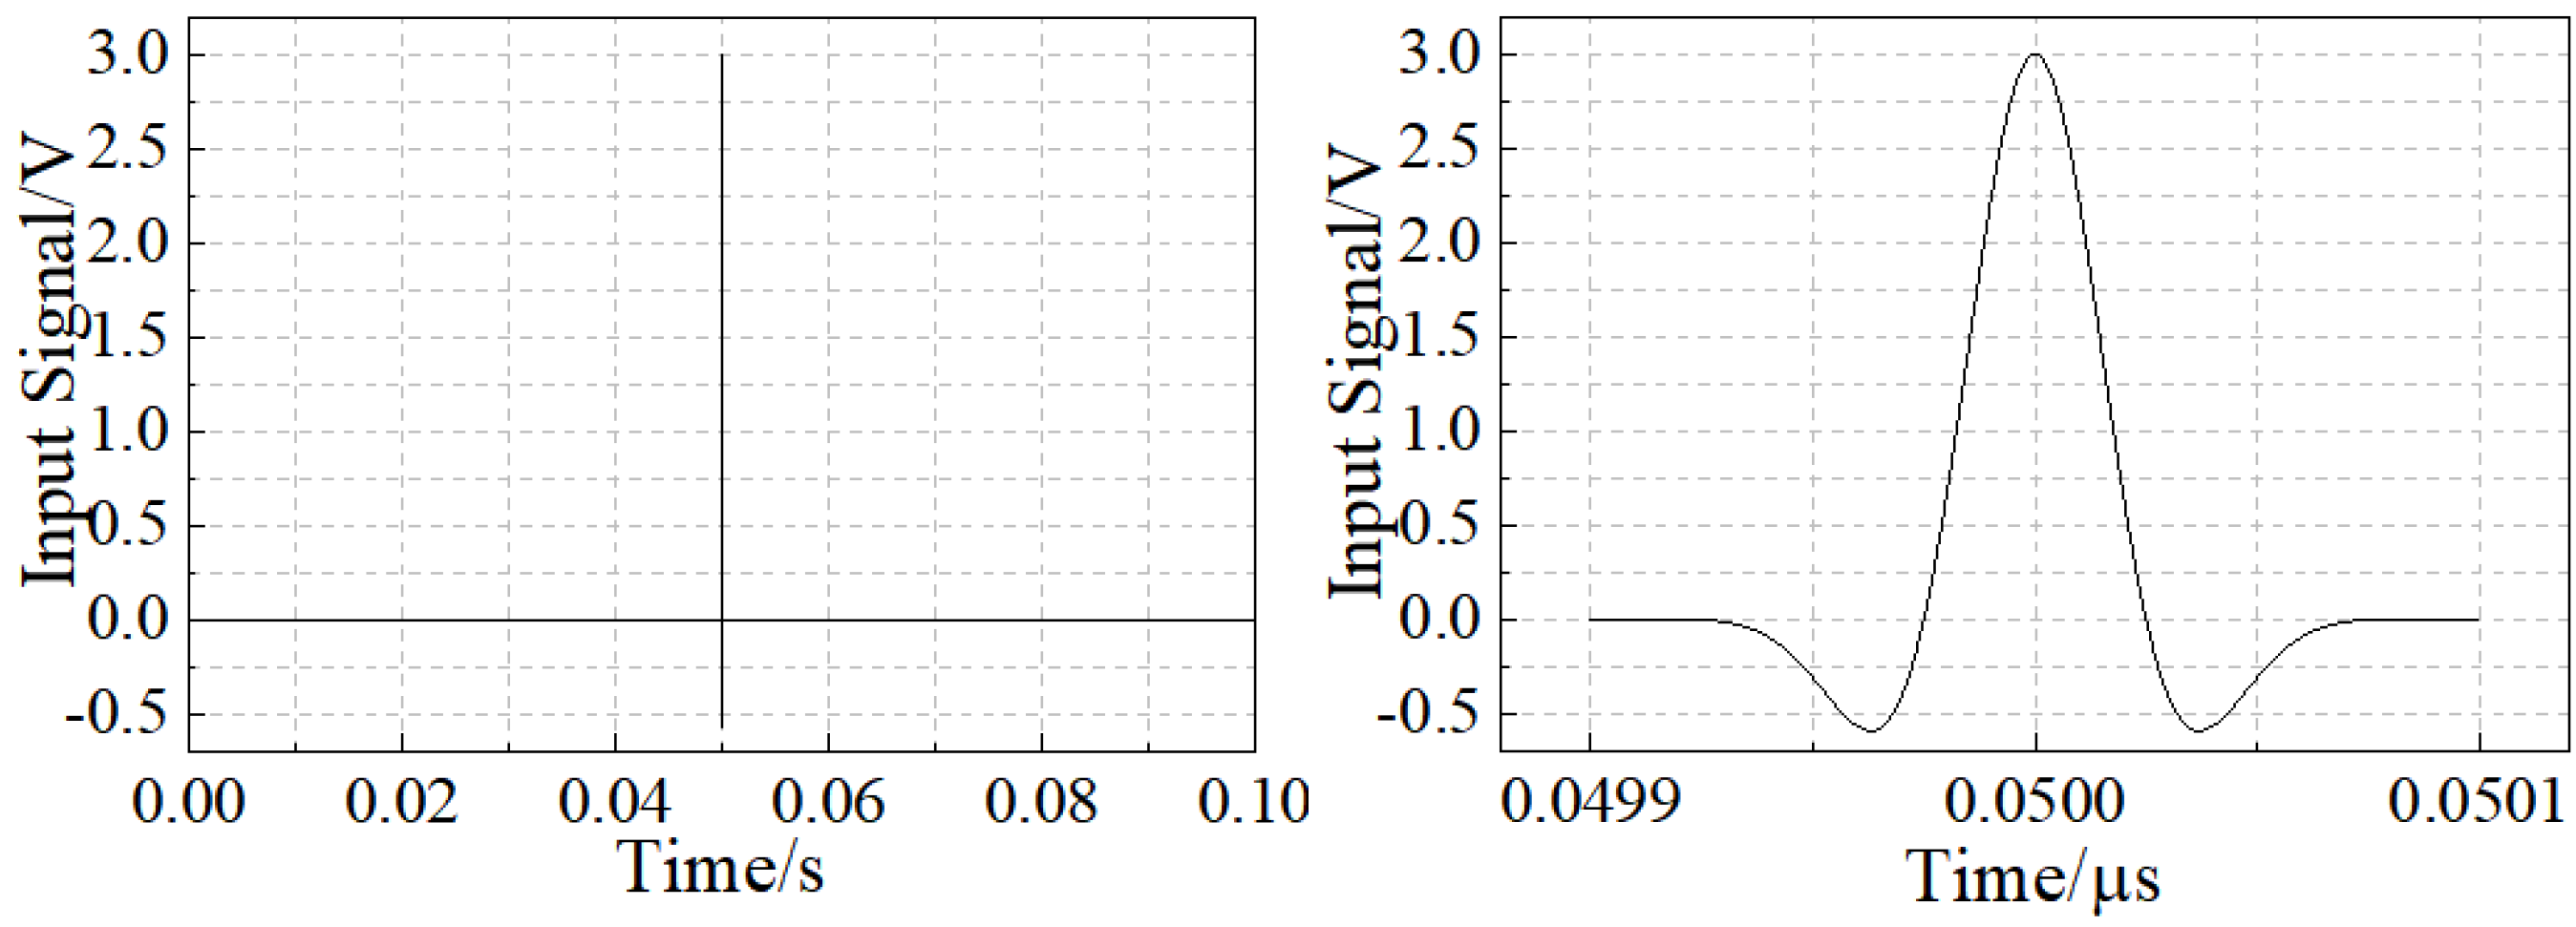
A two-step FE analysis was carried out on the basis of the above-mentioned FE model. In the first step (i.e., the static procedure), preload was applied to the bolt using the BOLT LOADS option provided by ABAQUS. In order to study the correlation between the preload level and the amplitude of the reconstructed signal, the following seven levels were selected for the preload: 5 kN, 7.5 kN, 10 kN, 12.5 kN, 15 kN, 17.5 kN and 20 kN. In the second step (i.e., the implicit dynamic procedure), the wave-propagation analysis based on TRA was performed. First, a Gaussian pulse input voltage (see Figure 4) was applied to PZT-A. The normalized bandwidth of the input signal was 0.8. The center frequency was taken to be 10 kHz. The elastic waves generated by PZT-A then traveled through the bolted joint and were recorded by PZT-B, which is mounted on the bar. The measured signal was then time-reversed and re-emitted by PZT-B and finally received by PZT-A. This procedure was repeated for each level of the bolt preload (i.e., 5 kN–20 kN, with the increment of 2.5 kN), from which the reconstructed signal at PZT-A was used to evaluate the tightness of the BSJ.

2.3. FE Results

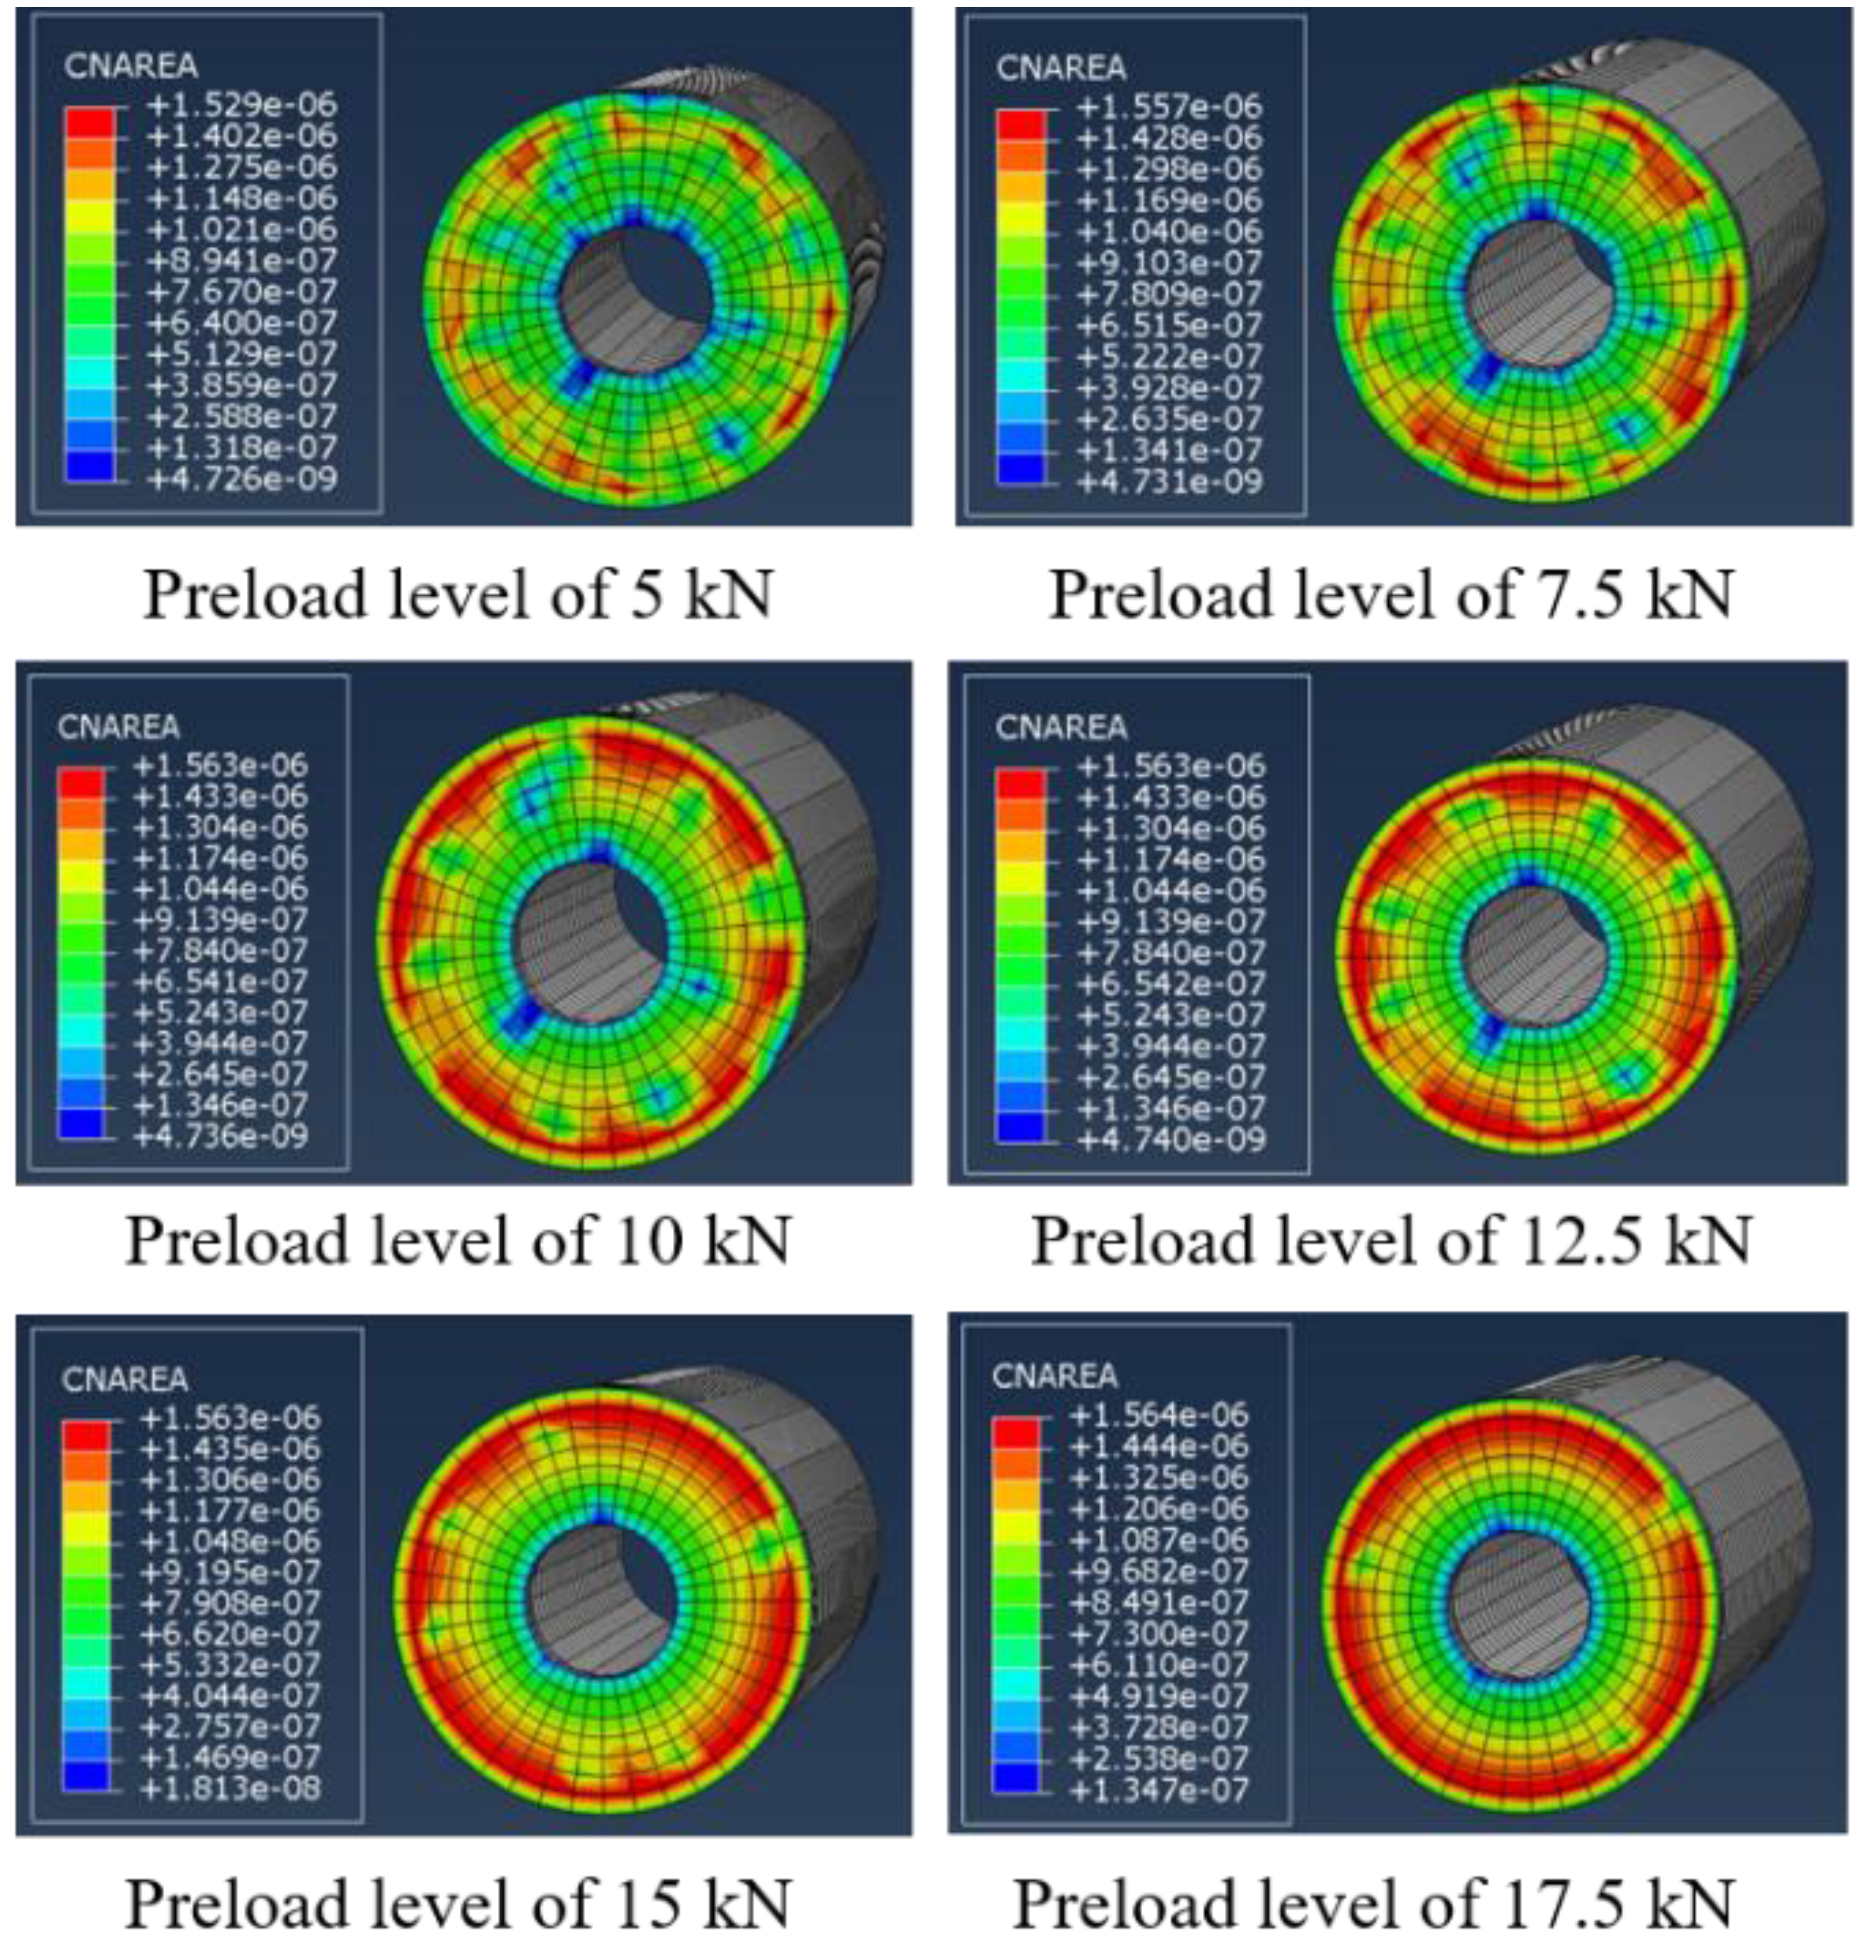
Figure 5 and Figure 6 show the contact areas of the sphere–sleeve interfaces and the sleeve–sealing plate interfaces for various preload levels. It is clear that with the increasing preload levels, the contact areas of the sphere–sleeve interface and the sleeve–sealing plate interface enlarge.
The reconstructed signals at PZT-A from the FE models with various preload levels are shown in Figure 7. The relationship between the amplitude of the focused signal and the preload level, which can be established on the basis of Figure 7, is shown in Figure 8. It is found that the amplitude of the focused signal is proportional to the preload level. The possible explanation is that the contact areas of the sphere–sleeve interface and the sleeve–sealing plate interface enlarge, which finally leads to the increase of the amount of energy focused on the source. The proposed method proves to be effective for evaluating the preload loss of the BSJ.

3. Ultimate Flexural Capacity of the Bolted Spherical Joint

According to the discussion presented above, the preload loss of the BSJ can be rationally evaluated based on the concept of TRA. The next question is how the preload loss affects the ultimate flexural capacity of the BSJ. In this section, the FE modelling of the flexural behavior of the BSJ is presented.

3.1. FE Model and Verification

To facilitate the verification of the FE model, the experimental study on the BSJs performed by Fan et al. [20] was simulated. The test setup is shown in Figure 9. A point load was applied at the top of the bolted sphere, which was connected to two bars via bolted joints. The test specimen was simply supported by two rollers. The test results for the moment and angle of rotation at the end of the cone were reported by Fan et al. [20].
In the FE model, the geometry and material parameters are taken according to the test specimen. The diameter of the sphere is 100 mm. The outer diameters of the sleeve, the sealing plate and the bar are the same (i.e., 46 mm). Both the sleeve and the sealing plate have an inner diameter of 27 mm. The length of the sleeve is 40 mm. The diameter of the bolt is 27 mm. The material parameters of the steel for the high-strength bolt are as follows: density ρ = 7860 kg/m3; elastic modulus E = 209 GPa; Poisson’s ratio ν = 0.3; yield stress fy = 365 MPa; the ultimate stress fu = 430 MPa. The material parameters for the other parts are as follows: density ρ = 7860 kg/m3; elastic modulus E = 209 GPa; Poisson’s ratio ν = 0.3; yield stress fy = 235 MPa. The stress–strain curve of steel is assumed to be bilinear. The surface-to-surface contact model provided by ABAQUS is used to describe the behavior of the sphere–sleeve interface, sleeve–sealing plate interface, bolt–sleeve interface and bolt–sealing plate interface. “Hard contact” is assumed for the normal behavior, while the friction coefficient for the tangential behavior is taken as 0.15. No slip is assumed between the bolt and the sphere (i.e., using TIE constraint provided by ABAQUS). The nominal element size is taken as 5 mm.
To reduce the computational effort, only the part comprised of the bolted sphere, one sleeve and one cone was modelled (see the part covered by a green box in Figure 9). The FE model is illustrated in Figure 10. The degree of freedom of the left half of the bolted sphere is constrained. The preload is applied to the FE model in the first step using the BOLT LOADS option provided by ABAQUS. To apply the moment to the end of the cone, a reference point is created. The kinematic coupling constraint provided by ABAQUS is defined between the reference point and the group of nodes at the surface of the cone’s end. In this manner, the cross section at the cone’s end will remain plane and move/rotate following the rigid body motion of the reference point. The bending moment is then applied at the reference point in the second step.
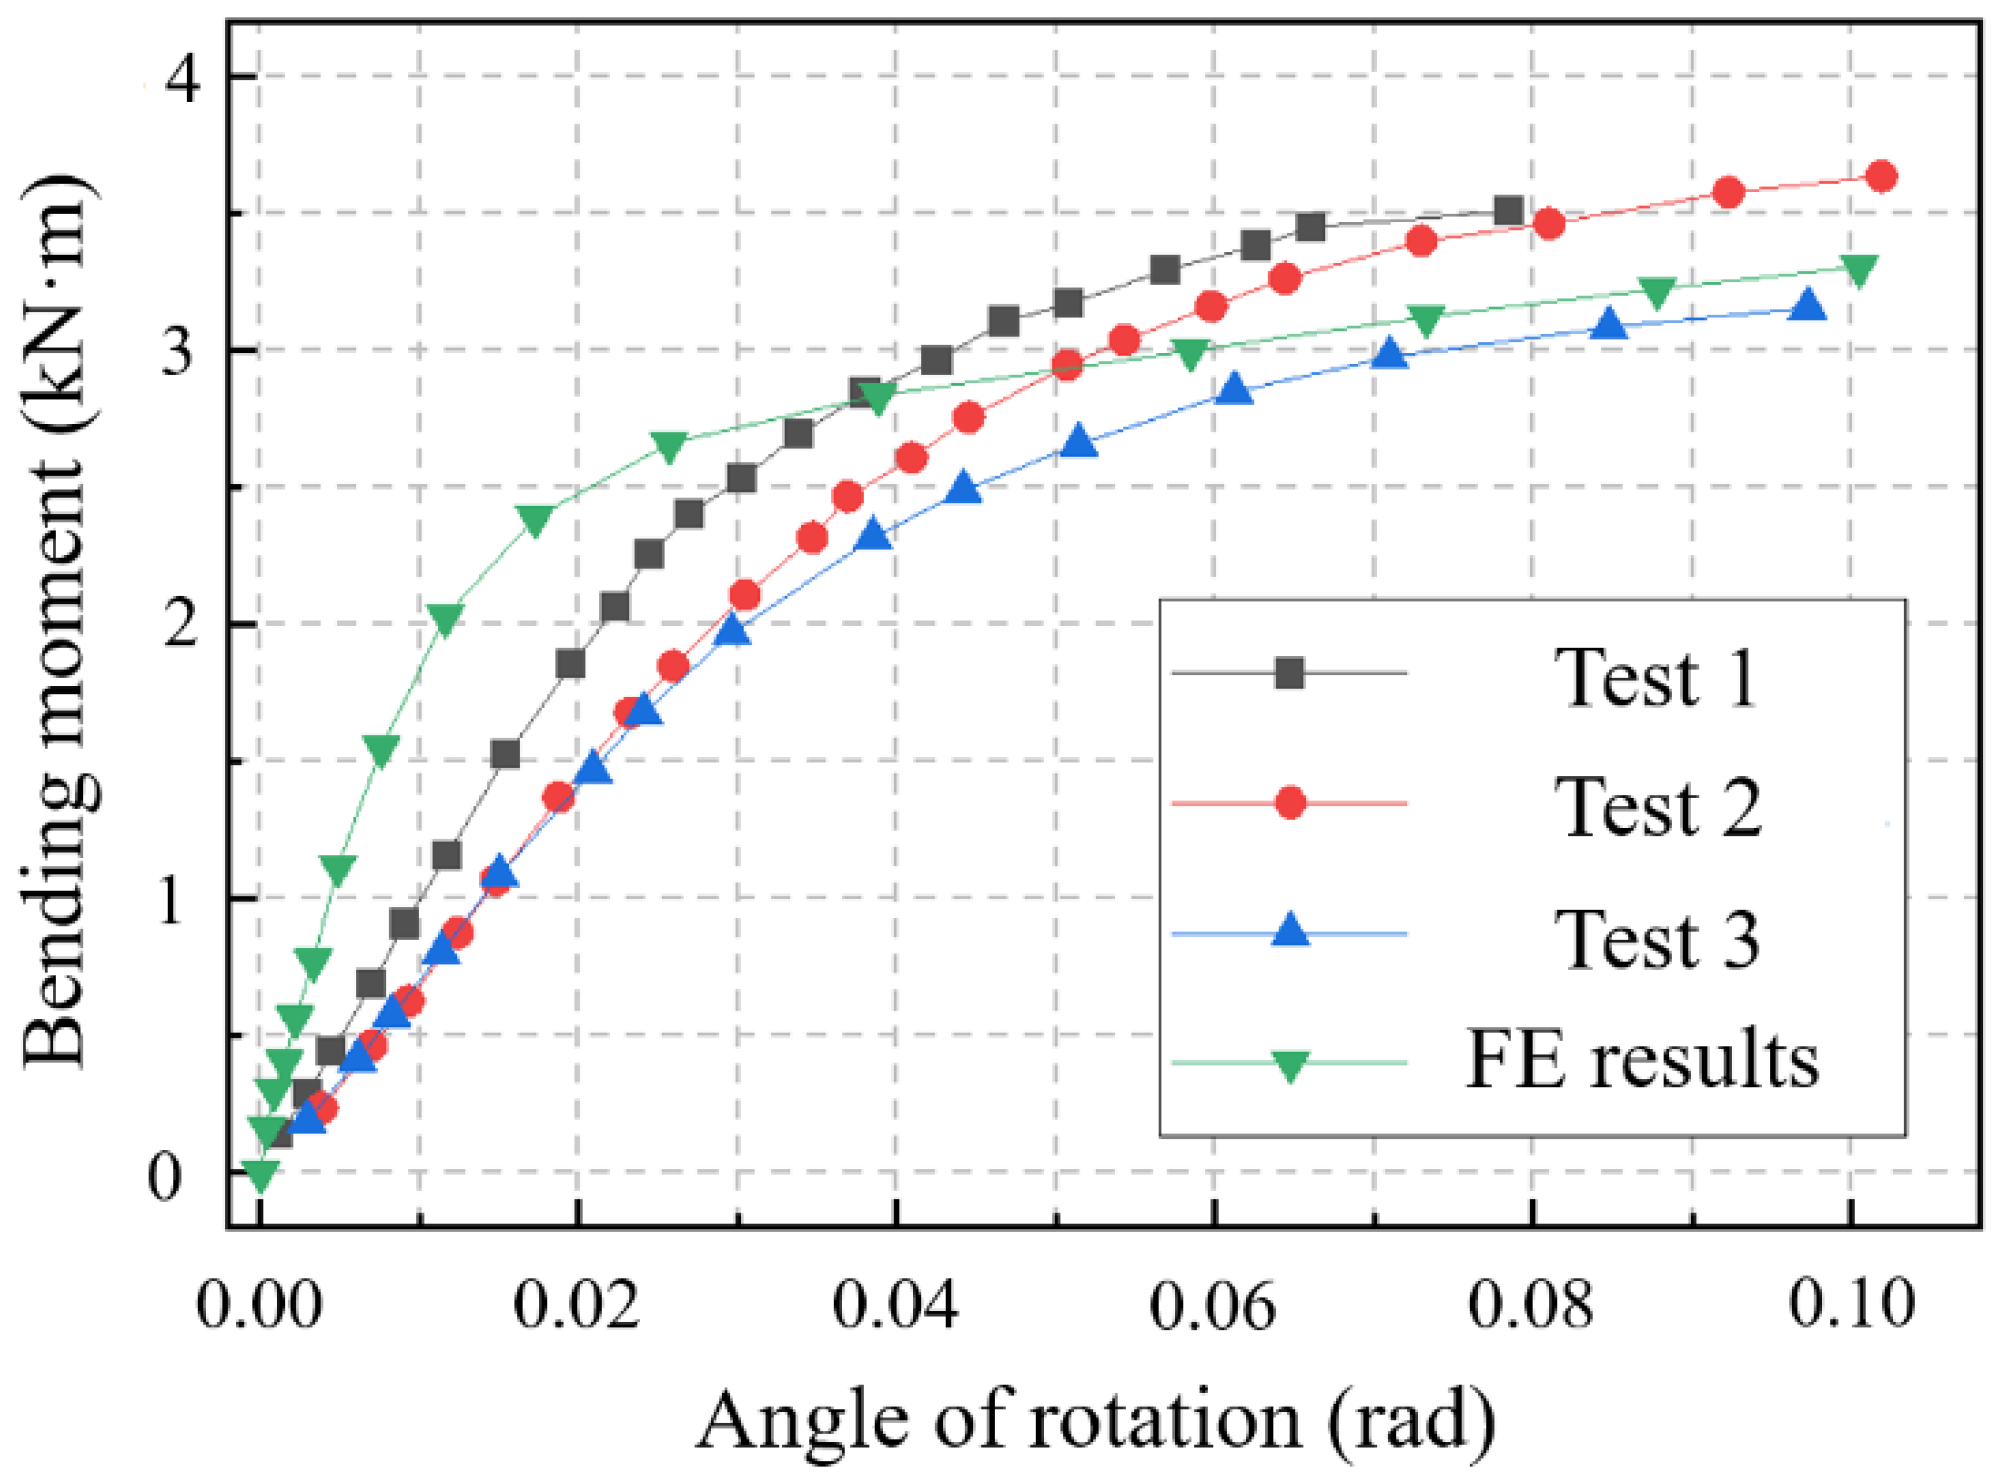
The FE results are compared with the experimental data in terms of the moment-rotation curve (see Figure 11) and the deformed shape (see Figure 12). It can be found that the moment-rotation behavior is well reproduced by the developed FE model. The deformed shape of the BSJ is also in good agreement with the experimental observation.

3.2. Effect of Preload Loss on the Ultimate Flexural Capacity

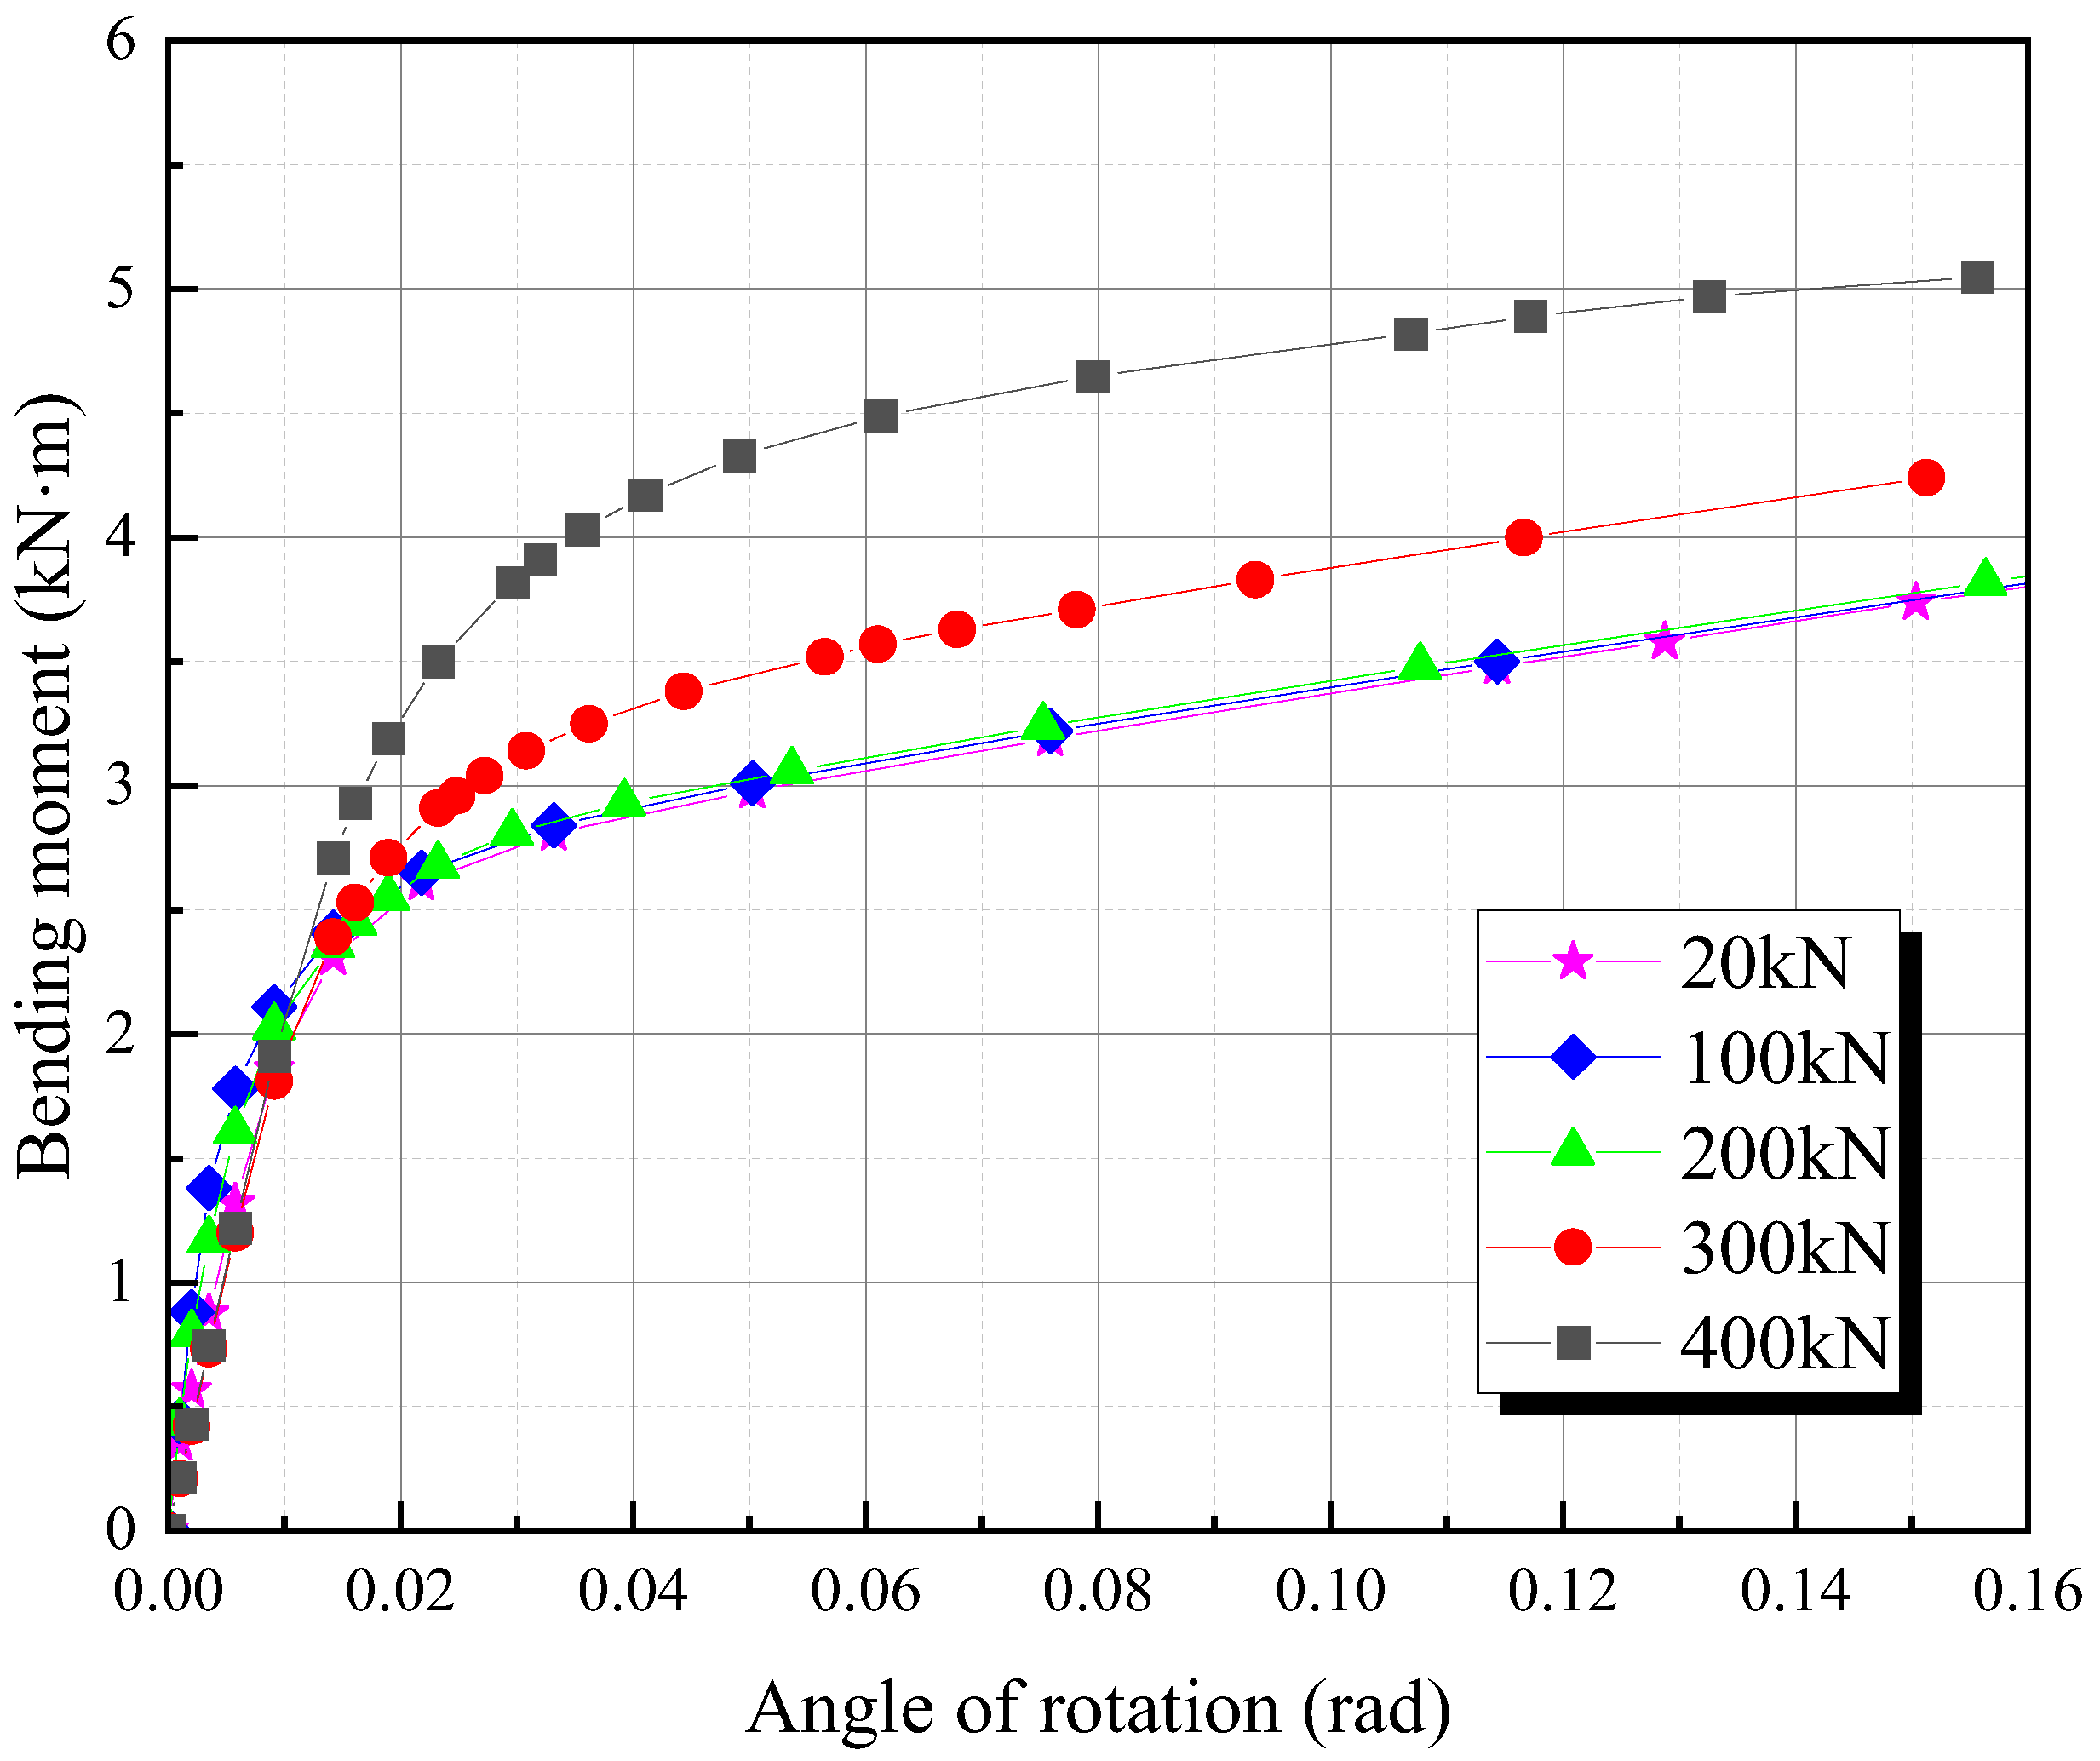
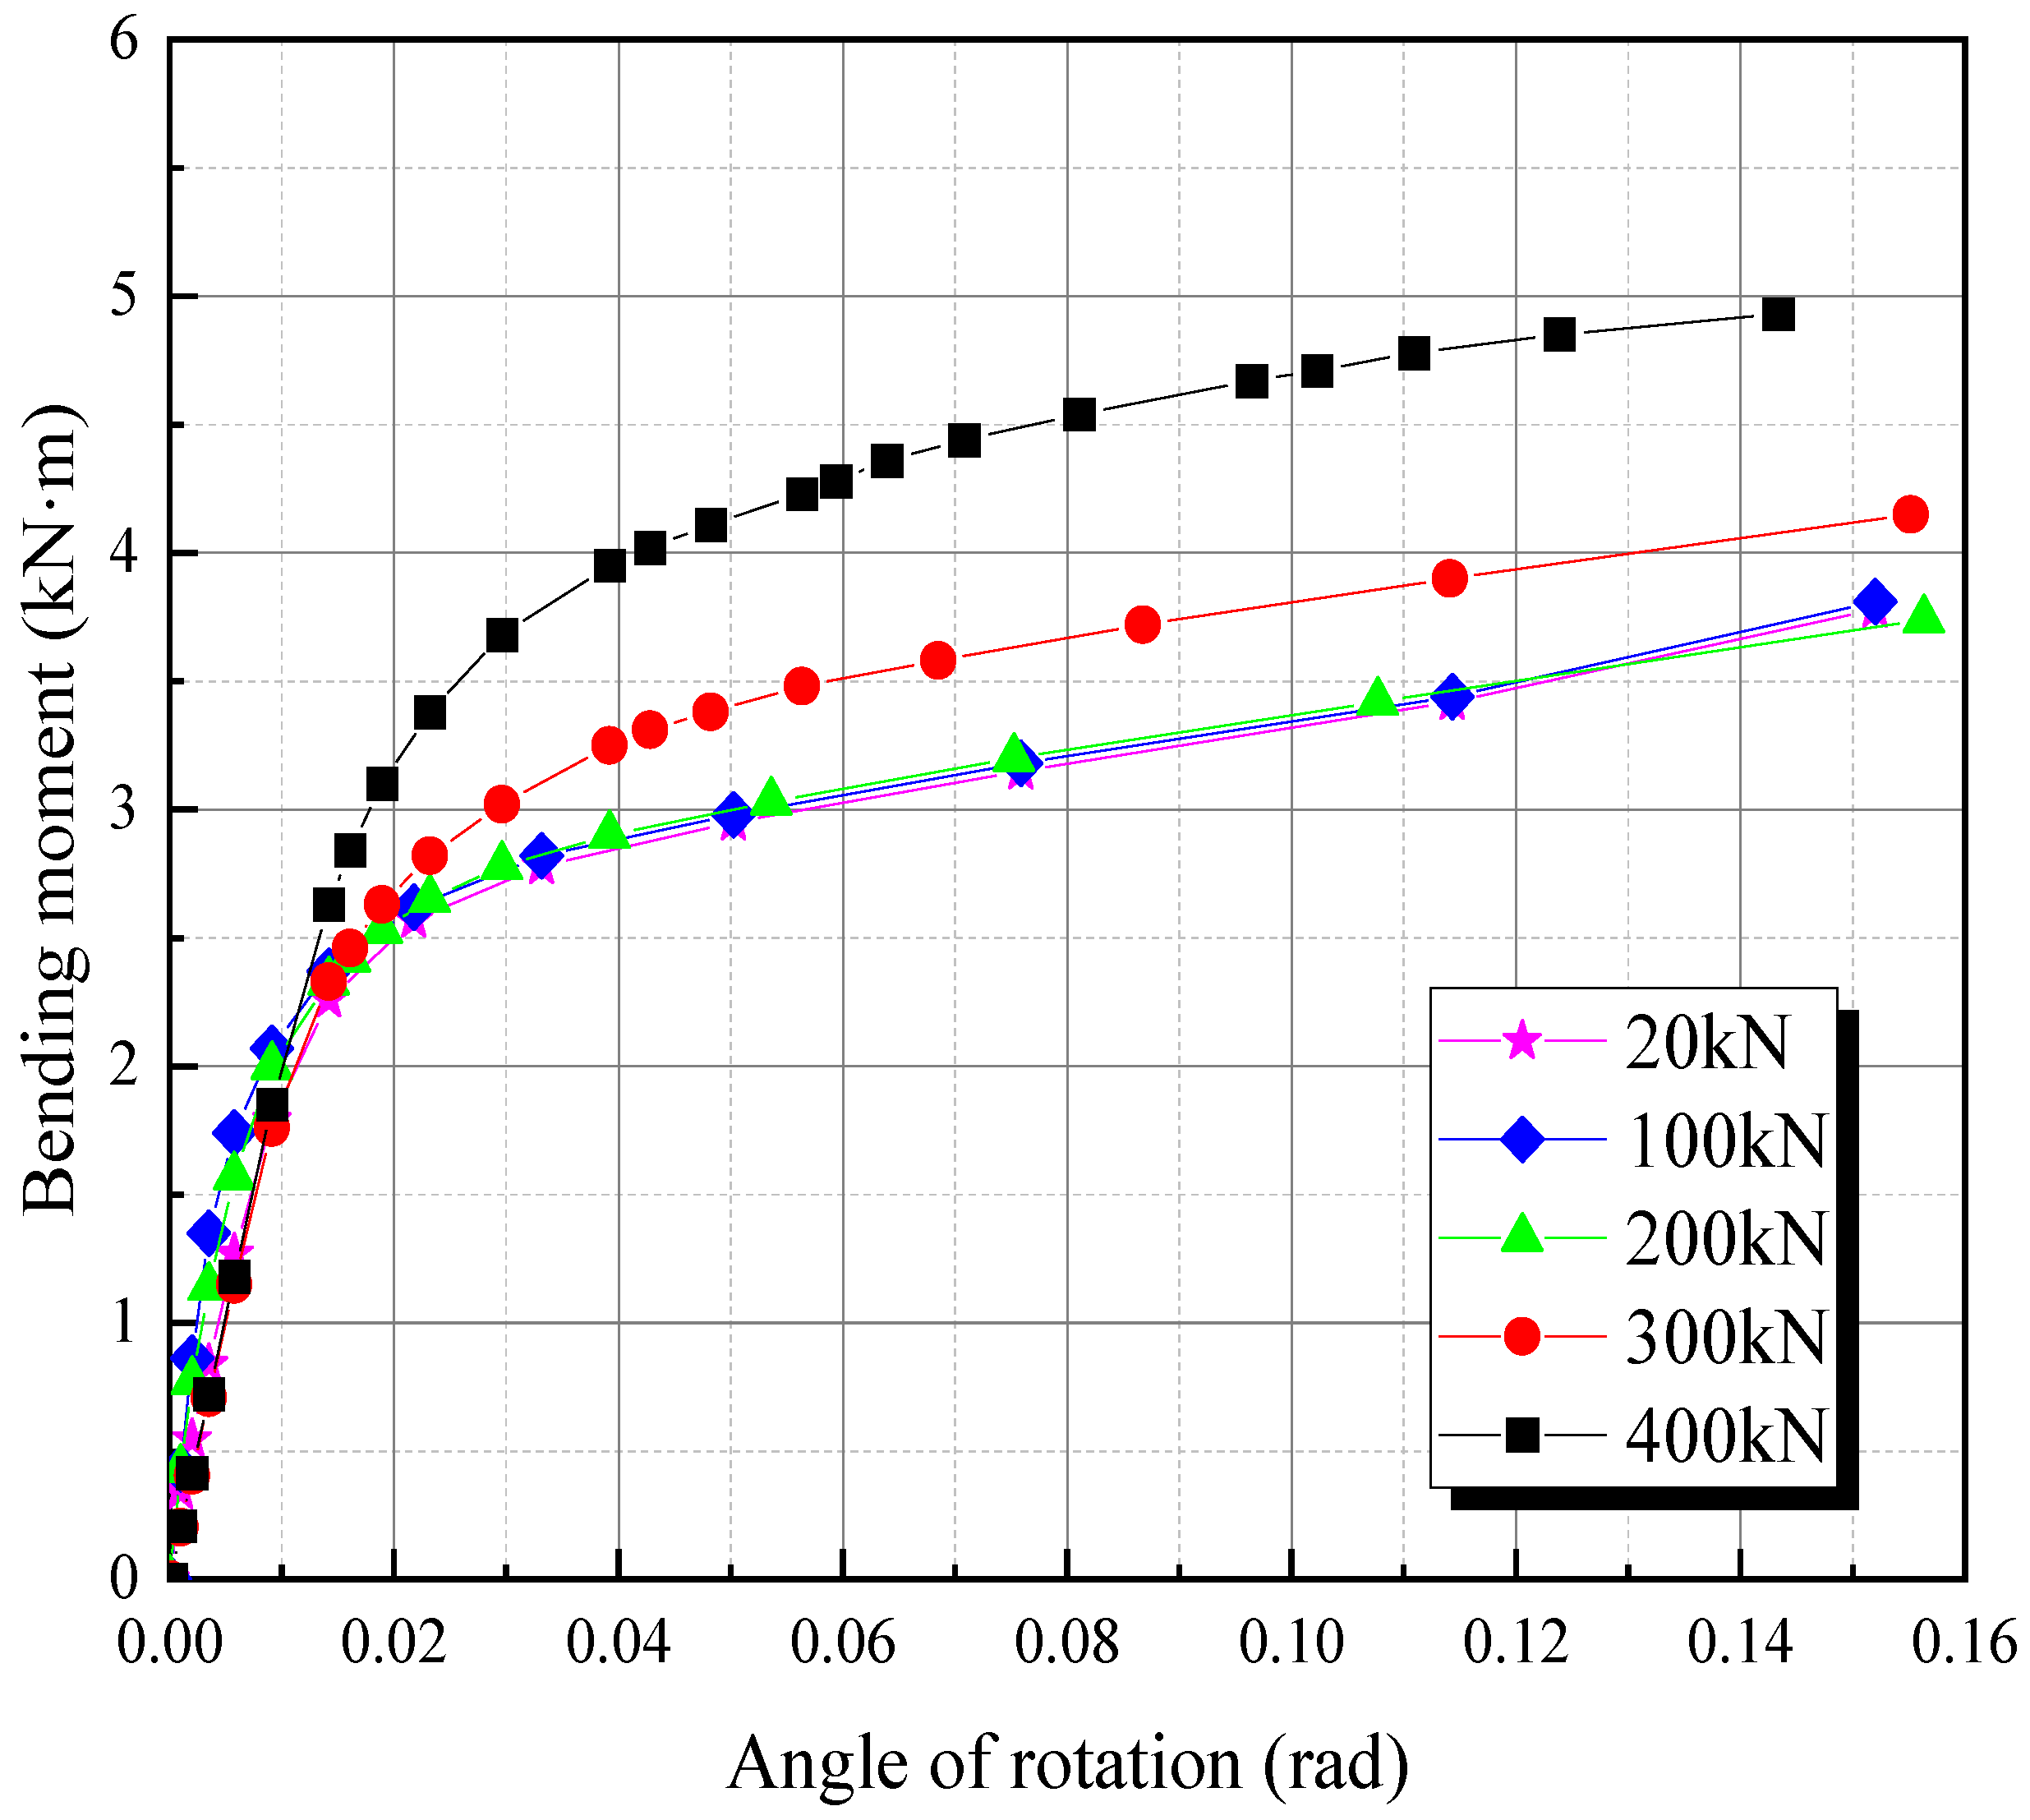
In this sub-section, the effect of preload loss on the ultimate flexural capacity is studied based on the above FE model. As mentioned above, no slip is assumed between the bolt and the sphere. It is also interesting to study how the modelling approach for the bolt–sphere’s interface behavior affects the calculated results. Three modelling approaches are adopted in the analysis. In the first approach, no slip is assumed between the bolt and the sphere. The tie constraint provided by ABAQUS is applied. In the second approach, the spatially varying clearances or overclosures are defined for the surface to describe the behavior of the bolt–sphere interface. By specifying the thread geometry data, i.e., the half-thread angle and pitch, the contact normal directions of a single-threaded bolt connection can be automatically generated. For the FE model presented below, the half-threaded angle and the pitch are taken to be 30° and 3 mm, respectively. In the third model, the geometry of the bolt threads is explicitly modelled, which represents the finest numerical model, as shown in Figure 13.
The FE results obtained from the above three different FE models are shown in Figure 14, Figure 15 and Figure 16. It can be found that with the increasing preload level, the ultimate flexural capacity increases. When the preload level is lower (i.e., lower than 200 kN), its effect on the load-carrying capacity is negligible. However, when the preload level exceeds 200 kN, the ultimate flexural capacity becomes increasingly sensitive to the preload level. All three modelling approaches yield similar results, which implies that in the practical application, the simplest approach (i.e., tie constraint) can predict the flexural behavior of BSJs with acceptable accuracy.

4. Conclusions

This paper presents a non-destructive evaluation of preload loss of the bolted spherical joint (BSJ) by means of a numerical simulation. The evaluation is on the basis of the time-reversed acoustics, in which an excited signal generated by a lead zirconate titanate (PZT) patch at the bolted sphere is reconstructed after the signal recorded by another PZT patch at the bar is time-reversed and re-emitted. To demonstrate the capability of the proposed method, a coupled electro-mechanical analysis is carried out using the general-purpose finite element software ABAQUS. In addition, the effect of preload loss on the ultimate flexural capacity of the bolted spherical joint is also studied numerically. Based on the above discussion, the following conclusion may be drawn:
(1)
It is found from the FE results that with the increasing preload levels, the contact areas of the sphere–sleeve interface and the sleeve–sealing plate interface enlarge. The subsequent coupled electro-mechanical analysis indicates that the amplitude of the focused signal is proportional to the preload level. The possible explanation is that the increase of the contact areas of the sphere–sleeve interface and the sleeve–sealing plate interface leads to the increase of the amount of energy focused on the source.
(2)
The FE model for examining the ultimate flexural capacity of BSJs is verified against the experimental data. Parametric analysis based on the verified FE model indicates that with the increasing preload level, the ultimate flexural capacity of the bolted spherical joint increases. When the preload level is lower, its effect on the load-carrying capacity is negligible. However, when the preload level exceeds a certain level, the ultimate flexural capacity becomes increasingly sensitive to the preload level.
(3)
Three approaches are adopted to model the bolt–sphere interface to explore its effect on the predicted ultimate flexural capacity. All three modelling approaches yield similar results, which implies that in practical application, the simplest approach (i.e., tie constraint) can predict the flexural behavior of bolted spherical joints with acceptable accuracy.
Generally, the discussion presented in this paper highlights the necessity for the rational evaluation of the preload loss of bolted spherical joints in practical applications.

Author Contributions

Conceptualization, Z.H. and Z.P.; software, Z.G., Z.Z. and Z.P.; validation, Z.G., Z.H. and Z.P.; investigation, Z.G. and Y.Y.; data curation, Z.G. and Z.H.; writing—original draft preparation, Z.H., Z.P. and Z.Z.; writing—review and editing, Z.G., Z.H. and Z.P. All authors have read and agreed to the published version of the manuscript.

Funding

This research was funded by the National Natural Science Foundation of China (Grant No. 52078368 and 52038010).

Data Availability Statement

Not applicable.

Conflicts of Interest

The authors declare no conflict of interest.

References

  1. Li, D.; Cui, S.; Zhang, J. Experimental investigation on reinforcing effects of engineered cementitious composites (ecc) on improving progressive collapse performance of planar frame structure. Constr. Build. Mater. 2022, 347, 128510. [Google Scholar] [CrossRef]
  2. Chen, W.; Xie, Y.; Guo, X.; Li, D. Experimental investigation of seismic performance of a hybrid beam—Column connection in a precast concrete frame. Buildings 2022, 12, 801. [Google Scholar] [CrossRef]
  3. Fan, F.; Ma, H.; Chen, G.; Shen, S. Experimental study of semi-rigid joint systems subjected to bending with and without axial force. J. Constr. Steel Res. 2012, 68, 126–137. [Google Scholar] [CrossRef]
  4. Miao, R.; Shen, R.; Zhang, S.; Xue, S. A Review of Bolt Tightening Force Measurement and Loosening Detection. Sensors 2020, 20, 3165. [Google Scholar] [CrossRef] [PubMed]
  5. Davoodi, M.R.; Amiri, J.V.; Gholampour, S.; Mostafavian, S.A. Determination of nonlinear behavior of a ball joint system by model updating. J. Constr. Steel Res. 2012, 71, 52–62. [Google Scholar] [CrossRef]
  6. Ebadi Jamkhaneh, M.; Homaioon Ebrahimi, A.; Shokri Amiri, M. Numerical Investigation of the Behavior of MERO Joint System Under Combined Loading Regarding Helical Threads of Elements. Int. J. Steel Struct. 2020, 20, 897–909. [Google Scholar] [CrossRef]
  7. Ebadi-Jamkhaneh, M.; Ahmadi, M. Comprehensive Investigations of the Effect of Bolt Tightness on Axial Behavior of a MERO Joint System: Experimental, FEM, and Soft Computing Approaches. J. Struct. Eng. 2021, 147, 04021197. [Google Scholar] [CrossRef]
  8. Lin, S.W.; Yi, T.H.; Li, H.N.; Ren, L. Damage detection in the cable structures of a bridge using the virtual distortion method. J. Bridge Eng. 2017, 22, 04017039. [Google Scholar] [CrossRef]
  9. Fink, M. Time reversal of ultrasonic fields. I. Basic principles. IEEE Trans. Ultrason. Ferroelectr. Freq. Control 1992, 39, 555–566. [Google Scholar] [CrossRef] [PubMed]
  10. Fink, M. Time Reversed Acoustics. Phys. Today 1997, 50, 34–40. [Google Scholar] [CrossRef]
  11. Leutenegger, T.; Dual, J. Non-destructive testing of tubes using a time reverse numerical simulation (TRNS) method. Ultrasonics 2004, 41, 811–822. [Google Scholar] [CrossRef] [PubMed]
  12. Du, G.; Kong, Q.; Wu, F.; Ruan, J.; Song, G. An experimental feasibility study of pipeline corrosion pit detection using a piezoceramic time reversal mirror. Smart Mater. Struct. 2016, 25, 037002. [Google Scholar] [CrossRef]
  13. Liang, Y.; Li, D.; Kong, Q.; Song, G. Load Monitoring of the Pin-Connected Structure Using Time Reversal Technique and Piezoceramic Transducers—A Feasibility Study. IEEE Sens. J. 2016, 16, 7958–7966. [Google Scholar] [CrossRef]
  14. Parvasi, S.M.; Ho, S.C.M.; Kong, Q.; Mousavi, R.; Song, G. Real time bolt preload monitoring using piezoceramic transducers and time reversal technique—A numerical study with experimental verification. Smart Mater. Struct. 2016, 25, 085015. [Google Scholar] [CrossRef]
  15. Tao, W.; Shaopeng, L.; Junhua, S.; Yourong, L. Health monitoring of bolted joints using the time reversal method and piezoelectric transducers. Smart Mater. Struct. 2016, 25, 025010. [Google Scholar] [CrossRef]
  16. Zhang, L.; Wang, C.; Huo, L.; Song, G. Health monitoring of cuplok scaffold joint connection using piezoceramic transducers and time reversal method. Smart Mater. Struct. 2016, 25, 035010. [Google Scholar] [CrossRef]
  17. Xu, J.; Wang, C.; Li, H.; Zhang, C.; Hao, J.; Fan, S. Health Monitoring of Bolted Spherical Joint Connection Based on Active Sensing Technique Using Piezoceramic Transducers. Sensors 2018, 18, 1727. [Google Scholar] [CrossRef] [PubMed] [Green Version]
  18. Sun, X.; Fan, S.; Liu, C. Multitype Damage Imaging in Concrete Modeling Based on Time Reversal Technique. Buildings 2022, 12, 430. [Google Scholar] [CrossRef]
  19. Yan, S.; Li, Y.; Zhang, S.; Song, G.; Zhao, P. Pipeline Damage Detection Using Piezoceramic Transducers: Numerical Analyses with Experimental Validation. Sensors 2018, 18, 2106. [Google Scholar] [CrossRef] [PubMed]
  20. Fan, F.; Ma, H.; Shen, S. Numerical simulation and experimental study on mechanical characters of bolt-ball joint system. Eng. Mech. 2009, 26, 92–99. (In Chinese) [Google Scholar]
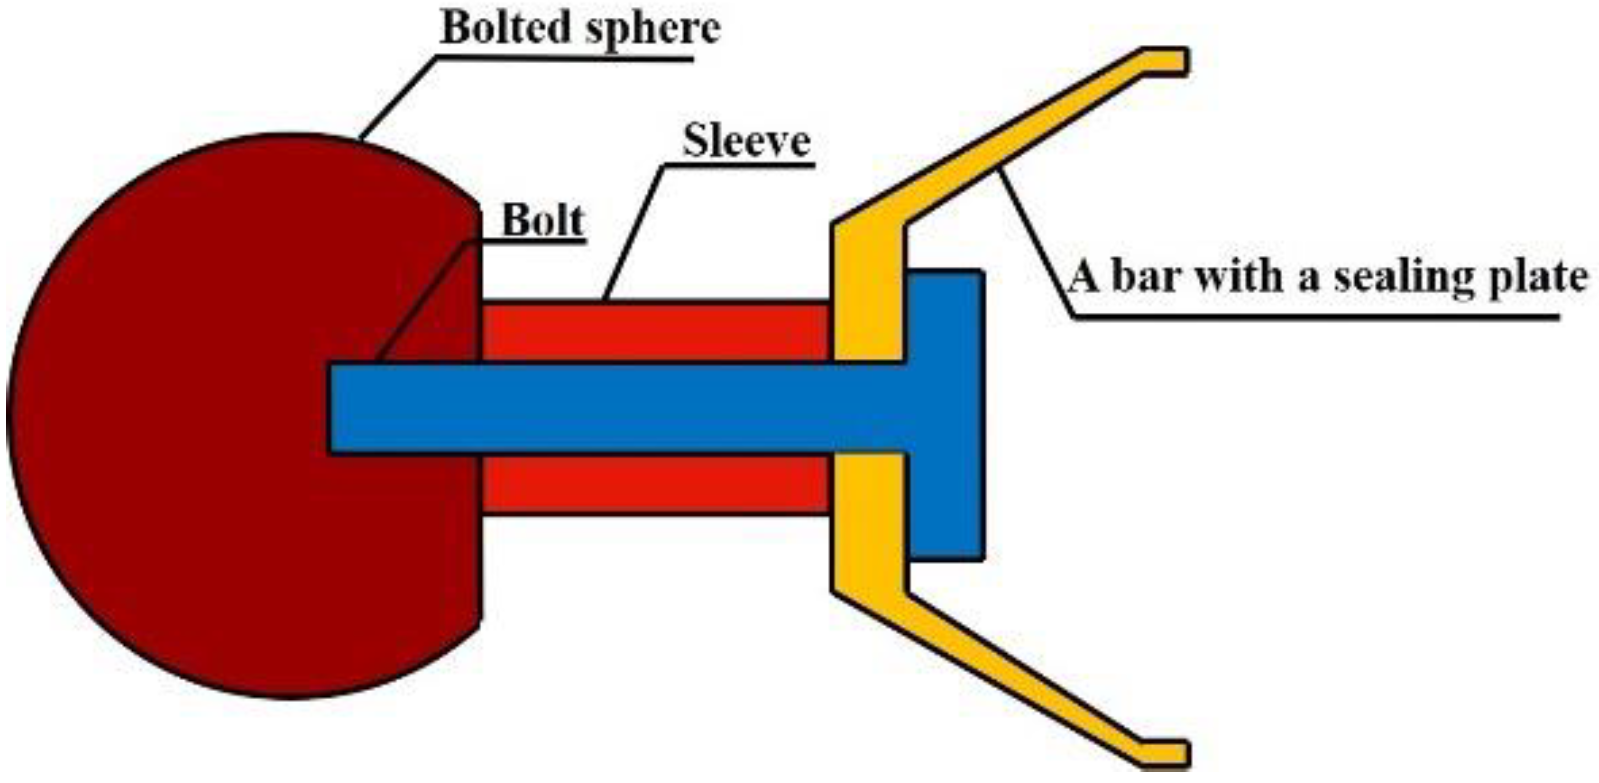
Figure 1. Bolted spherical joint.
Buildings 13 00127 g001
Figure 2. Schematic diagram of the concept of non-destructive evaluation of preload loss of the bolted spherical joint based on TRA.
Buildings 13 00127 g002
Figure 3. FE model for the bolted spherical joint.
Buildings 13 00127 g003
Figure 4. Gaussian pulse signal.
Buildings 13 00127 g004
Figure 5. Contact areas of the sphere–sleeve interfaces.
Buildings 13 00127 g005
Figure 6. Contact areas of the sleeve–sealing plate interfaces.
Buildings 13 00127 g006
Figure 7. Reconstructed signals from the FE models with various preload levels. (a) Preload level of 5 kN. (b) Preload level of 7.5 kN. (c) Preload level of 10 kN. (d) Preload level of 12.5 kN. (e) Preload level of 15 kN. (f) Preload level of 17.5 kN. (g) Preload level of 20 kN.
Buildings 13 00127 g007
Figure 8. Relationship between the amplitude of the focused signal and the preload level.
Buildings 13 00127 g008
Figure 9. Test setup for examining the flexural behavior of the bolted joint [20].
Buildings 13 00127 g009
Figure 10. FE model for calculating the ultimate flexural capacity.
Buildings 13 00127 g010
Figure 11. Comparison between numerical and experimental moment-rotation curves.
Buildings 13 00127 g011
Figure 12. Comparison between numerical and experimental deformed shapes.
Buildings 13 00127 g012
Figure 13. FE model for the bolt threads.
Buildings 13 00127 g013
Figure 14. Moment-rotation curves from the first FE model using tie constraint.
Buildings 13 00127 g014
Figure 15. Moment-rotation curves from the second FE model based on spatially varying clearances or overclosures.
Buildings 13 00127 g015
Figure 16. Moment-rotation curves from the third FE model in which the bolt threads are explicitly modelled.
Buildings 13 00127 g016
Table 1. Mechanical and electrical parameters of PZT materials.
Dielectric Constants
(F/m)
Elastic Constants
(N/m2)
Piezoelectric Constants
(C/m2)
Density
(kg/m3)
D11 = 8.11 × 10⁻⁹
D22 = 8.11 × 10⁻⁹
D33 = 7.35 × 10⁻⁹
D1111 = 1.21 × 10¹¹
D1122 = 7.54 × 10¹⁰
D2222 = 1.21 × 10¹¹
D1133 = 7.52 × 10¹⁰
D2233 = 7.52 × 10¹⁰
D3333 = 1.11 × 10¹¹
D1212 = 2.26 × 10¹⁰
D1313 = 2.11 × 10¹⁰
D2323 = 2.11 × 10¹⁰
e2 23 = 12.3
e3 11 = −5.4
e1 13 = 12.3
e3 22 = −5.4
e3 33 = 15.8
7600
Disclaimer/Publisher’s Note: The statements, opinions and data contained in all publications are solely those of the individual author(s) and contributor(s) and not of MDPI and/or the editor(s). MDPI and/or the editor(s) disclaim responsibility for any injury to people or property resulting from any ideas, methods, instructions or products referred to in the content.