Abstract
This paper presents quantitative information on the effectiveness of seismic retrofit solutions using bilinear oil dampers for seismically deficient existing tall steel buildings. For this purpose, a benchmark 40-story steel space moment-resisting frame building is studied that represents 1970s design practice in North America. Rigorous seismic performance assessment based on ASCE 41 recommendations reveals a high collapse risk for the existing building. The local engineering demand parameters are comprehensively assessed to quantify the impact of seismic retrofit on steel columns and column splices, which are particularly vulnerable due to the time of construction. Multiple retrofit schemes are explored with numerous damping levels and vertical damping distribution methods. The dampers are designed via a recently developed multi-degree-of-freedom performance curves method. A new balanced vertical damping method is proposed to account for the effects of frame inelasticity. This strongly depends on the supplemental damping level, and it determines the effectiveness of the employed vertical damping distribution method. The results indicate that the proposed retrofit strategies can minimize the collapse risk of the tall building. It is shown that the balanced vertical damping distribution method provides the most uniform drift distribution along the building height. Despite the reduction in story drift ratios, the axial force demand in exterior columns remains relatively high in the bottom stories regardless of the seismic retrofit solution. On the other hand, bilinear oil dampers produce relative constant forces despite exhibiting higher velocity demands than expected.
1. Introduction
Several tall buildings were constructed between 1960 and 1990 in seismic regions of the West Coast of North America. Particularly those with more than 35 stories consist of steel space moment-resisting frames (MRFs) [1]. Many of these buildings were designed according to standards [2], in which the seismic design loads were not based on a detailed seismic hazard assessment. Past studies [3,4,5,6,7,8] have demonstrated the seismic vulnerability of existing steel MRF buildings due to inadequate seismic detailing. More recently, the focus has been on the seismic performance of existing tall buildings [9,10,11,12,13]. The general consensus from the above studies is that these buildings are typically seismically deficient. Particular issues of concern relate to the (a) relatively high compressive axial force demands in exterior columns [11], (b) the large tensile axial force demands that may result in widespread fractures of PJP splice weld connections, and (c) the collapse risk, which may be high. Moreover, requirements for dynamic analysis were not available in the building codes of the time [2]. Hence, higher mode effects may be an additional concern in the seismic deficiency of these buildings.
Conventional seismic retrofitting techniques for tall buildings, such as stiffening, generally lead to an increase in the force demands on the structural members. Strengthening of framing members as well as the foundation system of the building is inevitable in this case [14]. Instead, energy dissipation devices may be effectively utilized. For instance, the use of fluid viscous dampers is fairly common in the retrofitting of existing buildings [11,15,16,17,18,19].
Oil dampers with a relief valve (i.e., bilinear oil dampers) have been widely used in several buildings in Japan [20,21,22,23,24]. Field reconnaissance from past earthquakes [25] demonstrated the effectiveness of bilinear oil dampers in controlling the seismic performance of high-rise buildings.
In North America, guidance for the design and assessment of energy dissipation devices for buildings can be found in ASCE 7-16 [26] and ASCE 41-17 [27]. Nonetheless, the focus of these guidelines is mainly on low- to mid-rise buildings. More recently, other guidelines have been developed for the performance-based design and assessment of tall buildings [28,29,30], however, the challenge on how to effectively retrofit existing tall buildings still remains. While a handful of studies have shown that the implementation of damper and seismic isolation technologies [10,11] is effective in retrofitting tall buildings, the use of oil dampers with relief valves has never been explored. This is an important aspect when it comes to capping of the axial force demands in steel columns, seismically deficient column splices [31,32], as well as the foundation system.
The motivation for this study is to promote the use of bilinear oil dampers for the seismic retrofitting of existing tall buildings. To this end, a comprehensive discussion on the retrofit strategies is provided to further guide the researchers and structural engineers. For this purpose, a prototype 40-story steel MRF building is used as a benchmark. The seismic performance of the prototype building is first assessed through nonlinear analyses to identify the primary seismic deficiencies of the prototype building and better inform the selection of effective retrofit schemes. The effects of various damping levels and vertical distribution methods on the building’s performance are then assessed. A vertical damping distribution method is proposed to address retrofit cases where the steel MRF exhibits inelastic behavior during an earthquake. A comprehensive discussion on the effectiveness of various seismic retrofit strategies on global and local engineering parameters is provided.
2. Prototype Tall Building
Tall steel buildings designed in 1970s featured space frames [9,11,33]. Figure 1a shows the plan view of the prototype building to be used hereinafter. The lateral load-resisting system of the building is comprised of steel MRFs in both loading directions. Figure 1b shows the elevation view of the exterior steel MRF. The prototype building consists of 43 stories, including three stories below the ground floor. The total height of the building is 154.7 m above the ground level (see Figure 1). The typical story height is 3 m (10 ft), while the story heights at the ground and basement levels are 6.1 m (20 ft) and 3.8 m (12.5 ft), respectively. A 76 mm (3 in.) thick concrete slab on 63.5 mm (2.5 in) metal deck supported by steel beams forms the floor system at each level. The design location of the building is 37.7897 °N, 122.4003 °E; the corresponding soil type classification is D at the design location of interest based on the NEHRP provisions [34].
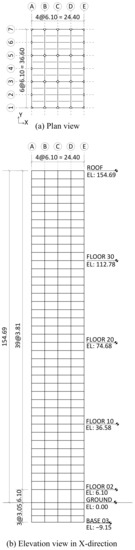
Figure 1.
(a) Floor plan and (b) elevation views of the building, with dimensions in m.
According to UBC (1973), the wind base shear was found as = 0.027 and 0.018 in the X- and Y- loading directions, respectively. The seismic design was based on the equivalent lateral force method. It was found that the total seismic force coefficient was = 0.021. In the X-direction, the wind base shear is about 1.6 times larger than the seismic base shear, whereas, in the Y-direction, they are almost equal. Notably, in the X-loading direction, the seismic load governs the design in the upper stories of the building. According to the accepted design practice of the time, the allowable story drift ratio under wind and earthquake loads was limited to 0.25% to 0.5%, respectively [10,35].
In the prototype building, steel beams featured ASTM A36 steel wide flange cross-sections (i.e., nominal yield stress, Fy = 248 MPa), and welded box columns. These were typically made of ASTM A36 and/or ASTM A572 Gr. 42 (i.e., nominal yield stress, Fy = 290 MPa) steel. The modulus of elasticity of the steel material E was assumed to be 200 GPa in all cases. Material properties for steel components are obtained from Tables 9.1 and 9.3 (1961–1990, Group 1) of ASCE 41-17 [27]. Columns were spliced at every three stories. The column splices were placed at 1.2 m (4 ft) above the respective floor. Column splices featured partial joint penetration groove (PJP) welds to reflect the design practice of the time of construction [36]. Moreover, member design was based on allowable stress design [37]. The above design assumptions and fabrication detailing were found to be representative of tall building designs in the 1970s in North America [9,11,33].
For design purposes, a three-dimensional (3D) model of the prototype building was constructed in ETABS [38]. The prototype building design was mainly governed by the drift limitation due to the wind load, particularly in the X-loading direction. This was more critical in the bottom stories of the building. The upper floor beams were sized according to their flexural strength to satisfy the seismic loading requirements. This led to appreciable overstrength in the lower stories, where stress ratios in this case were generally below 70%. The peak gravity-induced axial load ratio, Pc,G/Pye,c (i.e., Pye,c is the expected yield strength of the columns) was 32% at the ninth story. The peak Pc,G/Pye,c ratio is comparable with prior work on existing tall buildings [9].
Capacity design was not common in UBC 1973 [2]; thus, the steel MRFs, particularly in the X-direction, have very low strong-column/weak-beam (SCWB) ratios (i.e., on average, 0.4 in the exterior column of the lower half of the building). This suggests that exterior column moment capacities may be exceeded during earthquakes with a low probability of occurrence. Comprehensive details regarding the design of the prototype building, ETABS modelling, and analysis can be found in Akcelyan [39].
3. Nonlinear Building Model
The prototype building is considered to be in Risk Category 2. It also features several seismic deficiencies in its members and connections. Because of the number of stories, a Tier 3 systemic evaluation of the building is required, as per ASCE 41-13 [40]. Therefore, rigorous nonlinear response history analysis (NRHA) is employed to assess the seismic performance of the building in a more rigorous manner. Nevertheless, nonlinear static analysis is also conducted for a preliminary seismic assessment of the building.
Two-dimensional (2D) nonlinear building models in the X- and Y-loading directions are developed in the OpenSees simulation platform [41]. Due to the symmetry and the odd number of the lateral load resisting frame systems in the X-loading direction, the nonlinear building model in the X-loading direction comprises two frames (1–1 and 3–3) with a leaning column in series. In the Y-loading direction, all five frames are explicitly modeled in series. Soil–structure interaction is neglected. The floors at and below the ground level are assumed to be restrained in the horizontal loading direction. A rigid diaphragm action is considered at each floor. Geometric nonlinearities are considered with the P-delta transformation.
Beams are modeled using an elastic beam-column element with zero-length spring elements at their ends that feature the Ibarra–Medina–Krawinkler deterioration model [42]. The moment–rotation relation of these springs employs three modeling cases. The first case is called ‘brittle’. The input model parameters in this case represent those of typical pre-Northridge beam-to-column connections according to the modelling procedures summarized in Hartloper [43] and ASCE 41-13 [40]. In the second case (the so-called ‘ductile’), we utilized the moment–rotation relation of typical welded fully-restrained beam-to-column connections according to Lignos and Krawinkler [44]. Finally, the third case (i.e., the base-case model), assumes that only 25% of the beam-to-column connections are ductile and the rest is brittle. This agrees with prior studies regarding the seismic behavior of existing tall buildings (Muto and Krishnan [6] as well as surveys from actual steel MRF buildings that experienced the 1994 Northridge earthquake [45]. The ductile beam-to-column connection locations are randomly distributed for the X- and Y-loading directions, respectively.
The built-up box columns are modeled with force-based beam-column elements with five integration points along the length of a single element. If a column splice connection exists, the columns are modeled with two elements connected at 1.2 m (4 ft) above the lower floor level. The steel cross-sections are discretized with 50 fibers (5 fibers for the flange and 20 fibers for the web) in parallel to the axis of bending. The Giuffré–Menegotto–Pinto [46] steel material model is assigned at each fiber element to capture the inelastic cyclic straining. The columns feature stocky cross-sections (width-to-thickness ratios of 27 or less). As such, the hysteretic behavior of these members is non-degrading [47] until relatively large lateral drift demands (i.e., 5–6% rads) occur. Expected material properties have been considered in all cases [40]. The strain hardening ratio was taken as 2% [44]. The nonlinear behavior of column splices is not explicitly modeled. However, the stress–strain histories of the outer cross-sectional fibers were recorded right above the location of the column splice to assess the likelihood of premature fractures at this location. The methodology proposed by Galasso et al. [31] was adopted for this purpose. The beam-to-column web panel zone zones are modeled with the parallelogram model by Gupta and Krawinkler [48]. The panel zone response is idealized with the Krawinkler [49] model.
Eigenvalue analysis is conducted after the gravity load application. The fundamental translational period in the X- and Y-loading directions are found to be 5.29 and 5.25 s, respectively, based on the OpenSees models.
4. Seismic Performance Assessment of the Prototype Tall Building per ASCE-41
Pushover analysis is first carried out in both loading directions based on the first mode lateral load pattern per loading direction to provide first insight on the building behavior under lateral loading. Rigorous NRHA is also conducted to depict important response characteristics of the building due to higher mode effects among others. For the sake of brevity, results are presented only for the X-loading direction. However, a detailed seismic assessment of the Y-loading direction can be found in Akcelyan [39].
4.1. Nonlinear Static Analysis
Figure 2 shows the pushover curves based on a first mode lateral load pattern and the peak story drift ratios (SDRs) from the “Ductile”, “Base Case” and “Brittle” cases. The green, red, and black points in the pushover curves highlight the analysis steps, at which initial yielding, capping and collapse occurred, respectively. In addition to these characteristic points, two intermediate points (blue and brown) are added to further track the change in the story drift ratio profiles. In all cases, flexural yielding of the first-floor beams occurs at a base shear force of 0.06 W, at about 0.5–0.6% roof drift ratio in both loading directions. The peak base shear ranges from 0.09 W to 0.1 W, depending on the model type. The low base shear coefficients are indicative that the structure is wind controlled. Figure 2b–d demonstrate characteristic peak SDRs along the building height for the three analyzed cases. Up to the peak response, the lateral drift profiles remain more-or-less uniform. Upon further lateral loading, the steel MRFs attain a negative stiffness (see Figure 2a) due to the formation of soft story mechanisms between stories 9 and 20, regardless of the employed modeling case. Qualitatively, a similar response is observed in the Y-loading direction. However, in this case a story collapse mechanism forms in between stories 5 to 13. While capacity design is not respected in a strict sense due to the lack of relevant code requirements at the time of construction, the observed behavior is deemed rational based on prior studies on steel MRFs due to their susceptibility to P-delta effects [48,50,51]. On the other hand, limitations on the applicability of pushover analysis to assess the seismic performance of structures at large deformations have been pointed out [52,53]. In that respect, rigorous NRHA is conducted for the same building.
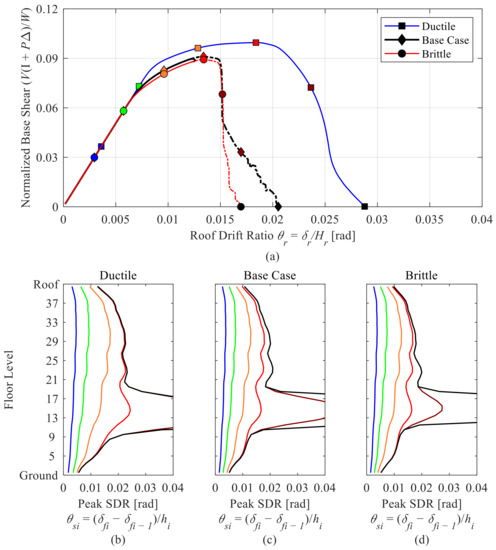
Figure 2.
Comparison of pushover curves and story drift ratios for in the X-loading direction, (a) pushover curves, (b) story drift ratios for ductile case, (c) story drift ratios for base case, (d) story drift ratios for brittle case.
4.2. Nonlinear Response History Analysis
The performance-based seismic assessment via NRHA is conducted for the 2D “Base Case” models of the prototype building in both loading directions. Viscous damping is idealized with the Rayleigh damping model based on the first and sixth translational modes of the 2D models in the loading direction of interest. The critical damping ratio is assumed to be 1.5% for both modes, as suggested in PEER/ATC [54]. The ground motions selected for seismic assessment and detailed analysis results, including the global and local engineering demand parameters (EDPs), are discussed in the following sections.
4.2.1. Ground Motion Selection
According to Tier 3 procedure [40], the evaluation of existing buildings should be carried out for the BSE-1E and BSE-2E hazard levels. These correspond to a probability of exceedance of 20% and 5% in 50 years (i.e., mean return periods of 225 and 975 years, respectively). Ground motion selection is carried out based on the procedures discussed in NIST [55]. To reliably estimate the building’s EDPs of interest and characterize the associated building response dispersion, 40 ground motion records were selected from the NGA-West2 ground motion database [56]. According to disaggregation data at the predominant period, Tn, of the building (i.e., Tn = 5 s), the primary seismic hazard source is the San Andreas Fault. The selected ground motions are from 15 different seismic events. At most, six records are selected from the same seismic event. The selected ground motions are generated by earthquakes having moment magnitudes between 6.2 and 7.6. A median shear wave velocity of about 245 m/s represents the shear wave velocity interval of D-type soil. Only magnitude scaling is employed. The maximum scale factor to be applied for the BSE-2E level in all ground motions should be less than 5.0 for NRHA. Indicatively, the mean values of the scale factors to be used at BSE-2E and BSE-1E levels are 3.1 and 2.0, respectively. Ground motion records are scaled such that the mean spectral ordinate of the 5% damped response spectrum is not less than that of the 5% damped target spectrum over a period range from 0.2 Tn to 1.5 Tn. Figure 3 show the absolute acceleration response spectra of the selected and scaled ground motion records, including their mean spectra. In the same figures, the target spectra at BSE-2E level are superimposed for comparison purposes.
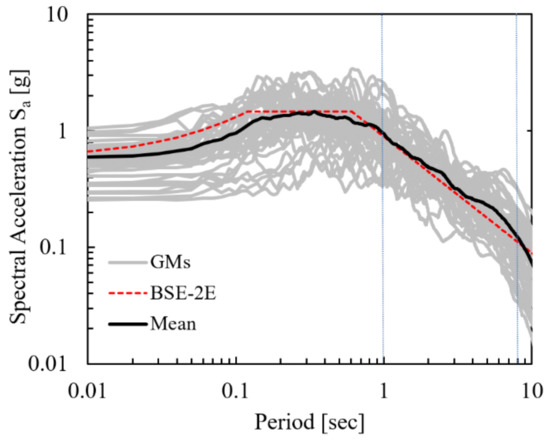
Figure 3.
5% damped response spectra of selected and scaled ground motions in comparison with ASCE-41-13 target spectrum for two-dimensional analyses; BSE-2E level.
4.2.2. Assessment of Global Engineering Demand Parameters
Figure 4 and Figure 5 show the peak SDRs, peak normalized story shear forces, and the maximum absolute floor accelerations in the X loading direction of the building for the BSE-1E and BSE-2E seismic intensities, respectively. Superimposed in the same figure are the median, as well as the 16th and 84th percentiles of the same EDPs.
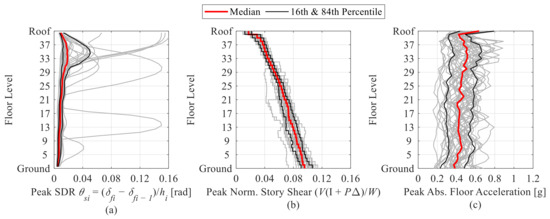
Figure 4.
Engineering demand parameters in the X-loading direction (BSE-1E), (a) peak SDR, (b) peak normalized story shear force, (c) peak absolute floor acceleration.
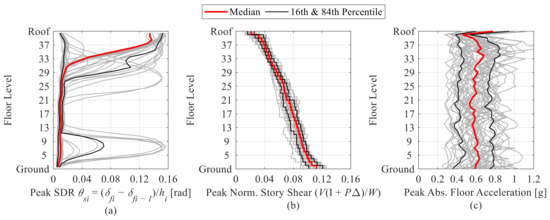
Figure 5.
Engineering demand parameters in the X-loading direction (BSE-2E), (a) peak SDR, (b) peak normalized story shear force, (c) peak absolute floor acceleration.
At the BSE-2E level, the probability of collapse of the building is 72% and 32% in the X- and Y-loading directions, respectively, which is deemed to be high according to modern seismic standards [26]. At the BSE-1E seismic intensity, the probability of collapse of the same building in the X-loading direction is more than 10%, whereas no collapses occurred in the Y-loading direction.
Referring to Figure 5a, the dynamic response of the building is mainly controlled by collapses occurring in the upper stories of the building. In only six of the analyzed ground motions, the same building experiences drift concentrations in its bottom stories. The upper story collapse mechanisms are primarily attributed to (a) the high axial deformation of columns and shorter frame dimensions, and (b) the flexural frame deformation, which is significantly larger in the X- than in the Y-loading direction. This causes relatively high story drift ratios in the upper stories, which are amplified by P-delta effects.
Referring to Figure 5b, the median dynamic base shear of the building is about 0.10 W at the BSE-2E level. The story shear pattern depicts the dynamic amplification due to higher mode effects. Figure 5c suggests that the median peak absolute floor acceleration demands along the height of the building are nearly uniform and around 0.6 g at the same seismic intensity. Referring to Figure 4c, the median value at BSE-1E is 0.4 g, which could potentially be an issue for damage control of acceleration-sensitive non-structural elements.
4.2.3. Assessment of Local Engineering Demand Parameters
This section puts emphasis on the seismic assessment of local EDPs, which are deemed critical for seismic retrofitting of existing tall steel buildings [57]. These EDPs include the beam plastic rotations, the column axial force demands, and the corresponding longitudinal stress demands in column splices. For the sake of brevity, only the response at the BSE-2E level in the X-loading direction is shown.
The plastic rotation of each beam is recorded and compared with characteristic values at yield, peak, and ultimate according to the definitions of ASCE 41 [40]. The beam end moment demands exceed their effective yield moment capacity in most cases. Figure 6a shows the peak beam plastic rotation at each level for the set of 40 ground motions. Interestingly, based on the 84th percentile response, the beams above the 28th floor exceed their ultimate rotation capacity. The same findings hold true for beams between floors 5 and 10. The above observations further explain the observed collapse modes discussed earlier. It is noteworthy that beams located between floors 11 and 27 exhibit flexural yielding but not their peak flexural resistance.
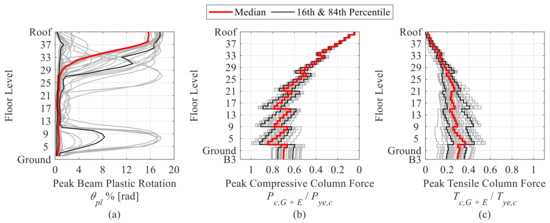
Figure 6.
(a) Peak beam plastic rotations, (b) normalized peak compressive, and (c) tensile column forces (BSE-2E).
Figure 6b,c depicts the normalized peak compressive (Pc,G+E/Pye,c ratios) and tensile force demands (Tc,G+E/Tye,c ratios) at BSE-2E. The simulation results suggest that the column axial force demands are significantly higher in the X-loading direction relative to those in the Y-loading direction due to the smaller number of bays. The exterior columns experience high axial load demands due to the dynamic overturning effects. From Figure 6b,c, higher force demands are typically observed in lower stories. The highest values are observed in the third-story exterior columns. Interestingly, the peak compressive axial load ratio reached the squash load (see Figure 6b), while the corresponding tensile force exceeded 0.5 Tye,c. (see Figure 6c).
Figure 7a shows for 1–1 MRF the median peak normalized column compressive load demands. The third-story exterior columns (including the 3–3 frame) are subjected to variable axial load demands ranging, on average, from 0.8 Pye,c in compression to 0.3 Tye,c in tension. The compressive force in the interior columns is less than 0.5 Pye,c. The normalized axial force component of the gravity load for columns PG/Pye < 0.6; hence, the steel columns are not considered to be force-controlled as per ASCE 41-17 [27].
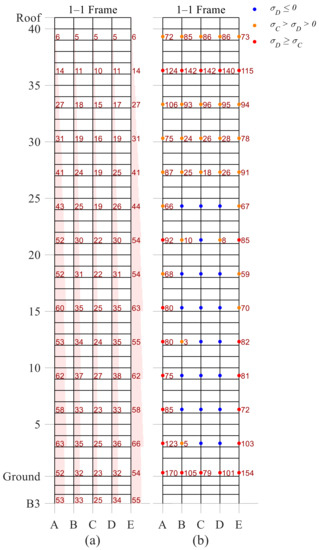
Figure 7.
(a) Median column normalized peak compressive forces and median peak (%), (b) tensile stresses at column splices as built (MPa) (BSE-2E).
4.3. Column Splice Demands
Bruneau and Mahin [36] demonstrated that column splices in existing steel buildings that feature PJP welds may be susceptible to brittle fracture. In prior works [31,32], it was shown that these fractures depend on the peak flange tensile stress demands of the column splices as well as their estimated flange stress capacity, σC, prior to fracture. Material and geometric properties associated with the material toughness, the crack length, and the flange thickness of the upper and lower columns are imperative in this case. Figure 7b indicates the locations of column splices and their peak tensile stresses in MPa, σD, recorded at the fiber extremity of the smallest of the two column cross-sections forming a column splice in the X-loading direction. Due to dynamic overturning effects, all exterior column splices at the lower half and the upper stories of the building exhibit tensile stresses (see Figure 7b). The σD values correspond to median peak tensile stresses. The blue dots represent sections where no tensile stresses are observed. Sections with peak tensile stresses are highlighted with orange dots. The peak stresses that exceed the estimated stress capacity, σC, [11,31,32] are highlighted in red. The simulation results suggest that about 35% of the column splices are potentially vulnerable to brittle fracture at a BSE-2E seismic intensity.
The use of space frames allows for shallow beam designs. This, in conjunction with the relatively thick webs (i.e., above 70 mm) of the box columns, results in an elastic behavior of the panel zones regardless of the seismic intensity. This is an important observation on the role of the panel zone response on the observed behavioral characteristics of the prototype building.
5. Retrofit Solutions
Traditional seismic rehabilitation techniques, such as stiffening, may result in increased seismic forces, which are not desirable in flexible structures, such as that analyzed herein. While base isolation techniques are effective in seismic force reduction, they may not be always effective for long-period buildings. For this purpose, velocity-dependent energy dissipation devices may be an interesting alternative. In prior work, nonlinear viscous dampers have been widely used for retrofitting existing tall buildings [11,58]. In the present study, we explore the use of bilinear oil dampers, as their force-suppressing mechanism can efficiently control seismic force demands on columns, which is a major concern in this case. Additionally, bilinear oil dampers can provide linear supplemental damping at low and moderate ground shaking intensities. For retrofitting of existing steel moment-resisting frame buildings, oil dampers with relief valves can be installed in a diagonal brace configuration. The damper–brace assembly typically consists of a hollow section steel brace, which features a clevis that is connected to a gusset plate at the ends. The design and modelling details of such damper–brace assembly has been demonstrated in Akcelyan et al. [59].
5.1. Design Objectives for Retrofit
Buildings in Risk Category II as per ASCE 7-10 [60] should meet the damage control and safety requirements at BSE-1E and BSE-2E, respectively [40]. Within such a context, the building does not meet any of the above requirements and should be retrofitted.
The retrofit aims to minimize the inelastic deformations within the steel MRFs and reduce the probability of collapse from 72% to 10% at BSE-2E level without significantly increasing the seismic force demands. To this end, multiple retrofit options are explored by implementing bilinear oil dampers. This is achieved by exploring different damping levels and damping distribution methods.
5.2. Bilinear Oil Dampers
Bilinear oil dampers possess a relief mechanism, which suppresses the damper forces once the damper relief load, is exceeded. Thus, it generates a bilinear force–velocity relation, , which can be expressed as follows in Equation (1):
where is the initial damping coefficient, and is the relief velocity (). The post-relief damping coefficient ratio, p, is the ratio of the initial damping coefficient to the post-relief damping coefficient. Under sinusoidal excitation with loading circular frequency , the peak damper force, , can be computed as follows in Equation (2):
where is the loss stiffness of the damper (, is the peak damper velocity ratio, and is the peak damper displacement. To produce a bilinear force–velocity response, the dampers should be designed such that While Equations (1) and (2) reflect the behavior of a pure bilinear dashpot, in reality, dampers as an assembly contain a combined axial stiffness, , due to the internal damper portion, , and supporting members, . Past research [22] revealed that the damper loss stiffness to frame shear stiffness ratio and the damper supporting stiffness to frame shear stiffness ratio are critical for determining an effective retrofit solution. The following section discusses the determination of these parameters by means of a multi-degree-of-freedom (MDF) performance curve method.
5.3. Multi-Degree-of-Freedom Performance Curves
The authors have proposed a MDF performance curves method that allows for the quick exploitation of a wide range of potential damper parameters to be used in seismic retrofitting of existing tall buildings [59]. In the MDF performance curves method, the ratio is the key iterative single-degree-of-freedom (SDF) design parameter to satisfy target seismic performance objectives for the retrofitted building. The ratio is assumed to be dependent on by setting a constant ratio, because, in practice, a higher damper capacity typically requires a higher damper supporting brace stiffness. To generate an MDF performance curve, several damper-specific parameters should be predetermined based on available damper products and considering the dynamic properties of the building to be retrofitted. These parameters are ratio, the internal damper stiffness-to-damping coefficient ratio, , the post-relief damping coefficient ratio, p, and the peak damper velocity ratio, . The validity of these predetermined SDF parameters should be checked once the damper design is finalized.
To assess the effect of different values on the building response reduction, MDF performance curves are generated for peak SDR, peak roof drift ratio, peak absolute floor acceleration (PFA), and peak base shear, as shown in Figure 8a. Based on the MDF performance curves method, a damper loss stiffness to frame shear stiffness ratio , corresponding to a highly damped building. This choice may not be economically feasible or practical. On the other hand, very low supplemental damping (i.e., 0.1) may not improve the seismic behavior of a seismically deficient building. A damage-free response may be achieved if the roof drift ratio remains within 0.5%, as observed from the nonlinear static analysis (see Figure 2a). This corresponds to a required peak roof drift ratio reduction factor of about 0.3.
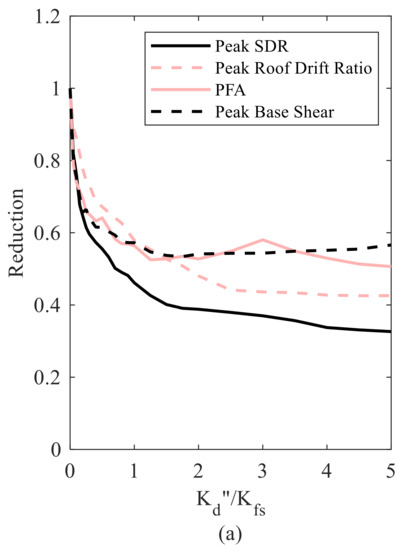
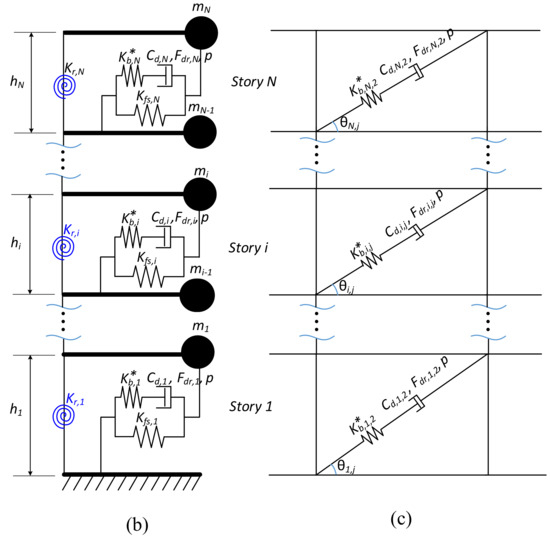
Figure 8.
(a) MDF performance curves, (b) flexural-shear beam model, and (c) two-dimensional frame model.
Referring to Figure 8a, the MDF performance curves method suggests that a ratio shall not exceed 1.0 for optimal force control. Oversized dampers may result in a high seismic base shear. This may require an additional retrofit of the foundation system, which is not desirable from an economic standpoint. Stresses in key structural members (e.g., columns and splices) may also increase in this case.
Herein, three damping levels with = 0.25, 0.5, and 1.0 are feasible to be explored. In total, nine different design scenarios (three damping levels x three distribution methods) are considered. Among all the design cases, the available damper sizes led to a ratio between 4.4 to 6.3 and a ratio between 1.6 and 2.4. A is considered for the SDF design. To maximize the peak damper velocity ratio, , the damper sizes with the lowest relief velocity (1.8 cm/s) are selected. In this case, the post-relief damping coefficient ratio of p = 0.0168. The initial design aims for for all three damping levels to cap the damper force demands transferred to the retrofitted steel MRFs. However, the damper relief velocity demands are found to be lower in medium and high damping cases. Therefore, is reduced to 1.2 and 1.5 for the medium and high damping levels, respectively, to assure compatibility between the design and the selected damper properties.
Table 1 summarizes the final design equivalent SDF parameters for three damping levels, namely the ‘low damping’ ( = 0.25), the ‘medium damping’ ( = 0.5), and the ‘high damping’ ( = 1.0) cases. These correspond to an effective damping ratio of about 7%, 13%, and 22%, respectively. The advantage of the ‘high damping’ case is that the steel MRFs of the building remain more-or-less elastic at the BSE-2E seismic intensity.

Table 1.
Effective SDF parameters obtained from performance curve for three damping levels in the X-loading direction.
5.4. Design of Bilinear Oil Dampers
Once the total lateral damper properties (i.e., damping coefficient, , damper stiffness, , and damper relief force, ) are determined through the MDF performance curves method (see Figure 8b), these should be transformed to design the properties of each damper within a story. If the dampers are installed in a diagonal fashion (see Figure 8c), the required initial damping coefficient,, the internal damper stiffness,, the supporting brace stiffness, , the relief load, , and the relief velocity, , of the damper of bay j at story i can be determined as follows:
where nd,i is the number of dampers at story i; θi,j the inclination angle of the dampers at bay j; and are the total lateral supporting brace and internal damper stiffness at each story computed in design, respectively.
The brace stiffness and internal damper stiffness are computed based on the largest available stroke of the corresponding damper size. The internal damper stiffness can be directly obtained from the manufacturer, while the axial stiffness of the supporting brace can be computed as follows:
where Eb is the modulus of elasticity of the supporting steel brace (205 GPa); Ab,i,j and Lb,i,j are the cross-sectional area and the length of the supporting brace, respectively; Ltot,i,j is the total diagonal length between working points; Ld,i,j is length of the damper portion; Lrigid,i,j is the rigid zone length, which is approximately 1000 mm in this case. The supporting length of the brace, Lb,i,j, refers to the damper assembly length excluding the damper portion and the rigid zone length. It is also assumed that Ab,i,j is valid for the entire Lb,i,j. Thus, the mechanical model shown in Figure 8c is deemed representative. Details on the damper’s properties can be found in Akcelyan [39].
The damper design is based on the required relief force. Dampers with maximum forces of 250 kN, 500 kN, 1000 kN, 1500 kN, and 2000 kN are used. Care is given not to oversize the dampers to provide a fair comparison between different design cases. The mean overstrength ratio of dampers in all design cases is between 1.07–1.11.
5.5. Effect of Vertical Damping Distribution
The damper configuration and placement have a significant impact on the efficiency of the retrofit solution [61,62,63]. This is particularly evident in tall buildings. Therefore, a comparative study is first carried out with different damping levels (i.e., low, medium, and high damping levels) and distribution methods. Figure 9a–i depicts the damper locations for the selected design scenarios, where the maximum damper design forces are indicated with different tones and thicknesses. The dampers are initially designed based on two vertical damping distribution methods, namely the effective and the direct shear force proportional damping distribution (SFPDD). The effective SFPDD method determines the required loss stiffness of the damper based on its storage stiffness ; while the required storage stiffness of the damper is obtained by subtracting the total storage stiffness from the elastic frame shear stiffness . For the direct SFPDD, the required loss stiffness of the damper is computed in proportion to the shear force distribution without considering the lateral stiffness distribution of the frame.
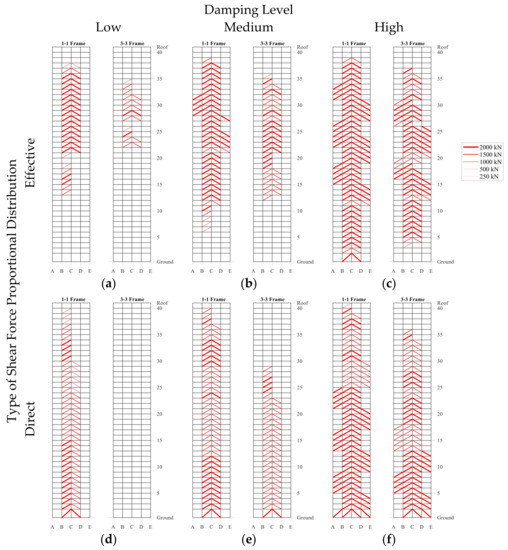
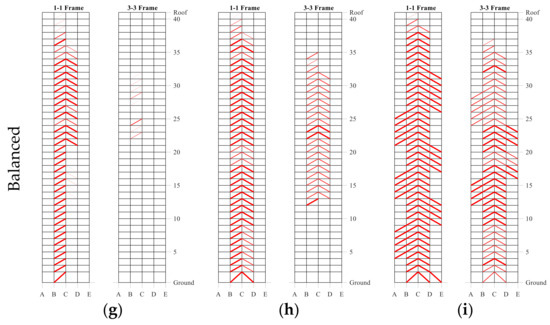
Figure 9.
Damper design based on nine different retrofit schemes, (a) low damping and effective SFPDD, (b) medium damping and effective SFPDD, (c) high damping and effective SFPDD, (d) low damping and direct SFPDD, (e) medium damping and direct SFPDD, (f) high damping and direct SFPDD, (g) low damping and balanced SFPDD, (h) medium damping and balanced SFPDD, (i) high damping and balanced SFPDD.
Referring to Figure 9a, the dampers are placed mainly at the upper half of the building based on the effective SFPDD method. In contrast, according to the direct SFPDD method (see Figure 9d), damping is provided at each level, and it decreases gradually with the increasing height similarly to the story shear forces.
An additional study is conducted to observe the effect of horizontal damper placement on the story based EDPs. The results suggest that placing dampers in interior bays maximizes the damper efficiency. This is also beneficial for exterior columns that exhibit high axial stresses, particularly in the X-loading direction. Therefore, the dampers are placed as diagonal braces mainly in exterior frames. In this way, torsional vibrations may be controlled more effectively. Furthermore, installing dampers at the same locations is more practical and less costly [18]. Qualitatively, the larger the damping level, the more bays are required for the damper placement. Due to the limited number of available bays in exterior frames of the X-loading direction (e.g., a 1–1 frame) some of the dampers are placed in the interior frames as well (e.g., a 3–3 frame).
To compare the performance of each retrofit case, only 10 ground motions were employed. The dampers are modelled with the BilinearOilDamper material model. The numerical material model used in this study for the simulation of bilinear oil dampers has been validated with full scale shake table tests. More details can be found in Akcelyan et al. [64]. Figure 10 shows the median peak SDRs for different design cases and for the three examined damping levels. Referring to Figure 10a, a low damping level design according to the effective SFPDD method still led to bottom story collapses of the prototype building. Conversely, higher damping levels tend to reduce the drift concentrations along the building height. In such cases, a uniform SDR profile can be achieved (see Figure 10c). A higher damping level would minimize the inelastic deformations of the retrofitted steel MRF building.
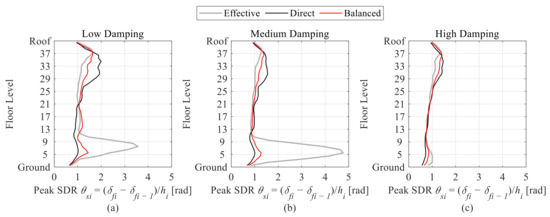
Figure 10.
Comparison of peak SDRs based on nine different retrofit schemes in the X-loading direction, (a) low damping level, (b) medium damping level, (c) high damping level.
Balanced Vertical Damping Distribution
The effective SFPDD method assumes that the building will maintain its elastic stiffness during an earthquake. This assumption may not be valid for low-probability-of-occurrence seismic events. An appropriate distribution method should be effective for seismic intensities associated with both serviceability and collapse prevention. In this section, we propose a balanced distribution method (termed as balanced SFPDD). To compute the loss stiffness based on the balanced SFPDD the weighted average of the loss stiffness obtained from the effective and direct SFPDDs can be considered as follows in Equation (9):
where γ is a weight factor, ranging between 0 and 1. This parameter is dependent on the expected inelastic displacement demands of the building under consideration. In cases where the inelastic displacement demands are large (i.e., large ductility demands), γ approaches 0 and the damping distribution is essentially identical with the direct SFPDD. Otherwise, γ approaches unity. In the considered design scenarios, inelastic deformations in the steel MRFs are expected. As such, a γ = 0.5 is assumed. An optimal γ factor selection necessitates additional studies to quantify the effect of frame inelasticity on the effective damping and response reduction. However, such studies are outside the scope of the present work.
Figure 9g,h,i shows the damper design for the seismic retrofit of the tall building based on the balanced SFPDD method for low, medium, and high damping levels, respectively. Unlike the effective SFPDD method, providing supplemental damping at every story makes the proposed retrofit solution more redundant.
Figure 10 suggests that the balanced SFPDD leads to a more-or-less uniform distribution regardless of the associated damping level. For high damping levels (see Figure 10c), the earthquake-induced collapse is prevented regardless of the employed damping distribution method.
The general consensus from the previous discussion is that the optimal retrofit strategy for the tall building should be derived with the balanced vertical damping distribution method. For this reason, three damping levels are considered. The results are based on the full set of 40 selected ground motion records. Figure 11 shows the histogram of the peak SDRs for low, medium, and high damping levels at the BSE-2E seismic intensity. For comparison purposes, the non-retrofitted building response is superimposed in the same figure. The results suggest that for peak SDR demands of 10% rad or higher, the number of collapses is reduced from 29 to 10, 4, and 0, in the case of the low, medium, and high damping levels, respectively.
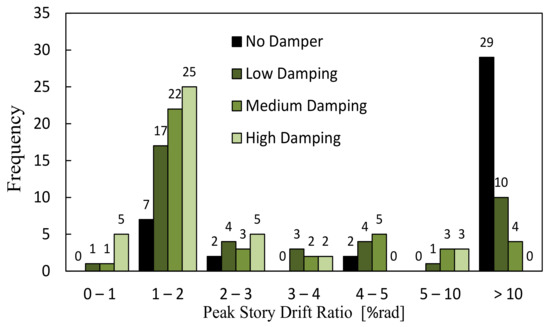
Figure 11.
Comparison of peak SDRs at BSE-2E level for different damping levels.
6. Proposed Retrofit Solution
From the comparative study it can be inferred that at the medium damping level the retrofitted building achieves, at minimum, the established seismic performance objectives for the prototype building. This corresponds to the solution in Figure 9e. The following sections present a detailed discussion on how the proposed solution affects the global and local EDPs of the retrofitted building. Results are only presented for the X-loading direction for the sake of brevity.
6.1. Seismic Assessment of the Retrofitted Building
Figure 12 and Figure 13 illustrate the median and the 16th and 84th percentiles of the peak story-based EDPs for a medium damping level obtained from NRHAs at the BSE-1E and BSE-2E levels, respectively. From these figures, the peak SDRs in the upper stories are mostly controlled by flexural deformations. At higher seismic intensities, the peak SDRs migrate towards the lower stories (see Figure 13a), which is consistent with prior studies on mid- and high-rise steel MRFs [48,50,65].
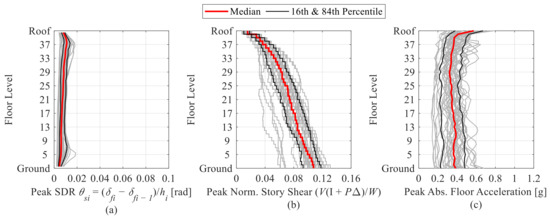
Figure 12.
Engineering demand parameters of the retrofitted building (BSE-1E), (a) peak SDR, (b) peak normalized story shear force, (c) peak absolute floor acceleration.
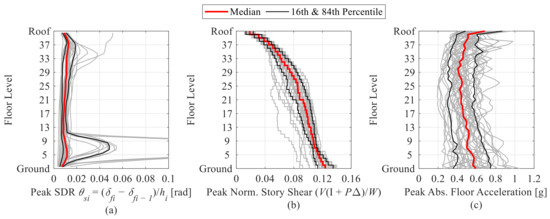
Figure 13.
Engineering demand parameters of the retrofitted building (BSE-2E), (a) peak SDR, (b) peak normalized story shear force, (c) peak absolute floor acceleration.
Referring to Figure 12a, the 84th peak SDR percentiles amplify in the lower stories. Residual deformations, which are mainly observed in the bottom stories of the retrofitted building, are below 0.2% at the BSE-2E level. Moreover, the retrofitted building did not experience any collapse at the BSE-1E level. In 32 of the analyzed ground motion records, the residual SDRs were less than 0.2%.
Referring to Figure 12b and Figure 13b, the median peak normalized base shear is 0.11 W and 0.12 W at the BSE-1E and BSE-2E seismic intensities, respectively. Figure 12c and Figure 13c suggest that besides the roof, the median absolute floor acceleration demands are fairly uniform along the building height regardless of the examined seismic intensity.
6.2. Local Engineering Demand Parameters
In this section, the focus is on the effectiveness of the employed retrofit solution on local EDPs (i.e., beam plastic rotations, column axial force demands, column splice stresses, peak damper stroke, damper forces, and post-relief velocities).
6.2.1. Beam Plastic Rotational Demands
Referring to Figure 14a, the peak beam plastic rotation is generally below their corresponding capping rotation in the upper stories, which is a significant improvement compared to what was observed in the non-retrofitted building; however, considering the 84th percentile response, the lower story beams exhibit high plastic rotation demands. Many of them exceed their ultimate rotation capacity. Due to the non-uniform distribution of the flexural deformations along the building height, the lower stories experience higher shear deformation demands. This explains that dynamic instability occurred in four cases that are associated with bottom story mechanisms at the BSE-2E level.
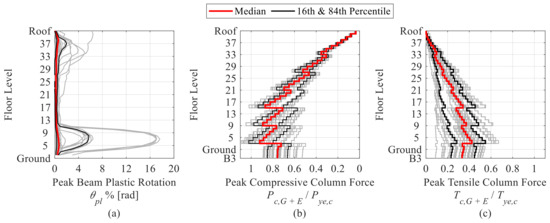
Figure 14.
(a) Peak beam plastic rotations and (b) normalized peak compressive and (c) normalized tensile column forces of the retrofitted building (BSE-2E).
6.2.2. Column Axial Load Demands
Referring to Figure 14b, the column normalized compressive axial forces are higher than those observed in the non-retrofitted building. This can be attributed to the lesser number of collapses in the retrofitted configuration, as the forces induced by the mechanisms developed at beams are successfully transmitted through the columns to the bottom stories. The peak values are more scattered compared to the non-retrofitted building. In many cases, the peak compressive forces exceed the axial yield capacity Pye,c of the columns. From Figure 14c, higher tensile forces are observed in only a few ground motions. In particular, the tensile forces exceed 0.6 Tye,c. Figure 15a indicates the median column normalized peak compressive forces for the retrofitted building in 1–1 frame columns. Figure 7a and Figure 15a depict the effect of damper placement on the column forces. In this case, the increase in median column normalized peak compressive forces in B- and D-axis columns is larger compared to the non-retrofitted building. This is more evident in the 1–1 frame, where dampers are densely installed. For instance, as shown in Figure 7a at story 30 of the non-retrofitted building, the exterior columns exhibit about 0.3 Pye,c, compressive force, while this value in the B- and D-axis columns is about 0.2 Pye,c. For the retrofitted building, although the compressive force in exterior columns remains the same, the B- and D-axis columns experience relatively higher increase in compressive force, exceeding that of the exterior columns. This increase is due to the additional forces that the framing members experience due to the damper placement.
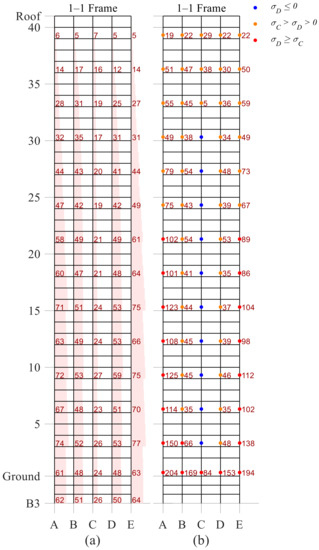
Figure 15.
(a) Median column normalized peak compressive forces and median peak [%], (b) tensile stresses at column splices of the retrofitted building [MPa] (BSE-2E).
The tensile forces at B-axis columns in the 1–1 frame slightly increase in comparison to the non-retrofitted building. Nevertheless, the damper placement in internal bays is a wise strategy to avoid further retrofit measures for the interior columns. There is practically no difference in the force demands in the majority of middle-interior C-axis columns. This is achieved with the inverted-V diagonal placement of the dampers; thus, if the damper sizes are identical, then the compressive and tensile damper forces cancel each other out. For instance, in the upper stories of the 1–1 frame (i.e., from the 36th to 40th stories, see Figure 15a) the dampers are single or do not have the same size; therefore, the interior column compressive forces at story 36 increase from 0.10 Pye,c to 0.16 Pye,c in the retrofitted configuration.
6.2.3. Column Splice Demands
As shown in Figure 15b the exterior column splices of the retrofitted building experience tensile stresses. However, there is a significant reduction in the tensile stresses in the upper story column splices relative to the un-retrofitted case (see Figure 7b). This is attributed to the prevention of collapse mechanisms in the upper stories of the building due to the damper placement. From the same figure, while the reduction in the peak SDRs of the retrofitted building configuration is considerable, the reduction in the tensile stress demands at the column splices is modest. A seismic retrofit, based on the median building response, would only require the seismic upgrading of the column splices in the lower half exterior columns, which is a small fraction of the total.
6.2.4. Damper Stroke, Post-Relief Velocity Ratios and Forces
To compare with the damper stroke limits, the peak damper displacements are computed. Figure 16a indicates the median values of the peak damper strokes at the BSE-2E level. Referring to Figure 16a, the median of the peak damper displacement demands is less than 30 mm, which is well below the smallest damper stroke limit (i.e., it typically ranges from 60 mm to 120 mm).
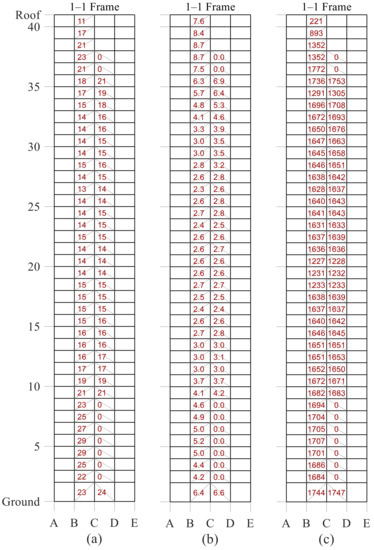
Figure 16.
(a) Median peak damper displacements [mm], (b) median response of peak damper post-relief velocity ratio, and (c) median response of peak damper forces [KN] (BSE-2E).
Another important parameter to be considered is the damper peak velocities and the corresponding peak damper post-relief velocity ratio . The allowable post-relief velocity ratio of the dampers is 30 mm/sec, which corresponds to a . Figure 16b indicates that the median values of the peak post-relief velocity ratio vary from 2.3 to 9.8. The ratio is around 3.0 in most of the mid-stories. The largest values are observed in the lower and upper stories. Note that according to the SDF design via performance curves, the expected post-relief velocity ratio is 1.5 at the medium damping level (see Table 1). This implies that velocities at each level are amplified due to higher mode effects. This emphasizes the advantage of using bilinear oil dampers over linear viscous dampers for seismic retrofitting. Figure 16c shows the median peak damper forces. Although the relief velocity is exceeded in all the dampers, unlike linear viscous dampers, the increase in damper forces is very limited. In all cases, the resultant damper forces are below the allowable damper forces. Figure 17 shows the force–displacement relation of oil dampers in stories 10 and 40 in the building subjected to GM#32 (Westmorland Fire Station-360, 2010 El Mayor Cucapah Mexico Earthquake) scaled to the BSE-2E seismic intensity. The figure demonstrates that the damper forces cap once they exceed their relief forces.
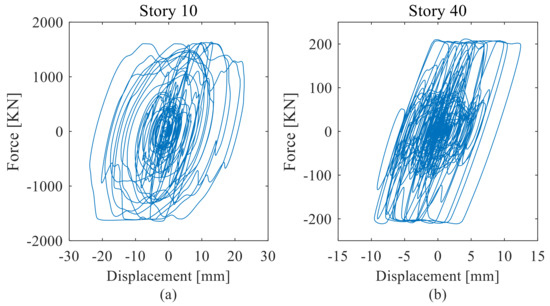
Figure 17.
Damper force deformation relations for GM#32 at (a) story 10 and (b) story 40 (BSE-2E).
7. Summary and Conclusions
This paper provides a comprehensive seismic evaluation and multiple retrofit strategies for an existing 40-story tall building with space steel moment-resisting frames (MRFs) designed in early 1970s. The findings are used as recommendations for effective retrofit strategies with bilinear oil dampers. The assessment is based on both global and local engineering demand parameters (EDPs) of the prototype building. The main findings are summarized as follows:
- Existing tall buildings are likely to have a high collapse risk based on the regional seismic hazard due to lack of capacity design principles as well as inadequate structural detailing at the time of construction. The 40-story building examined as part of the present study had a probability of collapse of 72% at the BSE-2E level;
- Bottom story exterior columns are likely to experience high compressive and tensile force demands due to dynamic overturning effects. Particularly, the compressive force demands may reach up to the expected column yield strength. For the examined 40-story building, the axial load demands ranged, on average, from 0.8 Pye,c in compression to 0.3 Tye,c in tension. Conversely, interior columns within the same stories experience compressive axial forces up to 0.5 Pye,c;
- The simulation results suggest that there is no significant difference in column axial loads between the BSE-1E and BSE-2E seismic intensities. Unless the reduction in SDRs is considerable, depending on the employed retrofit solution, the column axial load demands are likely to remain high at the BSE-2E;
- Up to about 35% of the column splices were likely to experience brittle fractures at the BSE-2E seismic intensity. On the other hand, a considerable number of interior column splices are not susceptible to fracture;
- Oil dampers with relief valves were employed for the seismic retrofit of the examined building. The damper design was carried out by using the MDF performance curves method. Multiple retrofit solutions were exploited. A damping distribution method was proposed, and a detailed seismic performance assessment of the retrofitted building was carried out via NRHA. The main findings are summarized as follows:
- For retrofits where the steel MRF still exhibits inelastic behavior, the effective shear force proportional damping distribution is the most inefficient retrofit solution that causes damage concentration at stories where dampers are not provided, particularly at low and medium damping levels;
- For the retrofitted 40-story building, the proposed balanced shear force proportional damping distribution method provided the most uniform peak SDR distribution, while at the medium damping level the probability of collapse reduced from 72% to 10% at the BSE-2E hazard level. The peak SDRs were mostly concentrated in the bottom stories;
- At the BSE-2E hazard level, high axial force demands in the upper story columns of the non-retrofitted building were minimized after the implementation of the seismic retrofit solution. Conversely, compressive and tensile forces in the bottom exterior columns were not reduced. Furthermore, the damper installation led to an increase in the interior column forces. However, the difference in forces at mid-interior columns was minimal due to the inverted-V damper configuration;
- On average, about 27% of column splices were found to be vulnerable at the BSE-2E hazard level. Tensile stresses at upper story column splices were reduced. The opposite was observed in the bottom story exterior columns. It is recommended to strengthen the exterior column splices at the lower half of the building as well as the first story columns;
- At the BSE-E hazard level, the median peak damper displacements were less than 50% of the damper stroke limits. Although the median values of the peak post-relief velocity ratio were between 2.3 to 9.8, the corresponding damper forces were not large. This underscores the main advantage of utilizing bilinear oil dampers for seismic retrofit applications;
Author Contributions
Conceptualization, S.A. and D.G.L.; methodology, S.A. and D.G.L.; software, S.A.; validation, S.A. and D.G.L.; formal analysis, S.A.; investigation, S.A.; resources, S.A. and D.G.L.; data curation, S.A.; writing—original draft preparation, S.A.; writing—review and editing, D.G.L. and S.A.; visualization, S.A.; supervision, D.G.L.; project administration, D.G.L.; funding acquisition, D.G.L. All authors have read and agreed to the published version of the manuscript.
Funding
This research was supported by Fonds de recherche du Québec Nature et technologies (Grant No. 2013—NC-166845), Natural Sciences and Engineering Research Council of Canada (NSERC), Individual Research Fund of Kadir Has University, and internal funding from École Polytechnique Fédérale de Lausanne (EPFL). The findings in this paper are those of the authors and do not necessarily reflect the view of the sponsors.
Data Availability Statement
The data that support the findings of this study are available from the first author upon reasonable request.
Conflicts of Interest
The authors declare no conflict of interest.
References
- Almufti, I.; Hutt, C.M.; Willford, M.; Deierlein, G. Seismic assessment of typical 1970s tall steel moments frame buildings in downtown San Francisco. In Proceedings of the 15th World Conference of Earthquake Engineering, Lisbon, Portugal, 24–28 September 2012. [Google Scholar]
- ICBO. Uniform Building Code (UBC) 73; International Conference of Buildings Officials: Whittier, CA, USA, 1973. [Google Scholar]
- Gupta, A.; Krawinkler, H. Estimation of seismic drift demands for frame structures. Earthq. Eng. Struct. Dyn. 2000, 29, 1287–1305. [Google Scholar] [CrossRef]
- Lee, K.; Foutch, D.A. Seismic performance evaluation of pre-Northridge steel frame buildings with brittle connections. J. Struct. Eng. 2002, 128, 546–555. [Google Scholar] [CrossRef]
- Hall, J.F.; Heaton, T.H.; Halling, M.W.; Wald, D.J. Near-source ground motion and its effects on flexible buildings. Earthq. Spectra 1995, 11, 569–605. [Google Scholar] [CrossRef]
- Muto, M.; Krishnan, S. Hope for the best, prepare for the worst: Response of tall steel buildings to the ShakeOut scenario earthquake. Earthq. Spectra 2011, 27, 375–398. [Google Scholar] [CrossRef]
- Luco, N.; Cornell, C.A. Effects of connection fractures on SMRF seismic drift demands. J. Struct. Eng. 2000, 126, 127–136. [Google Scholar] [CrossRef]
- Maison, B.F.; Bonowitz, D. How safe are pre-Northridge WSMFs? A case study of the SAC Los Angeles nine-story building. Earthq. Spectra 1999, 15, 765–789. [Google Scholar] [CrossRef]
- Bech, D.; Tremayne, B.; Houston, J. Proposed changes to steel column evaluation criteria for existing buildings. In Proceedings of the Improving the Seismic Performance of Existing Buildings and Other Structures, San Francisco, CA, USA, 10–12 December 2015; American Society of Civil Engineers (ASCE): Reston, VA, USA, 2015; pp. 255–272. [Google Scholar]
- Hutt, C.M.; Almufti, I.; Willford, M.; Deierlein, G. Seismic loss and downtime assessment of existing tall steel-framed buildings and strategies for increased resilience. J. Struct. Eng. 2016, 142, C4015005. [Google Scholar] [CrossRef]
- Lai, J.-W.; Schoettler, M.; Wang, S.; Mahin, S. Seismic Evaluation and Retrofit of Existing Tall Buildings in California: Case Study of a 35-Story Steel Moment Resisting Frame Building in San Francisco; Pacific Earthquake Engineering Research Center Headquarters at the University of California: Berkeley, CA, USA, 2015. [Google Scholar]
- Molina Hutt, C.; Zahedimazandarani, S.; Marafi, N.A.; Berman, J.W.; Eberhard, M.O. Collapse risk of pre-Northridge tall steel moment-resisting frames in the Seattle basin during large-magnitude subduction earthquakes. Eng. Struct. 2021, 244, 112751. [Google Scholar] [CrossRef]
- Wang, S.; Lai, J.-W.; Schoettler, M.J.; Mahin, S.A. Seismic assessment of existing tall buildings: A case study of a 35-story steel building with pre-Northridge connection. Eng. Struct. 2017, 141, 624–633. [Google Scholar] [CrossRef]
- Bjornsson, A.B. A Retrofitting Framework for Pre-Northridge Steel Moment-Frame Buildings; California Institute of Technology: Pasadena, CA, USA, 2014. [Google Scholar]
- Constantinou, M.; Symans, M.; Tsopelas, P.; Taylor, D. Fluid viscous dampers in applications of seismic energy dissipation and seismic isolation. Proc. ATC 17-1 Semin. Seism. Isol. Passiv. Energy Dissipation Act. Control. 1993, 2, 581–592. [Google Scholar]
- Uriz, P.; Whittaker, A.S. Retrofit of pre-Northridge steel moment-resisting frames using fluid viscous dampers. Struct. Des. Tall Build. 2001, 10, 371–390. [Google Scholar] [CrossRef]
- Symans, M.; Charney, F.; Whittaker, A.; Constantinou, M.; Kircher, C.; Johnson, M.; McNamara, R. Energy dissipation systems for seismic applications: Current practice and recent developments. J. Struct. Eng. 2008, 134, 3–21. [Google Scholar] [CrossRef]
- Malley, J.O.; Sinclair, M.; Graf, T.; Blaney, C.; Ahmed, T. Incorporation of full-scale testing and nonlinear connection analyses into the seismic upgrade of a 15-story steel moment frame building. Struct. Des. Tall Spec. Build. 2011, 20, 472–481. [Google Scholar] [CrossRef]
- Symans, M.D.; Constantinou, M.C. Passive fluid viscous damping systems for seismic energy dissipation. ISET J. Earthq. Technol. 1998, 35, 185–206. [Google Scholar]
- Fujita, K.; Wataya, R.; Takewaki, I. Robust optimal damper placement of nonlinear oil dampers with uncertainty using critical double impulse. Front. Built Environ. 2021, 7, 118. [Google Scholar] [CrossRef]
- Takewaki, I.; Akehashi, H. Comprehensive review of optimal and smart design of nonlinear building structures with and without passive dampers subjected to earthquake loading. Front. Built Environ. 2021, 7, 631114. [Google Scholar] [CrossRef]
- Kasai, K.; Ito, H.; Ogura, T. Passive control design method based on tuning of equivalent stiffness of bilinear oil dampers. J. Struct. Constr. Eng. 2008, 73, 1281–1288. [Google Scholar] [CrossRef][Green Version]
- Takewaki, I. Building Control with Passive Dampers: Optimal Performance-Based Design for Earthquakes; John Wiley & Sons (Asia) Pte. Ltd.: Hoboken, NJ, USA, 2009. [Google Scholar]
- De Domenico, D.; Ricciardi, G.; Takewaki, I. Design strategies of viscous dampers for seismic protection of building structures: A review. Soil Dyn. Earthq. Eng. 2019, 118, 144–165. [Google Scholar] [CrossRef]
- Kasai, K.; Mita, A.; Kitamura, H.; Matsuda, K.; Morgan, T.A.; Taylor, A.W. Performance of seismic protection technologies during the 2011 Tohoku-Oki Earthquake. Earthq. Spectra 2013, 29, S265–S293. [Google Scholar] [CrossRef]
- ASCE/SEI 7-16; Minimum Design Loads for Buildings and Other Structures. American Society of Civil Engineers: Reston, VA, USA, 2016.
- ASCE/SEI 41-17; Seismic Evaluation and Retrofit of Existing Buildings. American Society of Civil Engineers: Reston, VA, USA, 2017.
- LATBSDC. An Alternative Procedure for Seismic Analysis and Design of Tall Buildings Located in the Los Angeles Region; Los Angeles Tall Buildings Structural Design Council: Los Angeles, CA, USA, 2014. [Google Scholar]
- CTBUH. Recommendations for the Seismic Design of High-Rise Buildings; Council on Tall Buildings and Urban Habitat Seismic Working Group: Chicago, IL, USA, 2008. [Google Scholar]
- PEER. Guidelines for Performance-Based Seismic Design of Tall Buildings; Pacific Earthquake Engineering Research Center, University of California: Berkeley, CA, USA, 2010. [Google Scholar]
- Galasso, C.; Stillmaker, K.; Eltit, C.; Kanvinde, A. Probabilistic demand and fragility assessment of welded column splices in steel moment frames. Earthq. Eng. Struct. Dyn. 2015, 44, 1823–1840. [Google Scholar] [CrossRef]
- Stillmaker, K.; Kanvinde, A.; Galasso, C. Fracture mechanics-based design of column splices with partial joint penetration welds. J. Struct. Eng. 2016, 142, 04015115. [Google Scholar] [CrossRef]
- Anderson, J.; Bertero, V. Seismic response of a 42-story steel building. In The Loma Prieta, California, Earthquake of October 17, 1989: Performance of the Built Environment, Building Structures; USGS: Reston, VA, USA, 1989; Paper 1552-C; pp. c113–c140. [Google Scholar]
- FEMA. NEHRP Recommended Provisions for Seismic Regulations for New Buildings and Other Structures; FEMA 368; Federal Emergency Management Agency: Washington, DC, USA, 2001.
- Johnston, R.G. Design methods based on stiffness: Drift criteria. In Proceedings of the International Conference on Planning and Design of Tall Buildings Vol II: Structural Design of Tall Steel Buildings, Bethlehem, PA, USA, 21–26 August 1972; pp. 635–641. [Google Scholar]
- Bruneau, M.; Mahin, S. Ultimate behavior of heavy steel section welded splices and design implications. J. Struct. Eng. 1990, 116, 2214–2235. [Google Scholar] [CrossRef]
- AISC. Specification for the Design, Fabrication & Erection of Structural Steel for Buildings; American Insitute of Steel Construction: New York, NY, USA, 1969. [Google Scholar]
- Computers and Structures, Inc. (CSI), ETABS, Version 9.7.4; Extended 3D analysis of building systems; Computer and Structures: Berkeley, CA, USA, 2011. [Google Scholar]
- Akcelyan, S. Seismic Retrofit of Existing Steel Tall Buildings with Supplemental Damping Devices. Ph.D. Dissertation, McGill University, Montreal, QC, Canada, 2017. [Google Scholar]
- ASCE/SEI 41-13; Seismic Evaluation and Retrofit of Existing Buildings. American Society of Civil Engineers: Reston, VA, USA, 2014.
- McKenna, F.T. Object-Oriented Finite Element Programming: Frameworks for Analysis, Algorithms and Parallel Computing. Ph.D. Dissertation, University of California, Berkeley, CA, USA, 1997. [Google Scholar]
- Ibarra, L.F.; Medina, R.A.; Krawinkler, H. Hysteretic models that incorporate strength and stiffness deterioration. Earthq. Eng. Struct. Dyn. 2005, 34, 1489–1511. [Google Scholar] [CrossRef]
- Hartloper, A.R. Updates to the ASCE-41-13 Nonlinear Modelling Provisions for Performance-Based Seismic Assessment of New and Existing Steel Moment Resisting Frames. Master’s Dissertation, McGill University, Montreal, QC, Canada, 2016. [Google Scholar]
- Lignos, D.G.; Krawinkler, H. Deterioration modeling of steel components in support of collapse prediction of steel moment frames under earthquake loading. J. Struct. Eng. 2011, 137, 1291–1302. [Google Scholar] [CrossRef]
- Youssef, N.F.; Bonowitz, D.; Gross, J.L. A Survey of Steel Moment-Resisting Frame Buildings Affected by the 1994 Northridge Earthquake; US National Institute of Standards and Technology: Gaithersburg, MD, USA, 1995.
- Menegotto, M.; Pinto, P.E. Method of analysis for cyclically loaded reinforced concrete plane frames including changes in geometry and non-elastic behaviour of elements under combined normal force and bending. In Proceedings of the IABSE Symposium on Resistance and Ultimate Deformability of Structures Acted on by Well Defined Repeated Loads, Lisbon, Portugal, 13–14 September 1973; pp. 15–22. [Google Scholar]
- Lignos, D.; Krawinkler, H. A steel database for component deterioration of tubular hollow square steel columns under varying axial load for collapse assessment of steel structures under earthquakes. In Proceedings of the 7th International Conference on Urban Earthquake Engineering (7CUEE) &5th International Conference on Earthquake Engineering (5ICEE), Tokyo, Japan, 3–5 March 2010; Tokyo Institute of Technology: Tokyo, Japan, 2010. [Google Scholar]
- Gupta, A.; Krawinkler, H. Seismic Demands for the Performance Evaluation of Steel Moment Resisting Frame Structures; Stanford University: Stanford, CA, USA, 1999. [Google Scholar]
- Krawinkler, H. Shear in beam-column joints in seismic design of steel frames. Eng. J. 1978, 15, 82–91. [Google Scholar]
- Elkady, A.; Lignos, D.G. Modeling of the composite action in fully restrained beam-to-column connections: Implications in the seismic design and collapse capacity of steel special moment frames. Earthq. Eng. Struct. Dyn. 2014, 43, 1935–1954. [Google Scholar] [CrossRef]
- Adam, C.; Ibarra, L.F.; Krawinkler, H. Evaluation of P-delta effects in non-deteriorating MDOF structures from equivalent SDOF systems. In Proceedings of the The 13th World Conference on Earthquake Engineering, Vancouver, BC, Canada, 1–6 August 2004. [Google Scholar]
- Krawinkler, H. Importance of good nonlinear analysis. Struct. Des. Tall Spec. Build. 2006, 15, 515–531. [Google Scholar] [CrossRef]
- Krawinkler, H.; Seneviratna, G.D.P.K. Pros and cons of a pushover analysis of seismic performance evaluation. Eng. Struct. 1998, 20, 452–464. [Google Scholar] [CrossRef]
- PEER/ATC. Modeling and Acceptance Criteria for Seismic Design and Analysis of Tall Buildings; PEER/ATC 72-1; Applied Technology Council, Redwood City, Pacific Earthquake Engineering Center: Berkeley, CA, USA, 2010. [Google Scholar]
- NIST. Selecting and Scaling Earthquake Ground Motions for Performing Response History Analysis; Prepared by the NEHRP Consultants Joint Venture for the National Institute of Standards and Technology; NEHRP Consultants Joint Venture: Gaithersburg, MD, USA, 2010. [Google Scholar]
- Ancheta, T.D.; Darragh, R.B.; Stewart, J.P.; Seyhan, E.; Silva, W.J.; Chiou, B.S.-J.; Wooddell, K.E.; Graves, R.W.; Kottke, A.R.; Boore, D.M.; et al. NGA-West2 Database. Earthq. Spectra 2014, 30, 989–1005. [Google Scholar] [CrossRef]
- Pekelnicky, R.; Malley, J.O. Seismic performance of tall steel framed buildings built between 1960–1994. In Proceedings of the Proceedings 2019 SEAOC Convention, Squaw Creek, CA, USA, 28–31 August 2019. [Google Scholar]
- Wang, S.; Mahin, S.A. High-performance computer-aided optimization of viscous dampers for improving the seismic performance of a tall building. Soil Dyn. Earthq. Eng. 2018, 113, 454–461. [Google Scholar] [CrossRef]
- Akcelyan, S.; Lignos, D. A practical method for seismic retrofit of tall buildings with supplemental damping. In Proceedings of the 12th Canadian Conference on Earthquake Engineering (12CCEE), Quebec, QC, Canada, 17–20 June 2019. [Google Scholar]
- ASCE/SEI 7–10; Minimum Design Loads for Buildings and Other Structures. American Society of Civil Engineers: Reston, VA, USA, 2010.
- Constantinou, M.; Tsopelas, P.; Hammel, W.; Sigaher, A. Toggle-brace-damper seismic energy dissipation systems. J. Struct. Eng. 2001, 127, 105–112. [Google Scholar] [CrossRef]
- Hwang, J.-S.; Lin, W.-C.; Wu, N.-J. Comparison of distribution methods for viscous damping coefficients to buildings. Struct. Infrastruct. Eng. 2013, 9, 28–41. [Google Scholar] [CrossRef]
- Liang, Z.; Lee, G.C.; Dargush, G.F. Structural Damping: Applications in Seismic Response Modification; CRC Press: Boca Raton, FL, USA, 2011. [Google Scholar]
- Akcelyan, S.; Lignos, D.G.; Hikino, T. Adaptive numerical method algorithms for nonlinear viscous and bilinear oil damper models subjected to dynamic loading. Soil Dyn. Earthq. Eng. 2018, 113, 488–502. [Google Scholar] [CrossRef]
- NIST. Evaluation of the FEMA P695 Methodology for Quantification of Building Seismic Performance Factors; NIST GCR 10-917-8; NEHRP Consultants Joint Venture: Gaithersburg, MD, USA, 2010. [Google Scholar]


Disclaimer/Publisher’s Note: The statements, opinions and data contained in all publications are solely those of the individual author(s) and contributor(s) and not of MDPI and/or the editor(s). MDPI and/or the editor(s) disclaim responsibility for any injury to people or property resulting from any ideas, methods, instructions or products referred to in the content. |
© 2023 by the authors. Licensee MDPI, Basel, Switzerland. This article is an open access article distributed under the terms and conditions of the Creative Commons Attribution (CC BY) license (https://creativecommons.org/licenses/by/4.0/).