Article

Effect of Precompression and Material Uncertainty on the In-Plane Behavior of URM Pier–Spandrel Systems

1
Department of Civil and Environmental Engineering, Carleton University, Ottawa, ON K1S 5B6, Canada
2
Department of Built Environment, Oslo Metropolitan University, St. Olavs Plass, 0130 Oslo, Norway
3
Department of Structures for Engineering and Architecture, University of Naples Federico II, via Claudio 21, 80125 Naples, Italy
*
Author to whom correspondence should be addressed.
Buildings 2023, 13(1), 203; https://doi.org/10.3390/buildings13010203
Submission received: 21 December 2022 / Revised: 7 January 2023 / Accepted: 10 January 2023 / Published: 12 January 2023

Abstract

:
Theoretical and experimental studies on loadbearing masonry walls have shown the significant influence of the axial load level (i.e., precompression) and wall aspect ratio on in-plane lateral resistance. Nonetheless, the impact of the precompression and spatial variability of the material properties needs to be further investigated at the scale of walls with openings. This study presents a stochastic analysis of unreinforced (URM) pier–spandrel systems subjected to both axial loads on piers and lateral loads, considering the spatial variation in material properties. A discontinuum-based computational model was utilized to assess the force–displacement behavior of a benchmark pier–spandrel structure under different vertical precompression levels on piers. A total of 750 simulations were carried out to propagate material uncertainties in lateral load analysis. The proposed modeling strategy, based on the discrete element method, explicitly represents joint openings, sliding, and crushing phenomena at the contact points defined between the adjacent discrete rigid blocks. According to the validated computational modeling strategy, meaningful inferences were made regarding the effect of the precompression level on the maximum displacement and ultimate lateral load-carrying capacity of the benchmark URM pier–spandrel system. The results showed that vertical pressure on piers had considerable influence on the displacement ductility of the system while yielding less variation in the displacement capacity. Furthermore, the appealing feature of the spatial probabilistic analysis is noted in the variation in the lateral load-carrying capacity of the structural system.

1. Introduction

The vast majority of residential buildings and architectural heritage were built using unreinforced masonry (URM), a composite material consisting of units (stone, clay brick, earth blocks, etc.) and often a binding agent such as mortar. Each constituent of masonry shows significant uncertainty in terms of its mechanical properties with a highly nonlinear material behavior [1]. Therefore, a probabilistic approach considering predefined variations in material properties varying spatially can effectively predict the behavior and capacity of URM structures. Recently, the probabilistic analysis of masonry structures has been studied by various researchers [2,3,4,5,6,7,8,9,10,11]. In most of the existing works on the probabilistic analysis of masonry structures, the mechanical properties of masonry are assumed to be uniformly distributed within the structure, while only very few papers consider the spatial variation in those properties [3,9,11,12,13,14]. As evidenced by those studies, the spatial variation could change the damage pattern and variation in response parameters. Thus, more research is necessary to understand and quantify such effects.
A typical combination of masonry composite consists of strong units and weak mortar joints, where mortar joints delineate weak planes prone to failure. This phenomenon yields localized cracks in the form of joint openings and sliding along the head and bed joints in URM walls. Conversely, weak unit–strong joint action causes opposite behavior, in which the cracks predominantly pass through the masonry units [15,16,17]. In each combination of masonry constituents, progressive damage can be noticed in URM walls subjected to lateral loading due to successive failures at the masonry units and mortar joints. As witnessed in the past and recent earthquakes, URM buildings are vulnerable to seismic loads (unless reinforced), particularly when no proper connection is implemented between the structural elements and orthogonal walls, among many other factors [18,19,20]. The in- and out-of-plane failure of masonry walls are the two common collapse modes that can develop independently or interact with each other based on the construction quality, wall configuration, and openings. However, when façades are properly connected to orthogonal walls and floor systems are significantly stiffer than URM walls, in-plane mechanisms become more likely to develop under earthquake forces that are distributed to the in-plane walls as proportional to their own lateral stiffness.
Different computational modeling techniques are available to simulate the in-plane behavior of URM walls [21]. The first approach considers the composite nature of masonry as a continuum (denoted as macromodeling), where the entire URM structure is modeled via an equivalent homogeneous medium with averaged material properties corresponding to the main features of masonry (e.g., [22,23,24,25,26,27]). The main drawback of this technique is that it may not accurately capture the damage-induced anisotropy and failure mechanism governed by the morphological features of the masonry [28] unless a computational homogenization technique is adopted to capture failure localizations that stem from the mesoscale damage as demonstrated in the literature (see, e.g., [29,30,31]). Thus, macromodeling is commonly used for the large-scale analysis of masonry buildings. The second technique, so-called micromodeling, is proposed to overcome these challenges by considering the masonry constituents (i.e., masonry units, mortar, and unit–mortar interfaces) in the mesoscale (e.g., [32,33,34,35]). However, since this approach is computationally demanding with a large number of input parameters, it is only applicable to small-scale problems; hence, it is impractical for real-life large-scale buildings. The alternative and the most common approach, simplified micromodeling, is the midway between those techniques where the masonry units are explicitly represented as expanding up to the half thickness of the mortar joints, and mortar joints are indicated via zero-thickness interfaces (e.g., [36,37,38,39,40,41,42,43,44]). This approach reduces the required number of input parameters and provides less computational demand without compromising the detailed and explicit representation of essential failure modes in the URM walls (i.e., sliding and joint opening). Specifically, cracking in masonry units, joint opening and sliding at the unit mortar interfaces, and masonry crushing can be addressed in the simplified micromodeling, which will be discussed in the next section in detail. The well-known numerical modeling strategies used in micromodeling are the discrete element method (DEM) and discontinuous finite element analysis. Throughout this research, the DEM approach was utilized to simulate the in-plane behavior of a URM pier–spandrel system.
The lateral load-carrying capacity and failure mechanism of URM walls are primarily affected by material properties, boundary conditions, precompression stresses, geometrical properties, and wall cross section morphologies [45,46,47,48]. In the case of URM pier–spandrel systems, the coupling effect between the pier and spandrel provides additional complexity to the problem along with the other parameters. Recently, pier–spandrel systems’ behavior has been investigated experimentally and numerically to better understand the coupling effect, load-carrying capacity, and the associated collapse mechanisms [9,10,49,50,51,52,53,54]. In this context, this research aims to strengthen the existing knowledge in the literature, offering a detailed look at the lateral load-bearing capacity of URM pier–spandrel structures under different precompression forces, including material uncertainty and its spatial variation throughout the structure. A simplified micromodeling approach, denoted as discrete rigid block analysis (D-RBA), was utilized to analyze the reference URM pier–spandrel system. The validated modeling technique was further utilized to conduct a comprehensive parametric analysis to quantify the influence of vertical precompression forces on the lateral load-bearing capacity and displacement behavior of the structural system. Three levels of precompression stresses, i.e., low, medium, and high stress (approximately corresponding to 0.2 MPa, 0.38 MPa, and 0.75 MPa, respectively), are considered. The variation in the response was quantified, and the results were compared to highlight the effect of the vertical precompression stress.

2. Computational Modeling: Discrete Rigid Block Analysis (D-RBA)

In this study, a DEM-based approach was utilized to simulate the structural behavior of URM pier–spandrel systems. The adopted modeling strategy was first developed by Cundall [55] to analyze rock mechanic problems and simulate the progressive collapse mechanism of jointed rock masses. In the late 1990s, DEM was used to assess the seismic behavior of unreinforced masonry arches and walls, where the stone skeleton of the structures was represented as a group of rigid blocks [56]. In the last several decades, DEM has become a strong alternative to the conventional finite element models and has been employed excessively in the structural assessment of masonry structures for static and time-history analysis [48,57,58,59,60,61,62,63,64,65,66].
In DEM, the composite and discontinuous nature of masonry is represented by a system of rigid blocks that can interact with each other along their contact surfaces. It is worth noting that, within the DEM framework, the distinct block may be rigid and/or deformable depending on the desired outcomes from the computational model. Throughout this study, we used rigid blocks; hence, deformations were lumped at the contact surfaces. As mentioned earlier, the proposed DEM-based approach is denoted as a simplified micromodeling technique in the literature [67], in which the masonry units are expanded up to half thickness of the mortar joints, and mortar joints are indicated as zero-thickness interfaces as shown in Figure 1. The mechanical interaction between the discrete blocks was predicted using the point contact hypothesis, where each contact point had three orthogonal springs with limited tensile strength and cohesive shear behavior [68].
Overlapping is allowed among adjacent blocks that are controlled by the predefined contact stiffness in the normal ( k n ) and shear ( k s ) directions at each contact point (see Figure 2). Typically, the Coulomb–Slip joint model is utilized in the shear direction, which requires a cohesion and friction angle ( τ = c + t a n ϕ   σ , where c is cohesion, ϕ is the friction angle, and σ is normal stress), whereas tensile stress is limited by the predefined strength value ( f T ). Throughout this study, fracture-energy-based contact constitutive models were utilized to better capture the postpeak response of the material in tension, shear, and compression. A linear softening behavior was adopted for all three cases, where tension–shear damage was coupled using a single damage parameter, as explained in [69,70]. In the adopted modeling strategy, each masonry unit is represented via two blocks (with a potential crack surface in between) to capture tensile failure (cracking) in the units. The readers are referred to the most recent study of the authors for a detailed explanation of the proposed approach denoted as discrete rigid block analysis (D-RBA) [10].
In DEM, the rigid block movements are computed by integrating translational and rotational equations of motion using the central difference method for each block to obtain new translational ( u ˙ i t + ) and rotational velocities ( ω i t + ), given in Equation (1) (velocities are evaluated at midtime intervals, i.e., t + = t + Δ t / 2 , t = t Δ t / 2 , Δ t : time step):
u ˙ i t + = u ˙ i t + Δ t m Σ F i t λ Σ F i t s g n u ˙ t ω i t + = ω i t + Δ t I Σ M i t λ Σ M i t s g n ω t
where Σ F i t , Σ M i t , I , and m represent the unbalanced force vector (i.e., the sum of the contact forces, self-weight, and external forces), the unbalanced moment vector (i.e., the sum of moments produced by contact and external forces), the moment of inertia, and the block mass, respectively. The quasistatic solutions were obtained from the equations of motions using Cundall’s local damping formulation, using damping force (i.e., F d = λ Σ F i t s g n u ˙ t ) and moment (i.e., M d = λ Σ M i t s g n ω t ). It is noted that the damping force and moment were calculated based on the magnitude of Σ F i t and Σ M i t , respectively, and applied as opposed to the motion ( λ : a nondimensional force-based damping constant (default value is 0.8)) [71]. After calculating the new velocities ( u ˙ i t + ,   ω i t + ), the block positions were updated, and the corresponding action/reaction forces were obtained based on the relative block displacement increments in the normal ( Δ u n ) and shear ( Δ u s ) directions. The elastic contact stress increments were computed (i.e., the elastic normal stress increment Δ σ = k n Δ u n and elastic shear stress increment Δ τ = k s Δ u s , with k n and k s being the normal and shear stiffnesses, respectively) and added to the old stresses (obtained in the previous step). If the new stress state at the contact point violated the implemented failure criteria, it was corrected and utilized in the next step. Finally, the new contact stresses were multiplied with the associated contact area to obtain the contact forces, later utilized in the equations of motion (Equation (1)). The explained computational procedure was performed in an explicit time-marching scheme until reaching the quasistatic equilibrium from the numerical solution. All DEM-based simulations were run using a three-dimensional discrete element code, 3DEC, developed by ITASCA Consulting Group, Minneapolis, CO, USA [72]. Numerical stability was ensured during the analysis by utilizing sufficiently small time steps ( Δ t < Δ t c r ). The critical time step ( Δ t c r ) was automatically computed by 3DEC based on the minimum mass and maximum contact stiffness defined in the numerical model ( Δ t c r = 0.2 m m i n / k n , m a x ).

3. Brief Overview of Data Preparation and Material Uncertainty

This section presents the proposed data preparation strategy and the reference study utilized as a benchmark. The authors already presented the validation of the computational model (see [10]); hence, only an overview of the test setup and analysis model are discussed in this paper.

3.1. Benchmark Study and Validation

In the benchmark study, a URM pier–spandrel structure built with tuff stones and lime mortar was subjected to in-plane pushover testing with 200 kN precompression loads kept constant on each pier and displacement-controlled lateral loading until reaching approximately 1% drift [73]. Each pier was 1.70 m long and 3.62 m high, whereas the opening between them was 1.70 m long and 2.30 m high. The spandrel that connected the piers to each other was 1.00 m high, with a timber lintel over the opening to support the masonry above. Identical boundary conditions and geometrical features were used in the numerical model where the lateral loads were applied to the cantilevered piers, as shown in Figure 3a. Lateral loads were prescribed as constant velocity boundary conditions to mimic the displacement control testing while the base shear was recorded during the analysis. As shown in Figure 3b,c, according to the analysis results, a similar collapse mechanism, including the rocking behavior of piers, flexural cracks at the pier–spandrel connections, and diagonal tension cracks at the spandrel, was obtained that was in line with the experimental findings. It is worth noting that the material and contact properties were taken from the reference study without conducting any calibration procedure. The readers are referred to the early publication of the authors for further details [10].

3.2. Data Preparation

The adopted probabilistic analysis considered the variation in the joint and unit properties for masonry as random and dependent parameters. The random parameters were determined based on their effect on the strength and displacement capacity of the pier–spandrel system. These parameters are the compressive strength of masonry ( f c , m ), the joint (interface) tensile strength ( f t , j ), the tensile strength of units ( f t , u ), and the joint friction angle ( ϕ ), as shown in Table 1. The experimental results [73,74,75] were used to obtain the mean value and coefficient of variation (CoV) of the random parameters.
The dependent variables were presumed to be fully correlated with the random variables, such that their mean and CoV were the multiples of the statistical parameters of the random variables. As such, the cohesion of the units and joints was defined by the following relations: c u n i t = 1.5 f t , u n i t and c b o n d = 1.5 f t , b o n d , respectively. Similarly, the fracture energies were determined following the suggested ductility index values in [76]. Additionally, it is noted that the elastic stiffness of the lintel was considered constant during the analyses (adopted as E l i n t e l = 0.3 GPa). A normal distribution was used for compressive strength and friction angle parameters, whereas a lognormal distribution was assigned to the tensile strength of units and joints, complying with the earlier work of the authors and the pertinent literature [5,7,16,77,78]. The variables and their statistical distributions are presented in Table 1.
Once the statistical distributions and their parameters were defined, the Latin Hypercube Sampling (LHS) method [79] was used to obtain the sample values for Monte Carlo simulations. For each vertical pressure level, 250 simulations were run, i.e., adding up to 750 simulations in total. No correlation between the random variables was considered. The spatial variability of the parameters was set up in the following way: Each joint (or contact plane) in the structural system was defined with an identification number to assign the parameter values later. The identification numbers were defined separately for 367 units/blocks and 1211 unit–mortar interfaces to assign the mechanical properties effectively. In each of the 250 simulations, 367 values of unit tensile strength and 1211 values of joint tensile strength, friction angle, and masonry compressive strength were sampled using the statistical distributions and parameters given in Table 1. Once the contact properties were determined for each contact surface, either between or within the blocks, they were assigned to the associated contact points, providing homogeneous material property distribution through the contact plane. It is underlined that no spatial correlation was considered for the mechanical properties among the adjacent joints since it did not necessarily improve the understanding/quality of the probabilistic analyses, as discussed in [41]. The sampling process was repeated for 250 simulations. Once the parameters were generated for 250 simulations, the same set was used for all three vertical pressure levels. Three vertical stresses (or precompression loads), i.e., low, medium, and high, were determined to correspond approximately to 0.2 MPa, 0.38 MPa, and 0.75 MPa, respectively. Therefore, a total of 750 pushover analyses were performed.

4. Results and Discussion

The effect of the precompression stress on both the force and displacement capacities of the URM pier–spandrel system was investigated using the stochastic discontinuum-based model. The lateral force was applied up to a lateral displacement of 70 mm, corresponding to a 2.4% drift ratio. However, the force–displacement curves were truncated at 80% of the maximum lateral force once passing the ultimate load. The force–displacement behavior of the pier–spandrel system is presented as the relationship of the normalized displacement with the lateral load and with a seismic coefficient in the double vertical-axis plots. The normalized displacement represents the drift value, the ultimate displacement normalized by the height of the application point of the lateral loading (2.91 m from the ground level). On the other hand, the seismic coefficient is the lateral force normalized by the weight of the pier–spandrel system plus the vertical forces applied to the piers.
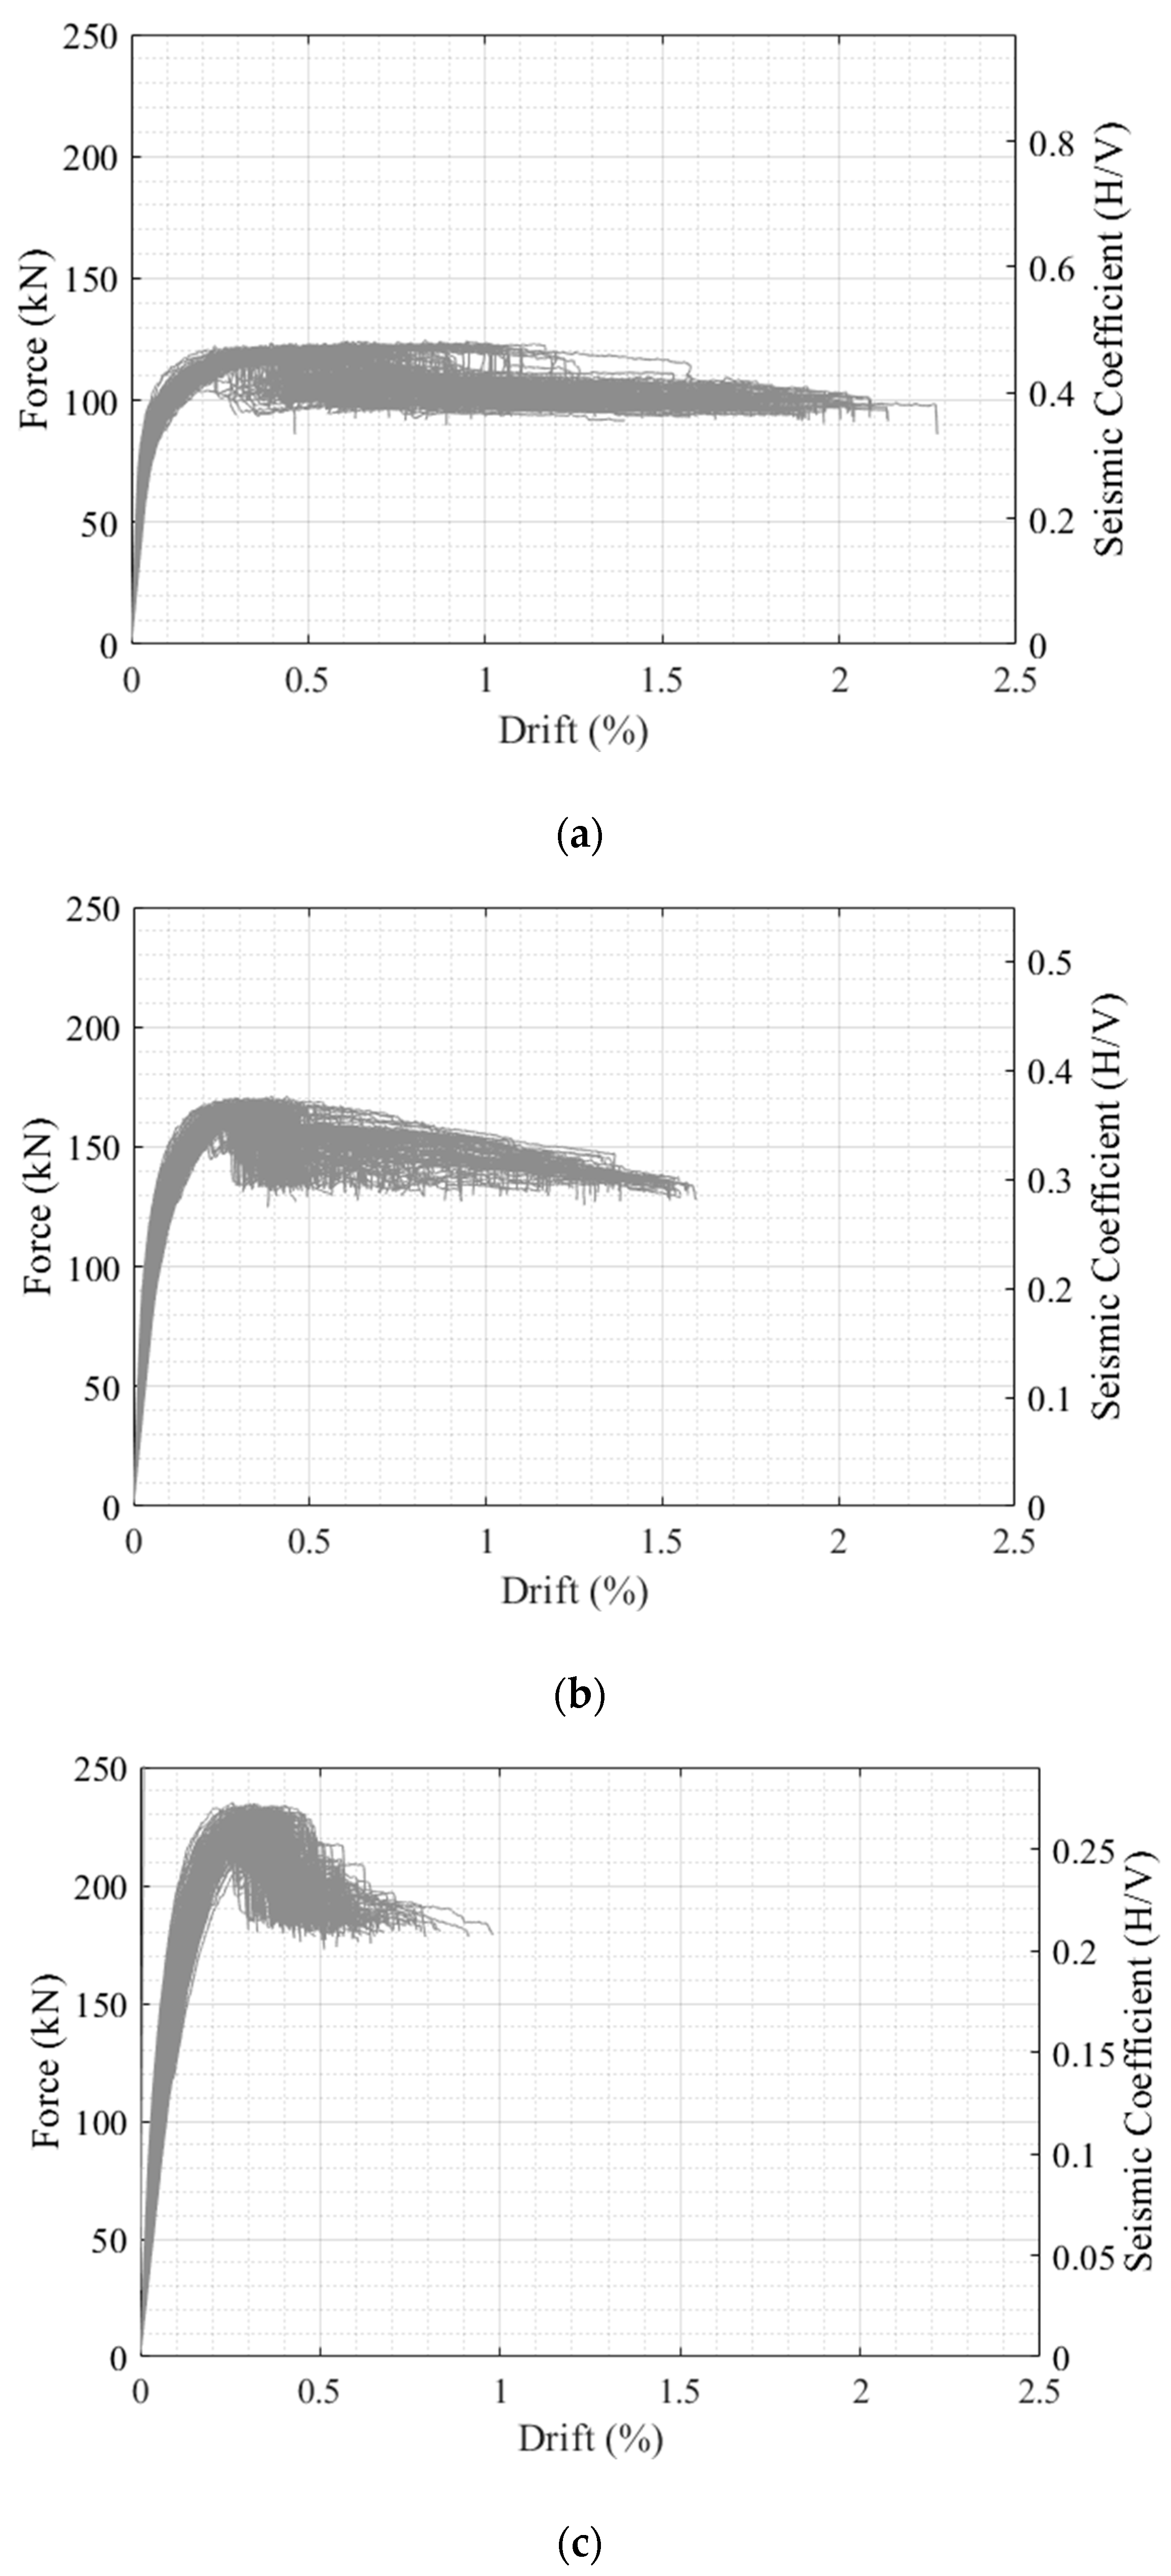
As expected and depicted in Figure 4a–c, the increasing precompression stress level increased the lateral load-carrying capacity. On the other hand, the seismic coefficient was between 0.42–0.48 for the low pressure, whereas it decreased to 0.34–0.37 for the medium pressure and 0.25–0.27 for the high pressure. The decrease stems from the increased vertical forces on the piers. The increase in the load capacity brought about a decrease in the lateral displacement capacity of the system, which is noted in Table 2.
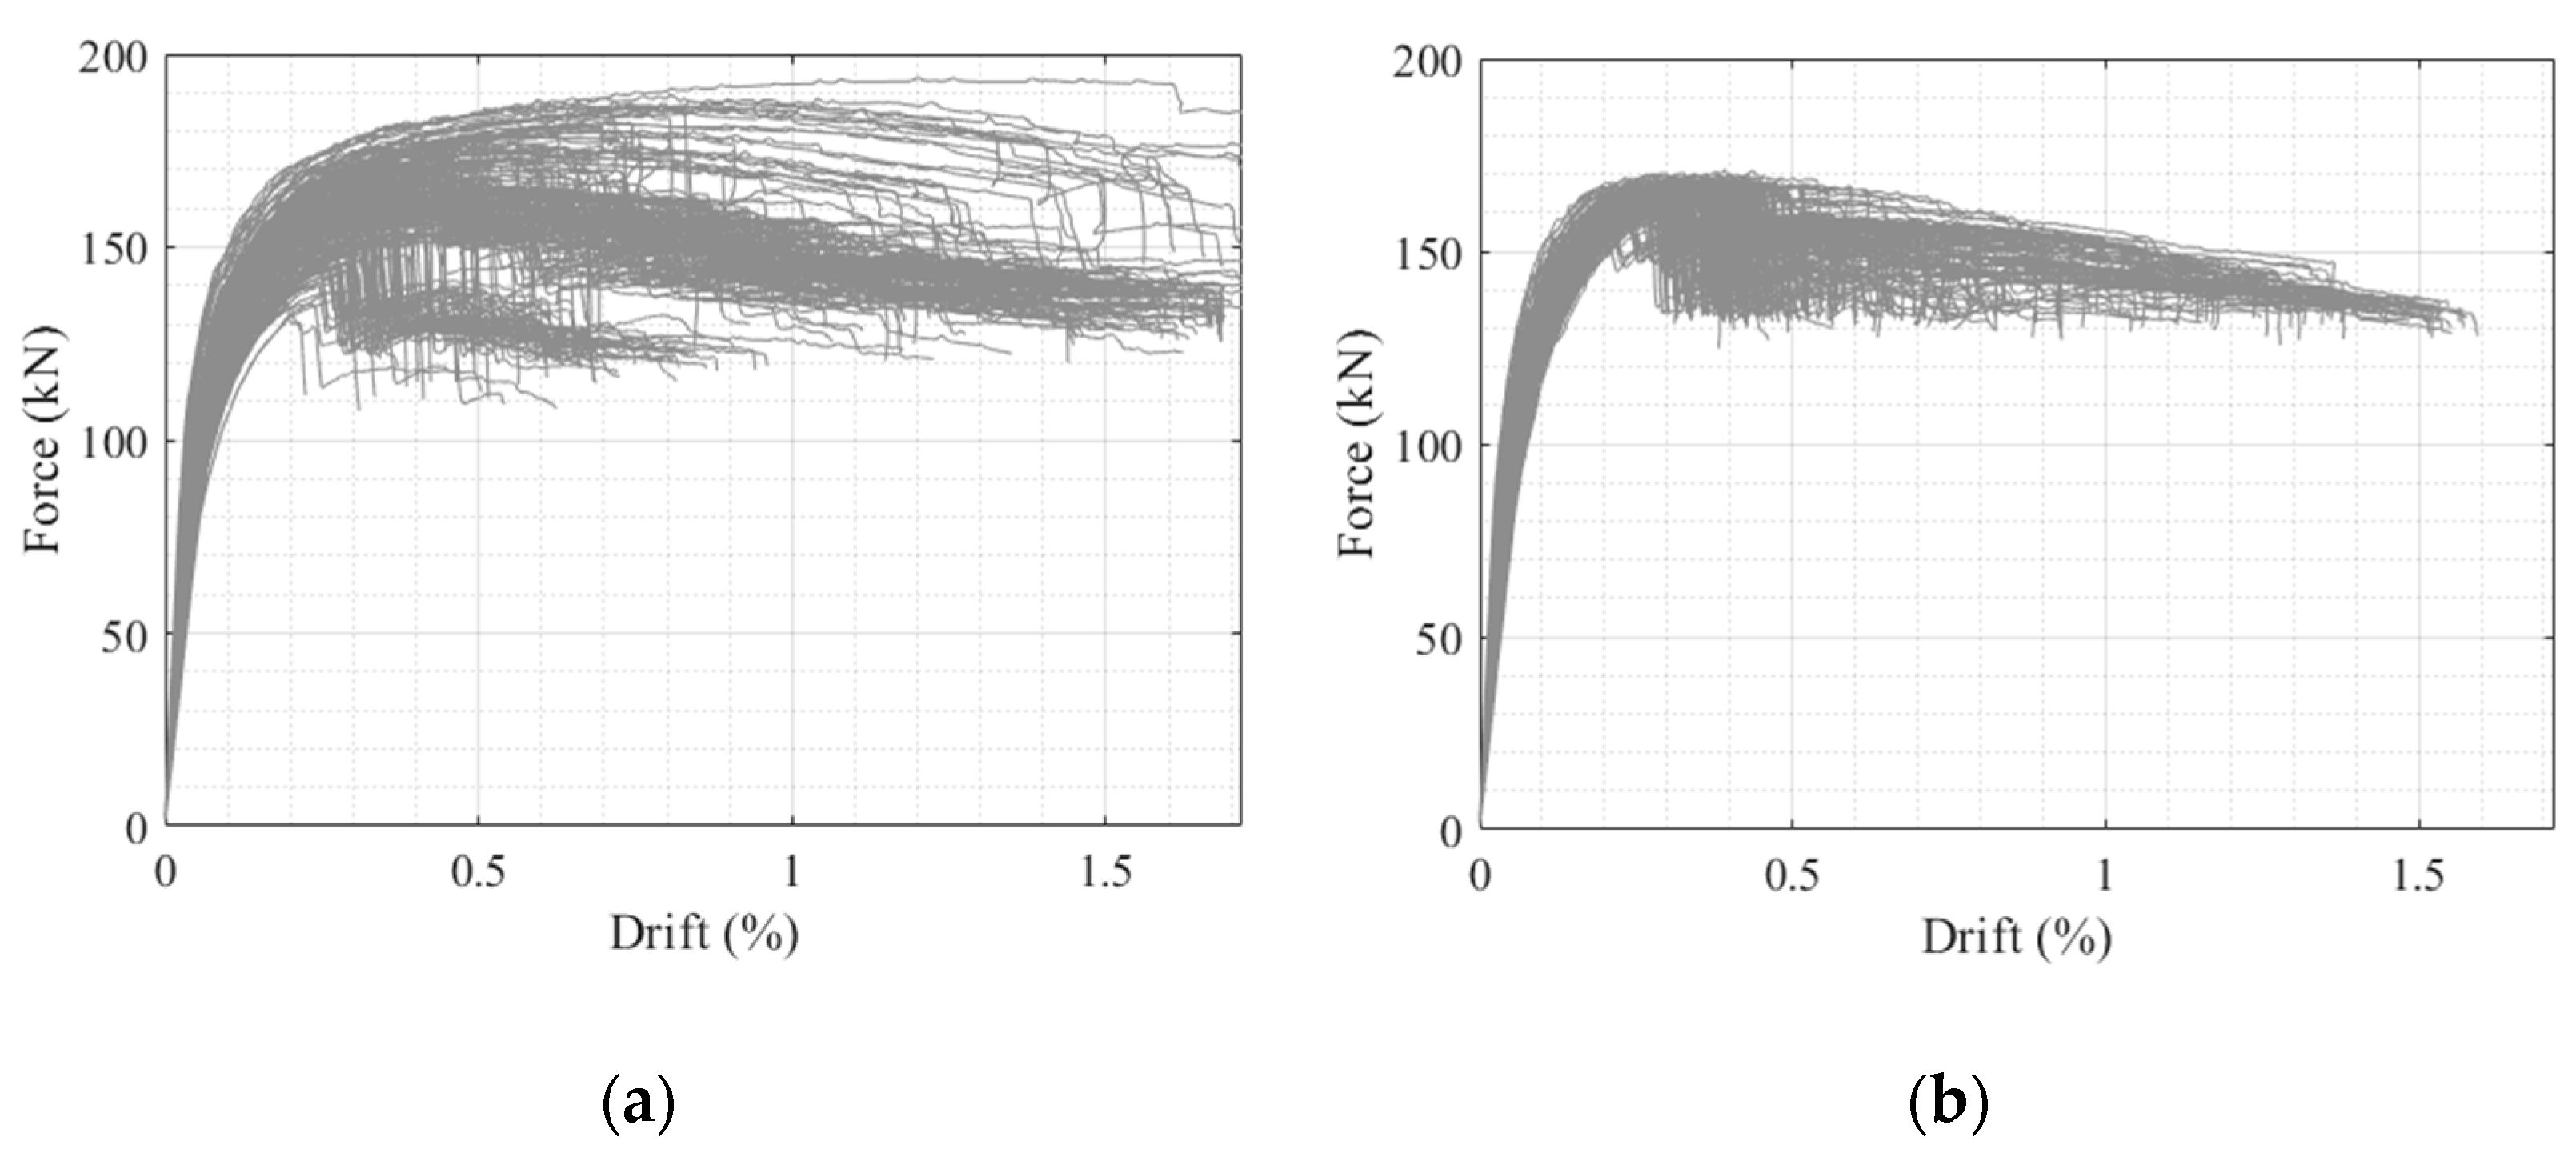
The average maximum values of the peak lateral resisting force (Hmax) and their coefficient of variation are outlined in Table 2. It was observed that the variation in the maximum lateral load was much lower than the variability of the ultimate drift (θmax), complying with the existing literature and the authors’ previous work on the same pier–spandrel system. For all cases considered, the variation in the maximum lateral load was less than 3%, indicating a highly reliable estimation of the load-carrying capacity. This phenomenon can also be observed in Figure 5, where the force–drift curves are given for both nonspatial and spatial analyses. Still, the ultimate drifts, considered at 0.8 Hmax on the postpeak descending branch of force–displacement curves, had significantly higher CoV, ranging between 23% and 54%, which highlights the noticeable variation in the displacement capacity. A different observation made in this study was the decrease in the variation in the average maximum lateral load when the spatial variation in the material properties was considered. This phenomenon is better observed in Figure 5a, where the response was visually more dispersed than the one in Figure 5b.
Another observation was the significant change in the drift response with the changing vertical precompression levels, see Table 2. The variability was much less for the high-pressure level, where presumably a more uniform failure pattern and force–drift behavior was observed, as seen in Figure 4c. On the contrary, the medium-level pressure results incorporated a highly variable response, also manifested in the CoV of maximum drifts.
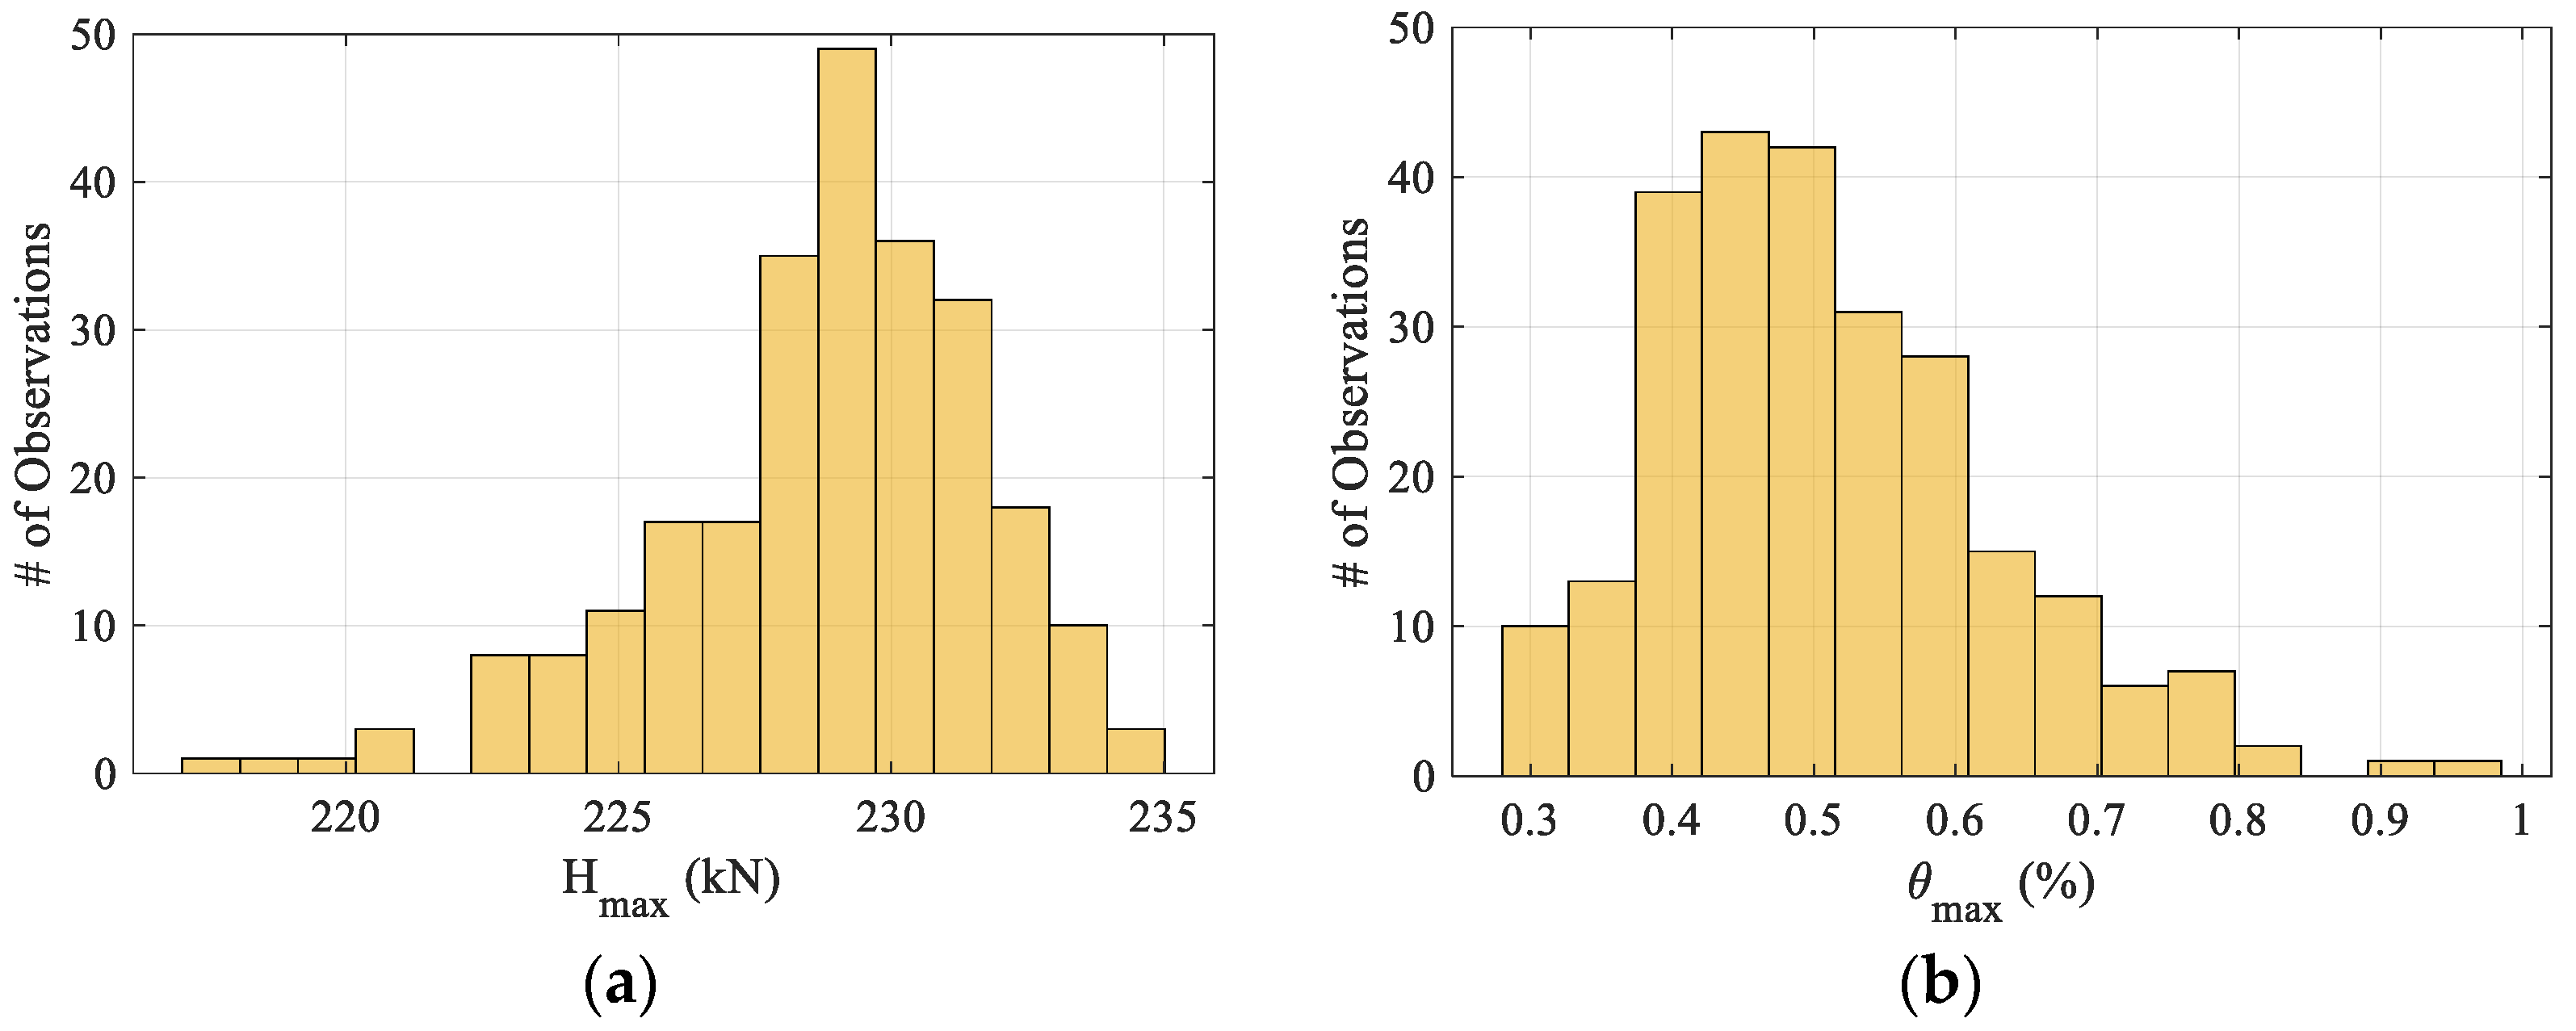
Given that the failure modes were well separated, the statistical distributions of the load and drift capacities might be investigated and later used in a reliability assessment. As seen in Figure 6, for the high precompression loads where the behavior was more uniform, these distributions resembled beta and lognormal distributions. Further research is required to observe and quantify how the response parameters change together with their relationship with the failure mechanisms.

5. Conclusions

This study explored the lateral load-carrying capacity of URM pier–spandrel systems subjected to different precompression loads. The adopted computational model, validated earlier, explicitly represented the weak planes (i.e., unit–mortar interfaces) and masonry units as a system of rigid blocks and considered the uncertainty in the material properties. Moreover, the proposed modeling strategy offered a spatial variation in the strength properties of the mortar joints and units embedded in the contact points. There were 250 simulations performed for each precompression pressure, denoted as low, medium, and high. According to the analyses, the conclusions are summarized as follows.
Compared to the authors’ previous study, where a nonspatial probabilistic analysis was performed, remarkably less variation in the average maximum lateral load was found considering the spatial variation in the material properties. The adopted spatial probabilistic D-RBA provided considerably less variation in the ultimate load (lower than 3%) as opposed to the ultimate drifts, which had a coefficient of variation ranging from 23% to 54%.
Furthermore, the effect of higher vertical pressure on the variation in ultimate drift (corresponding to 80% of the maximum lateral force) was noticed. Compared to medium and low precompression loads, more consistent force–displacement (or force vs. drift) responses were obtained with relatively less variation in the maximum displacement. This observation suggests that there should be less variation in the collapse mechanism in pier–spandrel systems when the vertical pressure gets higher. In future studies, the authors will further investigate this phenomenon by implementing automatic damage classification algorithms to exploit the type of collapse mechanism and the relationship between the applied vertical pressure. Overall, these conclusions strengthen the probabilistic analysis of URM structures and provide a detailed understanding of their structural behavior.

Author Contributions

Software, writing—review and editing, investigation, and methodology, B.P.; writing—original draft preparation, methodology, and conceptualization, S.G.; conceptualization, methodology, investigation, and writing—review and editing, F.P. All authors have read and agreed to the published version of the manuscript.

Funding

This research received no external funding.

Data Availability Statement

Not applicable.

Conflicts of Interest

The authors declare no conflict of interest.

References

  1. Gonen, S.; Soyoz, S. Investigations on the Elasticity Modulus of Stone Masonry. Structures 2021, 30, 378–389. [Google Scholar] [CrossRef]
  2. Bosiljkov, V.; D’Ayala, D.; Novelli, V. Evaluation of Uncertainties in Determining the Seismic Vulnerability of Historic Masonry Buildings in Slovenia: Use of Macro-Element and Structural Element Modelling. Bull. Earthq. Eng. 2015, 13, 311–329. [Google Scholar] [CrossRef]
  3. Isfeld, A.C.; Stewart, M.G.; Masia, M.J. Stochastic Finite Element Model Assessing Length Effect for Unreinforced Masonry Walls Subjected to One-Way Vertical Bending under out-of-Plane Loading. Eng. Struct. 2021, 236, 112115. [Google Scholar] [CrossRef]
  4. Tondelli, M.; Rota, M.; Penna, A.; Magenes, G. Evaluation of Uncertainties in the Seismic Assessment of Existing Masonry Buildings. J. Earthq. Eng. 2012, 16, 36–64. [Google Scholar] [CrossRef]
  5. Gonen, S.; Soyoz, S. Reliability-Based Seismic Performance of Masonry Arch Bridges. Struct. Infrastruct. Eng. 2022, 18, 1658–1673. [Google Scholar] [CrossRef]
  6. Gonen, S.; Pulatsu, B.; Soyoz, S.; Erdogmus, E. Stochastic Discontinuum Analysis of Unreinforced Masonry Walls: Lateral Capacity and Performance Assessments. Eng. Struct. 2021, 238, 112175. [Google Scholar] [CrossRef]
  7. Parisi, F.; Augenti, N. Uncertainty in Seismic Capacity of Masonry Buildings. Buildings 2012, 2, 218–230. [Google Scholar] [CrossRef] [Green Version]
  8. Müller, D.; Graubner, C.-A. Assessment of Masonry Compressive Strength in Existing Structures Using a Bayesian Method. ASCE-ASME J. Risk Uncertain. Eng. Syst. Part A Civ. Eng. 2021, 7, 04020057. [Google Scholar] [CrossRef]
  9. Gooch, L.J.; Masia, M.J.; Stewart, M.G. Application of Stochastic Numerical Analyses in the Assessment of Spatially Variable Unreinforced Masonry Walls Subjected to In-Plane Shear Loading. Eng. Struct. 2021, 235, 112095. [Google Scholar] [CrossRef]
  10. Pulatsu, B.; Gonen, S.; Parisi, F.; Erdogmus, E.; Tuncay, K.; Funari, M.F.; Lourenço, P.B. Probabilistic Approach to Assess URM Walls with Openings Using Discrete Rigid Block Analysis (D-RBA). J. Build. Eng. 2022, 61, 105269. [Google Scholar] [CrossRef]
  11. Gonen, S.; Pulatsu, B.; Lourenço, P.B.; Lemos, V.; Tuncay, K.; Erduran, E. Analysis and Prediction of Masonry Wallette Strength under Combined Compression-Bending via Stochastic Computational Modeling. Eng. Struct. 2023, 278, 115492. [Google Scholar] [CrossRef]
  12. Li, J.; Masia, M.J.; Stewart, M.G. Stochastic Spatial Modelling of Material Properties and Structural Strength of Unreinforced Masonry in Two-Way Bending. Struct. Infrastruct. Eng. 2017, 13, 683–695. [Google Scholar] [CrossRef]
  13. Müller, D.; Förster, V.; Graubner, C.-A. Influence of Material Spatial Variability on Required Safety Factors for Masonry Walls in Compression. Mauerwerk 2017, 21, 209–222. [Google Scholar] [CrossRef]
  14. Tabbakhha, M.; Deodatis, G. Effect of Uncertainty of Tensile Strength of Mortar Joints on the Behavior of Masonry Walls under Lateral Loads. J. Struct. Eng. 2017, 143, 04016166. [Google Scholar] [CrossRef]
  15. Backes, H.P. Tensile Strength of Masonry. In Proceedings of the 7th International Brick Masonry Conference, Melbourne, Australia, 17–20 February 1985; pp. 779–790. [Google Scholar]
  16. Pulatsu, B.; Gonen, S.; Erdogmus, E.; Lourenço, P.B.; Lemos, J.V.; Hazzard, J. Tensile Fracture Mechanism of Masonry Wallettes Parallel to Bed Joints: A Stochastic Discontinuum Analysis. Modelling 2020, 1, 78–93. [Google Scholar] [CrossRef]
  17. Pulatsu, B.; Erdogmus, E.; Lourenço, P.B.; Lemos, J.V.; Hazzard, J. Discontinuum Analysis of the Fracture Mechanism in Masonry Prisms and Wallettes via Discrete Element Method. Meccanica 2020, 55, 505–523. [Google Scholar] [CrossRef]
  18. Augenti, N.; Parisi, F. Learning from Construction Failures Due to the 2009 L’Aquila, Italy, Earthquake. J. Perform. Constr. Facil. 2010, 24, 536–555. [Google Scholar] [CrossRef]
  19. Vlachakis, G.; Vlachaki, E.; Lourenço, P.B. Learning from Failure: Damage and Failure of Masonry Structures, after the 2017 Lesvos Earthquake (Greece). Eng. Fail. Anal. 2020, 117, 104803. [Google Scholar] [CrossRef]
  20. Borri, A.; Corradi, M.; De Maria, A. The Failure of Masonry Walls by Disaggregation and the Masonry Quality Index. Heritage 2020, 3, 1162–1198. [Google Scholar] [CrossRef]
  21. Lourenço, P.B. Computational Strategies for Masonry Structures; Faculdade de Engenharia da Universidade do Porto: Porto, Portugal, 1996. [Google Scholar]
  22. Lourenço, P.B.; Rots, J.G.; Blaauwendraad, J. Continuum Model for Masonry: Parameter Estimation and Validation. J. Struct. Eng. 1998, 124, 642–652. [Google Scholar] [CrossRef]
  23. Saloustros, S.; Pelà, L.; Cervera, M.; Roca, P. An Enhanced Finite Element Macro-Model for the Realistic Simulation of Localized Cracks in Masonry Structures: A Large-Scale Application. Int. J. Archit. Herit. 2018, 12, 432–447. [Google Scholar] [CrossRef] [Green Version]
  24. Roca, P.; Cervera, M.; Gariup, G.; Pela’, L. Structural Analysis of Masonry Historical Constructions. Classical and Advanced Approaches. Arch. Comput. Methods Eng. 2010, 17, 299–325. [Google Scholar] [CrossRef] [Green Version]
  25. Pelà, L.; Cervera, M.; Roca, P. An Orthotropic Damage Model for the Analysis of Masonry Structures. Constr. Build. Mater. 2013, 41, 957–967. [Google Scholar] [CrossRef]
  26. Pelà, L.; Cervera, M.; Oller, S.; Chiumenti, M. A Localized Mapped Damage Model for Orthotropic Materials. Eng. Fract. Mech. 2014, 124–125, 196–216. [Google Scholar] [CrossRef]
  27. Gonen, S.; Soyoz, S. Seismic Analysis of a Masonry Arch Bridge Using Multiple Methodologies. Eng. Struct. 2021, 226, 111354. [Google Scholar] [CrossRef]
  28. Petracca, M.; Camata, G.; Spacone, E.; Pelà, L. Efficient Constitutive Model for Continuous Micro-Modeling of Masonry Structures. Int. J. Archit. Herit. 2022, 1–13. [Google Scholar] [CrossRef]
  29. Massart, T.J.; Peerlings, R.H.J.; Geers, M.G.D. Mesoscopic Modeling of Failure and Damage-Induced Anisotropy in Brick Masonry. Eur. J. Mech. A/Solids 2004, 23, 719–735. [Google Scholar] [CrossRef]
  30. Massart, T.J.; Peerlings, R.H.J.; Geers, M.G.D. Structural Damage Analysis of Masonry Walls Using Computational Homogenization. Int. J. Damage Mech. 2007, 16, 199–226. [Google Scholar] [CrossRef]
  31. Calderini, C.; Lagomarsino, S. Continuum Model for In-Plane Anisotropic Inelastic Behavior of Masonry. J. Struct. Eng. 2008, 134, 209–220. [Google Scholar] [CrossRef]
  32. Pascuzzo, A.; Greco, F.; Leonetti, L.; Lonetti, P.; Ronchei, C.; Gaetano, D. An Interface-Based Detailed Micro-Model for the Failure Simulation of Masonry Structures. Eng. Fail. Anal. 2022, 142, 106753. [Google Scholar] [CrossRef]
  33. Pulatsu, B.; Erdogmus, E.; Lourenço, P.B.; Quey, R. Simulation of Uniaxial Tensile Behavior of Quasi-Brittle Materials Using Softening Contact Models in DEM. Int. J. Fract. 2019, 217, 105–125. [Google Scholar] [CrossRef]
  34. Zhang, S.; Taheri Mousavi, S.M.; Richart, N.; Molinari, J.F.; Beyer, K. Micro-Mechanical Finite Element Modeling of Diagonal Compression Test for Historical Stone Masonry Structure. Int. J. Solids Struct. 2017, 112, 122–132. [Google Scholar] [CrossRef]
  35. Cross, T.; De Luca, F.; De Risi, R.; Camata, G.; Petracca, M. Micro-Modelling of Stone Masonry Template Buildings as a Strategy for Seismic Risk Assessment in Developing Countries. Eng. Struct. 2023, 274, 114910. [Google Scholar] [CrossRef]
  36. Guo, Y.T.; Bompa, D.V.; Elghazouli, A.Y. Nonlinear Numerical Assessments for the In-Plane Response of Historic Masonry Walls. Eng. Struct. 2022, 268, 114734. [Google Scholar] [CrossRef]
  37. Nie, Y.; Sheikh, A.; Visintin, P.; Griffith, M. An Interfacial Damage-Plastic Model for the Simulation of Masonry Structures under Monotonic and Cyclic Loadings. Eng. Fract. Mech. 2022, 271, 108645. [Google Scholar] [CrossRef]
  38. Chang, L.-Z.; Rots, J.G.; Esposito, R. Influence of Aspect Ratio and Pre-Compression on Force Capacity of Unreinforced Masonry Walls in out-of-Plane Two-Way Bending. Eng. Struct. 2021, 249, 113350. [Google Scholar] [CrossRef]
  39. Noor-E-Khuda, S.; Dhanasekar, M.; Thambiratnam, D.P. An Explicit Finite Element Modelling Method for Masonry Walls under Out-of-Plane Loading. Eng. Struct. 2016, 113, 103–120. [Google Scholar] [CrossRef] [Green Version]
  40. Abdulla, K.F.; Cunningham, L.S.; Gillie, M. Simulating Masonry Wall Behaviour Using a Simplified Micro-Model Approach. Eng. Struct. 2017, 151, 349–365. [Google Scholar] [CrossRef]
  41. Gonen, S.; Pulatsu, B.; Erdogmus, E.; Lourenço, P.B.; Soyoz, S. Effects of Spatial Variability and Correlation in Stochastic Discontinuum Analysis of Unreinforced Masonry Walls. Constr. Build. Mater. 2022, 337, 127511. [Google Scholar] [CrossRef]
  42. Patel, K.P.; Dubey, R.N. Effect of Flanges on the In-Plane Behavior of the Masonry Walls. Eng. Struct. 2022, 273, 115059. [Google Scholar] [CrossRef]
  43. Kesavan, P.; Menon, A. Investigation of In-Plane and out-of-Plane Interaction in Unreinforced Masonry Piers by Block-Based Micro-Modeling. Structures 2022, 46, 1327–1344. [Google Scholar] [CrossRef]
  44. Gonen, S.; Pulatsu, B.; Erdogmus, E.; Karaesmen, E.; Karaesmen, E. Quasi-Static Nonlinear Seismic Assessment of a Fourth Century A.D. Roman Aqueduct in Istanbul, Turkey. Heritage 2021, 4, 401–421. [Google Scholar] [CrossRef]
  45. Celano, T.; Argiento, L.U.; Ceroni, F.; Casapulla, C. Literature Review of the In-Plane Behavior of Masonry Walls: Theoretical vs. Experimental Results. Materials 2021, 14, 3063. [Google Scholar] [CrossRef] [PubMed]
  46. Lourenço, P.B.; Oliveira, D.V.; Roca, P.; Orduña, A. Dry Joint Stone Masonry Walls Subjected to In-Plane Combined Loading. J. Struct. Eng. 2005, 131, 1665–1673. [Google Scholar] [CrossRef] [Green Version]
  47. Malomo, D.; DeJong, M.J.; Penna, A. Influence of Bond Pattern on the In-Plane Behavior of URM Piers. Int. J. Archit. Herit. 2021, 15, 1492–1511. [Google Scholar] [CrossRef]
  48. Pulatsu, B.; Bretas, E.M.; Lourenço, P.B. Discrete Element Modeling of Masonry Structures: Validation and Application. Earthquakes Struct. 2016, 11, 563–582. [Google Scholar] [CrossRef]
  49. Beyer, K. Peak and Residual Strengths of Brick Masonry Spandrels. Eng. Struct. 2012, 41, 533–547. [Google Scholar] [CrossRef] [Green Version]
  50. Beyer, K.; Mangalathu, S. Numerical Study on the Peak Strength of Masonry Spandrels with Arches. J. Earthq. Eng. 2014, 18, 169–186. [Google Scholar] [CrossRef] [Green Version]
  51. Foraboschi, P. Coupling Effect between Masonry Spandrels and Piers. Mater. Struct. Constr. 2009, 42, 279–300. [Google Scholar] [CrossRef]
  52. Liu, Z.; Crewe, A. Effects of Size and Position of Openings on In-Plane Capacity of Unreinforced Masonry Walls. Bull. Earthq. Eng. 2020, 18, 4783–4812. [Google Scholar] [CrossRef]
  53. Parisi, F.; Lignola, G.P.; Augenti, N.; Prota, A.; Manfredi, G. Rocking Response Assessment of In-Plane Laterally-Loaded Masonry Walls with Openings. Eng. Struct. 2013, 56, 1234–1248. [Google Scholar] [CrossRef]
  54. Nowak, R.; Orłowicz, R. Testing of Chosen Masonry Arched Lintels. Int. J. Archit. Herit. 2021, 15, 1895–1909. [Google Scholar] [CrossRef]
  55. Cundall, P.A. A Computer Model for Simulating Progressive, Large-Scale Movements in Blocky Rock Systems. In Proceedings of the The International Symposium on Rock Mechanics, Nancy, France, 4–6 October 1971; Volume 2, pp. 47–65. [Google Scholar]
  56. Lemos, J.V. Discrete Element Modeling of the Seismic Behavior of Stone Masonry Arches. In Proceedings of the Computer Methods in Structural Masonry, Florence, Italy, 3–5 September 1997; pp. 220–227. [Google Scholar]
  57. Foti, D.; Vacca, V.; Facchini, I. DEM Modeling and Experimental Analysis of the Static Behavior of a Dry-Joints Masonry Cross Vaults. Constr. Build. Mater. 2018, 170, 111–120. [Google Scholar] [CrossRef]
  58. Hamp, E.; Gerber, R.; Pulatsu, B.; Quintero, M.S.; Erochko, J. Nonlinear Seismic Assessment of a Historic Rubble Masonry Building via Simplified and Advanced Computational Approaches. Buildings 2022, 12, 1130. [Google Scholar] [CrossRef]
  59. Pulatsu, B.; Sarhosis, V.; Bretas, E.M.; Nikitas, N.; Lourenço, P.B. Non-Linear Static Behaviour of Ancient Free-Standing Stone Columns. Struct. Build. 2017, 170, 406–418. [Google Scholar] [CrossRef]
  60. Tavafi, E.; Mohebkhah, A.; Sarhosis, V. Seismic Behavior of the Cube of Zoroaster Tower Using the Discrete Element Method. Int. J. Archit. Herit. 2019, 15, 1097–1112. [Google Scholar] [CrossRef]
  61. Sarhosis, V.; Forgács, T.; Lemos, J. Stochastic Strength Prediction of Masonry Structures: A Methodological Approach or a Way Forward? RILEM Tech. Lett. 2020, 4, 122–129. [Google Scholar] [CrossRef]
  62. Malomo, D.; DeJong, M.J. A Macro-Distinct Element Model (M-DEM) for out-of-Plane Analysis of Unreinforced Masonry Structures. Eng. Struct. 2021, 244, 112754. [Google Scholar] [CrossRef]
  63. Malomo, D.; DeJong, M.J. A Macro-Distinct Element Model (M-DEM) for Simulating the in-Plane Cyclic Behavior of URM Structures. Eng. Struct. 2021, 227, 111428. [Google Scholar] [CrossRef]
  64. Erdogmus, E.; Pulatsu, B.; Gaggioli, A.; Hoff, M. Reverse Engineering a Fully Collapsed Ancient Roman Temple through Geoarchaeology and DEM. Int. J. Archit. Herit. 2021, 15, 1795–1815. [Google Scholar] [CrossRef]
  65. Mendes, N.; Zanotti, S.; Lemos, J.V. Seismic Performance of Historical Buildings Based on Discrete Element Method: An Adobe Church. J. Earthq. Eng. 2020, 24, 1270–1289. [Google Scholar] [CrossRef]
  66. Bretas, E.M.; Léger, P.; Lemos, J.V. 3D Stability Analysis of Gravity Dams on Sloped Rock Foundations Using the Limit Equilibrium Method. Comput. Geotech. 2012, 44, 147–156. [Google Scholar] [CrossRef] [Green Version]
  67. Lourenço, P.B.; Rots, J.G. Multisurface Interface Model for Analysis of Masonry Structures. J. Eng. Mech. 1997, 123, 660–668. [Google Scholar] [CrossRef]
  68. Cundall, P.A. Formulation of a Three-Dimensional Disctinct Element Model—Part I. A Scheme to Detect and Represent Contacts in a System Composed of Many Polyhedral Blocks. Int. J. Rock Mech. Min. Sci. Geomech. 1988, 25, 107–116. [Google Scholar] [CrossRef]
  69. Pulatsu, B.; Erdogmus, E.; Lourenço, P.B.; Lemos, J.V.; Tuncay, K. Simulation of the In-Plane Structural Behavior of Unreinforced Masonry Walls and Buildings Using DEM. Structures 2020, 27, 2274–2287. [Google Scholar] [CrossRef]
  70. Pulatsu, B.; Gonen, S.; Erdogmus, E.; Lourenço, P.B.; Lemos, J.V.; Prakash, R. In-Plane Structural Performance of Dry-Joint Stone Masonry Walls: A Spatial and Non-Spatial Stochastic Discontinuum Analysis. Eng. Struct. 2021, 242, 112620. [Google Scholar] [CrossRef]
  71. Cundall, P.; Detournay, C. Dynamic Relaxation Applied to Continuum and Discontinuum Numerical Models in Geomechanics. In Rock Mechanics and Engineering; CRC Press: Boca Raton, FL, USA, 2017; Volume 3, pp. 45–90. [Google Scholar] [CrossRef]
  72. Itasca Consulting Group Inc. 3DEC Three Dimensional Distinct Element Code 2013.
  73. Parisi, F.; Augenti, N.; Prota, A. Implications of the Spandrel Type on the Lateral Behavior of Unreinforced Masonry Walls. Earthq. Eng. Struct. Dyn. 2014, 43, 1867–1887. [Google Scholar] [CrossRef]
  74. Augenti, N.; Parisi, F. Constitutive Models for Tuff Masonry under Uniaxial Compression. J. Mater. Civ. Eng. 2010, 22, 1102–1111. [Google Scholar] [CrossRef]
  75. Augenti, N.; Parisi, F. Constitutive Modelling of Tuff Masonry in Direct Shear. Constr. Build. Mater. 2011, 25, 1612–1620. [Google Scholar] [CrossRef]
  76. Lourenço, P.B. Recent Advances in Masonry Structures: Micromodelling and Homogenisation. In Multiscale Modeling in Solid Mechanics: Computational Approaches; Imperial College Press: London, UK, 2009; pp. 251–294. [Google Scholar]
  77. Pina-Henriques, J.; Lourenço, P.B. Masonry Compression: A Numerical Investigation at the Meso-Level. Eng. Comput. 2006, 23, 382–407. [Google Scholar] [CrossRef] [Green Version]
  78. Li, J.; Stewart, M.G.; Masia, M.J.; Lawrence, S.J. Spatial Correlation of Material Properties and Structural Strength of Masonry in Horizontal Bending. J. Struct. Eng. 2016, 142, 04016112. [Google Scholar] [CrossRef]
  79. Stein, M. Large Sample Properties of Simulations Using Latin Hypercube Sampling. Technometrics 1987, 29, 143–151. [Google Scholar] [CrossRef]
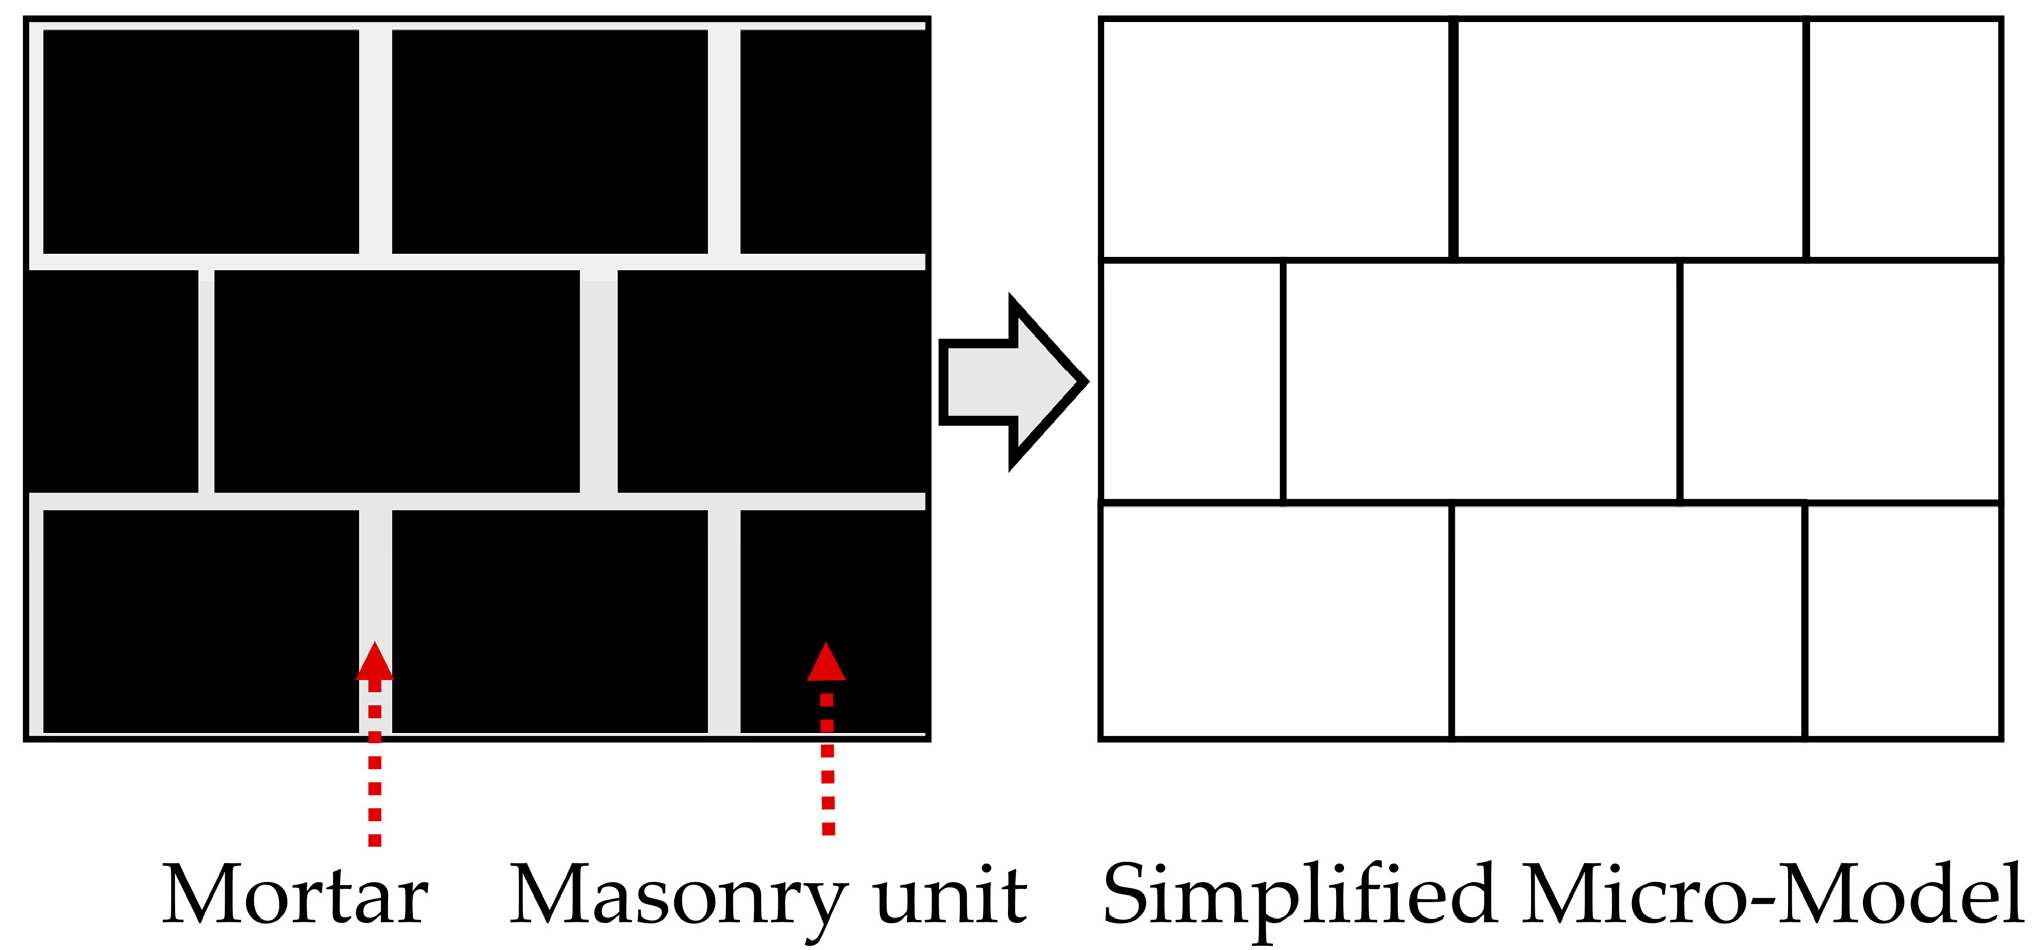
Figure 1. Illustration of the simplified micromodel of a regular masonry texture.
Buildings 13 00203 g001
Figure 2. Representation of point contact hypothesis and spring-frictional element model.
Buildings 13 00203 g002
Figure 3. Illustration of the loading pattern and results obtained from D-RBA: (a) representation of external loads, (b) collapse mechanism, and (c) failed contact points (tension combined with shear) along the unit–mortar interfaces (shown in red).
Buildings 13 00203 g003
Figure 4. Force and seismic coefficient under varying drift for (a) low, (b) medium, and (c) high vertical pressures.
Buildings 13 00203 g004
Figure 5. Force–drift curves obtained from (a) nonspatial analysis [10] and (b) spatial analysis of the present study (vertical force above each pier is 200 kN).
Buildings 13 00203 g005
Figure 6. Ultimate force ( H m a x ) and drift ( θ m a x ) distributions for high precompression analyses, illustrated in (a) and (b), respectively.
Buildings 13 00203 g006
Table 1. Variables, probability distributions, and statistical parameters.
Random VariableProbability DistributionMean (μ)Coefficient of Variation (CoV)
f c , m   M P a Normal3.960.125
f t , j M P a Lognormal0.150.30
f t ,   u M P a Lognormal0.230.22
ϕ   ° Normal160.20
Dependent VariableRelationship
c 1.5 f t , j
G f I 0.029 f t , b o n d
G C 3.2 f m
Table 2. Average maximum lateral force and drift for each precompression level.
Low Pressure (0.20 MPa)Medium Pressure (0.38 MPa)High Pressure (0.75 MPa)
Spatial H m a x Mean (kN)120.3166.3228.8
CoV0.020.010.01
θ m a x Mean (%)1.230.730.51
CoV0.400.540.23
Nonspatial [10] H m a x Mean (kN)N/A163.3N/A
CoV0.07
θ m a x Mean (%)N/A1.10N/A
CoV0.43
Disclaimer/Publisher’s Note: The statements, opinions and data contained in all publications are solely those of the individual author(s) and contributor(s) and not of MDPI and/or the editor(s). MDPI and/or the editor(s) disclaim responsibility for any injury to people or property resulting from any ideas, methods, instructions or products referred to in the content.