Abstract
Shear failure of reinforced concrete (RC) members belongs to brittle failure and has always been concerned. In this paper, 16 existing shear strength models of RC slender beams have been selected and comprehensively compared based on a set of 781 experimental test results. These formulas from eight national codes and eight published papers are mainly the semi-empirical models or the analytical models. These experimental test results were collected from 66 published papers, and the range of key parameters is relatively wide. The accuracy of these shear strength models is evaluated from overall prediction level and the effect of key parameters. These key parameters mainly contain concrete compressive strength, shear-span-to-depth ratio, effective depth, and stirrup ratio. According to the results of overall prediction and evaluation of key parameters, the prediction results of Zsutty’s, Gunawan’s, and Bazant–Kim’s models are more accurate than others for both beams with stirrups and without stirrups. The models of ACI and JSCE exhibit higher prediction accuracy and safety margin, and their average values are between 1.19 and 1.28. The results of this study may provide reference for the selection and/or improvement of the shear strength model for RC slender beams.
1. Introduction
It is well acknowledged that brittle shear failure is one of the most dangerous failure modes for reinforced concrete (RC) slender beams. The RC slender beam is a kind of RC structural member with a relatively large shear span-to-depth ratio (a/d) or span-to-height ratio (a/h), and there are different values defined in various articles and codes, e.g., a/d > 2.5 in Kani [1] and ACI 318 [2], a/d > 2 in JSCE [3], and a/h > 3 in EC2 [4]. The shear behavior of RC slender beams is complicated and influenced by many factors, such as concrete compressive strength, stirrup ratio, shear span-to-depth ratio, and longitudinal reinforcement ratio [5,6,7,8]. Thus far, numerous research studies on shear performances of RC slender beams have been carried out, and a large number of shear models have been proposed. For practical engineering design, it is essential that the shear strength model has good prediction performance.
The existing shear strength formulas of RC beams can mainly be classified into five categories according to mechanisms and methodologies, including the empirical models, semi-empirical models, mechanics-based approaches, probabilistic models, and machine learning-based models. The empirical models are exclusively derived from the regression analysis of experimental data, which includes primary influencing factors in the formulas. The mechanics-based models are proposed based on a mechanics principle. The typical mechanical models contain a truss model [9,10,11,12], critical shear crack theory [13], modified compression field theory [14], compressive force path concept [15,16], strain-based shear strength model [17,18], splitting failure theory [19], and plasticity theory [20,21,22]. The semi-empirical models are developed according to the mechanics-based models, and their coefficients are determined through the fitting of shear test results. The existing shear strength formulas in the literature and national codes are semi-empirical models, i.e., the shear models in ACI318 [2] and GB50010 [23] codes. Collins and Kuchma [24] modified the shear model of ACI 318 by considering the influence of the size effect. Khuntia et al. [25] considered beam size, type of loading and beam supports. Kuo et al. [26] modified the ACI 318 [2] model by combining the function of shear span-to-depth ratio from the UH method [27,28] and the web compression area from Frosch [29] for considering the arch action effect and the effect of longitudinal reinforcement ratio. Since the size effect is an important influencing factor for shear strength, it was also considered in CEB-FIP MC90 [30] and EC2 codes [4]. These models were established based on the variable angle truss model. The interaction between the bond action of longitudinal reinforcements and dowel action and the contribution of the dowel action, aggregate interlock, and the concrete compressive zone were considered in shear strength of RC slender beams of Kim [31]. On the basis of the fib model, Huber et al. [32,33] introduced a calibration factor to account for surface roughness. The models of CSA A23.3 [34] and level II approximation of the fib Model Code [35] were based on the modified compression field theory, in which the effect of the nominal maximum size of coarse aggregate was considered. In the semi-empirical model proposed by Zsutty [36], the concrete strength, shear span-to-depth ratio and longitudinal reinforcement ratio were determined by combining the dimensional analysis and regression analysis techniques.
A fact is the differences in forms, parameters and application scopes of these existing shear models. It is worth discussing how to select a model with good prediction accuracy. A series of related studies were carried out. Rao and Injaganeri [37] evaluated the models of codes [2,38] and Bazant’s models [39,40] by adopting a database of 614 beam test data. The results showed that Bazant’s models exhibit higher predictive accuracy. A comparative analysis of eight models based on a database containing 33 experimental studies was performed by Elsanadedy et al. [5]. It was found that the prediction results of the MCFT-based codes are more non-conservative than the other codes. Keskin [41] also conducted an evaluation study to compare the accuracy of nineteen models based on the test data of 1082 beams, including five design codes. The predictions from the models in design codes are poorly correlated with the experimental data, while the models proposed by researchers [19,42,43,44,45] present higher predictive accuracy. There is a contradiction that the evaluation results of the same model may be quite different in these studies. For example, Rahal [46] and Alqarni et al. [47] found that the prediction of the model of EC2 [4] performs better than CSA A23.3 [34]. EC2 [4] predictions are closer to the test data than ACI 318 [2]. However, Nawaz [48] obtained the opposite conclusion. Moreover, the result of EC2 [4] exhibits larger scatter than CSA A23.3 [34] and ACI 318 [2] when they were used in predicting RC beams with stirrups, as reported by Zhang et al. [49]. This phenomenon may be due to the insufficient number of test specimens in the experimental database or a different source for these test data.
In addition to the overall average prediction accuracy of these models, an ideal model should give high prediction accuracy in the variation range of parameters. Most of the existing models may be applicable to a certain range of parameters. The studies focused on the prediction accuracy of the models in different parameter ranges are not enough. These key parameters influencing the shear strength of RC slender beams mainly include the shear span-to-depth ratio, concrete strength, stirrup ratio, and effective depth. The effect of stirrup ratios on the prediction accuracy of shear strength of RC beams was discussed by Russo et al. [50] based on 474 experimental results of beams with stirrup. It was found that EC2 [4] and ACI 318 [2] models provided scatter and conservative predictions. Russo et al. [51] conducted a parametric comparison study concerning the effect of shear span-to-depth on the accuracy of seven models based on 917 experimental results of beams without stirrup. The results indicated that Nielsen’s model [52] was more reasonable than other models in terms of accuracy and scatter of prediction. Arslan [43] studied the prediction accuracy of the models on high-strength concrete beams without stirrup. This study concluded that the models of ACI 318 [2], CSA, EC2 [4], and Collins [24] are excessively conservative for most of the test members, whereas the NZS [53] and Bazant’s model [40] produced unsafe predictions for RC slender beams. Gandomi et al. [54] found that the shear strength models in the above four codes were sensitive to shear span-to-depth ratio and concrete strength. Furthermore, in the report of Ahmad and Bhargava [55], the accuracy of eight models was discussed under various concrete compressive strengths, longitudinal reinforcement ratio, and size of the member. The discussions revealed that the models of Zararis et al. [19] showed higher prediction accuracy under an increased longitudinal ratio, and the model of Niwa et al. [56] exhibited worse accuracy for beams with an effective depth greater than 900 mm. In summary, the key parameters influencing shear strength of RC slender beams are not completely considered evaluated in these models, and the parameter classification interval is unclear, which should be further discussed for the existing models. Therefore, the evaluation study on the existing typical models may be conducted based on a representative database, and the influence of key parameters classification interval also needs further investigation.
In this paper, a detailed comparative analysis of 16 shear strength models for RC slender beams is carried out by using an experimental database with 781 slender beams, which are collected from 66 available studies. The evaluated models contain eight national codes and eight papers, which are mainly the semi-empirical models and the analytical models. The accuracy of these models is evaluated from the overall prediction level and the influence of key parameters. The purpose of this study is to provide a reference for the selection and/or improvement of the shear strength model for RC slender beams.
2. Shear Strength Models of RC Slender Beams and Experimental Database
2.1. Evaluated Shear Strength Models
Based on the experimental database of 781 RC slender beams, the accuracy of 16 shear strength models is evaluated. These models are shown in Appendix A, Table A1 and Table A2, including eight national codes and eight models proposed by different researchers. For the models of national codes, it is recommended that the shear strength of RC beams is the sum of the shear contribution of the concrete term (Vc) and that of the stirrup (Vs). Furthermore, the coefficients of each parameter are determined by fitting the shear strength experimental results. The other eight models are selected from empirical models, mechanics-based models, and semi-empirical models. Among the national codes, the 45° truss model was adopted by GB50010 [23], TS500 [57], ACI 318 [2], and JSCE [3] to consider the shear contribution of the stirrup. TS500 [57] and ACI 318 [2] considered the shear contribution of concrete in the form of , whereas it was considered by GB50010 [23] in the form of tensile strength. Furthermore, ACI 318 [2] considers the longitudinal reinforcement rate and shear span-to-depth ratio. In the JSCE [3] code, the aforementioned variables in addition to size effect (in the form of d−0.25, d is the effective depth) are considered. In EC2 [4], BS8110 [38], and CEB-FIP MC90 [30], the calculations of vs. are recommended based on the variable angle truss model, and the size effect is considered in the three codes’ calculations of Vc. A size effect factor is used by EC2 [4] to consider the effect of the effective depth. The form of d−0.5 was adopted by CEB-FIP MC90 [30], while the form of d−0.25 was adopted by BS8110 [38]. The shear design provisions given in CSA A23.3 [34] were based on the modified compression field theory, and the size effect and strain effect on tensile reinforcement and maximum coarse aggregate size were taken into consideration in the contribution of concrete shear strength in CSA A23.3 [34].
The eight models selected in the papers are based on different mechanisms and methods, Zsutty [36] established an empirical equation in the function of concrete strength, shear span-to-depth ratio, and longitudinal reinforcement ratio, and these parameters were determined by statistical analysis of available shear strength experimental data. Based on the mechanical model, Campione [58] proposed to evaluate the shear resistance contribution under beam and arch actions. The model considers the stirrup ratio, shear span-to-depth ratio, crack spacing, bond resistance, and size effect. In the model of Tureyen et al. [59], a free-body diagram was used to describe the effect of principal tensile stress in the concrete above the neutral axis. The other five models are all semi-empirical models. By taking into account the effect of concrete strength, longitudinal reinforcement ratio, and shear span-to-depth ratio on the quasi-brittle nature of concrete, a model was obtained by Bazant et al. [40] based on fracture mechanics. Moreover, a modified model of the Bazant et al. model [40] was derived by Bazant et al. [39] by considering the effect of maximum aggregate on shear strength. In the model proposed by Kuo [26], Frosch’s model [29] and the UH method were combined to take into account the shear contribution of arch action and the area of the uncracked compression zone. In the truss theory-based models of Gunawan [60], a reduction coefficient was applied to reflect the effect of the initiation force of the diagonal crack. Kotsovos’s model [61] was based on the compressive force-path method, in which the shear resistance consists of three components, including the concrete strength, longitude reinforcement and stirrup.
It is generally known that the stirrup is a crucial component for the shear strength of RC slender beams. The primary functions of stirrups are to directly resist a portion of shear force, diminish the size effect, and restrict the development of shear cracks. The stirrup ratio is strongly related to the mechanism of stress transfer and failure mode of concrete beams. Furthermore, in various models, the form and contribution of stirrups are considered differently. In this study, the accuracy of these shear strength models is compared and assessed for two cases of RC slender beams with and without stirrup.
2.2. Experimental Database
In this paper, the 781 shear strength experimental results of RC slender beams from 66 published papers [8,33,46,47,48,60,62,63,64,65,66,67,68,69,70,71,72,73,74,75,76,77,78,79,80,81,82,83,84,85,86,87,88,89,90,91,92,93,94,95,96,97,98,99,100,101,102,103,104,105,106,107,108,109,110,111,112,113,114,115,116,117,118,119] were collected as a representative database (see Appendix A, Table A3). To ensure the consistency and reliability of the collected data, several criteria were used to select specimens. Firstly, RC slender beams failing in shear were selected. Secondly, specimens bear one or two concentrated loads, while beams bearing a uniformly distributed load or a continuous axial load were excluded. Thirdly, the database does not include beams made with waste materials other than recycled coarse aggregate (e.g., fly ash and bricks), fibers and reinforced with FRP. Additionally, the experimental data of specimens should be relatively complete so that the analysis presented in this paper can be carried out.
There are 428 groups of RC slender beams without stirrups and 353 groups with stirrups. The parameters of these beams in the database include the section width, shear span-to-depth ratio, effective depth, concrete strength, reinforcement diameter, reinforcement ratio, yield strengths of longitude reinforcement and stirrup, and stirrup spacing. The ranges of these parameters were as follows: the stirrup ratio ranges from 0.07% to 3.02%; the compressive strength of normal strength and high-strength concrete is in the range of 19.7 to 197 MPa; the effective depth ranges from 156 to 1925 mm; the shear span-to-depth ratio is in the range of 2.5 to 10.4.
3. Overall Evaluation Results and Discussion
In this section, the evaluation results of the 16 shear strength models based on the experimental database containing 781 RC slender beams are presented. The calculated results of the specimens without and with stirrup are given in Figure 1, Figure 2, Figure 3 and Figure 4. The horizontal axis is the number of each model, and the vertical axis is normalized predictive shear strength (the ratio of the test shear strength to the calculated shear strength Vtest/Vcal). The statistical indicators adopted to evaluate the models include the mean value, standard deviation, minimum value, maximum value, and quantiles. The whiskers represent the standard deviations (St.D), while the dots represent the means of the Vtest/Vcal. The standard deviation reflects the trend of data dispersion, whereas the mean reflects the trend of data concentration. The lower and upper lines of a plot stand for the normalized strength values at 25% and 75% quartiles (x25% and x75%), respectively. These values are shown in the first row of the table in each figure ([25%, 75%]). The other two lines stand for the values of the data at 2.5% quartiles (x2.5%), and 97.5% quartiles (x97.5%), respectively. These values are shown in the second row of the table ([2.5%, 97.5%]). Furthermore, the frequency of the Vtest/Vcal ≥ 1.0 (P(Vtest/Vcal ≥ 1.0)) is shown in the third row. If the percentage of the ratio between the experimental value and the predicted value is greater than one, the model is assessed to be safe.
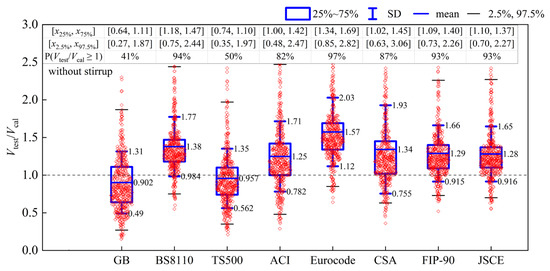
Figure 1.
Codes: overall prediction results for beams without stirrup.
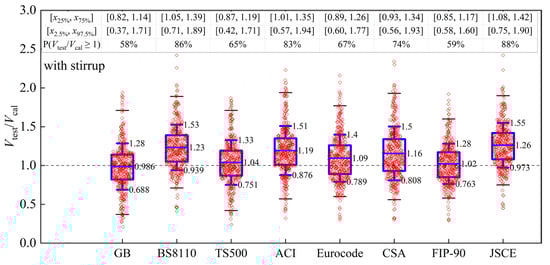
Figure 2.
Codes: overall prediction results for beams with stirrups.
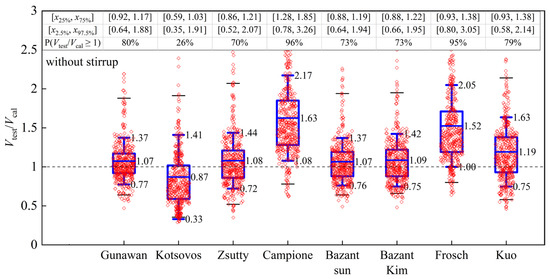
Figure 3.
Researchers: overall prediction results for beams without stirrup.
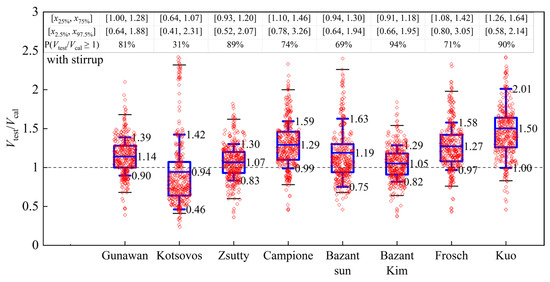
Figure 4.
Researchers: overall prediction results for beams with stirrups.
For models of eight codes, the results of the RC slender beams without and with stirrup are shown in Figure 1 and Figure 2, respectively. It can be seen that the mean values of Vtest/Vcal are greater than 1.0 for most of these models, except for that obtained by TS500 [57] and GB50010 [23] for RC slender beams without stirrup. The percentiles of safe prediction of the strength ratio from these two national codes are 41% and 50%, respectively. This indicates that the predictions from TS500 [57] and GB50010 [23] are mostly on the unsafe side. On the contrary, the mean value and the frequency of Vtest/Vcal ≥ 1.0 calculated by EC2 [4] are 1.57 and 97%, respectively, which exhibit highly conservative prediction results. For the RC slender beams with stirrup, most codes present reasonable estimations of the shear strength of RC slender beams compared to those without stirrup. The mean values of the codes GB50010 [23], CEB-FIP MC90 [30], and TS500 [57] are 0.99, 1.02, and 1.04, respectively, and the percentiles of safe prediction are 58%, 59%, and 65%, respectively. These results indicate that their predictions are closer to the experimental values, but their safety percentiles are much lower than other codes. The presence of stirrup has little effect on the accuracy of BS8110 [38], ACI 318 [2], and JSCE [3] codes. The results of these three models exhibit similar safety percentiles and accuracy behaviors. For instance, the results of the beams without and with stirrup obtained by JSCE [3] are close to 1.3, the frequency values of Vtest/Vcal ≥ 1.0 are both larger than 85%, and that for beams with stirrup are the largest in all of the evaluated codes. Furthermore, the range of 2.5% and 97.5% quartiles provided by JSCE [3] are 0.27 and 2.2, respectively, which is smaller than BS8110 [38] and ACI 318 [2]. It is concluded that the results of JSCE [3] are relatively superior to other codes, which also remain as uniform safety margins.
It can be clearly seen from Figure 3 and Figure 4 that the calculated mean values of the strength ratio by most models from published papers are greater than 1.0 for RC slender beams both without and with stirrup. For the RC slender beams without stirrup shown in Figure 3, the mean values of Gunawan [60], Zsutty [36], Bazant et al. [39], and Bazant et al. [40] are closer to 1 than other models. Among the above models, Gunawan [60] gives the lowest value of standard deviation and minimum range of quartile, which ranges from 0.30 to 0.25, respectively, and the distribution interval of values corresponding to [x2.5%, x97.5%] is [0.64, 1.88]. It is thus believed that the model proposed by Gunawan [60] has higher prediction accuracy. For the RC slender beams with stirrups in Figure 4, the prediction values of models of Zsutty [36] and Bazant et al. [40] are close to the experimental values, in which the normalized mean values are 1.07 and 1.05, respectively.
Compared to Zsutty’s model [36], the ranges of [, ] and [, ] calculated by both models suggest that Bazant et al. [40] presents a more uniform estimation of shear strength for RC slender beams with stirrup. Thus, Bazant et al.’s model [40] shows better performance than Zsutty’s model [36] in predicting RC slender beams with stirrup. By comparing the estimated results in Figure 3 and Figure 4, it is shown that the prediction accuracy of the studied models is affected to varying degrees by stirrup except for the models of Bazant et al. [40], Gunawan [60], and Zsutty [36], which remain uniform and close to 1.0 in both cases with and without stirrup. From the comparison of the above three models by standard deviation and the ranges of [, ] and [, ], the prediction results of Gunawan’s model [60] are less scattered, as they have a tight distribution of strength ratios. Therefore, it is confirmed from the above evaluation that Gunawan’s model [60] exhibits the most prediction performance. The reason for this result may be that in Gunawan’s model [60], the amount of stirrups is considered by applying a decrement factor to the initiation force of the diagonal crack. However, other models are sensitive to stirrup, especially the models of Kotsovos [61], Campione [58], Frosch [59], and Kuo [26]. The prediction results obtained from Kotsovos’s model [61] highly overestimate the test values for RC slender beams without stirrup and are scattered for RC slender beams with stirrup. Bazant et al.’s model [39] gives a reasonable prediction in the case of beams without stirrup, but conservative results are shown in the case of beams with stirrup. Furthermore, the models of Campione [58], Frosch [59], and Kuo [26] present conservative results for most of the test specimens in both cases. In addition, there are apparent differences in the dispersion of these models. The above discussions suggest that the influence of stirrup on shear strength is not well considered in these models.
4. Evaluation and Discussion of Key Parameters
4.1. Interval of the Key Parameter
The above discussions clearly show that the accuracy and conservativeness of each shear strength model are different. In order to better evaluate the selected shear strength models of RC slender beams under different ranges of each parameter, in this section, the influence of key parameters, which includes shear span-to-depth ratio (a/d), concrete compressive strength (fc’), and the stirrup ratio ρsw on the Vtest/Vcal in these models are discussed. The range of these parameters in the database is divided into several groups, and a single design parameter is varied for analysis at each time.
These key parameters are divided into different ranges according to the following constant convention.
The interval division of the shear span-to-depth ratio is mainly based on the analysis result of Subhan Ahmad’s study [55], and the trend of nominal shear stress versus shear span-to-depth scatter distribution is shown in Figure 5a, which finally takes 3.5 as the distinction.
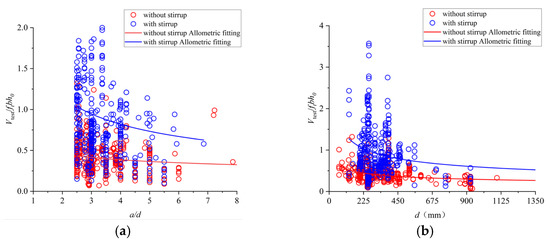
Figure 5.
Normalized shear strength versus key parameters: (a) shear span-to-depth a/d and (b) effective depth d.
The interval division of the effective depth is mainly based on the experience data obtained by Collins and Kuchma [24], along with the trend of nominal shear stress versus effective depth scatter distribution shown in Figure 5b, which is limited to 225 and 450 and is divided into three intervals. According to the provisions in GB50010 [23], the minimum stirrup ratio limit is divided into two ranges. For the strength of concrete, the value of 50 MPa is used as a distinction between normal concrete and high-strength concrete.
4.2. Effect of Shear Span-to-Depth Ratio a/d
The shear span-to-depth ratio (a/d) is closely related to the shear transfer path, which further affects the failure mode of RC slender beams. In order to study the influence of a/d on the accuracy of the models in national codes and published papers, the ratio of experimental to predicted shear strength is plotted against a/d in Figure 6, and the comparison results are summarized in Figure 7 and Figure 8.
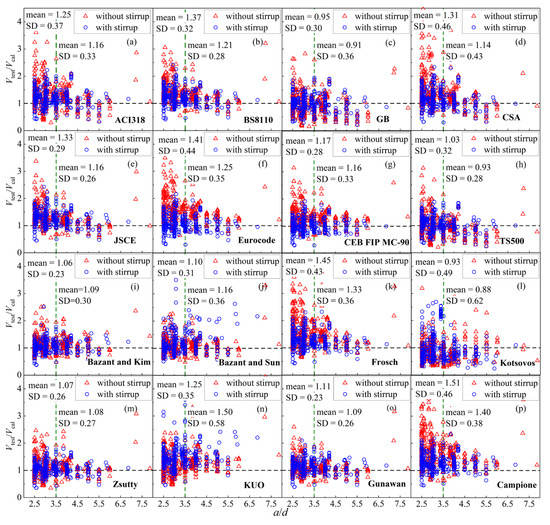
Figure 6.
The relationship between the ratios (Vtest/Vcal) and shear span-to-depth ratio of (a) ACI318; (b) BS8110; (c) GB; (d) CSA; (e) JSCE; (f) Eurocode; (g) CEB FIP MC-90; (h) TS500; (i) Bazant–Kim; (j) Bazant–Sun; (k) Frosch; (l) Kotsovos; (m) Zsutty; (n) Kuo; (o) Gunawan; (p) Campione.
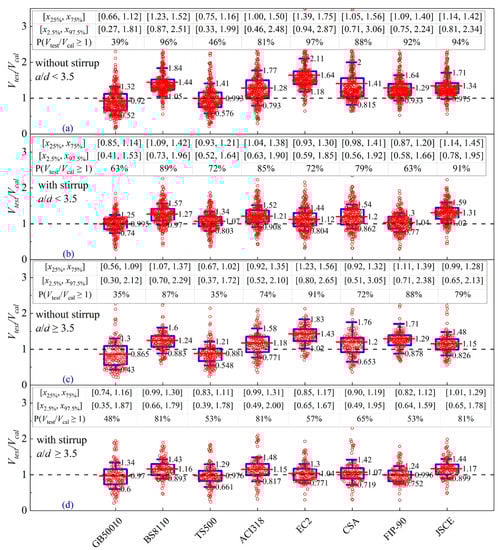
Figure 7.
Codes: prediction results for beams without stirrup versus (a) a/d < 3.5 and (c) a/d ≥ 3.5 and for beams with stirrup versus (b) a/d < 3.5 and (d) a/d ≥ 3.5.
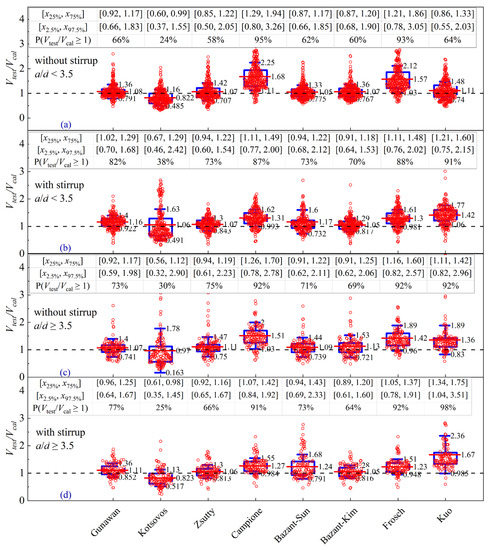
Figure 8.
Researchers: prediction results prediction results for beams without stirrup versus (a) a/d < 3.5; (c) a/d ≥ 3.5 and for beams with stirrup versus (b) a/d < 3.5; (d) a/d ≥ 3.5.
From Figure 6a–h, it can be clearly observed that most predicted values by the models of codes are distributed above the line of Vtest/Vcal = 1 for a/d < 3.5, except for GB 50010 [23] and TS500 [57]. As can be seen from Figure 7, the safety percentiles predicted by EC2 [4] and CEB-FIP MC90 [30] are sensitive to stirrup, which drop from 97% to 92% for beams without stirrup and from 72% to 63% for beams with stirrup. Furthermore, the mean normalized values predicted by BS8110 [38] and CSA A23.3 [34] show significant variations in the cases of stirrups or not, although the predictive safety percentiles obtained from both models are high. The mean values obtained by BS8110 [38] and CSA A23.3 [34] are significantly influenced by the appearance of stirrup. The models of ACI 318 [2] and JSCE [3] present uniform mean values and relatively high safety estimation under a/d < 3.5.
When the a/d increases to above 3.5, the frequency values of Vtest/Vcal ≥ 1.0 calculated by national codes are affected to varying degrees, except for JSCE [3], ACI 318 [2], and BS8110 [38]. Compared to JSCE [3] and ACI 318 [2], the prediction from the model of BS8110 [38] is mostly in the safer range under a/d ≥ 3.5. As mentioned above, for BS8110 [38], ACI 318 [2], and JSCE [3], their frequency values of Vtest/Vcal ≥ 1.0 are not sensitive to the a/d.
The models of Bazant et al. [40], Zsutty [36], and Gunawan [60], are independent of reinforcement types and are further accessed to investigate their sensitivity to a/d. For the beams under a/d < 3.5, it can be seen from Figure 6a,m,o that the predicted values of the three models are evenly distributed around the Vtest/Vcal = 1.0. The calculated mean value and standard deviation obtained by Bazant et al.’s model [40] are 1.06 and 0.23, respectively, and those obtained by Zsutty’s model [36] are 1.07 and 0.26, respectively, but those obtained by Gunawan [60] are 1.11 and 0.23, respectively. Moreover, the models of Bazant et al. [40] and Zsutty [36] provide the most reasonable prediction results at the given range of shear span-to-depth ratio (i.e., 2.5 < a/d < 3, and 3 < a/d < 3.5). A conclusion can be drawn from Figure 8a,b that the models of Bazant et al. [40], Zsutty [36], and Gunawan [60] are more accurate with less discreteness by judging from the predictive values of [x25%, x75%] and [x2.5%, x97.5%] versus other models. From the comparison results of the above three models, it is shown that the models of Bazant et al. [40] and Zsutty [36] exhibit similar mean values, which are closer to 1 than Gunawan [60]. It is thus believed that the models of Bazant et al. [40] and Zsutty [36] are most accurate for RC slender beams under a/d < 3.5. With the increasing span-to-depth ratio (a/d ≥ 3.5), the models of Gunawan [60] and Zsutty [36] provide more accurate prediction than Bazant et al.’s model [40], which can be seen from the fact that the mean values are close to 1.0, associated with smaller interquartile ranges and limits. It can also be seen from Figure 8 that the accuracy of Bazant et al.’s model [40] is more sensitive to stirrup than the other two models.
The accuracy and dispersion of other models (i.e., Bazant–Sun [39], Frosch [59], Kotsovos [61], Kuo [26], and Campione’s models [57]) can be evaluated by comparing Figure 6j–k,n,p. In the analyzed figures, these models are subjected to different shear span-to-depth ratios. As shown in Figure 6, the mean normalized values obtained by the models of Bazant et al. [39], Frosch [59], Kotsovos [61], Kuo [26], and Campione [58] are 1.10, 1.45, 0.93, 1.25, and 1.51, respectively, under a/d < 3.5. Therefore, the models of Frosch [59], Kuo [26], and Campione [58] are greatly conservative for most test data. When the value of a/d increases to above 3.5, the obtained mean values of these models change to 1.16, 1.33, 0.88, 1.50, and 1.40, respectively. From these values, it is apparent that the load carrying capacity is significantly underestimated by the models of Frosch [59], Kuo [26], and Campione [58], while it is overestimated by Kotsovos’s model [61]. On the other hand, although the mean normalized value obtained by Bazant et al.’s model [39] is more even than the other mentioned models, it still shows a great dispersion. It is concluded that these mentioned models are all sensitive to a/d, which has not been well accounted for in these models.
In general, it can be summarized that Zsutty’s model [36] presents the best accuracy for its good consideration of a/d. Similar to Zsutty’s model [36], the accuracy of the models of Gunawan [60] and Bazant et al. [40] is not significantly sensitive to a/d. Therefore, the models of Bazant et al. [40] and Zsutty [36] are more suitable for predicting the shear behavior of RC slender beams with small shear span-to-depth ratio (a/d < 3.5). With an increase in shear span-to-depth ratio, the models of Gunawan [60] and Zsutty [36] show higher accuracy and reliability. It may be that Zsutty and Gunawan proposed models based on separate analyses of beam action and arch action to minimize extensive dispersion of shear stress values under arch action. As a result of regression analysis of the data, Gunawan and Zsutty considered the effects of shear span-to-depth ratio in the form of (a/d)−1 and (a/d)−1/3, respectively.
4.3. Effect of Effective Depth d
The increasing effective depth will induce an increase in the width of the inclined crack, thus reducing the transmission ability of shear stress along the crack interface. The accuracy of the model in national codes and researchers’ works presents sensitivity to the size effect, as demonstrated in Figure 9, Figure 10 and Figure 11. It is apparent from Figure 9 that the strength ratios obtained from models in national codes and most researchers’ works tend to decrease with an increasing effective depth.
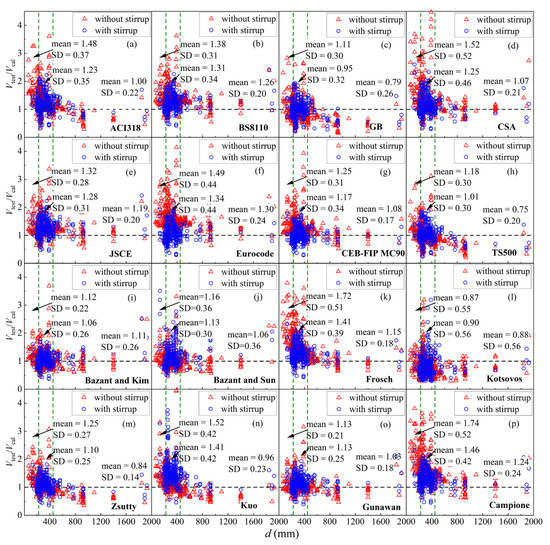
Figure 9.
The relationship between the ratios (Vtest/Vcal) and effective depth of (a) ACI318; (b) BS8110; (c) GB; (d) CSA; (e) JSCE; (f) Eurocode; (g) CEB FIP MC-90; (h) TS500; (i) Bazant–Kim; (j) Bazant–Sun; (k) Frosch; (l) Kotsovos; (m) Zsutty; (n) Kuo; (o) Gunawan; (p) Campione.
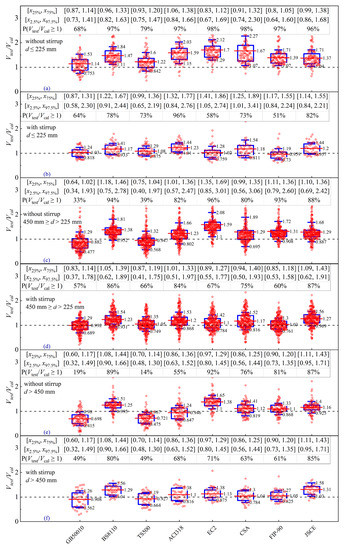
Figure 10.
Codes: prediction results for beams without stirrup versus (a) d ≤ 225 mm; (c) 225 mm < d ≤ 450 mm; (e) d > 450 mm and for beams with stirrup versus (b) d ≤ 225 mm; (d) 225 mm < d ≤ 450 mm; (f) d > 450 mm.
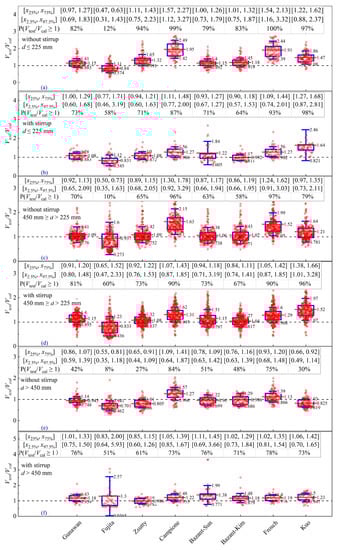
Figure 11.
Researchers: prediction results for beams without stirrup versus (a) d ≤ 225 mm; (c) 225 mm < d ≤ 450 mm; (e) d > 450 mm and for beams with stirrup versus (b) d ≤ 225 mm; (d) 225 mm < d ≤ 450 mm; (f) d > 450 mm.
As presented in the third row of Figure 10, it can be seen that the stability margins of various national codes are also different from each other with the change of the effective depth. Among them, the frequency values of Vtest/Vcal ≥ 1.0 calculated by the models of GB50010 [23], TS500 [57], and ACI 318 [2] decrease significantly with the increasing effective depth, which change from 68% to 64% under d ≤ 225 mm and from 19% and 49% under d > 450 mm, from 79% and 73% to 14% and 49%, and from 97% and 96% to 55% and 68%, respectively. The results could be explained by the fact that the above three codes do not consider the size effect. In addition, it presents that the stability margins of EC2 [4] and CEB-FIP MC90 [30] are obviously affected by the appearance of stirrup. For example, under d ≤ 225 mm, the safe percentiles of specimen calculated by both codes decrease from 98% to 97% for beams without stirrup and from 58% to 51% for beams with stirrup. The prediction results of JSCE [3] remain at high safety levels for RC slender beams under d ≤ 225 mm and d > 450 mm, and that of BS8110 [38] are adequately in favor of safety for RC slender beams under 225 mm < d ≤ 450 mm.
From the comparison of Figure 9i–p, the strength ratios calculated by the models of Bazant et al. [40], Bazant et al. [39], Zsutty [36], and Gunawan [60] are virtually unaffected by stirrup with tighter distribution and are closer to the line drawn at strength ratio = 1.0 than other models. The comparison results in Figure 11 clearly show that the predictions for beams without stirrup obtained by the models of Bazant et al. [39], Gunawan [60], and Bazant et al. [40] are not sensitive to the effective depth, which are closer to 1.0 than Zsutty’s model [36] over the entire range of the effective depth.
It can be thus believed that the models of Bazant et al. [39], Gunawan [60], and Bazant et al. [40] could precisely capture the size effect on shear strength of RC slender beams without stirrup. For beams with stirrup, Bazant et al.’s model [40] gives the most accurate and uniform estimations under d ≤ 225 mm and 225 mm < d ≤ 450 mm. It is evident that the predicted values given by Bazant et al.’s model [40] are approximately close to the experimental values with mean values of 0.99 and 1.04, respectively. The scatter of this model over both ranges is found below. Zsutty’s model [36] shows the most precise prediction with low scatters for beams with stirrup under the effective depth > 450 mm. When Gunawan [60] is used to calculate the beams with stirrup, it is found that the prediction accuracy is slightly more conservative than Bazant et al.’s model [40] under d ≤ 225 mm and 225 mm < d ≤ 450 mm and Zsutty [36] in the case of d > 450 mm.
The distributions of strength ratio are found to be concentrated with the increasing effective depth. It is indicated that the accuracy of Gunawan [60] is not sensitive to the effective depth, and the size effect is reasonably considered.
Apart from the four models discussed above, the accuracy of the other four models shows large sensitivity to the size effect. As can be seen in Figure 11, the predicted values obtained by Kotsovos’s model [61] greatly overestimate the experimental values for beams without stirrup, and it will exceedingly underestimate the experimental values with a large scatter. Furthermore, the models of Campione [58], Frosch [59], and Kuo [26] give conservative results with great dispersion. These four models are not reliable enough because the effect of the effective depth is not well considered.
4.4. Effect of Concrete Strength fc’
The influence of concrete strength on shear strength obtained by the models of national codes and researchers’ works of RC slender beams is shown in Figure 12, and the evaluation results are summarized in Figure 13 and Figure 14.
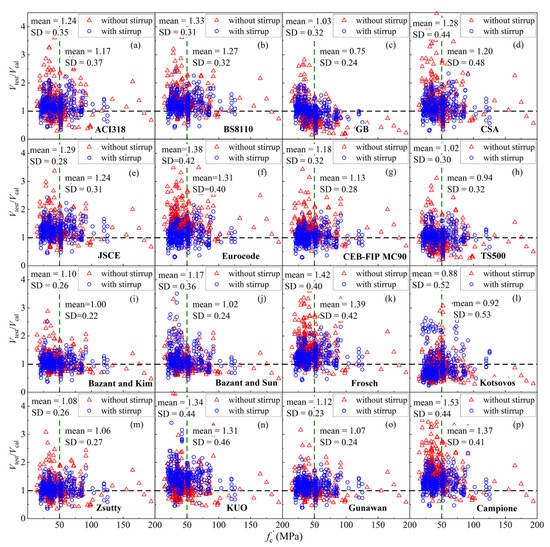
Figure 12.
The relationship between the ratios (Vtest/Vcal) and concrete strength of (a) ACI318; (b) BS8110; (c) GB; (d) CSA; (e) JSCE; (f) Eurocode; (g) CEB FIP MC-90; (h) TS500; (i) Bazant–Kim; (j) Bazant–Sun; (k) Frosch; (l) Kotsovos; (m) Zsutty; (n) Kuo; (o) Gunawan; (p) Campione.
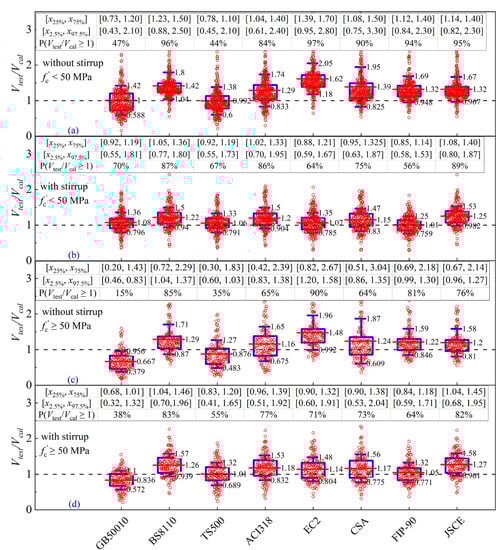
Figure 13.
Codes: prediction results for beams without stirrup versus (a) normal concrete strength and (c) high concrete strength and for beams with stirrup versus (b) normal concrete strength and (d) high concrete strength.
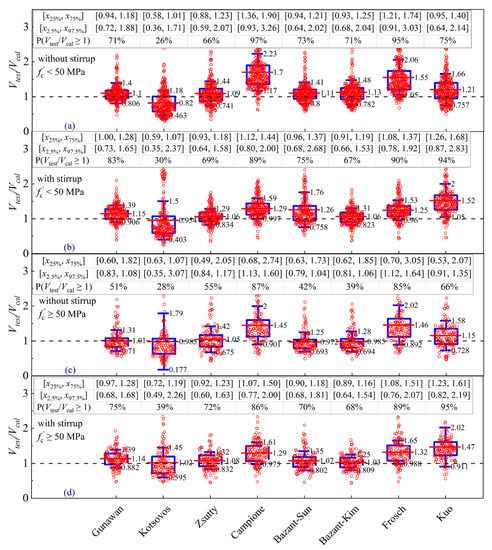
Figure 14.
Researchers: prediction results for beams without stirrup versus (a) normal concrete strength and (c) high concrete strength and for beams with stirrup versus (b) normal concrete strength and (d) high concrete strength.
Figure 12a–h show the distribution of strength ratios obtained by national codes against concrete strength. From Figure 13, it is visible that there is a large number of strength ratios yielded from codes except for GB50010 [23] and TS500 [57], which are distributed around the horizontal line at a strength ratio = 1.0. The safety percentile of specimens calculated by each code shows variations in concrete strength to varying degrees. Among them, the predictive results of GB50010 [23] and TS500 [57] constantly retain a low-security level, excluding predicting RC slender beams with stirrup and normal concrete strength, which are 70% and 67%, respectively, higher than CEB-FIP MC90 [30]. Furthermore, the amount of safety specimens obtained by EC2 [4] and CEB-FIP MC90 [30] are apparently influenced by the stirrup. For normal concrete strength, the frequency of Vtest/Vcal ≥ 1.0 of the models by EC2 [4] and CEB-FIP MC90 [30] range from 97% and 94% down to 64% and 56%, respectively, and those for high concrete strength range from 90% and 81% down to 71% and 64%. Compared to the above codes, the BS8110 [38], CSA A23.3 [34], and JSCE [3] models are not sensitive to concrete strength. In predicting the beams with normal and high concrete strength, the safety margins of the model of BS8110 [38] are comparatively high, which are consistently greater than 80%.
It can be observed from Figure 12i–p that the model of Zsutty [36], Gunawan [60], and Bazant et al. [40] are not significantly affected by the concrete strength and give a uniform prediction for beams with normal concrete strength. Gunawan’s model [59] obtains approximately constant average ratios, with a uniform scatter across the range of less than 35 MPa while the models of Zsutty [36] and Bazant et al. [40] present more uniform scatters between 35 and 50 MPa. As summarized in Figure 14, these three models illustrate strength ratios that are closer to 1.0 than other models, and the standard deviation values and quartile range are smaller than other models. The same conclusion can be drawn in predicting beams with high concrete strength, and the models of Zsutty [36], Gunawan [60], and Bazant et al. [40] show the most accurate performance.
Kotsovos’s model [61] gives unconservative and non-uniform estimations of shear strength since it yields the maximum number of unconservative results in predicting beams without stirrup and the highest scatter with a standard deviation of 60% in predicting beams with stirrup. Kotsovos’s model [61] is the least accurate since it is heavily affected by stirrup. Figure 12 shows that the trend of average strength and the distribution of the scattering of models are not different as compressive strength increases, except for the model of Campione [58]. It can be concluded that the effect of compressive strength on shear strength is reasonable in existing models.
Among the above models, Gunawan’s prediction results [60] are closer to the horizontal line at Vtest/Vcal = 1. Thus, Gunawan [60] is more accurate. Gunawan [60] considers the effect of concrete strength on shear strength by introducing a parameter of (f’c)1/3 based on the model of JSCE [3]. When predicting the RC slender beams with stirrup, the model of Bazant et al. [40] is more accurate than the rest of the models because its average strength ratio is closer to 1.0, and the standard deviation and quartile range are smaller than other models. This may be due to the fact that Bazant et al. [40] applies fracture mechanics to the extension of mortar cracks in the contact area between large aggregate pieces, correlating the concrete strength with the maximum aggregate size.
4.5. Effect of Stirrup ρsw
Stirrups could directly provide a portion of shear force, which restricts the formation of diagonal cracks and thereby enhances the shear strength of RC slender beams. The distribution of Vtest/Vcal versus the stirrup ratio is presented in Figure 15. The evaluation results for the models in codes and researchers’ models are presented separately in Figure 16 and Figure 17. From Figure 15a–h, it can be observed that for the beams with , the models of national codes obtain larger strength ratios, which are distributed above the horizontal line at a strength ratio equal to 1.0, but they have a large scatter compared to those for the beams with . As presented in Figure 16, among the considered national codes, the safety margins of EC2 [4], CSA A23.3 [34], and CEB-FIP MC90 [30] are significantly sensitive to stirrup ratio. The frequency of Vtest/Vcal ≥ 1.0 yields from the above three codes decreases to 50%, 69%, and 42% for , which are 91%, 82% and 77% for , respectively. Furthermore, the safety amount of prediction results by GB50010 [23] and TS500 [57] increases as the stirrup ratio increases. The models of BS8110 [38], ACI 318 [2], and JSCE [3] remain at a relatively high safety level as the stirrup ratios increase. The safe percentile of prediction results calculated by JSCE’s model [3] (i.e., 96%) is second only to those obtained by BS8110 [38] (i.e., 97%) and the highest (i.e., 87%) compared to the other codes. It indicates that JSCE’s model [3] is not sensitive to stirrup ratio and presents the safest predictions.
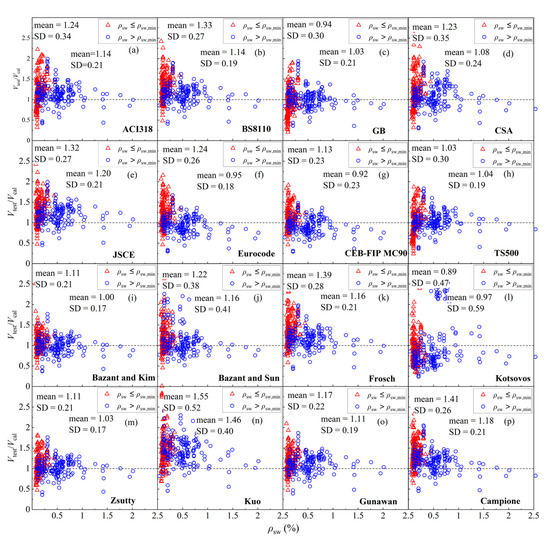
Figure 15.
The relationship between the ratios (Vtest/Vcal) and stirrup ratio of (a) ACI318; (b) BS8110; (c) GB; (d) CSA; (e) JSCE; (f) Eurocode; (g) CEB FIP MC-90; (h) TS500; (i) Bazant–Kim; (j) Bazant–Sun; (k) Frosch; (l) Kotsovos; (m) Zsutty; (n) Kuo; (o) Gunawan; (p) Campione.
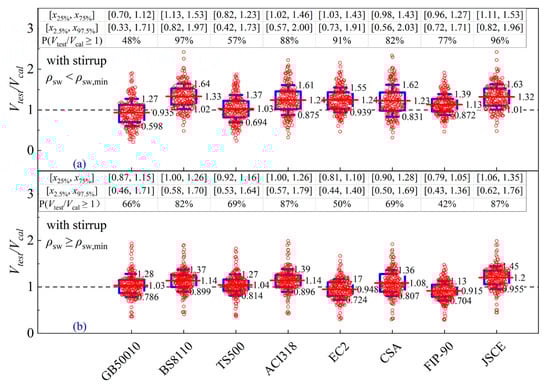
Figure 16.
Codes: prediction results versus (a) ρsw < ρsw,min and (b) ρsw ≥ ρsw,min.
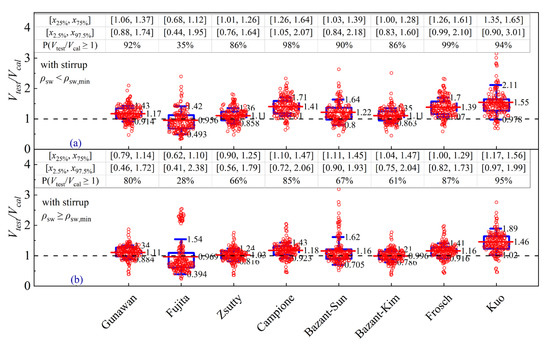
Figure 17.
Researchers: prediction results versus (a) ρsw < ρsw,min and (b) ρsw ≥ ρsw,min.
According to Figure 15i–p, the strength ratios obtained by the models of Zsutty [36] and Bazant et al. [40] are uniformly distributed along the horizontal line and become more concentrated with the increase in . As presented in Figure 17a, when predicting the beams with , the mean values and standard deviations obtained from the models of Zsutty [36] and Bazant et al. [40] are found to be both equal to 1.15 and 0.22, respectively. However, the quartiles range from Zsutty’s model [36] is 0.25, which is smaller than that from Bazant et al.’s model [40] (0.28), but when predicting the beams with , the results are somewhat different. Bazant et al.’s model [40] yields an average strength ratio of 0.996, which is closer to 1.0 compared to the average strength ratio of 1.026 obtained by Zsutty’s model [36]. In addition, the range of 2.5% and 97.5% quartiles obtained by the model of Bazant et al. [40] is 0.84, which is smaller than the one given by Zsutty [36] of 0.91.
It is shown that Zsutty’s model [36] is more suitable for beams with , and Bazant et al.’s model [40] is more suitable for predicting beams with . The increase in stirrup ratios significantly affect the predicted value of the models of Campione [58] and Frosch [59]. The prediction results of Kotsovos’s model [61] approximate to the experimental values in the case of but consistently exhibit high dispersion. On the contrary, the prediction results of the models of Campione [58] and Frosch [59] underestimate the experimental values in the case of , but they become reasonable in the case of . Furthermore, Kuo’s model [26] yields conservative values of shear strength at each stirrup ratio. Although the stirrup rate has a slight effect on the predicted results for the models of Gunawan [60] and Bazant et al. [39], these are more conservative than the models of Bazant et al. [40] and Zsutty [36].
5. Conclusions
In this paper, 16 shear strength formulas for RC slender beams, including eight national codes and eight published papers, were comparatively evaluated from overall level and effect level of key parameters by a large database consisting of 781 RC slender beams. The indexes for evaluation of these models mainly include the mean value, frequency of Vtest/Vcal ≥ 1, standard deviation, and quartiles range as well as 2.5th and 97.5th quartiles range. The following conclusions are drawn based on the detailed discussions:
- The main factors influencing the shear strength of slender beams mainly include the shear span-to-depth ratio, the effective depth, the concrete strength, and the stirrup ratio. Some factors considered by these sixteen models are different. According to overall prediction results, the prediction accuracy of the shear strength models from five researchers and seven codes is greatly affected by the presence or absence of stirrups. For researchers’ models, the prediction results of Zsutty [36], Gunawan [60], and Bazant et al.’s models [40] are more reliable than others for both beams with stirrups and without stirrups, and their average values are between 1.05 and 1.14. For codes, except for GB50010 and TS500, the results of other code models for beams with stirrups are less than that for beams without stirrups. For both beams with stirrups and without stirrups, ACI and JSCE exhibit superior prediction accuracy and safety margins with mean values ranging between 1.19 and 1.28.
- According to evaluation and discussion of key parameters, the effects of shear span-to-depth ratio, concrete strength and stirrup ratio on shear strength are reasonably considered by Bazant et al. [40], Zsutty [36], and Gunawan’s models [60]. Bazant et al. [40] and Zsutty [36] exhibit the most reasonable prediction for beams with a/d < 3.5, and Gunawan [60] and Zsutty’s models [36] provide more accurate prediction than Bazant et al. [40] for beams with a/d ≥ 3.5. For codes, the BS8110 code gives the most safety estimation for RC slender beams with a/d ≥ 3.5. The prediction of JSCE exhibits superiority over those of others for beams with a/d < 3.5 and stirrup ratios (ρsw ≥ 0).
- There exists a significant size effect in the models in national codes and some research, which has not been well considered. Bazant et al. [40] gave accurate results for the case of d ≤ 450 mm, while Zsutty [36] accurately predicted the case of beams with stirrup under d > 450 mm. The prediction of Gunawan [60] is not sensitive to the effective depth, but slightly underestimates the experimental results. For codes, JSCE remained at high safety levels for beams under d ≤ 225 mm and d > 450 mm, and BS8110 gave a high safety margin for beams under 225 mm < d ≤ 450 mm.
Author Contributions
C.M. mainly contributed to the design of this paper, methodology, establishment and analysis of database, formal analysis, writing—original draft, writing—review and editing, supervision, funding acquisition. Z.G. mainly contributed to conceptualization, methodology, formal analysis, writing—original draft, establishment of database, writing—review and editing. W.W. mainly contributed to the establishment of the database, formal analysis, resources, software, methodology. Y.Q. mainly contributed to the formal analysis, supervision, funding acquisition, investigation, project administration. All authors have read and agreed to the published version of the manuscript.
Funding
This study was financially supported by the NSF of Xinjiang Province (grant no. 2020D01C066, tcbs201928, and 2020Q069), the Doctoral Foundation of Xinjiang University (grant no. 620312396).
Institutional Review Board Statement
Not applicable.
Informed Consent Statement
Not applicable.
Data Availability Statement
All necessary data are provided in the article.
Conflicts of Interest
The authors declare no conflict of interest.
Appendix A

Table A1.
National codes for the shear strength of beams.
Table A1.
National codes for the shear strength of beams.
| Design Codes | Formulas |
|---|---|
| ACI 318 [2] | |
| GB 50010 [23] | |
| CSA A23.3 [34] | |
| EC2 [4] | |
| BS8110 [38] | |
| CEB-FIP MC90 [30] | |
| JSCE [3] | ; |
| TS500 [57] |
Notes: = cubic compressive strength; = longitude reinforcement ratio; = stirrup ratio; Vu = the ultimate shear force; Mu = the ultimate moment; = shear span; d = the effective depth; bw = the beam width; = tensile stress factor; = the cross section area of the stirrup; = the yield strength of the stirrups; = compressive stress field inclination; s = the stirrups’ spacing; = 0.18/γc, in which γc (=1.5) is the material coefficient of concrete; = 1 + ; = the compressive strength of concrete with prism specimens of 150 × 150 × 300 mm; = partial factor for materials; = characteristic strength of concrete. = coefficient to consider effect of effective depth on shear capacity; = coefficient to consider effect of longitudinal reinforcement on shear capacity; = distance between resultant compressive force and centroid of tension reinforcement; = the inclination of the stirrups.
Table A2.
Shear strength models proposed by researchers.
Table A2.
Shear strength models proposed by researchers.
| Researcher | Formulas |
|---|---|
| Gunawan [60] | |
| Zsutty [36] | |
| Bazant and Kim [40] | |
| Bazant and Sun [39] | |
| Campione [58] | |
| Kotsovos [61] | |
| Kuo et al. [26] | |
| Tureyen and Frosch [59] |
Notes: = cubic compressive strength; = stirrup ratio; = longitude reinforcement ratio; Vu = the ultimate shear force; = shear span; d = the effective depth; bw = the beam width; = the cross section area of the stirrup; = the yield strength of the stirrups; s = the stirrups’ spacing; = the compressive strength of concrete with prism specimens of 150 × 150 × 300 mm; = characteristic strength of concrete. = distance between resultant compressive force and centroid of tension reinforcement; c = cracked transformed section neutral axis depth; da = maximum aggregate size; Fc = compressive-stress resultant.
Table A3.
Experimental database of RC slender beams.
Table A3.
Experimental database of RC slender beams.
| Ref. | a/d | d (mm) | (MPa) | fy (MPa) | ρl (%) | fyv (MPa) | ρv (%) | Vu (kN) |
|---|---|---|---|---|---|---|---|---|
| Regan et al. [98] | 3.7~3.8 | 200~350 | 34.6~41.0 | 475~600 | 2.39~4.19 | 0~350 | 0.25~0.5 | 50~207 |
| Cucchiara et al. [62] | 2.8 | 219~225 | 41.2 | 610 | 1.86~1.91 | 0~510 | 0~0.63 | 40~117 |
| Angelakos et al. [64] | 2.8~2.9 | 925 | 21~99 | 483~550 | 0.50~2.02 | 0~508 | 0~0.08 | 163~452 |
| Lim et al. [76] | 3.08 | 130 | 34 | 420 | 3.09 | 0~359 | 0~1.41 | 46~91 |
| Rahal et al. [97] | 2.7~3.0 | 300~330 | 60.9~66.4 | 440 | 2.16~3.96 | 0~305 | 0~0.30 | 125~270 |
| Cao [102] | 2.8~2.9 | 1845~1925 | 27.5~30.8 | 436 | 0.36~1.52 | 0~483 | 0~0.07 | 399~1225 |
| Yoshida [110] | 2.9~3.1 | 110~1890 | 35.4~37.7 | 437~550 | 0.74~0.91 | 0~470 | 0~0.07 | 40~550 |
| Attar et al. [68] | 4.12 | 170 | 30 | 390 | 0.89 | 0 | 0 | 26 |
| López et al. [93] | 2.6~10.4 | 384~389 | 22.3~36.4 | 218~544 | 1.63~2.29 | 0~549 | 0~0.21 | 81.8~281 |
| Arowojolu et al. [66] | 2.5 | 279.40 | 69.5 | 420 | 0.94 | 0~400 | 0~1.42 | 99~131 |
| Rombach et al. [79] | 3.0~5.0 | 302 | 49.2~54.8 | 550 | 1.56 | 0 | 0 | 75~84 |
| Kim et al. [31] | 2.5~4.0 | 300 | 34 | 476.5 | 1.43 | 0 | 0 | 62~107 |
| Lee et al. [90] | 3.05 | 442~459 | 23.1 | 396~408 | 1.66~1.82 | 504 | 0.11~0.22 | 187~273 |
| Jeong et al. [86] | 2.50 | 150~780 | 33.5 | 455~542 | 0.96~3.44 | 0 | 0 | 81.7~245 |
| Choi et al. [73] | 2.5~5.0 | 525 | 27 | 433 | 1.87 | 0 | 0 | 206~259 |
| Alqarni et al. [47] | 3.2 | 250 | 49.4~81.6 | 571 | 4.19 | 0~599 | 0~0.52 | 70.4~197 |
| Jain et al. [85] | 3.5 | 251 | 24.5~28.2 | 566 | 2.67 | 0~558 | 0~0.46 | 62~201 |
| Huber et al. [33] | 3.0 | 460 | 42.5~63.9 | 566 | 1.17 | 0 | 0 | 56~85 |
| Perera et al. [113] | 3.0~4.0 | 250 | 116~194 | 750 | 3.04 | 0 | 0 | 80~226 |
| Wang et al. [114] | 3.0 | 155 | 70.51 | 336.5 | 2.59 | 441.5 | 0.19 | 58 |
| Nouri et al. [115] | 3.0 | 135 | 44~85 | 439~447 | 1.2~2.3 | 0 | 0 | 23~30 |
| Rahal et al. [46] | 3.0 | 387 | 44.4~55.5 | 565 | 1.04 | 0 | 0 | 60~68 |
| Deng et al. [75] | 3.0 | 360 | 31.1~34.1 | 470.6 | 1.58 | 0 | 0 | 77~99 |
| Hassan et al. [80] | 2.8~3.8 | 100~667 | 47 | 480 | 1.09~3.14 | 0 | 0 | 78~340 |
| Nawaz et al. [48] | 3.4 | 260 | 19.8~50.3 | 530 | 0.73~1.08 | 530 | 0.56~0.83 | 228~271 |
| Biolzi et al. [71] | 2.5~4.5 | 260 | 42.1~75.0 | 516~589 | 0.91~1.03 | 0~589.6 | 0~0.10 | 34~109 |
| Słowik [107] | 2.5~4.1 | 220 | 35 | 453~545 | 1.80 | 0 | 0 | 40~50 |
| Hu et al. [82] | 2.60 | 270 | 32.0~40.5 | 551 | 2.36 | 0~442 | 0~0.62 | 117~258 |
| Lee et al. [8] | 2.5~4.0 | 300~520 | 25.0~50.3 | 530~707 | 2.7~4.6 | 187.1~758.7 | 0.3~0.5 | 187~758 |
| Bukhari et al. [72] | 2.5~6.0 | 267 | 44.8~52.7 | 420 | 0.58~1.07 | 0 | 0 | 24~70 |
| Yi et al. [78] | 2.6~3.4 | 335~338 | 29.9~53.6 | 552 | 1.52~1.84 | 414.3 | 0~0.19 | 80~215 |
| Zu [112] | 2.6~3.5 | 201~218 | 25.8 | 439~443 | 1.13~1.85 | 0 | 0 | 31~45 |
| Yu et al. [111] | 2.5~2.7 | 426~1098 | 27.3~33.8 | 500 | 0.67~1.19 | 0 | 0 | 150~630 |
| Islam et al. [84] | 3.00~3.9 | 203 | 50.8~83.3 | 532~554 | 2.02~3.22 | 0 | 0 | 45~117 |
| Khaleel et al. [87] | 2.5~3.5 | 220 | 56.1 | 401 | 1.52~3.05 | 313.6 | 0.24 | 62~87 |
| Bentz et al. [69] | 3.3~4.1 | 194~937 | 35.0~46.0 | 397~474 | 0.51~2.54 | 0 | 0 | 54~232 |
| Thamrin et al. [116] | 3.7 | 219 | 32.0 | 550 | 0.97~2.50 | 0 | 0 | 32~37 |
| Lee et al. [117] | 2.6 | 390 | 33.6~68.4 | 648 | 3.72 | 0~667 | 0~253.68 | 403~914 |
| Lee et al. [91] | 3.0 | 252~383 | 26.8~84.6 | 525~1068 | 1.44~6.92 | 508~510 | 0.20~3.02 | 188~836 |
| Arslan et al. [67] | 2.5 | 230 | 20.8 | 420 | 1.16~2.21 | 393 | 0.22~0.54 | 57~87 |
| Gunawan et al. [60] | 2.5~3.5 | 300 | 40.8~49.1 | 1152~1197 | 1.69 | 0~395 | 0~0.65 | 57~144 |
| Tavio [77] | 3.5 | 200~700 | 85.0~102.0 | 512 | 3.98 | 0~518 | 0~0.58 | 69~620 |
| Lee et al. [6] | 3.0~5.0 | 280~410 | 19.7~40.8 | 520~550 | 0.93~4.76 | 0~215 | 0~0.18 | 70~316 |
| Kawamura et al. [87] | 2.9 | 350 | 20.3~21.5 | 537 | 1.84 | 370~403 | 0.32~0.36 | 114~171 |
| Vecchio et al. [109] | 4.0~5.0 | 457~466 | 22.6~25.9 | 436~555 | 1.80~3.46 | 325~600 | 0.1~0.202 | 141~244 |
| Rahal [96] | 3.0 | 340 | 24.3~42.2 | 440 | 1.60~2.66 | 445 | 0.2 | 166~264 |
| Mawlood et al. [92] | 3.9 | 130 | 91.5 | 390 | 0.38~1.69 | 0~485 | 0~0.22 | 40~186 |
| Shah et al. [101] | 3.0~5.5 | 254 | 52.0 | 414 | 0.33~2.00 | 0~276 | 0~0.1 | 23~127 |
| Bentz et al. [70] | 2.9 | 84~333 | 34.3~36.1 | 400 | 1.55~1.63 | 0 | 0 | 14~43 |
| Kim et al. [88] | 2.5 | 300~600 | 31.8~34.9 | 529~651 | 1.90 | 0 | 0 | 60~261 |
| Arezoumandi et al. [65] | 3.0 | 407 | 30~37.2 | 414 | 1.24~2.49 | 0 | 0 | 111~173 |
| Ignjatovic’ et al. [83] | 4.2 | 235 | 33.3~37.0 | 555~580 | 4.09 | 0~300 | 0~0.19 | 91~163 |
| Pradhan et al. [95] | 2.6 | 269 | 42.8 | 508~606 | 0.75~1.31 | 0~352 | 0~0.32 | 81~162 |
| Knaack et al. [89] | 3.8 | 200 | 31.2~46.4 | 572 | 1.34 | 0 | 0 | 31~44 |
| Roller et al. [99] | 2.5~3.0 | 559~762 | 72.0~125.4 | 436~489 | 1.61~6.89 | 406.7~457.8 | 0.07~1.76 | 301~226 |
| Cladera et al. [74] | 3.0~3.1 | 351~359 | 49.9~87.0 | 500 | 2.24~2.99 | 0~540 | 0~0.11 | 99~308 |
| Sowik [106] | 2.5~4.1 | 220 | 35.0 | 453~545 | 1.93 | 0 | 0 | 40~51 |
| Ros et al. [100] | 4.0 | 206 | 24.5~32.6 | 549~669 | 2.20 | 0~669.6 | 0~0.12 | 182~360 |
| Sherwood et al. [103] | 2.9 | 280~1400 | 28.1~77.3 | 452~494 | 0.83~1.34 | 494~496 | 0.10 | 36~298 |
| Ghannoum [118] | 2.5 | 65~889 | 34.2~58.6 | 385~477 | 1.15~2.00 | 0 | 0 | 42~386 |
| Ahmad et al. [63] | 3.0 | 198~216 | 38.3~84.8 | 421 | 0.96~4.51 | 0~421 | 0~0.78 | 23~120 |
| Shin et al. [104] | 2.5 | 215 | 52.0~73.0 | 414 | 3.77 | 0~388 | 0~0.94 | 56~183 |
| Hong et al. [81] | 3.0~6.0 | 142~915 | 53.7 | 477 | 1.01~4.68 | 0 | 0 | 39~332 |
| Placas et al. [119] | 3.4 | 272 | 24.8~30.3 | 621 | 0.98~1.46 | 0 | 0 | 45~54 |
| Tan et al. [108] | 2.8~3.1 | 400~448 | 54.7~74.7 | 498~538 | 2.00~5.8 | 353.2~385 | 0.48 | 135~265 |
| Morrow et al. [94] | 2.8~7.9 | 356~372 | 14.7~45.7 | 483 | 0.58~3.79 | 0 | 0 | 83~182 |
References
- Kani, G. Basic Facts Concerning Shear Failure. J. Am. Concr. Inst. 1966, 63, 675–692. [Google Scholar]
- ACI Committee 318; Building Code Requirements for Structural Concrete (ACI 318-19) and Commentary (ACI 318R-19). American Concrete Institute: Farmington Hills, MI, USA,, 2019.
- JSCE Guidelines for Concrete No.3. Structural Performance Verification. In Standard Specification for Concrete Structures-2002; Japan Society of Civil Engineers (JSCE): Tokyo, Japan, 2002.
- EN-1992-1-1; Eurocode 2: Design of Concrete Structures. Part 1–1: General Rules and Rules for Buildings. Comité Européen de Normalisation: Brussels, Belgium, 2004.
- Elsanadedy, H.M.; Abbas, H.; Al-Salloum, Y.A.; Almusallam, T.H. Shear Strength Prediction of HSC Slender Beams without Web Reinforcement. Mater. Struct. 2016, 49, 3749–3772. [Google Scholar] [CrossRef]
- Lee, J.Y.; Kim, U.Y. Effect of longitudinal tensile reinforcement ratio and shear span-depth ratio on minimum shear reinforcement in beams. ACI Struct. J. 2008, 105, 134–144. [Google Scholar]
- Syroka-Korol, E.; Tejchman, J. Experimental investigations of size effect in reinforced concrete beams failing by shear. Eng. Struct. 2014, 58, 63–78. [Google Scholar] [CrossRef]
- Lee, J.Y.; Choi, I.J.; Kim, S.W. Shear behavior of reinforced concrete beams with high-strength stirrups. ACI Struct. J. 2011, 108, 620–629. [Google Scholar]
- ACI-ASCE Committee 326. Shear and Diagonal Tension. ACI J. Proc. 1962, 59, 277–344. [Google Scholar]
- Hsu, T. Toward A Unified Nomenclature for Reinforced-Concrete Theory. J. Struct. Eng. 1996, 122, 275–283. [Google Scholar] [CrossRef]
- Hsu, T. Softened Truss model theory for shear and torsion. ACI Struct. J. 1988, 85, 624–635. [Google Scholar]
- Lampert, P.; Thürlimann, B. Ultimate Strength and Design of Reinforced Concrete Beams in Torsion and Bending. In Ultimate Strength and Design of Reinforced Concrete Beams in Torsion and Bending/Résistance et dimensionnement des poutres en béton armé soumises à la torsion et à la flexion/Bruchwiderstand und Bemessung von Stahlbetonbalken unter Torsion und Biegung; Institut für Baustatik und Konstruktion, Birkhäuser: Basel, Switzerland, 1972; Volume 42, pp. 107–131. [Google Scholar] [CrossRef]
- Muttoni, A.; Ruiz, M.F. Shear strength of members without transverse reinforcement as function of critical shear crack width. ACI Struct. J. 2008, 105, 163–172. [Google Scholar]
- Vecchio, F.J.; Collins, M.P. The modified compression-field theory for reinforced concrete elements subjected to shear. ACI J. Proc. 1986, 83, 219–231. [Google Scholar]
- Vougioukas, E.; Kotsovos, M.D.; Kotsovos, G.M. Behaviour of Reinforced Concrete Beams with Non-Bonded Flexural Reinforcement. Mag. Concr. Res. 2015, 67, 503–512. [Google Scholar]
- Kotsovos, M.D.; Lefas, D. Behavior of reinforced concrete beams designed in compliance with the concept of compressive-force path. ACI Struct. J. 1990, 87, 127–139. [Google Scholar]
- Choi, K.K.; Park, H.G.; Wight, J.K. Unified shear strength model for reinforced concrete beams—Part I: Development. ACI Struct. J. 2007, 104, 142–152. [Google Scholar]
- Park, H.G.; Choi, K.K.; Wight, J.K. Strain-based shear strength model for slender beams without web reinforcement. ACI Struct. J. 2006, 103, 783–793. [Google Scholar]
- Zararis, P.D.; Papadakis, G.C. Diagonal shear failure and size effect in RC beams without web reinforcement. J. Struct. Eng.-Asce 2001, 127, 733–742. [Google Scholar] [CrossRef]
- Chen, W.F. Plasticity in Reinforced Concrete; McGraw-Hill, Inc.: New York, NY, USA, 1982; pp. 253–461. [Google Scholar]
- Nielsen, M.P. Limit Analysis and Concrete Plasticity; Prentice Hall Inc.: Englewood Cliffs, NJ, USA, 1984; pp. 278–298. [Google Scholar]
- Zhang, J.P. Diagonal cracking and shear strength of reinforced concrete beams. Mag. Concr. Res. 1997, 49, 55–65. [Google Scholar] [CrossRef]
- GB 50010-2010; Code for Design of Concrete Structures. Ministry of Construction of the People’s Republic of China: Beijing, China, 2010. (In Chinese)
- Collins, M.P.; Kuchma, D. How safe are our large, lightly reinforced concrete beams, slabs, and footings? ACI Struct. J. 2000, 97, 482–490. [Google Scholar]
- Khuntia, M.; Stojadinovic, B. Shear strength of reinforced concrete beams without transverse reinforcement. ACI Struct. J. 2001, 98, 648–656. [Google Scholar]
- Kuo, W.W.; Hsu, T.T.C.; Hwang, S.J. Shear strength of reinforced concrete beams. ACI Struct. J. 2014, 111, 809–818. [Google Scholar] [CrossRef]
- Hsu, T.T.C.; Laskar, A.; Mo, Y.L. Shear strengths of prestressed concrete beams part 2: Comparisons with ACI and AASHTO provisions. ACI Struct. J. 2010, 107, 340–345. [Google Scholar]
- Laskar, A.; Hsu, T.T.C.; Mo, Y.L. Shear strengths of prestressed concrete beams part 1: Experiments and shear design equations. ACI Struct. J. 2010, 107, 330–339. [Google Scholar]
- Frosch, R.J. Behavior of large-scale reinforced concrete beams with minimum shear reinforcement. ACI Struct. J. 2000, 97, 814–820. [Google Scholar]
- Comite Euro-International du Beton. CEB-FIP Model Code 1990; Comite Euro-International du Beton: London, UK, 1990. [Google Scholar]
- Kim, H.G.; Jeong, C.Y.; Kim, M.J.; Lee, Y.J.; Park, J.H.; Kim, K.H. Prediction of shear strength of reinforced concrete beams without shear reinforcement considering bond action of longitudinal reinforcements. Adv. Struct. Eng. 2018, 21, 30–45. [Google Scholar] [CrossRef]
- Huber, P.; Huber, T.; Kollegger, J. Investigation of the Shear Behavior of RC Beams on the Basis of Measured Crack Kinematics. Eng. Struct. 2016, 113, 41–58. [Google Scholar] [CrossRef]
- Huber, T.; Huber, P.; Kollegger, J. Influence of Aggregate Interlock on the Shear Resistance of Reinforced Concrete Beams without Stirrups. Eng. Struct. 2019, 186, 26–42. [Google Scholar] [CrossRef]
- CSA CAN3-A23.3; Design of Concrete Structures. Canadian Standards Association: Rexdale, ON, Canada, 2004.
- Fib. CEB/FIP Model Code 2010 for Concrete Structures; Comité Euro-International du Béton (CEB): Lausanne, Switzerland, 2012.
- Zsutty, T.C. Beam shear strength prediction by analysis of existing data. ACI J. Proc. 1968, 65, 943–951. [Google Scholar]
- Rao, G.A.; Injaganeri, S.S. Evaluation of size dependent design shear strength of reinforced concrete beams without web reinforcement. Sadhana-Acad. Proc. Eng. Sci. 2011, 36, 393–410. [Google Scholar]
- BS8110; Structural use of concrete. British Standards Institution: London, UK, 1997.
- Bazant, Z.P.; Sun, H.H. Size effect in diagonal shear failure: Influence of aggregate size and stirrups. ACI Mater. J. 1987, 84, 259–272. [Google Scholar]
- Bazant, Z.P.; Kim, J.K. Size effect in shear failure of longitudinally reinforced beams. ACI J. Proc. 1984, 81, 456–468. [Google Scholar]
- Keskin, R.S.O. Predicting shear strength of SFRC slender beams without stirrups using an ANN model. Struct. Eng. Mech. 2017, 61, 605–615. [Google Scholar] [CrossRef]
- Okamura, H.; Higai, T. Proposed design equation for shear strength of reinforced concrete beams without web reinforcement. Proc. Jpn. Soc. Civ. Eng. 1980, 300, 131–141. [Google Scholar] [CrossRef][Green Version]
- Kim, J.K.; Park, Y.D. Prediction of shear strength of reinforced concrete beams without web reinforcement. ACI Mater. J. 1996, 93, 213–222. [Google Scholar]
- Arslan, G. Diagonal tension failure of RC beams without stirrups. J. Civ. Eng. Manag. 2012, 18, 217–226. [Google Scholar] [CrossRef]
- Perez, J.L.; Cladera, A.; Rabunal, J.R.; Martinez-Abella, F. Optimization of existing equations using a new genetic programming algorithm: Application to the shear strength of reinforced concrete beams. Adv. Eng. Softw. 2012, 50, 82–96. [Google Scholar] [CrossRef]
- Rahal, K.N.; Elsayed, K. Shear strength of 50 MPa longitudinally reinforced concrete beams made with coarse aggregates from low strength recycled waste concrete. Constr. Build. Mater. 2021, 286, 122835. [Google Scholar] [CrossRef]
- Alqarni, A.S.; Albidah, A.S.; Alaskar, A.M.; Abadel, A.A. The effect of coarse aggregate characteristics on the shear behavior of reinforced concrete slender beams. Constr. Build. Mater. 2020, 264, 120189. [Google Scholar] [CrossRef]
- Nawaz, W.; Abdalla, J.A.; Hawileh, R.A.; Alajmani, H.S.; Abuzayed, I.H.; Ataya, H.; Mohamed, H.A. Experimental study on the shear strength of reinforced concrete beams cast with lava lightweight aggregates. Arch. Civ. Mech. Eng. 2019, 19, 981–996. [Google Scholar] [CrossRef]
- Zhang, T.; Visintin, P.; Oehlers, D.J. Shear strength of RC beams with steel stirrups. J. Struct. Eng. 2016, 142, 04015135. [Google Scholar] [CrossRef]
- Russo, G.; Mitri, D.; Pauletta, M. Shear strength design formula for RC beams with stirrups. Eng. Struct. 2013, 51, 226–235. [Google Scholar] [CrossRef]
- Russo, G.; Somma, G.; Mitri, D. Shear strength analysis and prediction for reinforced concrete beams without stirrups. J. Struct. Eng. 2005, 131, 66–74. [Google Scholar] [CrossRef]
- Nielsen, M.P. Limit Analysis and Concrete Plasticity, 2nd ed.; CRC Press: Boca Raton, FL, USA, 1998. [Google Scholar]
- NZS 3101: 2005; NZS 1995 New Zealand Standard Code of Practice for the Design of Concrete Structures (NZS 3101). Standards New Zealand: Wellington, New Zealand, 2005.
- Gandomi, A.H.; Alavi, A.H.; Kazemi, S.; Gandomi, M. Formulation of shear strength of slender RC beams using gene expression programming, part I: Without shear reinforcement. Autom. Constr. 2014, 42, 112–121. [Google Scholar] [CrossRef]
- Ahmad, S.; Bhargava, P. Shear Strength Models for Reinforced Concrete Slender Beams: A Comparative Study. Structures 2018, 16, 119–128. [Google Scholar] [CrossRef]
- Niwa, J.; Yamada, K.; Yokozawa, K.; Okamura, H. Revaluation of the equation for shear strength of reinforced concrete beams without web reinforcement. Doboku Gakkai Ronbunshu 1986, 372, 167–176. [Google Scholar] [CrossRef] [PubMed]
- TS500; TS500 Requirements for Design and Construction of Reinforced Concrete Structures. Turkish Standards Institute: Ankara, Turkey, 2000. (In Turkish)
- Campione, G.; Monaco, A.; Minafo, G. Shear strength of high-strength concrete beams: Modeling and design recommendations. Eng. Struct. 2014, 69, 116–122. [Google Scholar] [CrossRef]
- Tureyen, A.K.; Frosch, R.J. Concrete shear strength: Another perspective. ACI Struct. J. 2003, 101, 609–615. [Google Scholar]
- Gunawan, D.; Okubo, K.; Nakamura, T.; Niwa, J. Shear capacity of RC beams based on beam and arch actions. J. Adv. Concr. Technol. 2020, 18, 241–255. [Google Scholar] [CrossRef]
- Kotsovos, M.D. Compressive-Force Path Method: Unified Ultimate Limit-State Design of Concrete Structures, 1st ed.; Springer International Publishing: Cham, Switzerland, 2014. [Google Scholar]
- Cucchiara, C.; Mendola, L.L.; Papia, M. Effectiveness of stirrups and steel fibres as shear reinforcement. Cem. Concr. Compos. 2004, 26, 777–786. [Google Scholar] [CrossRef]
- Ahmad, S.H.; Xie, Y.; Yu, T. Shear ductility of reinforced lightweight concrete beams of normal strength and high strength concrete. Cem. Concr. Compos. 1995, 17, 147–159. [Google Scholar] [CrossRef]
- Angelakos, D.; Bentz, E.C.; Collins, M.P. Effect of concrete strength and minimum stirrups on shear strength of large members. ACI Struct. J. 2001, 98, 290–300. [Google Scholar]
- Arezoumandi, M.; Drury, J.; Volz, J.S.; Khayat, K.H. Effect of recycled concrete aggregate replacement level on shear strength of reinforced concrete beams. ACI Mater. J. 2015, 112, 559–567. [Google Scholar] [CrossRef]
- Arowojolu, O.; Ibrahim, A.; Almakrab, A.; Saras, N.; Nielsen, R. Influence of Shear Span-to-Effective Depth Ratio on Behavior of High-Strength Reinforced Concrete Beams. Int. J. Concr. Struct. Mater. 2021, 15, 14. [Google Scholar] [CrossRef]
- Arslan, G.; Polat, Z. Contribution of concrete to shear strength of RC beams failing in shear. J. Civ. Eng. Manag. 2013, 19, 400–408. [Google Scholar] [CrossRef]
- Attar, H.S.; Esfahani, M.R.; Ramezani, A. Experimental Investigation of Flexural and Shear Strengthening of RC Beams Using Fiber-Reinforced Self-Consolidating Concrete Jackets. Structures 2020, 27, 46–53. [Google Scholar] [CrossRef]
- Bentz, E.C.; Massam, L.; Collins, M.P. Shear strength of large concrete members with FRP reinforcement. J. Compos. Constr. 2010, 14, 637–646. [Google Scholar] [CrossRef]
- Bentz, E.C.; Buckley, S. Repeating a Classic Set of Experiments on Size Effect in Shear of Members without Stirrups. ACI Struct. J. 2005, 102, 832–838. [Google Scholar]
- Biolzi, L.; Cattaneo, S.; Mola, F. Bending-shear response of self-consolidating and high-performance reinforced concrete beams. Eng. Struct. 2014, 59, 399–410. [Google Scholar] [CrossRef]
- Bukhari, I.A.; Ahmad, S. Evaluation of shear strength of high-strength concrete beams without stirrups. Arab. J. Sci. Eng. 2008, 33, 321–336. [Google Scholar]
- Choi, W.C.; Yun, H.D. Shear strength of reinforced recycled aggregate concrete beams without shear reinforcements. J. Civ. Eng. Manag. 2017, 23, 76–84. [Google Scholar]
- Cladera, A.; Mari, A.R. Experimental Study on High-Strength Concrete Beams Failing in Shear. Eng. Struct. 2005, 27, 1519–1527. [Google Scholar] [CrossRef]
- Deng, Q.; Yi, W.J.; Tang, F.J. Effect of coarse aggregate size on shear behavior of beams without shear reinforcement. ACI Struct. J. 2017, 114, 1131–1142. [Google Scholar]
- Lim, D.H.; Oh, B.H. Experimental and theoretical investigation on the shear of steel fibre reinforced concrete beams. Eng. Struct. 1999, 21, 937–944. [Google Scholar] [CrossRef]
- Tavio, T. Experimental investigation on size effect in shear of high-strength concrete beams. IPTEK J. Technol. Sci. 2009, 20, 65–72. [Google Scholar] [CrossRef]
- Yi, W.J.; Liu, S. Experimental study on shear behavior of simply supported reinforced concrete beams with minimum stirrup ratio. J. Build. Struct. 2022, 43, 128–137. (In Chinese) [Google Scholar]
- Rombacha, G.A.; Farona, A. Numerical analysis of shear crack propagation in a concrete beam without transverse reinforcement. Procedia Struct. Integr. 2019, 17, 766–773. [Google Scholar] [CrossRef]
- Hassan, A.a.A.; Hossain, K.M.A.; Lacherni, M. Behavior of full-scale self-consolidating concrete beams in shear. Cem. Concr. Compos. 2008, 30, 588–596. [Google Scholar] [CrossRef]
- Hong, K.N.; Han, S.H. Shear strength of reinforced high-strength concrete beams without web reinforcement. J. Korean Soc. Civ. Eng. 2005, 25, 261–269. [Google Scholar]
- Hu, B.; Wu, Y.F. Quantification of shear cracking in reinforced concrete beams. Eng. Struct. 2017, 147, 666–678. [Google Scholar] [CrossRef]
- Ignjatovic, I.S.; Marinkovic, S.B.; Tosic, N. Shear behaviour of recycled aggregate concrete beams with and without shear reinforcement. Eng. Struct. 2017, 141, 386–401. [Google Scholar] [CrossRef]
- Islam, M.S.; Pam, H.J.; Kwan, A.K.H. Shear capacity of high-strength concrete beams with their point of inflection within the shear span. Struct. Build. 1998, 128, 91–99. [Google Scholar] [CrossRef]
- Jain, K.; Singh, B. Steel fibres as minimum shear reinforcement in reinforced concrete beams. Mag. Concr. Res. 2013, 65, 430–440. [Google Scholar] [CrossRef]
- Jeong, C.Y.; Kim, H.G.; Kim, S.W.; Lee, K.-S.; Kim, K.H. Size effect on shear strength of reinforced concrete beams with tension reinforcement ratio. Adv. Struct. Eng. 2017, 20, 582–594. [Google Scholar] [CrossRef]
- Kawamura, K.; Takemura, M.; Nakamura, H.; Miura, T. experimental study on the effect of different shear reinforcement shapes on shear failure behavior and internal crack pattern of RC beams. J. Adv. Concr. Technol. 2021, 19, 82–94. [Google Scholar] [CrossRef]
- Kim, S.W.; Jeong, C.Y.; Lee, J.S.; Kim, K.H. Size effect in shear failure of reinforced concrete beams with recycled aggregate. J. Asian Archit. Build. Eng. 2013, 12, 323–330. [Google Scholar] [CrossRef]
- Knaack, A.M.; Kurama, Y.C. Behavior of reinforced concrete beams with recycled concrete coarse aggregates. J. Struct. Eng. 2015, 141, B4014009. [Google Scholar] [CrossRef]
- Lee, D.; Han, S.J.; Joo, H.E.; Kim, K.S.; Zhang, D.; Kim, J. Shear crack concentration in reinforced concrete beams subjected to shear and flexure. Adv. Struct. Eng. 2020, 23, 2305–2317. [Google Scholar] [CrossRef]
- Lee, J.Y.; Hwang, H.B. Maximum Shear Reinforcement of Reinforced Concrete Beams. ACI Struct. J. 2010, 107, 580–588. [Google Scholar]
- Mawlood, B.O.; Mohammad, A.H.; Abdulrazzaq, N.M.; Ismail, K.S. Shear strength of reinforced high-performance concrete wide beams. Zanco J. Pure Appl. Sci. 2021, 33, 117–127. [Google Scholar]
- Monserrat Lopez, A.; Miguel Sosa, P.F.; Bonet Senach, J.L.; Fernandez Prada, M.A. Experimental study of shear strength in continuous reinforced concrete beams with and without shear reinforcement. Eng. Struct. 2020, 220, 110967. [Google Scholar] [CrossRef]
- Morrow, J.; Viest, I.M. Shear strength of reinforced concrete frame members without web reinforcement. ACI Struct. J. 1957, 53, 833–869. [Google Scholar]
- Pradhan, S.; Kumar, S.; Barai, S. Shear performance of recycled aggregate concrete beams: An insight for design aspects. Constr. Build. Mater. 2018, 178, 593–611. [Google Scholar] [CrossRef]
- Rahal, K.N. Shear behavior of reinforced concrete beams with variable thickness of concrete side cover. ACI Struct. J. 2006, 103, 171–177. [Google Scholar]
- Rahal, K.N.; Al-Shaleh, K.S. Minimum transverse reinforcement in 65 MPa concrete beams. ACI Struct. J. 2004, 101, 872–878. [Google Scholar]
- Regan, P.E.; Reid, I.L.K. Shear strength of RC beams with defective stirrup anchorages. Mag. Concr. Res. 2004, 56, 159–166. [Google Scholar] [CrossRef]
- Roller, J.J.; Russell, H.G. Shear strength of high-strength concrete beams with web reinforcement. ACI Struct. J. 1990, 87, 191–198. [Google Scholar]
- Serna-Ros, P.; Fernandez-Prada, M.A.; Miguel-Sosa, P.; Debb, O.A.R. Influence of stirrup distribution and support width on the shear strength of reinforced concrete wide beams. Mag. Concr. Res. 2002, 54, 181–191. [Google Scholar] [CrossRef]
- Shah, A.; Ahmad, S. Statistical model for the prediction of shear strength of high strength reinforced concrete beams. Arab. J. Sci. Eng. 2009, 34, 399–414. [Google Scholar]
- Shen, C. Size Effect and the Influence of Longitudinal Reinforcement on the Shear Response of Large Reinforced Concrete Members. Ph.D. Thesis, University of Toronto, Toronto, ON, Canada, 2001. [Google Scholar]
- Sherwood, E.G.; Bentz, E.C.; Collins, M.R. Effect of aggregate size on beam-shear strength of thick slabs. ACI Struct. J. 2007, 104, 180–190. [Google Scholar]
- Shin, S.W.; Lee, K.S.; Moon, J.I.; Ghosh, S.K. Shear strength of reinforced high-strength concrete beams with shear span-to-depth ratios between 1.5 and 2.5. ACI Struct. J. 1999, 96, 549–556. [Google Scholar]
- Siew, K. Shear Strength of Reinforced Concrete Beams Without Stirrups. In Proceedings of the Scientific Conference of the College of Engineering, Washington, DC, USA, 1–3 March 2011. [Google Scholar]
- Sowik, M. Experimental Study of Shear Failure Mechanism in Concrete Beams. Brittle Matrix Compos. 10. 2012, 5, 345–354. [Google Scholar]
- Słowik, M. Shear failure mechanism in concrete beams. Procedia Mater. Sci. 2014, 3, 1977–1982. [Google Scholar] [CrossRef]
- Tan, K.H.; Teng, S.; Kong, F.K.; Lu, H.Y. Main tension steel in high strength concrete deep and short beams. ACI Struct. J. 1997, 94, 752–768. [Google Scholar]
- Vecchio, F.J.; Shim, W. Experimental and analytical reexamination of classic concrete beam tests. J. Struct. Eng.-Asce 2004, 130, 460–469. [Google Scholar] [CrossRef]
- Yoshida, Y. Shear Reinforcement for Large Lightly Reinforced Concrete Member. Ph.D. Thesis, University of Toronto, Toronto, ON, Canada, 2000. [Google Scholar]
- Yu, L.; Che, Y.; Song, Y.P. Experimental study on shear strength of large-size reinforced concrete beams without web reinforcement. China Civ. Eng. J. 2013, 46, 1–7. (In Chinese) [Google Scholar]
- Zu, K. Study on the Shear Capacity of RC Beams without Web Reinforcement Based on Mechanical Analysis. Ph.D. Thesis, Changan University, Xi’an, China, 2020. (In Chinese). [Google Scholar]
- Perera, S.V.T.J.; Mutsuyoshi, H. Shear behavior of reinforced high-strength concrete beams. ACI Struct. J. 2013, 110, 43–52. [Google Scholar]
- Wang, X.H.; Gao, X.H.; Li, B.; Deng, B.R. Effect of bond and corrosion within partial length on shear behaviour and load capacity of RC beam. Constr. Build. Mater. 2011, 25, 1812–1823. [Google Scholar] [CrossRef]
- Nouri, A.; Hamrat, M.; Boulekbache, B.; Nouri, S.; Bouziadi, F.; Labed, A.; Haddi, A.; Djelal, C. Quantification of shear strength in reinforced concrete beams using digital image correlation: Experimental and analytical study. Adv. Struct. Eng. 2021, 24, 147–164. [Google Scholar] [CrossRef]
- Thamrin, R.; Tanjung, J.; Aryanti, R.; Nur, O.; Devinus, A. Shear strength of reinforced concrete T-beams without stirrups. J. Eng. Sci. Technol. 2016, 11, 548–562. [Google Scholar]
- Lee, J.Y.; Lee, D.H.; Lee, J.E.; Choi, S.H. Shear behavior and diagonal crack width for reinforced concrete beams with high-strength shear reinforcement. ACI Struct. J. 2015, 112, 323–333. [Google Scholar] [CrossRef]
- Ghannoum, W. Size Effect on Shear Strength of Reinforced Concrete Beam. Ph.D. Thesis, McGill University, Montréal, QC, Canada, 1998. [Google Scholar]
- Placas, A.; Regan, P.E. Shear failure of reinforced concrete beams. ACI J. Proc. 1971, 68, 763–773. [Google Scholar]


Disclaimer/Publisher’s Note: The statements, opinions and data contained in all publications are solely those of the individual author(s) and contributor(s) and not of MDPI and/or the editor(s). MDPI and/or the editor(s) disclaim responsibility for any injury to people or property resulting from any ideas, methods, instructions or products referred to in the content. |
© 2022 by the authors. Licensee MDPI, Basel, Switzerland. This article is an open access article distributed under the terms and conditions of the Creative Commons Attribution (CC BY) license (https://creativecommons.org/licenses/by/4.0/).