

Testing and Analysis of Surrounding Buildings during the Operation of Seismic Simulation Shaking Table

Abstract
:1. Introduction
2. Methods
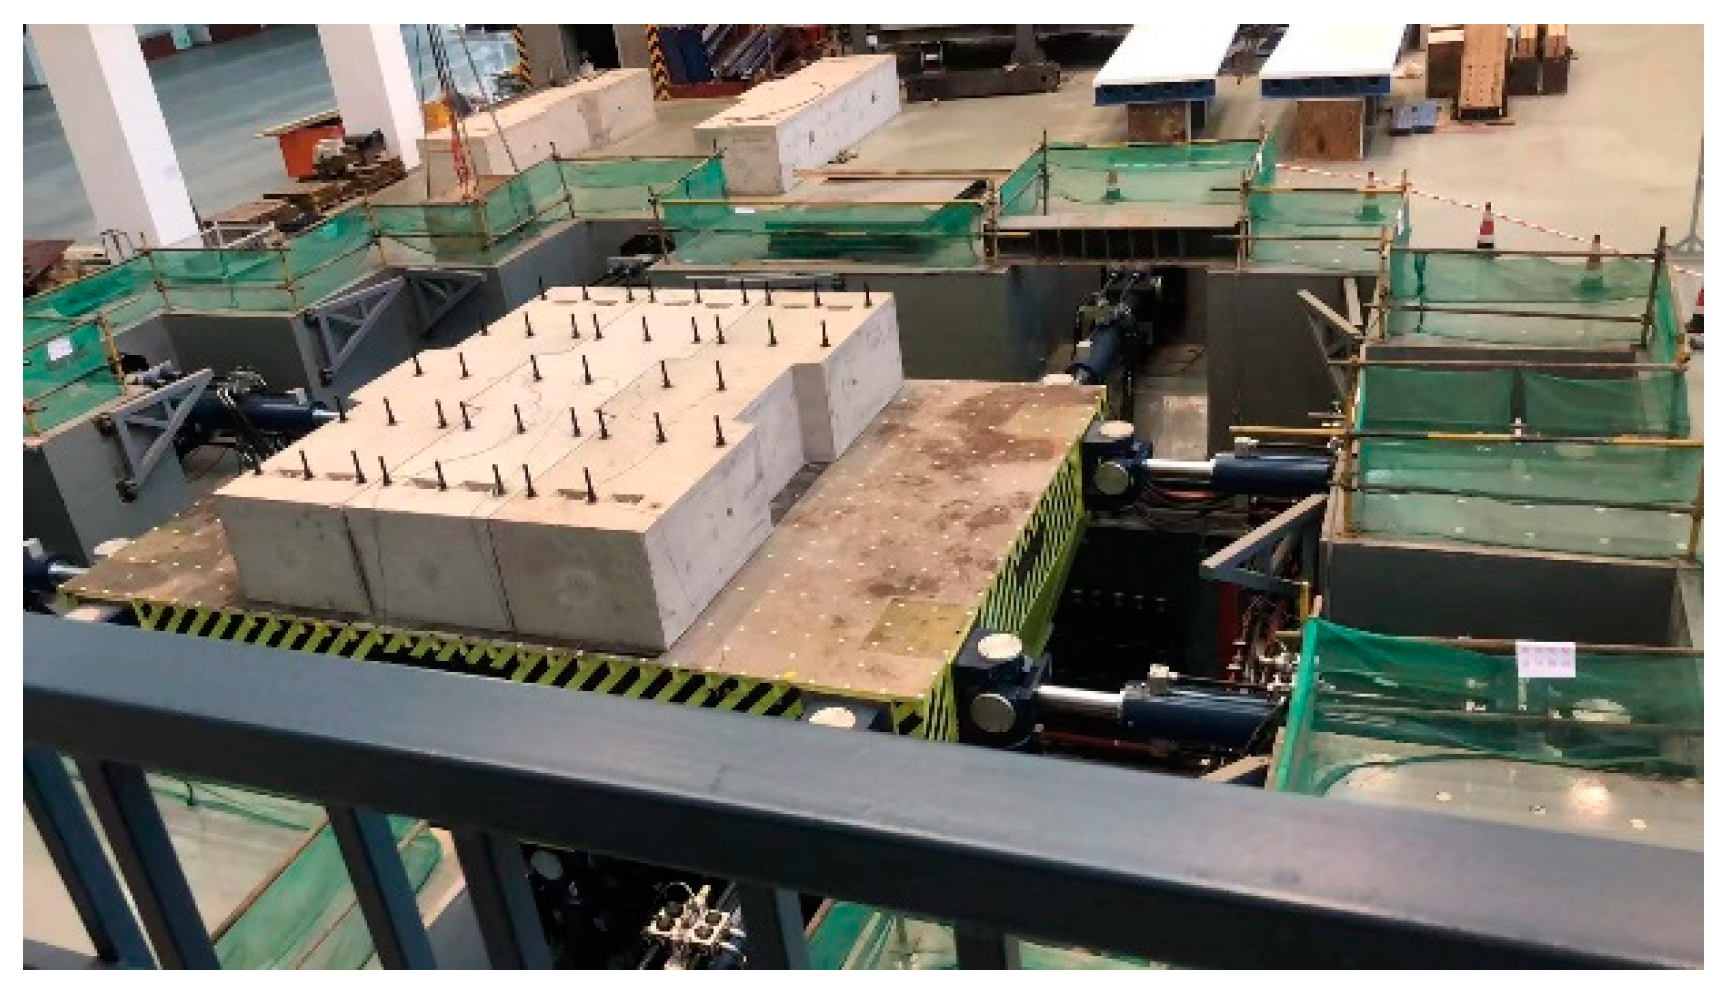
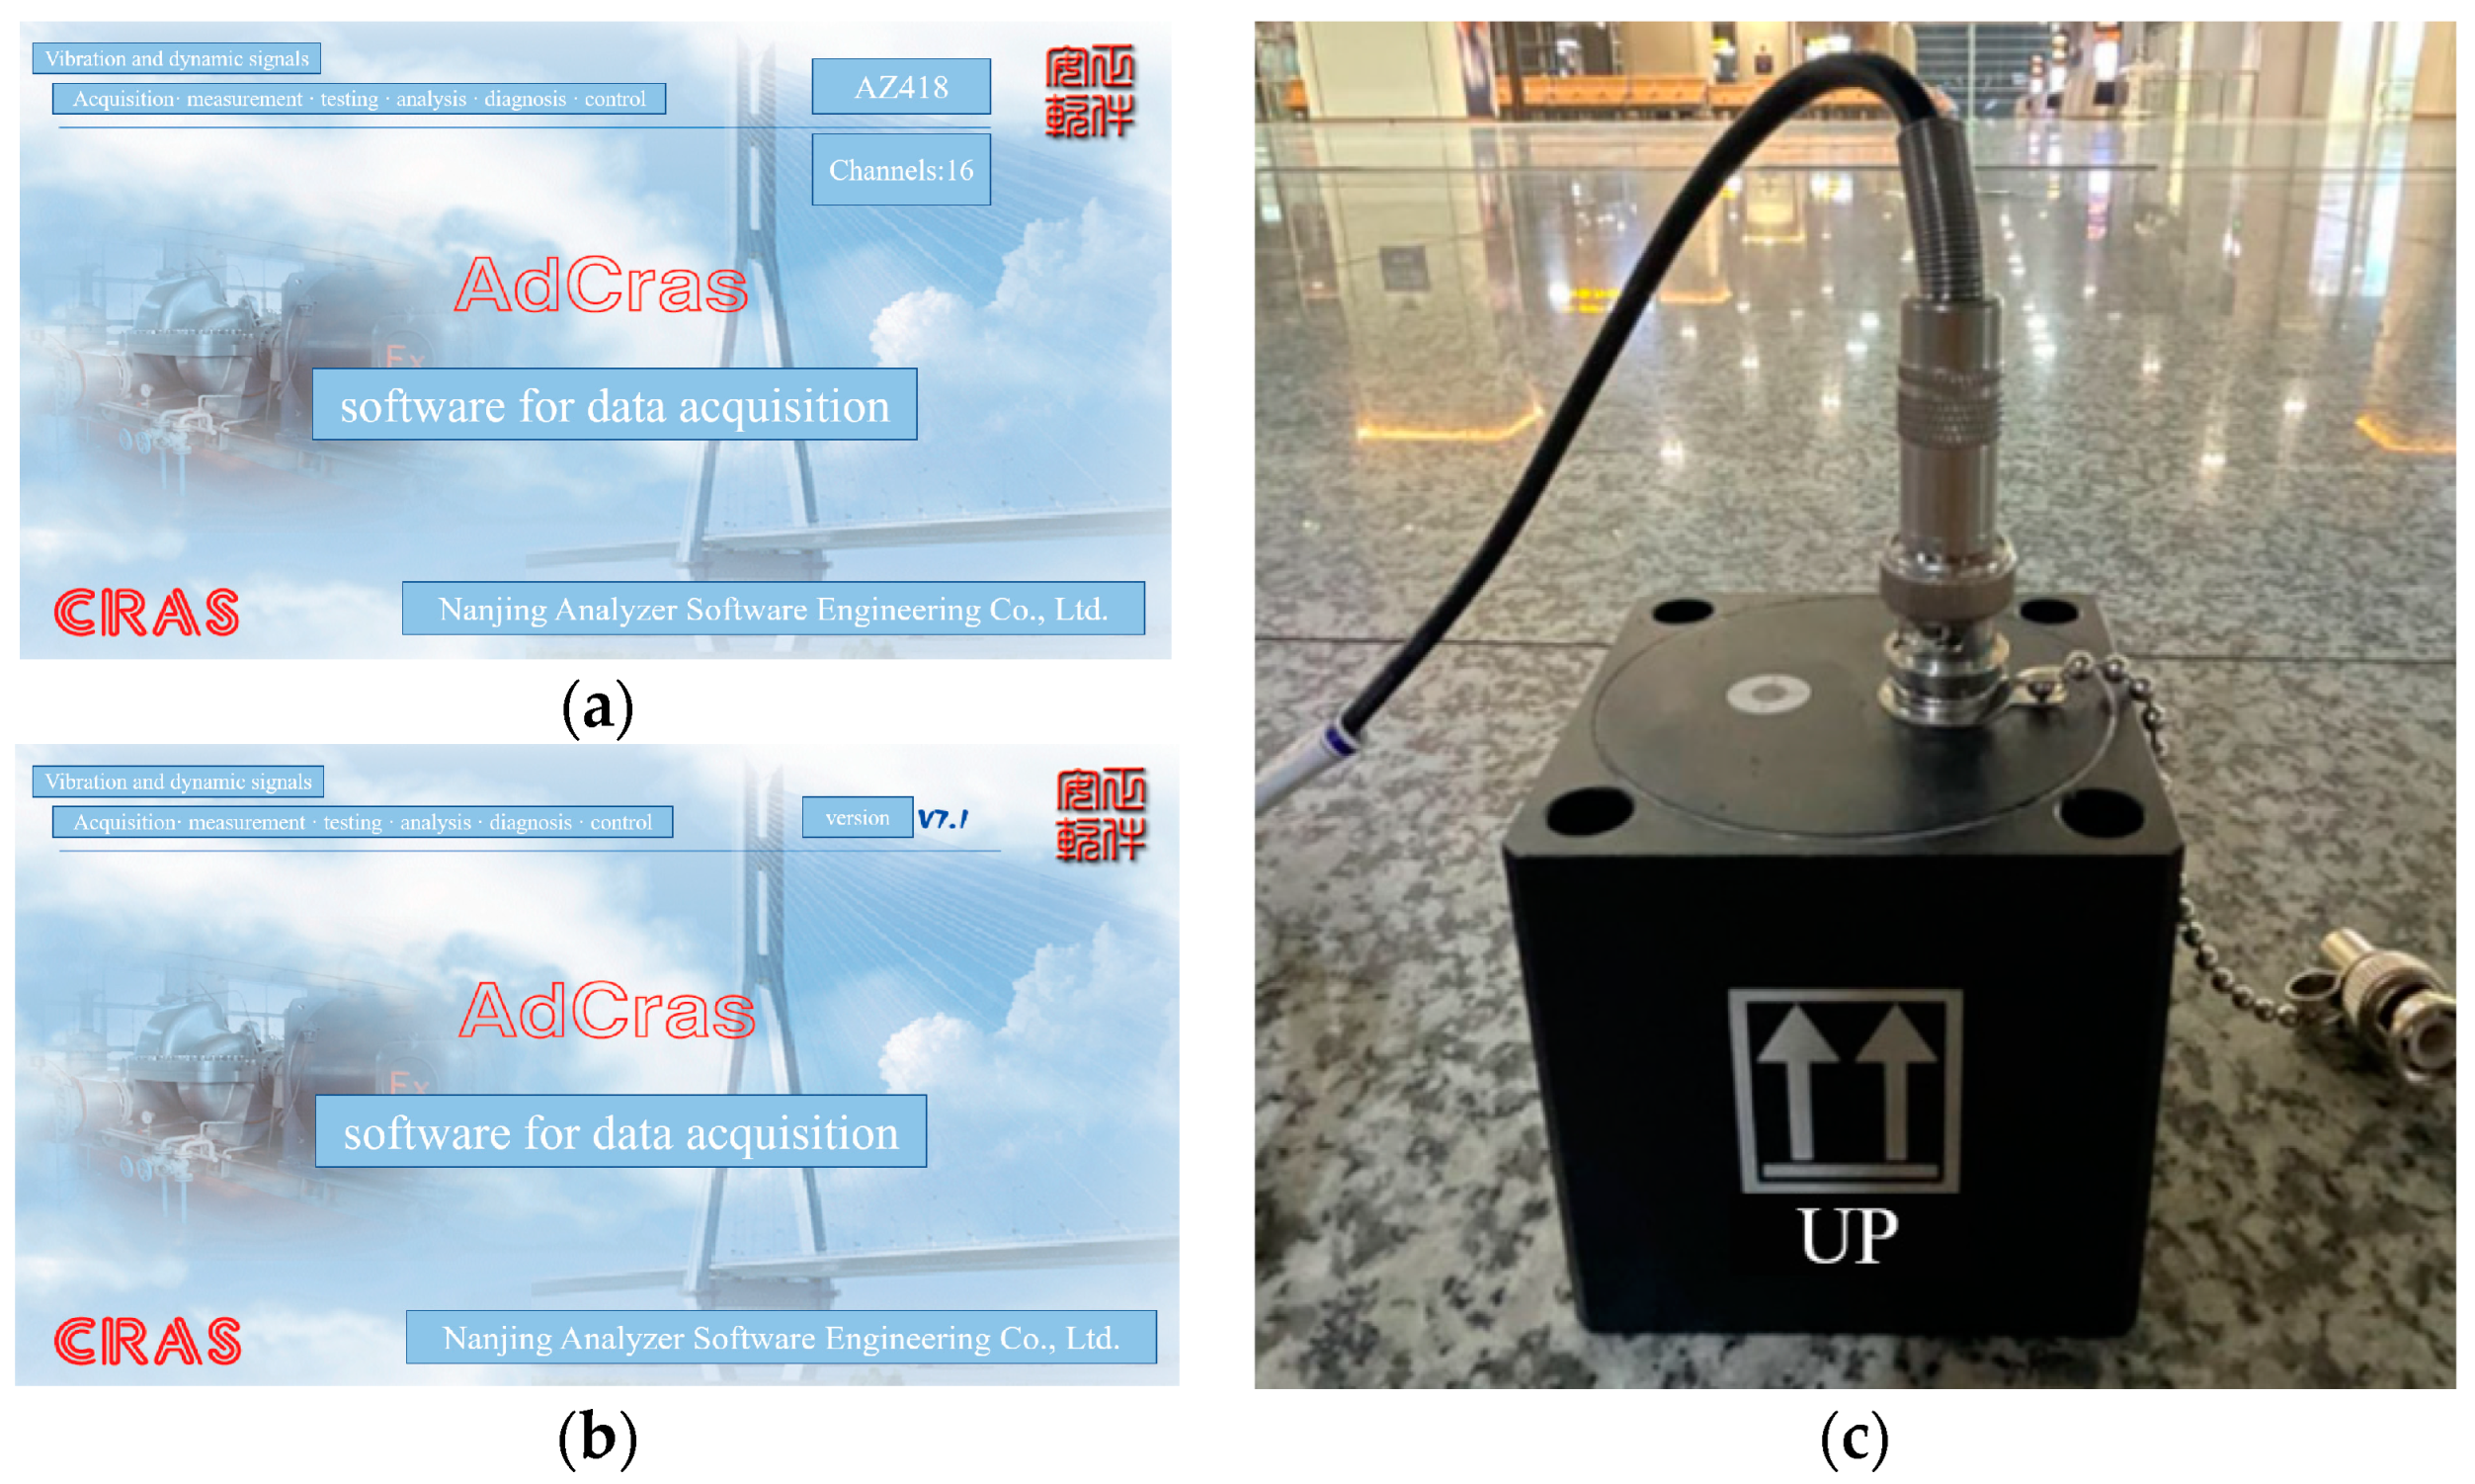
2.1. Testing Instruments
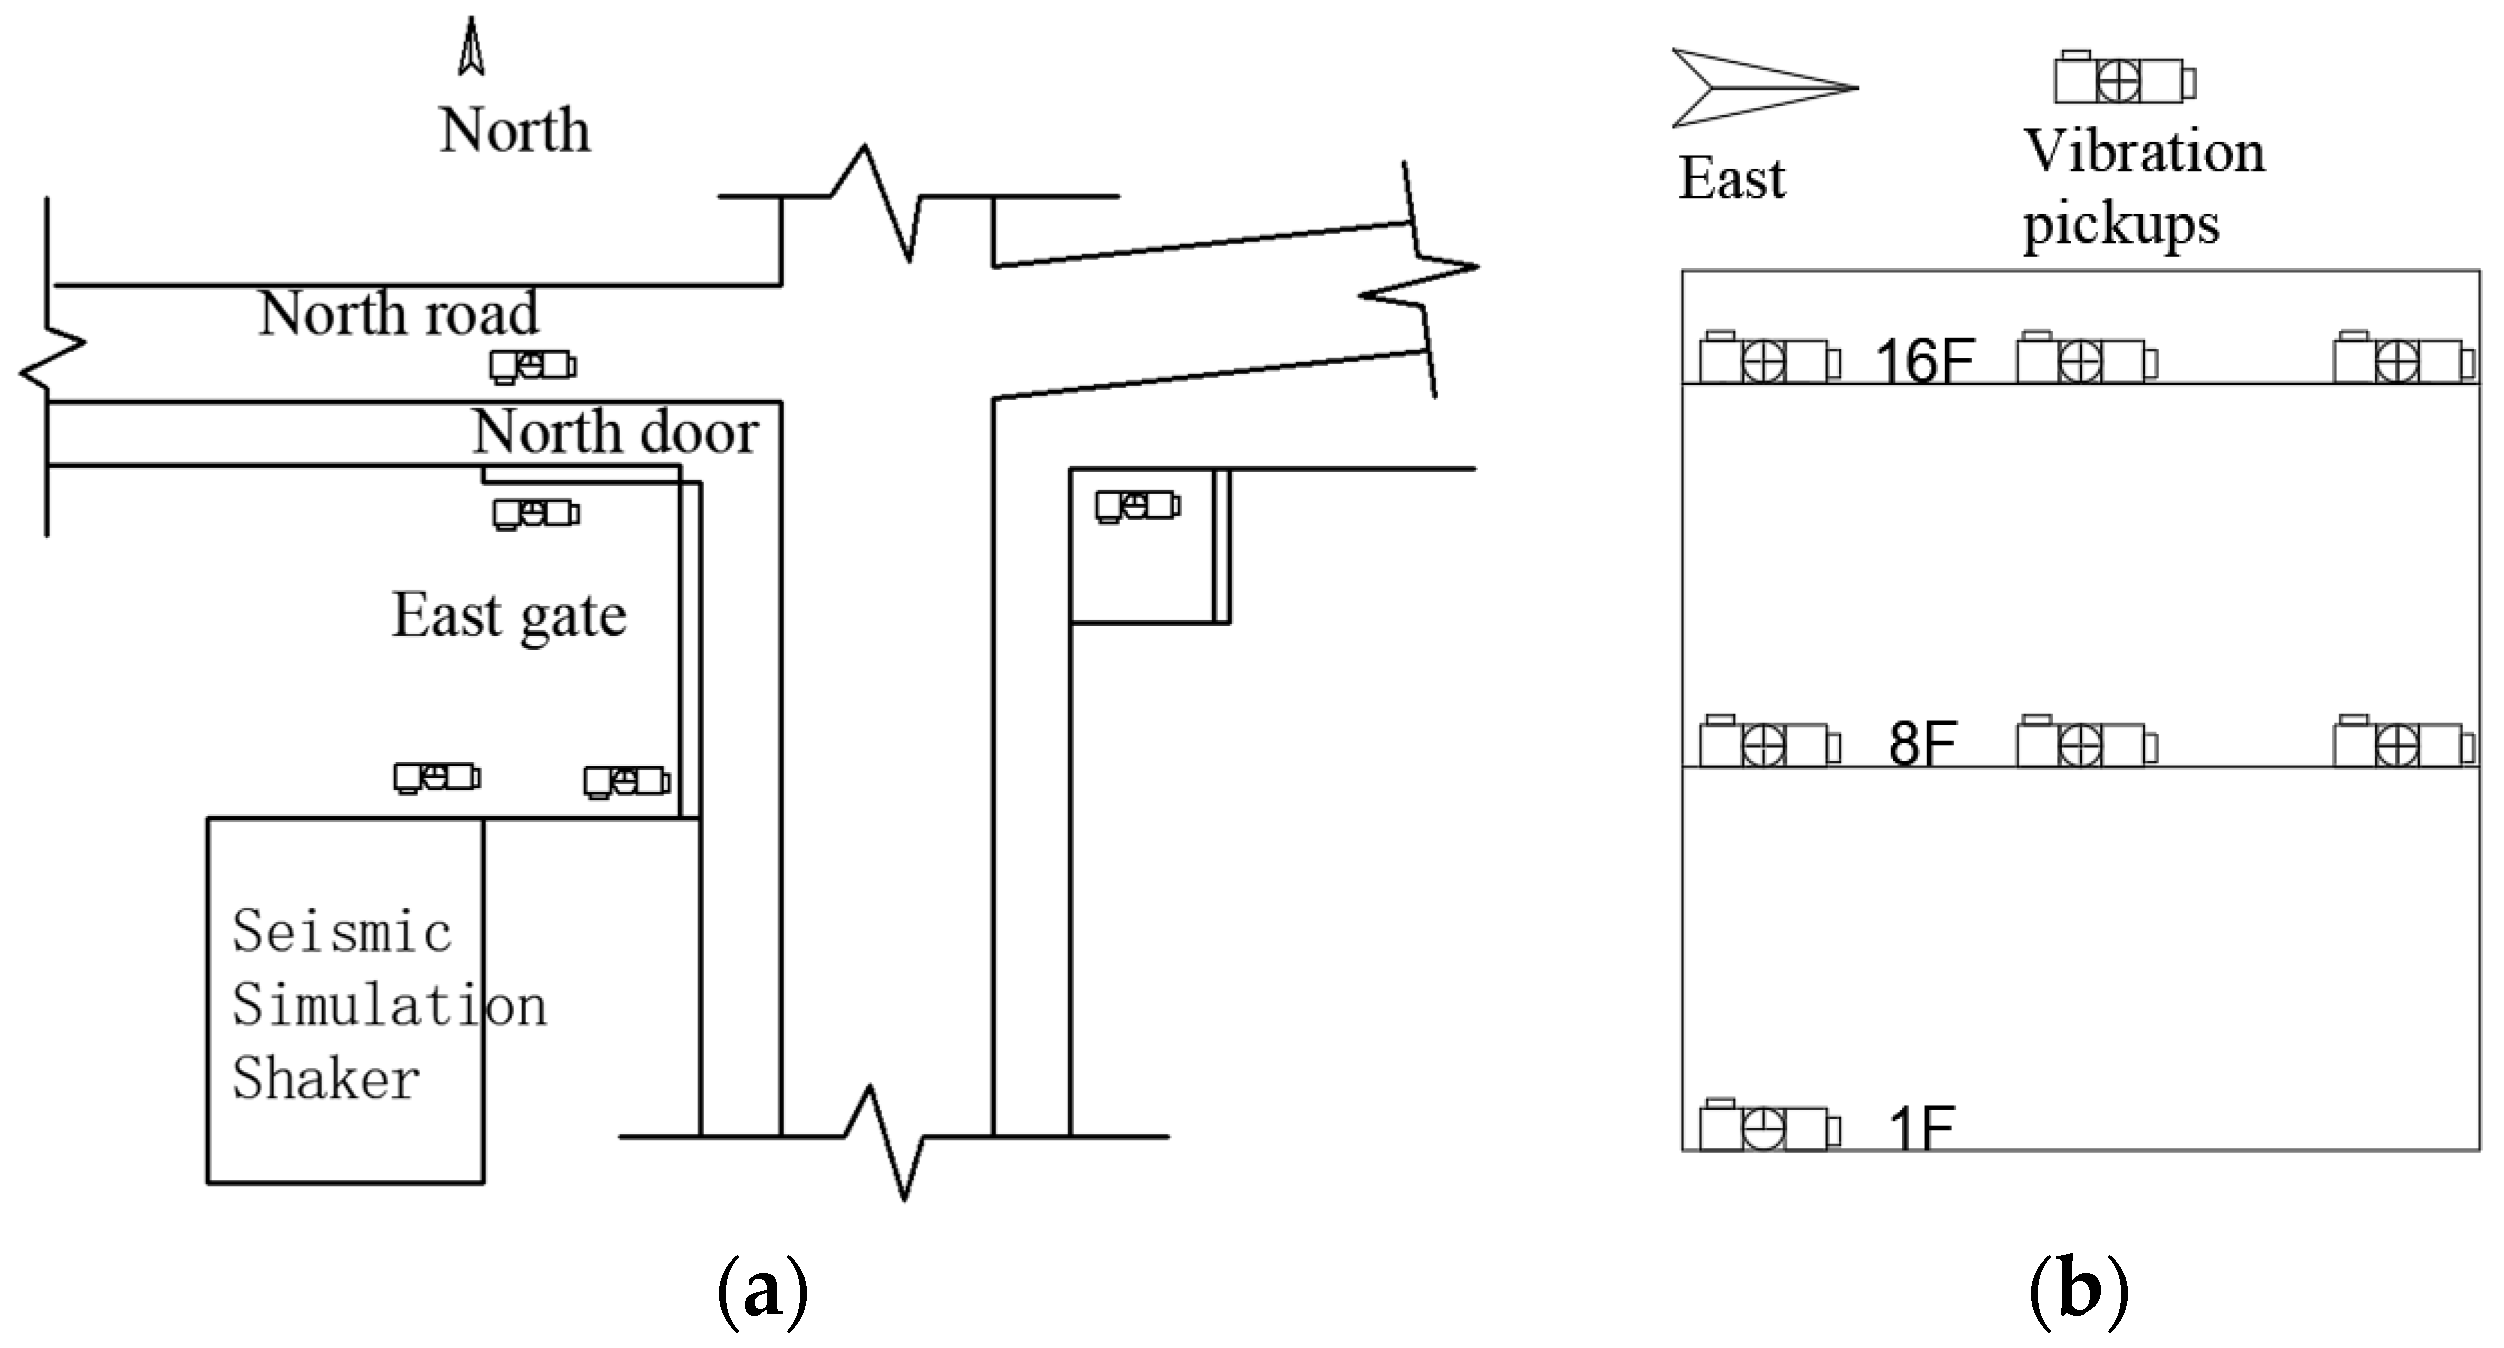
2.2. Test Process
3. Test Results and Analysis
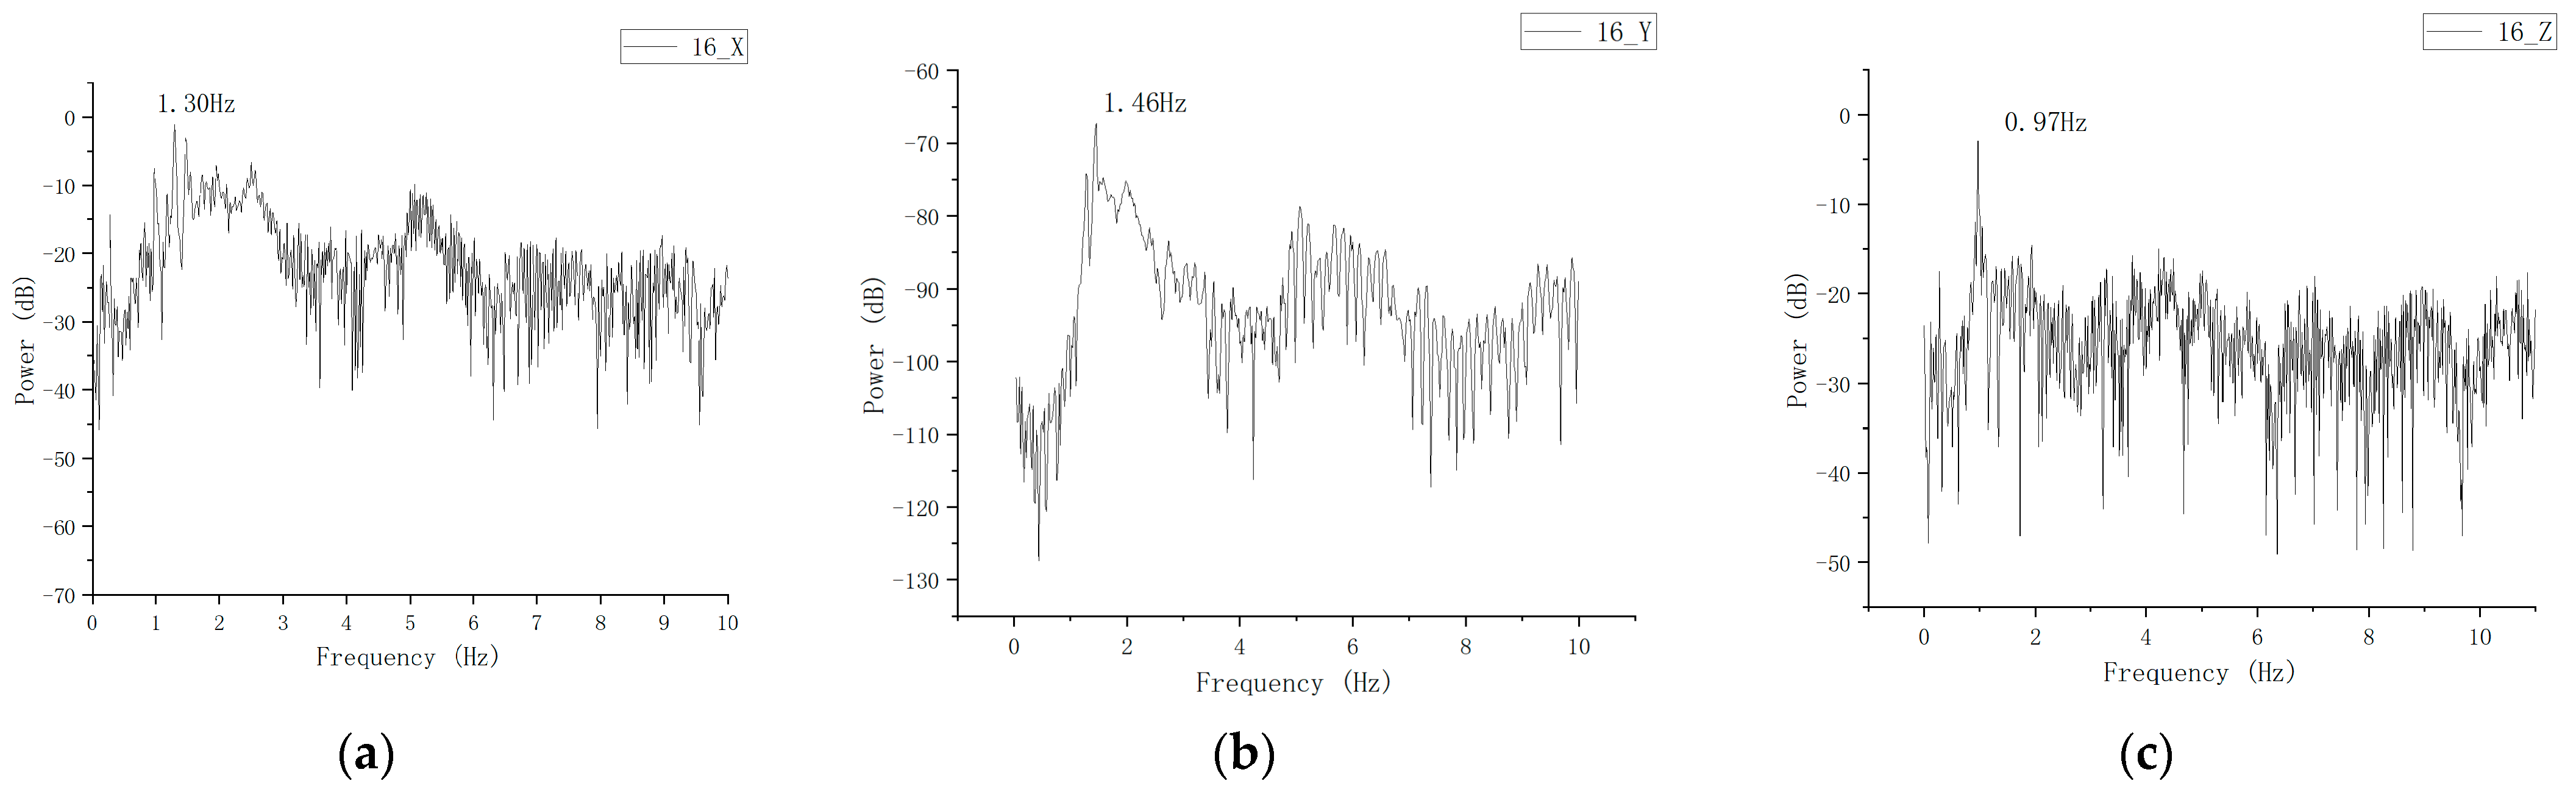
3.1. Natural Frequency Test Results of the Building
3.2. Vibration Test Response Results and Analysis
- The response value increases with the test frequency and is positively correlated, and when the frequency reaches 30 Hz, the measured data are the largest in the same category.
- The amplitude value next to the vibration source (shaking table) is the largest, the vibration response inside the vibration isolation trench is larger, and the vibration response outside the vibration isolation trench decreases.
- The largest response value of the building is the first-floor Z-directional response, which is generated under the conditions TZ_10 and TZ_30 working excitation.
- The response produced a change in response with distance and position, and the decay rate is shown in Table 8.
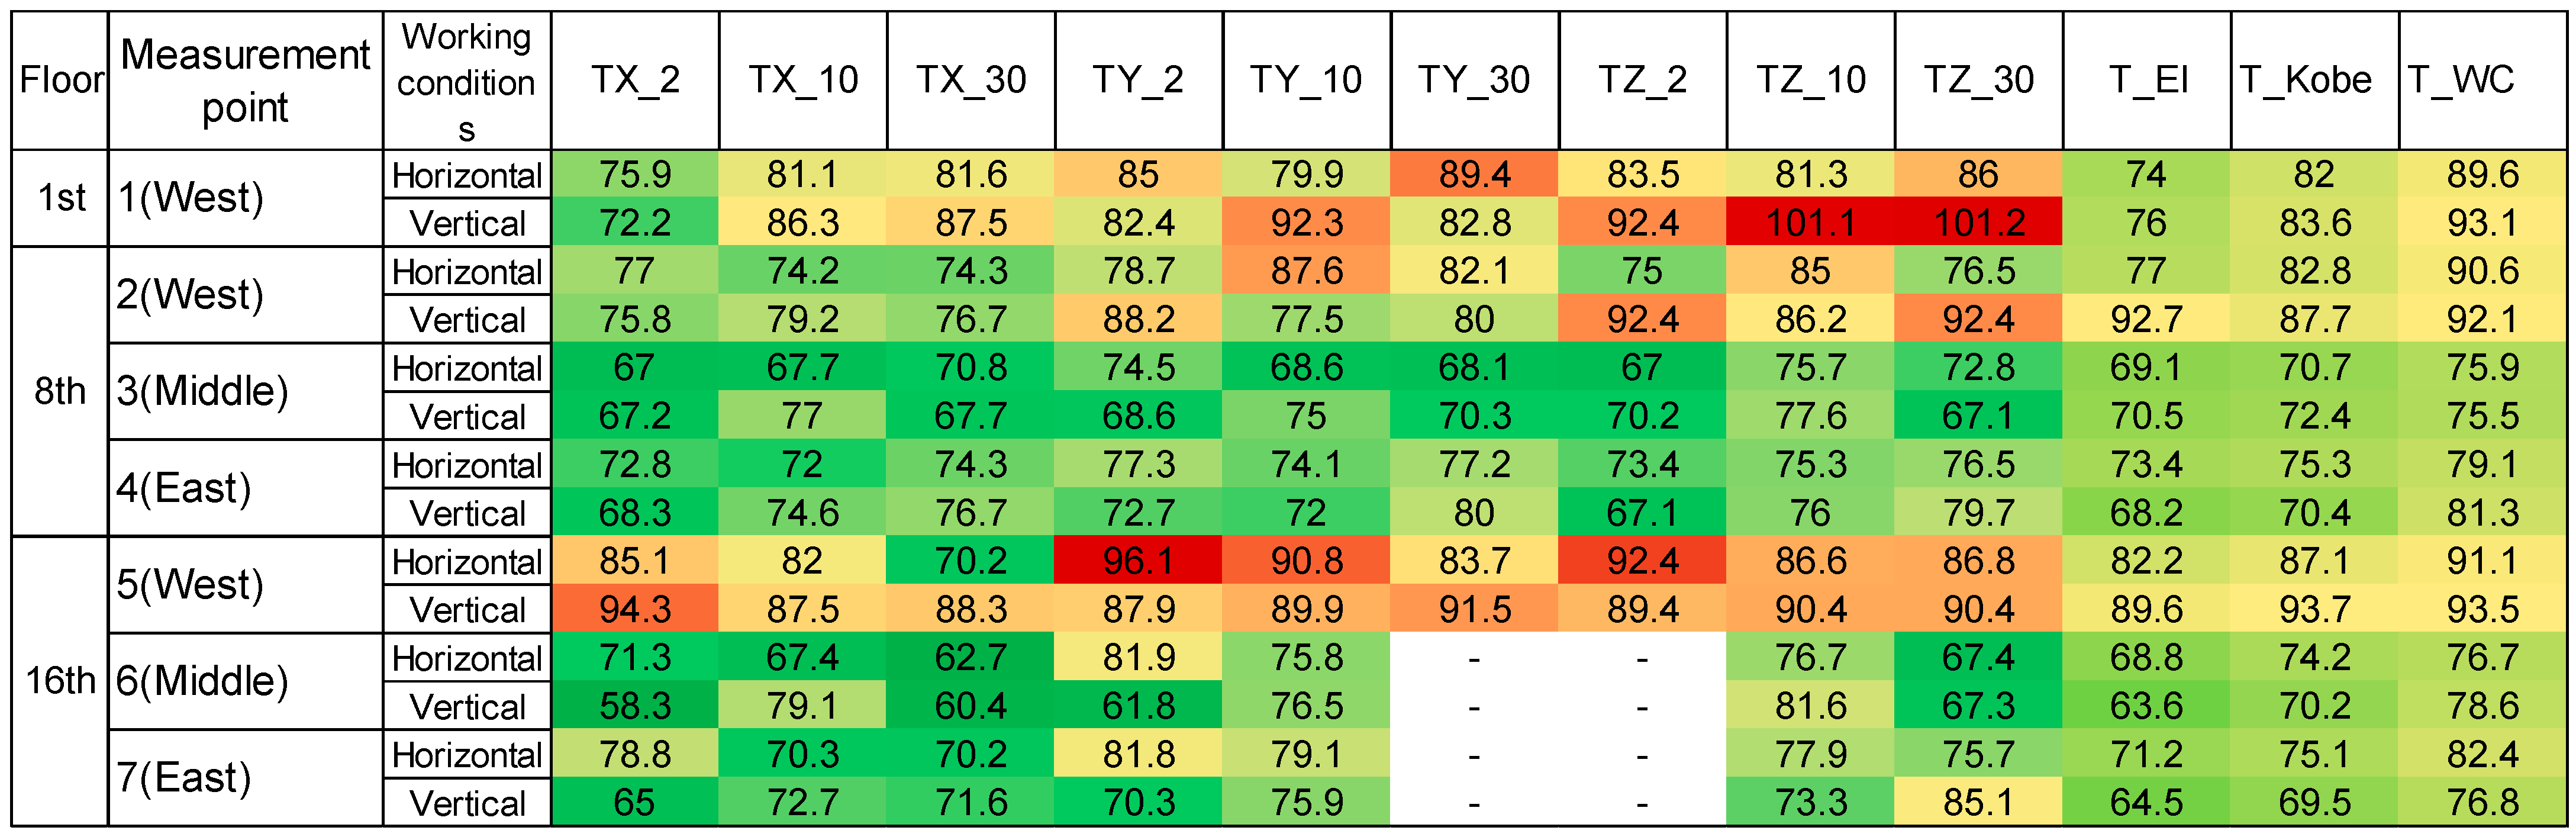
- TZ_10 and TZ_30 working conditions: when the shaking table was tested under 10 Hz and 30 Hz Z-directional sine waves, the vertical vibration-weighted acceleration level of the first floor of the civil engineering building was relatively the largest, 101.1 dB and 101.2 dB, exceeding the limit value by more than 15 dB.
- T_WC working condition: the horizontal vibration-weighted acceleration level of the 1st floor of the civil engineering building is relatively the largest, 89.6 dB.
- TY_10 and TZ_10 working conditions: the horizontal vibration-weighted acceleration level on the 8th floor exceeds the limit value of 83 dB, and the maximum is 90.6 dB for T_WC.
- TY_2, TZ_2-TZ_30 working conditions: the vertical vibration metered acceleration level on the 8th floor exceeds the limit value of 86 dB, and the maximum is 92.7 dB for T_KOBE.
- Most of the horizontal vibration metered acceleration levels on the 16th floor exceeded the limit value of 86 dB (except for TX_10, TX_30, and T_EI-T_WC working conditions), and the maximum vibration metered acceleration level was 96.1 dB for TY_2 working conditions.
- Most of the vertical vibration-weighted acceleration levels on the 16th floor exceed the limit value of 86 dB (except for T_EI-T_WC). The minimum is 87.5 dB for TX_10 working condition and the maximum is 93.7 dB for T_KOBE working condition.
4. Conclusions
- The vibration responses of the building were significantly attenuated with distance, particularly the transverse wave vibration.
- The vibration response of the building increased from the 1st floor to the 16th floor.
- For the sine wave excitations under TX_2-TZ_30 working conditions, some floors of the building exceeded the vibration limit value specified in “GB50868-2013 Construction Engineering Allowable Vibration Standard”. The data exceeding the limit values are shown in Figure 6, except for the 1st floor and the west measurement points on the 8th and 16th floors near the shaking table (i.e., measurement points 1, 2, and 5). All other points met the requirements. For the seismic wave excitations under T_EI-T_WC working conditions, all the measurement points of the building met the limit values specified in the GB50868-2013 Building Engineering Allowable Vibration Standards.
- The numerical value of the sine wave frequency when using shaking table should avoid the frequency in the XY direction of the structure. The X-direction frequency is 1.30 Hz, and the Y-direction frequency is 1.46 Hz. It is recommended to notify surrounding buildings in advance when the equipment is running. And please do not engage in high-power vibration during office hours.
- Architects and engineers should take into account the natural frequencies of nearby buildings, especially in the X and Y directions, to ensure that the designed structures do not resonate with these frequencies. Additionally, for existing buildings, consider retrofitting or strengthening measures to mitigate vibration issues, particularly on higher floors.
Author Contributions
Funding
Data Availability Statement
Acknowledgments
Conflicts of Interest
References
- Gao, C.H.; Yuan, X.B. Development of the Shaking Table and Array System Technology in China. Adv. Civ. Eng. 2019, 2019, 8167684. [Google Scholar] [CrossRef]
- Jaswanth, G.; Sumanth, G.; Ganesh, M.; Dash, A.K. Modal Analysis of a 6 DOF Seismic Simulator. In Proceedings of the 2017 IEEE International Conference On Power, Control, Signals And Instrumentation Engineering (ICPCSI), Chennai, India, 21–22 September 2017; pp. 373–376. [Google Scholar]
- Lu, X.L.; Zhang, H.Y.; Hu, Z.L.; Lu, W.S. Shaking table testing of a U-shaped plan building model. Can. J. Civ. Eng. 1999, 26, 746–759. [Google Scholar] [CrossRef]
- Xu, C.; Dou, P.; Du, X.; Chen, S.; Li, X. Review on Shaking Table Test of Dynamic Interaction of Liquefiable Site-structures System: Retrospect and Prospect. J. Beijing Univ. Technol. 2019, 45, 502–514. [Google Scholar]
- Guo, W.; Li, L.; Shao, P. Precision analysis of large structure seismic experiment utilizing shaking table for earthquake simulation. J. Earthq. Eng. Eng. Vib. 2016, 36, 16–21. [Google Scholar]
- Jiang, L.; Chen, J.; Li, J. Shaking table test of utility tunnel under non-uniform seismic excitations (Ⅲ): Numerical simulation. Earthq. Eng. Eng. Vib. 2010, 30, 45–52. [Google Scholar]
- Jiang, Z.; Liu, J.; Xu, C. Prediction method for seismic responses of underground structures in shaking table tests. Chin. J. Geotech. Eng. 2021, 43, 1220–1227. [Google Scholar]
- Jing, J.; Clifton, G.C.; Roy, K.; Lim, J.B.P. Three-storey modular steel building with a novel slider device: Shake table tests on a scaled down model and numerical. Thin-Walled Struct. 2020, 155, 106932. [Google Scholar] [CrossRef]
- Li, P.Z.; Liu, S.T.; Lu, Z.; Yang, J.P. Numerical analysis of a shaking table test on dynamic structure-soil-structure interaction under earthquake excitations. Struct. Des. Tall Spec. Build. 2017, 26, e1382. [Google Scholar] [CrossRef]
- Li, P.Z.; Zhao, P.; Lu, X.L. Parameter Identification and Analysis of Shaking Table Tests on SSI System. J. Asian Archit. Build. Eng. 2011, 10, 421–428. [Google Scholar] [CrossRef]
- Liang, H.Q.; Xie, W.B.; Wei, P.Z.; Zhou, Y.; Zhang, Z.Q. The Effect of the Decorative Surface Layer on the Dynamic Properties of a Symmetric Concrete Slab. Symmetry 2021, 13, 1174. [Google Scholar] [CrossRef]
- Xie, W.B.; Liang, H.Q.; Wei, P.Z.; Zhou, Y.; Zhang, Z.Q. Dynamic Test and Analysis of the Structure of the Stadium Stand in Suzhou Industrial Park. Appl. Sci. 2022, 12, 251. [Google Scholar] [CrossRef]
- Xu, C.; Gao, L.; Chen, S.; Du, X.; Dou, P. Shaking-table tests design on a liquefaction foundation-structure considering compressed ground motion. J. Earthq. Eng. Eng. Vib. 2017, 37, 51–57. [Google Scholar]
- Butenweg, C.; Bursi, O.S.; Paolacci, F.; Marinkovi, M.; Lanese, I.; Nardin, C.; Quinci, G. Seismic performance of an industrial multi-storey frame structure with process equipment subjected to shake table testing. Eng. Struct. 2021, 243, 112681. [Google Scholar] [CrossRef]
- Chen, M.C.; Pantoli, E.; Wang, X.; Astroza, R.; Ebrahimian, H.; Hutchinson, T.C.; Conte, J.P.; Restrepo, J.I.; Marin, C.; Walsh, K.D.; et al. Full-Scale Structural and Nonstructural Building System Performance during Earthquakes: Part I—Specimen Description, Test Protocol, and Structural Response. Earthq. Spectra 2016, 32, 737–770. [Google Scholar] [CrossRef]
- M Federal Emergency Management Agency (FEMA). Interim Protocols for Determining Seismic Performance Characteristics of Structural and Nonstructural Components through Laboratory Testing; Report No. FEMA 461; FEMA: Washington, WS, USA, 2007. [Google Scholar]
- International Code Council Evaluation Service (ICC-ES). AC156 Acceptance Criteria for the Seismic Qualification of Nonstructural Components; ICC-ES: Brea, CA, USA, 2020. [Google Scholar]
- Zito, M.; Nascimbene, R.; Dubini, P.; D’Angela, D.; Magliulo, G. Experimental Seismic Assessment of Nonstructural Elements: Testing Protocols and Novel Perspectives. Buildings 2022, 12, 1871. [Google Scholar] [CrossRef]
- Zito, M.; D’Angela, D.; Maddaloni, G.; Magliulo, G. A shake table protocol for seismic assessment and qualification of accelerationsensitive nonstructural elements. Comput. Civ. Infrastruct. Eng. 2022, 38, 1699–1726. [Google Scholar] [CrossRef]
- Cosenza, E.; Di Sarno, L.; Fiorillo, A.; Maddaloni, G.; Manfredi, G.; Prota, A. The base isolated mass of the dynamic laboratory at University of Naples Federico II. In Proceedings of the 14th World Conference on Earthquake Engineering, Beijing, China, 12–17 October 2008; pp. 1–8. [Google Scholar]
- Rayegani, A.; Nouri, G. Seismic collapse probability and life cycle cost assessment of isolated structures subjected to pounding with smart hybrid isolation system using a modified fuzzy based controller. In Structures; Elsevier: Amsterdam, The Netherlands, 2022; Volume 44, pp. 30–41. [Google Scholar]
- Rayegani, A.; Nouri, G. Application of smart dampers for prevention of seismic pounding in isolated structures subjected to near-fault earthquakes. J. Earthq. Eng. 2022, 26, 4069–4084. [Google Scholar] [CrossRef]
- GB 50868-2013; China Machinery Industry Federation, Standard for allowable vibration of building engineering, Chinese National Standards. Ministry of Housing and Urban Rural Development of the People’s Republic of China: Beijing, China, 2013.


| Item | Technical Parameters | Item | Technical Parameters |
|---|---|---|---|
| Table size | 6.0 m × 9.0 m | Max. eccentric moment | 1800 kN·m |
| Three-way vibration direction | six degrees of freedom | Max. eccentricity 1.5 m | 1.5 m |
| Max. load | 120 t | Working frequency | 0.1~50 Hz |
| The maximum displacement of the table | X/Y: ±500 mm; Z: ±300 mm | Vibration waveform | Periodic wave, random wave, seismic wave |
| The maximum speed of the table | Sine wave X/Y/Z: 1000 mm/s | Control method | Pulsar |
| Seismic wave peak X/Y/Z: 1500 mm/s | Oil source working time and pressure | 72 h continuous operation; pressure 21~28 MPa | |
| Maximum acceleration of table | X/Y: 1.5 g; Z: 1.3 g | Data acquisition Number of channels | 256 |
| Maximum overturning torque | 6000 kN·m |
| Sensor Number | Sensitivity Factor (V/m/s2) | Sensor Number | Sensitivity Factor (V/m/s2) |
|---|---|---|---|
| H13419 | 0.3015 | H13407 | 0.3067 |
| H08376 | 0.3056 | V13445 | 0.3072 |
| V13442 | 0.3017 | H368 | 0.3087 |
| H13406 | 0.2986 | H370 | 0.3063 |
| H13420 | 0.2946 | V13453 | 0.2930 |
| V13447 | 0.3044 | H365 | 0.3051 |
| H08376 | 0.3003 | H13418 | 0.3070 |
| Name | Quantity | Main Parameters |
|---|---|---|
| AZ408 signal acquisition box | 2 | 8 channels |
| AZ418 signal acquisition box | 1 | 16 channels |
| Pickup coaxial cable | 27 | - |
| Laptop | 3 | - |
| Power supply box | 1 | 12 V-3.8 A |
| Input Wave | Direction | Frequency (Hz) | Peak Acceleration (m/s2) |
|---|---|---|---|
| Sine sweep | X | 0.1–20 | 1.5 |
| Y | |||
| Z |
| Serial Number | Input Wave | Direction | Frequency (Hz) | Magnitude (m/s2) | Duration (s) |
|---|---|---|---|---|---|
| TX_2 | sine wave | X | 2 | 15 | 10 |
| TX_10 | X | 10 | 15 | ||
| TX_30 | X | 30 | 15 | ||
| TY_2 | Y | 2 | 15 | ||
| TY_10 | Y | 10 | 15 | ||
| TY_30 | Y | 30 | 15 | ||
| TZ_2 | Z | 2 | 13 | ||
| TZ_10 | Z | 10 | 13 | ||
| TZ_30 | Z | 30 | 13 | ||
| T_EI | El-Centro-100% | XYZ | - | 3.4 | 60 |
| T_KOBE | Kobe-100% | XYZ | - | 8.2 | 60 |
| T_WC | Wenchuan-100% | XYZ | - | 8.2 | 60 |
| Position | 1st Floor | 8th Floor | 16th Floor | ||||||
|---|---|---|---|---|---|---|---|---|---|
| Direction Serial Number | X | Y | Z | X | Y | Z | X | Y | Z |
| TX_2 | 6.22 | 6.27 | 4.09 | 3.61 | 7.08 | 6.19 | 8.68 | 18.06 | 52.06 |
| TX_10 | 11.37 | 8.52 | 20.75 | 3.62 | 5.13 | 9.14 | 3.29 | 12.61 | 23.63 |
| TX_30 | 12.04 | 5.95 | 23.68 | 5.21 | 4.87 | 6.83 | 3.24 | 1.36 | 26.01 |
| TY_2 | 17.76 | 8.16 | 13.11 | 3.34 | 8.6 | 25.7 | 4.04 | 64.15 | 24.94 |
| TY_10 | 6.85 | 9.93 | 41.21 | 3.39 | 23.98 | 7.46 | 9.03 | 34.58 | 31.22 |
| TY_30 | 29.61 | 12.42 | 13.8 | 6.22 | 12.7 | 10.03 | - | 15.25 | 37.64 |
| TZ_2 | 14.89 | 4.47 | 41.76 | 5.61 | 4.66 | 41.49 | - | 41.7 | 29.63 |
| TZ_10 | 11.56 | 7.78 | 113.28 | 5.8 | 17.88 | 20.34 | 7.84 | 21.27 | 33.1 |
| TZ_30 | 11.59 | 20.03 | 114.52 | 6.02 | 6.68 | 41.89 | 6.06 | 21.89 | 33.3 |
| T_EI | 5.00 | 5.01 | 6.3 | 7.05 | 6.05 | 43.26 | 3.64 | 12.85 | 30.1 |
| T_KOBE | 12.63 | 8.24 | 15.2 | 6.22 | 13.88 | 24.26 | 5.7 | 22.64 | 48.24 |
| T_WC | 28.53 | 30.05 | 45.32 | 7.13 | 34.07 | 40.23 | 13.14 | 35.95 | 47.35 |
| Position | Laboratory (Next to Shaking Table) | East Gate | North Door | North Road | ||||||||
|---|---|---|---|---|---|---|---|---|---|---|---|---|
| Direction Serial Number | X | Y | Z | X | Y | Z | X | Y | Z | X | Y | Z |
| TX_2 | 14.06 | 7.14 | 4.92 | 16.91 | 8.58 | 4.5 | 13.77 | 7.45 | 4.2 | 13.17 | 5.43 | 6.38 |
| TX_10 | 52.14 | 10.61 | 17.48 | 59.2 | 14.03 | 19 | 46 | 18.2 | 30.72 | 20.09 | 18.91 | 82.95 |
| TX_30 | 259.5 | 82.27 | 34.42 | 79.93 | 63.45 | 57.61 | 120 | 69.15 | 48.75 | 19.38 | 24.29 | 76.41 |
| TY_2 | 5.46 | 16.38 | 4.92 | 9.27 | 16.91 | 4.94 | 8.25 | 15 | 4.19 | 5.56 | 12.54 | 4.59 |
| TY_10 | 11.63 | 66.23 | 6.66 | 19.11 | 47.86 | 27.25 | 15.98 | 49.02 | 20.59 | 24.15 | 18.27 | 32.8 |
| TY_30 | 62.28 | 554.5 | 29.42 | 85.15 | 89.95 | 44.23 | 78.45 | 77.63 | 25.06 | 5.16 | 25.47 | 44.89 |
| TZ_2 | 4.48 | 4.21 | 6.04 | 6.49 | 6.12 | 4.85 | 5.16 | 5.23 | 4.62 | 4.54 | 3.65 | 4.84 |
| TZ_10 | 17.59 | 13.95 | 31.66 | 15.66 | 26.5 | 51.2 | 12.35 | 24.56 | 48.87 | 33.78 | 11.98 | 68.79 |
| TZ_30 | 78.28 | 56.68 | 114.1 | 51.42 | 54.3 | 112.7 | 42.84 | 80.13 | 70.27 | 29.79 | 19.79 | 47.78 |
| T_EI | 7.8 | 5.36 | 6.2 | 10.24 | 6.96 | 8.01 | 8.46 | 6.33 | 8.78 | 11.35 | 5.09 | 11.68 |
| T_KOBE | 26.83 | 17.58 | 15.18 | 21.78 | 17.9 | 19.76 | 23.11 | 18.02 | 20 | 17.89 | 11.17 | 28.37 |
| T_WC | 404.7 | 238 | 77.47 | 131 | 129.5 | 97.72 | 170.6 | 93.46 | 80.96 | 60.07 | 41.68 | 83.12 |
| Position | East Gate | 1st Floor | 8th Floor | 16th Floor | ||||||||
|---|---|---|---|---|---|---|---|---|---|---|---|---|
| Direction Serial Number | X | Y | Z | X | Y | Z | X | Y | Z | X | Y | Z |
| TX_2 | −20.3 | −20.2 | 8.5 | 55.8 | 12.2 | 16.9 | 74.3 | 0.8 | −25.8 | 38.3 | −152.9 | −958.1 |
| TX_10 | −13.5 | −32.2 | −8.7 | 78.2 | 19.7 | −18.7 | 93.1 | 51.6 | 47.7 | 93.7 | −18.9 | −35.2 |
| TX_30 | 69.2 | 22.9 | −67.4 | 95.4 | 92.8 | 31.2 | 98.0 | 94.1 | 80.2 | 98.8 | 98.3 | 24.4 |
| TY_2 | −69.8 | −3.2 | −0.4 | −225.3 | 50.2 | −166.5 | 38.8 | 47.5 | −422.4 | 26.0 | −291.6 | −406.9 |
| TY_10 | −64.3 | 27.7 | −309.2 | 41.1 | 85.0 | −518.8 | 70.9 | 63.8 | −12.0 | 22.4 | 47.8 | −368.8 |
| TY_30 | −36.7 | 83.8 | −50.3 | 52.5 | 97.8 | 53.1 | 90.0 | 97.7 | 65.9 | - | 97.2 | −27.9 |
| TZ_2 | −44.9 | −45.4 | 19.7 | −232.4 | −6.2 | −591.4 | −25.2 | −10.7 | −586.9 | - | −890.5 | −390.6 |
| TZ_10 | 11.0 | −90.0 | −61.7 | 34.3 | 44.2 | −257.8 | 67.0 | −28.2 | 35.8 | 55.4 | −52.5 | −4.5 |
| TZ_30 | 34.3 | 4.2 | 1.2 | 85.2 | 64.7 | −0.4 | 92.3 | 88.2 | 63.3 | 92.3 | 61.4 | 70.8 |
| T_EI | −31.3 | −29.9 | −29.2 | 35.9 | 6.5 | −1.6 | 9.6 | −12.9 | −597.7 | 53.3 | −139.7 | −385.5 |
| T_KOBE | 18.8 | −1.8 | −30.2 | 52.9 | 53.1 | −0.1 | 76.8 | 21.0 | −59.8 | 78.8 | −28.8 | −217.8 |
| T_WC | 67.6 | 45.6 | −26.1 | 93.0 | 87.4 | 41.5 | 98.2 | 85.7 | 48.1 | 96.8 | 84.9 | 38.9 |
| Location | Time | Continuous Vibration, Intermittent Vibration, and Repetitive Shock Vibration | Shock Vibration Occurs Only a Few Times per Day | ||||
|---|---|---|---|---|---|---|---|
| Horizontal | Vertical | Mixed | Horizontal | Vertical | Mixed | ||
| Office | Daytime | 83 | 86 | 83 | 107 | 110 | 107 |
| Nighttime | |||||||
Disclaimer/Publisher’s Note: The statements, opinions and data contained in all publications are solely those of the individual author(s) and contributor(s) and not of MDPI and/or the editor(s). MDPI and/or the editor(s) disclaim responsibility for any injury to people or property resulting from any ideas, methods, instructions or products referred to in the content. |
© 2023 by the authors. Licensee MDPI, Basel, Switzerland. This article is an open access article distributed under the terms and conditions of the Creative Commons Attribution (CC BY) license (https://creativecommons.org/licenses/by/4.0/).
Share and Cite
Xie, W.; Liang, H.; Zhang, Z.; Wei, P.; Lu, Y. Testing and Analysis of Surrounding Buildings during the Operation of Seismic Simulation Shaking Table. Buildings 2023, 13, 2432. https://doi.org/10.3390/buildings13102432
Xie W, Liang H, Zhang Z, Wei P, Lu Y. Testing and Analysis of Surrounding Buildings during the Operation of Seismic Simulation Shaking Table. Buildings. 2023; 13(10):2432. https://doi.org/10.3390/buildings13102432
Chicago/Turabian StyleXie, Wenbo, Huiqi Liang, Zhiqiang Zhang, Peizi Wei, and Yijing Lu. 2023. "Testing and Analysis of Surrounding Buildings during the Operation of Seismic Simulation Shaking Table" Buildings 13, no. 10: 2432. https://doi.org/10.3390/buildings13102432