Studies on the Specificity of Outdoor Thermal Comfort during the Warm Season in High-Density Urban Areas

Abstract
:1. Introduction
2. Method
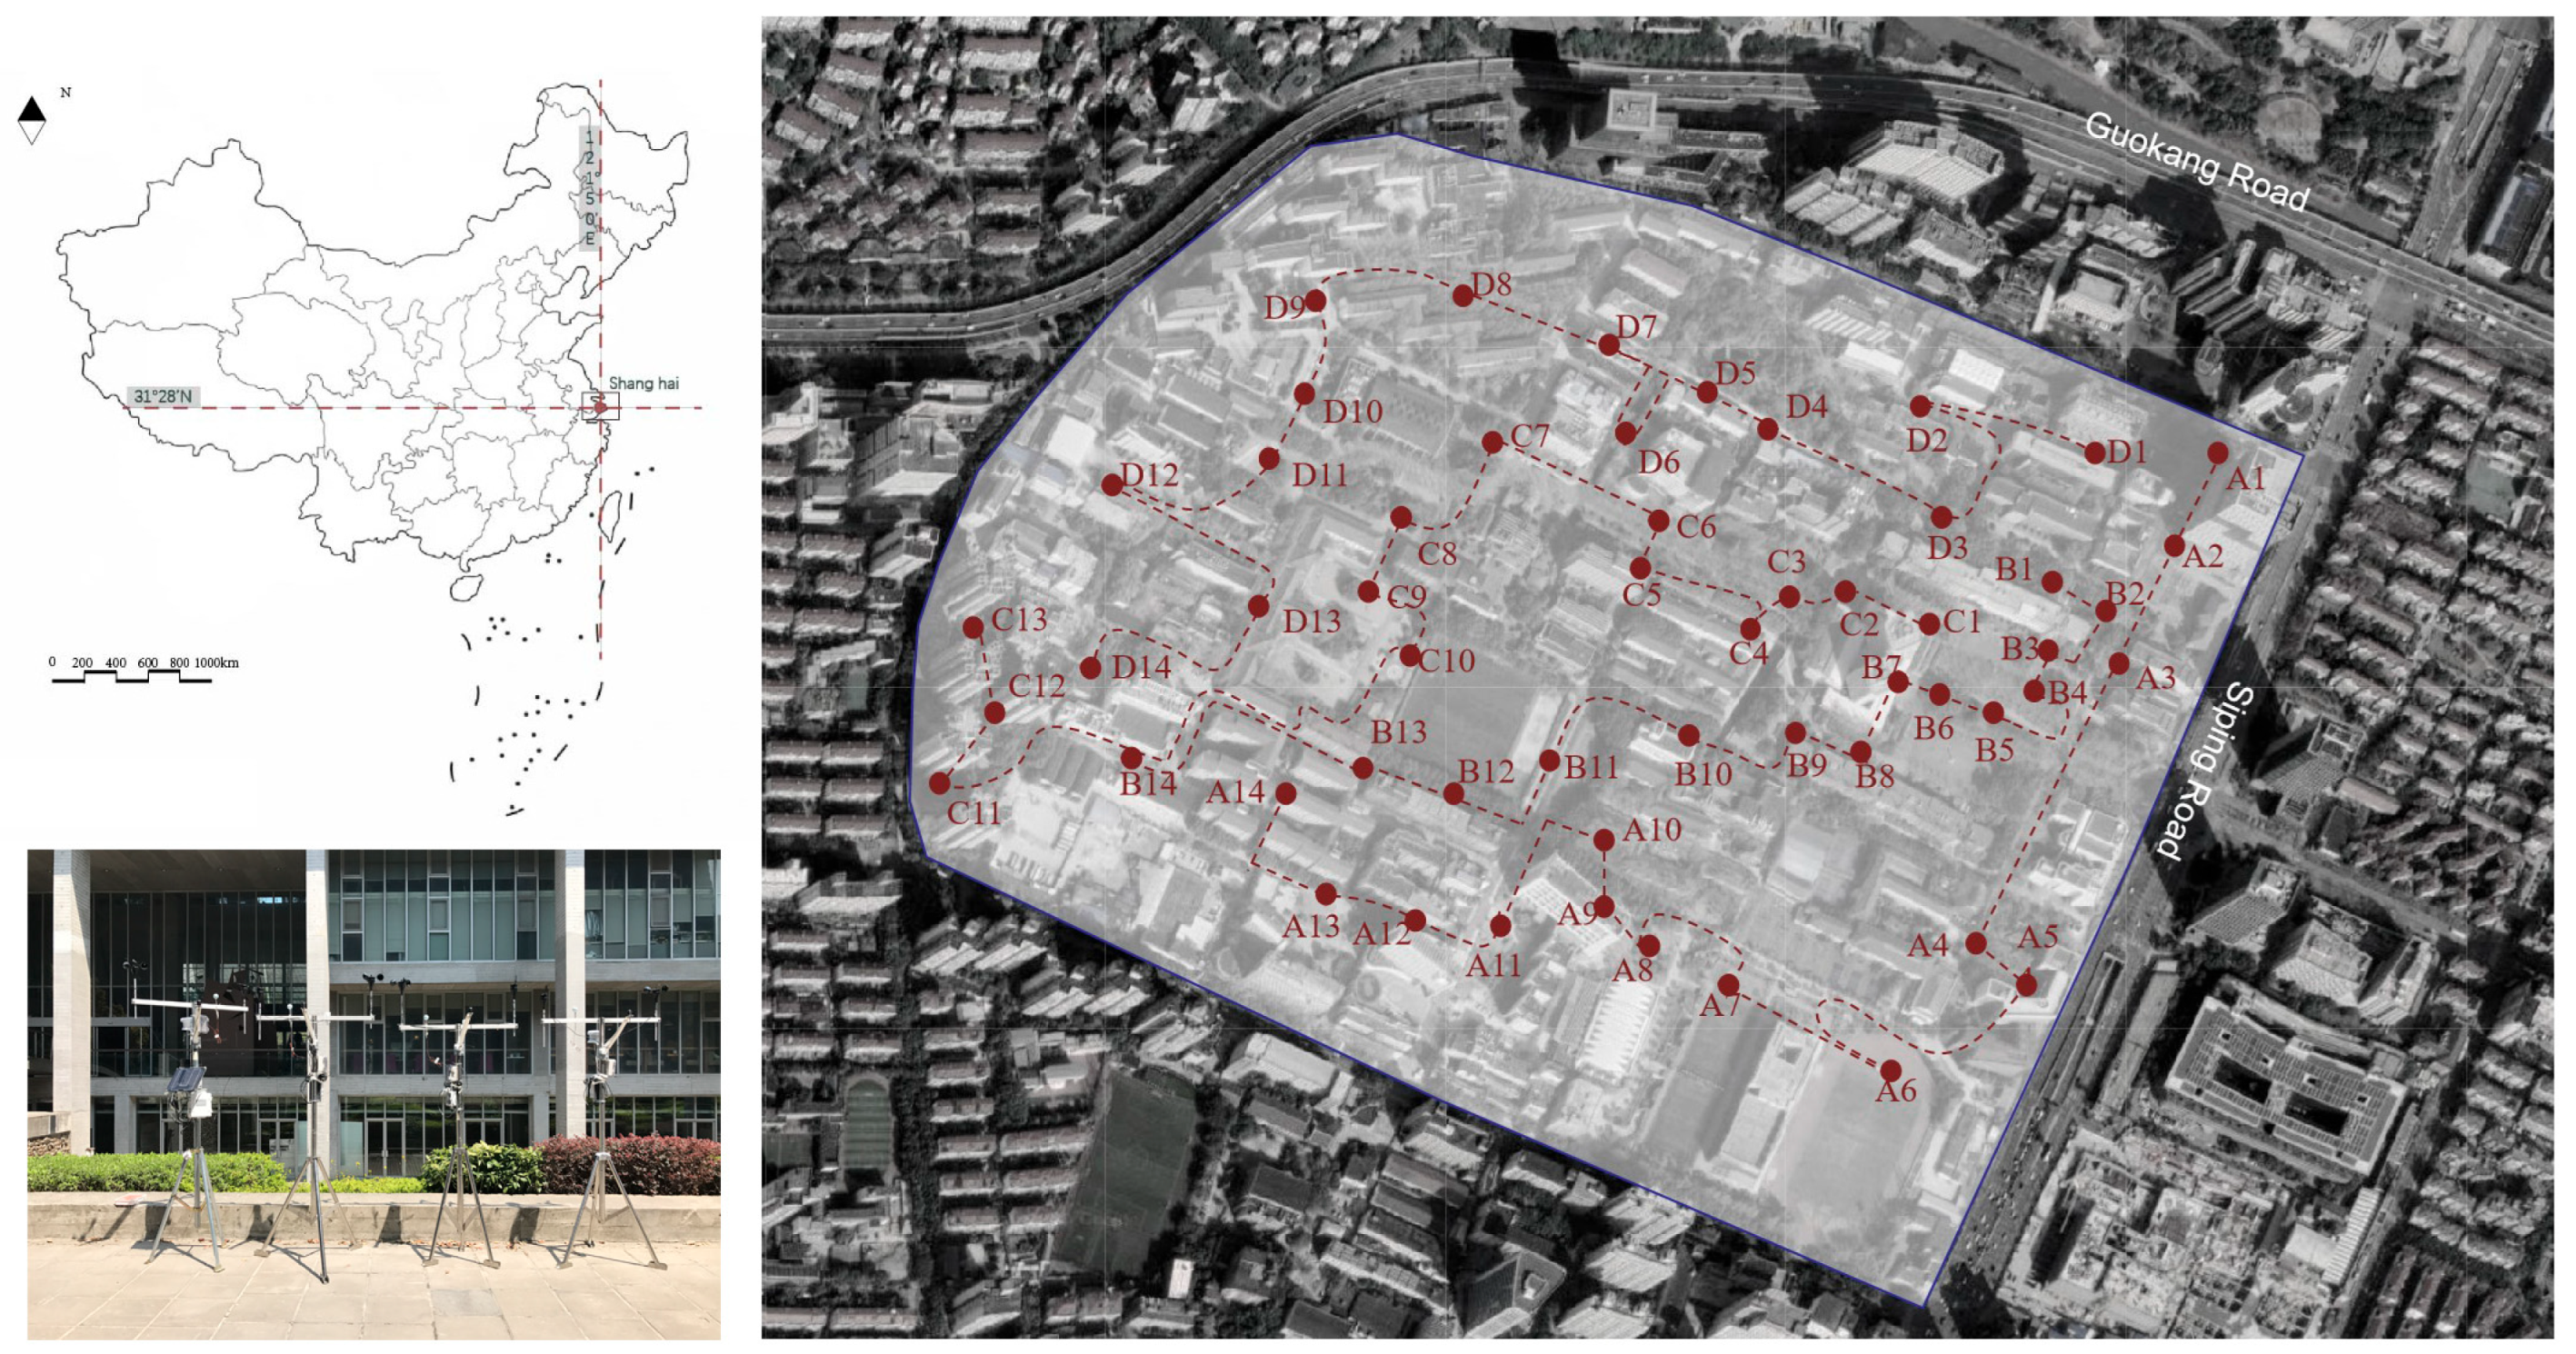
2.1. Research Area
2.2. Micro-Meteorological Measurement
2.3. Questionnaire
2.4. Thermal Comfort Indices
- (1)
- Physiological Equivalent Temperature (PET)
- (2)
- Universal Thermal Climate Index (UTCI)
3. Results and Discussion
3.1. Thermal Environmental Level
3.2. Thermal Comfort Status
3.2.1. Subjective Thermal Reaction Votes
- (1)
- Thermal sensation votes (TSVs) and thermal preference votes (TPVs)
- (2)
- Humidity sensation votes (HSVs) and humidity preference votes (HPVs)
- (3)
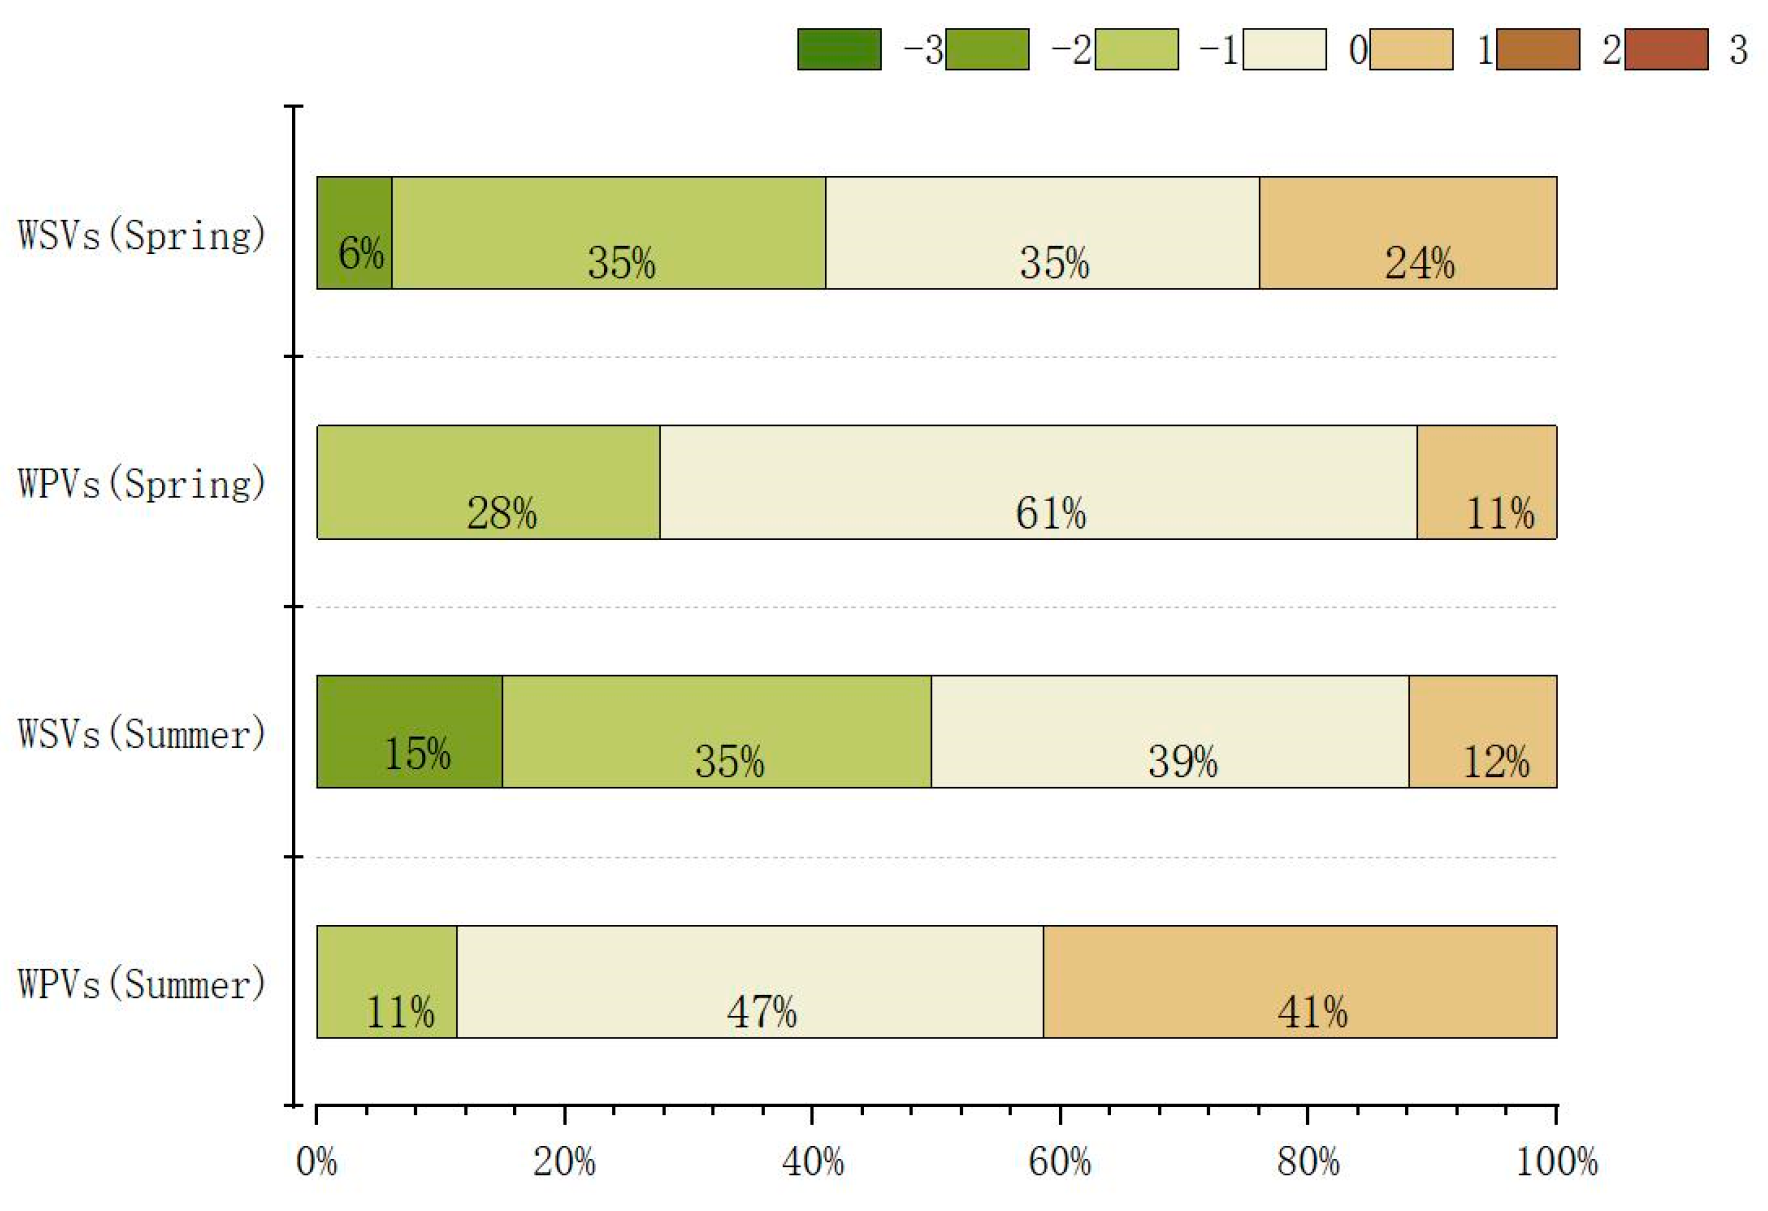
- Wind speed sensation votes (WSVs) and wind speed preference votes (WPVs)
- (4)
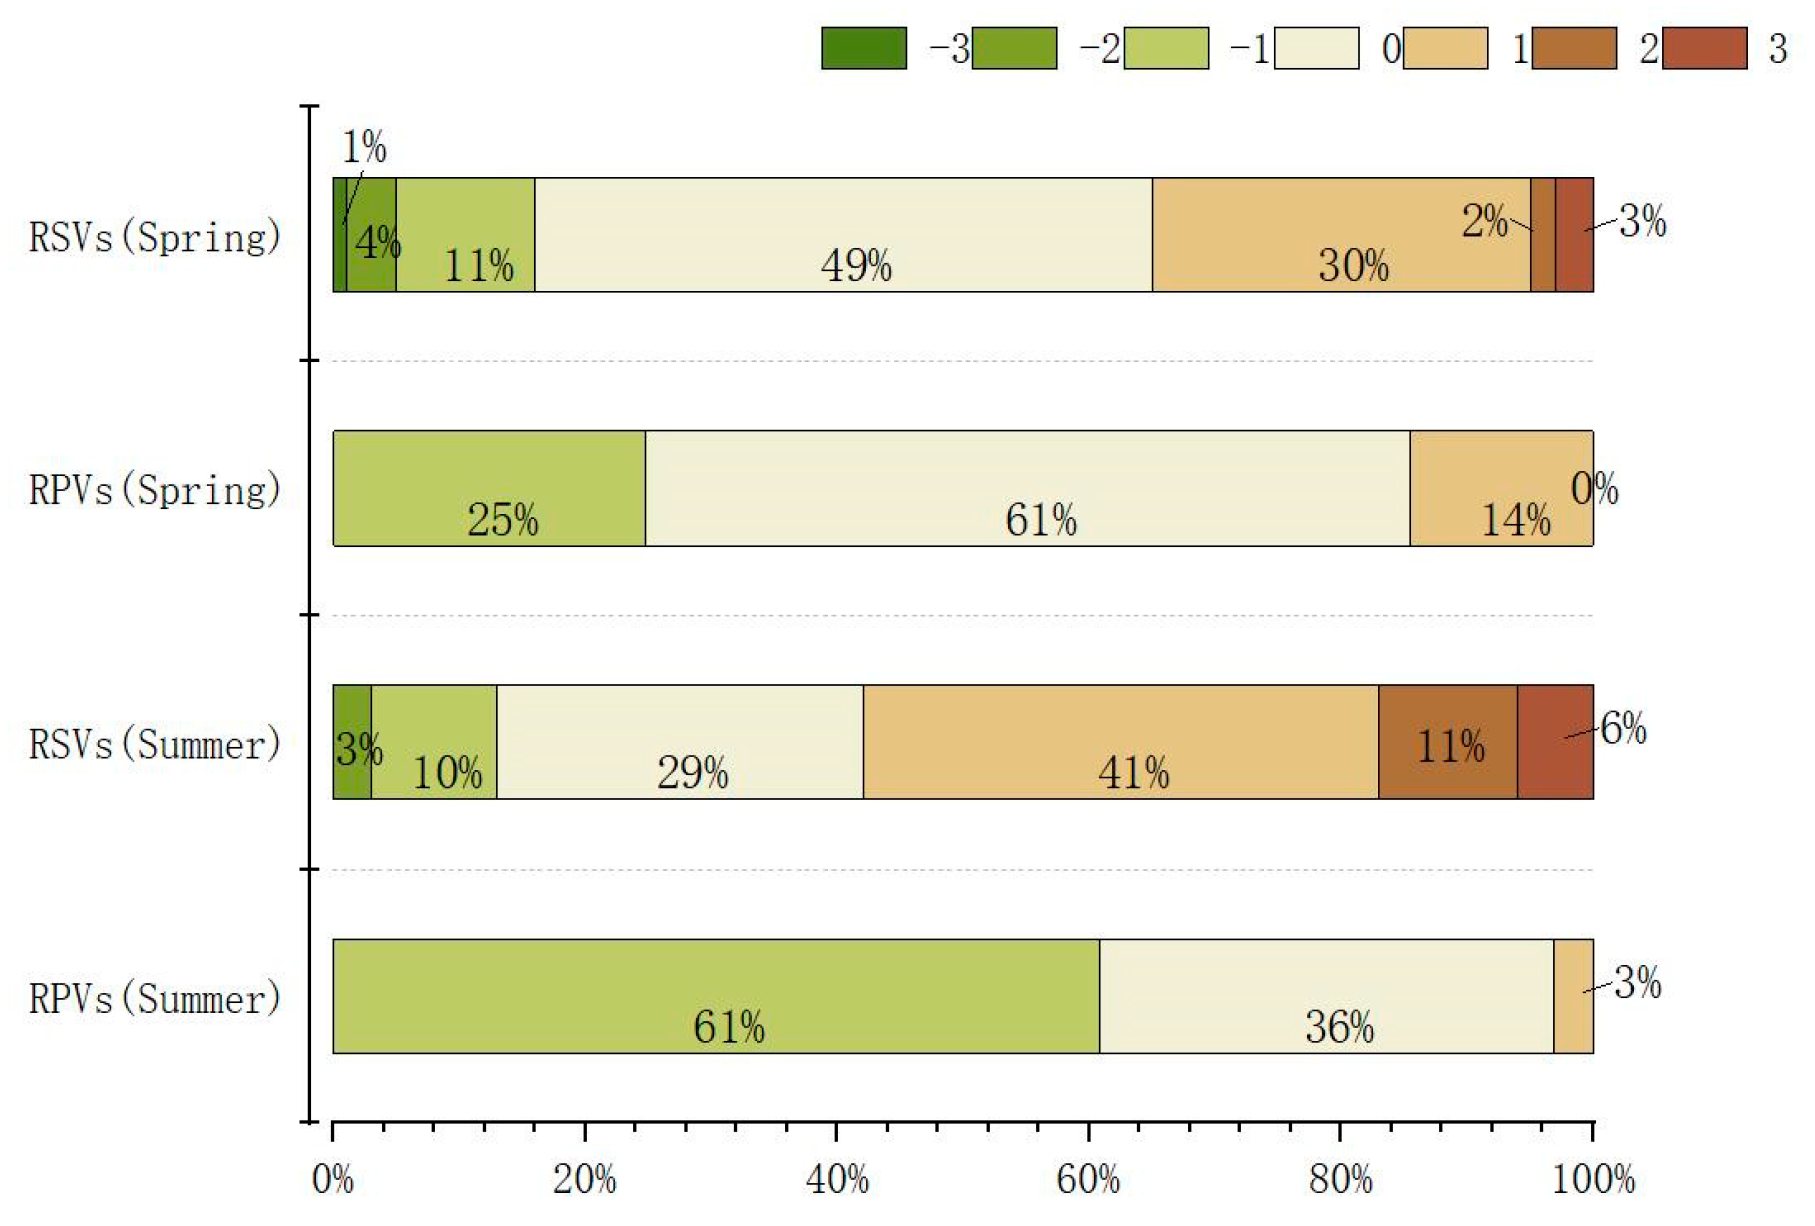
- Radiation sensation votes (RPVs) and radiation preference votes (RPVs)
3.2.2. Correlation between Subjective Feeling Votes
3.3. Outdoor Thermal Comfort Specificity Analysis
3.3.1. Analysis of the Applicability of PET to UTCI
3.3.2. Neutral Temperature and Heat Sensitivity
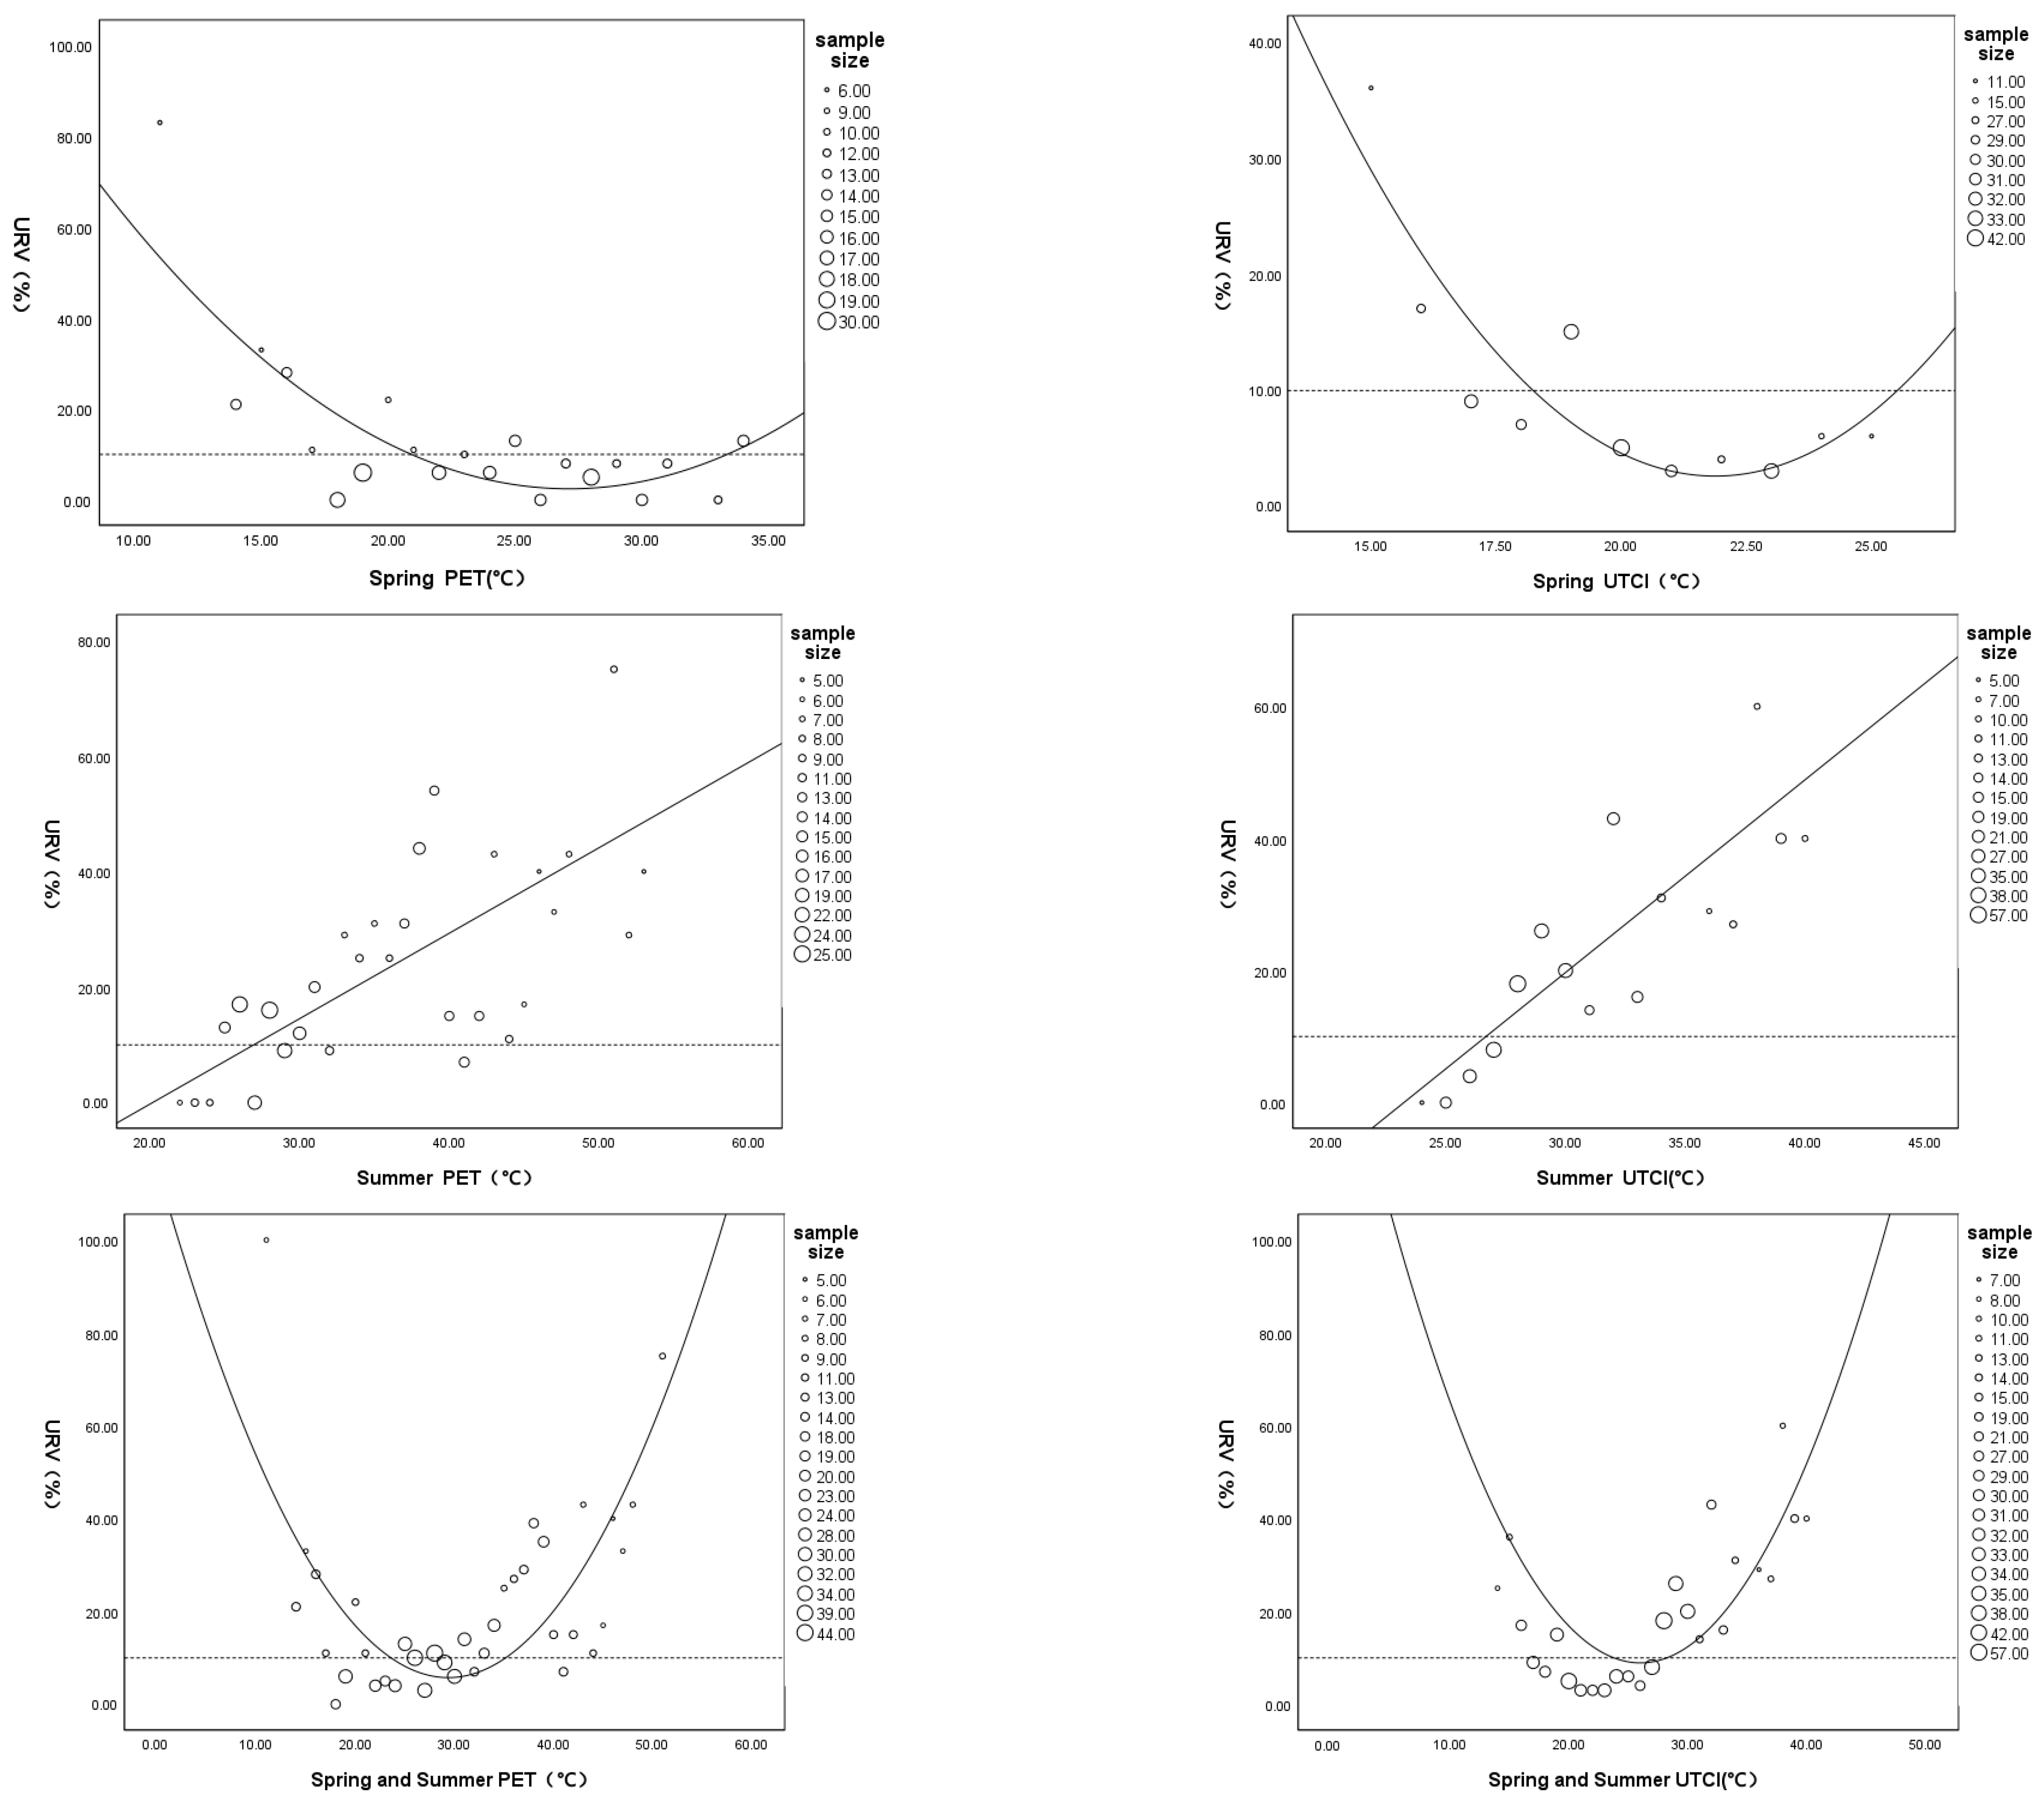
3.3.3. 90% Acceptance Range
3.4. Dress Code and Thermal Adaptation Behavior
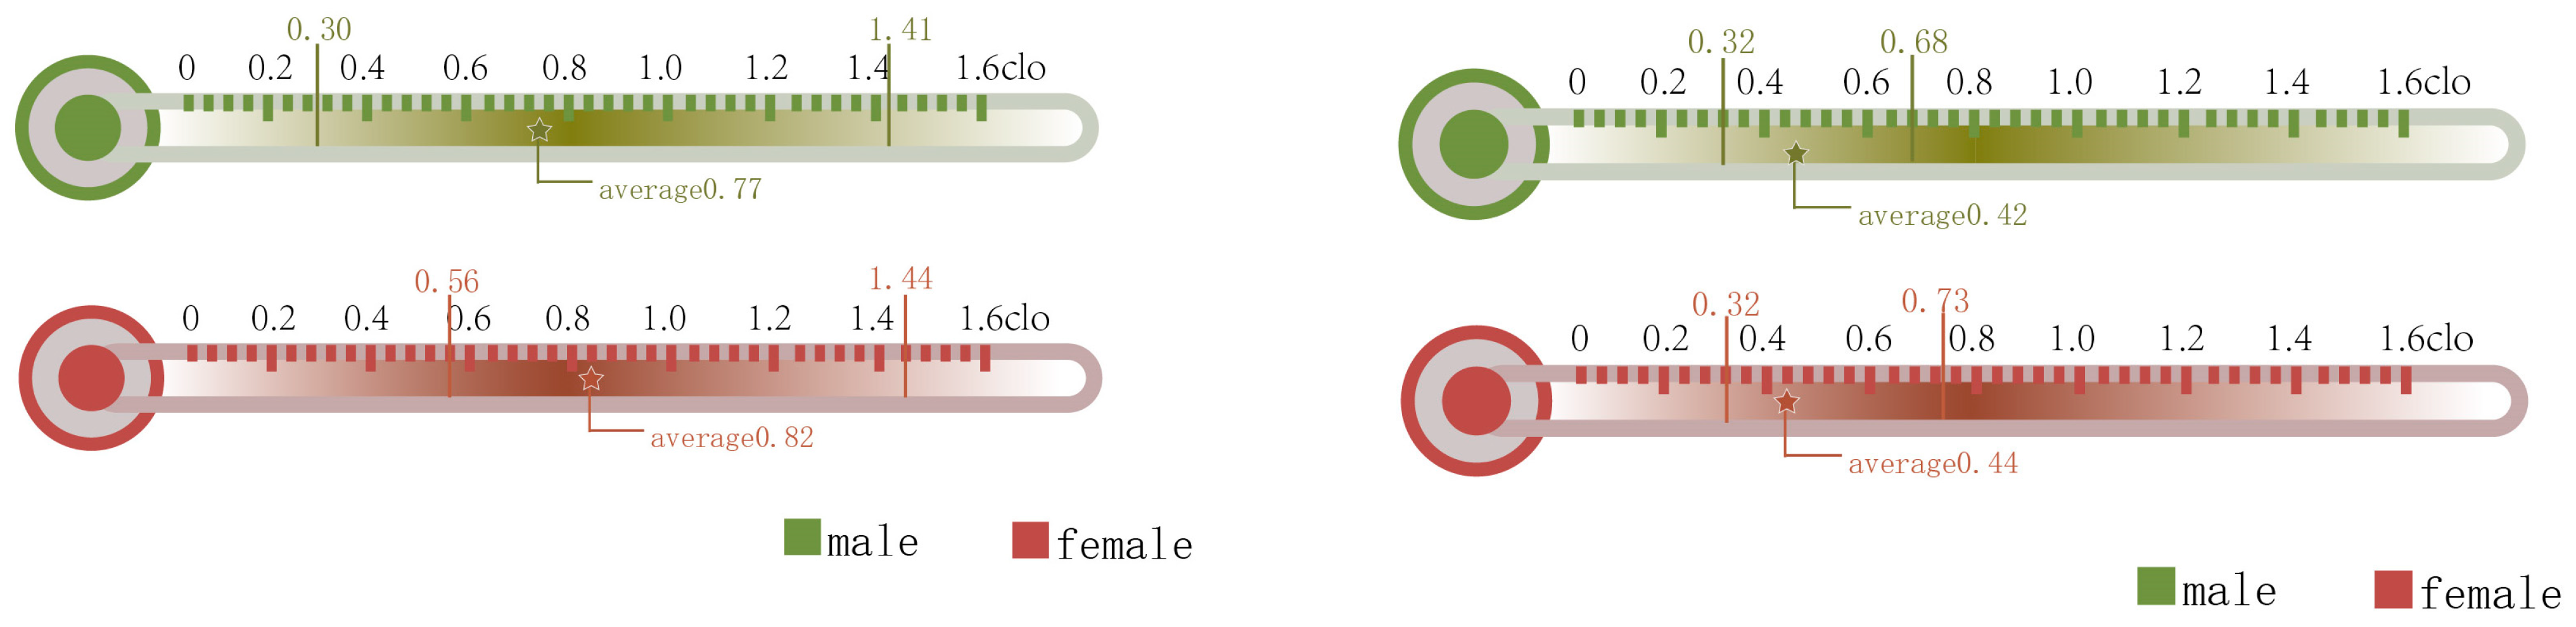
3.4.1. Clothing Thermal Resistance
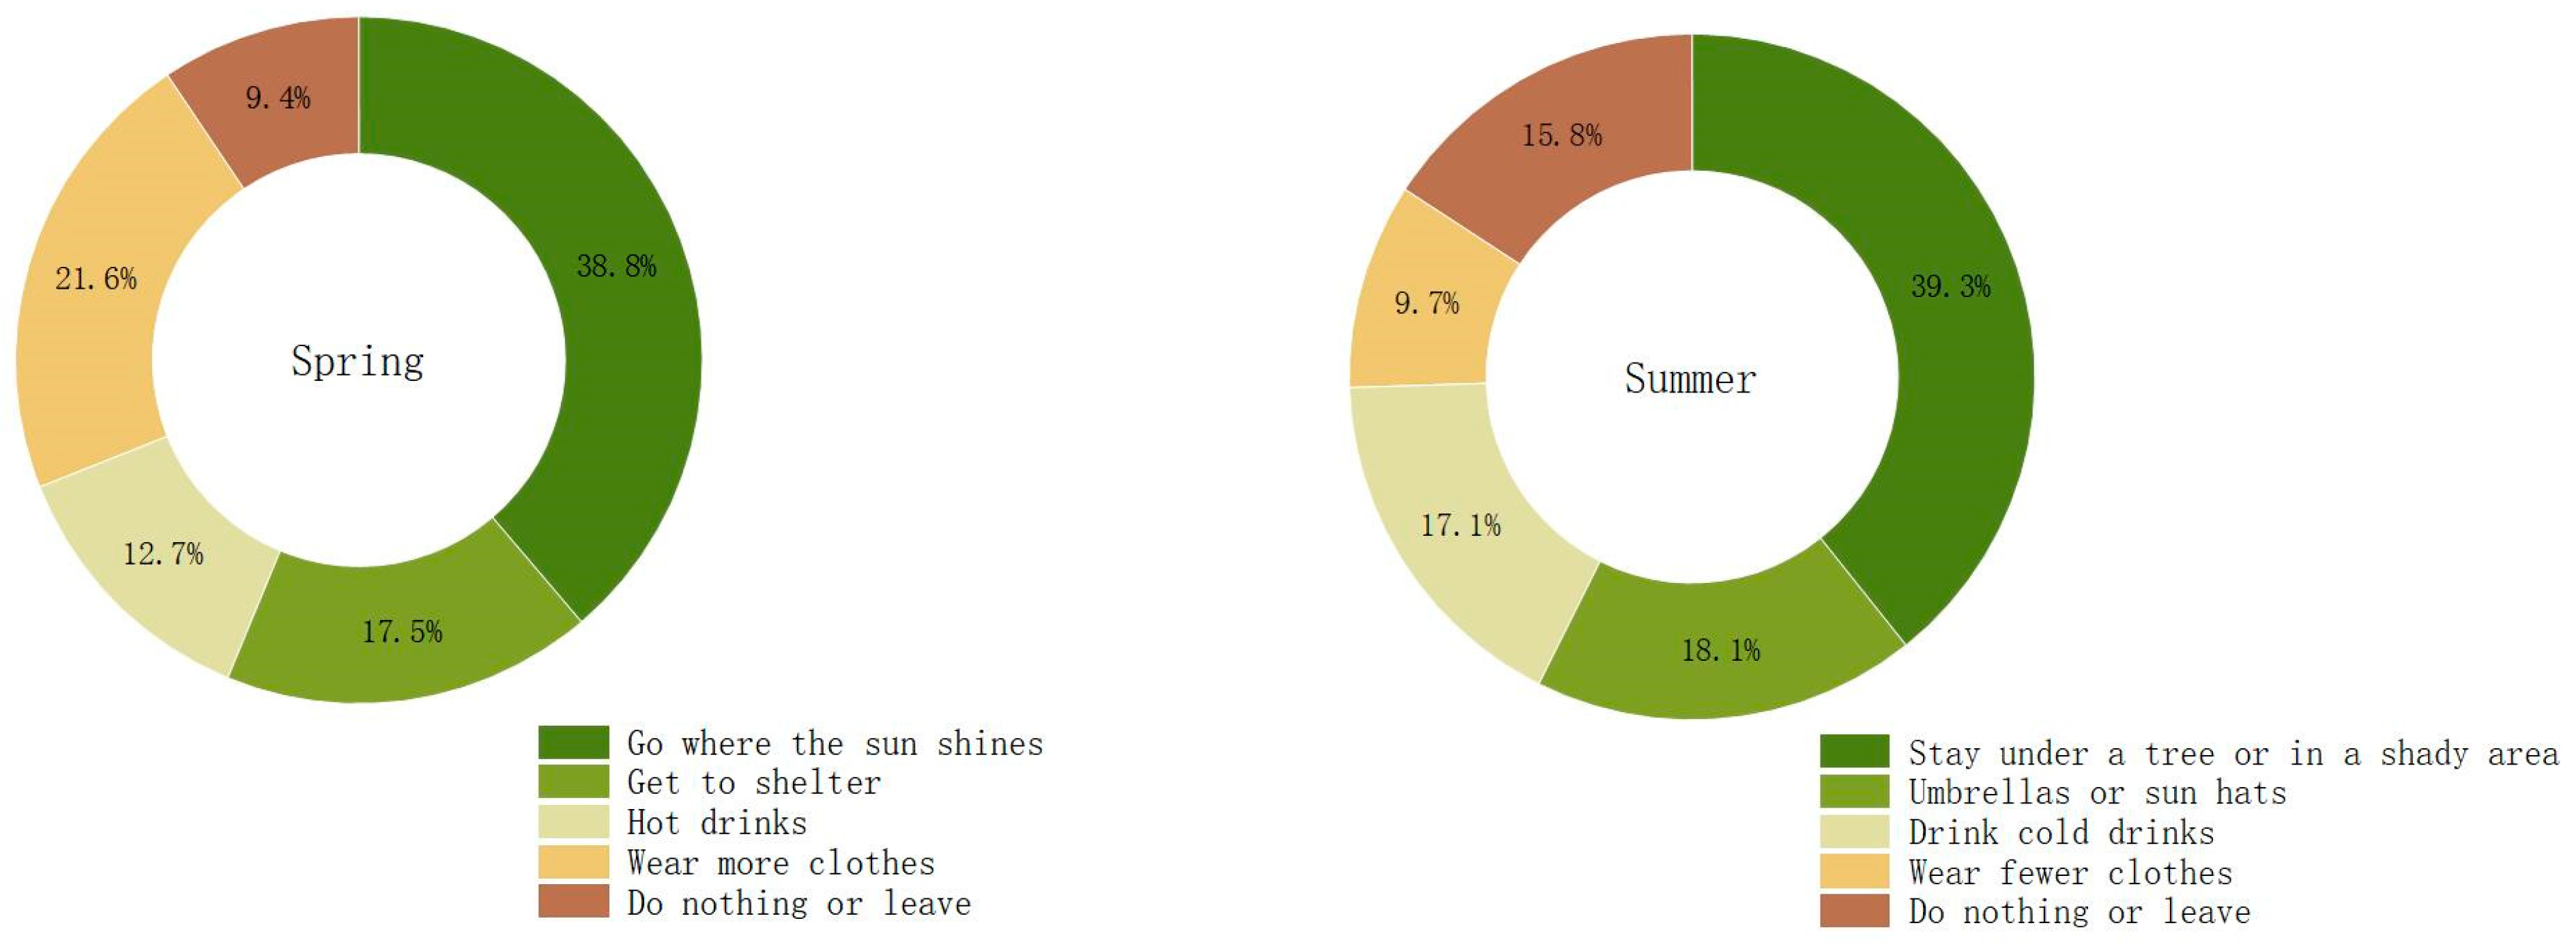
3.4.2. Thermal Adaptive Behavior
4. Conclusions
- (1)
- The analysis of correlation between the thermal sensation votes and the microclimate parameters showed that there is a negative correlation between TSVs and WSVs, as well as a positive correlation with RSVs during spring and summer. However, there is no significant correlation between RSVs and WSVs and HSVs in spring. It can be inferred that solar radiation and wind speed were most significant outdoor environmental factors that influence human outdoor thermal comfort during summer.
- (2)
- In the hot summer and cold winter region represented by Shanghai, the neutral PET was 22.30 °C and 24.55 °C in spring and summer, respectively; the neutral UTCI was 18.75 °C and 26.26 °C in spring and summer, respectively. The range of 90% acceptable PET in Shanghai is 25.0–32.1 °C and the range of the UTCI is 24.2–27.7 °C. This study evaluated the effectiveness of two thermal indices, the PET and UTCI. Compared with the two thermal indices, it was observed that the correlation between the UTCI and the average thermal sensation votes was higher. This indicates that the UTCI is more effective in characterizing the thermal sensation experienced by people in Shanghai.
- (3)
- During the research period, evidence of thermal adaptation was observed. The average thermal resistance values were determined to be 0.788 clo during the spring season and 0.434 clo during the summer season. A negative correlation was observed between the average clothing insulation and temperature. It was observed that people adapts to the temperature changes by modifying their clothing, either by adding or removing layers. Interestingly, hat females demonstrated a higher average thermal resistance in comparison to males during warm seasons.
Author Contributions
Funding
Data Availability Statement
Conflicts of Interest
References
- Lai, D.Y.; Lian, Z.W.; Liu, W.W.; Guo, C.R.; Liu, W.; Liu, K.X.; Chen, Q.Y. A comprehensive review of thermal comfort studies in urban open spaces. Sci. Total Environ. 2020, 742, 140092. [Google Scholar] [CrossRef] [PubMed]
- Li, X.M.; Zhou, Y.Y.; Yu, S.; Jia, G.S.; Li, H.D.; Li, W.L. Urban heat island impacts on building energy consumption: A review of approaches and findings. Energy 2019, 174, 407–419. [Google Scholar] [CrossRef]
- World eBook Library. American Society of Heating, Refrigerating and Air-conditioning Engineers. Int. J. Refrig. 1979, 2, 56–57. [Google Scholar] [CrossRef]
- ANSI/ASHRAE Standard 55-2020; Thermal Environmental Conditions for Human Occupancy. ASHRAE Customer Service: Atlanta, GA, USA, 2020.
- Yang, W.; Wong, N.H.; Jusuf, S.K. Thermal comfort in outdoor urban spaces in Singapore. Build. Environ. 2013, 59, 426–435. [Google Scholar] [CrossRef]
- Hwang, R.L.; Lin, T.P.; Cheng, M.J.; Lo, J.H. Adaptive comfort model for tree-shaded outdoors in Taiwan Build. Build. Environ. 2010, 45, 1873–1879. [Google Scholar] [CrossRef]
- Höppe, P. The physiological equivalent temperature: A universal index for the biometeorological assessment of the thermal environment. Int. J. Biometeorol. 1999, 43, 71–75. [Google Scholar] [CrossRef]
- Park, S.; Tuller, S.E.; Jo, M. Application of Universal Thermal Climate Index (UTCI) for microclimatic analysis in urban thermal environments. Landsc. Urban Plan. 2014, 125, 146–155. [Google Scholar] [CrossRef]
- Xi, T.Y.; Wang, S.; Wang, Q.C.; Lv, X.W.; Shaban, A.H.; Salame, C.T.; Aillerie, M.; Papageorgas, P. College students’ subjective response to outdoor thermal environment in a severely cold climate city. AIP Conf. Proc. 2019, 2123, 020023. [Google Scholar] [CrossRef]
- Wang, Y.; Pan, C.; Huang, Z.S. Comparison of the applicability of PET and UTCI in different seasons in Shanghai. Build. Sci. 2020, 36, 55–61. [Google Scholar] [CrossRef]
- Zafarmandi, S.; Mahdavinejad, M.; Norford, L.; Matzarakis, A. Analyzing Thermal Comfort Sensations in Semi-Outdoor Space on a University Campus: On-Site Measurements in Tehran’s Hot and Cold Seasons. Atmosphere 2022, 13, 1034. [Google Scholar] [CrossRef]
- Nikolopoulou, M.; Lykoudis, S. Thermal comfort in outdoor urban spaces: Analysis across different European countries. Build. Environ. 2005, 41, 1455–1470. [Google Scholar] [CrossRef]
- Feng, X.W.; He, C.X.; Fang, Z.S.; Yi, Z.L. Current status of research on outdoor thermal comfort. Build. Sci. 2017, 33, 152–158. [Google Scholar] [CrossRef]
- Kenawy, I.; Elkadi, H. Effects of cultural diversity and climatic background on outdoor thermal perception in Melbourne city, Australia. Build. Environ. 2021, 195, 107746. [Google Scholar] [CrossRef]
- Liu, W.W.; Zhang, Y.X.; Deng, Q.H. The effects of urban microclimate on outdoor thermal sensation and neutral temperature in hot-summer and cold-winter climate. Energy Build. 2016, 128, 190–197. [Google Scholar] [CrossRef]
- Yang, B.; Olofsson, T.; Nair, G.; Kabanshi, A. Outdoor thermal comfort under subarctic climate of north Sweden—A pilot study in Umeå. Sustain. Cities Soc. 2017, 28, 387–397. [Google Scholar] [CrossRef]
- Chen, L.; Wen, Y.Y.; Zhang, L.; Xiang, W.N. Studies of thermal comfort and space use in an urban park square in cool and cold seasons in Shanghai. Build. Environ. 2015, 94, 644–653. [Google Scholar] [CrossRef]
- Jendritzky, G.; de Dear, R.; Havenith, G. UTCI-why another thermal index? Int. J. Biometeorol. 2012, 56, 421–428. [Google Scholar] [CrossRef]
- Brode, P.; Fiala, D.; Blazejczyk, K.; Holmer, I.; Jendritzky, G.; Kampmann, B.; Tinz, B.; Havenith, G. Deriving the operational procedure for the Universal Thermal Climate Index (UTCI). Int. J. Biometeorol. 2012, 56, 481–494. [Google Scholar] [CrossRef]
- Blazejczyk, K.; Epstein, Y.; Jendritzky, G.; Staiger, H.; Tinz, B. Comparison of UTCI to selected thermal indices. Int. J. Biometeorol. 2012, 56, 515–535. [Google Scholar] [CrossRef]
- Li, K.M.; Zhang, Y.F.; Zhao, L.H. Outdoor thermal comfort and activities in the urban residential community in a humid subtropical area of China. Energy Build. 2016, 133, 498–511. [Google Scholar] [CrossRef]
- Mahmoud, A.H.A. Analysis of the microclimatic and human comfort conditions in an urban park in hot and arid regions. Build. Environ. 2011, 46, 2641–2656. [Google Scholar] [CrossRef]
- Kruger, E.; Drach, P.; Emmanuel, R.; Corbella, O. Urban heat island and differences in outdoor comfort levels in Glasgow, UK. Theor. Appl. Climatol. 2013, 112, 127–141. [Google Scholar] [CrossRef]
- Yahia, M.W.; Johansson, E. Evaluating the behaviour of different thermal indices by investigating various outdoor urban environments in the hot dry city of Damascus, Syria. Int. J. Biometeorol. 2013, 57, 615–630. [Google Scholar] [CrossRef]
- Spagnolo, J.; Dear, R.de. A field study of thermal comfort and semi-outdoor environments in subtropical Sydney Australia. Build. Environ. 2003, 38, 721–738. [Google Scholar] [CrossRef]
- Yang, W.; Wong, N.H.; Zhang, G. A comparative analysis of human thermal conditions in outdoor urban spaces in the summer season in Singapore and Changsha, China. Int. J. Biometeorol. 2013, 57, 895–907. [Google Scholar] [CrossRef] [PubMed]
- Charlie, K.C.L.; Ka-Lun, K.L. Effect of long-term acclimatization on summer thermal comfort in outdoor spaces: A comparative study between Melbourne and Hong Kong. Int. J. Biometeorol. 2018, 62, 1311–1324. [Google Scholar] [CrossRef]
- Cheng, V.; Ng, E.; Chan, C.; Givoni, B. Outdoor thermal comfort study in a sub-tropical climate: A longitudinal study based in Hong Kong. Int. J. Biometeorol. 2012, 56, 43–56. [Google Scholar] [CrossRef]
- Xi, T.Y.; Lei, Y.S. Study on the variability of thermal comfort of urban park crowds in winter and summer in severe cold areas. Build. Sci. 2021, 37, 52–60. [Google Scholar] [CrossRef]
- Xu, M.; Hong, B.; Jiang, R.S.; An, L.; Zhang, T. Outdoor thermal comfort of shaded spaces in an urban park in the cold region of China. Build. Environ. 2019, 155, 408–420. [Google Scholar] [CrossRef]
- Elnabawi, M.H.; Hamza, N.; Dudek, S. Thermal perception of outdoor urban spaces in the hot arid region of Cairo, Egypt. Sustain. Cities Soc. 2016, 22, 136–145. [Google Scholar] [CrossRef]
- Kumar, P.; Sharma, A. Assessing outdoor thermal comfort conditions at an urban park during summer in the hot semi-arid region of India. Mater. Today Proc. 2022, 61, 356–369. [Google Scholar] [CrossRef]
- Neves, E.B.; Salamunes, A.C.C.; de Oliveira, R.M.; Stadnik, A.M.W. Effect of body fat and gender on body temperature distribution. J. Therm. Biol. 2017, 70, 1–8. [Google Scholar] [CrossRef] [PubMed]
- Jin, H.; Liu, S.Q.; Kang, J. Gender differences in thermal comfort on pedestrian streets in cold and transitional seasons in severe cold regions in China. Build. Environ. 2019, 168, 106488. [Google Scholar] [CrossRef]


| Device Model | Measurement Parameters | Accuracy Error | Range |
|---|---|---|---|
| H21-002 Micro weather station data logger | Recorded data | First data point 0 to 2 s at 25 °C (77 °F) | / |
| S-THB-M002 Temperature and humidity sensor | Air temperature/ relative humidity | Temperature: ±0.2 °C Humidity: ±2.5% | −40 °C to 75 °C 0 to 100% |
| S-LIB-M003 Total radiation sensor | Total solar radiation | ±10 W/m2 or ±5% | 0 to 1280 W/m2 |
| S-WSET-B Wind speed and direction sensors | Wind speed/direction | ±1.1 m/s | 0 to 45 m/s |
| U23-001 Temperature and Humidity recorder | Air temperature/ relative humidity | Temperature: ±0.18 °C Humidity: ±2.5% | −40 to 75 °C; 0 to 100% |
| UX100-014M Temperature logger | Temperature | ±0.6 °C | −26 to 950 °C |
| Spring Sample | Summer Sample | ||||
|---|---|---|---|---|---|
| Sample Size | 311 | Sample Size | 357 | ||
| Sex | Male | 184 | Sex | Male | 209 |
| Female | 127 | Female | 148 | ||
| Age | Average age | 27.86 | Age | Average age | 24.82 |
| Standard deviation | 12.29 | Standard deviation | 8.02 | ||
| Minimum value | 6 | Minimum value | 5 | ||
| Maximum value | 84 | Maximum value | 70 | ||
| Spring | Summer | |||||||
|---|---|---|---|---|---|---|---|---|
| Minimum | Maximum | Average | Standard Deviation | Minimum | Maximum | Average | Standard Deviation | |
| Air temperature °C | 14.99 | 23.40 | 19.40 | 2.12 | 24.08 | 39.63 | 30.70 | 4.20 |
| Relative humidity % | 17.01 | 43.10 | 28.71 | 7.20 | 30.74 | 67.81 | 49.99 | 8.57 |
| Globe temperature °C | 16.41 | 28.51 | 22.20 | 2.95 | 24.39 | 44.84 | 32.47 | 4.64 |
| Solar radiation w/m2 | 28.33 | 930.08 | 414.25 | 271.63 | 5.00 | 956.53 | 318.93 | 296.02 |
| Wind speed m/s | 0.03 | 2.73 | 0.83 | 0.57 | 0.00 | 2.73 | 0.47 | 0.51 |
| Mean radiation temperature °C | 17.05 | 42.08 | 26.94 | 6.02 | 29.13 | 49.30 | 34.42 | 5.67 |
| PET °C | 11.30 | 39.30 | 24.17 | 6.595 | 22.10 | 56.60 | 35.44 | 8.55 |
| UTCI °C | 13.27 | 25.60 | 20.07 | 2.806 | 22.99 | 43.62 | 31.22 | 4.64 |
| HSVs | WSVs | RSVs | |||
|---|---|---|---|---|---|
| Spring | TSV | Pearson correlation | −0.025 | −0.218 ** | 0.367 ** |
| Significance (two-sided) | 0.661 | 0.000 | 0.000 | ||
| N | 311 | 311 | 311 | ||
| Summer | TSV | Pearson correlation | −0.067 | −0.488 ** | 0.477 ** |
| Significance (two-sided) | 0.209 | 0.000 | 0.000 | ||
| N | 357 | 357 | 357 | ||
| Thermal Comfort Indices | Season | Linear Regression Equation | R2 |
|---|---|---|---|
| PET | spring | MTSVs = 0.0585PET − 1.3043 | R2 = 0.5576 |
| summer | MTSVs = 0.0702PET − 1.7234 | R2 = 0.7616 | |
| UTCI | spring | MTSVs = 0.1274UTCI − 2.3893 | R2 = 0.7770 |
| summer | MTSVs = 0.1599UTCI − 4.1992 | R2 = 0.8255 |
| Thermal Comfort Indices | Season | Neutral Temperature | 90% Acceptance Range | Two Seasons 90% Acceptance Range |
|---|---|---|---|---|
| PET | spring | 22.30 °C | 20.5~31.4 °C | 25.0~32.1 °C |
| summer | 24.55 °C | <20.4 °C | ||
| UTCI | spring | 18.75 °C | 18.3~25.3 °C | 24.2~27.7 °C |
| summer | 26.26 °C | <23.3 °C |
| Climatic Zone | City | Neutral PET | Neutral UTCI |
|---|---|---|---|
| Arid climate region | Cairo (Egypt) [22] | 30.1 °C Hot month 29 °C Cold month | / |
| Temperate marine climate | Glasgow (UK) [23] | 13.5 °C summer | / |
| Tropical Mediterranean climate | Damascus (Syria) [24] | 15.7 °C summer 24.2 °C winter | / |
| Mediterranean climate | Sydney (Australia) [25] | 22.9 °C summer 28.8 °C winter | / |
| Tropical monsoon climate | Singapore [6] | 28.7 °C summer | 23.5 °C summer |
| Subtropical monsoon climate | Shanghai (This study) | 22.30 °C spring 24.55 °C summer | 18.75 °C spring 26.26 °C summer |
| Changsha (China) [26] | 27.9 °C summer | / | |
| Hong Kong (China) [27,28] | 25 °C summer 21 °C winter | 22.7 °C summer | |
| Temperate monsoon climate | Harbin (China) [29] | 20.0 °C summer 13.2 °C winter | / |
| Tianjin (China) [10] | 15.55 °C summer | 17.5 °C annual | |
| Xi’an (China) [30] | 23.27 °C summer | 23.1 °C Winter and summer average |
| Thermal Comfort Indices | Season | Equation | R2 |
|---|---|---|---|
| PET | spring | URV = 0.3PET2 − 15.59PET + 203.56 | R2 = 0.6719 |
| summer | URV = 148PET − 301.6 | R2 = 0.5196 | |
| two seasons | URV = 0.13PET2 − 7.44PET + 114.83 | R2 = 0.5349 | |
| UTCI | spring | URV = 0.57UTCI2 − 248.9UTCI + 274.6 | R2 = 0.7897 |
| summer | URV = 2.92UTCI − 67.97 | R2 = 0.7849 | |
| two seasons | URV = 0.22UTCI2 − 11.42UTCI + 157.54 | R2 = 0.6587 |
| Climatic Zone | City | 90% Acceptance Range |
|---|---|---|
| Arid climate region | Cairo (Egypt) [31] | 24.3~29.5 °C (PET) Winter and summer |
| Marine climate | Glasgow (UK) [23] | 9~18 °C (PET) Three seasons |
| Semi-dry monsoon climate | Haryana (India) [32] | 24.04~37.55 °C (PET) summer 28.03~35.6 °C (UTCI) summer |
| Temperate continental climate | Umea (Sweden) [16] | 10–17 °C (PET) summer 11.5~17.2 °C (UTCI) summer |
| Temperate monsoon climate | Harbin (China) [29] | 11.6~35.9 °C (PET) summer |
| Tianjin (China) [10] | 11~24 °C (PET) annual 13.6~21.3 °C (UTCI) annual | |
| Subtropical monsoon climate | Shanghai (This study) | 25.0~32.1 °C (PET) Spring and summer 24.2~27.7 °C (UTCI) Spring and summer |
| Changsha (China) [26] | 18.6~31.2 °C (PET) summer | |
| Tropical monsoon climate | Singapore [26] | 18.7~30.3 °C (PET) summer |
Disclaimer/Publisher’s Note: The statements, opinions and data contained in all publications are solely those of the individual author(s) and contributor(s) and not of MDPI and/or the editor(s). MDPI and/or the editor(s) disclaim responsibility for any injury to people or property resulting from any ideas, methods, instructions or products referred to in the content. |
© 2023 by the authors. Licensee MDPI, Basel, Switzerland. This article is an open access article distributed under the terms and conditions of the Creative Commons Attribution (CC BY) license (https://creativecommons.org/licenses/by/4.0/).
Share and Cite
Wei, R.; Yan, J.; Cui, Y.; Song, D.; Yin, X.; Sun, N. Studies on the Specificity of Outdoor Thermal Comfort during the Warm Season in High-Density Urban Areas. Buildings 2023, 13, 2473. https://doi.org/10.3390/buildings13102473
Wei R, Yan J, Cui Y, Song D, Yin X, Sun N. Studies on the Specificity of Outdoor Thermal Comfort during the Warm Season in High-Density Urban Areas. Buildings. 2023; 13(10):2473. https://doi.org/10.3390/buildings13102473
Chicago/Turabian StyleWei, Ruihan, Jin Yan, Yanqiu Cui, Dexuan Song, Xin Yin, and Ninghan Sun. 2023. "Studies on the Specificity of Outdoor Thermal Comfort during the Warm Season in High-Density Urban Areas" Buildings 13, no. 10: 2473. https://doi.org/10.3390/buildings13102473