Abstract
This study examined the influence of quantitative and qualitative findings from both a pre-design occupancy evaluation (PDOE) and a post-occupancy evaluation (POE) on the expanded design team’s (designers, client, and researchers) approach to updating the interior work environment. The design team’s implementation of mid-course design solution modifications to the primary workspaces of an engineering group’s environment both after the PDOE and the POE yielded many significant outcomes. The POE was conducted using the same instrument as the PDOE one year after the employees had moved back into their renovated space on a corporate campus. The study’s results were used as a diagnostic tool to improve indoor environmental quality (IEQ) conditions for employees and provided benchmarks for the remaining (85%) campus workplace improvements. The influence and importance of IEQ criteria on employee satisfaction, work performance, and health were demonstrated and contribute to the body of knowledge regarding the influence of the built environment on building occupants. A paired inquiry (PDOE plus POE) helps ensure that human, financial, and environmental resources are appropriated with a higher likelihood of success over POE data alone in terms of meeting current and future employees’ needs and corporate goals.
1. Introduction
Significant impacts of indoor environmental quality (IEQ) on building occupants’ satisfaction, performance, and health have been continuously studied by researchers, motivated by the significant amount of time building occupants spend indoors [1,2]. Acoustic conditions, indoor air quality, daylighting and artificial lighting, thermal conditions, and ergonomics, among others, are examples of IEQ factors. As a research tool, post-occupancy evaluations (POEs) have frequently been utilized to measure building occupants’ satisfaction, performance, and health as well as the building’s performance [3].
Over time, research methods have evolved and the interest in utilizing POEs has grown, advancing our understanding of the influence of the built environment on its occupants, and understanding the benefits of this knowledge for the employer and/or building owner/manager [3]. POEs study IEQ factors and their influence on building occupants both subjectively and objectively via surveys, observations, and field measurements [4]. Findings resulting from POEs can provide architects and designers with feedback that informs their critical understanding and subsequently helps them improve their future designs [5].
POE studies investigating the impact of IEQ on occupants’ satisfaction, performance, and health have been conducted across different building typologies, including workplaces, educational settings, and group residential spaces (i.e., residence halls) [6]. Numerous researchers have identified IEQ factors that can affect employees in workplaces and identify resulting impacts [3,4]. For example, the substantial impact of thermal comfort on employees has been continuously investigated through a variety of comfort models over the last five decades [7]. Also, daylighting condition makes a critical contribution to employees’ satisfaction, overall IEQ quality, and reduces the building’s energy consumption [8,9].
However, findings from POEs only provide part of the information needed to improve the design of future environments. Findings from POEs typically measure what is known about the new or renovated space from occupants’ perceptions, typically conducted 9 to 12 months post-occupancy [10]. However, a POE cannot inform us about the degree of change between occupants’ current satisfaction, work performance, or health influenced by the built environment as compared to their perceptions of those factors when they occupied the previous or pre-renovated environment. POE data alone do not provide measurable evidence of the degree of change between those two occupancies (i.e., a previously occupied or pre-renovated space versus a post-renovated or newly constructed workplace environment). Building owners, facility managers, designers and architects need to have this comparative data to be able to fully address resource management and preservation (human, environmental, and financial), agency/organization/business strategic planning and management, and the modification and enhancement of best practices in design and construction [11].
To implement that, a pre-design occupancy evaluation (PDOE) must be conducted of the occupants while they are occupying their existing space that is to be replaced or renovated [12]. Findings from a comparison of the PDOE and POE study data allow researchers to identify statistical evidence of the influence of the designed environment on the occupants’ satisfaction, performance, and health by analysis of the before (formerly occupied environment) and after (newly designed occupied environment) datasets [13,14]. Without this analysis, findings from the POE study alone present IEQ factor scores as influences on occupants’ satisfaction, performance, and health without knowing with certainty if the findings substantiate statistically significant outcomes.
Unfortunately, a PDOE is seldom conducted for a variety of reasons, including compressed design/build schedules, costs that neither the building nor building/business owner/tenant is prepared to pay, or that the design team cannot afford. Also, ongoing cooperation and support from these stakeholders during the process is not guaranteed.
Broadly, research has indicated that employees’ perceptions about their workplace environment have been found to largely determine employees’ attitudes, and subsequently contribute to their productivity, longevity, mood, creativity, and drive, among other outcomes [15]. This study was conducted to investigate the impact of the design solution of the newly renovated space on occupants’ satisfaction, performance, and health as influenced by IEQ factors. This knowledge is useful to the broadened team of stakeholders, including the employer (i.e., client and/or institution), building owner, facility manager and human relations leadership; the design team, consisting of the architects, interior designers, space planners, lighting designers and others; and design and human behavior researchers and educators.
Acknowledging employees’ perceptions of the physical environment of the workplace on their satisfaction, performance and health and understanding the important role of IEQ factors on their perceptions are critical. This is because the physical environments in workplaces can enhance or hinder occupants’ satisfaction, performance and health [16]. Further, enhanced satisfaction, work performance, and health among employees can bring benefits to employers. Based on a dataset of around 50,000 occupants collected over a decade, overall satisfaction with the workspace was positively correlated with job satisfaction as well as perceived work performance [17]. Moreover, satisfaction with the workspace is strongly associated with occupants’ satisfaction with the amount of space, noise level, and visual privacy [17]. Similar to these findings, perceived work performance can be enhanced by increased satisfaction with temperature, noise level, and air quality [17]. Another study found that employees were likely to be dissatisfied with their workspace when they were dissatisfied with acoustic conditions, furnishings, and privacy [6], and that a quiet workspace was found to have a positive influence on employees’ perceptions of greater collaboration, reduced stress, and overall positive perceptions of the workplace environment [18].
Not only overall physical environments but also a specific IEQ factor can affect an employee’s satisfaction as associated with work performance. To be specific, a controlled study found that cognitive performance, satisfaction, and eyestrain improved in a setting with window treatments (e.g., shades and tinted window) compared to in a baseline condition (e.g., lacking daylight and view) among participants who worked in a living lab for 14 days [19]. A recent review also indicated that IEQ factors, especially lighting and daylighting, were closely associated with mental health indicators, such as concentration and stress [20]. Also, increased thermal satisfaction was positively correlated with productivity and the optimal productivity was achieved in “neutral” or “slightly cool” environments [21].
Employees’ perceptions of the workplace can also impact the employer in positive ways. The physical environments in workplaces tend to reflect corporate culture as the layouts and settings are part of the culture [16]. Therefore, workplace design plays a critical role in attracting, developing, and retaining employees [22]. Moreover, the workplace design positively affected three aspects of culture, especially equality, openness, and collectivity [23,24]. Another study found a significant and positive association between office layout features and organizational culture ratings, which mediate the relationship between the office layout features and job satisfaction [25,26]. In addition, physical environments in offices are associated with recruitment, retention, and productivity of the organization [27]. According to a longitudinal case study, workplace design was critical for developing organizational creativity and sharing knowledge among employees [24]. Overall, workplace satisfaction as tied to IEQ factors has been linked to enhanced work performance [15]. In addition, the design of the physical workplace has been found to influence workplace (i.e., corporate) policies and procedures relative to scheduling, officing protocols, and collaboration [28].
POE studies can provide valuable findings about both the building occupants’ satisfaction and perception and feedback for designers. However, as discussed above, a POE alone may not be enough for the design team or the client. After analyzing a dataset featuring 11,243 responses from 93 buildings, researchers recommended that the direct involvement of building professionals from the early design stages to POEs can help improve the overall indoor environment [15]. Instead of conducting only a POE, implementing both a PDOE and a POE can provide feedback from building occupants to be applied in the design of future spaces based on statistically significant findings.
Due to these advantages, the pre–post comparison analysis is becoming a more often used approach among researchers. For example, a recent study confirmed the positive impact of design solutions on IEQ, especially in electric lighting and furnishings, after comparing PDOE and POE results [12]. Another comparison study suggested that employees reported higher performance, health status, and satisfaction from the PDOE to the POE findings and that building energy consumption (per m2) and performance also improved [29]. In addition, a significant and diverse impact of physical spaces on organizational communication, interaction, and performance was found through the pre–post comparison study [30].
The evaluation of the workplace for the purpose of improving future workplace designs for the building owner and/or client can benefit from broadening the team to incorporate design research. By doing so, learning by the design team and the employer (corporate, human relations, and facilities management) is leveraged. This team approach has been shown to enhance the capabilities of the design team and boost the employer’s bottom line.
Therefore, this paper discusses the current findings about POEs in workplaces regarding building occupants’ satisfaction, performance, and health. The paper conducted PDOE and POE at a single site (before and after the renovation) to compare the results of occupants’ satisfaction with the built environment including IEQ factors. Finally, this paper discusses how the findings can be interpreted in terms of the previous literature.
1.1. Aims and Overview of the Study
This study was conducted with three primary aims in mind which are noted below, followed by a brief overview of the study.
1.1.1. Identify the Influence of the Physical Environment (IEQ and Other Factors) on Employees’ Perceptions (and Behaviors)
The overall corporate campus, the building group space employees occupied together, and their primary (personal) workspace were analyzed in terms of the influence IEQ factors on their satisfaction, work performance, and health. Other factors examined included the use of collaborative (i.e., shared) workspace. Understanding these influences helps identify appropriate design solutions and their subsequent influence on corporate culture, among other factors.
1.1.2. Provide the Client and Design Team Measurable Outcomes as a Foundation for Design Solution Modifications to Best Meet the Needs of the Employees, Thereby Supporting the Client’s Bottom Line
This study was viewed by the client as an opportunity for a “mid-course” correction as it occurred when approximately 15% of their 1200 corporate campus office employees had been moved into fully renovated space. Findings supplied information that fueled modifications to the space planning prototypes, circulation and flow parameters, accommodation of ergonomic and privacy needs, and other IEQ factors for the next major phase of the campus renovation. In the interim, it also identified necessary modifications to the design of the group’s upcoming renovated space because of focus group feedback and findings of the PDOE survey. Employee retention and recruitment are priorities for this engineering-centric company. Based on the statistical data combined with open-ended responses by the occupants, workplace design and corporate policies were influenced.
1.1.3. Contribute to the Body of Knowledge and Demonstrate the Advantages of the Combination of PDOE and POE, over a POE Alone
POE findings alone are subjective in nature, as they are not compared to/measured against the “before” conditions in terms of their influence on the occupant. What we want to know is how much the post-construction or post-renovation workplace influenced occupants’ satisfaction, performance, and health. A paired PDOE and POE form of investigation allows the comparison of data from two survey instruments and quantifies results by identifying measurable outcomes. Results provide greater assurance that future design decisions can reflect a higher degree of knowledge about occupants’ needs within the built environment. The results from the PDOE were reflected in the design changes determined by the client and design team, collaboratively. After renovation, POE results showed how the design changes reflected from PDOE results worked for the employees by comparing two datasets. For example, if a POE finds that daylighting received a satisfied score, what do we know about the occupants’ degree of satisfaction? Did that score exceed their perceptions about lighting from their previous space, was the change statistically significant? Without a PDOE, that information cannot be determined.
2. Materials and Methods
This study consisted of both a PDOE and POE of the employees of a business group. They were surveyed while they occupied their existing workplace and then again after they moved back into that former workplace, newly renovated. Information gleaned from the PDOE was shared among the team (researcher, client, and design team). Next, previously determined design solutions were modified based on the PDOE findings and the space was renovated accordingly. One year after employees moved into their renovated space, they were surveyed via a POE survey to determine their views of the new space. Both datasets were analyzed, and the findings were used for additional modifications and updating of future campus renovations.
2.1. Client
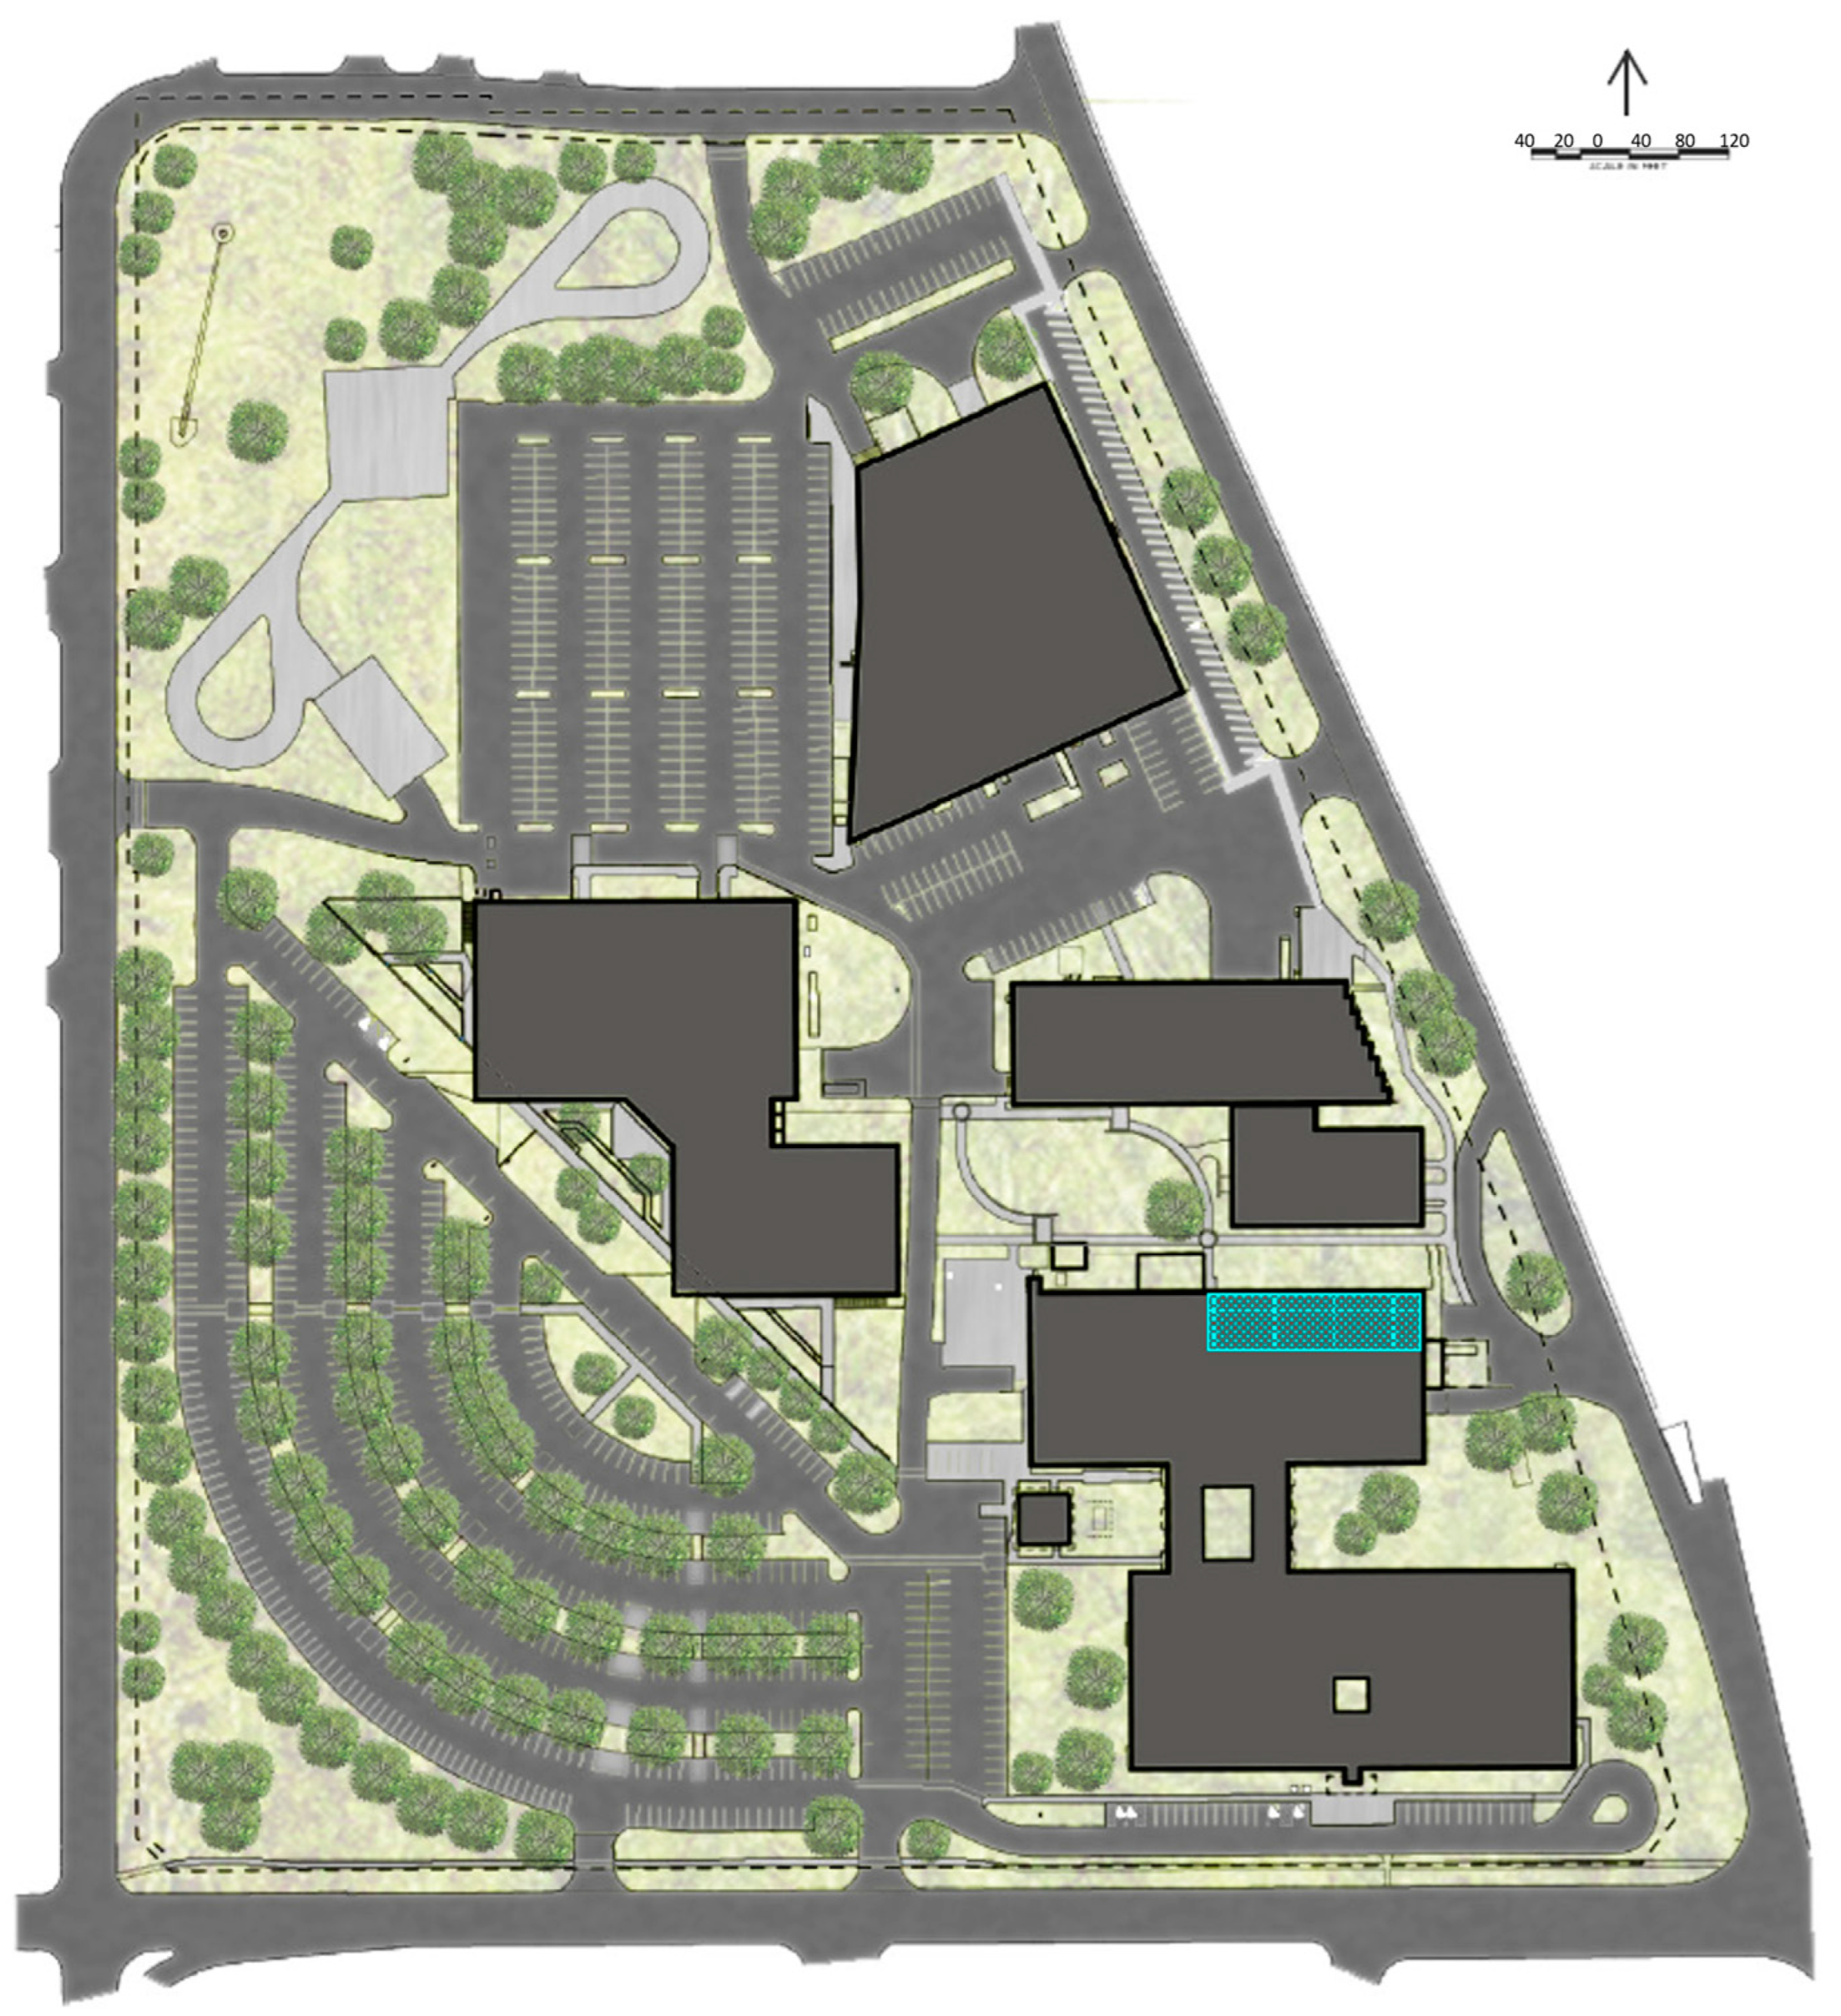
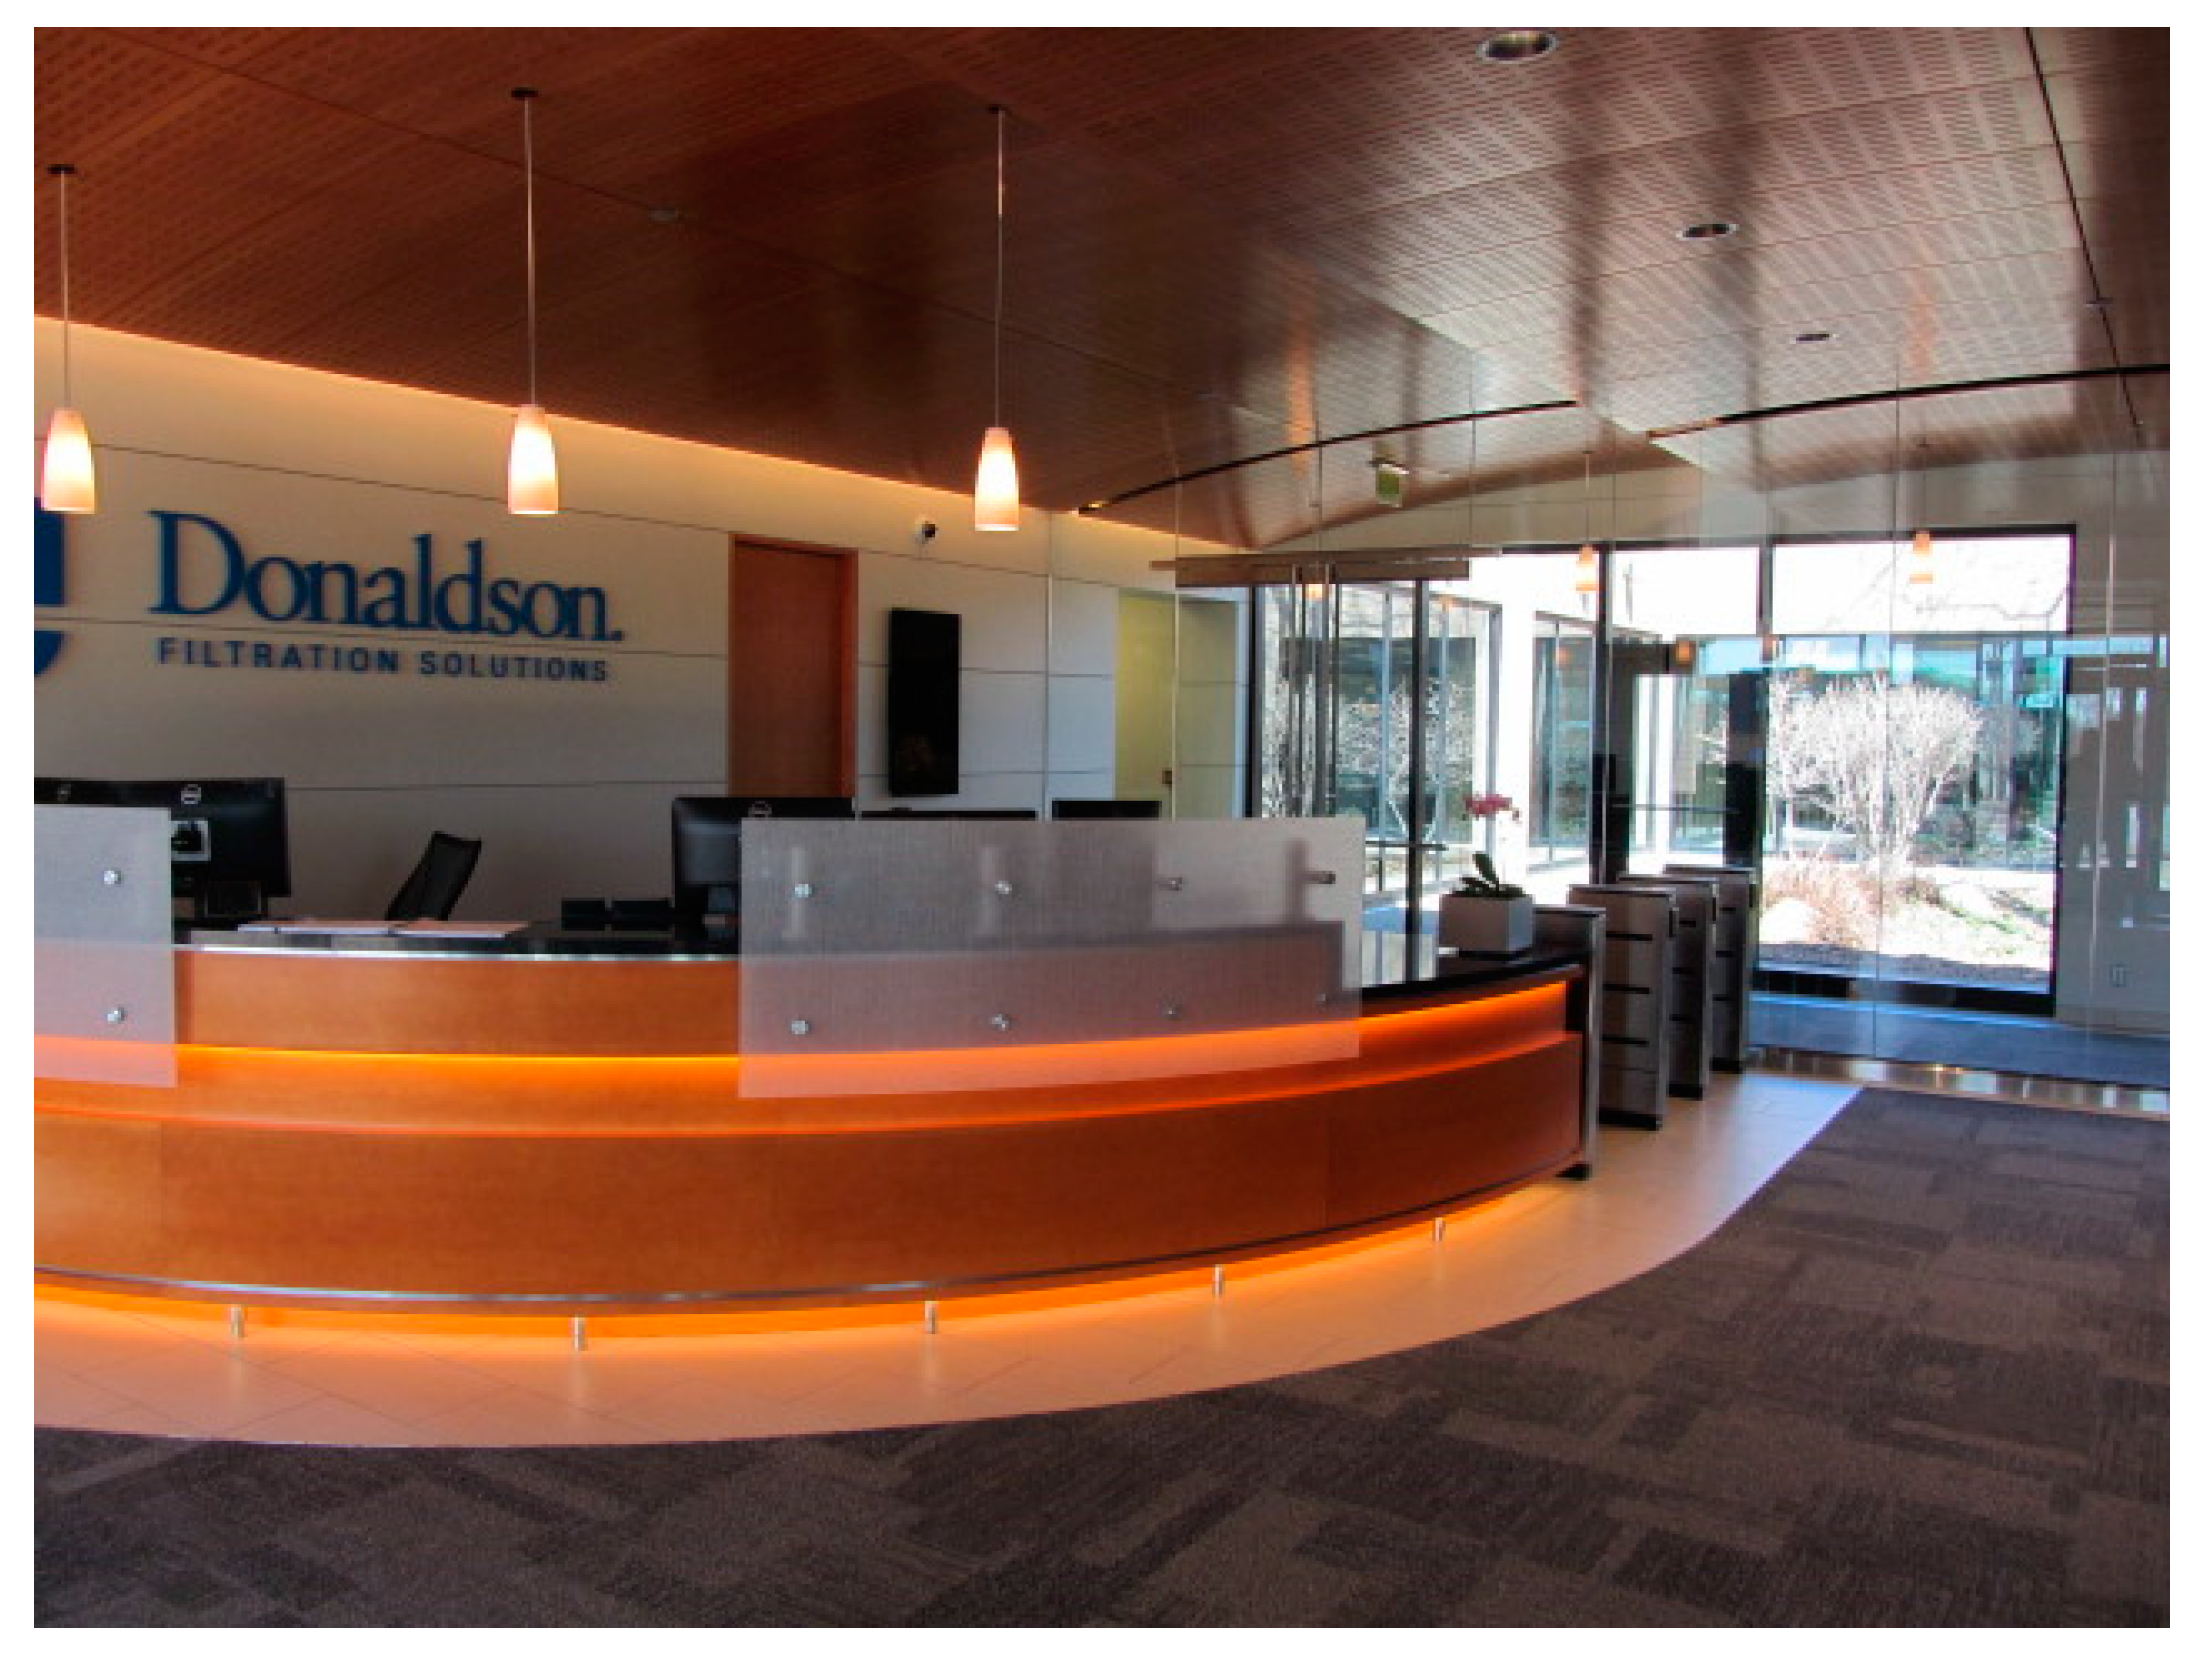
Donaldson Company (Donaldson) (Bloomington, MN, USA) was the client for this study. Founded in 1915, Donaldson is a global leader in the filtration industry with sales, manufacturing, and distribution locations around the world. Donaldson notes, “Every action we take must be driven by our three key values: integrity, respect and commitment”. Donaldson’s innovative technologies solve complex filtration challenges and enhance customers’ equipment. As a Fortune 1000 company, they hold 1800 active international patents and have employees in 44 countries. Their international corporate headquarters is in Bloomington, Minnesota, a suburb of Minneapolis. The campus is comprised of five facilities totaling 514,000 square feet (47,752 m2), including 177,000 (16,444 m2) of office space, as shown in Figure 1 below. Figure 2 shows the main reception area for guests coming to the campus. The campus was primarily constructed in the mid-1960s through the 1980s on 32 acres. Based on a master planning project begun in 2010, multiple extensive office space renovations have occurred.
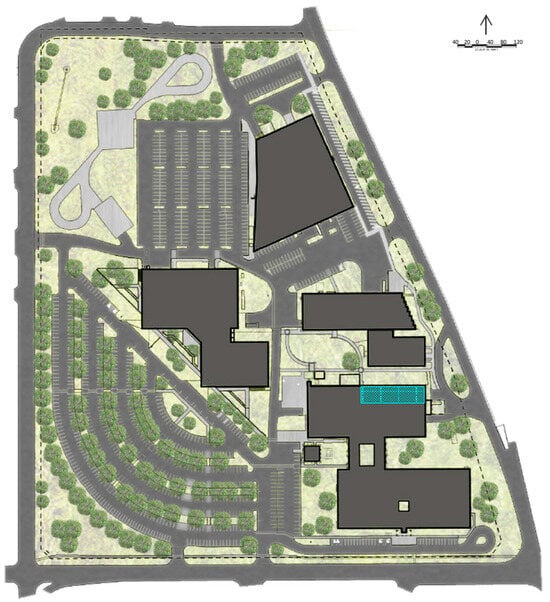
Figure 1.
Campus site plan (EA&EE space is highlighted) (Image courtesy of LHB, Inc. (Minneapolis, MN, USA)).

Figure 2.
Main reception area. (Image courtesy of Dana Wheelock Photography (Seattle, WA, USA) and LHB, Inc.)
2.2. Participants in the Process
The broad team involved in the process of this study consisted of the client, the researchers, the architectural firm, and the space planning firm. The client was represented by Bill Coldwell, Facility Development and Asset Manager, Donaldson. His work was supplemented by a focus group of workplace leaders who were employees within the group being studied. The research was conducted by Martin and Guerin Design Research, LLC. (MGDR) (Minneapolis, MN, USA). The design team was comprised of LHB Corporation (LHB), the architecture, engineering, interior design, and planning firm, and Amy Arnost Design, LLC. ((Minneapolis, MN, USA)) was responsible for space planning. The work progressed in an iterative process, resulting from the interaction of the four entities (client, researchers, architect, and space planner) from February 2018 to March 2020.
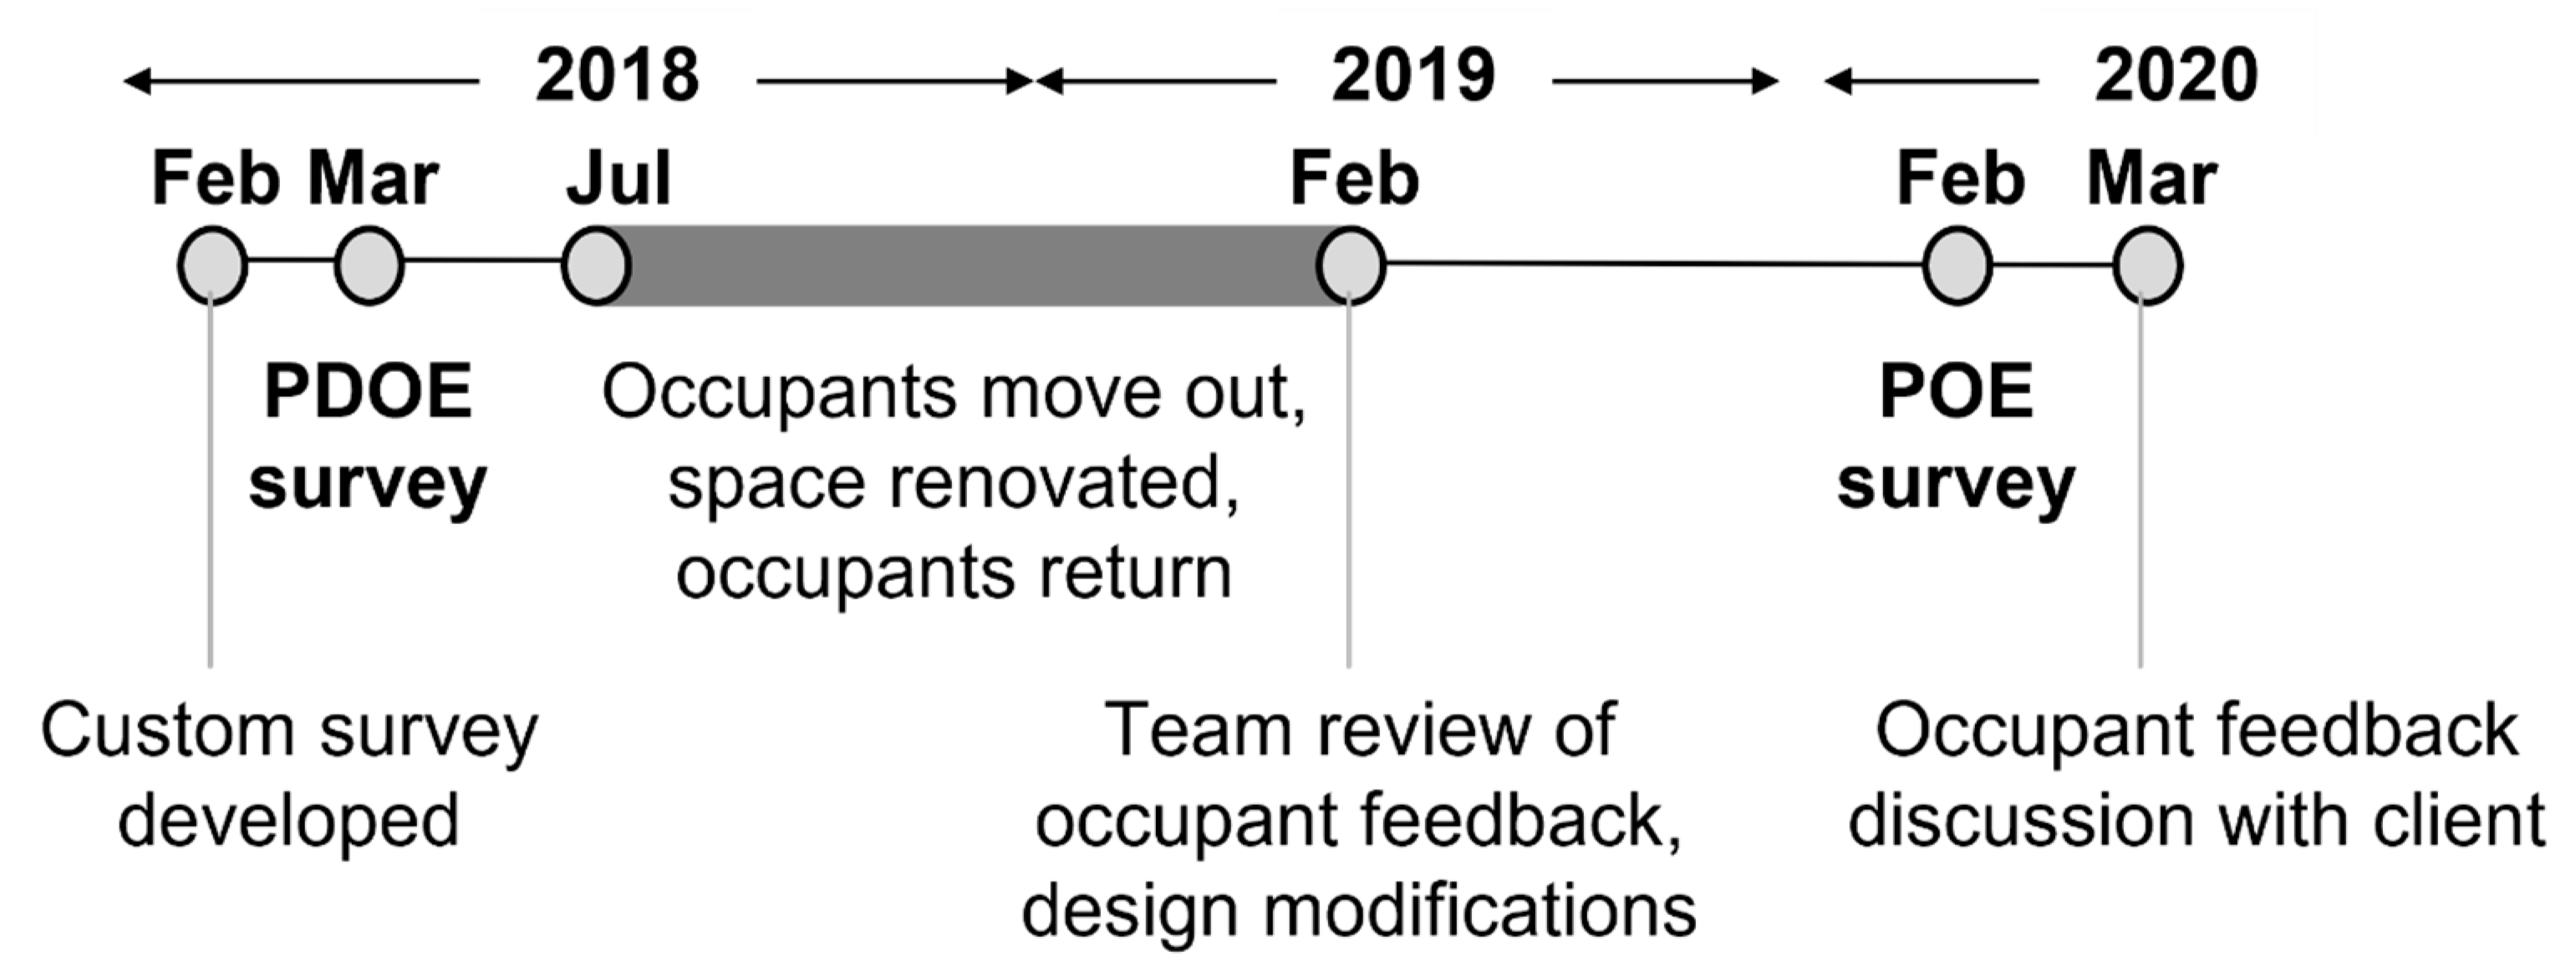
2.3. Study Timeline
Donaldson had begun a “Workplace of the Future” master planning exercise in 2015. In late 2017, the architect at LHB encouraged Donaldson to engage with a design researcher. Given the scope of the campus renovation project, it was determined that additional evidence related to the impact of the newly instituted design direction and details of the impact of the workspace on the employees was needed. At that point, knowledge regarding the impact of the new spaces on the employees was solely anecdotal. In early 2018, MGDR was contracted by Donaldson to begin a survey-based study of the Engine Air and Exhaust & Emissions Groups’ (EA&EE) employees who were in their existing, unrenovated space. This study focuses on findings gleaned from the PDOE and POE surveys of the EA&EE employees.
First, a custom survey was developed by MGDR with key input from the client. It was disseminated to the EA&EE employees. The design team and client were anxious to glean as much information as they could and believed that the PDOE findings from the EA&EE would be helpful as time was limited before the remaining 85% of the campus redesign planning would sequentially begin. To supplement those findings, representatives from the EA&EE Group’s leadership team participated in focus groups to provide feedback (July 2018).
Along the way, discussions among members of the broadened team (client, researchers, and design team) occurred in person and virtually (video or phone). Discussions focused on feedback that was provided by employees informally (i.e., in the hallways), evaluation of responses to open-ended questions in the PDOE surveys, and analysis of their alignment with statistical findings. Collectively, these findings informed the design of EA&EE’s renovated space (occupied in February 2019). Subsequently, the EA&EE PDOE and POE data would be used to inform the design of the renovations for the remainder of the corporate campus, with a focus on design standards and best practices. Findings and direction were discussed after the comparison PDOE and POE analysis was complete (March 2020). This study timeline is shown in Figure 3, below.
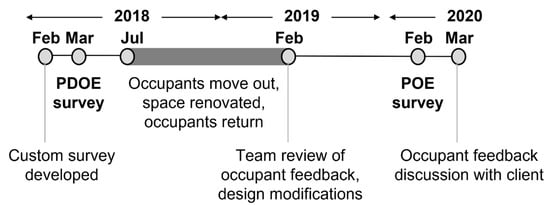
Figure 3.
Study timeline.
2.4. Custom Survey Instrument
Based on discussions with the client, MGDR developed a custom survey instrument that examined many variables to determine the influence of the built environment and occupants’ demographics on their perceptions. Employees rated their satisfaction, work performance, health, as well as their satisfaction and importance of the IEQ criteria. The process began in early February 2018. The client conducted a final review of the instrument as well as online dissemination protocols and duration details. Survey content examined occupants’ perceptions of the following variables:
- Employee’s Primary Workspace IEQ Criteria and Importance: The 26 IEQ criteria were categorized into 13 “overall” IEQ factors (some with “attributes” or sub-categories within them), including acoustic quality, appearance, cleaning and maintenance, daylighting, electric lighting, furnishings, indoor air quality (IAQ), personal control, personalization, privacy, technology, thermal conditions, and view conditions. The survey further included detailed question modules regarding satisfaction with acoustic privacy, visual privacy, lighting conditions, and ergonomics.
Also, the survey instrument examined demographic characteristics including gender, years worked at Donaldson (i.e., tenure), percentage of time per week employees work in their primary workspace, and space relationship to a window. The questions used a 7-point Likert scale, indicating 1 for very dissatisfied/hinders and 7 for very satisfied/enhances. The mean responses were interpreted as follows:
- 1.00–3.50 dissatisfied (or hindered)
- 3.51–4.50 neither dissatisfied (or hindered) nor satisfied (or enhanced)
- 4.51–7.00 satisfied (or enhanced)
The Likert scale questions were complemented by the inclusion of open-ended questions, responses from which provided greater specificity as to the “why”, “what”, or “when” of the statistical information from analysis of data resulting from the Likert scale questions. Occupants were presented with four opportunities to provide additional information about their primary workspace, ergonomic conditions, daylighting and electric lighting, and acoustic or visual privacy. The impetus for gleaning this information was to enhance the stakeholders’ understanding and provide specificity as to the possible causes underlying the closed-ended, Likert scale responses.
The online survey was pre-tested by eight (8) individuals who worked in similar corporate settings, though outside Donaldson, to confirm that the language used was easily comprehensible and to confirm the time (15–20 min) needed for completion. The survey instrument was used for both PDOE and POE surveys. The PDOE was conducted from late March to mid-April 2018 (16 days). Self-administrated online surveys were sent to employees who worked in Donaldson’s EA&EE Group through invitation emails that included a link to the survey, using Qualtrics. PDOE data were collected (PDOE n = 64; a response rate of over 84%) and were analyzed in April 2018.
Between July 2018 and February 2019, EA&EE occupants worked in another unrenovated workplace location on campus. They returned to their newly renovated space in February 2019. The POE was conducted in February 2020 (18 days), one year after the EA&EE employees had occupied the space. The same protocols noted above for the PDOE were repeated for the POE. POE data were collected (n = 56; a 77% response rate) and were analyzed in March 2020. The months between the two surveys resulted in a loss of three (3) of Donaldson’s employees from the EA&EE group.
For both PDOE and POE, the demographic characteristics remained similar (see Table 1). To be specific, the majority of participants were males (PDOE = 90.2%, POE = 87.0%), over 41 years old (PDOE = 60.6%, POE = 54.8%), had worked at Donaldson for more than 11 years (PDOE = 54.5%, POE = 51.9%), and worked more than 40 h per week (PDOE = 78.7%, POE = 76.4%). In terms of workspace types, there were significant differences between the existing space and the renovated one. Workstations with low partitions (PDOE = 1.6%, POE = 78.6%) versus workstations with high partitions (PDOE = 78.1%, POE = 0%) represented a reversal in quantities of each.

Table 1.
Employees’ demographic information (PDOE and POE).
2.5. Design Modifications Made to EA&EE by the Design Team Resulting from the PDOE and POE
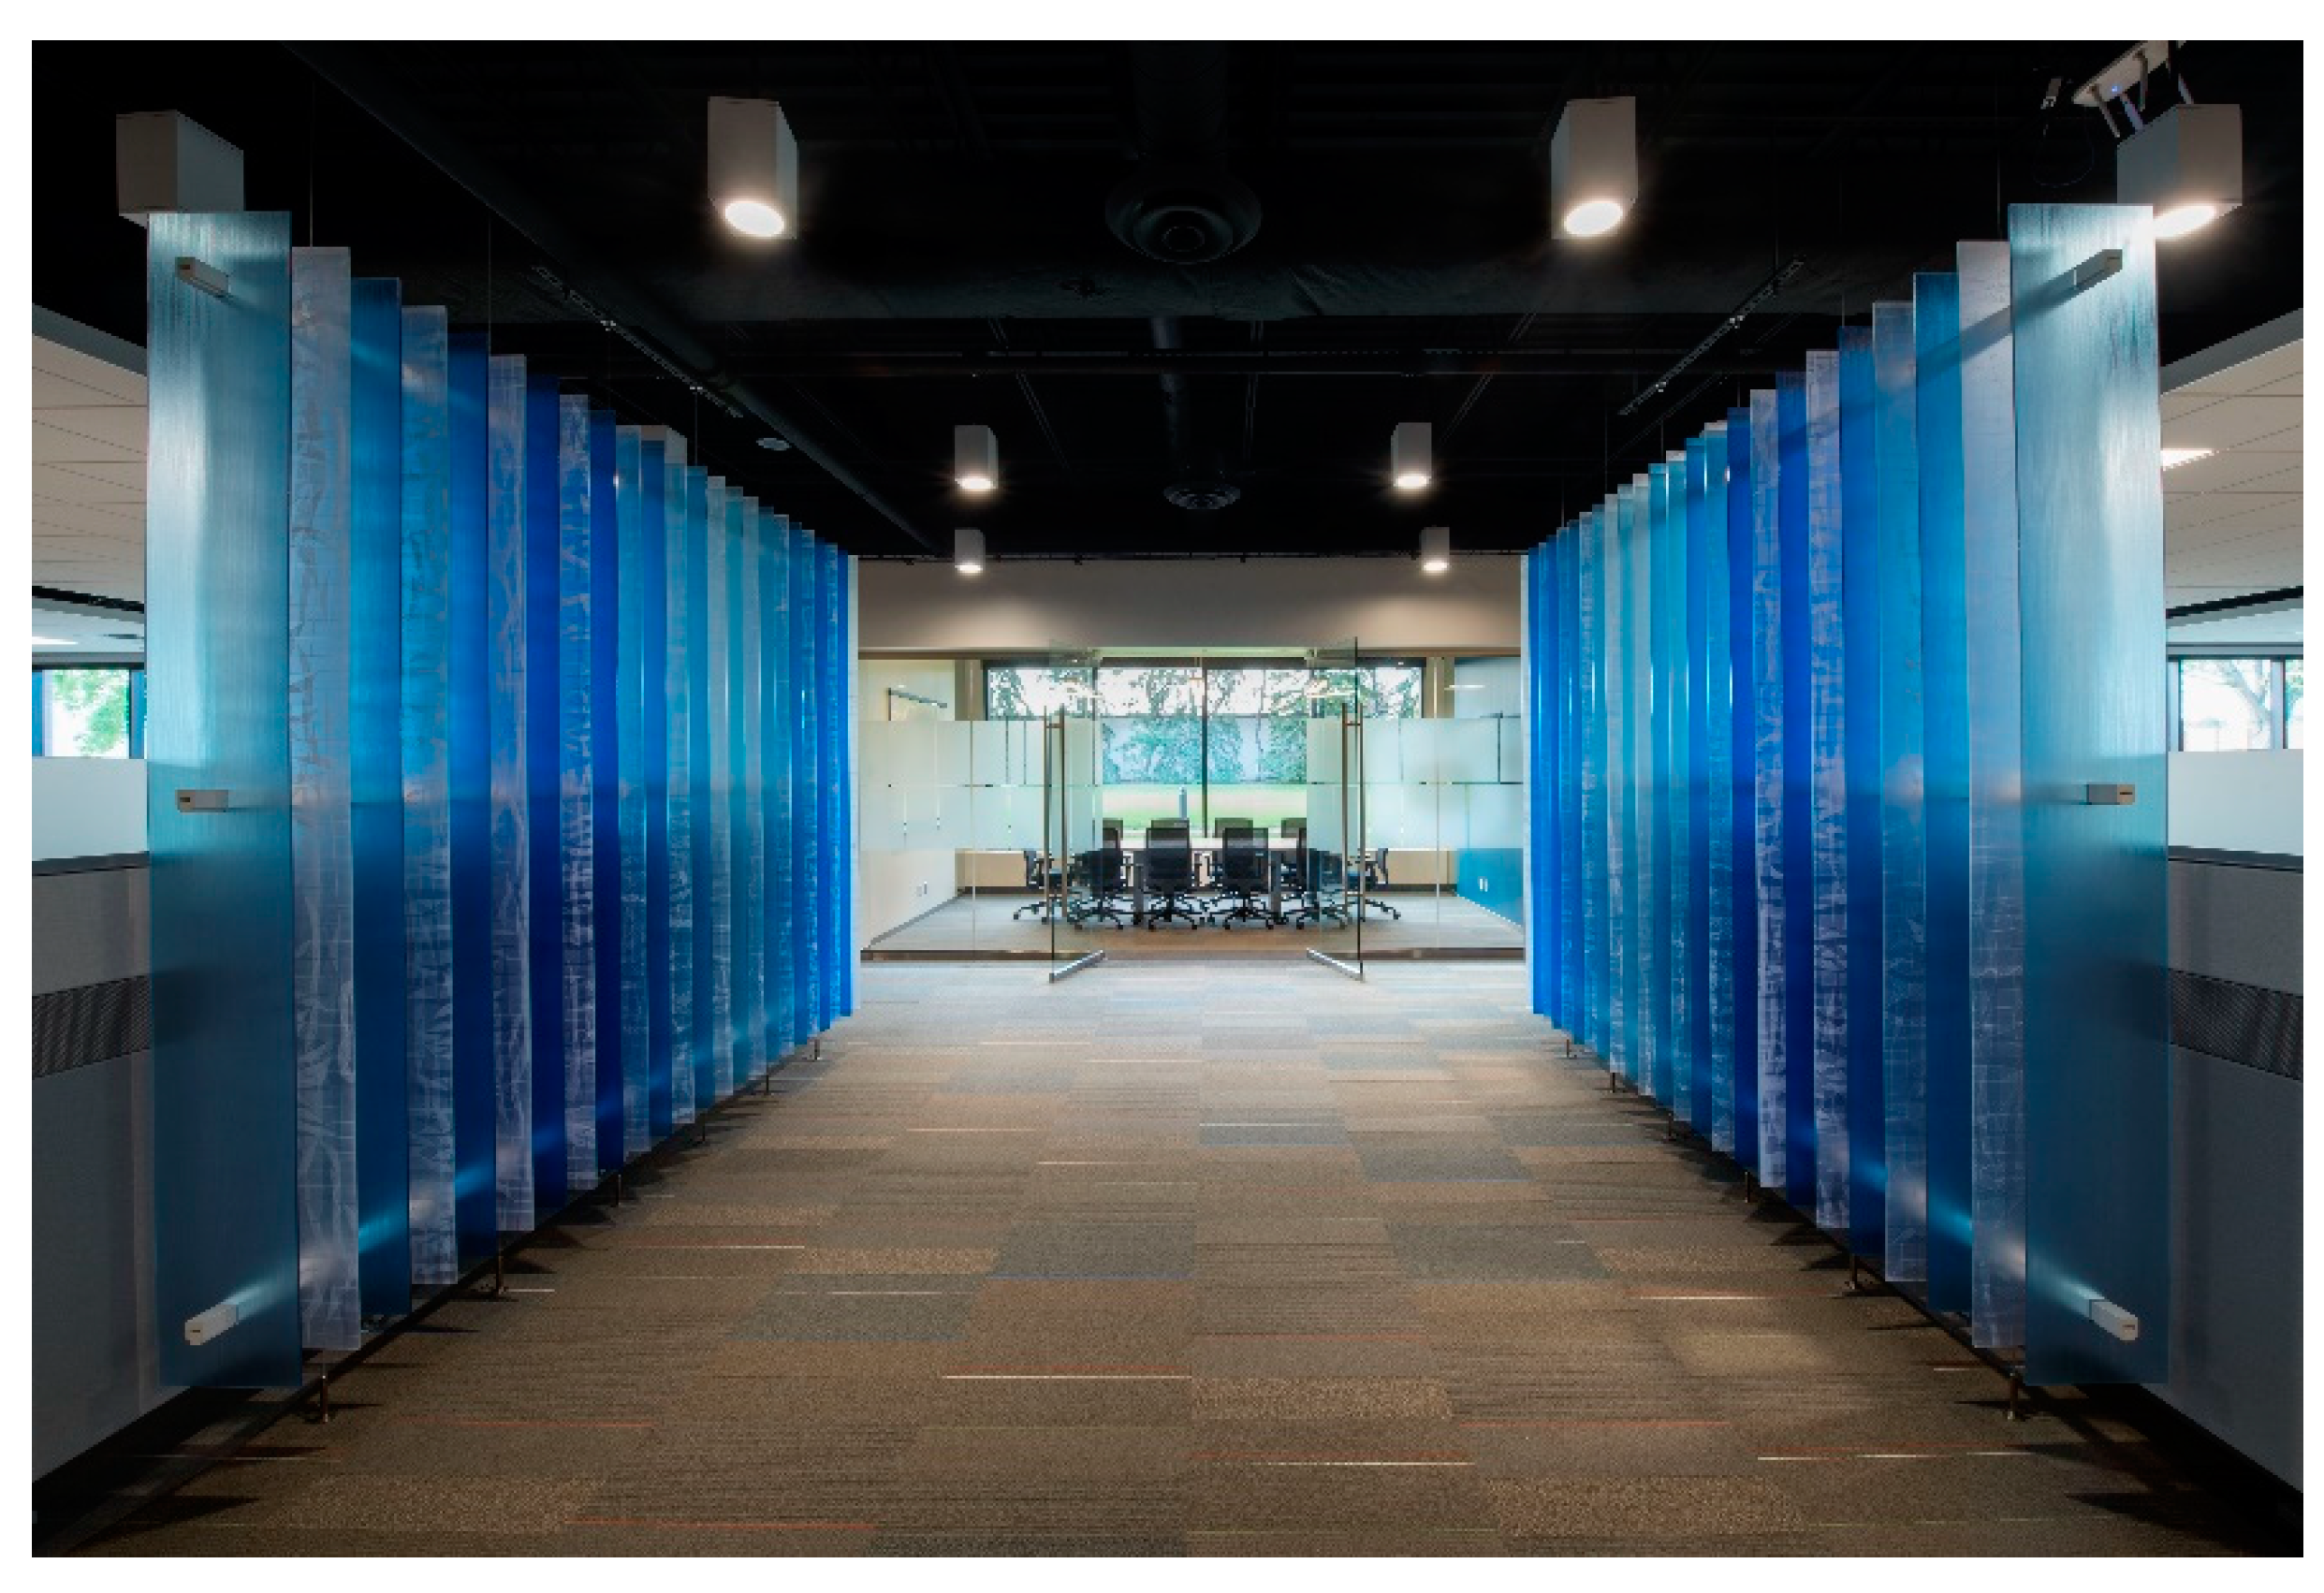
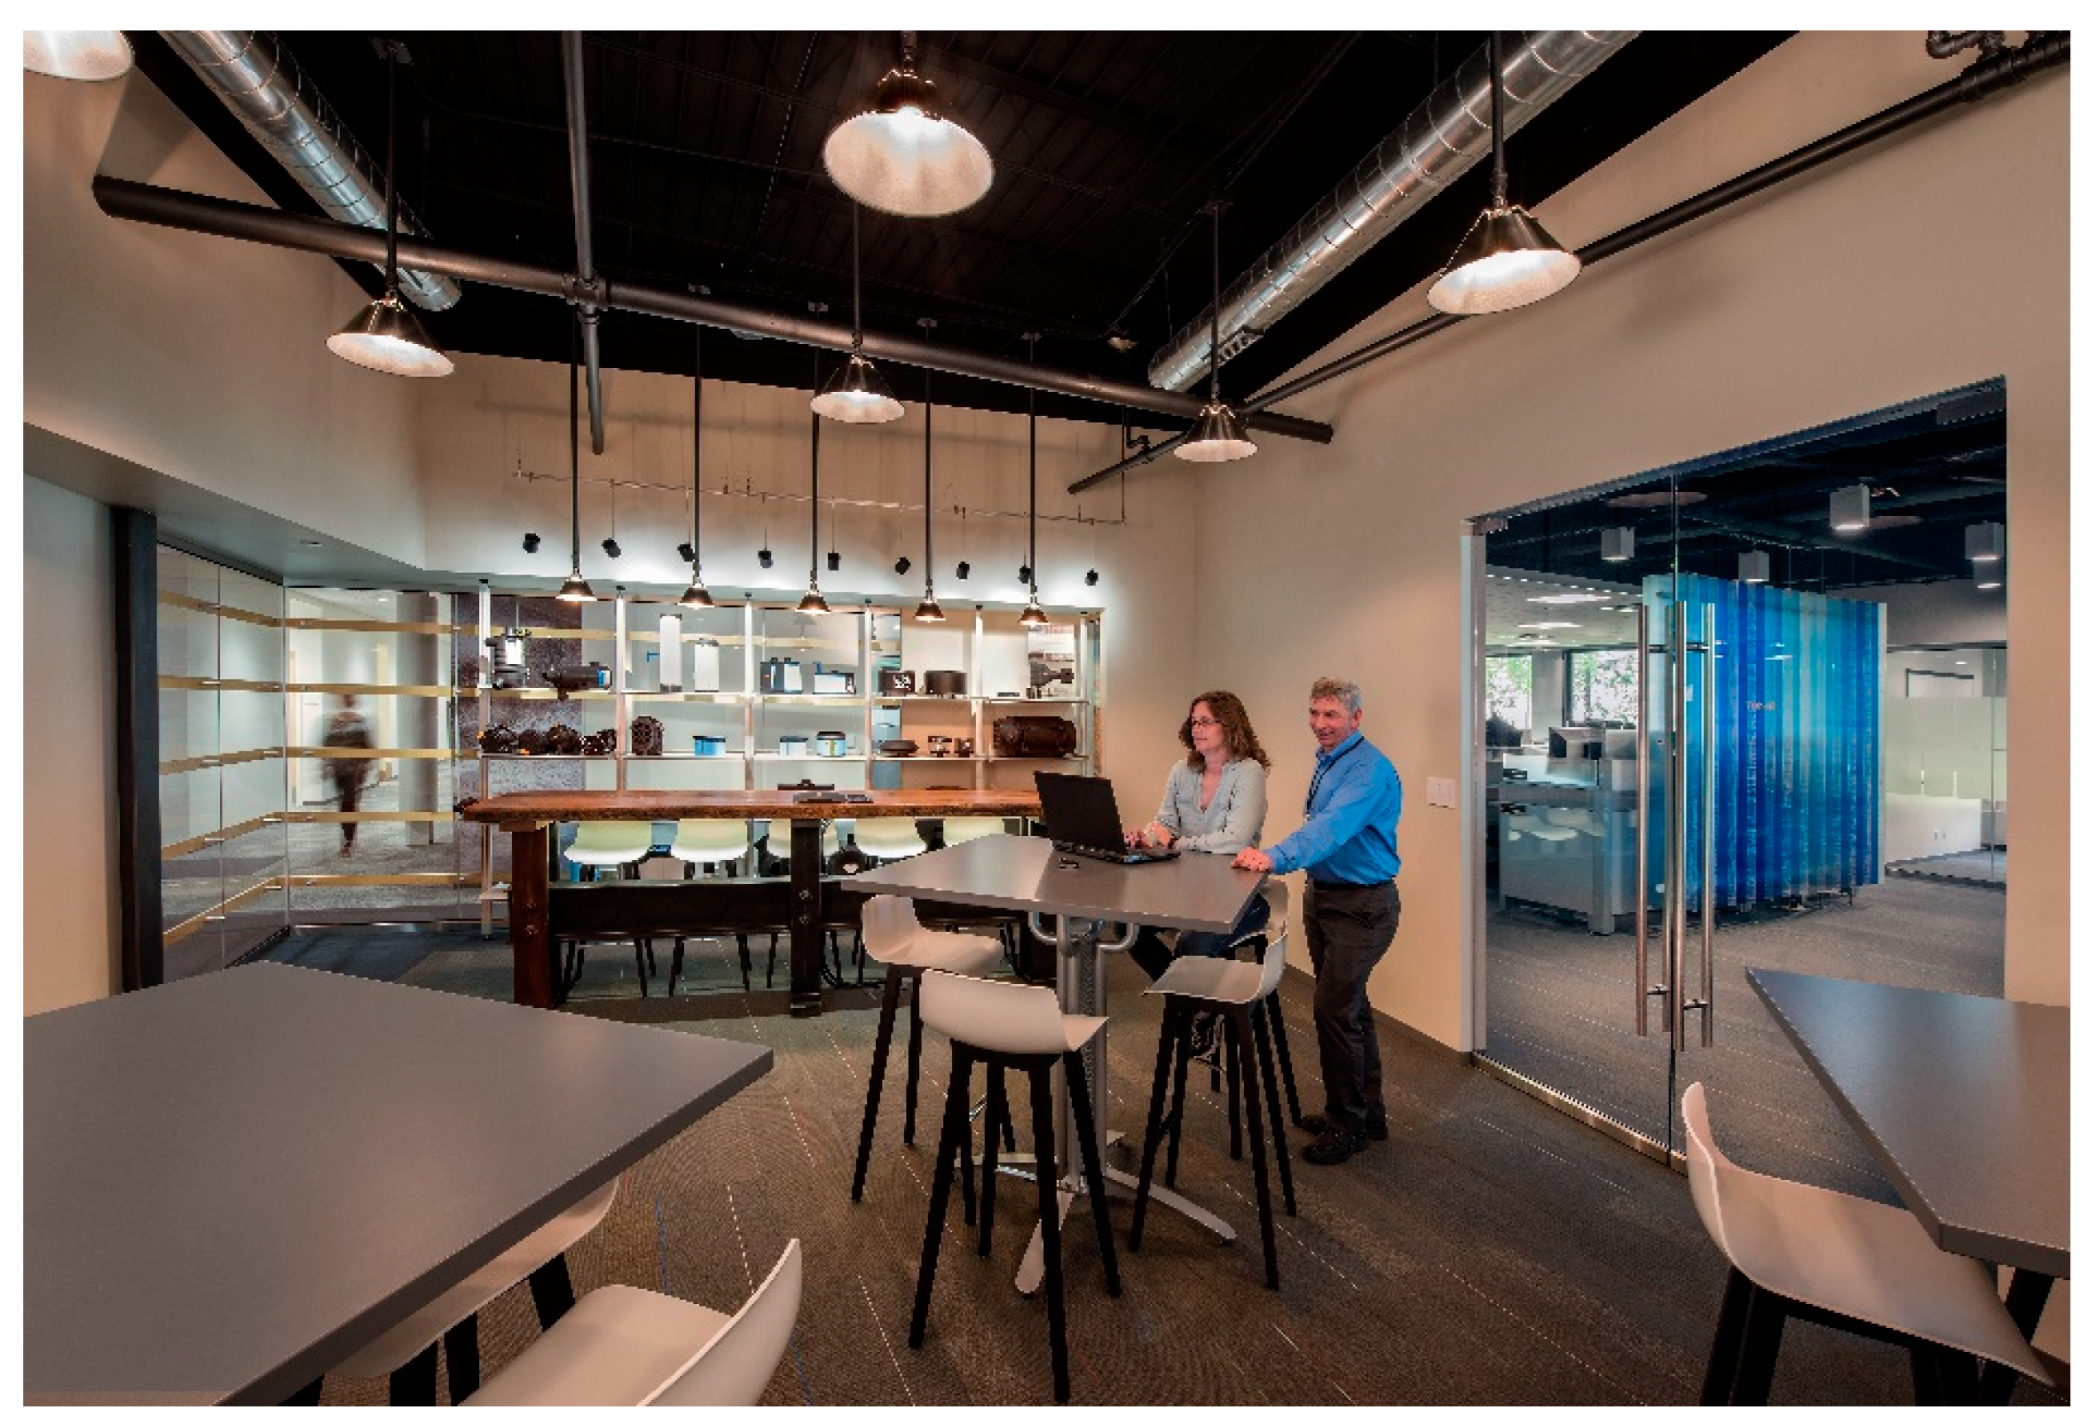
Several significant changes were made to the initial design solutions regarding the building, space planning, and workspace prototypes that had been used to design other business groups’ spaces up to that point. The amount of daylight and exterior views were provided by increasing the number of windows added into the existing structure; previously, there were fewer windows and with the use of the tall workstation partitions, what little view and light that existed could be seen by fewer employees. Electric lighting controls were implemented to address the level of brightness, glare, and visual disruption; previously, lighting was on or off without the ability to make adjustments. In terms of space planning, informal socialization/collaborative spaces were reduced or eliminated within the open office area to enhance employees’ visual and acoustic privacy and boost their ability to focus; previously, informal socialization/collaborative spaces had been intermingled with primary workspaces, causing unwanted distraction and interruptions. Instead, perimeter huddle rooms and right-sized, enclosed conference rooms were provided for collaborative activities (see Figure 4 and Figure 5, below).
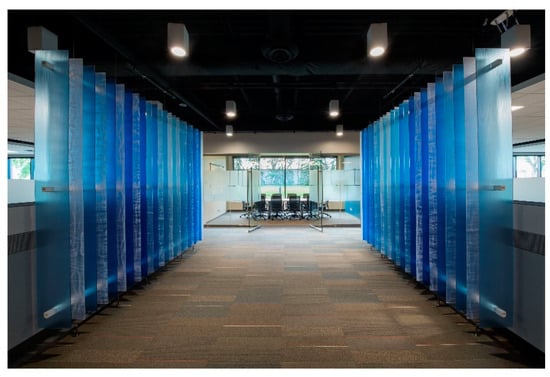
Figure 4.
Enclosed conference room. (Image courtesy of Dana Wheelock Photography and LHB, Inc.)

Figure 5.
Innovation lab. (Image courtesy of Dana Wheelock Photography and LHB, Inc.)
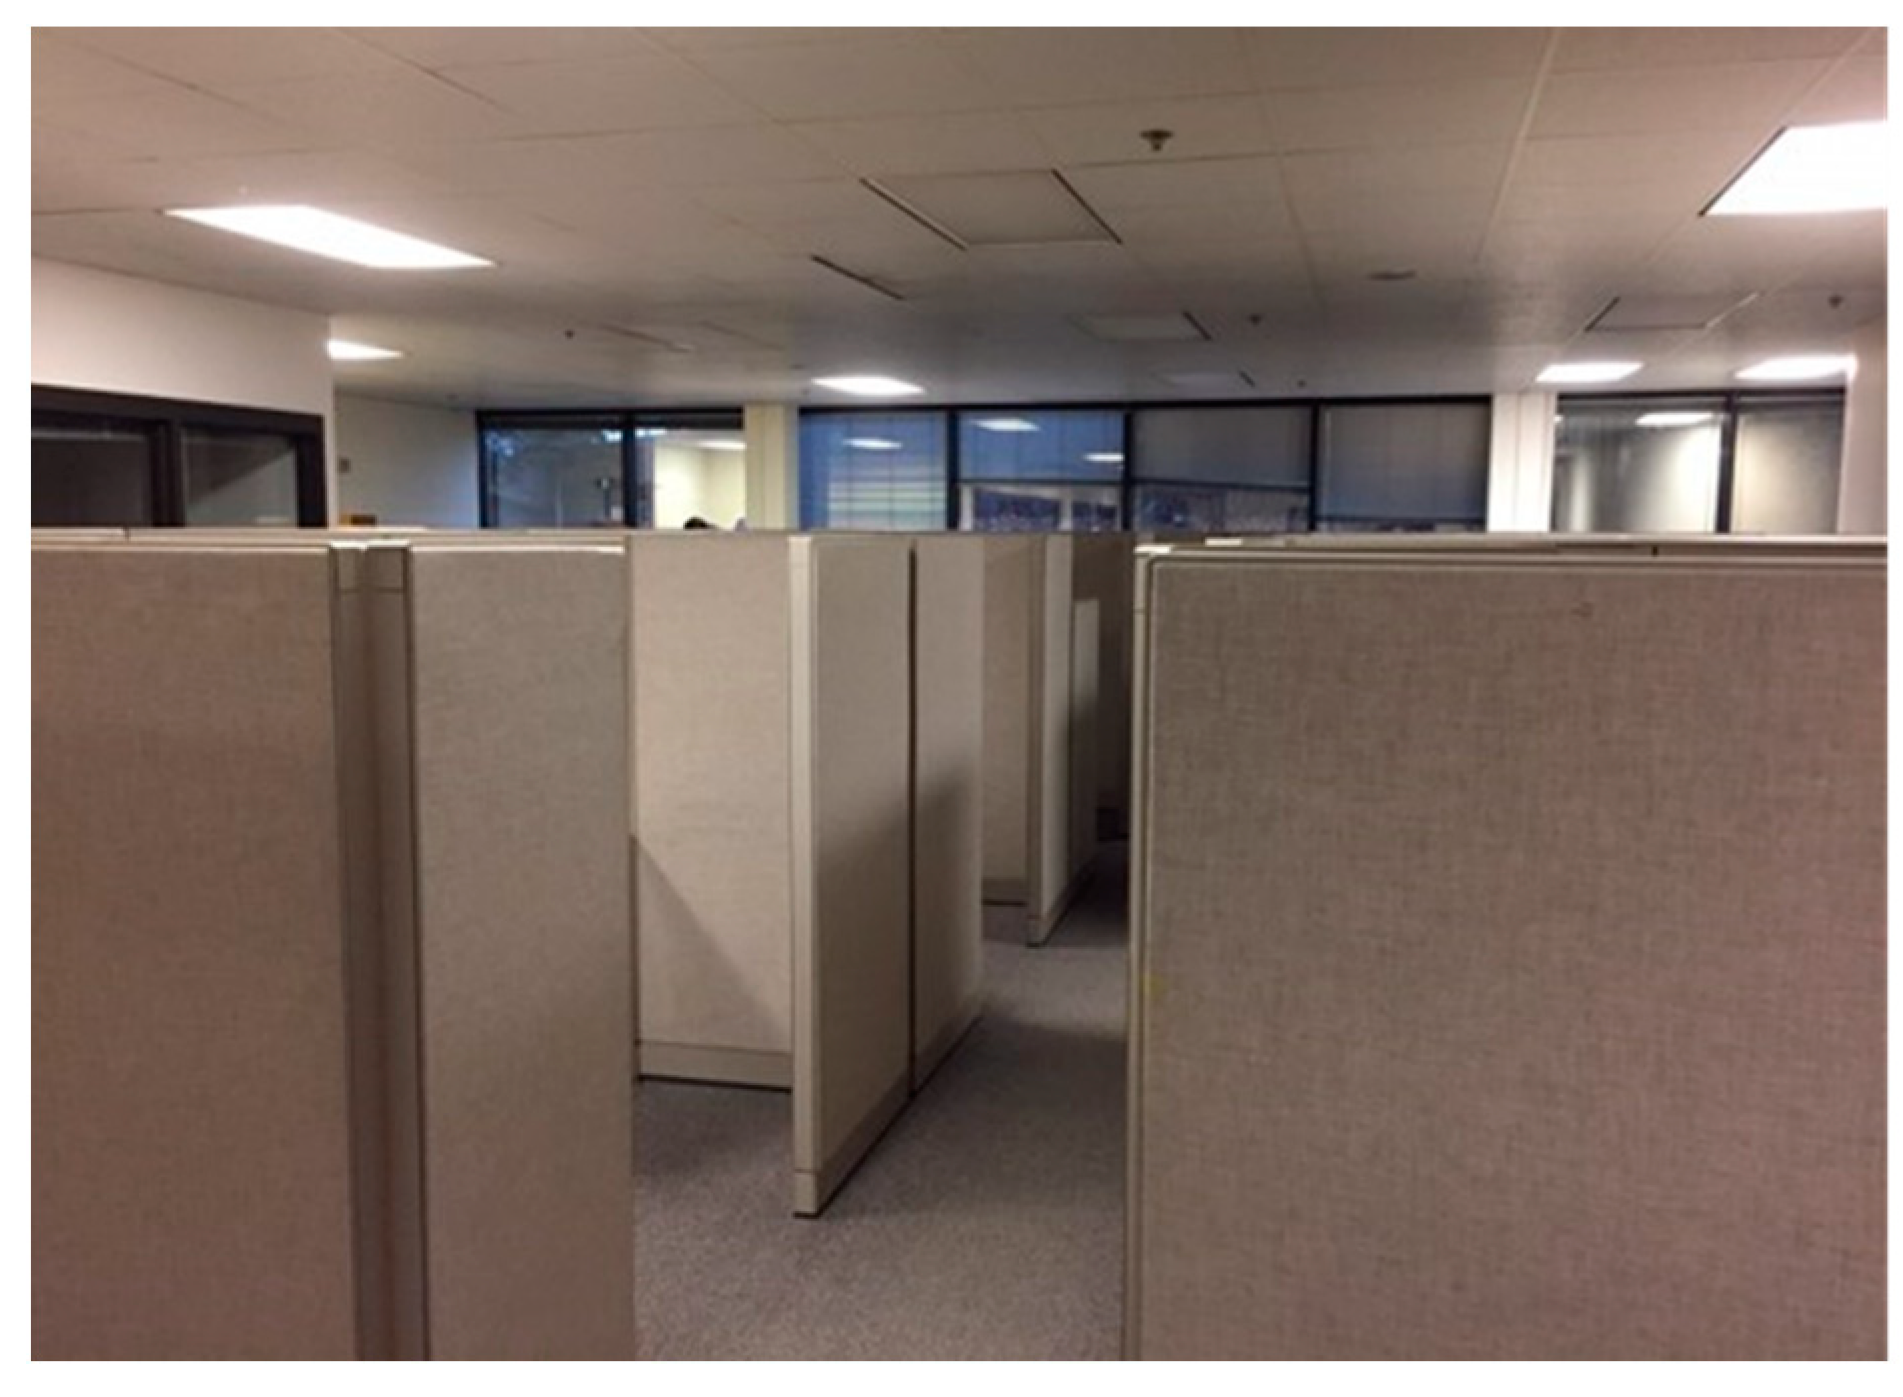
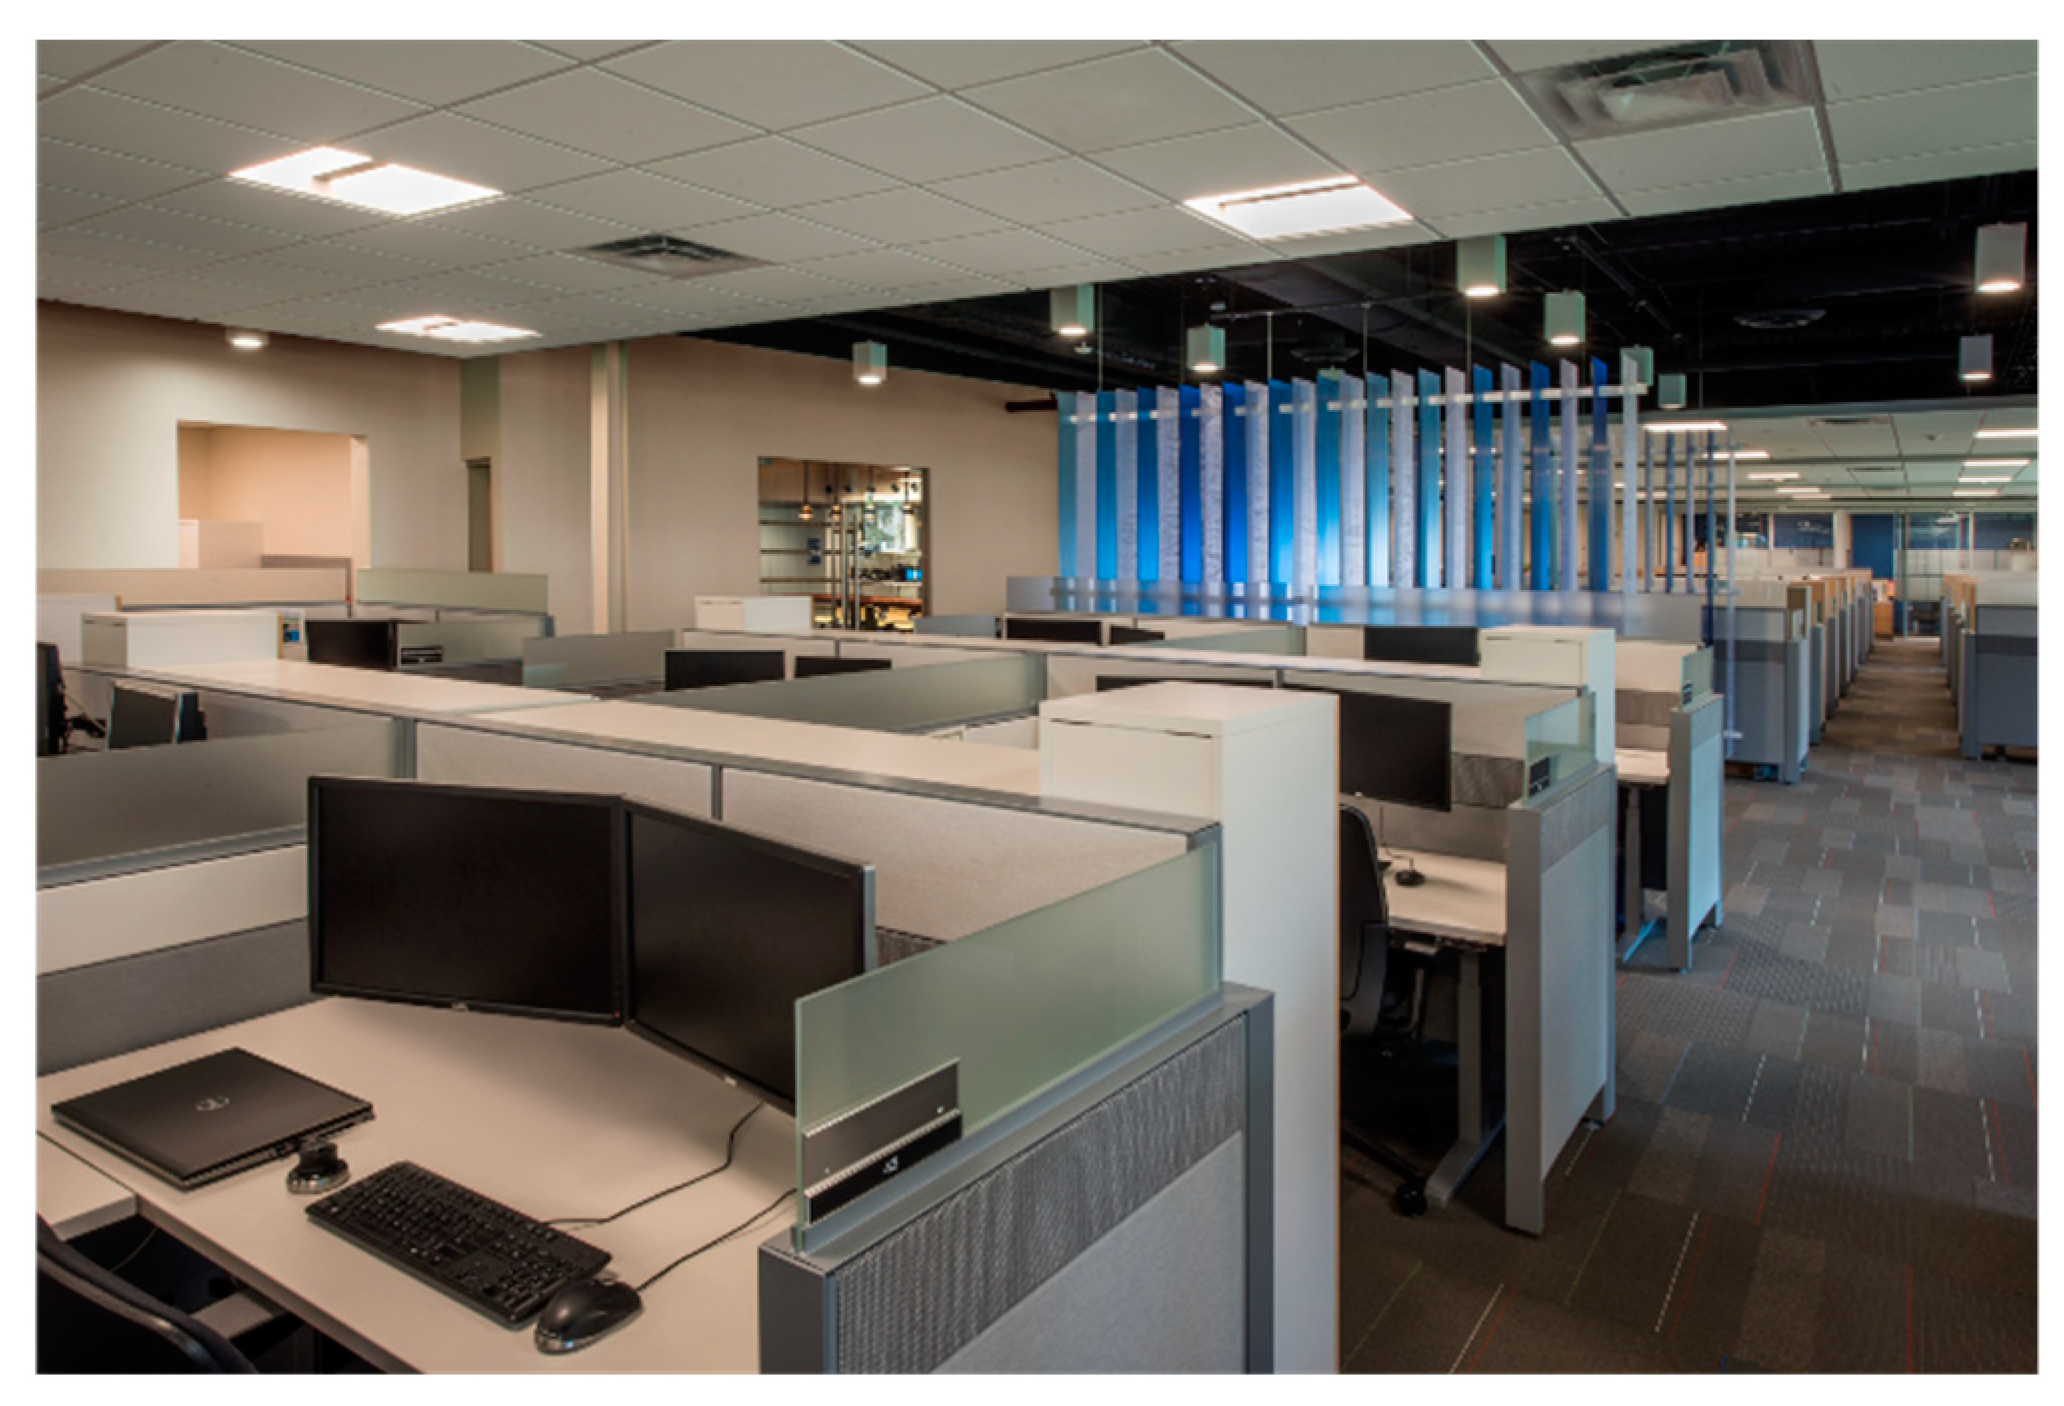
Primary workspace design enhanced privacy by elevating a portion of the workstation partitions, though did not replicate the tall partitions that had been used throughout prior to the redesign, which were perceived as isolating, though more private. The inclusion of a few taller partitions and a storage closet on the aisle end of the workstations helped limit visual distractions that had been identified by employees after moving from the tall partitions used previously. The depth of the primary worksurface was increased to accommodate multiple monitors without neck strain and allowed more legroom beneath the worksurface. Figure 6 presents the PDOE (before renovation) and Figure 7 presents the POE (after renovation) images and specific, related findings are discussed below in the Results.
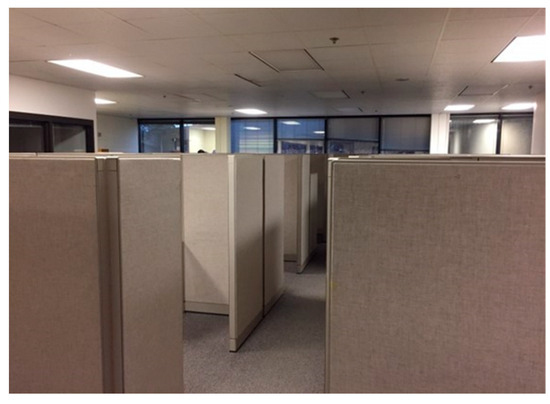
Figure 6.
Pre-renovation (PDOE). (Image courtesy Donaldson Company and LHB, Inc.)

Figure 7.
Post-renovation (POE). (Image courtesy of Dana Wheelock Photography and LHB, Inc.)
2.6. Data Analysis
The data were further analyzed to compare employees’ responses about the built environments by using SPSS 25. To compare employees’ satisfaction with the built environments, t-tests were used. In addition, Spearman correlation was used to demonstrate the relationship between IEQ factor satisfaction and IEQ factor importance. In some cases, only descriptive statistics (i.e., means, standard deviations, and frequencies) were appropriate. In all cases, when discussing the empirical findings, only those that are statistically significant are reported. All open-ended responses were analyzed via content analysis and organized by theme. Employees’ responses were reviewed in context with the statistics and in combination helped inform the design solution for the EA&EE occupants’ renovated space. This information is reported in Appendix A.
3. Results
3.1. Employees’ Primary Workspace IEQ Criteria and Importance
Employees responded to questions concerning their satisfaction with IEQ categories (e.g., overall thermal conditions, overall indoor air quality, etc.) related to their primary workspace (e.g., private office, workstation, or other primary workspace). Table 2 presents findings from both the EA&EE PDOE and the POE. The table is organized by the POE’s highest to lowest means.
Table 2.
Employees’ differences in primary workspace IEQ satisfaction (PDOE and POE).
PDOE results indicated significant changes in satisfaction scores between the PDOE and POE surveys. Based on the interpretation rule explained in the Section 2.4, scores indicated satisfied (PDOE = 3; POE = 17; M ≥ 4.51), neither satisfied nor dissatisfied (PDOE = 14; POE = 5; M = 4.5–3.51), and dissatisfied (PDOE = 9; POE = 4; M ≤ 3.5) resulted from employees’ ranking. The degree and direction of changes in employees’ scores were also examined for a better understanding of their perceptions of the IEQ criteria and their influence on satisfaction.
Additional results indicated that of the 26 IEQ criteria, the EA&EE employees were more satisfied with 22 of the IEQ criteria after the renovation (POE) than before (PDOE). Exceptions (4) included the following: ability to hear desired sounds, overall acoustic quality, overall privacy (sound and visual), and ability to limit undesired sounds (see Table 2). The statistically biggest improvements in IEQ satisfaction were overall appearance (aesthetics) of the space (t = 11.46, p < 0.001) and overall appearance (aesthetics) of the furnishings (t = 10.27, p < 0.001), fresh air flow (t = 7.46, p < 0.001), and overall electric lighting conditions (t = 7.43, p < 0.001). On the other hand, the overall privacy (sound and visual) satisfaction (t = 2.57, p < 0.01) score declined significantly from the PDOE to POE.
Interestingly, perceptions at the time of the PDOE indicated that the less the employees thought that overall appearance was an important IEQ, the more they were satisfied with the IEQ (r = −0.40, p < 0.01) (see Table 3). Also, employees were more satisfied with the thermal conditions when they thought that IEQ criteria was less important, after the renovation (PDOE: r = −0.27, p < 0.05). On the other hand, when employees were in their existing workspace, prior to the renovation, they were more satisfied with thermal conditions as the importance was higher (POE: r = 0.38, p < 0.01). This could be reflecting how employees’ attention was drawn to factors that were viewed most negatively; the more negative, the greater the degree of importance assigned to the factor (i.e., “wanting what you cannot have”). Also, an IEQ criteria that was assigned a lower satisfaction score by employees got more attention and was therefore deemed more important, i.e., the overall privacy score from the POE (M = 3.25) These suppositions are supported by the responses to the open-ended questions relative to EA&EE employees’ satisfaction scores about their primary workspace’s IEQ criteria, as indicated in Appendix A.
Table 3.
Correlation between IEQ satisfaction and importance (PDOE and POE).
3.2. Workspace Type and Privacy
The relationship between the changes in workspace type (as shown in Table 4) represents one of the most significant design and space planning changes reflected in the PDOE and POE survey data. Findings from the PDOE indicated that there was a statistical difference in satisfaction with their primary workspace and perceived work performance between employees in either enclosed offices or workstations. However, as demonstrated in the POE, employees working in enclosed offices had statistically higher satisfaction with their primary workspace (t = 4.28, p < 0.001) and perceived work performance (t = 4.76, p < 0.001) than employees in workstations (see Table 4).
Table 4.
Association between workspace type and satisfaction (PDOE and POE).
Regarding acoustic and visual privacy, the PDOE findings indicated that enclosed office employees had slightly higher satisfaction than workstation employees, except for their ability to limit visual distraction. These differences were not statistically significant, except for the employee’s ability to have a one-on-one conversation (t = 2.90, p < 0.05) and the noise generated by talking (t = 2.37, p < 0.05). Similarly, the POE findings indicated that enclosed office employees were more satisfied with acoustic and visual privacy than workstation employees. Among the privacy criteria, statistically significant differences were found in noise generated by machines (t = 3.34, p < 0.01), talking (t = 3.00, p < 0.01), amount of visual privacy (t = 2.97, p < 0.01), and ability to limit visual distraction (t = 2.10, p < 0.05).
3.3. Ergonomics
Employees responded to questions regarding their level of satisfaction with ergonomics in their primary workspace. The PDOE results indicated that employees were satisfied (M = 4.56 to M = 5.22) with most of the ergonomics of their primary workspace relative to their seated position and leg clearance; a place for work items, including a computer, keyboard, and mouse; and the absence of visible glare on the monitor(s) or documents. However, employees were neither dissatisfied nor satisfied (M = 4.47) with chair comfort, ease of adjustment, and back support; they were dissatisfied (M = 2.98) with the ability to adjust the height of their worksurface. It should be noted that nearly all standard deviation scores (SD = 1.61–2.15) from the PDOE indicated that there was a larger variation in employees’ satisfaction regarding primary workstation ergonomics as compared to other measures, indicating a moderate level of disagreement. Only employees’ responses about having a place for work items (SD = 1.35) showed greater similarity in rating satisfaction.
In contrast, the POE results indicated a much more positive response; employees were satisfied (M = 5.73 to M = 6.68) with all ergonomic attributes of their primary workspace with scores in the middle to top end of the satisfied range. Furthermore, there was similarity in how the attributes were rated by employees as indicated by the standard deviation (SD) scores (SD = 0.64 to 1.55). New furnishings were provided as part of the renovation; the improved satisfaction scores were highly related to the increased satisfaction scores of ergonomics. Employees’ dissatisfied scores (M = 2.98, SD = 2.15) were expected because adjustable height worksurfaces were not provided (with few exceptions) in the PDOE workspace. However, employees were highly satisfied with the adjustable-height worksurface as demonstrated by the POE scores (M = 6.68, SD = 0.64) (t = 11.05, p < 0.001). The results also showed that they were significantly more satisfied with chair comfort, ease of adjustment, and back support; placement of the computer and mouse; and comfortable posture, monitors viewed without a bent neck, leg clearance, absence of visible glare, and a place for work items (see Table 5).
Table 5.
Employees’ differences in satisfaction with ergonomics, daylighting, and electric lighting (PDOE and POE).
3.4. Daylighting and Electric Lighting
Daylighting was examined in terms of employees’ satisfaction and the influence of daylight on work performance and health, as demonstrated in Table 5. PDOE results demonstrate that employees were dissatisfied (M = 3.28) with the overall daylighting conditions and that the daylighting neither enhanced nor hindered their work performance (M = 4.46) and health (M = 4.50). Subsequently, the POE results demonstrated that employees were satisfied (M = 5.27) with the overall daylighting conditions and that daylighting conditions enhanced both their work performance (M = 5.09) and health (M = 5.18). Though the work performance and health PDOE scores were at the top of the neutral range (3.51–4.50) and employees’ satisfaction with the daylighting condition was moderately dissatisfied, employees’ POE perceptions elevated the means to a statistically significant degree. Considering that the percentage of employees that had a primary workspace within 15 feet (4.57 m) of a window increased from 41% (PDOE) to over 65% (POE), these improved daylighting scores were expected.
Additional information can be ascertained from an examination of the electric lighting in terms of its impact on employees’ satisfaction, work performance, and health as shown in Table 5. The PDOE results demonstrate that employees were neither satisfied nor dissatisfied (M = 3.66) with the overall electric lighting conditions and that the electric lighting neither enhanced nor hindered their work performance (M = 4.22) and health (M = 4.03). It should be noted that the work performance and health means were below employees’ rating of daylighting conditions, whereas satisfaction with the electric lighting conditions were not as low as the satisfaction score employees determined for daylighting conditions (see Table 5). Subsequently, the POE results demonstrated that employees were satisfied (M = 5.46) with the overall electric lighting, and that electric lighting enhanced both their work performance (M = 4.93) and health (M = 4.79). These results indicate that employees’ POE perceptions elevated the means to a statistically significant degree.
As shown in Table 5, satisfaction with electric lighting was greatly improved from the PDOE to POE, and further analyses were conducted with the lighting module. All lighting questions showed a statistically significant improvement from the PDOE (see Table 5). The biggest improvements were the effectiveness of sensors (t = 5.09, p < 0.001) and visual comfort (t = 5.35, p < 0.001). Satisfaction with task lighting, especially, significantly increased with employees satisfied with both the quality and quantity of task lighting. Employees’ dissatisfaction with adjustability of task lighting from the PDOE (M = 3.29, SD = 1.66) lessened significantly as indicated by the more positive POE results (t = 3.08, p < 0.01).
4. Discussion
This study reports responses from Donaldson Company employees and their satisfaction with the physical environment of the building they occupy and their primary workspace (see Table 2). The PDOE’s mean satisfaction scores for the 13 IEQ categories ranged from 5.05 (overall vibration and movement from equipment) to 2.67 (overall appearance of the space), representing a full range from satisfaction to dissatisfaction. Reviewing all 26 IEQ criteria (categories and attributes), employees’ PDOE responses showed they were satisfied with only three of the 26 IEQ criteria. From the POE findings, the mean satisfaction scores for the IEQ categories ranged from 5.57 (overall indoor air quality) to 3.07 (ability to limit undesired sounds), again representing a full range from satisfaction to dissatisfaction. However, the POE mean satisfaction scores resulting from the POE survey indicated that many of the criteria in the dissatisfied and “neutral” satisfaction ranges evident in the PDOE findings had been remedied through the design of the renovated space, though a few were not or had lower scores from the PDOE to the POE results. For instance, results from the POE indicated that employees were satisfied with 17 of the 26 IEQ criteria in their primary workspaces, 16 of which were statistically significant changes. This change in the number of satisfied criteria is impressive.
For this project, the actual users’ feedback regarding the built environments from the PDOE identified needed design modifications then implemented by the design team. Users’ participation in the pre-design process can positively impact their satisfaction with the built environment [31]. Office employees, especially, spend most of their time at work; therefore, the built environment can significantly influence their satisfaction, performance, and health. For this reason, employee feedback in the design process and evaluation about the current built environment has been shown to provide valuable opportunities for improvement in the building’s features [32].
Based on the literature, additional variables related to the IEQ criteria were explored to provide the client and design team with additional knowledge. Privacy, daylighting, electric lighting, and ergonomics are all IEQ criteria that present some of the most challenging aspects of achieving an interior environment that is supportive of employees’ satisfaction, work performance, and health and have been the source of study by other researchers for those reasons [23].
Relative to employees’ primary workspaces in this study, those in private offices perceived that visual privacy enhanced their work performance more than employees in workstations; other implications related to acoustic privacy and percentage of time spent in the primary workspace were also identified (see Table 4). As shown in Table 1, EA&EE employees had previously occupied workstations comprised of tall partitions (see Figure 6). The shift to workstations comprised of low partitions (see Figure 7) was identified by employees in open-ended responses as an improvement to open communication and collaboration. However, lower partitions in the redesigned space negatively influenced privacy (acoustic and visual) satisfaction. This challenge (i.e., balance between collaboration and privacy) has been recognized in the literature [1,18], requiring further design modifications and related research. Daylighting and electric lighting were also further examined as key IEQ criteria that contribute to employee satisfaction, work performance, and health. All scores represented positive, statistically significant changes from the PDOE to the POE results. PDOE results indicated that employees were dissatisfied (M = 3.28) with daylighting and were neither satisfied nor dissatisfied with electric lighting (M = 3.66). Employees perceived that both daylighting and electric lighting neither enhanced nor hindered their work performance (daylighting: M = 4.46; electric lighting: M = 4.22) and health (daylighting: M = 4.50; electric lighting: M = 4.03). All PDOE lighting results signified that there was room for improvement. Finally, the ergonomics of employees’ primary workspaces was explored and results from the POE indicated positive, statistically significant changes in the means from those found in the PDOE results (see Table 5).
According to the literature, these increased satisfaction scores can positively correlate with higher self-reported performance scores for productivity and health [15]. In addition, results from 20 years of the Center for Built Environment (CBE)’s occupant surveys about IEQ factors indicated that acoustic privacy, temperature, and noise level were the most dissatisfied IEQ factors among employees [33]. Although EA&EE employees working at workstations had lower satisfaction scores with acoustic and visual privacy than the employees working at enclosed offices, as design modifications (e.g., taller partitions at the aisle end) were made to the primary workplace types, the satisfaction scores with overall IEQ factors were much improved from the PDOE to POE in this project.
4.1. Implications
Results from this PDOE and POE study provide researchers and design teams with critical evidence about the importance of conducting both PDOE and POE. The influence and importance of IEQ criteria on employee satisfaction, work performance, and health has been demonstrated and contributes to the body of knowledge regarding the influence of the built environment on building occupants. This paired inquiry (PDOE plus POE) provides a rationale as to why statistically significant findings should be applied with more assurance than anecdotal information alone. The renovation was made based on the results from PDOE, and after renovation, the POE results were compared with the PDOE; the results showed how the design changes benefited employees. For the design team and the client, evidence-based design helps ensure that human, financial, and environmental resources are appropriated with a higher likelihood of success in terms of meeting current and future employees’ needs and corporate goals. As the subject of this study was Donaldson Company, a Fortune 1000 company, it is likely that other companies with that designation might also benefit from similar examinations. Donaldson’s representative made it clear that future planning is significantly influenced by human resources and facilities perspectives, which are of key importance to corporate leadership in their decision-making strategies.
It is important to note that beyond the findings from the statistical analyses conducted, responses to open-ended questions within both the PDOE and POE surveys provided additional insights from the employees to the client and design team, as presented in Appendix A. In the past, many building owners and managers who have not undertaken a research study have relied solely on the “squeaky wheels” among their employees who occupy their buildings for guidance. Making design decisions solely on the comments provided by a small number of employees has been found to be unreliable, as typically only those who are dissatisfied take the time to communicate their viewpoints to building owners or managers. However, when used in concert with in-depth, detailed perceptions provided by employees, the building owner and the design team were able to supplement and enhance what was being learned from the statistical analyses. Employees’ satisfaction, work performance, and health can be improved by addressing IEQ criteria with unsatisfactory scores.
It is also important to communicate continually within the broadened design team (i.e., architects, designers, and space planners along with researchers and the client) as well as with affected employees; the outcome was both informative and educational. The client and design team worked collaboratively on this project. If employees feel as though the design is “done to them,” they are more likely to be less satisfied with the designed environment.
And finally, cultivating support from an enlightened design team for the integration of design research into the process is a big leap for many clients in terms of human and financial investment. Also, it takes a brave design team to expose their design work to the research process, the results of which may be that some of their design concepts or solutions require re-evaluation based on findings from a research study. However, when the design team and client are working together on more than one project, such as in this case, the benefits were found to outweigh the risks.
4.2. Limitations
The PDOE/POE study was conducted using only one group of occupants within a corporate campus in the upper Midwest of the United States. Therefore, the outcomes cannot be generalized. All EA&EE employees had engineering backgrounds. Also, the design solution that was evaluated via findings from the POE is unique to Donaldson Company. In addition, all responses from PDOE and POE were subjective responses. Hence, the findings must be interpreted carefully. Finally, the data were collected before the COVID-19 pandemic, and employees’ perception and satisfaction may have changed as influenced by the post-pandemic work experience. Future studies can focus on the impact of the pandemic on employees’ perceptions and satisfaction at work. In addition, future research can further investigate the impact of the built environments on occupants’ satisfaction during COVID-19 and/or after COVID-19. Future studies can also collect measurable data about the physical space (i.e., decibels, temperature, energy consumption, etc.) along with the subjective data. These are all limitations to the study relative to specific outcomes.
5. Conclusions
The findings of this study provided Donaldson Company (corporate, facilities management, and human relations) and the design team (architects, interior designers, and space planners) insights to help inform existing and future renovation design goals. The findings were determined through qualitative and quantitative research methods applied to data collected from two online surveys of Engine Air and Exhaust & Emissions (EA&EE) employees. The first was a pre-design occupancy evaluation (PDOE), conducted in late March through early April 2018. Employees were then surveyed via a post-occupancy evaluation (POE) survey, using the same instrument (i.e., questionnaire) one year after they had moved back into their renovated space. Beyond the findings from the analyses conducted, it is important to explore the responses from the POE to open-ended questions, which are provided in Appendix A.
It was determined that employees’ satisfaction could be improved by addressing the categories that had “neither dissatisfied nor satisfied” scores from the POE data. These areas were explored in more detail by Donaldson and the design team and have been used to guide design solutions going forward. It must be noted that the expense of building and operating a facility is second only to employee-related expenses over the life of the building. Therefore, maintaining or improving employees’ satisfaction is a sound investment, which, in turn, affects their performance, health, and overall well-being. The results of a comparative PDOE and POE study can be used as a diagnostic tool to aid in improving IEQ conditions for employees and to set the benchmarks from which improvement can be measured in the future. Furthermore, the findings can be leveraged by the design team to reconsider and revise their best-practice standards to enhance the appropriate use of precious resources and reduce the impact of the built environment on the natural one.
Author Contributions
Conceptualization, C.S.M. and S.B.; methodology, C.S.M.; formal analysis, S.B.; investigation, S.B. and C.S.M.; writing—original draft preparation, S.B. and C.S.M.; writing—review and editing, C.S.M. and S.B.; visualization, S.B.; supervision, C.S.M. and S.B.; project administration, C.S.M. and S.B.; funding acquisition, C.S.M. All authors have read and agreed to the published version of the manuscript.
Funding
This research was funded by Donaldson Company, Bloomington, MN, USA.
Data Availability Statement
Data sharing is not applicable to this article due to privacy.
Acknowledgments
The authors would like to express their sincere gratitude to Bill Coldwell from Donaldson Company for the access we were granted to internal strategic planning documents, information obtained through employee focus groups, and access to the facility. The authors would also like to thank R. Bruce Cornwall from LHB Corporation, Minneapolis, MN for his steadfast advocacy for design research, background information about Donaldson Company’s master planning and redesign, and openness to design changes informed by the research findings.
Conflicts of Interest
The authors declare no conflict of interest. The authors conducted the research and have full access to all the study’s data. The authors had the ability to analyze and interpret the data and to prepare and publish manuscripts independently, when and where they choose, based on a contract with Donaldson Company. We certify that the submission is original work and is not under review at any other publication. All co-authors have seen and agree with the manuscript’s contents.
Appendix A
Table A1.
Sample of PDOE IEQ responses to open-ended questions and resulting design solution approaches.
Table A1.
Sample of PDOE IEQ responses to open-ended questions and resulting design solution approaches.
| PDOE IEQ Criteria Concerns | POE Design Solutions |
|---|---|
Privacy: Acoustic
|
|
Privacy: Visual
|
|
Ergonomic Conditions
|
|
Daylighting and View Outside
|
|
Electric Lighting
|
|
References
- Hassanain, M.A.; Mahroos, M.S. A preliminary post-occupancy evaluation of the built-environment in office buildings: A case study from Saudi Arabia. Prop. Manag. 2023, 41, 564–581. [Google Scholar] [CrossRef]
- Frontczak, M.; Schiavon, S.; Goins, J.; Arens, E.; Zhang, H.; Wargocki, P. Quantitative relationships between occupant satisfaction and satisfaction aspects of indoor environmental quality and building design. Indoor Air 2012, 22, 119–131. [Google Scholar] [CrossRef]
- Candido, C.; Kim, J.; de Dear, R.; Thomas, L. BOSSA: A multidimensional post-occupancy evaluation tool. Build. Res. Inf. 2016, 44, 214–228. [Google Scholar] [CrossRef]
- Li, P.; Froese, T.M.; Brager, G. Post-occupancy evaluation: State-of-the-art analysis and state-of-the-practice review. Build. Environ. 2018, 133, 187–202. [Google Scholar] [CrossRef]
- Göçer, Ö.; Hua, Y.; Göçer, K. Completing the missing link in building design process: Enhancing post-occupancy evaluation method for effective feedback for building performance. Build. Environ. 2015, 89, 14–27. [Google Scholar] [CrossRef]
- Bae, S.; Martin, C.S.; Asojo, A.O. Indoor environmental quality factors that matter to workplace occupants: An 11-year-benchmark study. Build. Res. Inf. 2021, 49, 445–459. [Google Scholar] [CrossRef]
- Antoniadou, P.; Papadopoulos, A.M. Occupants’ thermal comfort: State of the art and the prospects of personalized assessment in office buildings. Energy Build. 2017, 153, 136–149. [Google Scholar] [CrossRef]
- Asojo, A.O.; Bae, S.; Martin, C.S. Post-occupancy evaluation study of the impact of daylighting and electric lighting in the workplace. Leukos 2020, 16, 239–250. [Google Scholar] [CrossRef]
- Freihoefer, K.; Guerin, D.; Martin, C.; Kim, H.-Y.; Brigham, J.K. Occupants’ satisfaction with, and physical readings of, thermal, acoustic, and lighting conditions of sustainable office workspaces. Indoor Built Environ. 2015, 24, 457–472. [Google Scholar] [CrossRef]
- Preiser, W.F. Post-occupancy evaluation: How to make buildings work better. Facilities 1995, 13, 19–28. [Google Scholar] [CrossRef]
- Martin, C.S. Implementation of Evidence-Based Design (EBD) by non-healthcare design practitioners. ArchNet-IJAR Int. J. Archit. Res. 2014, 8, 165. [Google Scholar] [CrossRef]
- Asojo, A.; Vo, H.; Bae, S. The impact of design interventions on occupant satisfaction: A workplace pre-and post-occupancy evaluation analysis. Sustainability 2021, 13, 13571. [Google Scholar] [CrossRef]
- Motalebi, G.; Sal Moslehian, A.; Hasanzadeh, E. The most effective indoor environmental quality factors related to worker satisfaction and performance: A case of the administrative office building at Ferdowsi University of Mashhad. Int. J. Occup. Saf. Ergon. 2021, 27, 358–370. [Google Scholar] [CrossRef] [PubMed]
- Vischer, J. Post-occupancy evaluation: A multifaceted tool for building improvement. In Learning from out Buildings: A State-of-the-Practice Summary of Post-Occupancy Evaluation; The National Academies Press: Washington, DC, USA, 2002; pp. 23–34. [Google Scholar]
- Altomonte, S.; Schiavon, S.; Kent, M.G.; Brager, G. Indoor environmental quality and occupant satisfaction in green-certified buildings. Build. Res. Inf. 2019, 47, 255–274. [Google Scholar] [CrossRef]
- Al Horr, Y.; Arif, M.; Kaushik, A.; Mazroei, A.; Katafygiotou, M.; Elsarrag, E. Occupant productivity and office indoor environment quality: A review of the literature. Build. Environ. 2016, 105, 369–389. [Google Scholar] [CrossRef]
- Wargocki, P.; Frontczak, M.; Schiavon, S.; Goins, J.; Arens, E.; Zhang, H. Satisfaction and self-estimated performance in relation to indoor environmental parameters and building features. In Proceedings of the 10th International Conference on Healthy Buildings, Brisbane, Australia, 8–12 July 2012. [Google Scholar]
- Haapakangas, A.; Hongisto, V.; Varjo, J.; Lahtinen, M. Benefits of quiet workspaces in open-plan offices–Evidence from two office relocations. J. Environ. Psychol. 2018, 56, 63–75. [Google Scholar] [CrossRef]
- Jamrozik, A.; Clements, N.; Hasan, S.S.; Zhao, J.; Zhang, R.; Campanella, C.; Loftness, V.; Porter, P.; Ly, S.; Wang, S. Access to daylight and view in an office improves cognitive performance and satisfaction and reduces eyestrain: A controlled crossover study. Build. Environ. 2019, 165, 106379. [Google Scholar] [CrossRef]
- Bergefurt, L.; Weijs-Perrée, M.; Appel-Meulenbroek, R.; Arentze, T. The physical office workplace as a resource for mental health–A systematic scoping review. Build. Environ. 2022, 207, 108505. [Google Scholar] [CrossRef]
- Geng, Y.; Ji, W.; Lin, B.; Zhu, Y. The impact of thermal environment on occupant IEQ perception and productivity. Build. Environ. 2017, 121, 158–167. [Google Scholar] [CrossRef]
- Kegel, P. The impact of the physical work environment on organizational outcomes: A structured review of the literature. J. Facil. Manag. Educ. Res. 2017, 1, 19–29. [Google Scholar] [CrossRef]
- Candido, C.; Chakraborty, P.; Tjondronegoro, D. The rise of office design in high-performance, open-plan environments. Buildings 2019, 9, 100. [Google Scholar] [CrossRef]
- Kallio, T.J.; Kallio, K.-M.; Blomberg, A.J. Physical space, culture and organisational creativity–A longitudinal study. Facilities 2015, 33, 389–411. [Google Scholar] [CrossRef]
- Zerella, S.; Von Treuer, K.; Albrecht, S.L. The influence of office layout features on employee perception of organizational culture. J. Environ. Psychol. 2017, 54, 1–10. [Google Scholar] [CrossRef]
- Zhuang, D.; Zhao, X.; Gan, V.J.; Yang, Y.; Shi, X. Comparative Investigation of Office Layout Influences on Occupant Satisfaction from Priori and Posteriori Perspectives. Buildings 2022, 12, 1327. [Google Scholar] [CrossRef]
- Wheeler, G.; Almeida, A. These four walls: The real British office. Chap 2006, 22, 357–377. [Google Scholar]
- Göçer, Ö.; Göçer, K.; Ergöz Karahan, E.; İlhan Oygür, I. Exploring mobility & workplace choice in a flexible office through post-occupancy evaluation. Ergonomics 2018, 61, 226–242. [Google Scholar]
- Agha-Hossein, M.; El-Jouzi, S.; Elmualim, A.; Ellis, J.; Williams, M. Post-occupancy evaluation studies in a recently refurbished office building: Energy performance and employees’ satisfaction. Energy Built Environ. 2013, 382, 156–166. [Google Scholar]
- Sailer, K.; Budgen, A.; Lonsdale, N.; Turner, A.; Penn, A. Pre and post occupancy evaluations in workplace environments. J. Space Syntax 2010, 1, 199–213. [Google Scholar]
- Jouppila, T. Staff participation in design with multiple tools: Impact on design and POE results. HERD Health Environ. Res. Des. J. 2022, 15, 315–330. [Google Scholar] [CrossRef]
- Keys, Y.; Silverman, S.R.; Evans, J. Identification of tools and techniques to enhance interdisciplinary collaboration during design and construction projects. HERD Health Environ. Res. Des. J. 2017, 10, 28–38. [Google Scholar] [CrossRef]
- Graham, L.T.; Parkinson, T.; Schiavon, S. Lessons learned from 20 years of CBE’s occupant surveys. Build. Cities 2021, 2, 166–184. [Google Scholar] [CrossRef]
Disclaimer/Publisher’s Note: The statements, opinions and data contained in all publications are solely those of the individual author(s) and contributor(s) and not of MDPI and/or the editor(s). MDPI and/or the editor(s) disclaim responsibility for any injury to people or property resulting from any ideas, methods, instructions or products referred to in the content. |
© 2023 by the authors. Licensee MDPI, Basel, Switzerland. This article is an open access article distributed under the terms and conditions of the Creative Commons Attribution (CC BY) license (https://creativecommons.org/licenses/by/4.0/).