

Indoor Environmental Quality and Comfort in Offices: A Review
 , and
, and
Abstract
:1. Introduction
2. Materials and Methods
2.1. Literature Search Outcomes for the Four Research Questions
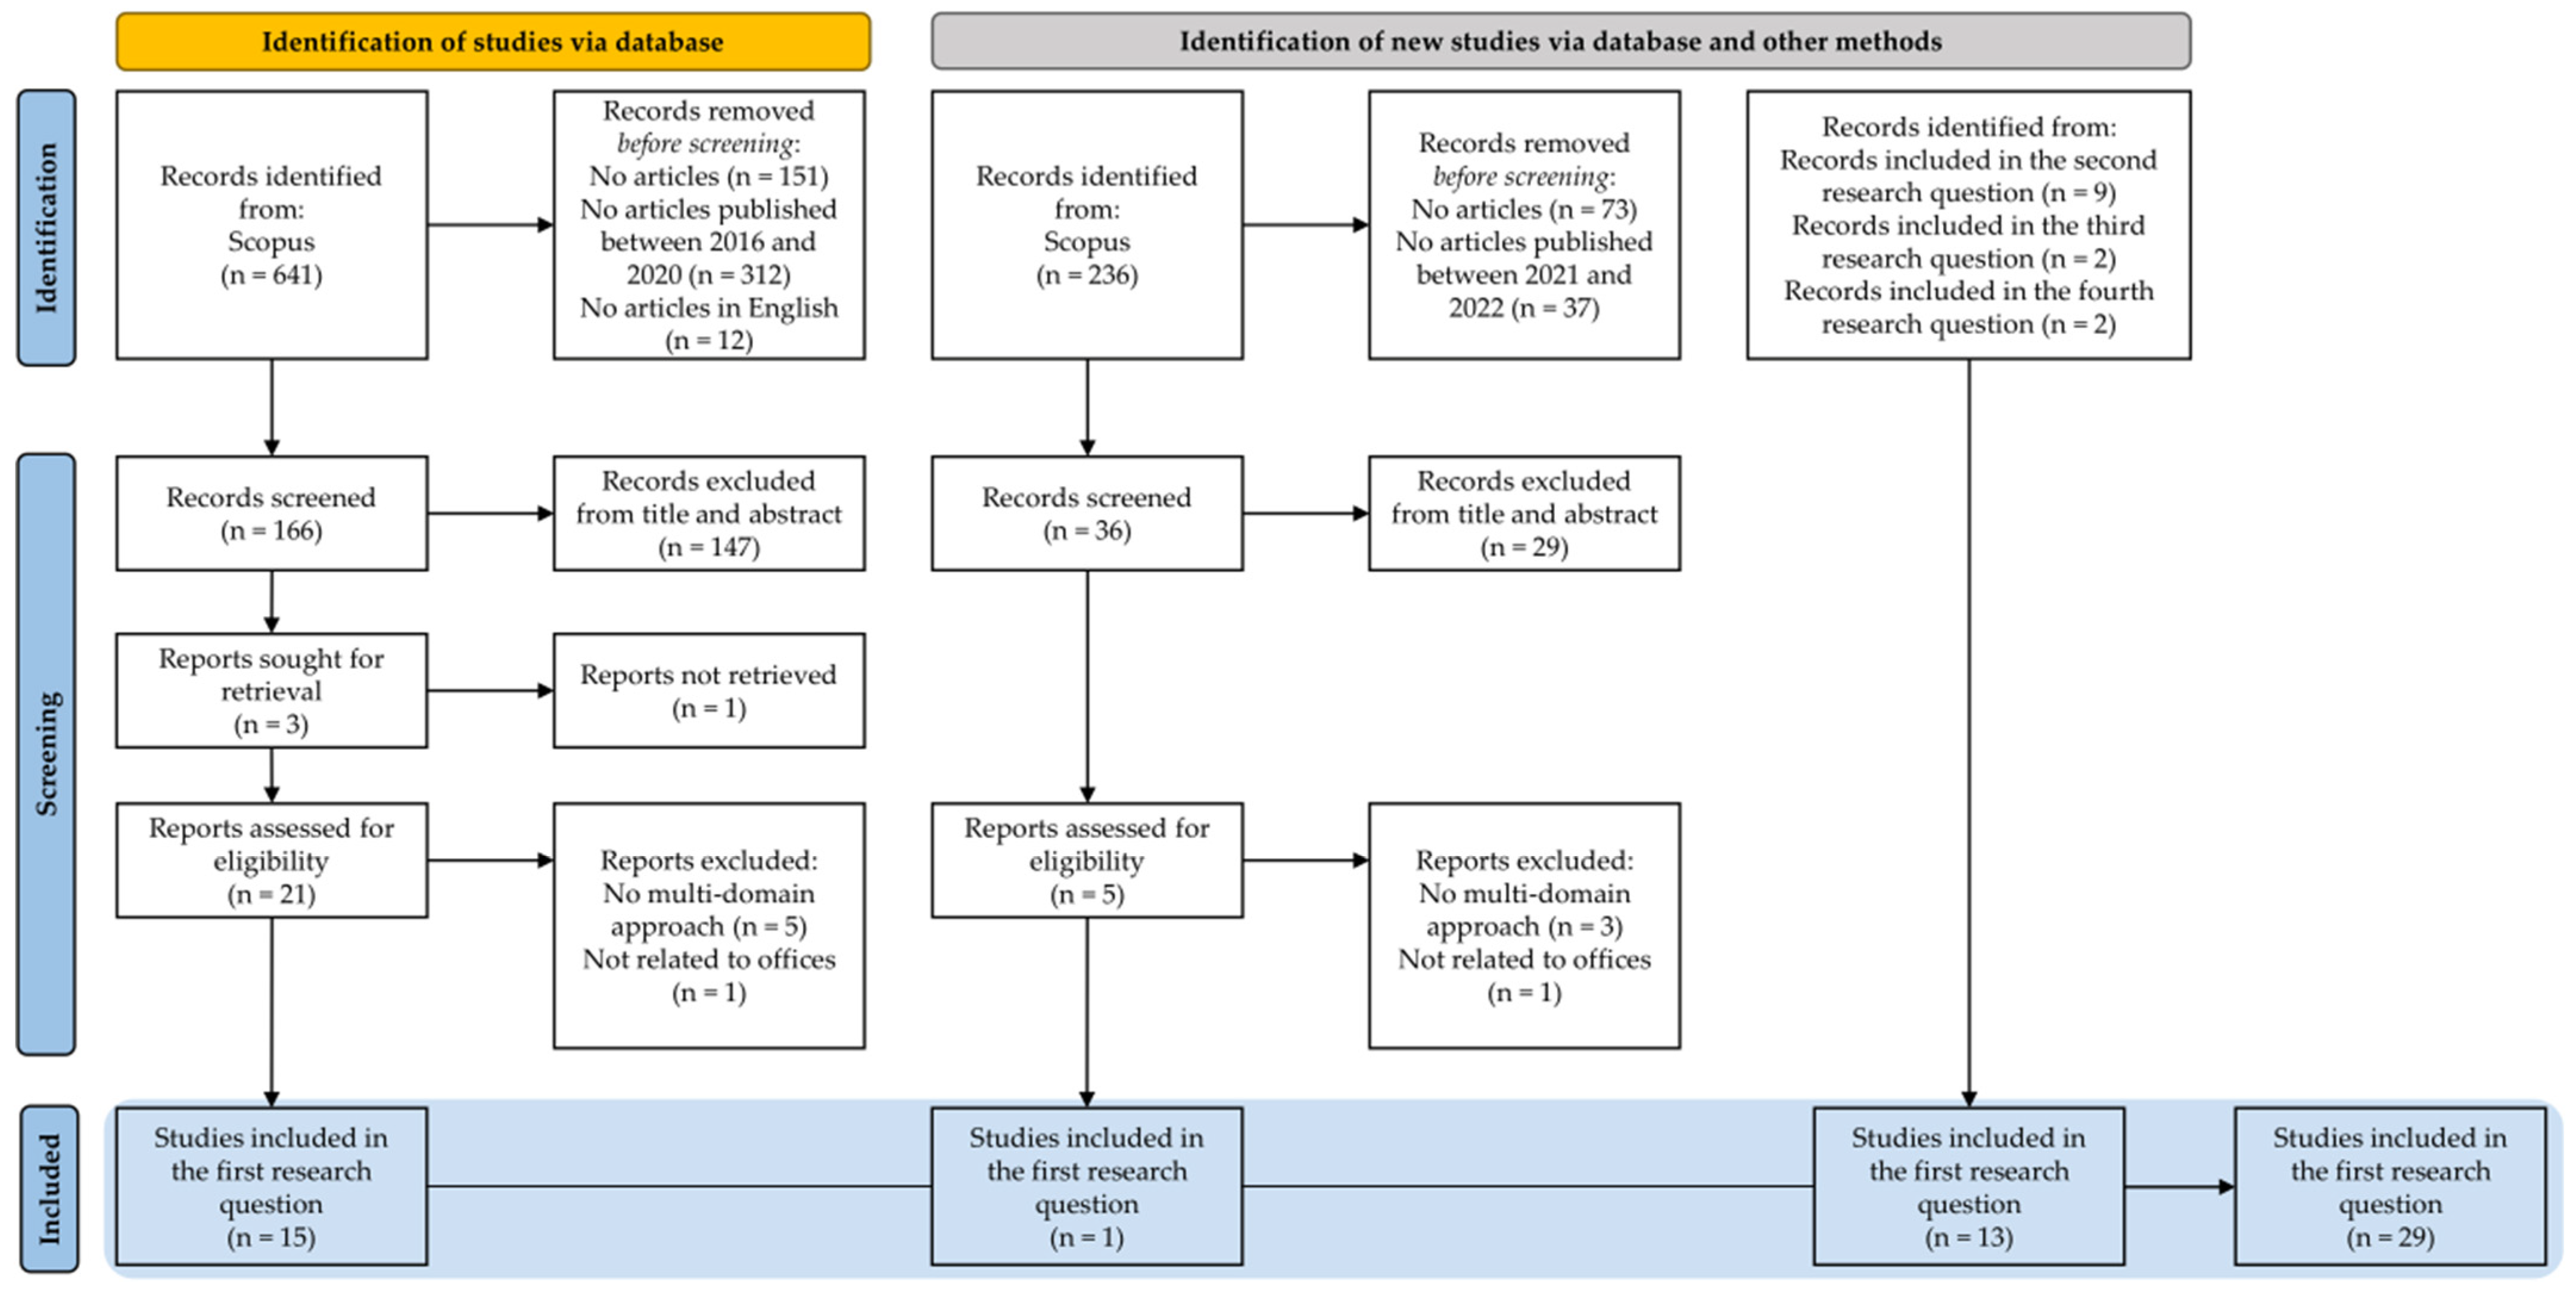
2.1.1. RQ1—“How Is IEQ Perceived and Evaluated?”
2.1.2. RQ2—“What Are the Main IEQ Indexes and Parameters?”
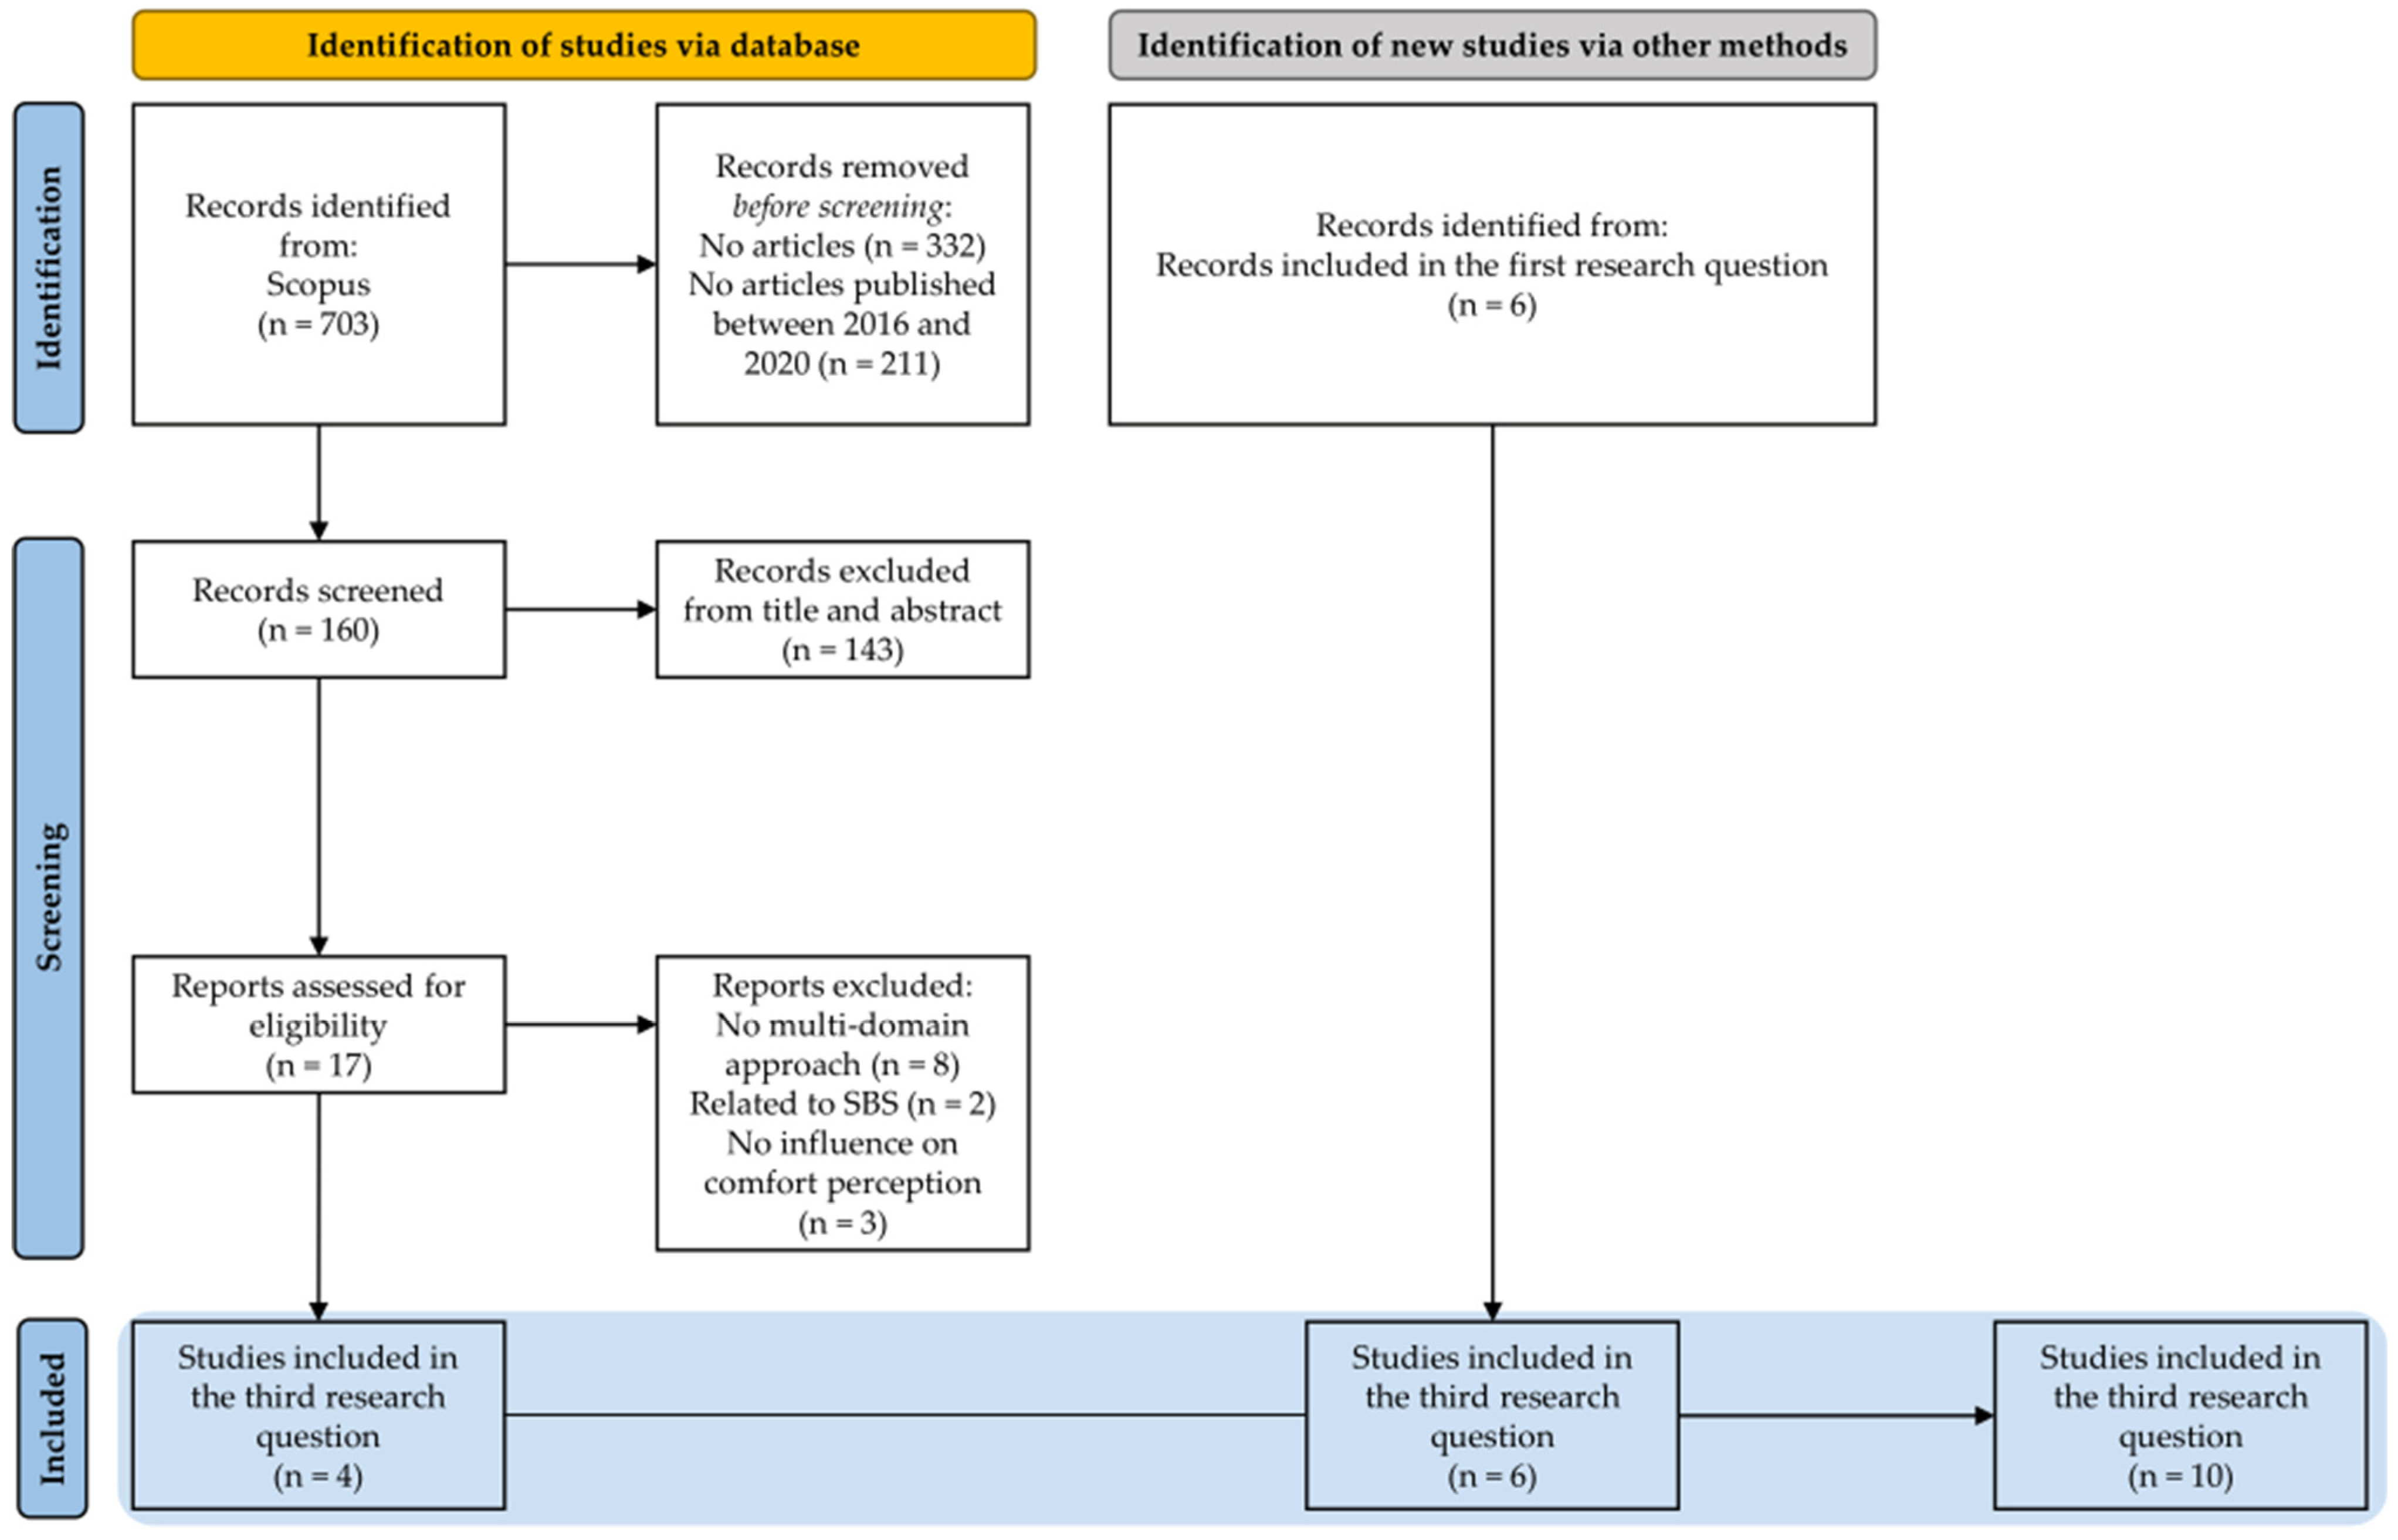
2.1.3. RQ3—“What Are the Main Contextual and Personal Factors That Influence the Comfort Perception?”
2.1.4. RQ4—“How Are IEQ and Comfort Represented in Space and Time?”
3. Results
3.1. RQ1—“How Is IEQ Perceived and Evaluated?”
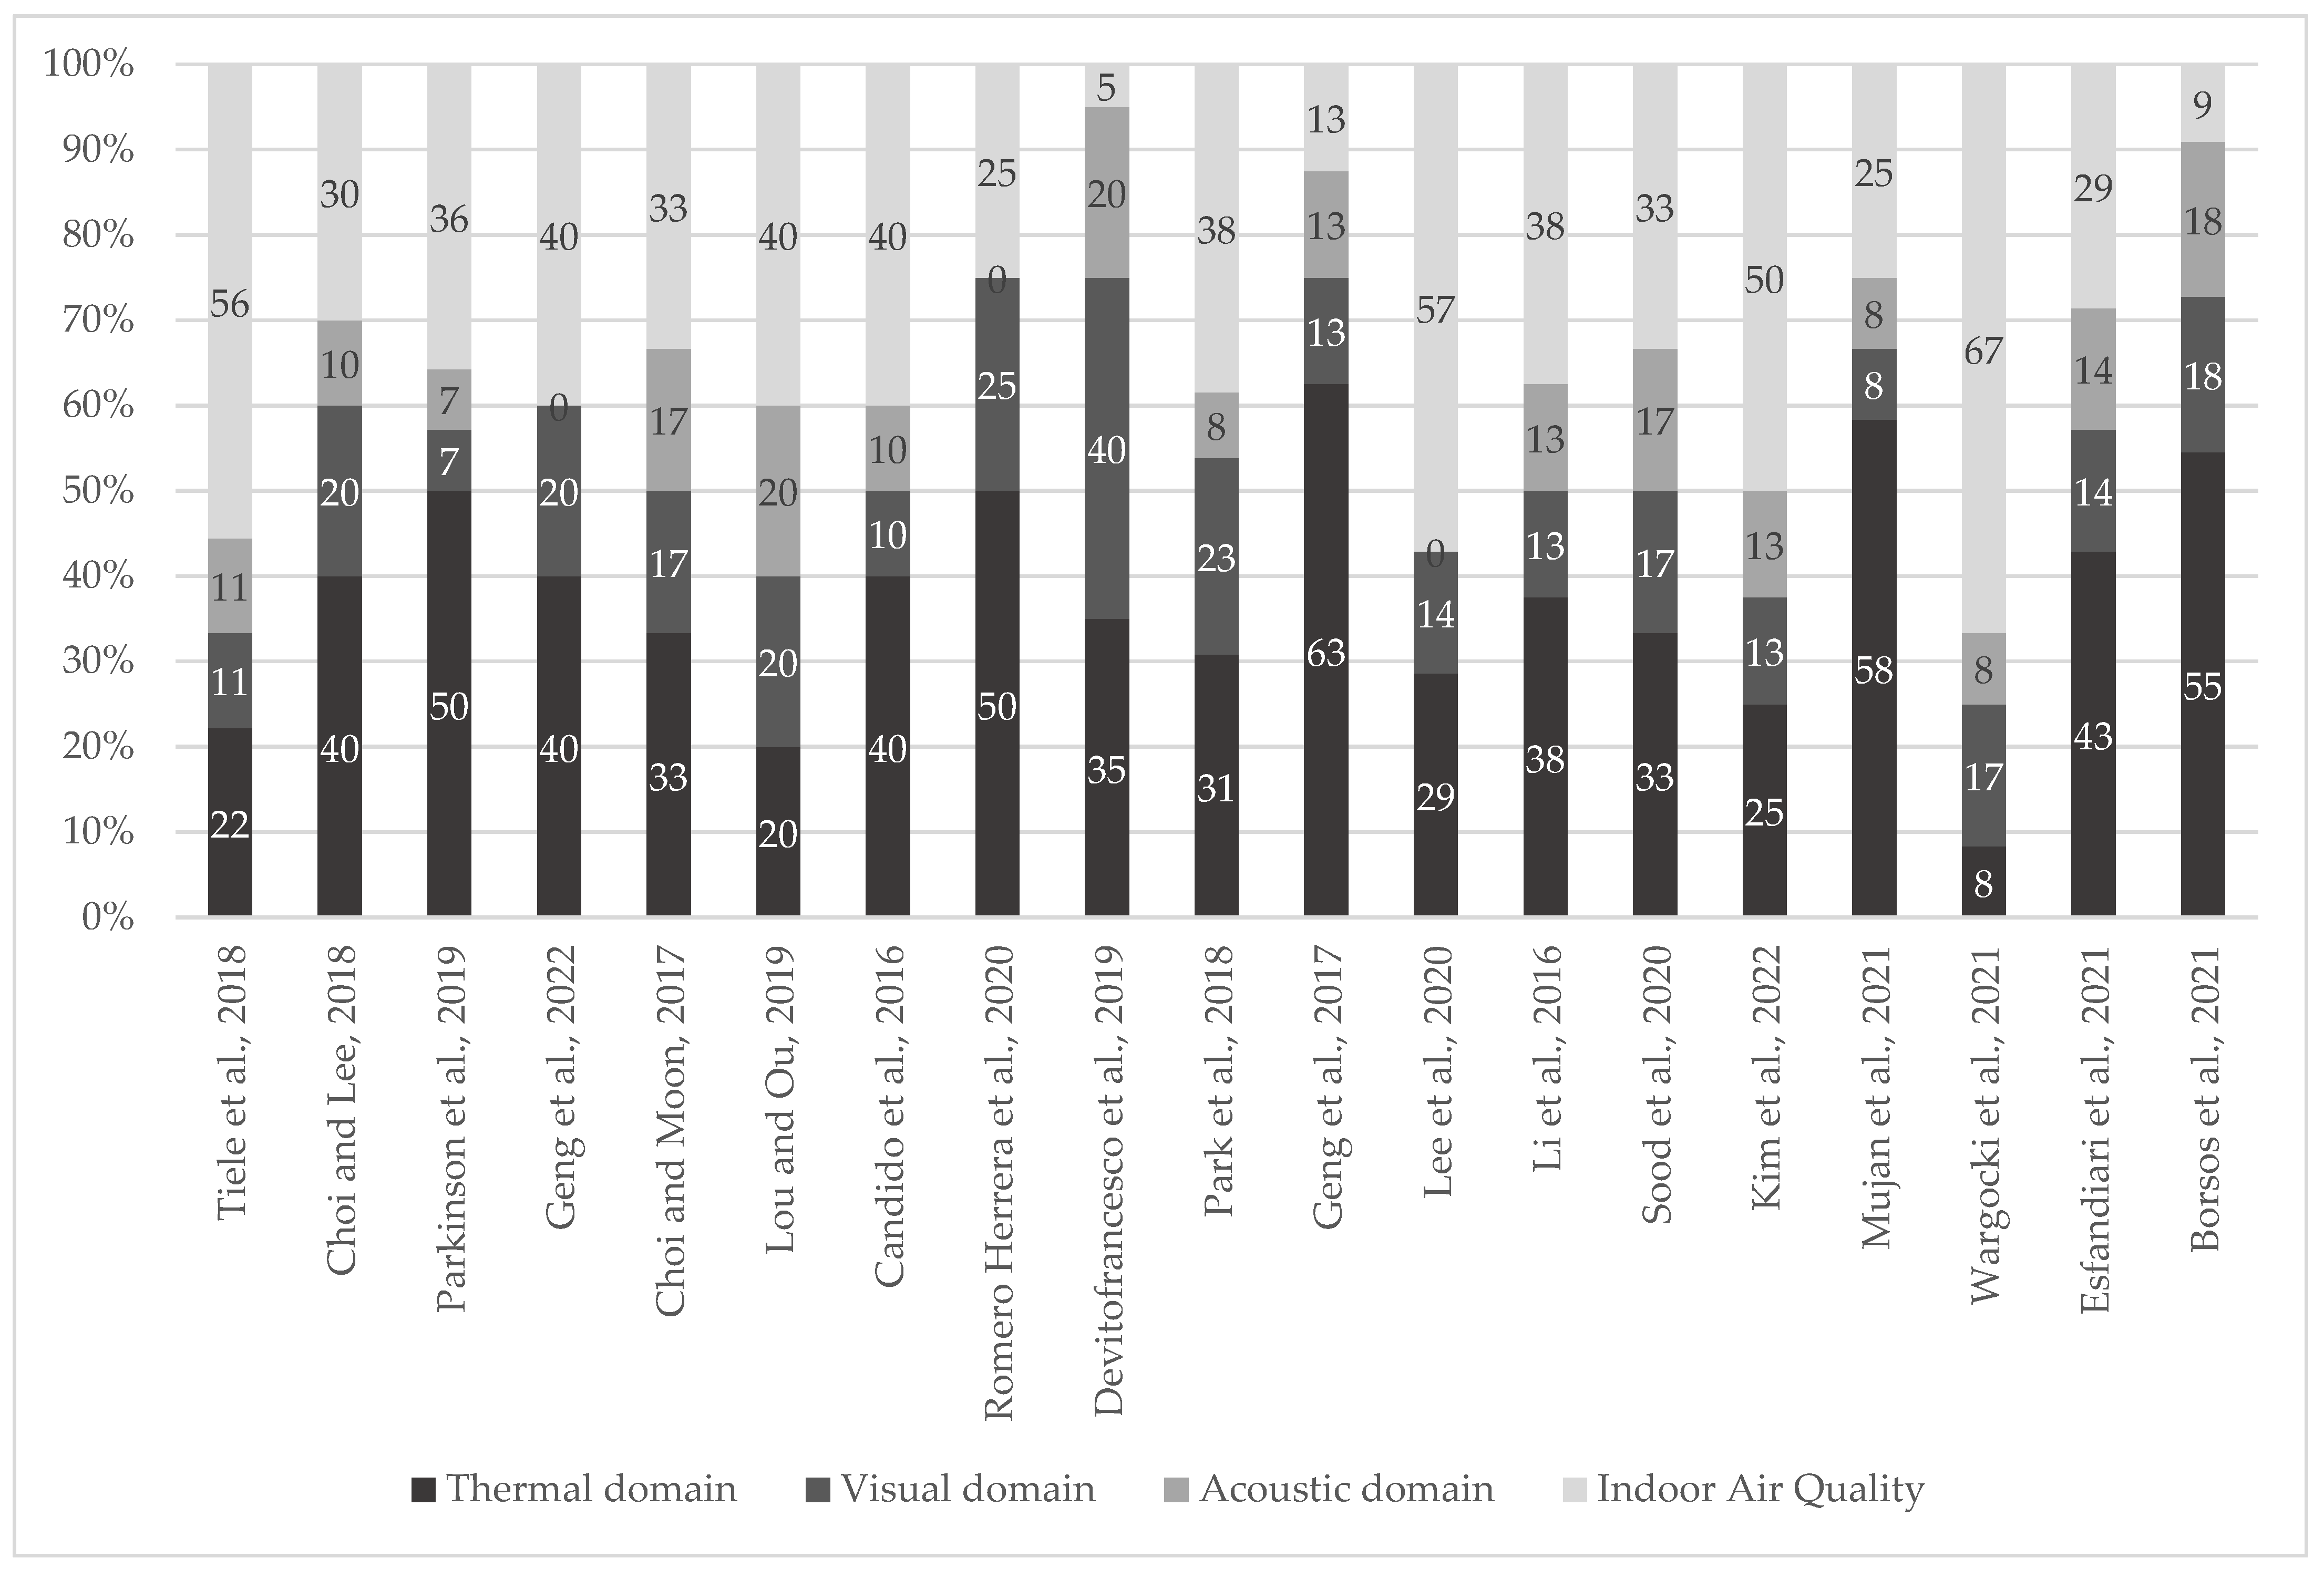
3.2. RQ2—“What Are the Main IEQ Indexes and Parameters?”
IEQ Indexes in International Standards
3.3. RQ3—“What Are the Main Contextual and Personal Factors That Influence the Comfort Perception?”
3.4. RQ4—“How Are IEQ and Comfort Represented in Space and Time?”
4. Conclusions and Future Perspectives
4.1. RQ1—“How Is IEQ Perceived and Evaluated?”
4.2. RQ2—“What Are the Main IEQ Indexes and Parameters?”
4.3. RQ3—“What Are the Main Contextual and Personal Factors That Influence the Comfort Perception?”
4.4. RQ4—“How Are IEQ and Comfort Represented in Space and Time?”
4.5. Future Perspectives
Author Contributions
Funding
Data Availability Statement
Acknowledgments
Conflicts of Interest
Abbreviations
| ACR | Air Change Rate |
| B | magnetic induction mean value |
| BOSSA | Building Occupants Survey System Australia |
| BREEAM | Building Research Establishment Environmental Assessment Method |
| BUS | Building Use Studies |
| CBE | Center of the Built Environment |
| CBPD | Center for Building Performance and Diagnostics |
| COPE | Cost-effective Open-Plan Environment |
| D | Devices used |
| DF | Daylight Factor |
| DR | Draught Risk |
| E | illuminance |
| EF | Electrical Field level |
| GM | Green Mark |
| I | Indexes assessed |
| IAQ | Indoor Air Quality |
| IEQ | Indoor Environmental Quality |
| IoT | Internet of Things |
| L10 | sound pressure level tenth percentile |
| L50 | sound pressure level fiftieth percentile |
| L90 | sound pressure level ninetieth percentile |
| LEED | Leadership in Energy and Environmental Design |
| Li,w | sound pressure level of winter air–conditioning |
| Li,s | sound pressure level of summer air–conditioning |
| LM | Long-term Monitoring |
| Lmin | minimum sound pressure level |
| Lmax | maximum sound pressure level |
| Lp,B | background noise level |
| M | Method used |
| NB | Number of Buildings |
| NEAT | National Environment Assessment Toolkit |
| NO | Number of Offices |
| NQ | Number of Questions |
| OLED | Organic Light-Emitting Diode |
| P | Parameters assessed |
| pb | barometric pressure |
| PD | Percentage of Dissatisfied |
| PM | Particulate Matter |
| PMV | Predicted Mean Vote |
| POE | Post-Occupancy Evaluation |
| PPD | Predicted Percentage of Dissatisfied |
| PRISMA | Preferred Reporting Items for Systematic Reviews and Meta-Analyses |
| QS | Questionnaires Sent |
| QT | Questionnaire Typology |
| QV | Questionnaires Valid |
| R | Response rate |
| Rback | ratio of the visual task discomfort glare to the average discomfort glare on the background area |
| RH | Relative Humidity |
| Rsurr | ratio of the visual task discomfort glare to the average discomfort glare in the immediate surrounding area |
| S | Support used |
| SAMBA | Sentient Ambient Monitoring of Buildings in Australia |
| SBS | Sick Building Syndrome |
| SM | Spot Measurement |
| SPL | Sound Pressure Level |
| SPOES | Sustainable Post-Occupancy Evaluation Surveys |
| STI | Speech Transmission Index |
| T | reverberation time |
| Ta | air temperature |
| Tg | globe temperature |
| Tmr | mean air temperature |
| Tr | radiant temperature |
| TVOC | Total Volatile Organic Compounds |
| UGR | Unified Glare Rating |
| Uo | illuminance uniformity |
| U0,surr | ratio of the minimum illuminance to the average illuminance on the immediate surrounding area |
| U0,back | ratio of the minimum illuminance to the average illuminance on the background area |
| Va | air velocity |
| WHO | World Health Organization |
| WODI | Work Environment Diagnosis Instrument |
Appendix A

| Parameter/Index and Reference Standard | Single Office | Shared Office | Open-Plan Office | |
|---|---|---|---|---|
| Thermal domain | ||||
| Predicted mean vote (PMV) * [-] EN ISO 7730:2005 [10] | Category A | −0.2 < PMV < +0.2 | −0.2 < PMV < +0.2 | −0.2 < PMV < +0.2 |
| Category B | −0.5 < PMV < +0.5 | −0.5 < PMV < +0.5 | −0.5 < PMV < +0.5 | |
| Category C | −0.7 < PMV < +0.7 | −0.7 < PMV < +0.7 | −0.7 < PMV < +0.7 | |
| Predicted percentage of dissatisfied (PPD) * [%] EN ISO 7730:2005 [10] | Category A | PPD < 6 | PPD < 6 | PPD < 6 |
| Category B | PPD < 10 | PPD < 10 | PPD < 10 | |
| Category C | PPD < 15 | PPD < 15 | PPD < 15 | |
| Operative temperature (Top) [°C] EN ISO 7730:2005 [10] | A (summer) | 24.5 ± 1.0 | 24.5 ± 1.0 | |
| A (winter) | 22.0 ± 1.0 | 22.0 ± 1.0 | ||
| B (summer) | 24.5 ± 1.5 | 24.5 ± 1.5 | ||
| B (winter) | 22.0 ± 2.0 | 22.0 ± 2.0 | ||
| C (summer) | 24.5 ± 2.5 | 24.5 ± 2.5 | ||
| C (winter) | 22.0 ± 3.0 | 22.0 ± 3.0 | ||
| Relative humidity (RH) [%] EN 16798-1:2019 [8] | 25 ≤ RH ≤ 60 | 25 ≤ RH ≤ 60 | ||
| Air velocity (Va) [m/s] EN ISO 7730:2005 [10] | A (summer) | 0.12 | 0.12 | |
| A (winter) | 0.10 | 0.10 | ||
| B (summer) | 0.19 | 0.19 | ||
| B (winter) | 0.16 | 0.16 | ||
| C (summer) | 0.24 | 0.24 | ||
| C (winter) | 0.21 | 0.21 | ||
| Acoustic domain | ||||
| Total noise level (L50) [dB(A)] NF S31-080:2006 [13] | Standard level | L50 ≤ 55 | L50 ≤ 55 | L50 ≤ 55 |
| Efficient level | 35 ≤ L50 < 45 | 35 ≤ L50 < 45 | 40 < L50 < 45 | |
| Highly efficient level | 30 < L50 < 35 | 30 < L50 < 35 | 40 < L50 < 45 | |
| —External noises (DnT,A,tr) [dB] NF S31-080:2006 [13] | Standard level | DnT,A,tr ≥ 30 | DnT,A,tr ≥ 30 | DnT,A,tr ≥ 30 |
| Efficient level | DnT,A,tr ≥ 30 and L50 ≤ 35 dB(A) | DnT,A,tr ≥ 30 and L50 ≤ 35 dB(A) | DnT,A,tr ≥ 30 and L50 ≤ 35 dB(A) | |
| Highly efficient level | DnT,A,tr ≥ 30 and L50 ≤ 30 dB(A) | DnT,A,tr ≥ 30 and L50 ≤ 30 dB(A) | DnT,A,tr ≥ 30 and L50 ≤ 30 dB(A) | |
| —Equipment noise NF S31-080:2006 [13] | Standard level | LAeq ≤ 45 dB(A) | LAeq ≤ 45 dB(A) | LAeq ≤ 45 dB(A) |
| Efficient level | Lp ≤ NR 33 | Lp ≤ NR 33 | NR 35 ≤ Lp ≤ NR 40 | |
| Highly efficient level | Lp ≤ NR 30 (permanent) and Lmax ≤ 35 dB(A) (intermittent) | Lp ≤ NR 30 (permanent) and Lmax ≤ 35 dB(A) (intermittent) | Lp ≤ NR 33 (permanent) and Lmax ≤ 35 dB(A) (intermittent) | |
| Reverberation time (Tr) [s] NF S31-080:2006 [13] | Standard level | / | Tr ≤ 0.6 | Tr ≤ 0.8 |
| Efficient level | Tr ≤ 0.7 | Tr ≤ 0.6 | 0.6 < Tr < 0.8 | |
| Highly efficient level | Tr ≤ 0.6 | Tr ≤ 0.5 | Tr ≤ 0.6 | |
| Reverberation time (Tr) [s] ISO 22955:2021 [12] | Tr ≤ 0.5 Tr ≤ 0.8 at 125 Hz | |||
| Impact noise L′nTw [dB] NF S31-080:2006 [13] | Standard level | L′nTw ≤ 62 | L′nTw ≤ 62 | L′nTw ≤ 62 |
| Efficient level | L′nTw ≤ 60 | L′nTw ≤ 60 | L′nTw ≤ 60 | |
| Highly efficient level | L′nTw ≤ 58 | L′nTw ≤ 58 | L′nTw ≤ 58 | |
| Insulation from internal airborne noise (DnT,A) [dB] NF S31-080:2006 [13] | Standard level | DnT,A ≥ 35 | DnT,A ≥ 35 | DnT,A ≥ 30 |
| Efficient level | DnT,A ≥ 40 | DnT,A ≥ 40 | DnT,A ≥ 35 | |
| Highly efficient level | DnT,A ≥ 45 | DnT,A ≥ 45 | DnT,A ≥ 40 | |
| Spatial decay NF S31-080:2006 [13] | Standard level | 2 dB. If decay not applicable: Tr ≤ 1.2 s | ||
| Efficient level | 3 dB. If decay not applicable: Tr ≤ 1.0 s | |||
| Highly efficient level | 4 dB. If decay not applicable: Tr ≤ 0.8 s | |||
| Spatial decay ISO 3382-3:2022 [11] | 7 dB | |||
| Spatial decay ISO 22955:2021 [12] | >6 dB | |||
| Distraction distance [m] ISO 3382-3:2022 [11] | 5 | |||
| Visual domain—electric lighting | ||||
| Illuminance in working areas (E) [lx] EN 16798-1:2019 [8] | 500 | 500 | ||
| Illuminance on the task area (E) [lx] * EN 12464-1:2021 [15] | T1 | 300 | 300 | 300 |
| T2 | 500 | 500 | 500 | |
| T3 | 750 | 750 | 750 | |
| T4 | 300 | 300 | ||
| T5 | 200 | 200 | 200 | |
| T6 | 500 | 500 | ||
| Unified glare rating (UGR) [-] * EN 12464-1:2021 [15] | T1 | UGR ≤ 19 | UGR ≤ 19 | UGR ≤ 19 |
| T2 | UGR ≤ 19 | UGR ≤ 19 | UGR ≤ 19 | |
| T3 | UGR ≤ 16 | UGR ≤ 16 | UGR ≤ 16 | |
| T4 | UGR ≤ 22 | UGR ≤ 22 | ||
| T5 | UGR ≤ 35 | UGR ≤ 35 | UGR ≤ 35 | |
| T6 | UGR ≤ 19 | UGR ≤ 19 | ||
| Illuminance uniformity (U) [-] * EN 12464-1:2021 [15] | T1 | U ≥ 0.4 | U ≥ 0.4 | U ≥ 0.4 |
| T2 | U ≥ 0.6 | U ≥ 0.6 | U ≥ 0.6 | |
| T3 | U ≥ 0.7 | U ≥ 0.7 | U ≥ 0.7 | |
| T4 | U ≥ 0.6 | U ≥ 0.6 | ||
| T5 | U ≥ 0.4 | U ≥ 0.4 | U ≥ 0.4 | |
| T6 | U ≥ 0.6 | U ≥ 0.6 | ||
| Color rendering index (CRI) [-] * EN 12464-1:2021 [15] | T1 | CRI ≥ 80 | CRI ≥ 80 | CRI ≥ 80 |
| T2 | CRI ≥ 80 | CRI ≥ 80 | CRI ≥ 80 | |
| T3 | CRI ≥ 80 | CRI ≥ 80 | CRI ≥ 80 | |
| T4 | CRI ≥ 80 | CRI ≥ 80 | ||
| T5 | CRI ≥ 80 | CRI ≥ 80 | CRI ≥ 80 | |
| T6 | CRI ≥ 80 | CRI ≥ 80 | ||
| Visual domain—natural lighting | ||||
| Daylight factor (DF) [%] EN 17037:2018 [14] | DF > 2 | DF > 2 | DF > 2 | |
| Spatial daylight autonomy (sDA) [%] * IES_LM-83-12 [54] | Nominally accepted | sDA > 55 | sDA > 55 | sDA > 55 |
| Preferred | sDA > 75 | sDA > 75 | sDA > 75 | |
| Annual sunlight exposure (ASE) [%] * IES_LM-83-12 [54] | Nominally accepted | ASE < 7 | ASE < 7 | ASE < 7 |
| Clearly acceptable | ASE < 3 | ASE < 3 | ASE < 3 | |
| Daylight glare probability (DGP) [-] * EN 17037:2018 [14] | Daylight glare mostly not perceived * | DGP ≤ 0.35 | DGP ≤ 0.35 | DGP ≤ 0.35 |
| Daylight glare perceived not disturbing * | 0.35 < DGP ≤ 0.4 | 0.35 < DGP ≤ 0.4 | 0.35 < DGP ≤ 0.4 | |
| Daylight glare often disturbing | 0.4 < DGP ≤ 0.45 | 0.4 < DGP ≤ 0.45 | 0.4 < DGP ≤ 0.45 | |
| Daylight glare intolerable | DGP ≥ 0.45 | DGP ≥ 0.45 | DGP ≥ 0.45 | |
| Indoor air quality | ||||
| Carbon dioxide (CO2) concentration above outdoors for nonadapted persons [ppm] * EN 16798-1:2019 [8] | Category I | 550 | 550 | 550 |
| Category II | 800 | 800 | 800 | |
| Category III | 1350 | 1350 | 1350 | |
| Category IV | 1350 | 1350 | 1350 | |
| Carbon monoxide (CO) [mg/m3] * EN 16798-1:2019 [8] | 15 min mean | ≤100 | ≤100 | ≤100 |
| 1 h mean | ≤35 | ≤35 | ≤35 | |
| 8h mean | ≤10 | ≤10 | ≤10 | |
| 24 h mean | ≤7 | ≤7 | ≤7 | |
| Formaldehyde [μg/m3] * EN 16798-1:2019 [8] | 30 min mean | ≤100 | ≤100 | ≤100 |
| Particulate matter (PM2.5) [μg/m3] * EN 16798-1:2019 [8] | 24 h mean | ≤25 | ≤25 | ≤25 |
| Annual mean | ≤10 | ≤10 | ≤10 | |
| Particulate matter (PM10) [μg/m3] * EN 16798-1:2019 [8] | 24 h mean | ≤50 | ≤50 | ≤50 |
| Annual mean | ≤20 | ≤20 | ≤20 | |
| Ozone (O3) [μg/m3] * EN 16798-1:2019 [8] | 8 h mean | ≤100 | ≤100 | ≤100 |
| Radon (Rn) * EN 16798-1:2019 [8] | 100 Bq/m3 (sometimes 300 mg/m3, country-specific) | 100 Bq/m3 (sometimes 300 mg/m3, country-specific) | 100 Bq/m3 (sometimes 300 mg/m3, country-specific) | |
| Nitrogen dioxide (NO2) [μg/m3] * EN 16798-1:2019 [8] | 1 h mean | ≤200 | ≤200 | ≤200 |
| Annual mean | ≤20 | ≤20 | ≤20 | |
References
- Schweiker, M.; Ampatzi, E.; Andargie, M.S.; Andersen, R.K.; Azar, E.; Barthelmes, V.M.; Berger, C.; Bourikas, L.; Carlucci, S.; Chinazzo, G.; et al. Review of Multi-domain Approaches to Indoor Environmental Perception and Behaviour. Build. Environ. 2020, 176, 106804. [Google Scholar] [CrossRef]
- European Comission. European Comission Indoor Air Pollution: New EU Research Reveals Higher Risks than Previously Thought; European Comission: Brussels, Belgium, 2003; IP/03/1278. [Google Scholar]
- Tiele, A.; Esfahani, S.; Covington, J. Design and Development of a Low-Cost, Portable Monitoring Device for Indoor Environment Quality. J. Sensors 2018, 2018, 5353816. [Google Scholar] [CrossRef]
- Choi, J.H.; Lee, K. Investigation of the Feasibility of POE Methodology for a Modern Commercial Office Building. Build. Environ. 2018, 143, 591–604. [Google Scholar] [CrossRef]
- Parkinson, T.; Parkinson, A.; de Dear, R. Continuous IEQ Monitoring System: Context and Development. Build. Environ. 2019, 149, 15–25. [Google Scholar] [CrossRef]
- Geng, Y.; Zhang, Z.; Yu, J.; Chen, H.; Zhou, H.; Lin, B.; Zhuang, W. An Intelligent IEQ Monitoring and Feedback System: Development and Applications. Engineering 2022, 18, 218–231. [Google Scholar] [CrossRef]
- Jayathissa, P.; Quintana, M.; Abdelrahman, M.; Miller, C. Humans-as-a-Sensor for Buildings—Intensive Longitudinal Indoor Comfort Models. Buildings 2020, 10, 174. [Google Scholar] [CrossRef]
- EN 16798-1; 2019 Energy Performance of Buildings—Ventilation for Buildings. Part 1: Indoor Environmental Input Parameters for Design and Assessment of Energy Performance of Buildings Addressing Indoor Air Quality, Thermal Environment, Lighting and Acoustics. European Committee for Standardization: Brussels, Belgium, 2019.
- ANSI/ASHRAE 55; 2017 Thermal Environmental Conditions for Human Occupancy. American Society of Heating, Refrigerating and Air-Conditioning Engineers (ASHRAE): Atlanta, GA, USA, 2017.
- ISO 7730; 2005 Ergonomics of the Thermal Environment—Analytical Determination and Interpretation of Thermal Comfort Using Calculation of the PMV and PPD Indices and Local Thermal Comfort Criteria. ISO: Geneva, Switzerland, 2005.
- ISO 3382-3; 2012 Acoustics—Measurement of Room Acoustic Parameters. ISO: Geneva, Switzerland, 2012.
- ISO 22955; 2021 Acoustics—Acoustic Quality of Open Office Spaces. ISO: Geneva, Switzerland, 2021.
- NF S31-080; Acoustics—Offices and Associated Areas—Acoustic Performance Levels and Criteria by Type of Area. AFNOR: Saint-Denis, France, 2006.
- EN 17037; 2018 Daylight in Buildings. European Committee for Standardization: Brussels, Belgium, 2018.
- EN 12464-1; 2021 Light and Lighting—Lighting of Work Places. Part 1: Indoor Work Places. European Committee for Standardization: Brussels, Belgium, 2021.
- Wei, W.; Wargocki, P.; Zirngibl, J.; Bendžalová, J.; Mandin, C. Review of Parameters Used to Assess the Quality of the Indoor Environment in Green Building Certification Schemes for Offices and Hotels. Energy Build. 2020, 209, 109683. [Google Scholar] [CrossRef]
- Rasheed, E.O.; Byrd, H. Can Self-Evaluation Measure the Effect of IEQ on Productivity? A Review of Literature. Facilities 2017, 35, 601–621. [Google Scholar] [CrossRef]
- Ong, B.L. Beyond Environmental Comfort; Routledge: Oxford, UK; New York, NY, USA, 2013; ISBN 9780415453684/0415453682/9780415453691/0415453690. [Google Scholar]
- Suyeon Bae, C.S.M.; Asojo, A.O. Indoor Environmental Quality Factors That Matter to Workplace Occupants: An 11-Year-Benchmark Study. Build. Res. Inf. 2021, 49, 445–459. [Google Scholar] [CrossRef]
- Aboulfotouh, A.K.; Tolba, O.; Ezzeldin, S. The Impact of Workspace Location and Indoor Environmental Quality on Employees’ Satisfaction within Office Buildings: A Case Study in Cairo. Indoor Built Environ. 2020, 31, 2094–2114. [Google Scholar] [CrossRef]
- Chen, C.F.; Yilmaz, S.; Pisello, A.L.; De Simone, M.; Kim, A.; Hong, T.; Bandurski, K.; Bavaresco, M.V.; Liu, P.L.; Zhu, Y. The Impacts of Building Characteristics, Social Psychological and Cultural Factors on Indoor Environment Quality Productivity Belief. Build. Environ. 2020, 185, 107189. [Google Scholar] [CrossRef]
- Choi, J.H.; Moon, J. Impacts of Human and Spatial Factors on User Satisfaction in Office Environments. Build. Environ. 2017, 114, 23–35. [Google Scholar] [CrossRef]
- Sakellaris, I.; Saraga, D.; Mandin, C.; de Kluizenaar, Y.; Fossati, S.; Spinazzè, A.; Cattaneo, A.; Szigeti, T.; Mihucz, V.; de Fernandes, E.O.; et al. Personal Control of the Indoor Environment in Offices: Relations with Building Characteristics, Influence on Occupant Perception and Reported Symptoms Related to the Building—The Officair Project. Appl. Sci. 2019, 9, 3227. [Google Scholar] [CrossRef]
- Lassen, N.; Josefsen, T.; Goia, F. Design and In-Field Testing of a Multi-Level System for Continuous Subjective Occupant Feedback on Indoor Climate. Build. Environ. 2021, 189, 107535. [Google Scholar] [CrossRef]
- Azuma, K.; Ikeda, K.; Kagi, N.; Yanagi, U.; Osawa, H. Evaluating Prevalence and Risk Factors of Building-Related Symptoms among Office Workers: Seasonal Characteristics of Symptoms and Psychosocial and Physical Environmental Factors. Environ. Health Prev. Med. 2017, 22, 38. [Google Scholar] [CrossRef]
- Dhungana, P.; Chalise, M. Prevalence of Sick Building Syndrome Symptoms and Its Associated Factors among Bank Employees in Pokhara Metropolitan, Nepal. Indoor Air 2019, 30, 244–250. [Google Scholar] [CrossRef]
- Kang, S.; Ou, D.; Mak, C.M. The Impact of Indoor Environmental Quality on Work Productivity in University Open-Plan Research Offices. Build. Environ. 2017, 124, 78–89. [Google Scholar] [CrossRef]
- Al Horr, Y.; Arif, M.; Kaushik, A.; Mazroei, A.; Katafygiotou, M.; Elsarrag, E. Occupant Productivity and Office Indoor Environment Quality: A Review of the Literature. Build. Environ. 2016, 105, 369–389. [Google Scholar] [CrossRef]
- Astolfi, A.; Carullo, A.; Fissore, V.; Puglisi, G.E.; Arcamone, G.; Shtrepi, L.; Raviola, E.; Barbaro, A.; Espinosa, G.R.; Chiavassa, P.; et al. Development and Metrological Characterization of a Multi-Sensor Device for Indoor Environmental Quality (IEQ) Monitoring. In Proceedings of the 2023 IEEE International Workshop on Metrology for Living Environment (MetroLivEnv), Milano, Italy, 29–31 May 2023; pp. 179–184. [Google Scholar]
- Page, M.J.; McKenzie, J.E.; Bossuyt, P.M.; Boutron, I.; Hoffmann, T.C.; Mulrow, C.D.; Shamseer, L.; Tetzlaff, J.M.; Akl, E.A.; Brennan, S.E.; et al. The PRISMA 2020 Statement: An Updated Guideline for Reporting Systematic Reviews. PLoS Med. 2021, 18, e1003583. [Google Scholar] [CrossRef]
- Frontczak, M.; Schiavon, S.; Goins, J.; Arens, E.; Zhang, H.; Wargocki, P. Quantitative Relationships between Occupant Satisfaction and Satisfaction Aspects of Indoor Environmental Quality and Building Design. Indoor Air 2012, 22, 119–131. [Google Scholar] [CrossRef]
- Sakellaris, I.A.; Saraga, D.E.; Mandin, C.; Roda, C.; Fossati, S.; De Kluizenaar, Y.; Carrer, P.; Dimitroulopoulou, S.; Mihucz, V.G.; Szigeti, T.; et al. Perceived Indoor Environment and Occupants’ Comfort in European “Modern” Office Buildings: The OFFICAIR Study. Int. J. Environ. Res. Public Health 2016, 13, 444. [Google Scholar] [CrossRef] [PubMed]
- Lou, H.; Ou, D. A Comparative Field Study of Indoor Environmental Quality in Two Types of Open-Plan Offices: Open-Plan Administrative Offices and Open-Plan Research Offices. Build. Environ. 2019, 148, 394–404. [Google Scholar] [CrossRef]
- D’Oca, S.; Pisello, A.L.; De Simone, M.; Barthelmes, V.M.; Hong, T.; Corgnati, S.P. Human-Building Interaction at Work: Findings from an Interdisciplinary Cross-Country Survey in Italy. Build. Environ. 2018, 132, 147–159. [Google Scholar] [CrossRef]
- Day, J.K.; Ruiz, S.; O’Brien, W.; Schweiker, M. Seeing Is Believing: An Innovative Approach to Post-Occupancy Evaluation. Energy Effic. 2020, 13, 473–486. [Google Scholar] [CrossRef]
- Candido, C.; Marzban, S.; Haddad, S.; Mackey, M.; Loder, A. Designing Healthy Workspaces: Results from Australian Certified Open-Plan Offices. Facilities 2021, 39, 411–433. [Google Scholar] [CrossRef]
- Candido, C.; Chakraborty, P.; Tjondronegoro, D. The Rise of Office Design in High-Performance, Open-Plan Environments. Buildings 2019, 9, 100. [Google Scholar] [CrossRef]
- Tamas, R.; Ouf, M.M.; O’Brien, W. A Field Study on the Effect of Building Automation on Perceived Comfort and Control in Institutional Buildings. Archit. Sci. Rev. 2020, 63, 74–86. [Google Scholar] [CrossRef]
- Candido, C.; Kim, J.; De Dear, R.; Thomas, L. BOSSA: A Multidimensional Post-Occupancy Evaluation Tool. Build. Res. Inf. 2016, 44, 214–228. [Google Scholar] [CrossRef]
- Romero Herrera, N.; Doolaard, J.; Guerra-Santin, O.; Jaskiewicz, T.; Keyson, D. Office Occupants as Active Actors in Assessing and Informing Comfort: A Context-Embedded Comfort Assessment in Indoor Environmental Quality Investigations. Adv. Build. Energy Res. 2020, 14, 41–65. [Google Scholar] [CrossRef]
- Devitofrancesco, A.; Belussi, L.; Meroni, I.; Scamoni, F. Development of an Indoor Environmental Quality Assessment Tool for the Rating of Offices in Real Working Conditions. Sustainability 2019, 11, 1645. [Google Scholar] [CrossRef]
- Park, J.; Loftness, V.; Aziz, A. Post-Occupancy Evaluation and IEQ Measurements from 64 Office Buildings: Critical Factors and Thresholds for User Satisfaction on Thermal Quality. Buildings 2018, 8, 156. [Google Scholar] [CrossRef]
- Geng, Y.; Ji, W.; Lin, B.; Zhu, Y. The Impact of Thermal Environment on Occupant IEQ Perception and Productivity. Build. Environ. 2017, 121, 158–167. [Google Scholar] [CrossRef]
- Lee, J.Y.; Wargocki, P.; Chan, Y.H.; Chen, L.; Tham, K.W. How Does Indoor Environmental Quality in Green Refurbished Office Buildings Compare with the One in New Certified Buildings? Build. Environ. 2020, 171, 106677. [Google Scholar] [CrossRef]
- Li, N.; Cui, H.; Zhu, C.; Zhang, X.; Su, L. Grey Preference Analysis of Indoor Environmental Factors Using Sub-Indexes Based on Weber/Fechner’s Law and Predicted Mean Vote. Indoor Built Environ. 2016, 25, 1197–1208. [Google Scholar] [CrossRef]
- Sood, T.; Janssen, P.; Miller, C. Spacematch: Using Environmental Preferences to Match Occupants to Suitable Activity-Based Workspaces. Front. Built Environ. 2020, 6, 113. [Google Scholar] [CrossRef]
- Weerasinghe, A.S.; Onyeizu, E.; Rotimi, J.O.B. Environmental and Socio-Psychological Drivers of Building Users’ Behaviours: A Case Study of Tertiary Institutional Offices in Auckland. J. Facil. Manag. 2022. [Google Scholar] [CrossRef]
- Kim, Y.K.; Abdou, Y.; Abdou, A.; Altan, H. Indoor Environmental Quality Assessment and Occupant Satisfaction: A Post-Occupancy Evaluation of a UAE University Office Building. Buildings 2022, 12, 986. [Google Scholar] [CrossRef]
- Mujan, I.; Licina, D.; Kljajić, M.; Čulić, A.; Anđelković, A.S. Development of Indoor Environmental Quality Index Using a Low-Cost Monitoring Platform. J. Clean. Prod. 2021, 312, 127846. [Google Scholar] [CrossRef]
- Wargocki, P.; Wei, W.; Bendžalová, J.; Espigares-Correa, C.; Gerard, C.; Greslou, O.; Rivallain, M.; Sesana, M.M.; Olesen, B.W.; Zirngibl, J.; et al. TAIL, a New Scheme for Rating Indoor Environmental Quality in Offices and Hotels Undergoing Deep Energy Renovation (EU ALDREN Project). Energy Build. 2021, 244, 111029. [Google Scholar] [CrossRef]
- Esfandiari, M.; Zaid, S.M.; Ismail, M.A.; Hafezi, M.R.; Asadi, I.; Mohammadi, S.; Vaisi, S.; Aflaki, A. Occupants’ Satisfaction toward Indoor Environment Quality of Platinum Green-Certified Office Buildings in Tropical Climate. Energies 2021, 14, 2264. [Google Scholar] [CrossRef]
- Borsos, Á.; Zoltán, E.S.; Pozsgai, É.; Cakó, B.; Medvegy, G.; Girán, J. The Comfort Map—A Possible Tool for Increasing Personal Comfort in Office Workplaces. Buildings 2021, 11, 233. [Google Scholar] [CrossRef]
- Göçer, Ö.; Candido, C.; Thomas, L.; Göçer, K. Differences in Occupants’ Satisfaction and Perceived Productivity in High- and Low-Performance Offices. Buildings 2019, 9, 199. [Google Scholar] [CrossRef]
- IES Daylight Metrics Committee. IES Spatial Daylight Autonomy (sDA) and Annual Sunlight Exposure (ASE); Daylight Metrics Committee. Approved Method IES LM-83-12; Illuminating Engineering Society of North America: New York, NY, USA, 2012. [Google Scholar]


| N | Research Question | Keywords |
|---|---|---|
| RQ1 | How is IEQ perceived and evaluated? | Multidimensional comfort, overall comfort, IEQ, discomfort, cross-modal effect, combined effect, office, workplace, work environment |
| RQ2 | What are the main IEQ indexes and parameters? | IEQ index, IEQ parameter, office, work environment |
| RQ3 | What are the main contextual and personal factors that influence the comfort perception? | IEQ, indoor environmental quality, indoor environment, office, workplace, work environment, contextual variable, contextual factor, psychosocial factor, context |
| RQ4 | How are IEQ and comfort represented in space and time? | Indoor environmental quality, comfort, user interface, platform, interface, data representation, data visualization, office |
| Ref | Location | Study Period | NO/ NB | IEQ Evaluation | ||||||||
|---|---|---|---|---|---|---|---|---|---|---|---|---|
| Questionnaire | IEQ Monitoring | |||||||||||
| QT | QS | QV | R | S | NQ | D | M | P/I | ||||
| [3] | University of Warwick | 1 O | - | Multisensor | LM | Ta, RH, E, CO2, CO, PM2.5, PM10, TVOC, SPL | ||||||
| [4] | Downtown Los Angeles | 2017 | 1 O | Customized COPE | 110 | Paper | 30 | IEQ cart “e-BOT” and hand-held sensors | SM | Ta, Tr, RH, Va, E, UGR, CO2, PM, TVOC, SPL | ||
| City of Irvine | 1 O | 79 | ||||||||||
| [5] | - | SAMBA | LM | Ta, Tmr, RH, Va, E, CO2, CO, TVOC, CH2O, SPL | ||||||||
| [6] | China | 2020 | 63 B | 2425 | Online, mobile | Multisensor | LM | Ta, RH, E, CO2, PM2.5 | ||||
| [19] | Minnesota | 2009–2019 | 41 B | SPOES | 2836 | Online | 29 | - | ||||
| [21] | Brazil, Italy, Poland, Switzerland, United States, Taiwan | 6 B | 2537 | Online | - | |||||||
| [22] | University of Southern California | 9 B | Customized COPE | 29 | IEQ cart | LM and SM | Ta, Tr, RH, Va, E, CO2, PM, TVOC, SPL | |||||
| City of Los Angeles | 5 B | |||||||||||
| [23] | 8 European Countries | October 2011–May 2012 | 167 B | 7441 | 41% | Online | - | |||||
| [27] | South of China | December 2015–March 2016 | 19 B | 231 | 87% | - | ||||||
| [33] | Huaqiao University, China | September 2017 | 13 O | 62 | 82.2% | Independent devices | SM | Ta, RH, E, Uo, SPL, Lmin, Lmax, L10, L50, L90, CO2, CH2O, PM2.5, PM10 | ||||
| 12 O | 63 | |||||||||||
| [34] | Turin | April–May 2017 | 4424 | 502 | 11% | Online | 37 | - | ||||
| Perugia | 2991 | 405 | 14% | |||||||||
| Renden | 1598 | 253 | 16% | |||||||||
| [35] | Eastern Washington State | 2018 | 1 B | 180 | 57 | 31.7% | Online, photovoice survey | 60 | - | |||
| [36] | Australia | 4 O | BOSSA Time-Lapse | 465 | - | |||||||
| 5 O | 656 | |||||||||||
| [37] | Australia | 61 O | BOSSA Time-Lapse | 8827 | Online | 31 | - | |||||
| [38] | Canada | June–July 2018 | 23 B | 170 | Interviews | 24 | - | |||||
| [39] | BOSSA Time-Lapse and BOSSA Snap-Shot | Online | 31 | BOSSA Nova cart | SM | Ta, Tg, RH, Va, E, CO2, CO, TVOC, CH2O, SPL | ||||||
| [40] | Netherlands | October 2016 | 1 B | 173 | Online | Wireless sensor infrastructure | LM | Ta, RH, E, CO2 | ||||
| United Kingdom | November 2016 | 1 B | 288 | |||||||||
| [41] | - | Independent devices | LM and SM | ΔCO2, Ta, RH, Tmr, Va, PMV, PD, DR, DF, U0,surr, U0,back, Rsurr, Rback, Li,w, Li,s, T, STI, B, EF | ||||||||
| [42] | 2003–2014 | 64 O | Customized COPE | Paper and online | NEAT cart, independent devices | LM and SM | Ta, Tr, RH, Va, E, UGR, CO2, CO, PM2.5, PM10, TVOC, acoustic quality | |||||
| [43] | Tsinghua University in Beijing, China | November 2016 | 1 O | 441 | Online | Independent devices | Test (2 h) | Ta, Tg, RH, E, CO2, Lp,B | ||||
| [44] | Singapore | September 2014– December 2016 | 4 B | POE | 115 | 73.7% | Tablet | Independent devices | LM | CO2, Ta, RH | ||
| 4 B | 113 | 85.6% | ||||||||||
| 6 B | 139 | 72.9% | SM | E, CO, CH2O, PM2.5, outdoor ACR | ||||||||
| [45] | Guangzhou, China | April–May 2014 | 1 O | 91 | Independent devices | SM | Ta, RH, Va, E, CO2, PM10, CH2O, SPL | |||||
| [46] | National University of Singapore | April–May 2019 | 2 B | Mobile | Independent sensors | LM | Ta, RH, E, CO2, TVOC, SPL | |||||
| [47] | Auckland, New Zealand | October 2020–January 2021 | 5 B | 257 | 52 | 20% | Online | - | ||||
| [48] | Al Ain, United Arab Emirates | December 2019– February 2020 | 9 O | POE | Independent devices | LM and SM | Ta, RH, E, CO2, PM2.5, PM10, TVOC, SPL | |||||
| [49] | Novi Sad, Serbia | August 2020 | 1 O | 34 | 34 | 100% | Paper | ENVIRA Prototype | LM | Ta, Tg, Tmr, Va, RH, PMV, PPD, E, CO2, PM2.5, TVOC, SPL, pb | ||
| 1 O | 36 | 35 | ||||||||||
| [50] | Southern, Central and Northern Europe | April 2019–March 2020 | 6 B | - | Independent sensors | LM and SM | Ta, ventilation rate, RH, E, DF, CO2, PM2.5, CH2O, benzene, radon, SPL | |||||
| [51] | Putrajaya, Kuala Lumpur | May–August 2019 | 1 B | BUS | 174 | 112 | 64% | Independent devices | LM | Ta, Va, RH, E, CO2, TVOC, SPL | ||
| Shah Alam, Kuala Lumpur | 1 B | |||||||||||
| [52] | Budapest | November 2019– January 2020 | 1 O | 216 | Online | Independent devices | SM | Ta, Tr, Va, RH, E, CO2, SPL | ||||
| IEQ Domain | Subfactors | Ref |
|---|---|---|
| Thermal comfort | Overall thermal environment | [6,19,21,27,33,34,35,36,38,43,45,47,49,51,52] |
| Temperature | [4,19,21,22,23,27,33,39,40,42,44,46,51] | |
| Air movement | [19,21,23,42,44] | |
| Humidity | [19,27,33,44] | |
| Too hot/too cold temperature | [23,48] | |
| Temperature variation | [23,48] | |
| Surfaces’ temperature | [23,48] | |
| Temperature stability | [51] | |
| Windows are too close/far from me | [21] | |
| Cold feet | [48] | |
| Visual comfort | Overall lighting environment | [4,6,21,23,27,33,34,35,36,42,43,44,45,47,51] |
| Natural lighting | [20,26,30,35,37,40,46,53] | |
| Lighting level | [37,39,44,46,48,49,52] | |
| Artificial lighting | [19,23,28,33,38,51] | |
| Direct glare | [22,23,35,48] | |
| Visual privacy | [35,37,42,44] | |
| View to outside | [21,37,39,48] | |
| Glare in the computer screen | [4,21,42] | |
| Amount of daylighting | [20,22,35] | |
| Light for computer work | [4,22,42] | |
| Glare from sun | [4,42,51] | |
| Glare from artificial light | [4,42,51] | |
| Shading | [37,39,52] | |
| Reflected light | [22,48] | |
| Amount of electric lighting | [19,21] | |
| Access to daylight | [37,39] | |
| Light for paper-based tasks | [42] | |
| Acoustic comfort | Overall acoustic environment | [6,19,21,23,27,33,34,43,45,47,51] |
| Noise level | [35,37,38,39,40,44,46,48,49,52] | |
| Sound privacy | [35,37,39,42,44] | |
| Verbal noise | [4,23,42,51] | |
| Outside noise | [21,23,51] | |
| Noise from building systems | [4,21,23] | |
| Noise from inside | [21,24,51] | |
| Nonverbal noise | [23,42] | |
| Unwanted interruptions | [37,39] | |
| Noise disturbance | [33] | |
| Noise distraction and privacy | [36] | |
| Quietness | [28] | |
| Noise sources | [28] | |
| IAQ perception | Overall air quality | [4,6,19,21,22,23,28,33,34,35,36,37,39,42,43,44,45,47,49,51] |
| Ventilation/air velocity | [21,22,28,33,37,39,48,52] | |
| Odor | [21,23,38,42,48,51,52] | |
| Humid/dry air | [23,37,39,48,51] | |
| Stuffy or fresh air | [21,23,28,48] | |
| Freshness | [28,33,39,51] |
| Surveyed Factors | Subfactors | Ref |
|---|---|---|
| Workspace | Personal space | [27,33,36,38] |
| Amount of personal space | [4,22,39,42,44] | |
| Connection to the outdoor environment | [36,37,39] | |
| Building maintenance | [19,36,37,39] | |
| Overall layout | [23,27,33,35,36,37] | |
| View outside | [4,22,23,35,37,39,42] | |
| Overall appearance (aesthetics) | [19,37,39,42] | |
| Cleanliness | [19,37,39,42,51] | |
| Overall furnishings | [19,27,35,51] | |
| Adjustability of furnishings | [19,35,37,39] | |
| Office type | [21,42,47,51] | |
| Enclosure of the work area | [4,22,42] | |
| Indoor environment | [22,44] | |
| Health | Perceived health | [36,37,39,51] |
| Headache | [23,44,48] | |
| Stuffy/runny nose | [23,44,48] | |
| Sleepiness | [23,44,48] | |
| Time spent at work | Hours per week in work area | [19,21,34,36,42] |
| Overall years spent in the building | [19,38,48,51] | |
| Personal | Gender | [4,19,21,27,34,36,37,42,47,48,49,51] |
| Age | [4,19,21,27,34,36,37,42,47,48,49,51] | |
| Job category | [4,21,34,36,37,42,48] | |
| Control | Personal control | [21,35,36,37,44] |
| Access to thermostats | [4,21,22,23,34,35,37,38,39,47,48] | |
| Control over ventilation | [23,37,39,47,48] | |
| Control over shade from the sun | [21,23,34,35] | |
| Control over light | [21,23,34,35,37,38,39,47,48] | |
| Control over noise | [23,38,47] | |
| Operable windows | [21,34,35] | |
| Perceived productivity | [4,21,23,27,33,34,36,37,39,42,51] | |
| Level of privacy | [4,19,22,23] | |
| Alterability of physical conditions | [4,35,42] | |
| Overall comfort | [23,34,37,38,39,40,51] | |
| IEQ | [4,21,35,42,43,49] |
| IEQ Domain | Indexes and Parameters | Ref |
|---|---|---|
| Thermal domain | Air temperature | [3,4,5,6,22,33,39,40,41,42,43,44,45,46,48,49,50,51,52] |
| Relative humidity | [3,4,5,6,22,33,39,40,41,42,43,44,45,46,48,49,50,51] | |
| Air velocity | [4,5,22,39,41,42,45,49,51,52] | |
| Predicted mean vote | [5,6,41,43,49,51] | |
| Predicted percentage of dissatisfied | [6,22,41,43,49,52] | |
| Globe temperature | [5,39,43,49] | |
| Radiant temperature | [4,22,42,52] | |
| Mean radiant temperature | [5,41,49] | |
| Draught risk | [41] | |
| Visual domain | Illuminance | [3,4,5,6,22,33,39,40,41,42,43,44,45,46,48,49,50,51,52] |
| Unified glare rating | [4,22,41,42] | |
| Daylight factor | [41,50,52] | |
| Luminance | [41,42] | |
| Illuminance uniformity | [33] | |
| Ratio of the minimum illuminance to the average illuminance on the immediate surrounding area | [41] | |
| Ratio of the minimum illuminance to the average illuminance on the background area | [41] | |
| Ratio of the visual task discomfort glare to the average discomfort glare in the immediate surrounding area | [41] | |
| Ratio of the visual task discomfort glare to the average discomfort glare on the background area | [41] | |
| Acoustic domain | Sound pressure level | [3,4,5,22,33,39,42,45,46,48,49,50,51,52] |
| Reverberation time | [41,52] | |
| Background noise level | [22,43] | |
| Sound pressure level of winter air conditioning | [41] | |
| Sound pressure level of summer air conditioning | [41] | |
| Statistical sound levels (L10, L50 and L90) | [33] | |
| Speech transmission index | [41] | |
| Indoor Air Quality | Carbon dioxide | [3,4,5,6,22,33,39,40,41,42,43,44,45,46,48,49,50,51,52] |
| Particulate Matter 2.5 | [3,4,6,22,33,42,44,48,49,50] | |
| Total volatile organic compounds | [3,5,22,39,42,48,49,51] | |
| Particulate Matter 10 | [3,4,5,23,33,42,45,47] | |
| Formaldehyde | [5,33,39,44,45,50] | |
| Carbon monoxide | [3,5,39,42,44] | |
| Benzene | [50] | |
| Ventilation rate | [50] | |
| Radon | [50] | |
| Volatile organic compounds | [46] | |
| Relative humidity | [50] |
| Contextual Factor | Affected Domain | Ref |
|---|---|---|
| Personal space | Overall comfort | [33] |
| Office typology | Overall comfort | [33] |
| Visual comfort | [35] | |
| Acoustic comfort | [27] | |
| Workstation location | Overall comfort | [27] |
| Thermal comfort | [22] | |
| Visual comfort | [22] | |
| Work typology | Thermal comfort | [33] |
| Acoustic comfort | [27,33] | |
| Occupants’ control on building systems | Overall comfort | [23,38] |
| Visual comfort | [35] | |
| Work area aesthetics | Overall comfort | [37] |
| Adaptation of the work area | Overall comfort | [37] |
| Furnishing | Overall comfort | [19,37] |
| Cleanliness | Overall comfort | [19,37] |
| Amount of interruptions | Overall comfort | [37] |
| Season | Overall comfort | [4] |
| Area ratio of window to floor | Visual comfort | [33] |
| Privacy | Overall comfort | [19] |
| Personal Factor | Affected Domain | Ref |
|---|---|---|
| Gender | Thermal comfort | [4,22,27,34] |
| Visual comfort | [23] | |
| Acoustic comfort | [4] | |
| Age | Thermal comfort | [23] |
| Visual comfort | [4,23,28] | |
| Acoustic comfort | [28] | |
| Birthplace | Thermal comfort | [28] |
| Visual comfort | [28] | |
| Acoustic comfort | [28] |
| Ref | Parameters and Indexes | Parameters Rating | IEQ Index | Occupants’ Feedback | Represented Data | Support Tool | End-Users |
|---|---|---|---|---|---|---|---|
| [3] | Ta, RH, CO, CO2, TVOC, PM2.5, PM10, E, SPL | Good, average, poor, bad | Percentage | IEQ indicator, IEQ score and warnings | Low-power OLED display on the external case | Researchers, enthusiasts, everyday users | |
| [5] | Ta, RH, Tg, Va, SPL, E, TVOC, CH2O, CO, CO2 | Good (green), fair (yellow), poor (red) | Percentage | Real-time averages, compliance times, recent histories, alerts, noncompliant parameters, IEQ rating | IEQ Analytics web service (online data visualization) | Building owners, facility managers, tenants, building occupants | |
| [6] | Ta, RH, E, CO2, PM | Percent of measurement results within the compliance range in the last hour | Percentage based on specific weighting scheme | Perceptions or level of satisfaction with each IEQ factor | Data visualization and downloads | Web platform and mobile interface | Professionals and data analysts |
| Real-time and historical data of IEQ parameters, their ratings, overall IEQ and suggestions for users | Mobile interface | Building occupants | |||||
| [40] | Ta, RH, CO2, E, movement | Pleasantness, thermal comfort, sound level | Real-time temperature value of the selected sensor box, occupants’ pleasantness and thermal sensation votes | Compi app: web-based mobile app also accessible via a web browser | Office employees | ||
| [41] | ΔCO2, Ta, RH, Tm, Va, PMV, PPD, DR, DF, U0,surr, U0,back, Rsurr, Rback, Li,w, Li,s, T, STI, B, EF | Score attributed according to a predefined benchmark scale and weight | Score in a four-option range evaluation (−1, 0, 3, 5) | Indoor thermal comfort, indoor air quality, visual comfort, acoustic quality, electromagnetic pollution, overall level of environmental quality | Owner, manager, building customer | ||
| [46] | Ta, RH, SPL, E, CO2, TVOC, presence | Temperature, light, noise levels | Information about the room and real-time values of temperature, humidity and noise | Spacematch platform: web-based mobile application | Office employees | ||
| [49] | Ta, Tg, Tr, Va, RH, E, CO2, PM2.5, TVOC, SPL, pb | Integration of IEQ parameters through derivation of their weighting coefficients | Perception of IEQ evaluated using a paper-based survey | Single domain indexes and IEQ index displayed visually using gauges, real-time values of IEQ parameters and their graphical representation | User-friendly smartphone application | Building occupants | |
| [50] | Ta, ventilation rate, RH, E, DF, CO2, PM2.5, CH2O, benzene, radon, SPL | Green, yellow, orange, red color | Roman numerals from I (high quality level) to IV (low quality level) | Quality of the thermal environment, acoustic environment, indoor air, luminous environment and overall level of IEQ | |||
| [52] | Ta, Tr, Va, RH, E, CO2, SPL | Odors, ventilation, noises and sounds, shielding, lighting and thermal conditions | Thermal comfort, CO2, visual comfort and acoustic comfort of each workstation | Office occupants |
Disclaimer/Publisher’s Note: The statements, opinions and data contained in all publications are solely those of the individual author(s) and contributor(s) and not of MDPI and/or the editor(s). MDPI and/or the editor(s) disclaim responsibility for any injury to people or property resulting from any ideas, methods, instructions or products referred to in the content. |
© 2023 by the authors. Licensee MDPI, Basel, Switzerland. This article is an open access article distributed under the terms and conditions of the Creative Commons Attribution (CC BY) license (https://creativecommons.org/licenses/by/4.0/).
Share and Cite
Fissore, V.I.; Fasano, S.; Puglisi, G.E.; Shtrepi, L.; Astolfi, A. Indoor Environmental Quality and Comfort in Offices: A Review. Buildings 2023, 13, 2490. https://doi.org/10.3390/buildings13102490
Fissore VI, Fasano S, Puglisi GE, Shtrepi L, Astolfi A. Indoor Environmental Quality and Comfort in Offices: A Review. Buildings. 2023; 13(10):2490. https://doi.org/10.3390/buildings13102490
Chicago/Turabian StyleFissore, Virginia Isabella, Silvia Fasano, Giuseppina Emma Puglisi, Louena Shtrepi, and Arianna Astolfi. 2023. "Indoor Environmental Quality and Comfort in Offices: A Review" Buildings 13, no. 10: 2490. https://doi.org/10.3390/buildings13102490