Article

Determination of Climate-Based Daylight Metrics under 15 CIE (International Commission on Illumination) Standard Skies and Three Representative Skies

1
Building Energy Research Group, Department of Architecture and Civil Engineering, City University of Hong Kong, Hong Kong SAR, China
2
Shenzhen Pingshan District Key Area Constructing and Developing Centre, Shenzhen 518000, China
3
School of Civil Engineering, Guangzhou University, Guangzhou 511370, China
4
Department of Science, Hong Kong Metropolitan University, Hong Kong SAR, China
*
Author to whom correspondence should be addressed.
Buildings 2023, 13(10), 2523; https://doi.org/10.3390/buildings13102523
Submission received: 18 August 2023 / Revised: 22 September 2023 / Accepted: 1 October 2023 / Published: 5 October 2023
(This article belongs to the Section Building Energy, Physics, Environment, and Systems)

Abstract

:
Daylighting serves as a crucial sustainable strategy in assessing the built environment. Climate-based daylight metrics (CBDMs) have been widely employed to evaluate the dynamic performance of daylight. However, conventional CBDM calculations heavily rely on time-consuming full-scale computer simulations. In addition, the CBDMs need representative annual daylight data that are essential for CBDM analysis, and can pose challenges in many locations. Even when suitable daylight data are available, they may not accurately reflect current trends and conditions. This study aims to determine the various CBDMs using both the 15 CIE Standard Skies and the three representative skies specific to Hong Kong. All data were simulated from a software named RADIANCE (version 5.3). The R2s of the CBDMs under both the 15 CIE Standard Skies and the three representative skies were more than 0.89, and the MBEs and RMSEs were not more than 5.4% and 9.1%, respectively, when the outdoor illuminance measured in 2004 was employed. The findings could be adopted for other locations where the required daylight parameters were not systematically recorded.

1. Introduction

Daylighting is widely acknowledged as a valuable sustainable strategy [1] for promoting visual comfort and energy-efficient building designs [2,3]. Its benefits are especially significant in hot climates as it reduces electricity consumption not only for artificial lighting but also for air conditioning by minimizing heat dissipation from lighting fixtures [4,5]. Proper daylighting design means as much glare-free daylight as possible for indoor spaces, which enriches visual comfort and reduces electric lighting expenditure [6]. Architects and designers employ various rules of thumb and metrics to predict and assess daylighting performance. Recently, climate-based daylight metrics (CBDMs), such as different forms of daylight autonomy (DA) and useful daylight illuminance (UDI), have been adopted to provide information for daylight conditions on an annual and seasonal basis [7,8,9]. CBDMs deal with the daytime of real conditions and actual weather databases for a particular location to offer true daylight surroundings, which are apposite for judging visual performance, daylight glare, and daylight-linked lighting controls [10,11,12]. In order to have precise outcomes, full-scale dynamic simulations using sophisticated computer programs that conduct hour-by-hour calculations are frequently employed [13]. The process can be costly when modeling a building configuration with numerous calculation grids, leading to lengthy model preparation and simulation times [14,15], which may not be suitable during the early design stages when multiple building options and design plans need to be compared and evaluated. In addition, a typical year’s natural light dataset for simulation may not always be available for many sites. Having said that, the prevailing daylight variables are ready for use, although they may not represent the latest daylight climates and circumstances. For instance, the required schedules between 9 am and 3 pm for simulations under clear-sky days at equinox [16] may not be adequate to size a glazing area, particularly for overcast days.
In 2003, the International Commission on Illumination (CIE) established a set of 15 sky models (i.e., luminance distributions) [17], which serve as an appropriate overall framework for representing the likely range of skies worldwide. The models for many locations can be represented by a subset of three to four of these 15 models [18] called representative skies (RSs) [19]. In the case of Hong Kong, sky models 1, 8, and 13 are the three RSs corresponding to overcast, partly cloudy, and clear sky conditions, respectively [20]. While the sky conditions are inherently unpredictable, they can be categorized into different types based on the climatic parameters. There are many suitable climatic parameters for associating sky conditions with the CIE sky models [21]. This association enables the modeling of both the direct sunlight and the sky-diffuse component [22]. The 15 CIE sky models, including the RSs, are particularly useful in locations where measurements of skylight and direct sunlight are unavailable. This study aims to determine various CBDMs based on the frequency of occurrence (FOC) of individual CIE Standard Skies (CIESSs) and the three RSs specific to Hong Kong. The performance of the proposed approach was determined by the usual statistical indices. For universal applications, the suggested processes could be employed for other locations without the measured annual outdoor illuminance data.

2. Methodology

The initial step is to compute the hourly sky-diffuse illuminance (EHD) and direct sunlight (EHB) at a particular location under the 15 CIESSs for the whole year. Assuming that the sky type for the whole year is one of the CIESSs (e.g., Sky 1), the EHD and EHB at a given time can be estimated according to Equations (1) and (2) [22]
E H D = 133,800 × ε × E H D E v o h × sin α S ,
E H B = 133,800 × ε × e x p ( a V m T V ) × sin α S ,
where
  • αS is the altitude angle of the sun;
  • ε is eccentricity correction factor = 1 + 0.034 × cos (2π (J − 2)/365);
  • J is the number of a day within a year;
  • m is the relative optical air mass of the atmosphere = 1/(sin αS + 0.50572 × (αS + 6.07995°) −1.6364);
  • αV is the extinction coefficient of the ideally clean and dry atmosphere = 1/(9.9 + 0.043 × m);
  • TV is turbidity factor in the direction of solar beams;
  • and EHD/Evoh is the typical ratio of EHD and Evoh (extraterrestrial flux falling on the horizontal surface) [23].
The next stage is to estimate the typical values of EHD/Evoh and TV for each of the CIESSs. Table 1 summarizes such values for these two parameters, which were used to generate EHD and EHB for the simulation runs. The interior daylight illuminances were simulated using RADIANCE [24], which is widely regarded as one of the most effective lighting simulation tools available. RADIANCE was developed by the Building Technology Program of Lawrence Berkeley National Laboratory’s Environmental Energy Technology Division [25]. It offers numerous advantages, such as minimal limitations on geometry and the ability to simulate various materials. This software has been widely utilized by researchers for various applications. Sorooshnia, E. et al. used a RADIANCE engine to analyze the daylighting and luminous performance [26]. Falian Xie et al. imported the sky model, the data of the waiting hall, and environment in cold regions into Ladybug and RADIANCE, and simulated the natural lighting performance index [27]. Other researchers also used RADIANCE to analyze outdoor illuminance and solar radiation [28], daylighting performance assessment [29], and the evaluation of lighting and daylighting technologies [30,31]. In this study, version 5.3 of RADIANCE, developed at Lawrence Berkeley Laboratory and running on a Windows 10 workstation, was utilized for the analysis. The primary command used in RADIANCE for illuminance calculations is called “rtrace“, which traces specific rays into a scene. It reads the parameters of these rays from standard input and returns the corresponding light values as standard output. The simulation accuracy settings for rtrace are as follows: −ab = 3, −aa = 0.08, −ar = 256, −ad = 512, and −as = 256.
CBDMs such as DA, continuous DA (cDA), maximum DA (mDA), spatial DA (sDA), and UDI can be derived from the simulated daylight illuminances at different grid points (PDIs) for a specific sky type (e.g., CIE Sky 1) on an annual basis. The same simulation processes were repeated for the other individual CIE Standard Skies (e.g., Skies 2–15). Consequently, the results are the sum of the CBDMs for each sky type times the corresponding FOC. The DA under the 15 CIESSs and the RSs can be calculated with Equations (3) and (4). The same approach can also be employed for calculating cDA, mDA, sDA, and UDI.
D A = i 15 D A i × F O C i ,
D A = i 3 D A i × F O C i ,
The measured data consisting of horizontal global, diffuse, and direct illuminances, and sky luminance distributions from January to December in 2004 were utilized for identifying the sky types. The measurements were conducted at the City University of Hong Kong, with all sensors installed on the rooftop without any external obstructions. Further details about the measurement setup can be found in a previous publication [32]. For the analysis, the selected daytime working hours were from 8:00 to 16:00 in True Solar Time [33]. However, it is important to note that there were some periods of missing data due to various factors such as instrumentation malfunction, power failure, and damage to photometers. After undergoing a quality control test [34], a total of 17,637 sets of databases, measured at 10 min intervals in 2004, were included in this study for analysis.
The best-fitting sky luminance distributions approach [35] was applied in this study to reckon the FOC of the 15 CIESSs. Sky conditions belonging to the same category exhibit similar sky luminance distributions, along with corresponding climatic parameters and indices falling within certain ranges. Each of the CIESSs exhibits continuous variations in luminance according to the sun’s position, and these distribution patterns can be defined using simple mathematical expressions. Numerous global studies have reported that the standard skies are comprehensive enough to simulate skylight luminance distributions found in nature [36,37]. Figure 1a illustrates the FOC for the 15 CIESSs during the year 2004. It is evident that the majority of the sky conditions corresponded to Sky 8. Skies 1, 8, and 13 were identified as representative of overcast, intermediate, and clear skies in Hong Kong, accounting for 25%, 29%, and 16% of the entire year, respectively. Overcast skies are common in Hong Kong with a FOC of 42.3% (Skies 1–5). Apart from Sky 8 and 13, the FOCs of other cloudy and clear skies were less than 5%.
Skies can generally be categorized into clear, partly cloudy, and overcast conditions. In this study, the Classification Tree (C_Tree) algorithm [38] was utilized to classify the sky types into these three representative skies (RSs) using the measured data from 2004. Figure 1b illustrates the FOCs for Skies 1, 8, and 13, which correspond to overcast, partly cloudy, and clear sky conditions, respectively. According to the classification results, the FOCs are 38%, 39%, and 23% for Skies 1, 8, and 13, respectively.

3. Computer Simulation and Case Study

The case study model contains a simple rectangular room with a side window. The dimensions of the room are 6 m (W) × 5.4 m (L) × 3 m (H). Such a configuration is a common shoebox design, which is often used to simulate a simple open-plan office. The outcomes of this study can be generalized and applied to a variety of applications during the initial design phase. Furthermore, an irregular model (non-shoebox) is also adopted to demonstrate the proposed method. Both rooms have the same reflectance coefficients of 0.6, 0.5, and 0.2 for the ceiling, wall, and floor, respectively. A total of 81 and 66 reference points were arranged for the shoebox and non-shoebox rooms, respectively. These reference points were evenly spaced, with a distance of 0.6 m between them. The height of the reference points above the floor was set at 0.8 m. Figure 2 provides a visualization of the room layout and the locations of the reference points for the two rooms. The vertical window in the room was assumed to face the four cardinal orientations: North (N), East (E), South (S), and West (W).
High-rise buildings are becoming quite common in the most densely populated cities, and the distances between nearby buildings are always small [39]. This close proximity of buildings can result in external obstructions that significantly reduce the amount of daylight entering indoor spaces, particularly on the lower floors. On the contrary, rooms located on the top floors and facing unobstructed skies may experience excessive penetration of solar radiation and daylight, leading to issues such as thermal and visual glare, as well as an increased cooling load. Therefore, the obstructed angle (30°) and the overhang with 400 mm were selected to evaluate the initiated approach as presented in Table 2. The reflectance of obstruction and external ground is 0.2. To evaluate the effectiveness of the proposed method, a comparative study for two case studies based on the measured sky-diffuse illuminance and the direct sunlight in 2004 was also conducted via the RADIANCE simulation software.

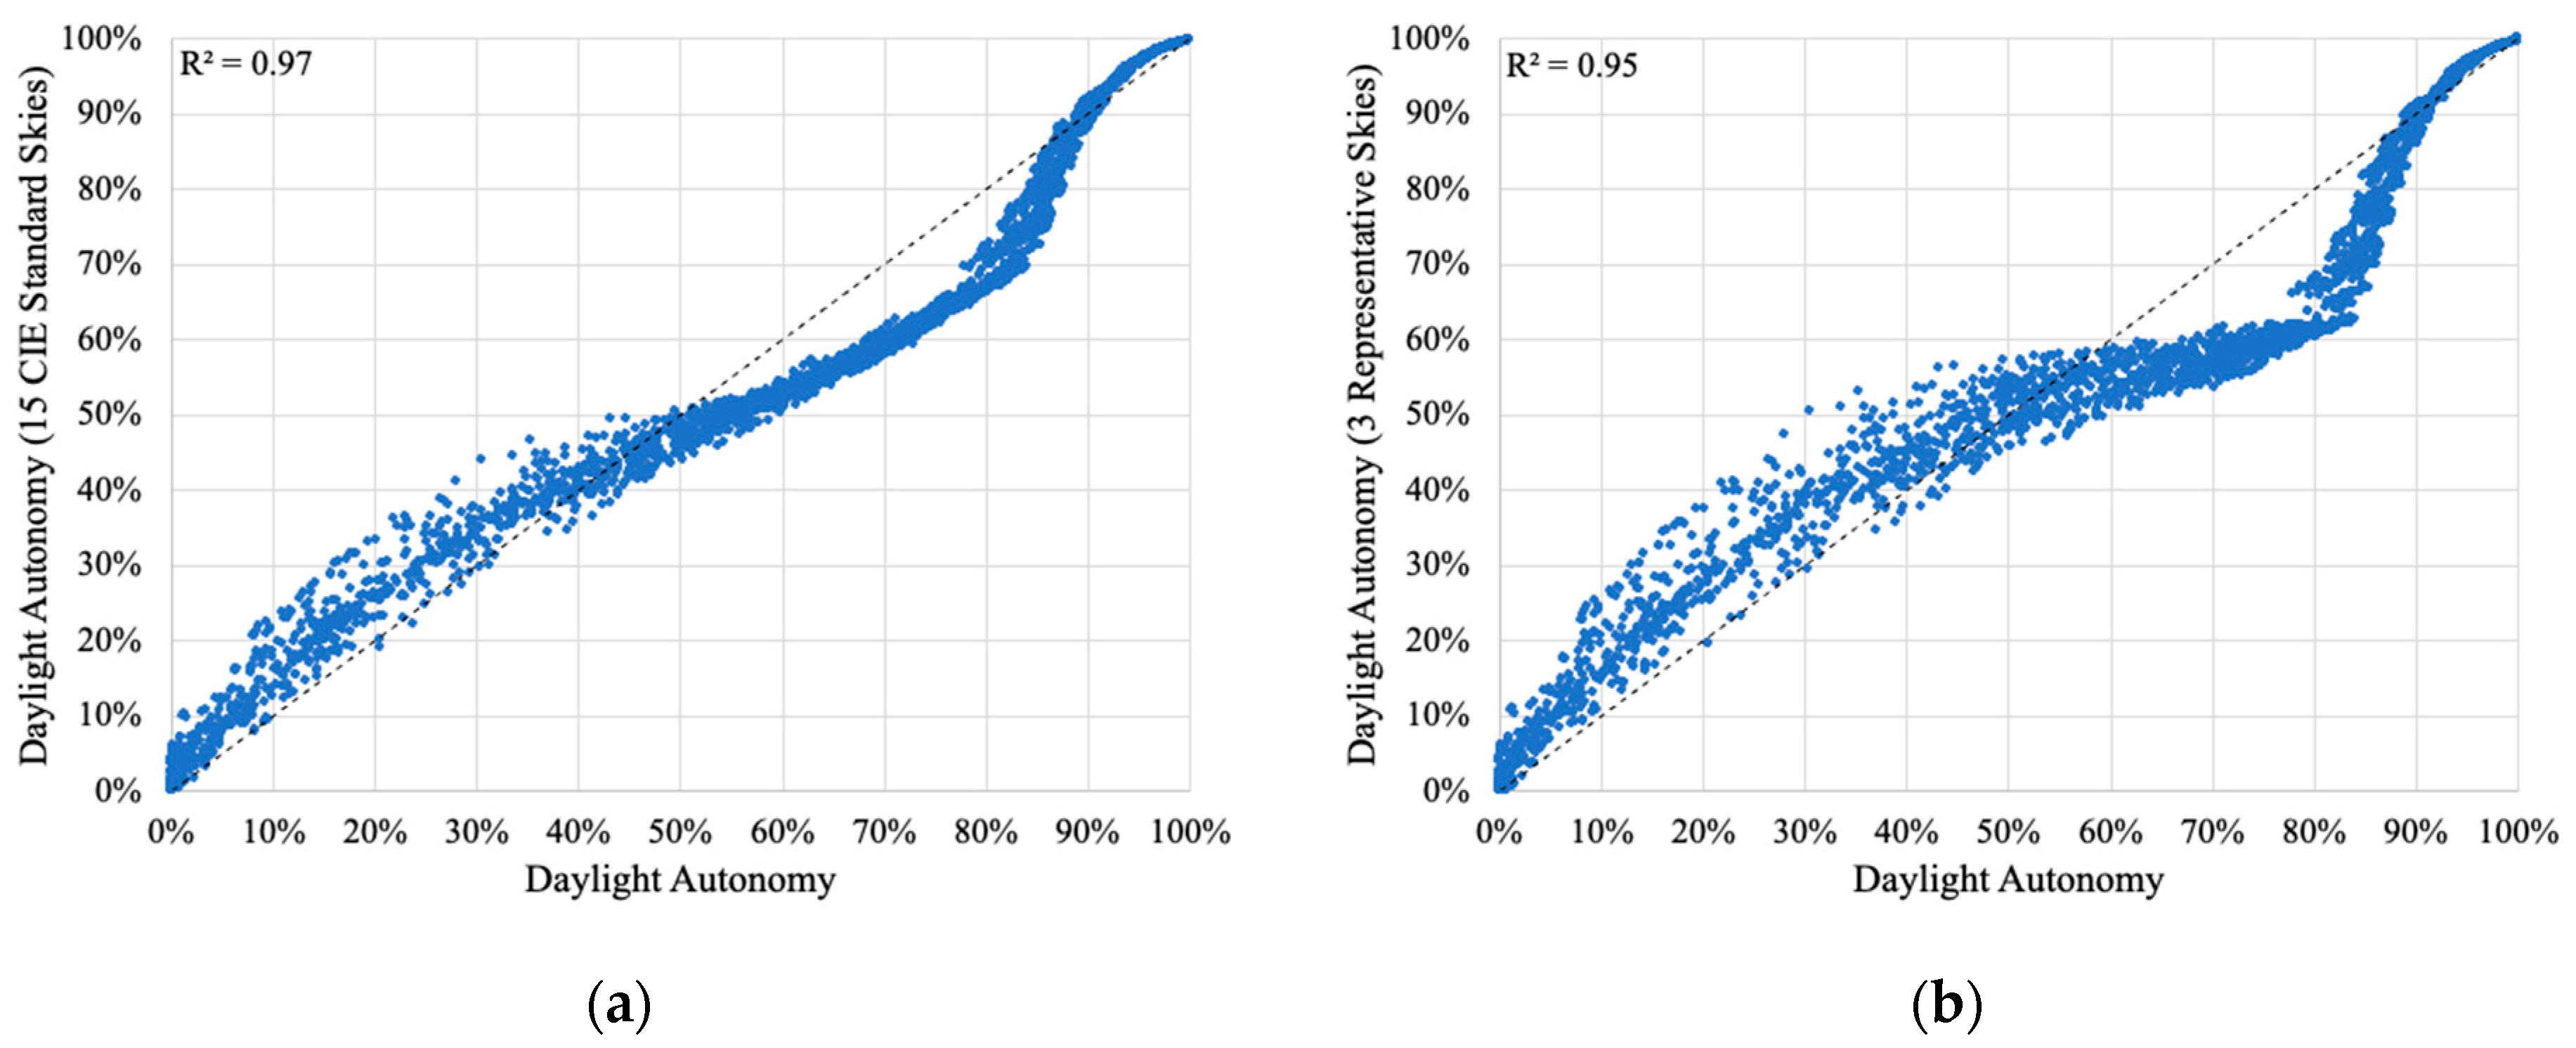
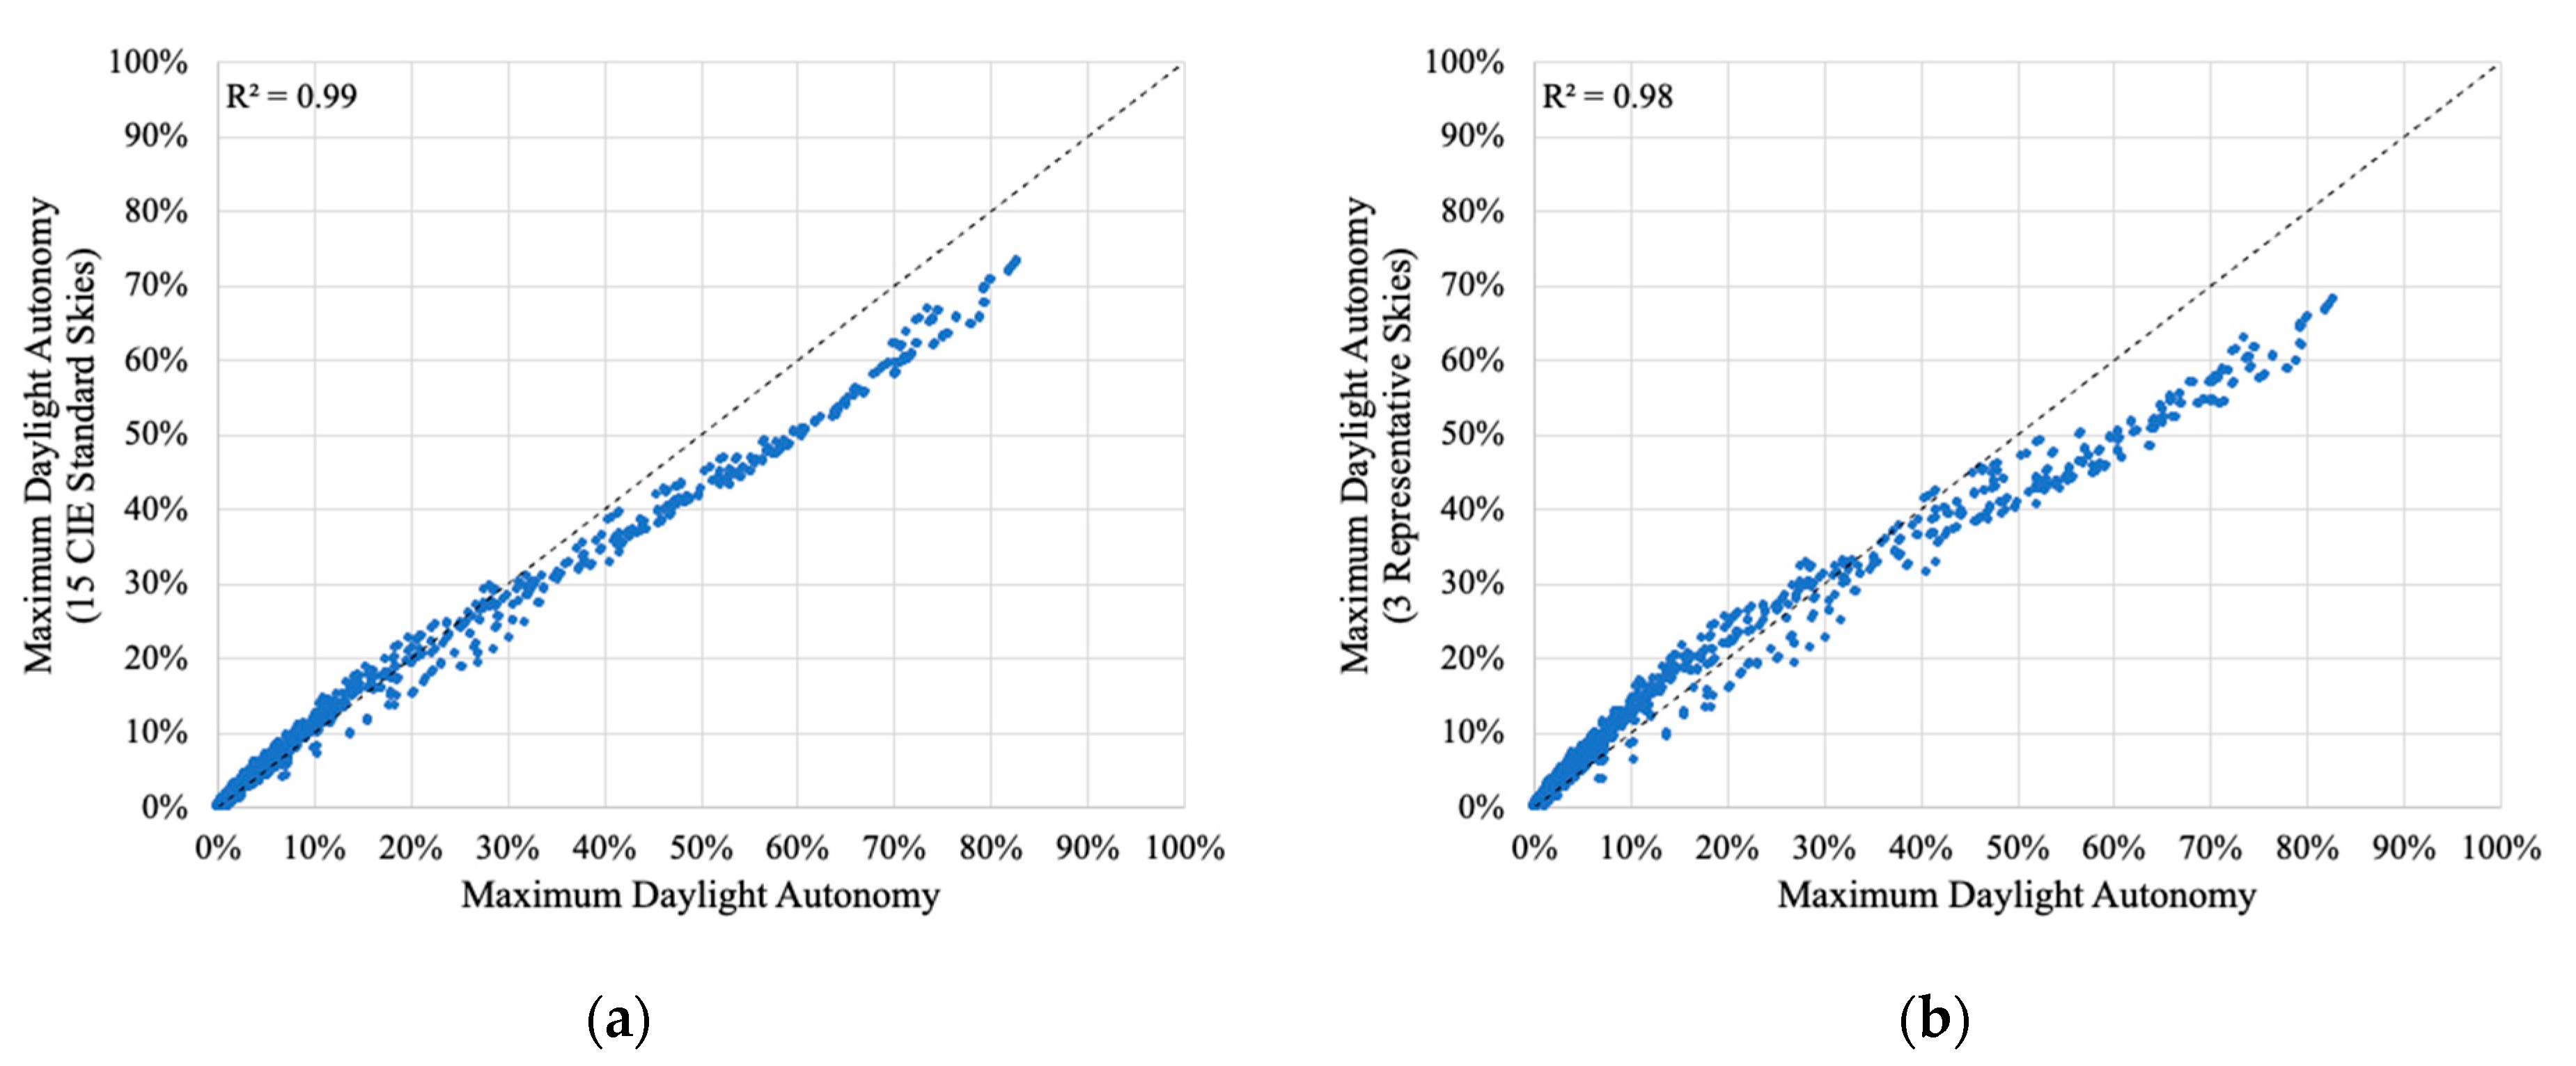
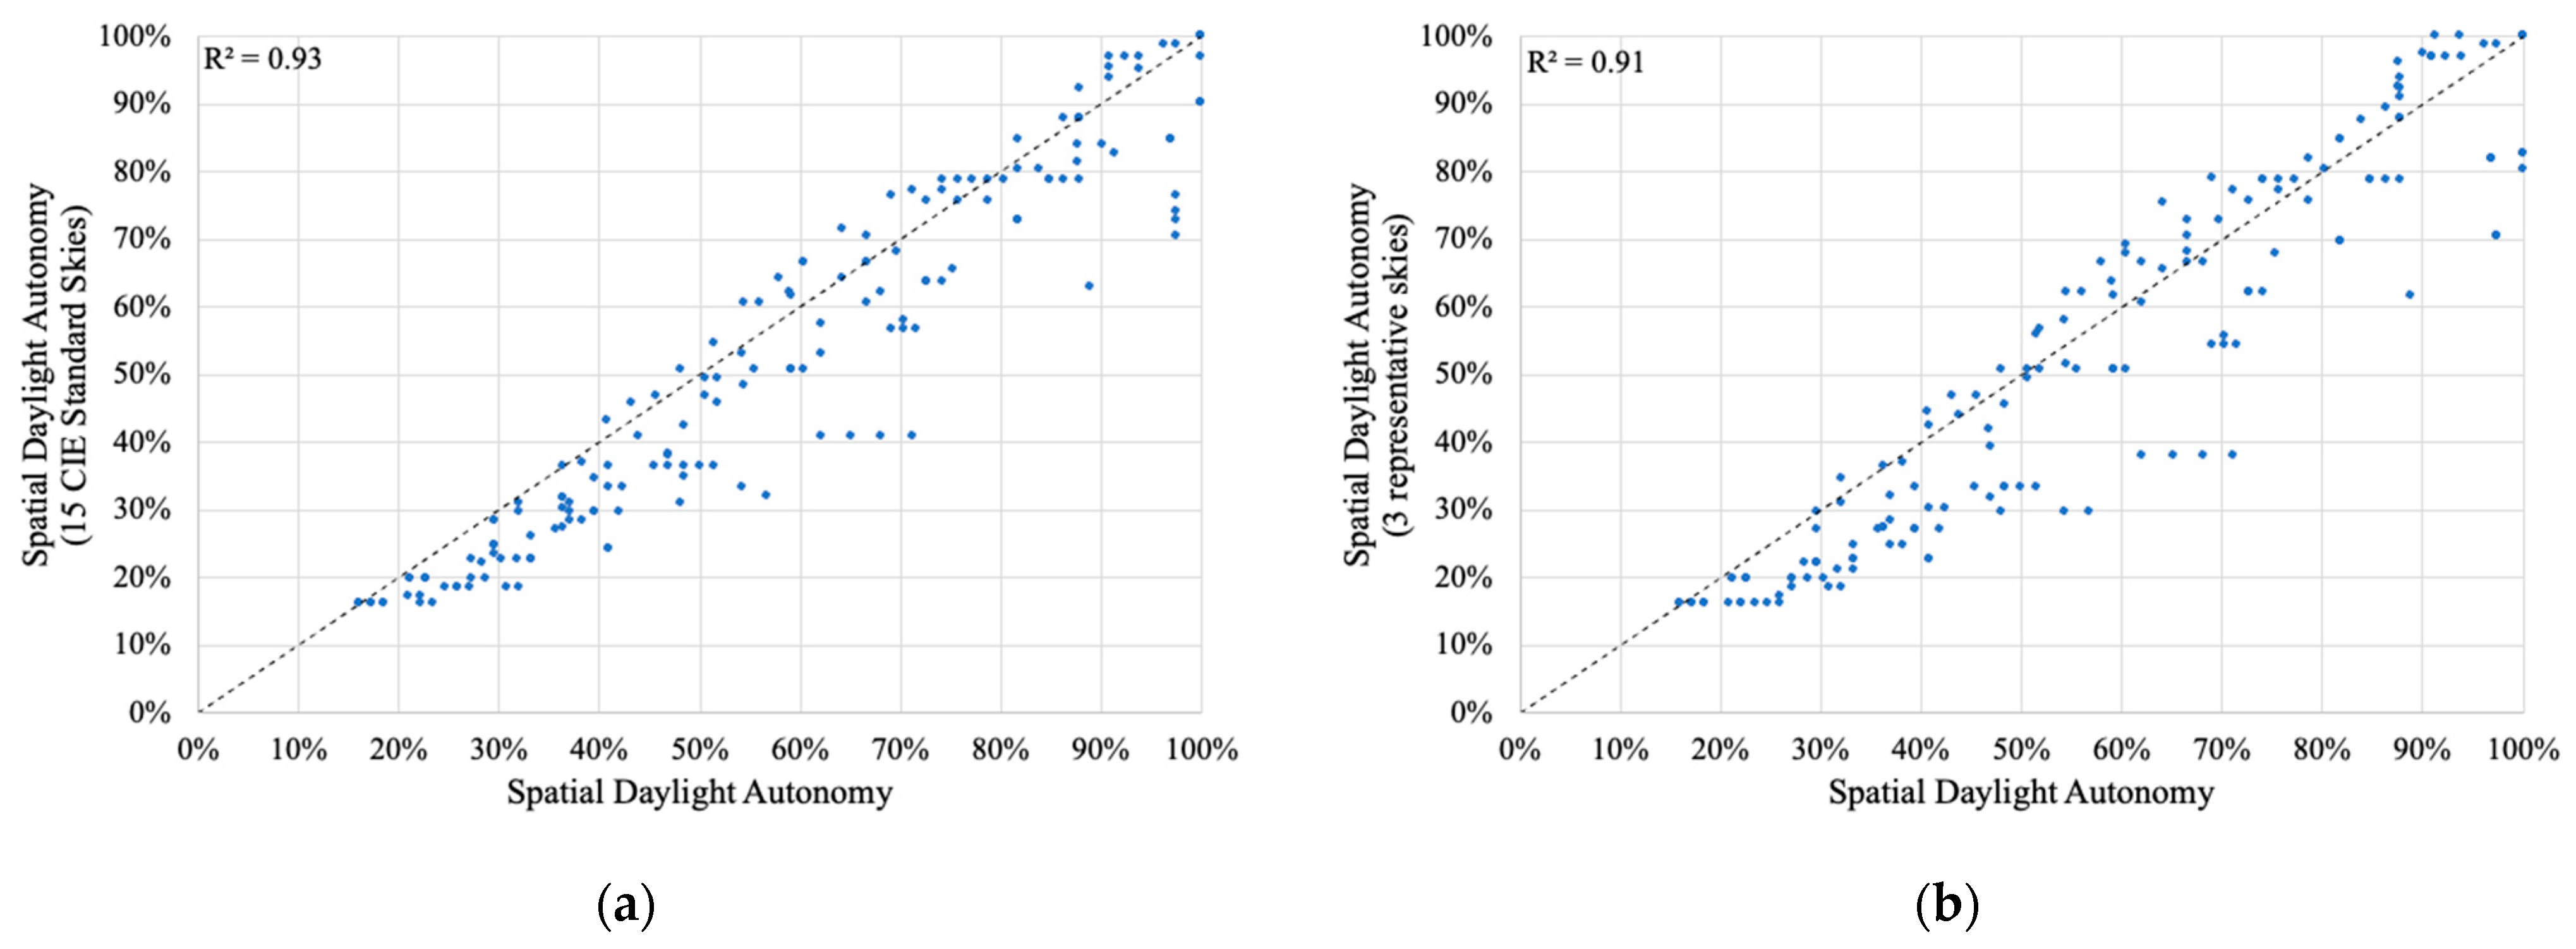
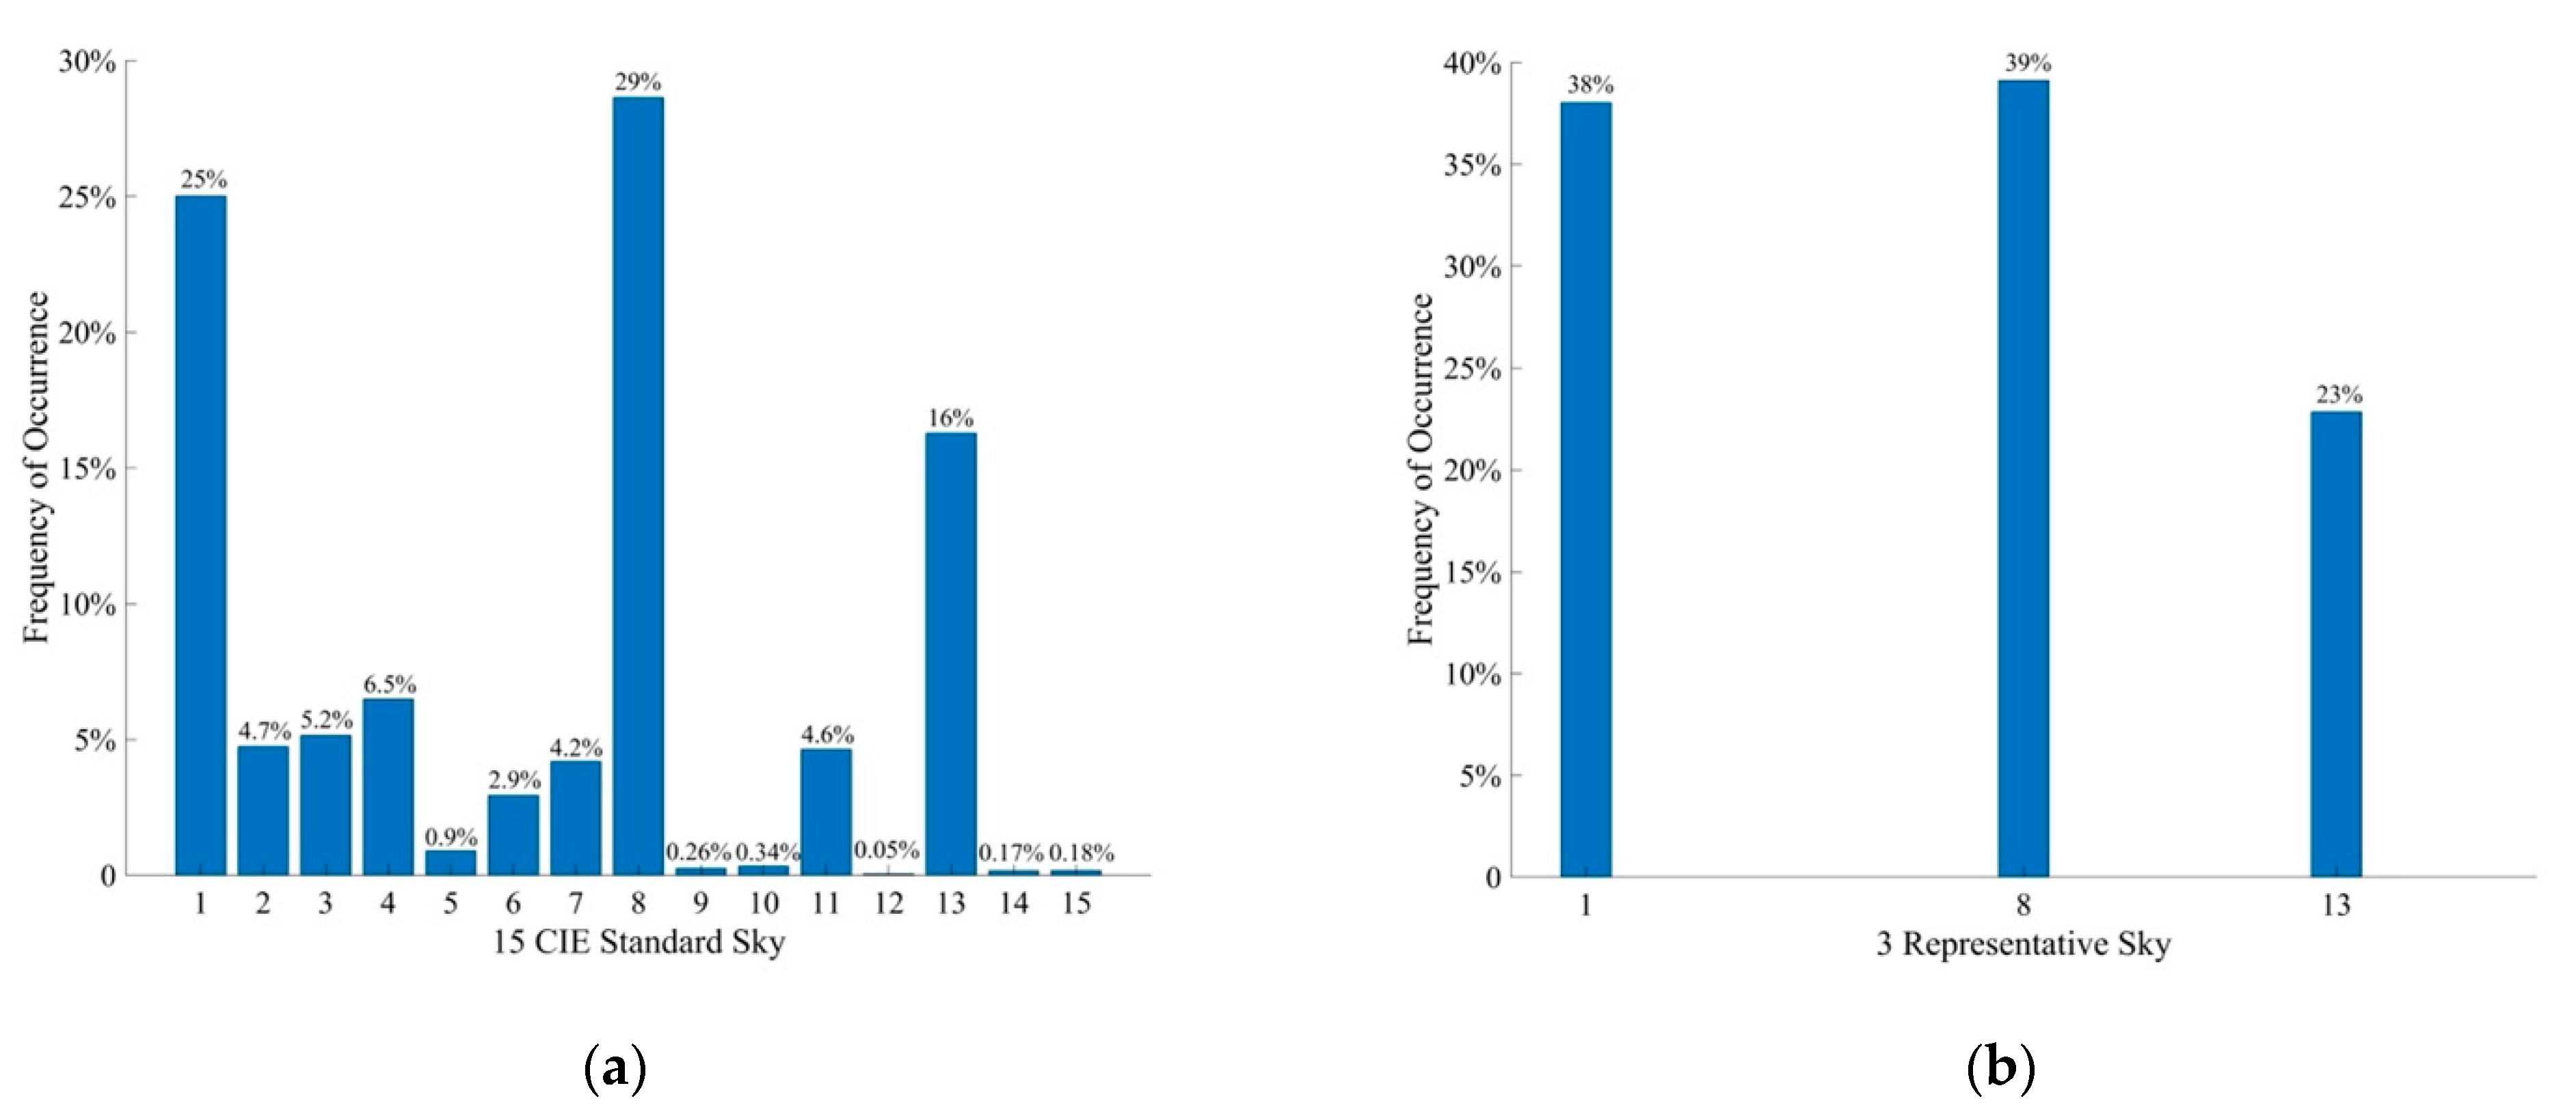
4. Analysis of Results

Accordingly, CBDMs containing DA, cDA, mDA, sDA, and UDI for both shoebox and non-shoebox rooms were computed under the sky-diffuse and direct sunlight measured in 2004 from the 15 CIESSs and three RSs. The correlations between the DA simulations based on measured daylight data in 2004 from the 15 CIESSs and three RSs are presented in Figure 3a,b, respectively. Similar plots for cDA are shown in Figure 4a,b. Three indoor illuminance thresholds (100, 300, and 500 lux) for DA and cDA were set. Since the daylight illuminance below the task lighting criterion is also included, coefficients of determination (R2) for all regression curves of cDA are greater than those of DA, especially under the three RSs. The values of R2 under the 15 CIESSs for both DA and cDA are more than 0.97, indicating very good agreements with those using measured daylight illuminance weather files. The values of R2 under the three RSs are close to the 15 CIESSs, showing that DA and cDA can be estimated based on Skies 1, 8, and 13 at the initial daylighting design stage. Daylighting is an important and effective strategy for reducing electricity consumption by utilizing natural light and switching off artificial lighting when the daylight levels exceed the target illuminance [40]. In well-daylit spaces where the available daylight exceeds the required level, daylighting can lead to significant energy savings when combined with appropriate daylight-linked lighting controls. DA and cDA can be used to predict energy savings resulting from standard daylight-linked switching and dimming lighting controls, respectively [41].
The mDA with 2000 and 3000 lux illuminance thresholds was simulated under the measured outdoor illuminance, the 15 CIESSs and the three RSs were analyzed, and the correlations are displayed in Figure 5. The linear trends using the proposed approach for mDA are evident. The R2s are quite high, ranging around 0.98, which denote that more than 98% of the mDA can be calculated with the suggested method.
The sDA of various occupied space areas, including 30%, 50%, 70%, and 80%, was analyzed using three different illuminance thresholds (100 lux, 300 lux, and 500 lux) in relation to the two sky classifications. Figure 6 shows the relationships between the sDA computed under measured daylight data in 2004 and the 15 CIESSs and three RSs. The data points in Figure 6 appear to be more scattered than those shown in Figure 5, but the R2s are still more than 0.91, showing that 91% of the sDA can be accurately estimated at the preliminary phase of the daylighting design process.
Likewise, the correlations for UDIs (100–2000 lux and 300–3000 lux) are presented in Figure 7. The R2 values range from 0.89 to 0.94. UDI and sDA are two important metrics to evaluate indoor daylight distribution and uniformity. The LEED v4.1 guidance manual [16] also adopted sDA 300 lux 50% and UDI 300–3000 lux to give credit points to green buildings. Many researchers applied these two metrics to evaluate the annual daylighting performance [27,42,43]. According to the proposed method, sDA and UDI could be easily achieved at the beginning of the design process without the need for comprehensive simulations or long-term measurements.
To assess the accuracy of the predicted values in relation to the simulated results, the mean bias error (MBE) and the root mean square error (RMSE) were calculated. These metrics are quantified using Equations (5) and (6), respectively,
M B E = 1 n i = 1 n ( y y i ) ,
R M S E = 1 n i = 1 n ( y i y ) 2
where y is the CBDM based on the modeled EHD and EHB under 15 CIESSs or three RSs; and yi is the CBDM based on the measured EHD and EHB in 2004.
As presented in Table 3, the MBEs of the CBDMs under 15 CIESSs and the three RSs range between −2% and 0.14% and between −2.3% and 5.3%, respectively. These values indicate that the proposed calculation procedures yield reliable findings and demonstrate good performance. Except for sDA and UDI, MBEs under the three RSs are close to those under the 15 CIESSs. The values of RMSEs for CBDMs under the 15 CIESSs are between 3% and 7.2%. The RMSEs are less than 9.4% under the three RSs indicating that the CBDMs could be well-predicted under RSs at the initial stage, which is particularly useful for places without long-term measured outdoor illuminance data.
To allow for global application and more help during the early design stage, the room parameters, particularly the obstruction angle, shading device, glazing area, and visual transmittance, are modified to obtain a wide range of point daylight factors (PDFs) and average daylight factors (ADFs) under traditional overcast sky conditions (i.e., Sky 1) [41]; and the 15 CIESSs weather files at a given location throughout the whole year should be generated. These daylight factor matrices (DMFs) are strongly related to a fraction of the visible sky and room parameters [44]. The simulation processes will be carried out using such building configurations and the 15 CIESSs as the weather files. Then, the dataset of CBDMs for various room designs in terms of ADFs and PDFs will be established. Accordingly, architects and building designers can determine the DFMs based on the initial room design scheme. Ultimately, the required CBDMs will be estimated if the FOC for individual CIESSs and RSs for that place are known. It means that full-scale lighting simulations are not required at the very beginning. Once the initial room designs for achieving daylight criteria have been confirmed, full-scale building simulations can be conducted to obtain precise outcomes including daylighting schemes and the energy consumption of various buildings.

5. Conclusions

The CBDMs, including DA, cDA, mDA, sDA, and UDI, were established under the 15 CIESSs and the three Hong Kong RSs. All data were obtained using the RADIANCE software. The simulated results of shoebox and non-shoebox rooms were analyzed for two cases: one with an overhang and the other with an obstructed angle. To classify the measured data from 2004 into the 15 CIESSs and the three RSs, the best-fitting sky luminance approach and the Classification Tree algorithm were employed, respectively. Generally, the R2s under the 15 CIESSs and the three Hong Kong RSs for various CBDMs are more than 0.89, indicating that CBDMs can be predicted under these two types of sky classification at the initial daylighting design phase. The MBEs and RMSEs of the CBDMs are not more than 5.4% and 9.1% under the 15 CIESSs and the three RSs, representatively. The findings indicate that the proposed method is independent of room shapes and can be widely adopted in various architectural and fenestration designs. The typical model depends on diffuse illuminance and direct sunlight which are either easily available or predictable using simple equations. The findings could be applied to places where daylight measurements are not conducted. The proposed approaches will be extended to other daylight climates in the near future.

Author Contributions

Conceptualization, methodology, D.H.W.L. and S.L. (Shuyang Li); software, S.L. (Shuyang Li) and W.C.; validation, W.C., E.K.W.T., and S.L. (Siwei Lou); data curation, S.L. (Shuyang Li) and Z.W.; writing—original draft preparation, S.L. (Shuyang Li); writing—review and editing, D.H.W.L. and S.L. (Shuyang Li); supervision, D.H.W.L.; funding acquisition, D.H.W.L. All authors have read and agreed to the published version of the manuscript.

Funding

This research was funded by a Strategic Research Grant from the City University of Hong Kong (project no. 7005673).

Data Availability Statement

Not applicable.

Acknowledgments

Zhenyu Wang was supported by a City University of Hong Kong Postgraduate Studentship.

Conflicts of Interest

The authors declare that they have no conflict of interest.

Nomenclature

αSAltitude angle of the sun, degree
αVExtinction coefficient of the ideally clean and dry atmosphere
εEccentricity correction factor
JThe number of a day within a year
mRelative optical air mass of the atmosphere
TVTurbidity factor in the direction of solar beams
EHBDirect sunlight, lux
EHDDiffuse illuminance on the unobstructed horizontal plane, lux
EvohExtraterrestrial flux falling on the horizontal surface, lux
Abbreviations
ADFAverage Daylight Factor
CBDMClimate-Based Daylight Metrics
cDAContinuous Daylight Autonomy
CIEInternational Commission on Illumination
CIESSsCIE Standard Skies
DADaylight Autonomy
DMFsDaylight Factor Matrices
FOCFrequency of Occurrence
LEEDLeadership in Energy and Environmental Design
MBEsMean bias error
mDAMaximum Daylight Autonomy
PDFPoint Daylight Factor
RMSEsRoot Mean Square Error
RSsRepresentative Skies
sDASpatial Daylight Autonomy
UDIUseful Daylight Illuminance

References

  1. Zarghami, E.; Fatourehchi, D.; Karamloo, M. Impact of Daylighting Design Strategies on Social Sustainability Through the Built Environment. Sustain. Dev. 2017, 25, 504–527. [Google Scholar] [CrossRef]
  2. Kwong, Q.J. Light level, visual comfort and lighting energy savings potential in a green-certified high-rise building. J. Build. Eng. 2020, 29, 101198. [Google Scholar] [CrossRef]
  3. Nasrollahzadeh, N. Comprehensive building envelope optimization: Improving energy, daylight, and thermal comfort performance of the dwelling unit. J. Build. Eng. 2021, 44, 103418. [Google Scholar] [CrossRef]
  4. Gago, E.J.; Muneer, T.; Knez, M.; Köster, H. Natural light controls and guides in buildings. Energy saving for electrical lighting, reduction of cooling load. Renew. Sustain. Energy Rev. 2015, 41, 1–13. [Google Scholar] [CrossRef]
  5. Asfour, O.S. A comparison between the daylighting and energy performance of courtyard and atrium buildings considering the hot climate of Saudi Arabia. J. Build. Eng. 2020, 30, 101299. [Google Scholar] [CrossRef]
  6. Acosta, I.; Campano, M.Á.; Molina, J.F. Window design in architecture: Analysis of energy savings for lighting and visual comfort in residential spaces. Appl. Energy 2016, 168, 493–506. [Google Scholar] [CrossRef]
  7. Munoz, C.M.; Esquivias, P.M.; Moreno, M.; Acosta, A.; Navarro, J. Climate-based daylighting analysis for the effects of location, orientation and obstruction. Light. Res. Technol. 2014, 46, 268–280. [Google Scholar] [CrossRef]
  8. Ruiz, A.; Campano, M.Á.; Acosta, I.; Luque, Ó. Partial Daylight Autonomy (DAp): A New Lighting Dynamic Metric to Optimize the Design of Windows for Seasonal Use Spaces. Appl. Sci. 2021, 11, 8228. [Google Scholar] [CrossRef]
  9. Zoure, A.N.; Genovese, P.V. Implementing natural ventilation and daylighting strategies for thermal comfort and energy efficiency in office buildings in Burkina Faso. Energy Rep. 2023, 9, 3319–3342. [Google Scholar] [CrossRef]
  10. Campano, M.Á.; Acosta, I.; Domínguez, S.; López-Lovillo, R. Dynamic analysis of office lighting smart controls management based on user requirements. Autom. Constr. 2022, 133, 104021. [Google Scholar] [CrossRef]
  11. Piraei, F.; Matusiak, B.; Lo Verso, V.R.M. Evaluation and Optimization of Daylighting in Heritage Buildings: A Case-Study at High Latitudes. Buildings 2022, 12, 2045. [Google Scholar] [CrossRef]
  12. Overen, O.K.; Meyer, E.L.; Makaka, G. Daylighting Assessment of a Heritage Place of Instruction and Office Building in Alice, South Africa. Buildings 2023, 13, 1932. [Google Scholar] [CrossRef]
  13. Tsagrassoulis, A.; Kontadakis, A.; Roetzel, A. Comparing climate based daylight modelling with daylight factor assessment–implications for architects. In Proceedings of the 49th International Conference of the Architectural Science Association, Melbourne, VIC, Australia, 1 January 2015. [Google Scholar]
  14. Pellegrino, A.; Cammarano, S.; Lo Verso, V.R.M.; Corrado, V. Impact of daylighting on total energy use in offices of varying architectural features in Italy: Results from a parametric study. Build. Environ. 2017, 113, 151–162. [Google Scholar] [CrossRef]
  15. Gibson, T.; Krarti, M. Analysis of End-Use Impact of Daylighting and Glare Controls for Private Office Spaces. Leukos 2014, 11, 61–87. [Google Scholar] [CrossRef]
  16. U.S. Green Building Coumcil. LEED v4.1_Building Design and Construction; U.S. Green Building Coumcil: Washington, DC, USA, 2021. [Google Scholar]
  17. CIE. Spatial Distribution of Daylight-CIE Standard General Sky; CIE General Bureau: Vienna, Austria, 2003. [Google Scholar]
  18. Tregenza, P.R. Standard skies for maritime climates. Light. Res. Technol. 1999, 31, 92–106. [Google Scholar] [CrossRef]
  19. Ho, J.C.K.; Ng, E.; Chan, P.W. Predicting the hourly Hong Kong representative sky from typical meteorological year data for dynamic daylighting simulation. Light. Res. Technol. 2015, 47, 730–739. [Google Scholar] [CrossRef]
  20. Ng, E.; Cheng, V.; Gadi, A.; Mu, J.; Lee, M.; Gadi, A. Defining standard skies for Hong Kong. Build. Environ. 2007, 42, 866–876. [Google Scholar] [CrossRef]
  21. Kittler, R.; Darula, S. Parametric definition of the daylight climate. Renew. Energy 2002, 26, 177–187. [Google Scholar] [CrossRef]
  22. Kittler, R.; Darula, S.; Perez, R. A Set of Standard Skies; Ploygrafia: Bratislava, Slovakia, 1998. [Google Scholar]
  23. CIE. Technical Report CIE Standard General Sky Guide; CIE Central Bureau: Vienna, Austria, 2014. [Google Scholar]
  24. Ward, G.L.; Shakespeare, R. Rendering with RADIANCE. The Art and Science of Lighting Visualization; Morgan Kaufmann: Los Altos, CA, USA, 1998. [Google Scholar]
  25. Radiance—Radsite. Lawrence Berkeley National Laboratory (LBNL) Building Technologies Department. Available online: https://www.radiance-online.org/ (accessed on 1 April 2023).
  26. Sorooshnia, E.; Rahnamayiezekavat, P.; Rashidi, M.; Sadeghi, M.; Samali, B. Passive Intelligent Kinetic External Dynamic Shade Design for Improving Indoor Comfort and Minimizing Energy Consumption. Buildings 2023, 13, 1090. [Google Scholar] [CrossRef]
  27. Xie, F.; Song, H.; Zhang, H. Research on Light Comfort of Waiting Hall of High-Speed Railway Station in Cold Region Based on Interpretable Machine Learning. Buildings 2023, 13, 1105. [Google Scholar] [CrossRef]
  28. He, Y.; Arens, E.; Li, N.; Wang, Z.; Zhang, H.; Yongga, A.; Yuan, C. Modeling solar radiation on a human body indoors by a novel mathematical model. Build. Environ. 2021, 187, 107421. [Google Scholar] [CrossRef]
  29. Tian, Z.; Lei, Y.; Jonsson, J.C. Daylight luminous environment with prismatic film glazing in deep depth manufacture buildings. Build. Simul. 2018, 12, 129–140. [Google Scholar] [CrossRef]
  30. Welle, B.; Haymaker, J.; Rogers, Z. ThermalOpt: A methodology for automated BIM-based multidisciplinary thermal simulation for use in optimization environments. Build. Simul. 2011, 4, 293–313. [Google Scholar] [CrossRef]
  31. Kim, C.-S.; Seo, K.-W. Integrated daylighting simulation into the architectural design process for museums. Build. Simul. 2012, 5, 325–336. [Google Scholar] [CrossRef]
  32. Li, D.H.W.; Tang, H.L. Standard skies classification in Hong Kong. J. Atmos. Sol. Terr. Phys. 2008, 70, 1222–1230. [Google Scholar] [CrossRef]
  33. IES. Approved Method: Spatial Daylight Autonomy and Annual Sunlight Exposure; IES: New York, NY, USA, 2012. [Google Scholar]
  34. Li, D.H.W.; Tang, H.L.; Lee, E.W.M.; Muneer, T. Classification of CIE standard skies using probabilistic neural networks. Int. J. Climatol. 2009, 30, 305–315. [Google Scholar] [CrossRef]
  35. Li, D.H.W.; Chau, T.C.; Wan, K.K.W. A review of the CIE general sky classification approaches. Renew. Sustain. Energy Rev. 2014, 31, 563–574. [Google Scholar] [CrossRef]
  36. Wittkopf, S.K.; Soon, L.K. Analysing sky luminance scans and predicting frequent sky patterns in Singapore. Light. Res. Technol. 2007, 39, 31–51. [Google Scholar] [CrossRef]
  37. Luo, T.; Yan, D.; Lin, R.; Zhao, J. Sky-luminance distribution in Beijing. Light. Res. Technol. 2014, 47, 349–359. [Google Scholar] [CrossRef]
  38. Lou, S.; Li, D.H.W.; Lam, J.C. CIE Standard Sky classification by accessible climatic indices. Renew. Energy 2017, 113, 347–356. [Google Scholar] [CrossRef]
  39. Wang, J.; Wei, M.; Ruan, X. Characterization of the acceptable daylight quality in typical residential buildings in Hong Kong. Build. Environ. 2020, 182, 107094. [Google Scholar] [CrossRef]
  40. Gibson, T.; Krarti, M. Comparative Analysis of Prediction Accuracy from Daylighting Simulation Tools. Leukos 2014, 11, 49–60. [Google Scholar] [CrossRef]
  41. Li, S.; Li, D.H.W.; Chen, W.; Lou, S.; Tsang, E.K.W. Simple mathematical models to link climate-based daylight metrics with daylight factor metrics and daylighting design implications. Heliyon 2023, 9, e15786. [Google Scholar] [CrossRef] [PubMed]
  42. Ma, J.; Yang, Q. Optimizing Annual Daylighting Performance for Atrium-Based Classrooms of Primary and Secondary Schools in Nanjing, China. Buildings 2022, 13, 11. [Google Scholar] [CrossRef]
  43. Jia, Y.; Liu, Z.; Fang, Y.; Zhang, H.; Zhao, C.; Cai, X. Effect of Interior Space and Window Geometry on Daylighting Performance for Terrace Classrooms of Universities in Severe Cold Regions: A Case Study of Shenyang, China. Buildings 2023, 13, 603. [Google Scholar] [CrossRef]
  44. Tregenza, P. Opinion: Climate-based daylight modelling or daylight factor? Light. Res. Technol. 2014, 46, 618. [Google Scholar] [CrossRef]
Figure 1. Frequency of occurrence of the (a) 15 CIE Standard Skies; (b) 3 representative skies in Hong Kong.
Buildings 13 02523 g001
Figure 2. Room layout and reference point arrangement for (a) shoebox room; (b) non-shoebox room.
Buildings 13 02523 g002
Figure 3. The DA against (a) DA 15 CIE Standard Skies; (b) DA 3 representative skies.
Buildings 13 02523 g003
Figure 4. The cDA against (a) cDA 15 CIE Standard Skies; (b) cDA 3 representative skies.
Buildings 13 02523 g004
Figure 5. The mDA against (a) mDA 15 CIE Standard Skies; (b) mDA 3 representative skies.
Buildings 13 02523 g005
Figure 6. The sDA against (a) sDA 15 CIE Standard Skies; (b) sDA 3 representative skies.
Buildings 13 02523 g006
Figure 7. The UDI against (a) UDI 15 CIE Standard Skies; (b) UDI 3 representative skies.
Buildings 13 02523 g007
Table 1. Typical TV and EHD/Evoh ratios on 15 Standard CIE Skies to be used in Equations (1) and (2) [23].
Sky No.Description of Luminance DistributionEHD/EvohTV
1CIE Standard Overcast Sky, steep luminance gradation towards zenith, azimuthal uniformity0.10
2Overcast, with steep luminance gradation and slight brightening toward the sun0.10
3Overcast, moderately gradated with azimuthal uniformity0.15
4Overcast, moderately gradated, and slight brightening toward the sun0.20
5Sky of uniform luminance0.22
6Partly cloudy sky, no gradation towards zenith, slight brightening toward the sun0.38 *
0.35 #
7Partly cloudy sky, no gradation towards zenith, brighter circumsolar region0.39 *
0.40 #
12
8Partly cloudy sky, no gradation towards zenith, distinct solar corona0.38 *
0.35 #
10
9Partly cloudy, with the obscured sun0.32 *
0.35 #
12
10Partly cloudy, with brighter circumsolar region0.28 *
0.30 #
10
11White-blue sky, with distinct solar corona0.26 *
0.30 #
4
12CIE Standard Clear Sky, low luminance turbidity0.25 *
0.30 #
2.5
13CIE Standard Clear Sky, polluted atmosphere0.26 *
0.30 #
4.5
14Cloudless turbid sky, with broad solar corona0.28 *
0.30 #
5
15White-blue turbid sky, with broad solar corona0.28 *
0.30 #
4
* Sunny situations, # sun shaded situations.
Table 2. Two case studies.
CasesWindow Area (m2)Window TransmittanceObstruction AngleShading Device
160.630°0
260.60Overhang 400 mm
Table 3. MBEs and RMSEs of CBDMs.
Climate-Based Daylight Metrics15 CIE Standard Skies3 Representative Skies
MBEsDaylight autonomy−2%−2.2%
Continuous daylight autonomy−1.9%−2.3%
Maximum daylight autonomy−0.9%−0.6%
Spatial daylight autonomy0.14%5.3%
Useful daylight illuminance−1.6%−2.3%
RMSEsDaylight autonomy6.2%8.1%
Continuous daylight autonomy3.3%4.3%
Maximum daylight autonomy3%3.7%
Spatial daylight autonomy3.4%9.0%
Useful daylight illuminance7.2%9.4%
Disclaimer/Publisher’s Note: The statements, opinions and data contained in all publications are solely those of the individual author(s) and contributor(s) and not of MDPI and/or the editor(s). MDPI and/or the editor(s) disclaim responsibility for any injury to people or property resulting from any ideas, methods, instructions or products referred to in the content.

