Article

Assessing the Potential for Developing Innovation Districts at the City Scale by Adapting a New Sustainable Entrepreneurial Ecosystems Method

1
College of Architecture and Urban Planning, Qingdao University of Technology, Qingdao 266033, China
2
Shandong Engineering Research Center of City Information Modeling, Qingdao 266033, China
3
School of International Affairs and Public Administration, Ocean University of China, Qingdao 266100, China
*
Author to whom correspondence should be addressed.
Buildings 2023, 13(10), 2572; https://doi.org/10.3390/buildings13102572
Submission received: 9 September 2023 / Revised: 3 October 2023 / Accepted: 10 October 2023 / Published: 12 October 2023
(This article belongs to the Section Architectural Design, Urban Science, and Real Estate)

Abstract

:
Excellent previous case studies of innovation districts have provided a foundation for the integration of innovation and urban development. However, few researchers have evaluated the potential for developing innovation districts in inner city spaces. In this study, taking Qingdao as an example, the adaptive cycle theory was combined with entrepreneurial ecosystem theory to form a sustainable entrepreneurial ecosystem (SEE) framework, including the three criteria of conditions, outputs, and outcomes. This framework allows for the effective identification of key factors and areas within cities that influence the development of innovation districts. The results showed that the potential for developing innovation districts showed a concentric trend, i.e., higher in the downtown, highest in the suburbs, and lowest in the outer suburbs. Comparative analysis revealed that innovation sources were a key factor in the development of Qingdao’s innovation districts. In terms of cluster analysis, the northern and southwestern clusters in the suburbs were in the conservation (K) phase, and the eastern and downtown clusters were in the exploitation (r), suggesting that the former was the preferred location for innovation districts. This study facilitates the establishment of site-specific innovation districts at key locations to enhance the success of decision making.

1. Introduction

Globally, over the last two decades, knowledge and innovation have replaced natural resources and physical labor production as the main sources of wealth creation and economic growth [1,2]. In the context of the innovation economy, the development paradigm of knowledge-based urban development (KBUD) is an effective strategy to revitalize old districts, create jobs, and promote sustainable economic development [3]. As the nexus of KBUD, innovation districts are a new land use type and are becoming prominent in the development policies and plans applied in many cities across the world [4]. However, developing innovation districts is a high-risk investment; therefore, it is necessary to conduct a holistic assessment of the potential for developing innovation districts to enable stakeholders to make sound decisions in the planning, development, and management of innovation districts [5].
Innovation spaces, as carriers of urban innovation and entrepreneurship, play an increasingly significant role in driving urban development. In essence, the innovation district is a form of organizational model for innovation spaces, characterized by the aggregation of innovation and entrepreneurial entities (such as enterprises and talent) and foundational elements (including research institutions, schools, business incubators, service providers, etc.), forming a comprehensive urban development zone [6,7,8]. Although it is a relatively new concept, it derives from established theories, and related studies have drawn on industrial cluster theory [9], industrial park theory [10], and innovation environment theory [11]. For the assessment of innovation space, most of the previous studies focused on the city or regional level. For example, Yigitcanlar proposed a KBUD assessment model (KBUD/AM) to benchmark 11 emerging knowledge cities around the world in terms of economic, social, spatial, and institutional development [12]. Considering that innovation districts are clusters of knowledge- and innovation-oriented activities, recent studies on innovation spaces or innovation districts have increasingly focused on the investigation of place attributes to attract sustained investments and human assets in urban localities [13,14]. The proposal of various assessment frameworks for innovation districts follows this trend [15]. While the traditional assessment framework is simply an accumulation of many innovative elements, the innovation district assessment framework focuses on the interaction between the internal and external environment of the system from the perspective of an open system to achieve its own sustainable development [16].
In terms of the potential of innovation districts, researchers have provided qualitative and theoretical frameworks to understand the place quality and performance characteristics of innovation districts. For example, Esmaeilpoorarabi et al., proposed an evaluation framework comprising a set of indicators derived from three spatial scales (i.e., regional, city, cluster) for assessing the place quality of innovation districts [17]. Rapetti et al., designed a framework of indicators in the four spheres to measure the maturity of innovation districts [18]. In terms of evaluation methods, previous studies mainly classified innovation districts through qualitative means. Yigitcanlar et al., pointed to a holistic approach for the performance classification of innovation districts through three key factors: (a) function, (b) feature, and (c) space use [19]. Based on this, Adu-McVie et al., proposed a case study matrix in terms of form, function, and features to classify the performance of the sample innovation districts in southeast Queensland [20]. Rapetti et al., presented key performance indicators (KPIs) that can be used to track and monitor the progress of an innovation district in distinct phases of development towards the achievement of its goals [21]. In terms of evaluation scales, past studies mainly selected specific and bounded spatial areas. Pique et al., examined the changing role and importance of triple helix agents in the inception, launch, growth, and maturity phases of Silicon Valley [22]. Davidson et al., used Melbourne’s Innovation District (MID) as an example to explore how transformative innovation policies in the MID can enable it to meet wider social and environmental needs [23]. However, these studies only concentrated on limited aspects of innovation districts and cannot explain their long-term development mechanism. More importantly, contemporary innovation districts are becoming open systems with mixed uses and blurred boundaries [24,25]. The traditional spatial pattern of high-tech zones or industrial parks can hardly explain the innovative development pattern of the whole city. In conclusion, we still need a method that assesses not only the innovation district of a specific region but also the entire urban space, with the innovation district as the target.
Research on the impact of ecosystems on firms and entrepreneurs emerged as the competition among firms changed innovation activities from mechanical to organic [26]. Moore J. first introduced the term “ecosystem” in the context of competition dynamics and saw the company as a member of a cross-industry business ecosystem [27]. With the growing integration of entrepreneurship and regional development, it has become increasingly important to consider elements in an integrated manner. In response to this need, the concept of the entrepreneurial ecosystem (EE) emerged [28,29,30]. EE is a system of interdependent actors and components in the region to support start-ups [31,32], which has the major characteristics of modularity, connectedness, and non-linearity [33,34,35]. In innovation theory, innovation and entrepreneurship are mutually reinforcing relationships [36], which leads to many similarities between entrepreneurial ecosystems and innovation districts. Together with the fact that ecosystems do not emphasize scale but structure [37], all these advantages make the entrepreneurial ecosystem theory a more universal perspective for examining the development mechanisms of innovation districts at the city scale, which in turn can contribute to the success of innovation districts.
As a rather young and hot issue, entrepreneurial ecosystems (EEs) have received attention from scholars in other fields and have been used to study how urban and regional environments affect innovative and entrepreneurial activity [38]. EEs describe a set of interdependent actors and factors that enable productive entrepreneurship through coordination, including the three dimensions of conditions, outputs, and outcomes [39]. The conditions layer consists of EE elements, such as physical infrastructure, formal institutions, and culture, which influence how actors in EEs connect with each other [40], while the outputs layer is considered an entrepreneurial activity, i.e., it is the process by which individuals create opportunities for innovation [41]. As for the outcomes layer, it means innovations that will ultimately create new value for social development [42]. With the maturity of entrepreneurial ecosystem theory, it has been applied to explore sustainable innovation in cities, and related research includes two main aspects. Firstly, some scholars have used the EE Index to evaluate the innovative and entrepreneurial capacity of regions [43,44]. Secondly, a wide range of studies have focused on the dynamics of EEs, examining the key factors that drive their sustainability, such as resources, interactions, and governance logic [45,46]. Furthermore, the helix innovation model, evolved from EEs, provides a unique approach to studying sustainable innovation and entrepreneurship in open ecosystems [47].
Identification and assessment of urban spaces for developing innovation districts are important for the integration of innovation and urban development. Chinese scholars have introduced entrepreneurial ecosystem theory to study the innovation district mechanism and constructed a three-dimensional elemental ecosystem [48], which laid an important foundation for assessing the potential of urban areas to become innovation districts. Nevertheless, their research framework remains static and does not reflect the processual nature of innovation activities or highlight the dynamic nature of EEs. Moreover, it does not help to identify the area most in need of intervention and policy and investment decisions regarding the development of the type of innovation districts with the most site-specific characteristics. In this study, the EE is considered an important tool for creating a resilient economy based on entrepreneurial innovation. Consistent with the usage in past studies [49], adaptive cycle theory can be applied to form a sustainable entrepreneurial ecosystem (SEE) framework, which explains the complex evolution of innovation districts and includes four phases, i.e., exploitation (ϒ), conservation (K), release (Ω), and reorganization (α). In addition, clusters co-evolve with related communities in the same ecosystem, which could explain why similar clusters in different regions evolve differently. Therefore, the combination of the two theories enables us to dynamically investigate the potential for developing innovation districts at the city scale and, more importantly, to identify key factors and areas to promote their rational development.
This paper combined entrepreneurial ecosystem theory and adaptive cycle theory to develop a new SEE method to evaluate the potential for developing innovation districts at the city scale and identify key factors and areas for rational development. Firstly, taking Qingdao, a representative city in northern China, as an example, an evaluation index system based on three criteria of condition–output–outcome was constructed to evaluate the potential of urban interior space for developing innovation districts. Secondly, the coupled coordination degree model was used to calculate the potential of each spatial unit, and the spatial units were classified according to the differences in results between the three criteria layers. Thirdly, spatial clustering analysis of subdistrict potential was performed using exploratory spatial data analysis (ESDA) to identify high-value clustering areas as the main clusters for analysis, and the evolutionary stages of clusters were described by combining the characteristics of the results of 3-D criteria layer with the adaptive cycle framework. Finally, this paper discussed the advantages of the newly developed method and provided suggestions for the future development of Qingdao City.

2. Conceptual Framework

Innovation districts are a product of the progress of the times, with the transformation of innovation as an important basis and characterized by their diversity and openness [50]. With the popularity and application of new technologies such as the Internet, artificial intelligence, robotics, virtual reality, and the Internet of things, small teams and individuals are increasingly valued in the marketplace, and the strict hierarchical system of the past is gradually changing into a flat network organization model [51]. Under the trend of innovation transformation, innovation is no longer dominated by large enterprises, state-owned enterprises, and scientific research institutions in universities. Instead, innovation development is mainly led by innovative enterprises and innovative talents under market forces [52]. Meanwhile, the relationship between talent and enterprise choice has changed, realizing the transformation from talent following enterprise to enterprise following talent. From the cultural atmosphere of the city to the office environment of the company, they all have an impact on the location selection of a business [53,54]. More importantly, there is a growing interest in how to form an ecosystem of innovation in a certain region [55]. Entrepreneurial ecosystem (EE) as a systemic theory provides a holistic approach to understanding the behavior of innovative actors and their interaction with the external environment.
From an innovation district perspective, the “entrepreneurial” aspect highlights the openness, agglomeration, and diversity of urban spaces that provide opportunities for innovation [56]. The term “ecosystem” reveals the networked nature of innovation and entrepreneurship, which involves connections not only among actors but also between actors and contexts. In this system, innovative and entrepreneurial actors are not only dependent on the local economy but are also closely related to the local market, human resources, capital, culture, and infrastructural support [57]. This interaction mechanism is deeply rooted in the three layers of the EE (i.e., conditions, outputs, and outcomes) and is a key aspect in the evaluation of urban spaces when considering the long-term development of innovation districts. Specifically, the conditions layer represents the attributes of spatial units, while the outputs layer represents the productivity resulting from the attributes of spatial units. Spatial units with different attributes and productivity may reflect differently under external decision-making interventions, showing varying innovative capabilities. The outcomes layer refers to the innovations of spatial units. It assesses the ability of spatial units to translate innovation capabilities into innovation outcomes and the potential to contribute to economic development through innovation. According to the entrepreneurial ecosystem theory, the established pro-entrepreneurship conditions can enhance spatial productivity, thus promoting innovation and activating the economy [58]. The presence of this positive feedback loop is a crucial factor in ensuring the continuous development and growth of innovation districts. As a result, a three-dimensional (3-D) framework containing “conditions”, “outputs”, and “outcomes” criteria can be used to assess the potential of urban spaces to develop innovation districts corresponding to the attributes, productivity, and innovations of spatial units, respectively.
The framework focuses on the interaction between actors and between actors and contexts, which articulates the mechanisms by which innovation districts operate as an integrated system from emergence to development. However, as a complex ecosystem, innovation districts are constantly evolving and developing [59]. The proposed framework based on the EE remains static and cannot explain the specific changes that occur in the evolution of innovation districts. Adaptive cycle theory, which suggests that a dynamic system goes through four phases of exploitation (ϒ), conservation (K), release (Ω), and reorganization (α) [60], explains the evolution of entrepreneurial ecosystems in the face of external perturbations and, as a result, develops a dynamic SEE framework. Similarly, in the face of risk disruptions, innovation districts also exhibit adaptability and dynamism and evolve from their birth to self-renewal [61]. In the exploitation phase (ϒ), as new business activities continue to emerge within the system, a new opportunity space is defined. Pioneers and opportunists who prioritize acquiring newly released energy and resources will be the first to leap into innovative and entrepreneurial action, increasing the overall diversity of the ecosystem. The flow of personnel and mergers between enterprises will establish new system-level standards and make innovative activities more specialized. In this situation, the ecosystem becomes increasingly dense and performs economic activities across scales, and it correspondingly comes to the conservation phase (K). During this phase, the dense and hierarchical network makes the ecosystem less flexible and more vulnerable to external disturbances. Some strong stochastic shocks, such as government regulation and market fluctuations, can significantly disrupt many networks within the structure and release abundant energy into the environment; this is the release (Ω) phase. In the subsequent reorganization (α) phase, actors will once again seek opportunities in such disturbances and begin to establish a new order in the ecosystem.
Based on the above analysis, this paper first constructed an SEE assessment framework to quantitatively evaluate the ability of urban spatial units to support the development of innovation districts (Figure 1). Secondly, for the innovation district areas obtained from the cluster analysis, it identified the development phases and maturity of Qingdao’s main innovation district clusters. Finally, practical suggestions were provided for the planning and development of innovation districts in Qingdao at both temporal and spatial levels, with the aim of fostering an ecosystem that encourages diversity and innovative activities, enhances cooperation among different actors, and increases the resilience of innovation districts to potential risks and uncertainties.

3. Materials and Methods

3.1. Study Area and Data Sources

Qingdao is located at the southern tip of the Shandong Peninsula, on the east of Jiaozhou Bay, and covers a total area of 11,293 km2. Qingdao City consists of 10 administrative subdivisions, which include 7 districts (Shibei, Shinnan, Laoshan, Huangdao, Licang, Jimo, and Chengyang districts) and 3 county-level cities (Laixi, Pingdu, and Jiaozhou cities) (Figure 2). Qingdao City is the central city on China’s coast that has played a leading role in the region’s development and which had, at the end of 2021, a resident population of nearly 10.25 million and an urbanization rate of 77.17%. Along with the rapid socioeconomic development, the rise in the tertiary industry, especially the high-tech industry, has led to a substantial increase in the city’s innovation capacity in recent years. In 2022, it ranked 10th on a list of the country’s 78 most innovative cities and was the only city from the country’s north to feature in the “first tier” of science and innovation cities. As a representative city of national reform and development, Qingdao is currently undergoing a process of integrating innovation and urban development. Research on the potential of developing innovation districts in Qingdao can be an important reference for guiding China’s innovation-driven development.
This paper took 108 subdistricts within the administrative area of Qingdao as the evaluation unit. The data came from 3 sources: (1) Basic map: Qingdao’s Vector Administrative Boundary (1:5000) was from the Qingdao Bureau of Surveying and Mapping; Qingdao’s Land Use Status Vector Data were from the Qingdao Bureau of Land Resources and Planning. (2) Innovation and entrepreneurship data: Invention patent data were from the State Intellectual Property Office (https://www.cnipa.gov.cn/, accessed on 10 August 2023); technology talent and enterprise data were from the Qingdao Bureau of Science and Technology. Among them, the enterprises and institutions involved in this paper were from the official certified list provided by the Qingdao Bureau of Science and Technology, including 335 innovation platforms, 6306 small and medium-sized enterprises (SMEs), 10 science and technology parks, 119 enterprise incubators, and 101 maker spaces. (3) City POI data: This paper used a Python crawler to obtain Qingdao’s POI data from Baidu Map API (https://lbsyun.baidu.com/products/location, accessed on 10 August 2023), including POI data names, addresses, latitudes and longitudes, category codes, etc. of parks, schools, leisure and entertainment venues, shopping malls, etc. The obtained POI data were spatially matched and projected through ArcGIS 10.7 to remove invalid and duplicate information, and finally, the valid POI data required in this paper were screened out.

3.2. Methods

3.2.1. Indicator System

Based on the SEE framework, this paper established an indicator system to evaluate the potential of spatial units to develop innovation districts in terms of three criteria: conditions, outputs, and outcomes (see Table 1). For the selection of indicators, this paper referred to the “Industry-City-Creation” integrated development index system and the innovation city evaluation index system [62], which draws on the OECD Science Technology and Industry Scoreboard, European Innovation Scoreboard from the European Union, and Report on the Statistical Monitoring Research on the Process of Innovation Country from State Statistics Bureau. The following criteria were used to refine and select the indicators: (1) selected indicators cover the three criterion layers (conditions, outputs, and outcomes), thus ensuring a systematic description of the potential of spatial units; (2) selected indicators should not contain data that can only be obtained at the municipal or provincial level; and (3) considering the feasibility of subdistrict data acquisition, selected indicators do not contain long-term time-series data, and the indicator weights were calculated using analytic hierarchy process (AHP).
The “conditions” criterion represents the attributes of spatial units to support innovative and entrepreneurial activities. Here, this paper summarized the spatial unit attributes into three dimensions: physical space, facility services, and cultural environment. First, the physical conditions of a spatial unit affect its attraction to people and, thus, the generation of innovative and entrepreneurial activities [63]. In this paper, commercial network density, degree of functional mix, and green area per capita were chosen to represent the physical conditions of spatial units. Second, facility services refer to the organizations, institutions, operating mechanisms, and management systems that serve innovation and entrepreneurship, aiming to improve their efficiency and transform them into tangible outcomes [64]; here, four indicators were chosen to represent this dimension. In addition, a favorable cultural environment is a catalyst and accelerant for innovation and entrepreneurship; here, the number of cultural exchange venues per square kilometer was used to represent the dimension of the cultural environment [65].
The “Outputs” criterion represents the productivity of spatial units to carry out innovative and entrepreneurial activities. This paper explored the productivity of spatial units by examining two key dimensions: the primary contributors to innovation and entrepreneurship and the supporting elements that allow innovation and entrepreneurship to flourish. On the one hand, companies, institutions, and talents can be considered as the main sources and contributors to innovative and entrepreneurial activities [66]; therefore, the number of SMEs and key laboratories per square kilometer and the percentage of corporate R&D personnel were used to represent this dimension. On the other hand, innovation and entrepreneurship cannot flourish in isolation; rather, they rely on the support of network structures and the various flows of resources and information that they facilitate [67]. Correspondingly, the number of university campuses, science and technology parks, and venture capital institutions per square kilometer were used to reveal the developmental environment for innovation and entrepreneurship.
The “Outcomes” criterion represents the innovations resulting from the innovative and entrepreneurial activities in spatial units. Currently, the most common index for evaluating innovative capability is the number of patents, which can be considered as representing the innovation outcomes of a spatial unit. This paper referred to the established regional innovation evaluation system [68] while considering that the goal of innovation districts is to achieve economic growth and ultimately evaluated innovation outcomes in two dimensions: patent grant and innovation output value. The data on innovation output value used in this paper were obtained from the output value of innovation enterprises provided by the Qingdao Bureau of Science and Technology. In addition, both indicators were divided by population to eliminate the effect of spatial unit size on the results.

3.2.2. Coupling Coordination Degree Model

Coupling is a physical concept that specifically refers to the phenomenon where two or more systems affect each other through various interactions, reflecting synchronization between multiple systems. The coupling degree is used to describe the strength of interactions and influences among different systems. Referring to the established model [69], a coupling evaluation model consisting of three dimensions, “conditions”, “outputs”, and “outcomes”, was constructed. As is shown in Equation (1).
C = S 1   ×   S 2   ×   S 3 / S 1 + S 2 + S 3 / 3 3 3 ,
In Equation (1), S1, S2, and S3 represent the three levels of “outputs”, “outcomes”, and “conditions”, respectively, and the coupling degree C takes values in the range [0, 1]. Although the coupling degree model can more effectively evaluate the strength of interactive coupling among dimensions, it is difficult to accurately measure the three dimensions’ overall function and true level [70]. In order to scientifically evaluate the development potential of spatial units and highlight their contribution factors to innovation districts, this paper constructed a three-dimensional coupled coordination degree model, as is shown in Equation (2).
D = C   ×   α S 1 + β S 2 + γ S 3 ,
In Equation (2), α, β, and γ denote the weights of each dimension, and the three dimensions are of equal importance and are therefore all assigned a value of 1/3. D is the coupling coordination degree, and 0 ≤ D ≤ 1. The levels of the three dimensions in Equation (2) can be measured by using the weighted average method [71], as is shown in Equation (3).
S t = i = 1 m s ti λ ti , i = 1 , 2 , , m ; t = 1 , 2 , 3 ,
In Equation (3), Sti denotes the contribution of the indicator i in dimension t; λti denotes the weight of indicator i in dimension t; St denotes the level of dimension t; and Sti was processed by using the normalization method for comparison [72].

3.2.3. Exploratory Spatial Data Analysis (ESDA)

To further explore the key areas influencing the development of innovation districts, a spatial clustering analysis was used to classify subdistrict units. Moran’s I has been widely utilized to examine spatio-temporal properties by determining the spatial correlations, spatial dependencies, and geographic heterogeneity as a common indicator of ESDA [73,74]. To assess the spatial correlation and spatial distribution pattern of subdistrict unit potential, this paper used a mixture of the Global Moran’s I and Local Moran’s I. The Global Moran’s I was calculated using the following equation:
I = n i = 1 n i j n W i j × i = 1 n i j n W i j x i x * x j x * i = 1 n x i x * 2 ,
In Equation (4), n denotes the number of spatial units, x represents the indicator tested (potential of subdistrict units), i represents the i-th spatial unit, and x* represents the mean value of xi. Wij is the spatial weight matrix defining the structure of the neighborhood, where Wij = 1 if spatial units i and j share a border and Wij = 0 otherwise. The Global Moran’s I can reflect spatial autocorrelation but does not identify the location and type of spatial clusters. Therefore, the Local Moran’s I can be used to determine the local differences and similarities across spatial units in proximity. The equation for calculating the Local Moran’s I is as follows:
I = x i x * 1 n i = 1 n x i x * i = 1 n i j n w i j 1 n i = 1 n x i x * ,
Four outcomes can be obtained when using the Local Moran’s I to identify clusters: high–high cluster (HH), high–low cluster (HL), low–high cluster (LH), and low–low cluster (LL). The high-value agglomerations of spatial unit potential will be the most likely areas to achieve the goal of innovation districts; therefore, this paper selected HH clusters and HL clusters and further analyzed their evolutionary phases and development potential.

4. Results

4.1. Potential for Developing Innovation Districts in the Studied City

This paper measured “conditions”, “outputs”, and “outcomes” levels through the weighted average method. The coupling coordination model was used to measure the coupling coordination degree between the three dimensions. The coupling coordination degree represents the potential for developing innovation districts. In addition, the differences in the levels of the three dimensions showed that the main contributing factors of the spatial units to the development of innovation districts were different. Thus, spatial units can be classified by combining the levels of the three dimensions.

4.1.1. Potential of Subdistrict Units to Develop Innovation Districts

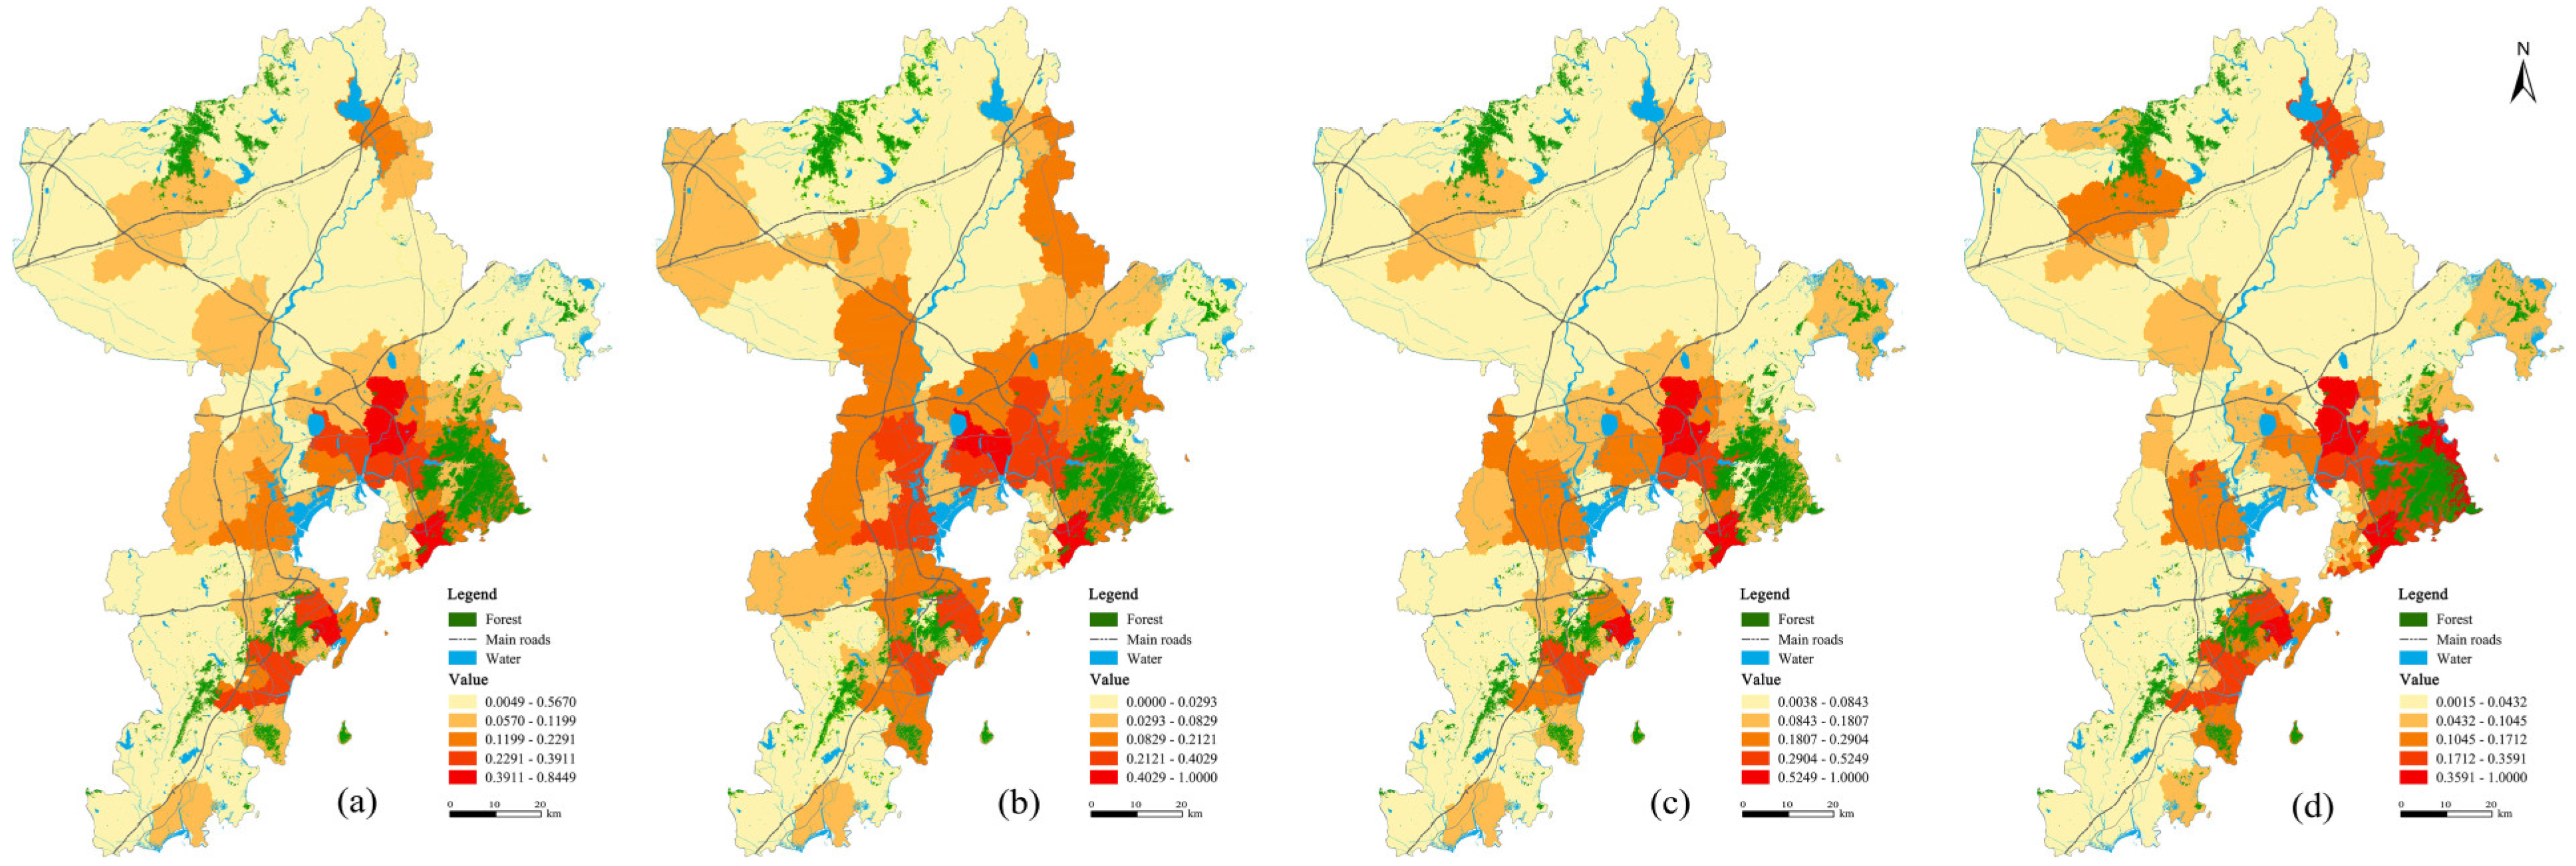
Figure 3 shows the results of the three dimensions and the coupling coordination degree model for each subdistrict unit. Firstly, the potential for developing innovation districts showed a rising and then decreasing trend from the downtowns to the distant suburbs. Low-potential subdistricts were mainly distributed in the three inner districts of Qingdao City (including Shinnan, Shibei, and Licang districts) and the three distant suburban cities (including Pingdu, Laixi, and Jiaozhou cities). High-potential subdistricts were mainly distributed in the suburban districts, including Chengyang, Jimo, Huangdao, and Laoshan districts. These distribution patterns were closely related to the urban construction development of Qingdao in recent years. As infrastructure gradually extended to the outskirts of the city, large areas of undeveloped land in the suburbs became extremely attractive to SMEs and entrepreneurs, thus making these areas a hotbed of innovative and entrepreneurial activity.
Secondly, the results for the three dimensions were generally consistent with the above trend, but there were slight differences. For the “outputs” dimension, the distribution of high-potential subdistricts was more continuous, forming a belt around the downtown areas, which indicated that the productivity of Qingdao’s subdistrict units, such as SMEs, was more developed. The spatial distribution of the “conditions” and “outcomes” dimensions showed that the potential for developing innovation districts diminished outward around a single core. The high-value core of the “outcomes” dimension was in the Laoshan district, while that of the “conditions” dimension was at the intersection of Chengyang and Jimo. In addition, a portion of high-potential subdistricts were observed in the lower-value areas of the outer suburbs. These subdistricts were mainly the administrative centers of the suburban counties.

4.1.2. Classification of the Dominant Factors of Subdistrict Units

In order to distinguish the differences in the contribution factors of each subdistrict to the development of innovation districts, this paper further used the “conditions”, “outputs”, and “outcomes” levels as classification criteria and divided subdistrict units into three categories (seven subcategories). First, the average of the three dimensions was calculated. If the values of “conditions”, “outputs”, and “outcomes” are all greater than the average, it is classified as a synchronous development type (Ia); if any two of the values of “conditions”, “outputs”, and “outcomes” are greater than the average, it is classified as a productivity–innovations advantage type (IIa), an attributes–innovations advantage type (IIb), or an attributes–productivity advantage type (IIc); and if only one of the values is greater than the average, it is classified as a productivity-dominant type (IIIa), an innovation-dominant type (IIIb), or an attribute-dominant type (IIIc).
Table 2 summarizes the quantity statistics of the classification of subdistrict units in Qingdao. There was only one subcategory in Category I, i.e., Ia, and 15 subdistricts were placed into this category. These subdistricts had medium or high potential to develop into innovation districts, accounting for 20% of the total areas. The distribution of these subdistricts was characterized by axis-belt attachment and reunion, and they were mainly along the Jiaozhou Bay (Figure 4).
Category II contained three subcategories of subdistricts, IIa, IIb, and IIc, which had a medium potential to develop into innovation districts. There were 23 subdistricts of these three subcategories, accounting for 4%, 14%, and 4% of the total areas. The IIa and IIc subdistricts were mainly in the more distant suburbs next to the Ia subdistricts and had a low degree of agglomeration with a scattered distribution. They were further away from the downtown area; thus, the subdistrict units had slightly weaker attributes or innovations, but entrepreneurial activity was more advantageous. The IIb subdistricts were mainly in the administrative centers of the suburban counties. These subdistricts were not attractive to talents and SMEs due to their location and were thus attribute-innovation dominant. In addition, there are also some IIb subdistricts in the downtowns, where the lack of space has caused greater restrictions on the entrepreneurial activities of talent.
Category III had the lowest potential to develop into innovation districts, including three subcategories, i.e., IIIa, IIIb, and IIIc. There were 34 subdistricts of these three subcategories, accounting for 25%, 26%, and 5% of the total areas. The IIIa and IIIb subdistricts were mainly in the outer suburbs and distributed in small-scale reunions. Compared with IIa and IIc subdistricts, they were further away from the downtown area, had worse infrastructure conditions, and relied only on the advantage of land value to attract some entrepreneurs. The IIIc subdistricts were on the edge of the suburbs. Although these subdistricts had a moderate environment, they were far from industrial parks and business clusters and were not preferred by companies and talent.

4.2. Potential for Developing Innovation Districts at the Cluster Scale

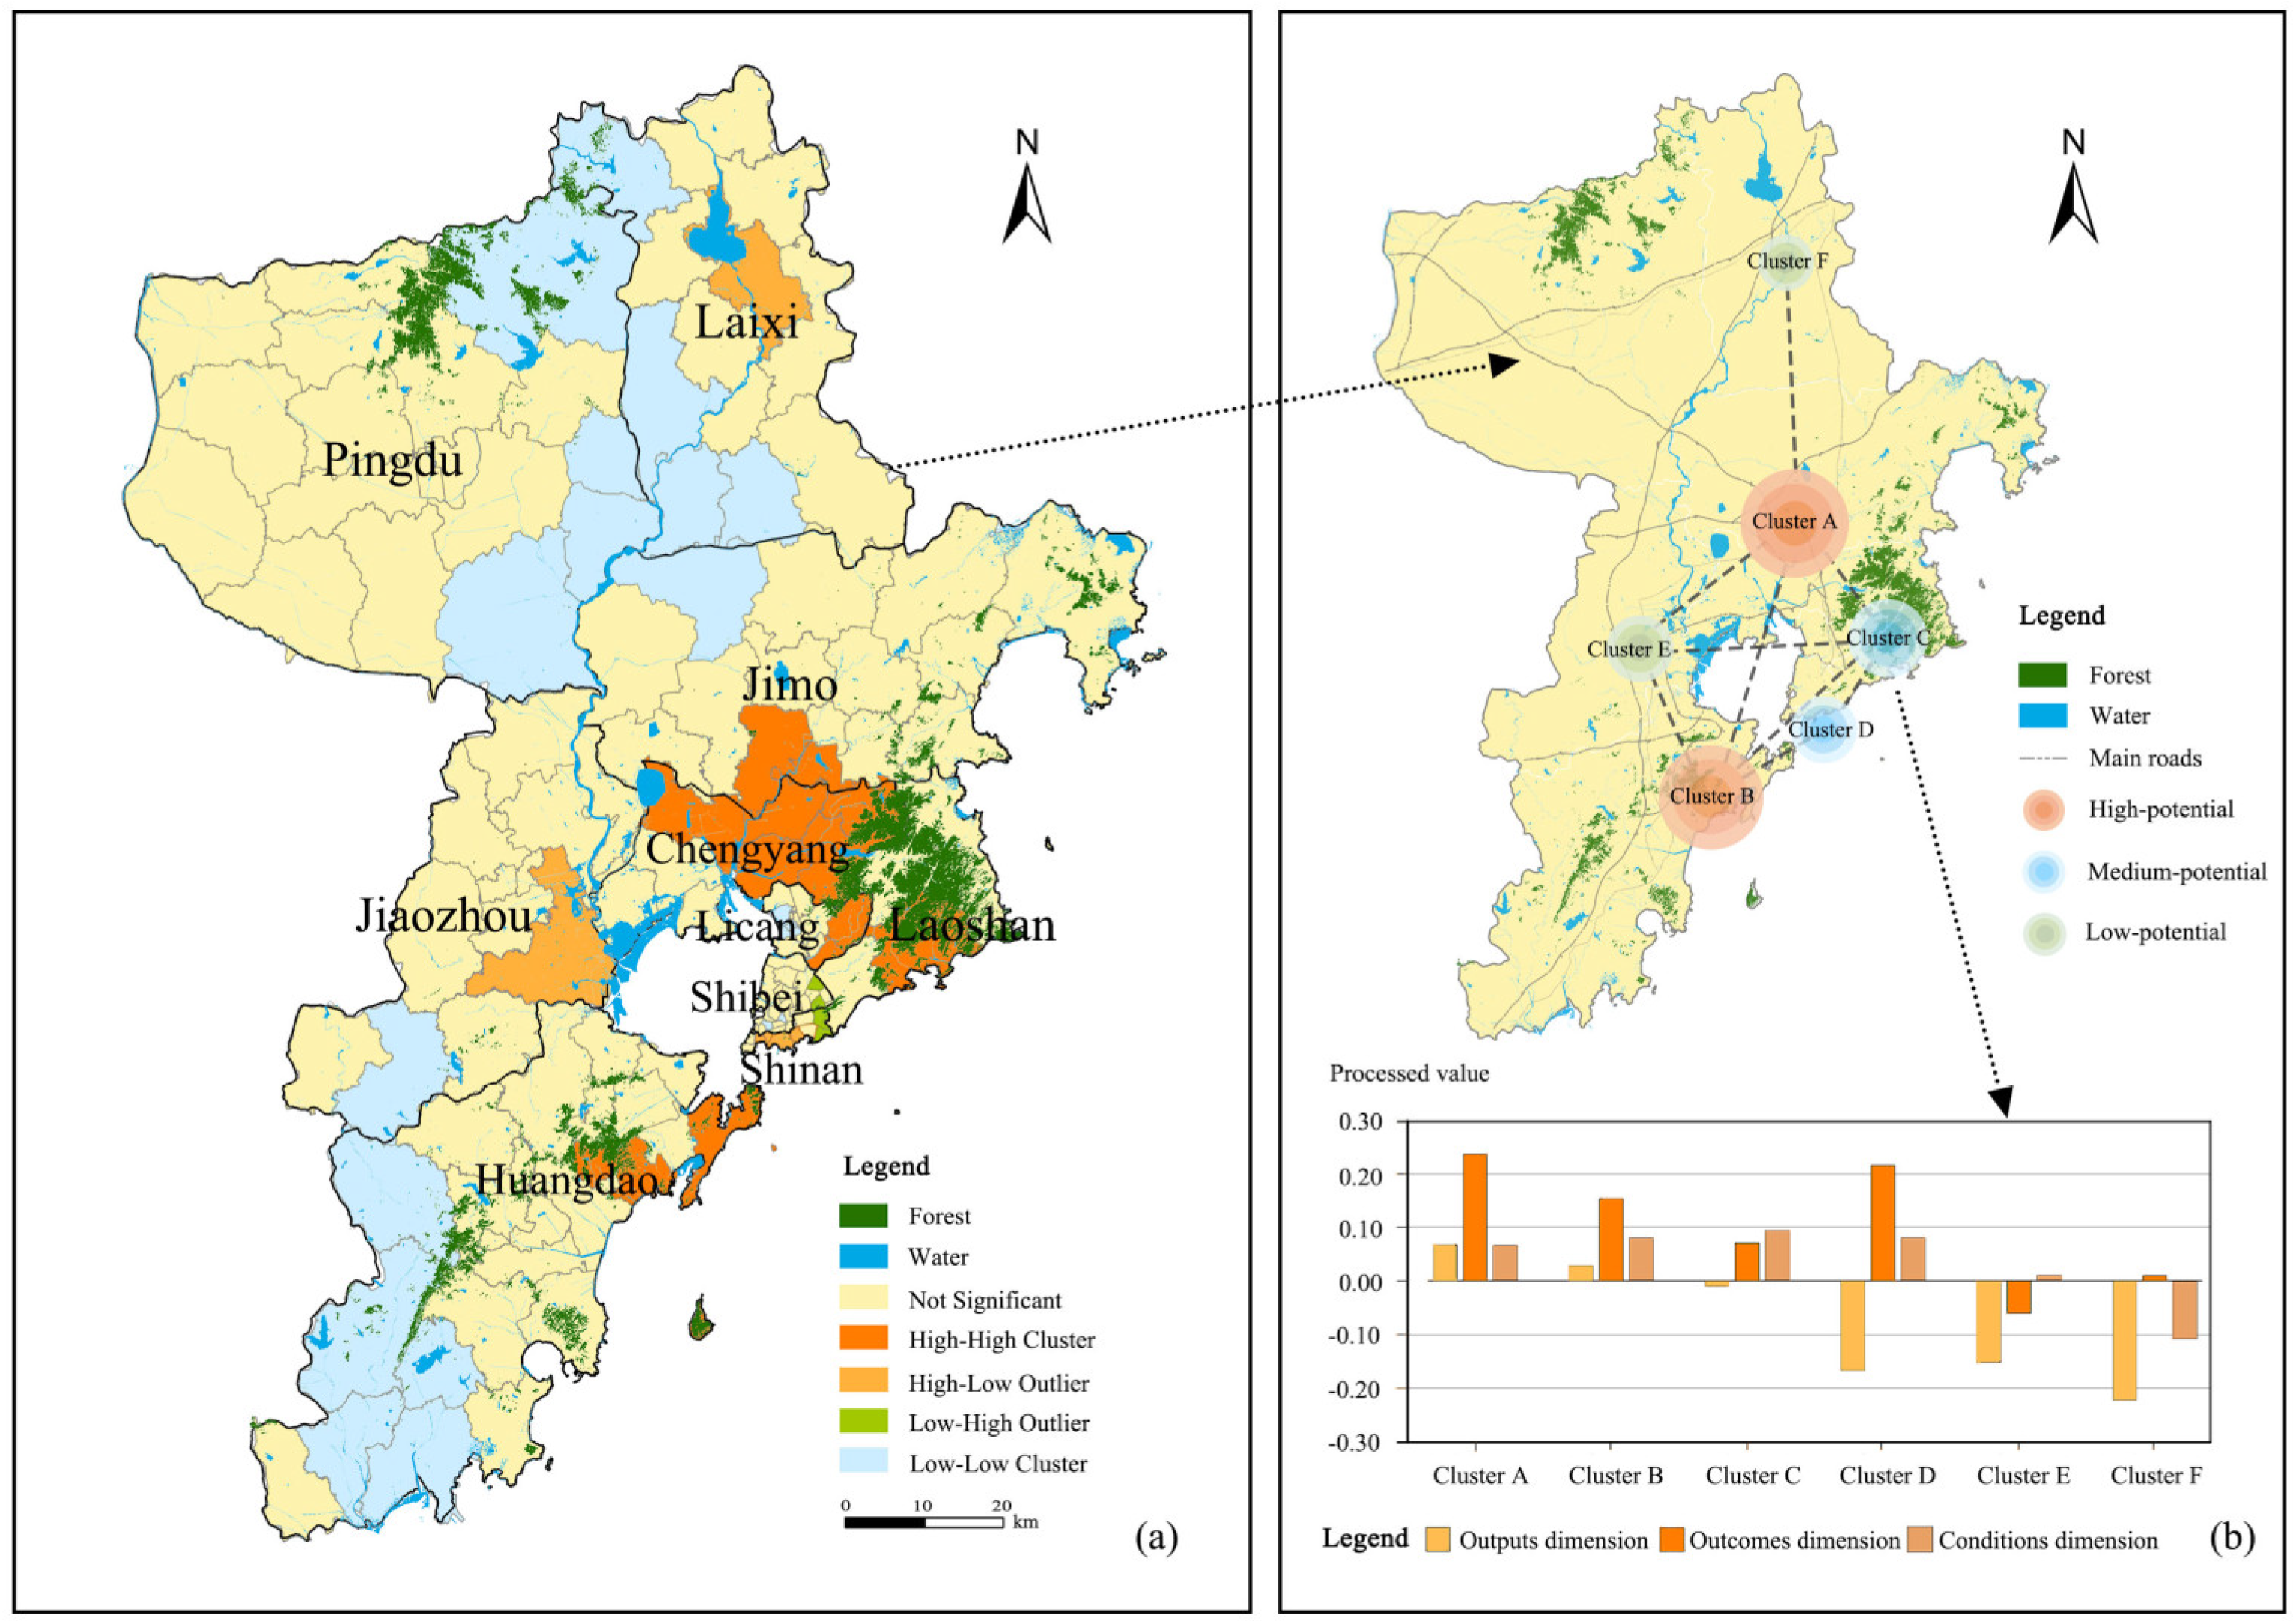
The Global Moran’s I index was positive and passed the Z-significance test, which indicated that there was a significant spatial clustering of the potential for developing innovation districts. This paper further investigated the local spatial autocorrelation analysis to obtain the LISA clustering results. Figure 5a shows that the subdistrict units with significant spatial association were in the suburban and outer suburban areas. The high–high clusters were mainly in the suburbs, while the low–low clusters were in the outer suburbs. In addition, high–low clusters and low–high clusters appeared sporadically in the outer suburbs and downtowns, respectively. In this paper, high–high and high–low clusters were selected as specific areas for further analysis. The high-value areas of the potential for developing innovation districts can be divided into six locations, forming a total of six innovation district clusters in space.
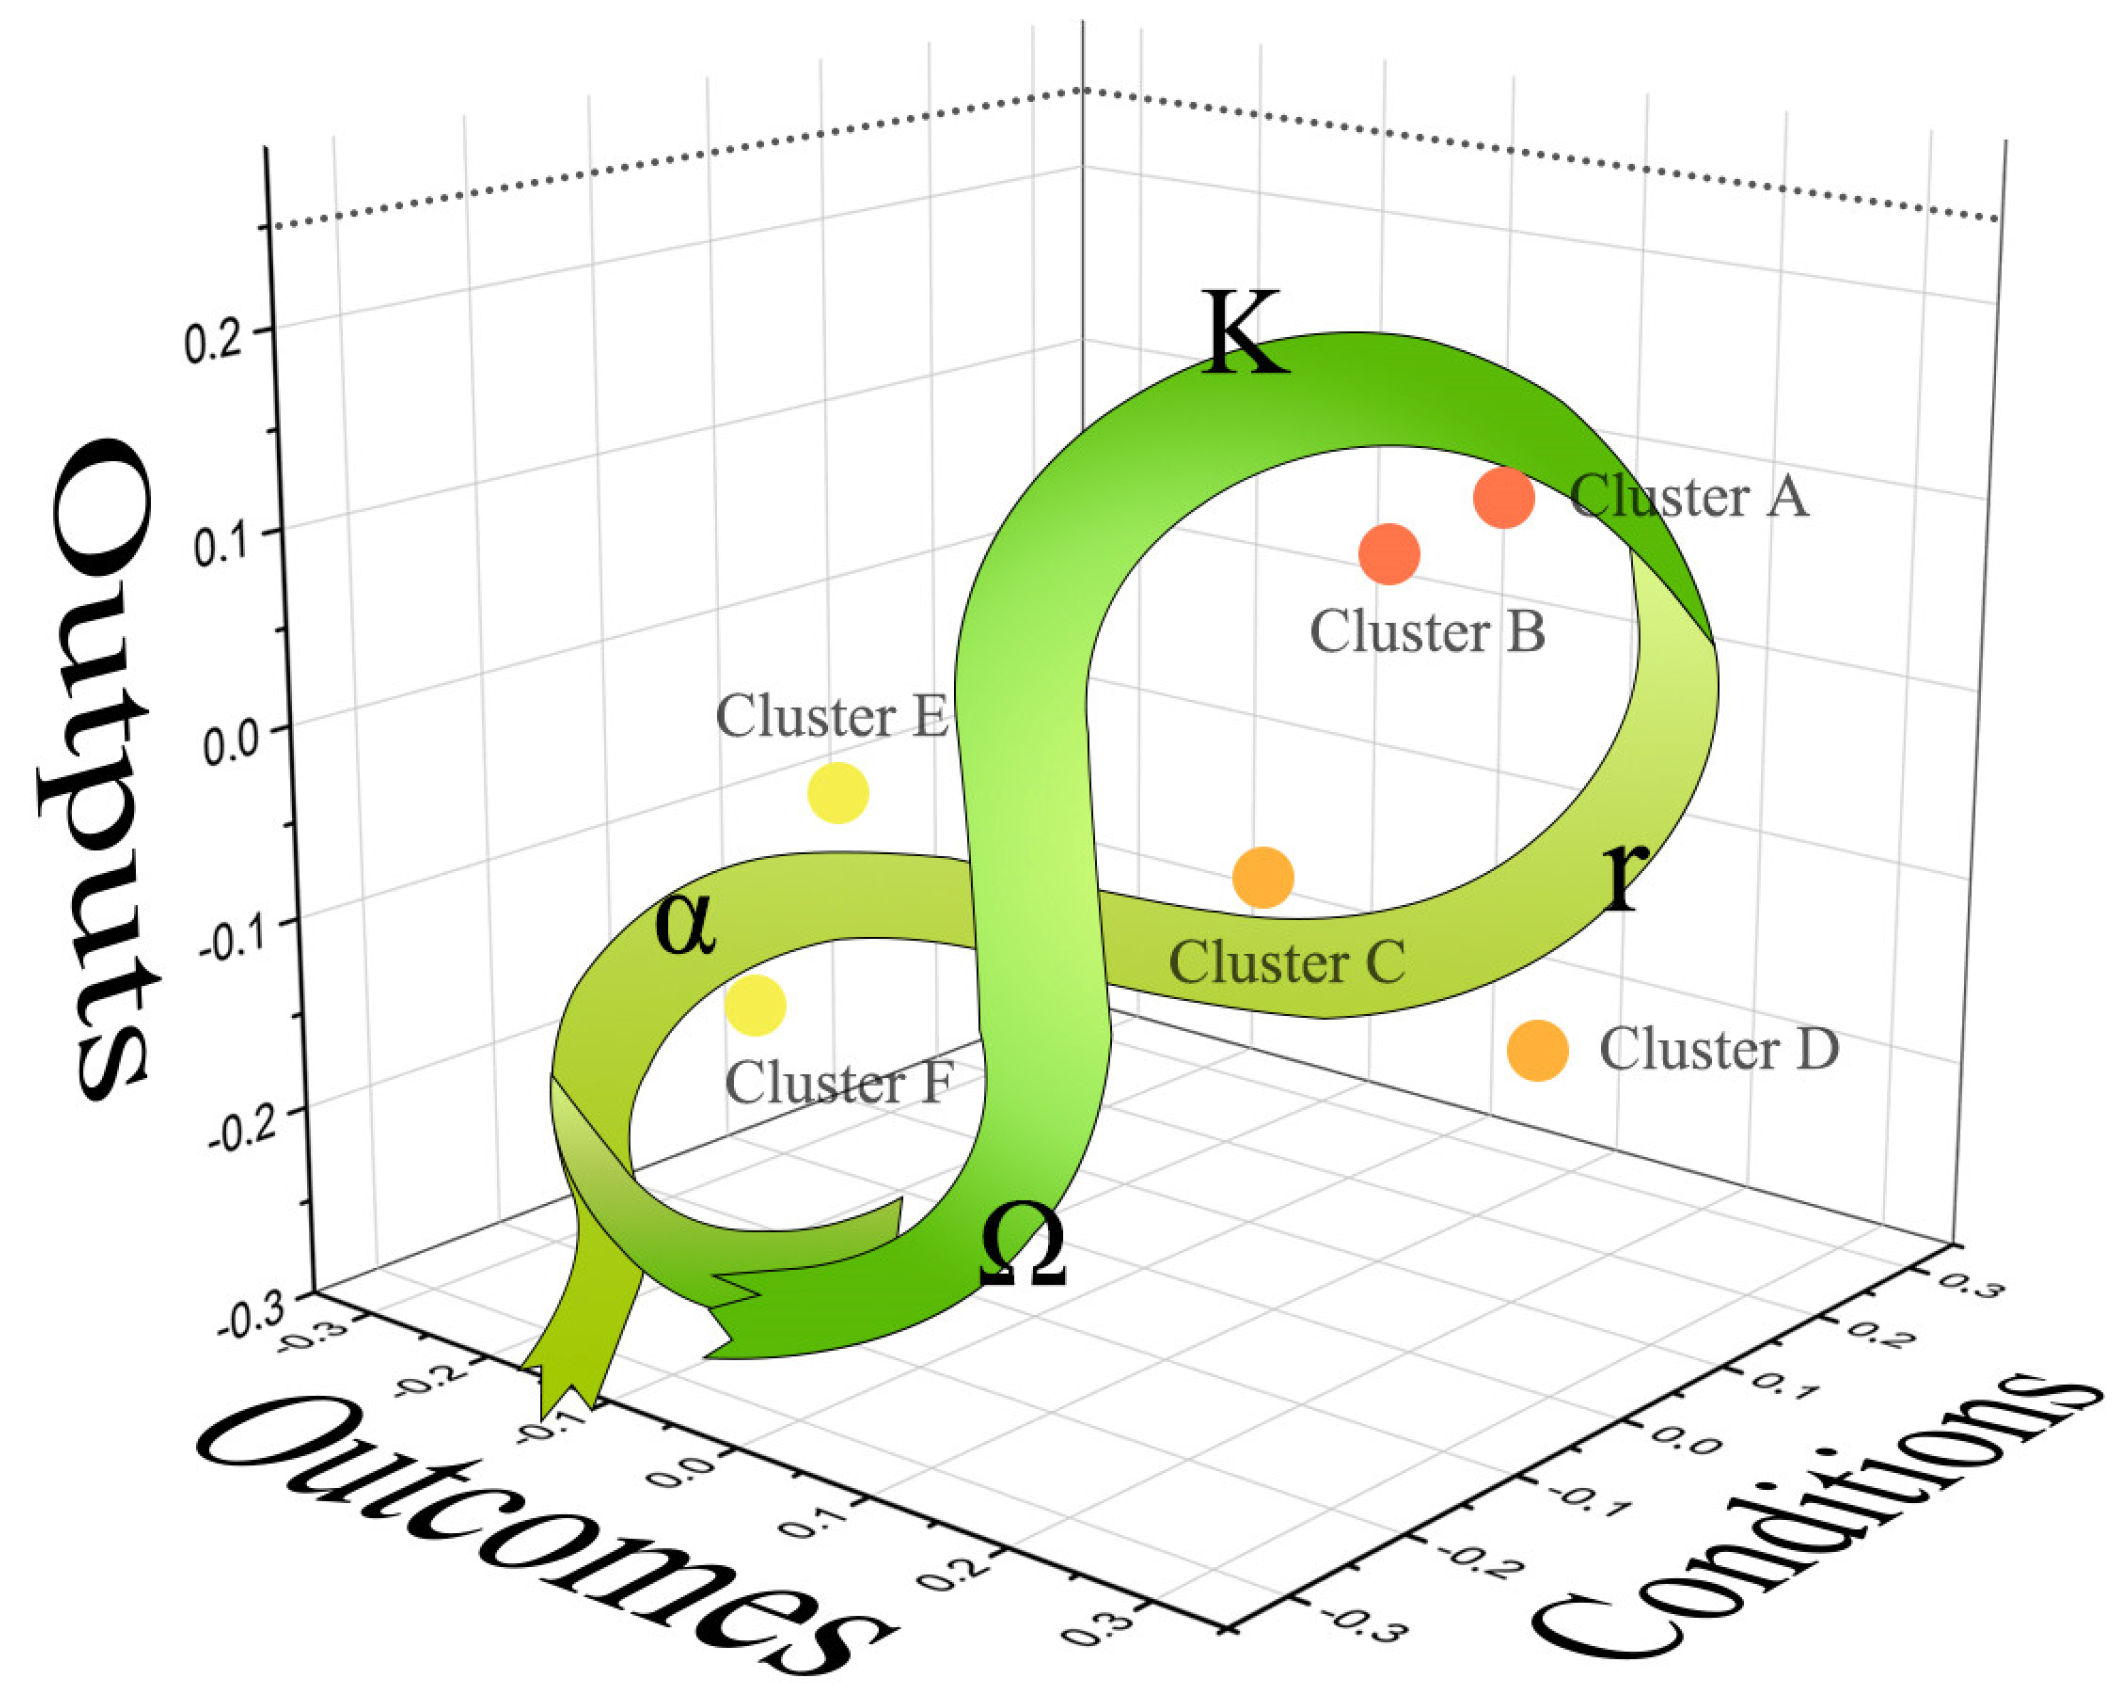
Innovation districts are a dynamic system that is constantly evolving. Similarly, innovation district clusters can correspond to phases of the adaptive cycle. In this study, the values of the three dimensions of the innovation district clusters were used minus the mean to obtain the processed values. As shown in Figure 5b, all clusters can be classified into three levels based on the similarity of potential characteristics. Subsequently, the processed values of all the clusters were plotted in a three-dimensional coordinate system with “conditions”, “outputs”, and “outcomes” as the axes. The adaptive cycle model was also overlaid to produce a schematic diagram of the development phases of the innovation district clusters (Figure 6).
In the exploitation (r) phase, all the potential values of “conditions”, “outputs”, and “outcomes” showed an upward trend. Cluster C and Cluster D were in this phase, with the former in the Laoshan district and the latter in the Shinan district. Cluster C was distributed in the old town of Qingdao, where the spatial fragmentation was high, and it was difficult to call for a more concentrated space for the development of innovation districts. Cluster D occupied the subdistrict units with the highest development potential. However, restricted by Laoshan Mountain, the local space cannot support relevant companies and universities, making it difficult to obtain sufficient innovation sources.
In the conservation (K) phase, the potential value of “conditions”, “outputs”, and “outcomes” all reached a high level. Cluster A and Cluster B were in this phase, with the former at the junction of Jimo and Chengyang and the latter at the eastern coast of Huangdao. These areas were profoundly affected by Qingdao’s construction of science and technology innovation parks in recent years, which greatly enhanced the environment needed for innovative and entrepreneurial activity and attracted a wide range of talented people and innovative companies.
In the release (Ω) phase, the potential value of “conditions”, “outputs”, and “outcomes” showed a decreasing trend. When innovation districts encounter strong disruptions, the structure of the system will be disrupted, and the accumulated social capital and talent will revert to the external environment. Qingdao was in a rapid development stage, and there were no innovation district clusters in the release phase.
In the reorganization (α) phase, the potential value of “conditions”, “outputs”, and “outcomes” were all low. Cluster E and Cluster F were in this phase, with the former in Jiaozhou district and the latter in Laixi county. Cluster E was distributed in the newly developed area of Qingdao, and all the constructions were still in the preliminary stage, which cannot support the development of innovation districts. Cluster F was adjacent to the Dagu River, near the reservoir. Although the environment and services were favorable to innovation, the location was less advantageous and could not attract innovators.

5. Discussion

5.1. The Features and Advantages of the Evaluation Method

This paper developed a new method that can be used to quantitatively evaluate the potential for developing innovation districts at the city scale by combining entrepreneurial ecosystem theory and adaptive cycle theory. This method not only pinpointed the key factors affecting the development potential of spatial units but also identified the evolutionary stages of primary clusters, providing an important basis for the regional selection of innovation districts. In general, this method compensated for some past shortcomings in the analysis and provided practical advice to promote the rational development of innovation districts.
First, this method is based on the entrepreneurial ecosystem (EE), which forms a 3-D assessment framework that can be used to assess the potential for developing innovation districts at the city scale and to identify key factors. This method can effectively evaluate the potential for sustainable development of innovation districts and identify the dominant factors contributing to this potential based on the differences in the level of the three dimensions. In contrast, the evaluation indicator systems commonly used in the past, such as innovation district performance [75], focused on a limited number of indicators and specific regions and were unable to evaluate the overall urban space or analyze key factors. By analyzing the potential of subdistrict units in Qingdao and their classification results, this paper found that the “output” dimension was characterized by a clear clustering of high values in high-potential areas, while its development had a lag in medium- and low-potential areas, suggesting that innovation sources were a key factor in the development of Qingdao’s innovation districts. This is consistent with what has been found in the past. Local governments adopted appropriate talent acquisition programs to promote social and economic development in their areas [76]. Past studies also pointed out that innovation sources are the innovation elements that prompt innovation generation and transformation and are the driving force for innovation. Universities, research institutions, and enterprises all belong to the innovation actors that generate innovation, and they all belong to the innovation sources [77].
Second, this method is based on the adaptive cycle theory and can analyze the evolutionary phases of the primary innovation district clusters and their development potential to provide alternative areas for the development of innovation districts. In general, high-potential innovation district clusters in the conservation (K) phase were distributed in suburban areas, while medium-potential innovation district clusters in the exploitation (r) phase were distributed in areas with a high density of natural elements or the downtowns. Low-potential innovation district clusters in the reorganization (α) phase were in outer counties. This implied the importance of adequate space reserves for the future development of innovation districts. These results are consistent with previous studies and policies. For example, Junyu Ren found that the number of industrial innovation units in Qingdao grew radially from the downtown to the suburbs [78]. At the same time, the government issued the “One District, Multiple Parks” development plan for the high-tech zone. The plan focuses on the main park in the northern part of Jiaozhou Bay and forms a belt-shaped development model around the downtown of Qingdao. In addition, Qingdao is currently working on the preparation of science city planning, and from the performance of the innovation district clusters, Chengyang district in the north of Jiaozhou Bay and the east coast of Huangdao district are the areas to be focused on.
Third, this method helps to identify localized problems in the city and to flexibly evaluate various innovation districts. For a city, this method can evaluate the potential of spatial units and primary clusters to develop innovation districts. Thus, practical recommendations can be made for the areas and types of innovation districts to be developed. In the case of a developing innovation district, this method can also evaluate its current development potential and main problems. On the one hand, the three criteria of “conditions”, “outputs”, and “outcomes” included in this method are crucial factors reflecting the development status of innovation districts, which can evaluate the development level and potential of innovation districts. At the same time, the results calculated using the coupled coordination degree model can better demonstrate the interaction between different dimensions, which is in line with the view of treating innovation districts as open systems. On the other hand, this method can identify the evolutionary phases of innovation districts. At their respective development phases, innovation districts have different structural properties and will encounter different problems. In response to the new round of potential risks, the government can formulate corresponding countermeasures to enhance the resilience of innovation districts and promote their sustainable development.

5.2. Implications for Future Development and Spatial Planning

Place-based policies for innovation district development should be formed for areas with different potentials to achieve sustainable development goals (Table 3). High-potential areas had balanced levels of all three dimensions and were best suited for developing innovation districts. However, it is easy to enter the release (Ω) phase under external disturbance. In future development, these areas should make up for their shortcomings, implement flexible development, moderately mix in land functions, and focus on the dependency relationship between industrial forms, carriers, and people’s living status to better meet the living needs of innovative talents.
In Qingdao, the medium-potential areas were under obvious pressure of space shortage and faced the challenge of sustainable development. For example, the main problem in the Cluster F area is the lack of space for development in the old town, which is the same as the problem of land mismatch that has been caused by rapid expansion in the country [79]. It is therefore necessary to redevelop the stock space and upgrade local enterprises by “Vacating Cage to Change Bird” [80]. The Cluster B area is constrained by geographical elements. Laoshan Mountain occupies a large amount of space, which may provide a suitable spatial environment. However, the assessment results showed that the excellent environment did not attract innovation source elements. The government needs to consider how to use the advantages of universities and the environment to gather innovative resources and realize the re-prosperity of space. For these areas, it is not currently appropriate to develop innovation districts. After industrial upgrading, they can be properly considered.
Low-potential areas had difficulty in attracting the corresponding innovative and entrepreneurial subjects due to the lack of resource advantages or favorable location conditions. These areas are still far from developing into innovative urban areas. For them, they must seize the opportunity of overflowing innovation resources and make use of the existing resource conditions to achieve leapfrog development. In the long run, how to fully exploit its own characteristic resources and build a professional innovation and entrepreneurship cluster will be the key way to get rid of the predicament.

5.3. Limitations and Future Work

This paper developed a method to evaluate the potential for developing innovation districts at the city scale, which is significant for the rational selection of types and areas of innovation districts. However, there are still some limitations. First, the smallest unit evaluated in this paper is the subdistrict, which makes the evaluation results ambiguous. For innovation districts, using a 1 × 1 km grid as the evaluation unit can evaluate the areas suitable for developing innovation districts in a more refined way. Second, this paper did not quantitatively explore the complex factors that influence the potential for developing innovation districts and the mechanisms by which the various factors act. A variety of factors work together to influence the emergence and development of innovation districts, but due to the length limitations of this paper, only the three most important dimensions were discussed. Other factors, such as socio-cultural issues (policy support, innovation culture, and talent introduction) and changes in environmental endowments (capital investment in the market and technological innovation), were not explored. In addition, since innovation districts target inner-city stock space, further research is needed to enhance the built environment of innovation districts.

6. Conclusions

Given that innovation districts are complex systems, this paper developed a SEE method that combines entrepreneurial ecosystem theory and the adaptive cycle framework to assess the potential for developing innovation districts at the city scale. By using Qingdao as a case study, we verified the feasibility of the methodology. This approach makes it possible to identify not only the key factors influencing development potential but also the evolutionary phases of key areas at the cluster scale, which helps to rationalize the selection of the type and location of innovation districts. However, due to the difficulty in obtaining relevant statistical data on urban internal innovation, the minimum assessment unit in this study is the subdistrict. To apply the methodology to a wider range of evaluation objects, adopting a 1 × 1 km grid would be more appropriate. Furthermore, a more in-depth analysis and consideration of factors influencing potential impacts should also be undertaken.
Overall, the potential for developing innovation districts in Qingdao showed a concentric trend, i.e., higher in the downtown, highest in the suburbs, and lowest in the outer suburbs. The “output” dimension was characterized by a clear clustering of high values in high-potential areas and had a significant lag in medium- and low-potential areas. These spatial patterns indicated that in suburban areas, the innovation districts should primarily adopt the innovation-source-driven model, whereas in the downtown, the service and environment attraction model should be prioritized. In addition, the suburban east coast was affected by mountains and had limited space for development. The best place to develop innovative urban areas was on the north side of Jiaozhou Bay or the west coast area.

Author Contributions

Conceptualization, Y.D. and C.X.; methodology, Y.D. and C.X.; software, Y.D. and C.X.; validation, Y.D. and Z.Y.; formal analysis, Y.D.; investigation, Y.D.; resources, Y.D. and L.Q.; data curation, Y.D. and L.Q.; writing—original draft preparation, Y.D.; writing—review and editing, L.Q. and Y.D.; supervision, Z.Y. and R.L.; project administration, Z.Y. and R.L.; funding acquisition, L.Q. and R.L. All authors have read and agreed to the published version of the manuscript.

Funding

This research was funded by the National Natural Science Foundation of China, grant number 52278019, and the Natural Science Foundation of Shandong Province, grant number ZR2020ME217.

Data Availability Statement

Data are unavailable due to privacy and ethical constraints.

Acknowledgments

The authors thank the editor and anonymous referees for their invaluable comments on an earlier version of the manuscript.

Conflicts of Interest

The authors declare no conflict of interest.

References

  1. Cui, M.; Pan, S.; Newell, S.; Cui, L. Strategy, Resource Orchestration and E-Commerce Enabled Social Innovation in Rural China. J. Strateg. Inf. Syst. 2017, 26, 3–21. [Google Scholar] [CrossRef]
  2. Hu, T.-S.; Pan, S.-C.; Lin, H.-P. Development, Innovation, and Circular Stimulation for a Knowledge-Based City: Key Thoughts. Energies 2021, 14, 7999. [Google Scholar] [CrossRef]
  3. Yigitcanlar, T.; Inkinen, T. Theory and Practice of Knowledge Cities and Knowledge-Based Urban Development. In Geographies of Disruption: Place Making for Innovation in the Age of Knowledge Economy; Yigitcanlar, T., Inkinen, T., Eds.; Springer International Publishing: Cham, Switzerland, 2019; pp. 109–133. [Google Scholar]
  4. Pancholi, S.; Yigitcanlar, T.; Guaralda, M.; Mayere, S.; Caldwell, G.A.; Medland, R. University and Innovation District Symbiosis in the Context of Placemaking: Insights from Australian Cities. Land Use Policy 2020, 99, 105109. [Google Scholar] [CrossRef]
  5. Liang, S. Streets Place-Making in Beijing’s Innovative Districts: From the Perspective of Public Assets and Property Rights. China City Plan. Rev. 2019, 28, 28–36. [Google Scholar]
  6. Hutton, T.A. The New Economy of the Inner City. Cities 2004, 21, 89–108. [Google Scholar] [CrossRef]
  7. Katz, B.; Wagner, J. The Rise of Innovation Districts: A New Geography of Innovation in America; Brookings Institution: Washington, DC, USA, 2014. [Google Scholar]
  8. Wang, J.; Tong, C.; Hu, X. Policy Zoning Method for Innovation Districts to Sustainably Develop the Knowledge-Economy: A Case Study in Hangzhou, China. Sustainability 2021, 13, 3503. [Google Scholar] [CrossRef]
  9. Yan, Y.-L.; He, M.; Song, L. Evaluation of Regional Industrial Cluster Innovation Capability Based on Particle Swarm Clustering Algorithm and Multi-Objective Optimization. Complex Intell. Syst. 2021, 9, 3547–3558. [Google Scholar] [CrossRef]
  10. Hervás-Oliver, J.-L.; Albors-Garrigos, J.; Estelles-Miguel, S.; Boronat-Moll, C. Radical Innovation in Marshallian Industrial Districts. Reg. Stud. 2018, 52, 1388–1397. [Google Scholar] [CrossRef]
  11. Baker, S.C.; Mehmood, A. Social Innovation and the Governance of Sustainable Places. Local Environ. 2015, 20, 321–334. [Google Scholar] [CrossRef]
  12. Yigitcanlar, T. Position Paper: Benchmarking the Performance of Global and Emerging Knowledge Cities. Expert Syst. Appl. 2014, 41, 4680–4690. [Google Scholar] [CrossRef]
  13. Esmaeilpoorarabi, N.; Yigitcanlar, T.; Guaralda, M.; Kamruzzaman, M. Does Place Quality Matter for Innovation Districts? Determining the Essential Place Characteristics from Brisbane’s Knowledge Precincts. Land Use Policy 2018, 79, 734–747. [Google Scholar] [CrossRef]
  14. Esmaeilpoorarabi, N.; Yigitcanlar, T.; Kamruzzaman, M.; Guaralda, M. How Does the Public Engage with Innovation Districts? Societal Impact Assessment of Australian Innovation Districts. Sustain. Cities Soc. 2020, 52, 101813. [Google Scholar] [CrossRef]
  15. Esmaeilpoorarabi, N.; Yigitcanlar, T.; Kamruzzaman, M.; Guaralda, M. Conceptual Frameworks of Innovation District Place Quality: An Opinion Paper. Land Use Policy 2020, 90, 104166. [Google Scholar] [CrossRef]
  16. Adu-McVie, R.; Yigitcanlar, T.; Erol, I.; Xia, B. Classifying Innovation Districts: Delphi Validation of a Multidimensional Framework. Land Use Policy 2021, 111, 105709. [Google Scholar] [CrossRef]
  17. Esmaeilpoorarabi, N.; Yigitcanlar, T.; Guaralda, M.; Kamruzzaman, M. Evaluating Place Quality in Innovation Districts: A Delphic Hierarchy Process Approach. Land Use Policy 2018, 71, 471–486. [Google Scholar] [CrossRef]
  18. Rapetti, C.; Pareja-Eastaway, M.; Piqué, J.M.; Grimaldi, D. Measuring the Development of Innovations Districts through Performance Indicators: 22@Barcelona Case. J. Evol. Stud. Bus. 2022, 7, 6–39. [Google Scholar] [CrossRef]
  19. Yigitcanlar, T.; Adu-McVie, R.; Erol, I. How Can Contemporary Innovation Districts Be Classified? A Systematic Review of the Literature. Land Use Policy 2020, 95, 104595. [Google Scholar] [CrossRef]
  20. Adu-McVie, R.S.; Yigitcanlar, T.; Erol, I.; Xia, B. How Can Innovation District Performance Be Assessed? Insights from South East Queensland, Australia. J. Place Manag. Dev. 2022, 16, 183–247. [Google Scholar] [CrossRef]
  21. Rapetti, C.; Piqué, J.M.; Figlioli, A.; Berbegal-Mirabent, J. Performance Indicators for the Evolution of Areas of Innovation: Porto Digital Case. J. Evol. Stud. Bus. 2022, 7, 219–267. [Google Scholar] [CrossRef]
  22. Piqué, J.M.; Berbegal-Mirabent, J.; Etzkowitz, H. Triple Helix and the Evolution of Ecosystems of Innovation: The Case of Silicon Valley. Triple Helix 2018, 5, 1–21. [Google Scholar] [CrossRef]
  23. Davidson, K.; Håkansson, I.; Coenen, L.; Nguyen, T.N.M. Municipal Experimentation in Times of Crises: (Re-)Defining Melbourne’s Innovation District. Cities 2022, 132, 104042. [Google Scholar] [CrossRef]
  24. Jones, A.L. Regenerating Urban Waterfronts—Creating Better Futures—From Commercial and Leisure Market Places to Cultural Quarters and Innovation Districts. Plan. Pract. Res. 2016, 32, 333–344. [Google Scholar] [CrossRef]
  25. Van Winden, W.; Carvalho, L. Urbanize or Perish? Assessing the Urbanization of Knowledge Locations in Europe. J. Urban Technol. 2016, 23, 53–70. [Google Scholar] [CrossRef]
  26. Jiang, S.; Hu, Y.; Wang, Z. Core Firm Based View on the Mechanism of Constructing an Enterprise Innovation Ecosystem: A Case Study of Haier Group. Sustainability 2019, 11, 3108. [Google Scholar] [CrossRef]
  27. Moore, J.F. Predators and Prey: A New Ecology of Competition. Harv. Bus. Rev. 1993, 71, 75–86. [Google Scholar]
  28. Isenberg, D.J. How to Start an Entrepreneurial Revolution. Harv. Bus. Rev. 2010, 88, 40–50. [Google Scholar]
  29. Jacobides, M.G.; Cennamo, C.; Gawer, A. Towards a Theory of Ecosystems. Strateg. Manag. J. 2018, 39, 2255–2276. [Google Scholar]
  30. Neck, H.M.; Meyer, G.D.; Cohen, B.; Corbett, A.C. An Entrepreneurial System View of New Venture Creation. J. Small Bus. Manag. 2004, 42, 190–208. [Google Scholar] [CrossRef]
  31. Acs, Z.J.; Stam, E.; Audretsch, D.B.; O’Connor, A. The Lineages of the Entrepreneurial Ecosystem Approach. Small Bus. Econ. 2017, 49, 1–10. [Google Scholar] [CrossRef]
  32. Hakala, H.; O’Shea, G.; Farny, S.; Luoto, S. Re-Storying the Business, Innovation and Entrepreneurial Ecosystem Concepts: The Model-Narrative Review Method. Int. J. Manag. Rev. 2020, 22, 10–32. [Google Scholar] [CrossRef]
  33. Bischoff, K.; Volkmann, C. Stakeholder Support for Sustainable Entrepreneurship—A Framework of Sustainable Entrepreneurial Ecosystems. Int. J. Entrep. Ventur. 2018, 10, 172–201. [Google Scholar] [CrossRef]
  34. Spigel, B. The Relational Organization of Entrepreneurial Ecosystems. Entrep. Theory Pract. 2017, 41, 49–72. [Google Scholar] [CrossRef]
  35. Theodoraki, C.; Dana, L.-P.; Caputo, A. Building Sustainable Entrepreneurial Ecosystems: A Holistic Approach. J. Bus. Res. 2021, 140, 346–360. [Google Scholar] [CrossRef]
  36. Malecki, E.J. Entrepreneurship and Entrepreneurial Ecosystems. Geogr. Compass 2018, 12, e12359. [Google Scholar] [CrossRef]
  37. Nicotra, M.; Romano, M.; Giudice, M.D.; Schillaci, C.E. The Causal Relation between Entrepreneurial Ecosystem and Productive Entrepreneurship: A Measurement Framework. J. Technol. Transf. 2018, 43, 640–673. [Google Scholar] [CrossRef]
  38. Cantner, U.; Cunningham, J.A.; Lehmann, E.E.; Menter, M. Entrepreneurial Ecosystems: A Dynamic Lifecycle Model. Small Bus. Econ. 2019, 57, 407–423. [Google Scholar] [CrossRef]
  39. Cao, G.-H.; Zhang, J. Is a Sustainable Loop of Economy and Entrepreneurial Ecosystem Possible? A Structural Perspective. Environ. Dev. Sustain. 2020, 23, 7002–7040. [Google Scholar] [CrossRef]
  40. O’Connor, A.; Audretsch, D.B. Regional Entrepreneurial Ecosystems: Learning from Forest Ecosystems. Small Bus. Econ. 2022, 60, 1051–1079. [Google Scholar] [CrossRef]
  41. Mukesh, H.V. Digital Transformation Taking Centre Stage: How Is Digital Transformation Reshaping Entrepreneurial Innovation? J. Entrep. 2022, 31, 364–401. [Google Scholar] [CrossRef]
  42. Filho, W.L.; Fritzen, B.; Vargas, V.R.; Paço, A.; Zhang, Q.; Doni, F.; Azul, A.M.; Vasconcelos, C.R.P.; Nikolaou, I.E.; Skouloudis, A.; et al. Social Innovation for Sustainable Development: Assessing Current Trends. Int. J. Sustain. Dev. World Ecol. 2021, 29, 311–322. [Google Scholar] [CrossRef]
  43. Stam, E. Measuring Entrepreneurial Ecosystems. In Entrepreneurial Ecosystems: Place-Based Transformations and Transitions; O’Connor, A., Stam, E., Sussan, F., Audretsch, D.B., Eds.; Springer International Publishing: Cham, Switzerland, 2018; pp. 173–197. [Google Scholar]
  44. Perugini, F. Space–Time Analysis of Entrepreneurial Ecosystems. J. Technol. Transf. 2022, 48, 240–291. [Google Scholar] [CrossRef]
  45. Cao, Z.; Shi, X. A Systematic Literature Review of Entrepreneurial Ecosystems in Advanced and Emerging Economies. Small Bus. Econ. 2020, 57, 75–110. [Google Scholar] [CrossRef]
  46. Neumeyer, X.; Santos, S.C. Sustainable Business Models, Venture Typologies, and Entrepreneurial Ecosystems: A Social Network Perspective. J. Clean. Prod. 2018, 172, 4565–4579. [Google Scholar] [CrossRef]
  47. Kitsios, F.; Kamariotou, M.; Grigoroudis, E. Digital Entrepreneurship Services Evolution: Analysis of Quadruple and Quintuple Helix Innovation Models for Open Data Ecosystems. Sustainability 2021, 13, 12183. [Google Scholar] [CrossRef]
  48. Ren, J.; Yang, J.; Huang, H. Research on the Innovation District Mechanism: Ecology, Subject and Space. Urban Dev. Stud. 2020, 27, 18–25. [Google Scholar]
  49. Auerswald, P.E.; Dani, L. The Adaptive Life Cycle of Entrepreneurial Ecosystems: The Biotechnology Cluster. Small Bus. Econ. 2017, 49, 97–117. [Google Scholar] [CrossRef]
  50. Yigitcanlar, T.; Guaralda, M.; Taboada, M.B.; Pancholi, S. Place Making for Knowledge Generation and Innovation: Planning and Branding Brisbane’s Knowledge Community Precincts. J. Urban Technol. 2016, 23, 115–146. [Google Scholar] [CrossRef]
  51. Xu, F.C.; Wu, L.; Evans, J.A. Flat Teams Drive Scientific Innovation. Proc. Natl. Acad. Sci. USA 2022, 119, e2200927119. [Google Scholar] [CrossRef]
  52. García-Terán, J.; Skoglund, A. A Processual Approach for the Quadruple Helix Model: The Case of a Regional Project in Uppsala. J. Knowl. Econ. 2019, 10, 1272–1296. [Google Scholar] [CrossRef]
  53. Shi, X.; Chen, Y.; Xia, M.; Zhang, Y. Effects of the Talent War on Urban Innovation in China: A Difference-in-Differences Analysis. Land 2022, 11, 1485. [Google Scholar] [CrossRef]
  54. Shi, J.; Lai, W.-H. Fuzzy Ahp Approach to Evaluate Incentive Factors of High-Tech Talent Agglomeration. Expert Syst. Appl. 2022, 212, 118652. [Google Scholar] [CrossRef]
  55. Granstrand, O.; Holgersson, M. Innovation Ecosystems: A Conceptual Review and a New Definition. Technovation 2020, 90–91, 102098. [Google Scholar] [CrossRef]
  56. Thai, Q.H.; Mai, K.N.; Do, T.T. An Evolution of Entrepreneurial Ecosystem Studies: A Systematic Literature Review and Future Research Agenda. SAGE Open 2023, 13, 1. [Google Scholar] [CrossRef]
  57. Mack, E.A.; Mayer, H. The Evolutionary Dynamics of Entrepreneurial Ecosystems. Urban Stud. 2016, 53, 2118–2133. [Google Scholar] [CrossRef]
  58. Audretsch, D.B.; Cunningham, J.A.; Kuratko, D.F.; Lehmann, E.E.; Menter, M. Entrepreneurial Ecosystems: Economic, Technological, and Societal Impacts. J. Technol. Transf. 2018, 44, 313–325. [Google Scholar] [CrossRef]
  59. Haarhaus, T.; Strunk, G.; Liening, A. Assessing the Complex Dynamics of Entrepreneurial Ecosystems: A Nonstationary Approach. J. Bus. Ventur. Insights 2020, 14, e00194. [Google Scholar] [CrossRef]
  60. Gotts, N.M. Resilience, Panarchy, and World-Systems Analysis. Ecol. Soc. 2007, 12, 24. [Google Scholar] [CrossRef]
  61. Feng, L.; Lu, J.; Wang, J. A Systematic Review of Enterprise Innovation Ecosystems. Sustainability 2021, 13, 5742. [Google Scholar] [CrossRef]
  62. Lin, X.; Lu, M. Report on Evaluation of China Innovation Cities. Stat. Res. 2009, 26, 3–9. [Google Scholar]
  63. Pancholi, S.; Yigitcanlar, T.; Guaralda, M. Attributes of Successful Place-Making in Knowledge and Innovation Spaces: Evidence from Brisbane’s Diamantina Knowledge Precinct. J. Urban Des. 2018, 23, 693–711. [Google Scholar] [CrossRef]
  64. Cheah, S.L.-Y.; Ho, Y.P. Building the Ecosystem for Social Entrepreneurship: University Social Enterprise Cases in Singapore. Sci. Technol. Soc. 2019, 24, 507–526. [Google Scholar] [CrossRef]
  65. Uçar, E. Local Creative Culture and Corporate Innovation. J. Bus. Res. 2018, 91, 60–70. [Google Scholar] [CrossRef]
  66. Carayannis, E.G.; Campbell, D.F.J.; Grigoroudis, E. Helix Trilogy: The Triple, Quadruple, and Quintuple Innovation Helices from a Theory, Policy, and Practice Set of Perspectives. J. Knowl. Econ. 2021, 13, 2272–2301. [Google Scholar] [CrossRef]
  67. Yu, C.; Wang, T.; Gu, X. Collective Reputation Cognition, Network Competence and Enterprise Innovation Performance. Manag. Decis. 2022, 60, 567–588. [Google Scholar] [CrossRef]
  68. Pradhan, R.P.; Maradana, R.P.; Dash, S.; Zaki, D.B.; Gaurav, K.; Jayakumar, M.N. Venture Capital, Innovation Activities, and Economic Growth: Are Feedback Effects at Work? Innovation 2017, 19, 189–207. [Google Scholar] [CrossRef]
  69. Li, Y.; Wang, J.; Liu, Y.; Long, H. Spatial Pattern and Influencing Factors of the Coordination Development of Industrialization, Informatization, Urbanization and Agricultural Modernization in China: A Prefecture Level Exploratory Spatial Data Analysis. Acta Geogr. Sin. 2014, 69, 199–212. [Google Scholar]
  70. Li, C. China’s Multi-Dimensional Ecological Well-Being Performance Evaluation: A New Method Based on Coupling Coordination Model. Ecol. Indic. 2022, 143, 109321. [Google Scholar] [CrossRef]
  71. Zhu, Y.; Tang, C.; Sun, R.; Lei, J. Evaluation of China Science and Technology Innovation City Based on System Coupling. Sci. Technol. Manag. Res. 2019, 39, 10. [Google Scholar]
  72. Xu, Z.; Chau, S.N.; Chen, X.; Zhang, J.; Li, Y.; Dietz, T.; Wang, J.; Winkler, J.A.; Fan, F.; Huang, B.; et al. Assessing Progress Towards Sustainable Development over Space and Time. Nature 2020, 577, 74–78. [Google Scholar] [CrossRef]
  73. Getis, A. The Analysis of Spatial Association by Use of Distance Statistics. Geogr. Anal. 2010, 24, 189–206. [Google Scholar] [CrossRef]
  74. Symanzik, J. Exploratory Spatial Data Analysis. In Handbook of Regional Science; Fischer, M.M., Nijkamp, P., Eds.; Springer: Berlin/Heidelberg, Germany, 2014; pp. 1295–1310. [Google Scholar]
  75. Shen, L.; Huang, Z.; Wong, S.W.; Liao, S.; Lou, Y. A Holistic Evaluation of Smart City Performance in the Context of China. J. Clean. Prod. 2018, 200, 667–679. [Google Scholar] [CrossRef]
  76. Notice on the Issuance of the Implementation Rules for Promoting Postdoctoral Innovation and Entrepreneurship in Qingdao City. Available online: http://www.qingdao.gov.cn/zwgk/xxgk/rlshbz/gkml/gwfg/202205/t20220523_6067388.shtml (accessed on 10 August 2023).
  77. Liyanage, S.I.H.; Netswera, F.G. Greening Universities with Mode 3 and Quintuple Helix Model of Innovation–Production of Knowledge and Innovation in Knowledge-Based Economy, Botswana. J. Knowl. Econ. 2022, 13, 1126–1156. [Google Scholar] [CrossRef]
  78. Ren, J.; Hu, X.; Yu, L. “Industry, City, Innovation” Integrated Development Model. Planners 2018, 9, 94–99. [Google Scholar]
  79. Wang, J.; Zhang, X. Land-Based Urbanization in China: Mismatched Land Development in the Post-Financial Crisis Era. Habitat Int. 2022, 125, 102598. [Google Scholar] [CrossRef]
  80. Wang, Y.; Duan, X.; Wu, K. The Dilemma and Outlet of the Industry Transformation and Upgrading of the City’s “Vacating Cage to Change Birds”: Based on the Investigation and Study in Beijing. Sci. Geogr. Sin. 2020, 40, 786–792. [Google Scholar]
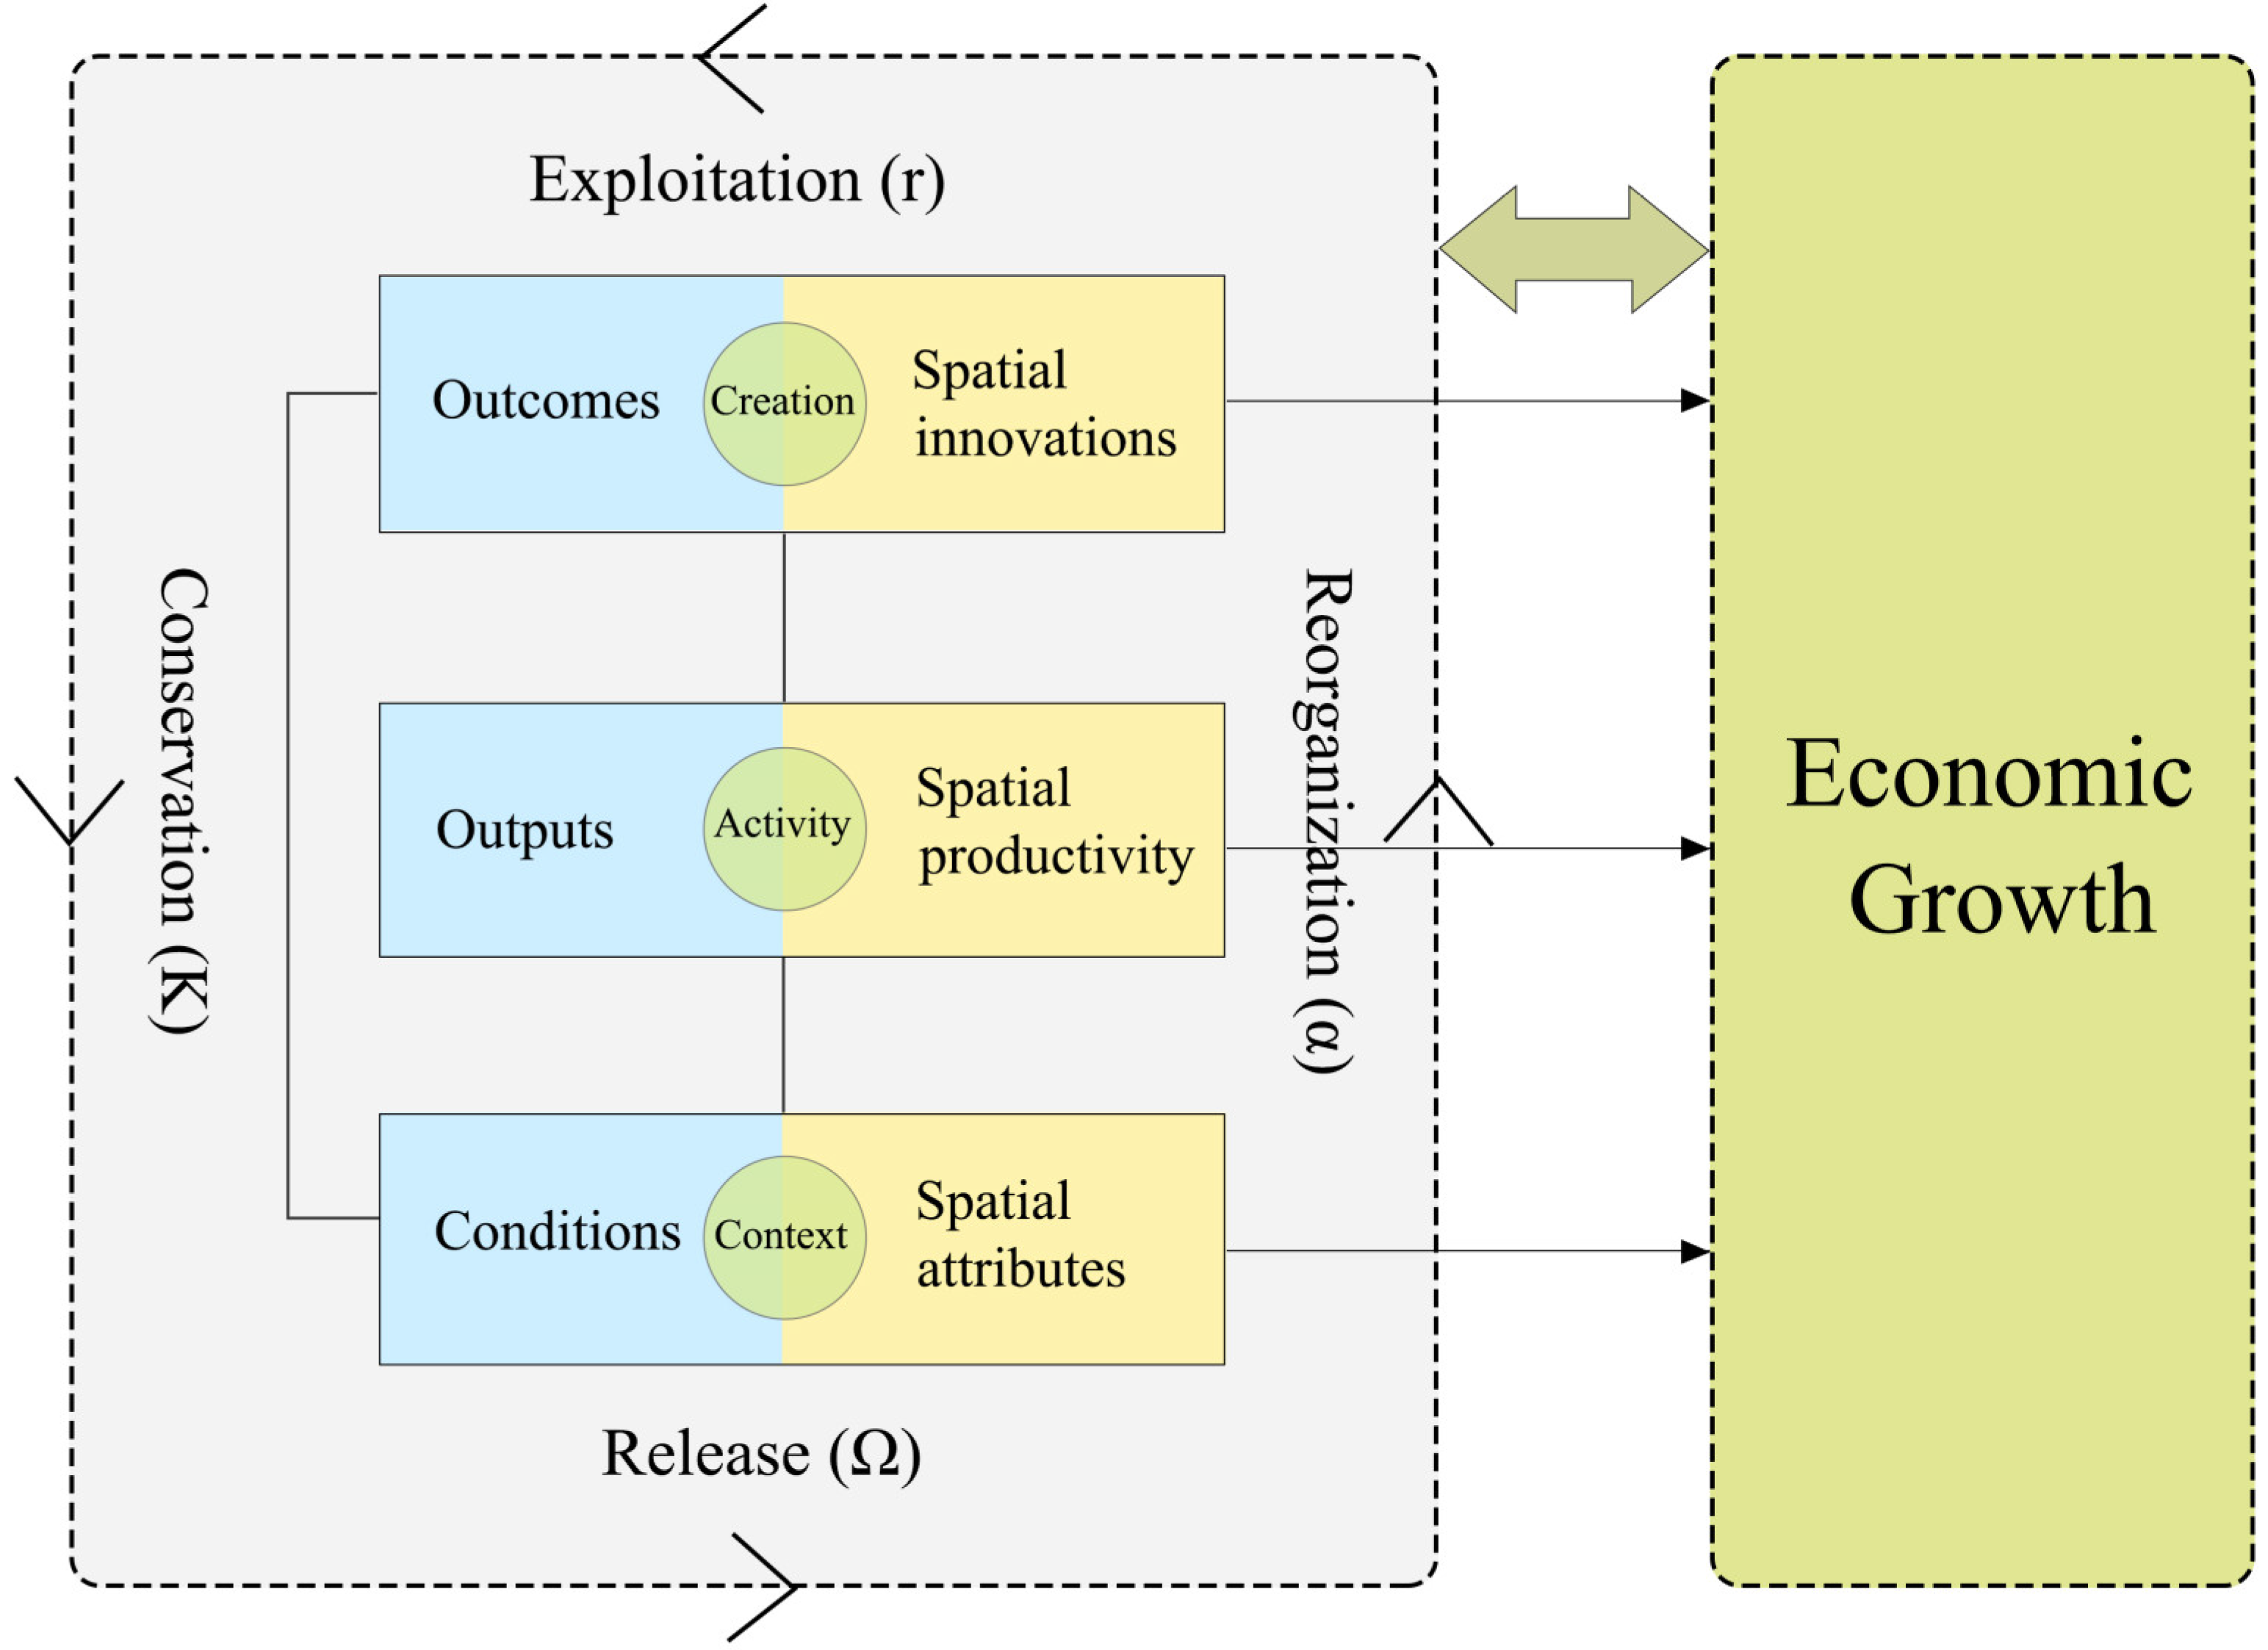
Figure 1. Conceptual framework for assessing the potential for developing innovation districts.
Buildings 13 02572 g001
Figure 2. Location of the study area.
Buildings 13 02572 g002
Figure 3. (a) Calculation results of the coupling coordination degree model. (b) Potential value of “output” dimension. (c) Potential value of “outcomes” dimension. (d) Potential value of “conditions” dimension.
Buildings 13 02572 g003
Figure 4. Classification results and spatial distribution of subdistrict units.
Buildings 13 02572 g004
Figure 5. (a) Local Moran scatter plot of the potential for developing innovation districts. (b) The 3-D values of the potential of each innovation district cluster.
Buildings 13 02572 g005
Figure 6. Adaptive cycle phase of each innovation district cluster in Qingdao City.
Buildings 13 02572 g006
Table 1. Indicator system for assessing the potential to develop innovation districts.
CriteriaIndicatorWeightCriteriaIndicatorWeight
ConditionsCommercial network density0.1178OutputsNumber of SMEs per square kilometer0.2208
Degree of functional mix0.1783Percentage of corporate R&D personnel0.1394
Green area per capita0.1262Number of key laboratories per square kilometer0.1596
Number of technical cooperation bases per square kilometer0.1304Number of university campuses per square kilometer0.1112
Number of advanced service enterprises per square kilometer0.1470Number of science and technology parks per square kilometer0.1964
Number of co-working spaces per square kilometer0.1901Number of venture capital institutions per square kilometer0.1726
Number of cultural exchange venues per square kilometer0.1102
Outcomesinnovation output value per capita0.6666
Number of patents grants per capita0.3334
Table 2. Statistical results of the classification of subdistrict units.
CategoryArea Ratio
(%)
SubcategoryCoupling CharacteristicsQuantity
(Pieces)
Category I20.08%IaHigh S 1 -High S 2 -High S 15
Category II22.04%IIaHigh S 1 -High S 2 -Low S 3 5
IIbLow S 1 -High S 2 -High S 3 16
IIcHigh S 1 -Low S 2 -High S 3 2
Category III57.16%IIIaHigh S 1 -Low S 2 -Low S 14
IIIbLow S 1 -High S 2 -Low S 3 12
IIIcLow S 1 -Low S 2 -High S 8
Table 3. Potential values and countermeasures for developing innovation districts.
CategoryValue
Interval
Development
Phase
Counter Measures
High potential
(Cluster A and Cluster B)
[0.3736,
0.3376]
Conservation (K) phaseMaintain the current level and make up for the shortcomings
Medium potential
(Cluster C and Cluster D)
[0.2771,
0.3015]
Exploitation (r)
phase
Take advantage of the environment and facilities to attract talented people, promote industrial upgrading, and realize the re-prosperity of space
Low potential
(Cluster E and Cluster F)
[0.1435,
0.1847]
Reorganization (α) phaseStabilize existing platforms and absorb external advantages to achieve leapfrog development
Disclaimer/Publisher’s Note: The statements, opinions and data contained in all publications are solely those of the individual author(s) and contributor(s) and not of MDPI and/or the editor(s). MDPI and/or the editor(s) disclaim responsibility for any injury to people or property resulting from any ideas, methods, instructions or products referred to in the content.