Article

Chemical and Creep Models Applied to Concrete Damaged by Alkali–Silica Reactions

by
Rodrigo F. Roma
1,
Fernando A. N. Silva
1,
Mohamed K. Bourbatache
2,
Mahfoud Tahlaiti
3,
João M. P. Q. Delgado
4,* and
António C. Azevedo
5
1
Civil Engineering Department, Pernambuco Catholic University, Recife 50050-900, Brazil
2
Institut National des Sciences Appliquées de Rennes, 35700 Rennes, France
3
Research Institute in Civil Engineering and Mechanics, Centrale Nantes, 44321 Nantes, France
4
CONSTRUCT-LFC, Department of Civil Engineering, Faculty of Engineering, University of Porto, 4200-465 Porto, Portugal
5
Instituto Federal de Ciências de Educação e Tecnologia de Pernambuco (IFPE), Recife 50670-430, Brazil
*
Author to whom correspondence should be addressed.
Buildings 2023, 13(10), 2575; https://doi.org/10.3390/buildings13102575
Submission received: 13 September 2023 / Revised: 2 October 2023 / Accepted: 9 October 2023 / Published: 12 October 2023
(This article belongs to the Section Building Materials, and Repair & Renovation)

Abstract

:
Concrete structures that experience internal swelling reactions are often affected by other deleterious mechanisms, such as creep and shrinkage. In Brazil and many other countries around the world, numerous cases of building foundations and concrete dams were investigated due to the damage associated with internal expansions. Macroscopic models for the numerical representation of these expansions must take into account the influence of key environmental parameters such as temperature, degree of saturation, and the rate of development of the chemical reaction. To be relevant in structural applications, concrete creep models must consider several important phenomena, such as non-linearity, multi-axiality, and thermal and drying effects. In order to prevent these pathologies, to plan rehabilitation work, and to develop new design procedures, numerical simulation using the finite element method (FEM) is a very useful tool. This work aimed to implement a chemical model to simulate the advancement of the internal expansion reactions and a mechanical model to simulate creep and shrinkage phenomena in COMSOL Multiphysics® to reassess concrete structures suffering from these mechanisms. Both models were implemented separately to evaluate their responses and compare them with the theoretical results and experimental benchmarks proposed by the developers of these models. The numerical results obtained presented an excellent agreement with the experimental results, with a deviation of less than 10%, which showed that the implementation of the developed numerical models was very efficient. Moreover, this research holds significant importance as the mathematical models used to simulate internal expansions in concrete are currently only available in limited-use FEM software’s. Therefore, demonstrating the successful implementation of these models in widely used finite element programs and their ability to produce reliable results would be a valuable contribution.

1. Introduction

Concrete is probably the most used civil construction material in the modern world. Among the biggest consumers of this material in the construction of buildings and public infrastructure are developing countries such as China, India, and Brazil. In this context, the durability of concrete structures has been an important research topic worldwide because rehabilitation works on early deteriorated structures usually involve many financial resources [1].
Assessment of the structural behavior of the material under mechanical and environmental loads usually requires consideration of its viscosity, elasticity, and plastic behavior. Thus, the material can be considered as an elasto-viscoplastic material, and its deformation properties can result from shrinkage, creep, and damage phenomena (in compression or tension) [2].
Stresses associated with shrinkage and creep are considered to be two major factors affecting the durability of concrete structures over time. To better understand how these stresses evolve, many experimental test campaigns and numerical models have been developed, with the main aim of predicting specific responses to these phenomena [3].
Another important issue that changes the material’s strength and strain properties is the internal expansion response of concrete, which causes the material to expand. Chemical and physical expansion processes activated by certain environmental conditions can lead to significant losses in the strength and stiffness of concrete structures [3]. When these environmental conditions exist, expansion damage may occur due to one or more pathologies affecting concrete structures [1,4].
The inadequate durability of concrete can be seen in pathological manifestations. Agents of these pathologies can arise within the material or from its interaction with the external environment. Internally, these agents can be found in cement or aggregates’ chemical and mineralogical composition. Externally, aggressive substances penetrate the interior of concrete structures through the capillary network (connected porous matrix) in the form of gases, vapors, or liquids, leading to chemical deterioration, which may involve the formation of expansive products (e.g., the alkali–aggregate reaction—AAR) [1,5].
Some pathologies such as the alkali–silica reaction (ASR) and delayed ettringite formation (DEF), external sulfate attack, and even frost, are considered as internal swelling processes (ISPs). ISPs cause internal expansions in the concrete, leading to an early cracking occurrence with a consequent decrease in its mechanical properties and the durability of the material. These pathological manifestations often cause severe problems in terms of serviceability, structural integrity, and sustainable operation of concrete structures. ASR and DEF are often observed to occur simultaneously in concrete structures, necessitating a precise understanding of these processes when they occur in isolated or combined situations [6]. In general, the alkali–aggregate reaction (AAR) is a phenomenon involving chemical reactions in which some constituents of the aggregate react with the alkaline hydroxides dissolved in the solution of the concrete pores. Under specific conditions, deleterious expansion of concrete or mortar may result from AARs [7]
Four conditions must be satisfied to generate AARs in concrete:
  • the use of reactive aggregate;
  • an adequate level of alkalinity;
  • sufficient moisture in the pores of concrete;
  • high temperature.
Understanding AAR is very complex, and these processes play an important role in the pathologies found in large structures such as bridges, railroads, dams, and building foundations. The damage caused by AAR ranges from localized cracking to widespread failure and performance degradation. The effective resolution of this problem is also very complex, as the description of the reaction mechanism has not yet been conclusively formulated and accepted worldwide, and experimental tests to carefully observe the phenomenon require a considerable amount of time and resources.
As the evolution of ASR is a process that usually takes many years to produce visible damage, it is very important to predict the behavior of concrete structures affected by ASR, so that it is possible to assess the stability and durability of these structures. On the other hand, numerical simulations of concrete structures affected by ASR generally neglect the important interactions and effects of time on concrete, such as creep and shrinkage [1,8,9].
The research gap refers to the limited understanding of internal expansion reactions in concrete structures at a microstructural level. While empirical data and macroscopic models offer some insights, they lack the precision required to capture the complexities of these reactions. However, by utilizing finite element analysis, it becomes possible to examine internal expansion reactions in concrete in great detail, taking into account chemical processes, material properties, and structural interactions at a microscopic level. This approach allows for more accurate predictions of expansion behavior, which is crucial for designing durable concrete structures capable of withstanding the long-term effects of internal reactions and improving the safety and reliability of infrastructure projects. Moreover, this research holds significant importance as the mathematical models used to simulate internal expansions in concrete are currently only available in limited-use FEM software. Therefore, demonstrating the successful implementation of these models in widely used finite element programs and their ability to produce reliable results would be a valuable contribution.

Research Significance

The rapid development of large cities around the world has generated a growing demand for new infrastructure equipment (such as highways, dams, long tunnels, bridges, viaducts, and power stations). This demand usually requires the use of large quantities of concrete, along with a significant volume of aggregates—both fine and coarse. Design and construction engineers need to exercise caution in this regard, as the use of potentially reactive aggregates can increase the risk of expansive reactions occurring within the concrete. This is an important issue because reactive aggregates are readily available at a lower cost and with a lower environmental impact compared to non-reactive materials [10]. However, the use of reactive aggregates can also lead to the development of internal expansive reactions from various sources, which can damage the concrete, even at an early stage [5].
The internal expansion in concrete can result in significant deterioration, leading to costly maintenance or rehabilitation expenses for affected structures. Numerous countries have reported instances of delayed ettringite formation (DEF) and alkali–aggregate reactions (AAR) occurring in concrete infrastructure equipment. These occurrences typically coincide when siliceous aggregates, high temperatures, and moisture during the curing phase are present.
In certain countries, significant financial resources have been allocated towards the repair and upkeep of concrete structures impacted by internal expansions. For instance, Broekmans [11] documented an annual expenditure of EUR 2 billion for the maintenance and reconstruction of ASR-affected structures in Europe. Similarly, South Africa expended approximately USD 350 million between 1970 and 1996. In 2008, sponsors of the ICAAR Conference estimated that the yearly expense for rehabilitating and re-placing buildings affected by internal expansion reactions amounted to USD 2.6 billion.
One important example is the Elgeseter Bridge. In the early 1990s, USD 6.8 million was spent on rehabilitating a large part of the bridge’s superstructure, which had been affected by the AAR, an amount much higher than that invested in its construction [12].
These significant sums of money are a major concern for the construction industry and also for governments around the world. This has led to the creation and funding of many research centers (e.g., LMDC-INSA) to develop appropriate technology for the characterization, mitigation, and repair of affected structures. The main research centers are located in France, Canada, the UK, Germany, and the USA.
In this context, conducting research that enhances the understanding of internal expansions in concrete and enables the development of design and construction strategies to minimize their impact is a significant scientific matter. From this perspective, utilizing numerical simulations with the finite element method to analyze the phenomenon is a promising approach to quantifying the extent of damage caused by these reactions. The findings from these simulations can assist in making informed decisions regarding the most suitable structural rehabilitation strategies to be implemented, and they can also serve as a foundation for revising the design and construction criteria for concrete structures in areas where these reactions are likely to occur [13].

2. Swelling and Cracking Mechanisms Related to ASR

ASR causes expansion and cracking in concrete, and this process drastically reduces the durability of the material. ASR is caused by certain rocks and siliceous minerals, such as opal, chert, microcrystalline quartz, and acid volcanic glass, which are present in some aggregates. This expansion reaction is recognized as one of the most important causes of concrete structure deterioration in the USA and in several countries around the world [14].
Although it usually occurs in several stages, ASR expansions can be summarized in two steps. The first one is the rupture of the aggregated siloxane networks (Si-O-Si) caused by the attack of hydroxyl ions. This process produces alkali silicate and silicic acid, which react immediately with more hydroxyl ions. The product resulting from this reaction—alkali silicate or alkali–silica gel—is amorphous and hygroscopic. The second stage is the expansion of the alkali–silica gel due to the absorption of free water, which causes cracks in the cement paste and in the aggregate.
The ASR product is solid in the absence of water and in this state is usually referred to as a basic gel. The gel has the ability to absorb water molecules, which causes it to swell and transform into a fluid. From a microscopic point of view, the evolution of ASR can be seen as a four-stage process. Stage I, generally referred to as the micro nucleation stage, is the onset of the reaction that starts around the aggregate, causing practically no expansion. The formation of the gel in the pores of the aggregates occurs in Stage II, when the stresses that will crack the material are induced.
Acceleration of the reaction occurs in Stage III. At this point, the deterioration process of the material becomes more visible, and cracks spread to the cement paste. At this stage, the size and amount of cracks increase and the gel circulates between them, reaching more distant voids inside the cement paste. The stage where material deterioration is clearly visible with reinforcement bar rupture and loss of material integrity is referred to as Stage IV.
The mechanism of expansion and cracking in concrete due to the ASR is very complex and it is still not completely understood. Despite that, it is widely accepted that the resulting deleterious process arises from the water absorption by the gel, causing its expansion and increasing internal tensile stresses. When these tensile stresses overcome the material strength, surface cracks form and spread in a non-uniform way.
Osmotic pressure theory states that the cement paste works as a semipermeable membrane surrounding the reactive aggregate. This way, it avoids the diffusion of alkali–silicate ions from the reactive locations into the surrounding cement paste, while the water can move through the pore solution. Therefore, an osmotic pressure cell forms and the alkali–silica gel swells with the increasing hydrostatic pressure, inducing cracking in the cement paste [15,16,17].
Mechanical expansion theory suggests that a solid layer of alkali silicate forms on the surface of the reactive aggregate. This layer absorbs water from the pore solution and changes from a solid to a gel, and this is followed by the absorption of more water into the gel. As a result, the gel swells, inducing cracks in the cement paste.
Another mechanism proposed by Ichikawa and Miura [18] states that the diffusion of the viscous alkali–silicate gel does not occur due to the tight packing of the reactive aggregate with an insoluble and rigid reaction rim. However, it does allow the alkaline solution to penetrate. Once the rim is formed, any excess alkali–silica gel produced is stored within the aggregate, resulting in the generation of expansive pressure. When the material’s strength is surpassed, it leads to cracking in the aggregates and the surrounding cement paste.

2.1. Factors Influencing the Evolution of ASR

There are several factors that can affect the expansion of a concrete structure induced by ASR. These include the alkali content in the cement, the type and size of the aggregate, the 3D confining stresses, the ambient temperature, and the relative humidity [19,20].
The specific surface area of aggregates has an impact on swelling. More gel can migrate into the connected porosity of a smaller aggregate compared to a larger one. Additionally, a pessimum effect is observed, depending on the size of the aggregates. The size of the aggregate that leads to the highest ASR expansion depends on the nature and composition of the aggregate. For aggregates that react quickly, it has been found that the quantity of soluble silica is similar for different particle sizes of a specific aggregate. However, the expansion varies for different sizes, with higher expansions observed for coarse particles. This phenomenon can be explained by the amount of silica consumed during the cracking of the aggregate. When the aggregate is small, cracking occurs, and the silica is strongly attacked. In contrast, for a larger aggregate, its core has not yet reacted at the time of cracking. The resulting ASR gel only causes a small increase in pressure due to the space created by the cracking [21,22].
Accelerated laboratory tests have shown that temperature directly affects the progression of ASRs. In other words, higher temperatures lead to faster reactions. This phenomenon can be explained by the fact that as the temperature rises, the solubility of silica increases while the solubility of calcium hydroxide decreases. This makes the silica more conducive to reaction and reduces the ability of calcium hydroxide to combine with the gel. As a result, the rate of expansion due to ASR increases [23].
The ASR gel is hydrophilic and has a high water absorption capacity. Experimental data indicate that its expansion is directly influenced by the relative humidity (RH) of the surrounding environment. Ulm et al. [24] showed that significant swelling occurs when the relative humidity exceeds approximately 70%. Other studies have suggested that the final swelling is less pronounced at 100% relative humidity compared to 96%, potentially due to alkali leaching.
The confining stresses are widely recognized as crucial factors influencing the expansion caused by ASR. These stresses have the ability to limit or even completely hinder the free expansion of the concrete structure. When compression stress is applied in a specific direction, it can decrease the expansion in that particular direction. Conversely, tensile stress can amplify the expansion in that direction [25].

2.2. Numerical Modeling of ASR

Numerical models capable of describing the alkali–silica reaction (ASR) have been developed since the 1980s. However, the scientific community has not yet reached a consensus on a model that can fully describe and replicate the evolution of ASR-affected concrete structures, as well as on the parameters that should be considered in the model [26,27,28].
Mathematical models can be categorized based on their scale as microscopic, mesoscopic, and macroscopic models [9]. Microscopic models focus solely on chemical reactions and typically analyze a representative volume element (RVE) consisting of a cement–aggregate system. Mesoscopic models aim to capture the mechanical deterioration of ASR on a material scale and propose establishing a connection with larger structures. Concrete anisotropy is represented by coupling the multiphase nature of concrete (aggregate, cement paste, pores, and ASR gel). ASR swelling is depicted as either the expansion of randomly distributed gels or an equivalent expansion of aggregate particles. Macroscopic models address the coupled chemo–mechanical behavior of ASR-induced expansion in affected concrete structures by combining chemical reaction kinetics with linear or non-linear mechanical constitutive equations formulated within the framework of the finite element method (FEM). These models aim to replicate and predict the long-term behavior observed in real ASR-affected concrete structures.

3. Poromechanical Theory

Poroelasticity is a mechanical theory that explains the behavior of porous materials, including soils and rocks, under stress. It combines the principles of fluid mechanics, elasticity, and porosity to model the flow and deformation of fluids within porous materials. The theory takes into account the effects of fluid pressure and stress on the solid matrix of the material, as well as the interaction between these factors, which ultimately affect the overall deformation of the material.

3.1. Chemical Modelling

The ASR (alkali–silica reaction) causes the formation of new phases within the porous matrix of concrete. This leads to increased pressure on the solid skeleton of the concrete due to limited space, resulting in tensile stresses around the reactive locations (aggregates). Therefore, the theory of poro-mechanics considers the impact of this intrapore pressure on the solid skeleton of the concrete [20].
The physical phenomena responsible for the degradation of the mechanical behavior of concrete structures affected by ASR typically involve the following phases: (a) creation of the ASR gel—chemical reactions lead to the formation of a volume of intrapore swelling product known as ASR gel; (b) creation of intrapore pressure—once the entire pore volume surrounding the reactive site (silica aggregate) is filled with the reaction product, intra-pore pressure is generated; (c) development of diffuse cracking—intra-pore pressures generate tensile stresses in the cement paste, and when these stresses exceed the material’s tensile strength, a process of diffuse cracking initiates; (d) creep due to intra-pore pressures—over time, as the pressure from the gel continues to exert itself on the solid skeleton, creep occurs; (e) development of localized cracking—when external loading is applied to the concrete structure, localized cracks may form. These cracks facilitate the penetration of water and other harmful agents such as CO2, which can accelerate or reactivate the swelling reaction.
The advancement of the reaction ( A a s r ) has values ranging from 0 (before the onset of the reaction) to 1 (when the reaction is complete). This advancement can be calculated by:
δ A a s r δ t = 1 τ r e f a s r · C T , a s r · C W , a s r · S r A a s r +
where τ r e f a s r is the characteristic time (calibrated using a free-swelling test), S r is the saturation degree, C T , a s r is the coefficient for temperature effect, and C W , a s r is the coefficient for humidity effect. The effect of temperature ( C T , a s r ) is formulated with an Arrhenius’ law as:
C T , a s r = e x p   E a s r R · 1 T 1 T r e f
where E a s r is the thermal activation energy (40.000 J/mol), T r e f is the reference temperature (calibrated on the same test as τ r e f a s r ), R is the perfect gas constant (8.1314 J/molK), and T is the temperature in kelvin.
The relative humidity effect ( C W , a s r ) is assessed using a potential law (Equation (3)), which effectively captures the nonlinear escalation of humidity’s influence on ASR, particularly the significance of saturation levels.
C W , a s r = S r S r t h , a s r 1 S r t h , a s r 2   i f   S r > S r t h , a s r   0   i f   S r S r t h , a s r  
where S r t h , a s r is the threshold saturation degree, representing the minimum saturation degree required to initiate the chemical reaction. Consequently, the chemical reactions lead to the formation of ASR gel ( ϕ a s r ) within a specified time period, t.
ϕ a s r t = ϕ a s r , · A a s r ( t )
where ϕ a s r , represents the maximum volume ratio of gel that can be formed, and this is determined through the free-swelling test under the same conditions as τ r e f a s r .
Table 1 presents a summary of the key material parameters utilized for the calculation of ASR gel volume. It also includes the range of values, units of measurement, and the calibration tests necessary to determine these parameters.
The intrapore pressure ( P a s r ) induced by the swelling of the ASR gel is determined by the volume of gel produced. This volume ( ϕ a s r ) is compared to the available volume for the gel to expand into ( ϕ a s r v ) in order to calculate the pressure at any given moment:
P a s r = M a s r · ϕ a s r ϕ a s r v · ( P a s r R ~ I t ) + b a s r · t r ε e + ε c r + t r ε p , a s r + +
where M a s r represents the Biot modulus, which governs the interaction between ASR gel and the cement matrix; b a s r is the Biot coefficient used to account for the increase in porosity volume caused by the evolution of intrapore pressure; ϕ a s r v denotes the available void volume; R ~ I t refers to the micro-tensile strength of the material; t r ε e + ε c r represents the variation of porosity due to concrete strain, comprising the sum of elastic strain ( ε e ) and creep strain ( ε c r ) of the cement matrix; t r ε p , a s r is the variation of porosity due to plastic strain, representing the volume of cracks generated by ASR and assumed to be completely filled by the ASR gel, which is composed of the trace of the plastic strains ( ε p , a s r ) of the cement matrix; and + denotes the Macaulay bracket, which indicates the positive part operator.
The permeation of the gel ( φ a s r v ) is affected by various factors, including connected porosity, changes in the volume of voids where the gel forms (due to elastic strains or creep of the cement matrix), and the volume of cracks caused by the ASR. Table 2 provides a summary of the key material parameters used to determine the volume of the ASR gel, along with the range of values, units of measurement, and necessary calibration tests.

3.2. Creep Modelling

In this model, the concrete is considered to be a porous material consisting of a pore space filled with expansive gel products, embedded in a solid matrix that represents the concrete skeleton. The drying effect, which impacts the material properties, is simulated using the concept of effective stress. The strain over time is divided into three components: elastic strain, permanent creep strain, and reversible creep strain. The latter two strains correspond to the Maxwell chain and the Kelvin chain, respectively.
Although the microstructure of concrete is not explicitly simulated, the constitutive equations of the model account for the various underlying phenomena caused by the heterogeneity of the material. The model assumes that the viscous behavior occurs in the C–S–H interlayers, while the other hydrates and aggregates are considered non-viscous elements.

3.2.1. Permanent Creep—Maxwell Strain

Permanent creep is represented by a Maxwell module, which is assumed to be directly derived from the corresponding elastic strain components ( ε I E ). Experimental data support the proportionality between the creep velocity and ε I E , indicating that multiaxial creep begins with relative strain rates in different directions ( I ) that are proportional to ε I E . As a result, the Maxwell strain component ( ε I M ) can be expressed as:
ε I M t = ε I E τ I M
where τ I M represents the characteristic time associated with ε I M and I is the eigenvalue used to represent the main directions.
The characteristic time is expressed as a function of the reference characteristic time ( τ r e f M ), which characterizes the initial material state and the consolidation function ( C I C ). τ r e f M is a fitting parameter that is inversely proportional to the initial creep velocity under controlled conditions (temperature, humidity, and mechanical loading). C I C takes into account the non-linear relationship between the creep potential and the loading rate.
τ I M = τ r e f M · C I C
The consolidation function is written as an anisotropic formulation to consider the varying rates of consolidation in the three main creep directions. Its purpose is to incorporate the decrease in the creep strain rate over time without depending solely on the time variable.
C I C = 1 k · e x p 1 k · ε I M ε I E +
where k is the creep coefficient for the same conditions as τ r e f M and + is the Macaulay bracket, which denotes the positive part operator.
The creep coefficient can be expressed as follows, as it is influenced by physical conditions such as temperature (T), relative humidity (H), and mechanical stress (M):
k = k r e f · C T · C H · C M
where k r e f is the reference creep coefficient and C T , C H , and C M are the functions associated with the impact of temperature, humidity, and mechanical loading, respectively.
The reference creep coefficient is then expressed as:
k r e f = ε r e f M ε r e f E
where ε r e f E represents the reference elastic strain, which is a fitting parameter obtained for a specific applied loading level, and ε r e f M denotes the reference creep potential, which is a fitting parameter associated with the amplitude of the creep function. Both ε r e f E and ε r e f M are defined under the same conditions.
The reference elastic strain refers to the strain observed during the creep test when the load is at 30% or less of the compressive strength. In cases where creep tests have not been conducted on actual structures, this strain can be estimated by dividing the uniaxial compressive strength (Rc) by the modulus of elasticity (E), and it is expressed as follows:
ε r e f E = R c 3 E
The function related to the influence of relative humidity ( C H ) is taken to be equal to the saturation degree ( S r ), expressed as:
C H = S r
The function that describes the influence of temperature ( C T ) is considered as the combination of two functions: the first one represents the impact of temperature on water viscosity ( C w T ) and the second one represents the impact of temperature on the differential expansion between the inviscid and viscous phases ( C p T ).
C T = C w T · C p T
The two functions C w T and C p T can be expressed as Arrhenius laws in the following manner:
C w T = e x p   E w a R · 1 T 1 T r e f , c r e e p
C p T = e x p   E p a R · 1 T 1 T t h r   i f   T > T t h r 1   i f   T T t h r
where E w a is the activation energy of water viscosity, approximately 17,000 J/mol; R is the ideal gas constant, 8.1314 J/(mol.K); T represents the ambient temperature; T r e f , c r e e p is the reference temperature used for fitting τ r e f M ; E p a is the activation energy for differential dilation between phases, approximately 25,000 J/mol; and T t h r is the temperature threshold, approximately 45 °C, at which thermal damage occurs and alters the creep potential.
The function associated with the influence of the mechanical loading ( C M ) begins at 1 for materials with low loads and deviates once the loading level reaches a critical value that leads to tertiary creep. Tertiary creep is assumed to occur only when there is microstructural damage. Hence, C M is linked to an equivalent Drucker–Prager criterion expressed as follows:
C M = τ c r D P τ c r D P τ D P   ;   τ c r D P > τ D P
where τ c r D P represents the critical stress that leads to tertiary creep and τ D P represents the Drucker–Prager equivalent shear stress. These two stresses ( τ D P and τ c r D P ) are then expressed as:
τ D P = σ D : σ D 2 + δ · t r σ 3
τ c r D P = σ c r 3 · 1 δ 3
where σ D represents the deviatoric part of the stress tensor, t r σ / 3 denotes the hydrostatic pressure, δ stands for the Drucker–Prager confinement coefficient, and σ c r is the assumed compression uniaxial critical stress. The expression for the uniaxial critical stress is:
σ c r = 2 3 · χ M χ M 1 · R c
where R c represents the uniaxial compressive strength and χ M is a fitting parameter that accounts for the nonlinear behavior observed when the specific creep amplification increases with the loading rate. Table 3 provides a summary of the key material parameters utilized for calculating the reversible creep, including the range of values and their respective units of measurement.

3.2.2. Reversible Creep—Kelvin Strain

Reversible creep is modeled with a Kelvin modulus, and the asymptotic strain is assumed to be proportional to the elastic strain components ( ε i j E ). The direction i j correspond to the base in which the stress tensor is expressed. Therefore, the Kelvin strain component ( ε i j K ) is written as:
ε i j K t = 1 τ K · ε i j E ψ K ε i j K
where τ K represents the characteristic time associated with ε i j K and ψ K is a fitting parameter used to control the modification of kinetics, adjusting the final amplitude of the reversible creep. It is obtained through a creep test with strain recovery.
The characteristic time of reversible creep is influenced by environmental factors such as humidity ( C H ) and temperature ( C w T , specifically for water viscosity). Consequently, it can be expressed as:
τ K = τ r e f K · C w T · C H
where τ r e f K is the reference characteristic time associated with ε i j K , which has been calibrated for the same condition as ψ K .
Through an experimental test database, Sellier et al. [29] demonstrated that the reversible creep (Kelvin strain) value corresponds to 20–25% of the elastic strain. Table 4 presents a summary of the primary material parameters utilized for calculating the permanent creep, including the range of values and their units of measurement.

3.3. Implementation in COMSOL Multiphysics®

The models previously presented were implemented using the multiphysics simulation platform COMSOL Multiphysics® v. 5.5 (Stockholm, Sweden) [30]. COMSOL Multiphysics is a simulation software designed for modeling and analyzing multi-physics systems. It is widely used in various engineering and scientific applications, such as electrical, mechanical, mechanical fluids, and chemical systems. COMSOL offers a user-friendly interface for constructing and solving models, along with advanced post-processing tools for visualizing and analyzing simulation results.
The solid mechanics interface in COMSOL Multiphysics® is built upon the momentum balance equation (Equation (22)) as a standard. To simplify the analysis, inertial effects are neglected, and displacements and strains are assumed to be small (Equation (23)). Consequently, these equations are accompanied by suitable boundary conditions and a constitutive law that establishes the relationship between stresses and strains, thereby providing a comprehensive definition of the problem.
· σ + F V = 0
ε = 1 2 · u + u T
where σ is the stress tensor, F V represents the body forces, ε is the strain tensor, and u denotes the displacements.
In order to implement the chemical model, it was necessary to define the general parameters (environmental parameters, loading, and time), the chemical model parameters, and the internal variables of the problem. The advancement of the reaction (Aasr) was implemented as a domain ODE.
For the shrinkage model, the general parameters are the same as before. It was necessary to define the model parameters one more time, and the internal variables of the model are shown. The capillary pressure (shrinkage stress) was applied as a pore-pressure, regarding the poro-mechanical theory, using the external stress sub-node, which allows the user to specify an additional stress contribution to the material that is not part of the constitutive relation. The external stress can be added to the total stress tensor or act only as an extra load contribution. It should be mentioned that when the pore pressure option is selected, there is no contribution to the stress tensor and the only effect of the pressure is as a load.
Finally, in the case of the creep model, the definition of the general parameters was the same as before. Both strains were applied using the external strain sub-node, which allows the user to provide inelastic strain contributions to the material on a variety of formats, including using external coded functions. For both modules (Maxwell and Kelvin), the external coded functions were implemented as ODEs to calculate the strain components in the main directions (aij = a11, a22) regarding the 2D application.

4. Results and Discussion

This section presents the main numerical simulations and the corresponding experimental results of the models. Two calibration methods, theoretical and experimental, were used for the implementation in COMSOL. To simplify the evaluation of the chemical model, simulations in a 0-D framework were conducted, while simulations in a 2-D framework were used to evaluate the creep model.

4.1. Results of the Chemical Model

The aim of this study was to evaluate the effectiveness of the chemical model implemented in COMSOL Multiphysics® by examining the advancement of the reaction (Aasr), which is the main factor responsible for gel formation. The impact of three key factors on the reaction progression was investigated through parametric analysis: (i) characteristic time ( τ r e f a s r ); (ii) temperature (T); and (iii) saturation degree (Sr). The primary material characteristics utilized in the modeling are presented in Table 3 from the previous section.
The initial method did not explicitly incorporate a material such as concrete, and instead, it was represented within a 0-D framework. In this framework, the substance is represented by a point, and the chemical reaction is depicted without considering the material’s behavior. The analysis and validation of the chemical model were the only aspects addressed.
The parametric investigation on the characteristic time ( τ r e f a s r ) is shown in Figure 1, with the material parameter set at 50, 100, 150, and 200 days. The temperature was set at 38 °C, and the saturation level was set at 100%. It can be observed that the development of Aasr aligns well with the experimental results presented in [20].
The temperature (T) was subjected to a parametric investigation, with the environmental parameter set at 10, 20, 30, and 40 °C. Figure 2 illustrates the findings. The saturation degree was maintained at 100%, and the characteristic time was set to 50 days. Comparing the results to those presented in [20], the numerical model developed demonstrates consistent and satisfactory performance.
The parametric investigation on the saturation degree (Sr) is shown in Figure 3, with environmental parameters set at 25%, 50%, 75%, and 100%. The characteristic time was set to 50 days, and the temperature was set at 38 °C. Figure 3 demonstrates that the advancement of the reaction (Aasr) is more moderate compared to the findings of [20]. For example, the developed model shows an advance of 80% one hundredth of a day after the reaction begins, for a saturation level of 100%. In contrast, the model from [19] shows an advance of approximately 90% under the same conditions.
The developed model consistently demonstrated a slow reaction evolution across various saturation degrees, mirroring the behavior presented in [20]. However, an exception to this pattern was observed at a saturation degree of 25%, where both the developed model and the model from [20] yielded nearly identical results.
To investigate the possible origin of the observed discrepancy, we utilized the model proposed by [20] to analyze the results for the following data: temperature of 38 °C, characteristic time ( τ r e f a s r ) of 50 days, and saturation degree of 100%. The initial analysis aimed to evaluate the impact of the characteristic time, while the subsequent analysis focused on assessing the degree of saturation. Figure 4 illustrates the comparison between these two analyses. Initially, it was anticipated that these two curves would exhibit almost identical behaviors. However, a disparity in the advancement of the reaction was observed during the first two hundred days. Specifically, the curve evaluating the influence of the degree of saturation displayed a faster progression of the reaction, approximately 12% higher, during this time period. The authors speculate that this discrepancy lacks a clear and identifiable origin, but it could potentially be attributed to a modification in one of the parameters employed in the research conducted by [20].

4.2. Results of the Creep Model

To evaluate the implementation of the creep model in COMSOL Multiphysics® v. 5.5, it was necessary to simulate the creep tests conducted by [31,32]. Previous studies conducted by Sellier et al. [33] involved calibrating the main material parameters and comparing the results of their developed model with experimental data, which showed a very good agreement.
In order to verify the behavior of the developed numerical model, the experimental 2-D models tested by [32] were computationally simulated. These models involved uniaxial and biaxial compression tests on concrete cubic elements with a side length of 200 mm. The concrete used in these tests had compressive strengths of 26, 44, and 54 MPa.
Figure 5 illustrates the simulated test configuration, while Table 5 provides the loading configuration for each investigated scenario and type of concrete. Additionally, Table 6 presents a summary of the calibrated parameters utilized in the simulation of the creep tests conducted by [32].
Figure 6, Figure 7 and Figure 8 depict the strain evolutions over time for concretes C1, C2, and C3 in both the numerical models developed and the specimens tested in [31], under uniaxial compression stress. Upon observing these figures, it is evident that the numerical models exhibit excellent performance in replicating the experimental responses of the tested specimens across all investigated concrete strengths.
The most significant disparities between the numerical models and the experimental tests were consistently observed at the highest levels of the applied stresses. However, it is worth noting that the maximum difference observed was only 10%, and this was primarily observed in concrete with higher compressive strength and a longer duration of strain measurements. This level of difference is deemed acceptable for numerical simulations of complex issues such as creep strains. The following factors can account for these differences in the strain evolution over time: (a) variations in environmental conditions during testing, (b) inadequately determined boundary conditions in the simulation, and (c) numerical solvers that are not well-suited for complex problems.
Overall, the numerical models developed demonstrate a strong ability to accurately replicate the experimental responses of the tested specimens, with only minor discrepancies observed at the highest stress levels.
Figure 9, Figure 10 and Figure 11 show the strain evolutions over time for concretes C1, C2, and C3 in both the numerical models and the specimens tested in [30], under biaxial compression stress. The numerical models of biaxial tests exhibited similar behaviors to the uniaxial tests. The maximum difference between the numerical and experimental models was observed to be 13%. This difference is considered acceptable for such a complex problem, as the simulation results were in good agreement with the experimental data.
It is worth noting that the discrepancy in strain ε I (parallel to load σ I ) was higher compared to strain ε I I (parallel to load σ I I ). This suggests that higher loads result in greater discrepancies, as σ I was 2.5 and five times higher than σ I I . Additionally, the discrepancy was found to be higher for longer periods of time, as the creep strain increased over time.
The accuracies of numerical models in predicting creep behaviors under different temperature conditions were evaluated through the simulated experimental tests conducted in [32]. Uniaxial creep experiments were performed on 24 cylindrical specimens of high-performance concrete (HPC) with dimensions of 220 mm in height and 110 mm in diameter. The HPC had a compressive strength of 86 MPa and Young’s modulus of 45 GPa. During the experimental tests, creep strains were measured in the principal direction, which was the direction of the loading. After one year of curing, the specimens were subjected to a uniaxial compression stress of 26 MPa at temperatures of 20, 50, and 80 °C. A schematic representation of the simulated tests can be seen in Figure 12, and Table 7 provides the material properties used in the numerical simulations.
The impact of temperature on the creep tests can be observed through the simulation results at temperatures of 20, 50, and 80 °C. Figure 13 illustrates how the simulation results demonstrate the influence of temperature on the creep tests. However, the experimental results for the temperature of 80 °C after 56 days were not provided due to a malfunction of the strain gauges. The high temperature condition caused a failure in the electrical components of the gauges.
For all the temperature levels studied, the developed numerical models proved to be highly effective in capturing the responses of the experimental tests. It was observed that, for the temperatures of 20 °C and 50 °C, the numerical models slightly overestimated the experimental results for extended periods of time. However, the maximum difference did not exceed 5%, which ensures the reliability of the developed numerical models. Since there were no test results available for ages beyond 56 days at a temperature of 80 °C, an extrapolation was necessary to generate simulation results beyond that age. These extrapolated results are also depicted in Figure 13.

5. Conclusions

Finite element analyses were used to address the research gap in understanding internal expansion reactions in concrete structures at a microstructural level. The approach considered chemical processes, material properties, and structural interactions at a microscopic level, resulting in more accurate predictions of expansion behavior.
Numerical results obtained were compared with the data from the literature and the overall behaviors of the numerical models proved to be very efficient in capturing the internal expansion mechanism in concrete reported in the experimental tests. The primary findings are summarized as follows.
For chemical models
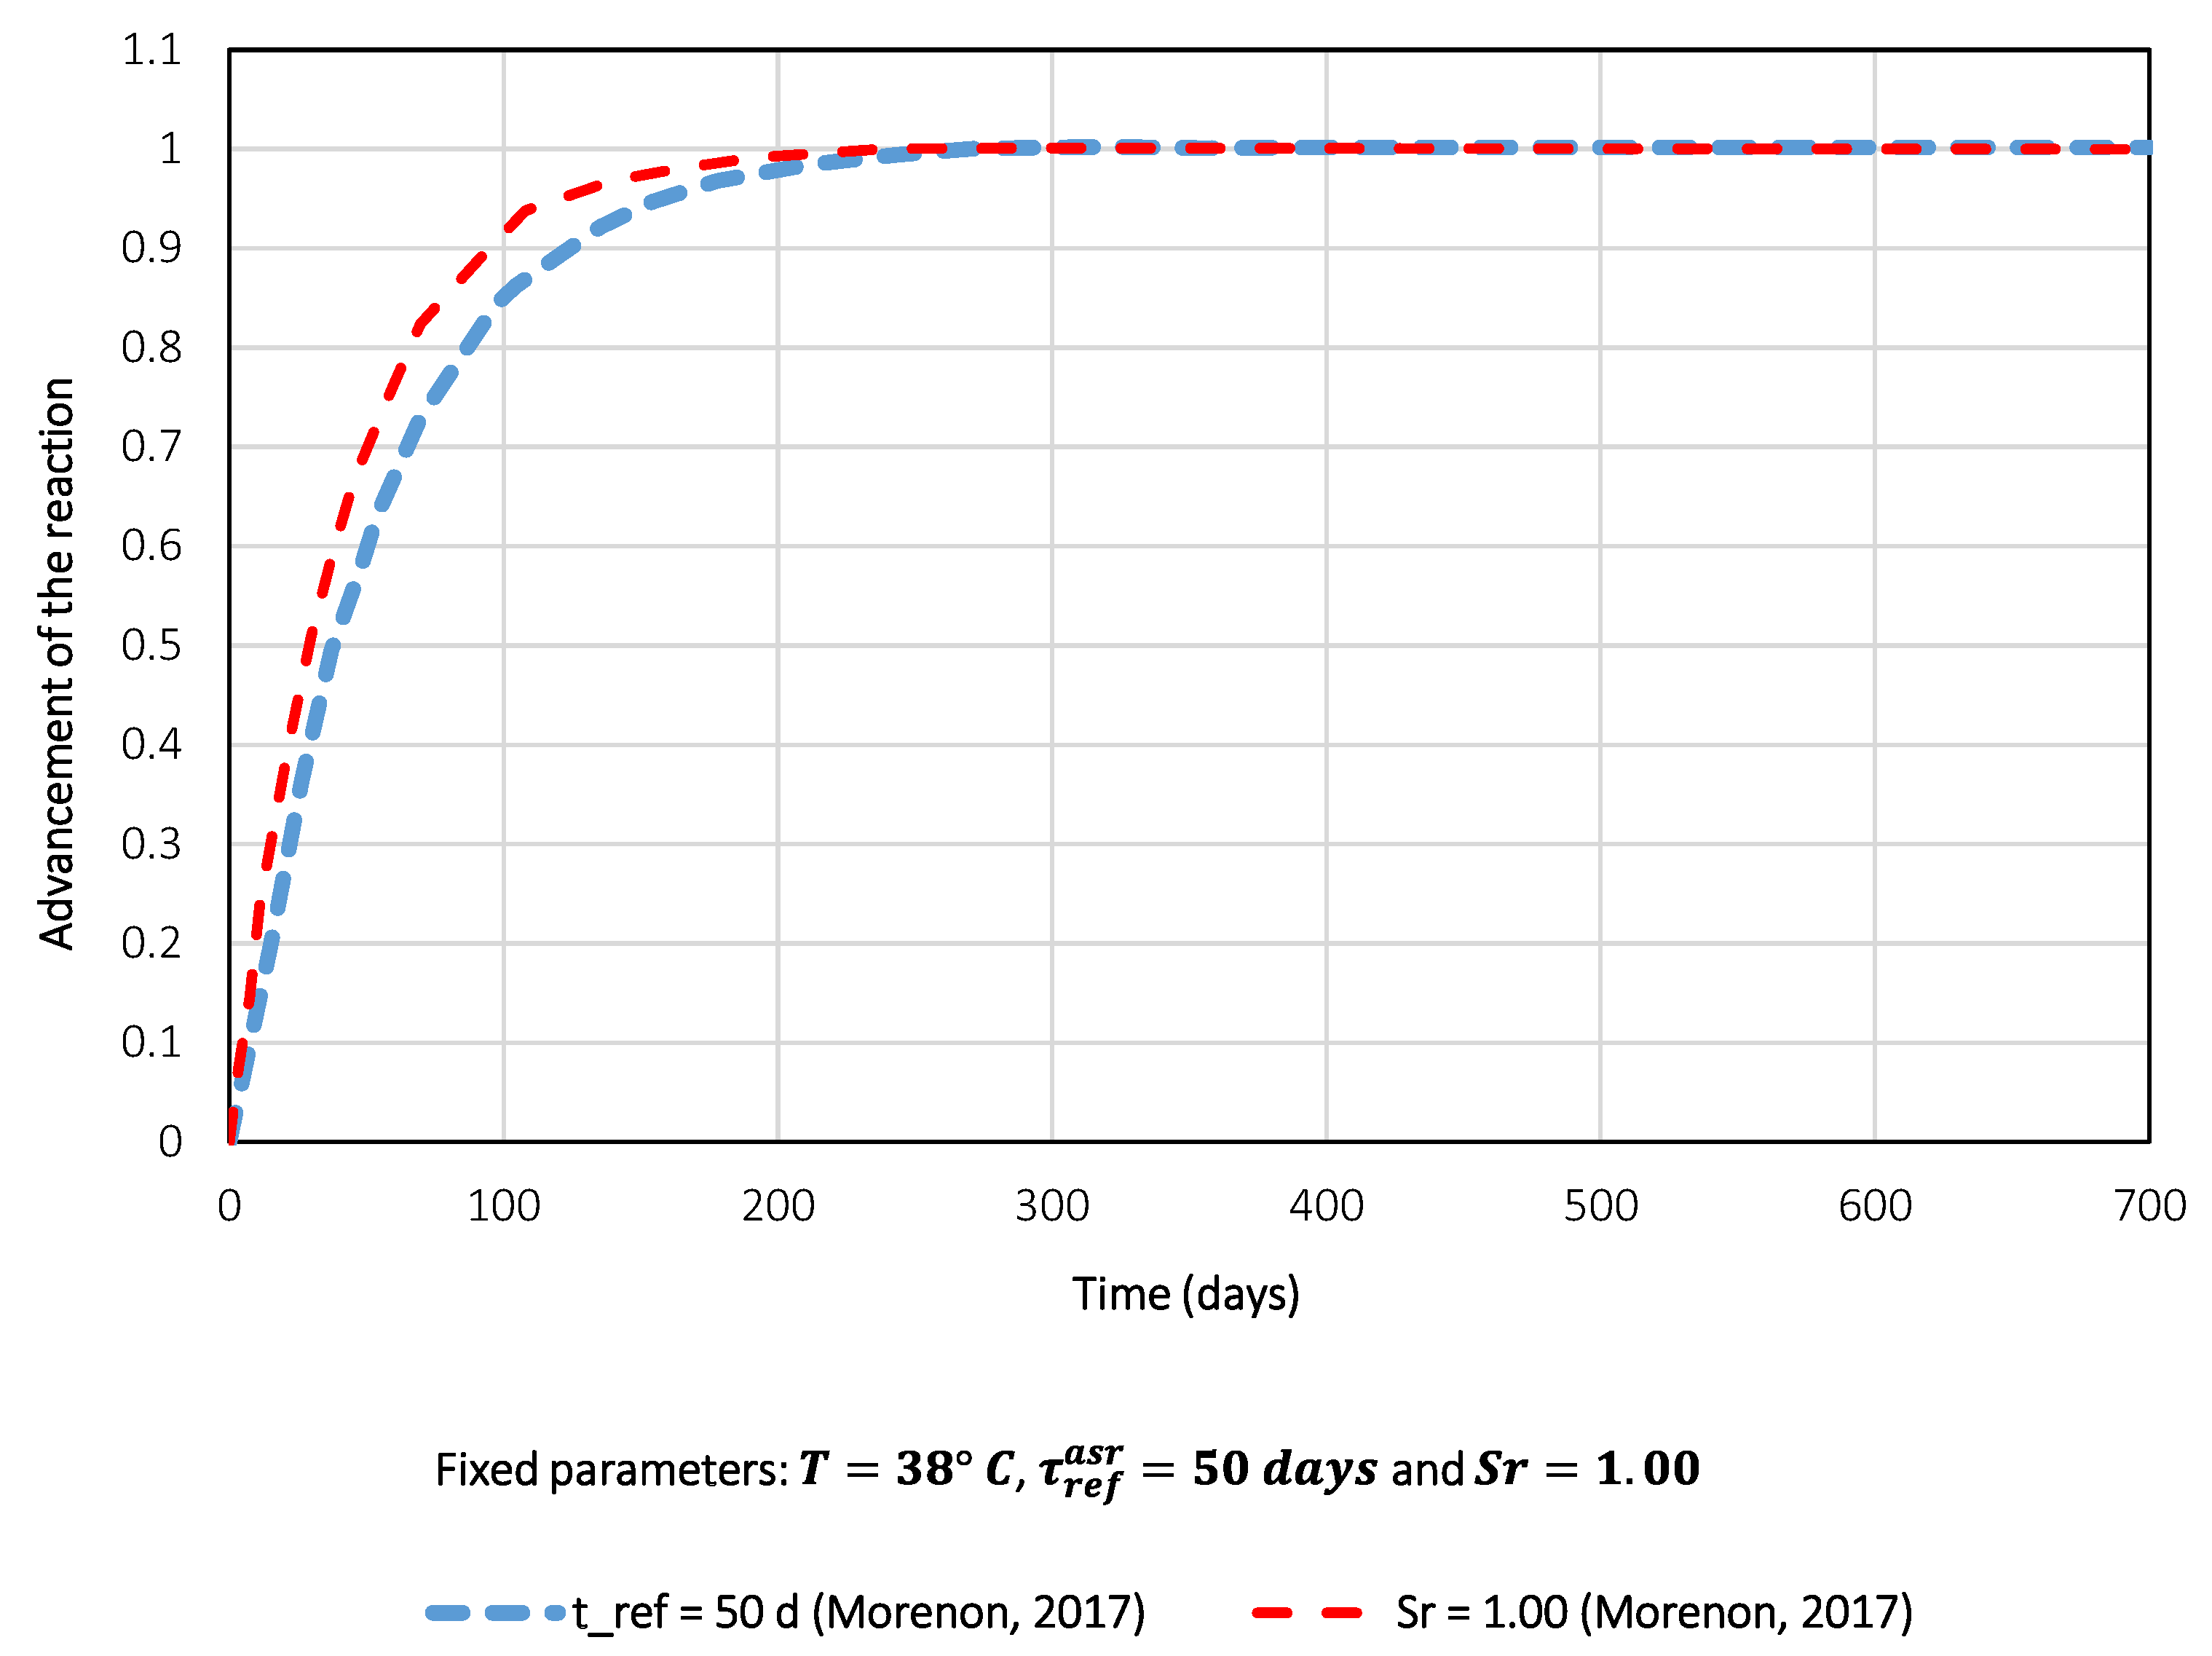
  • The impact of the characteristic time on the progress of the expansion reactions was found to be very similar to the experimental tests, given a degree of saturation of 100% and a temperature of 38 °C. However, the most significant difference between the numerical model and the experimental result was observed for a characteristic time of 50 days. This discrepancy can be attributed to the fact that the characteristic time plays a crucial role in determining the reaction kinetics from the beginning to the end of the swelling process. When the characteristic time is small, it indicates minimal expansion. Consequently, the numerical model struggles to accurately capture this phenomenon. Despite this limitation, the obtained results are still promising as the observed divergence is not substantial.
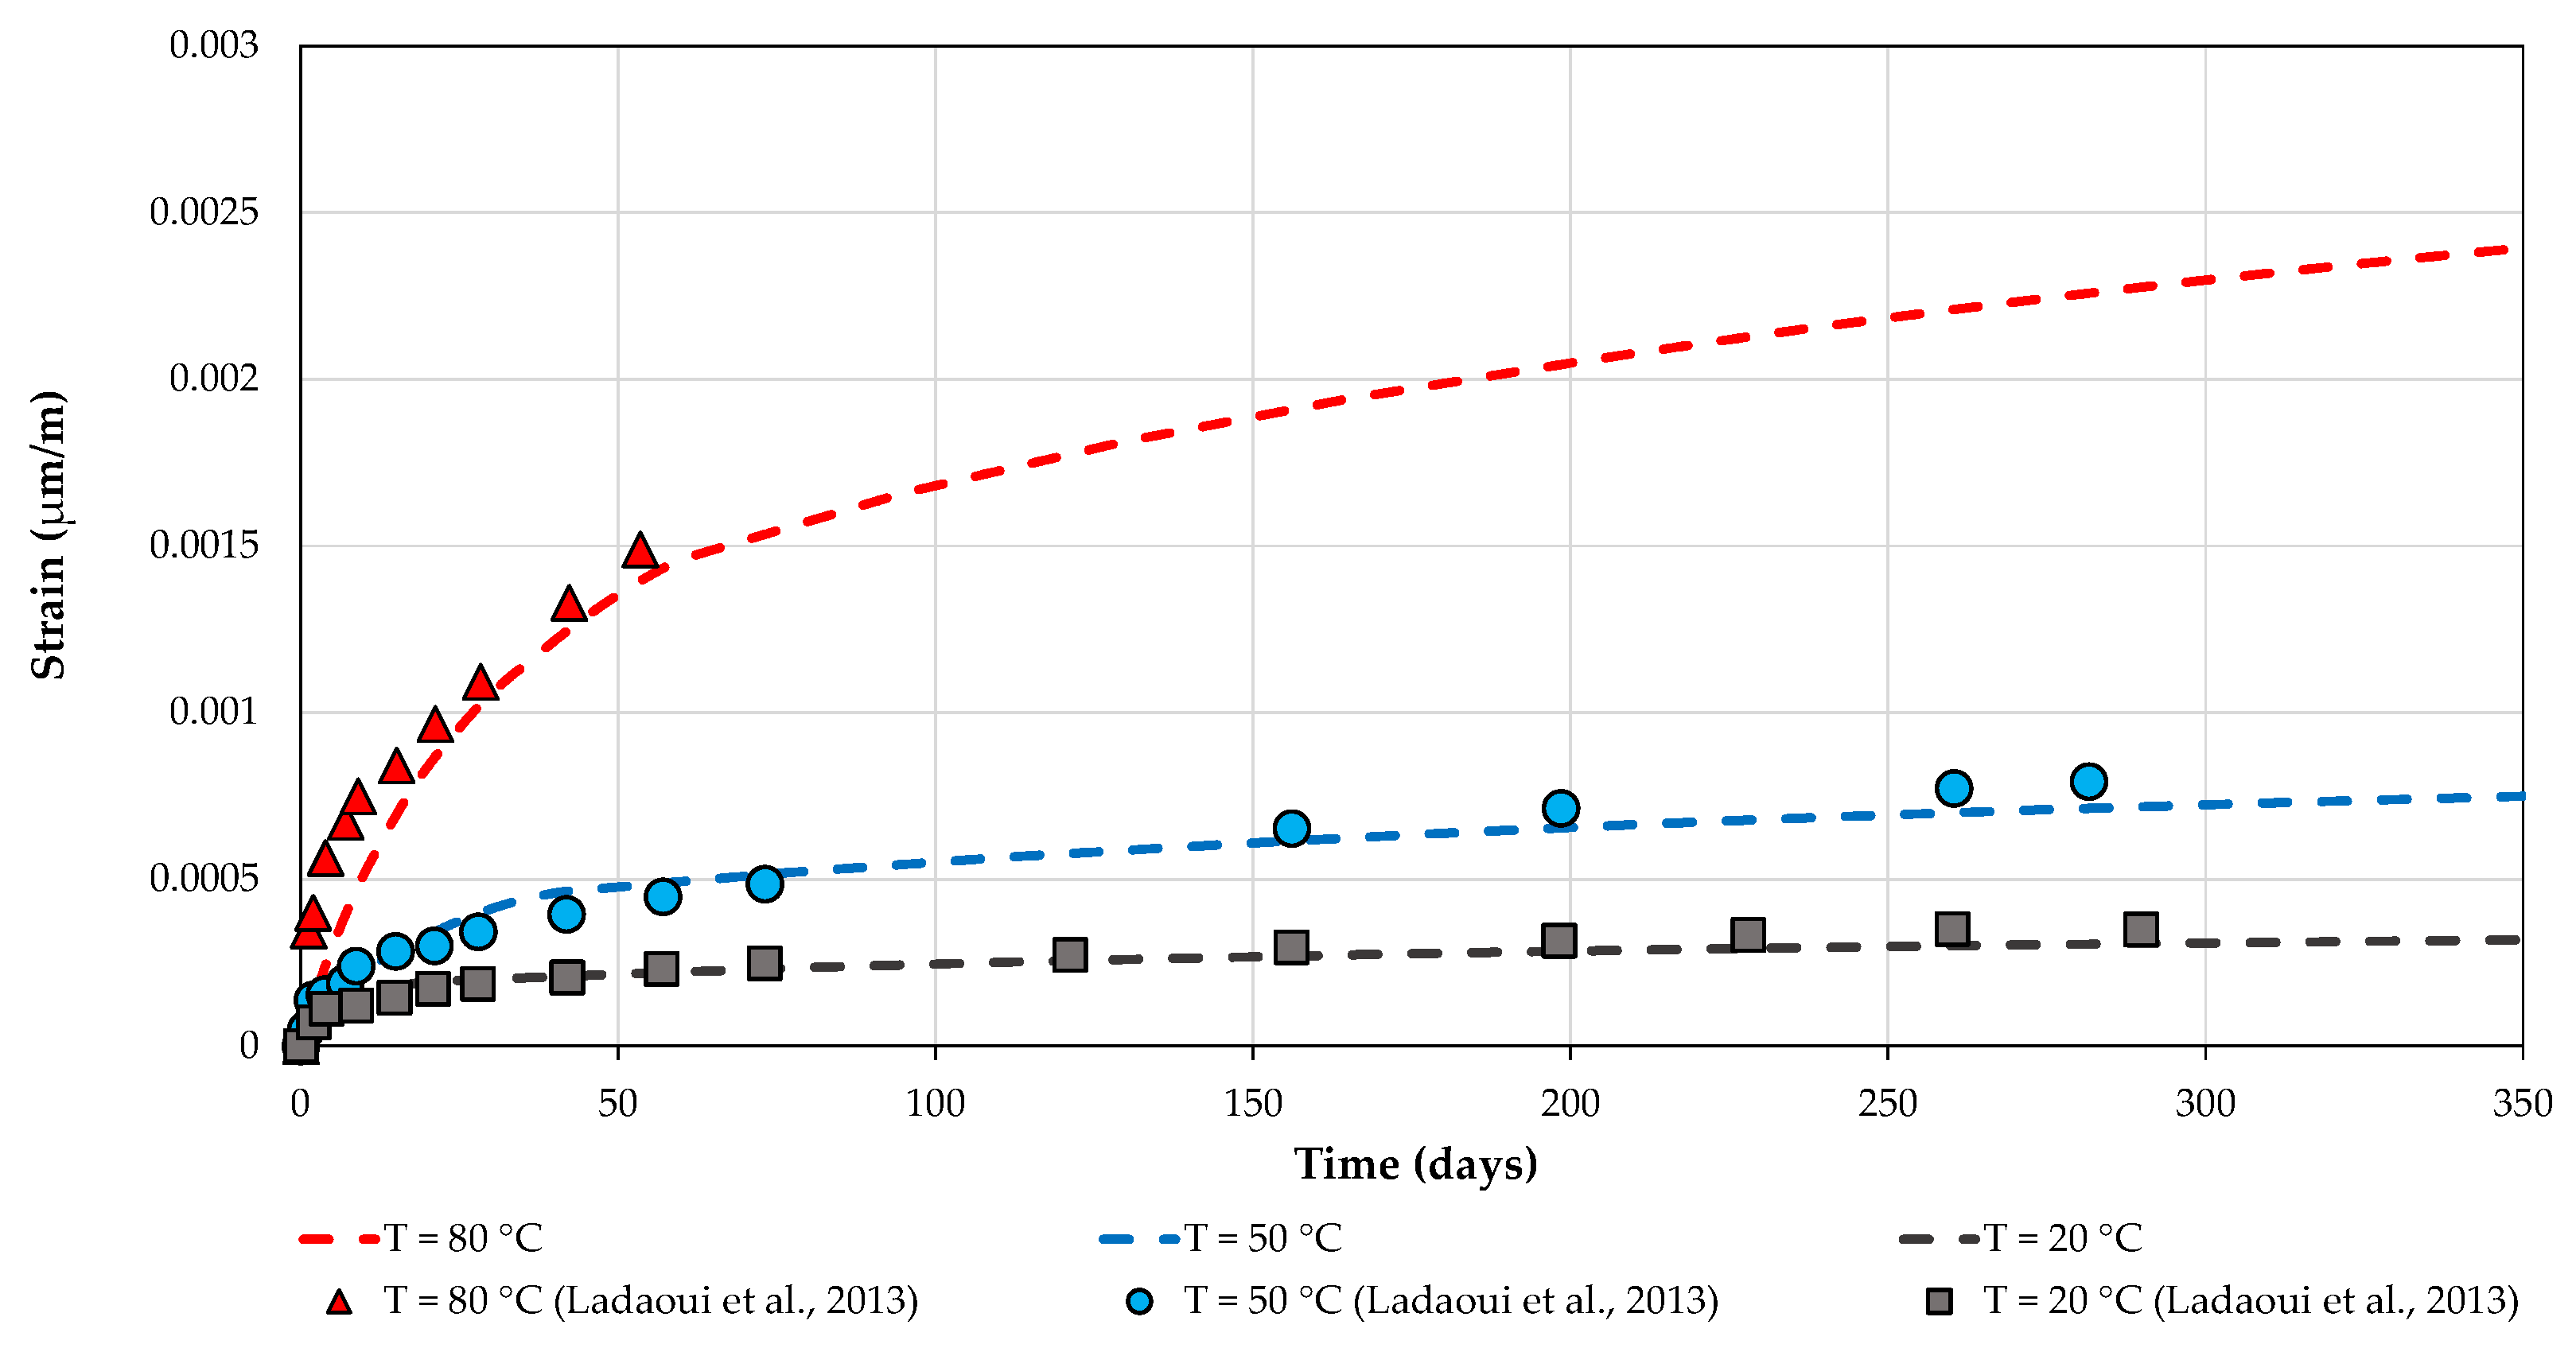
  • The effect of temperature on the progress of expansion reactions, for a degree of saturation of 100% and a characteristic time of 50 days, was equally close to the experimental tests. The most pronounced difference between the numerical model and the experimental result was observed at a temperature of 10 °C. This behavior can be explained for the same reasons as mentioned above, as lower temperatures result in less progress of the reaction. For higher temperatures, the numerical model was closer to the experimental results.
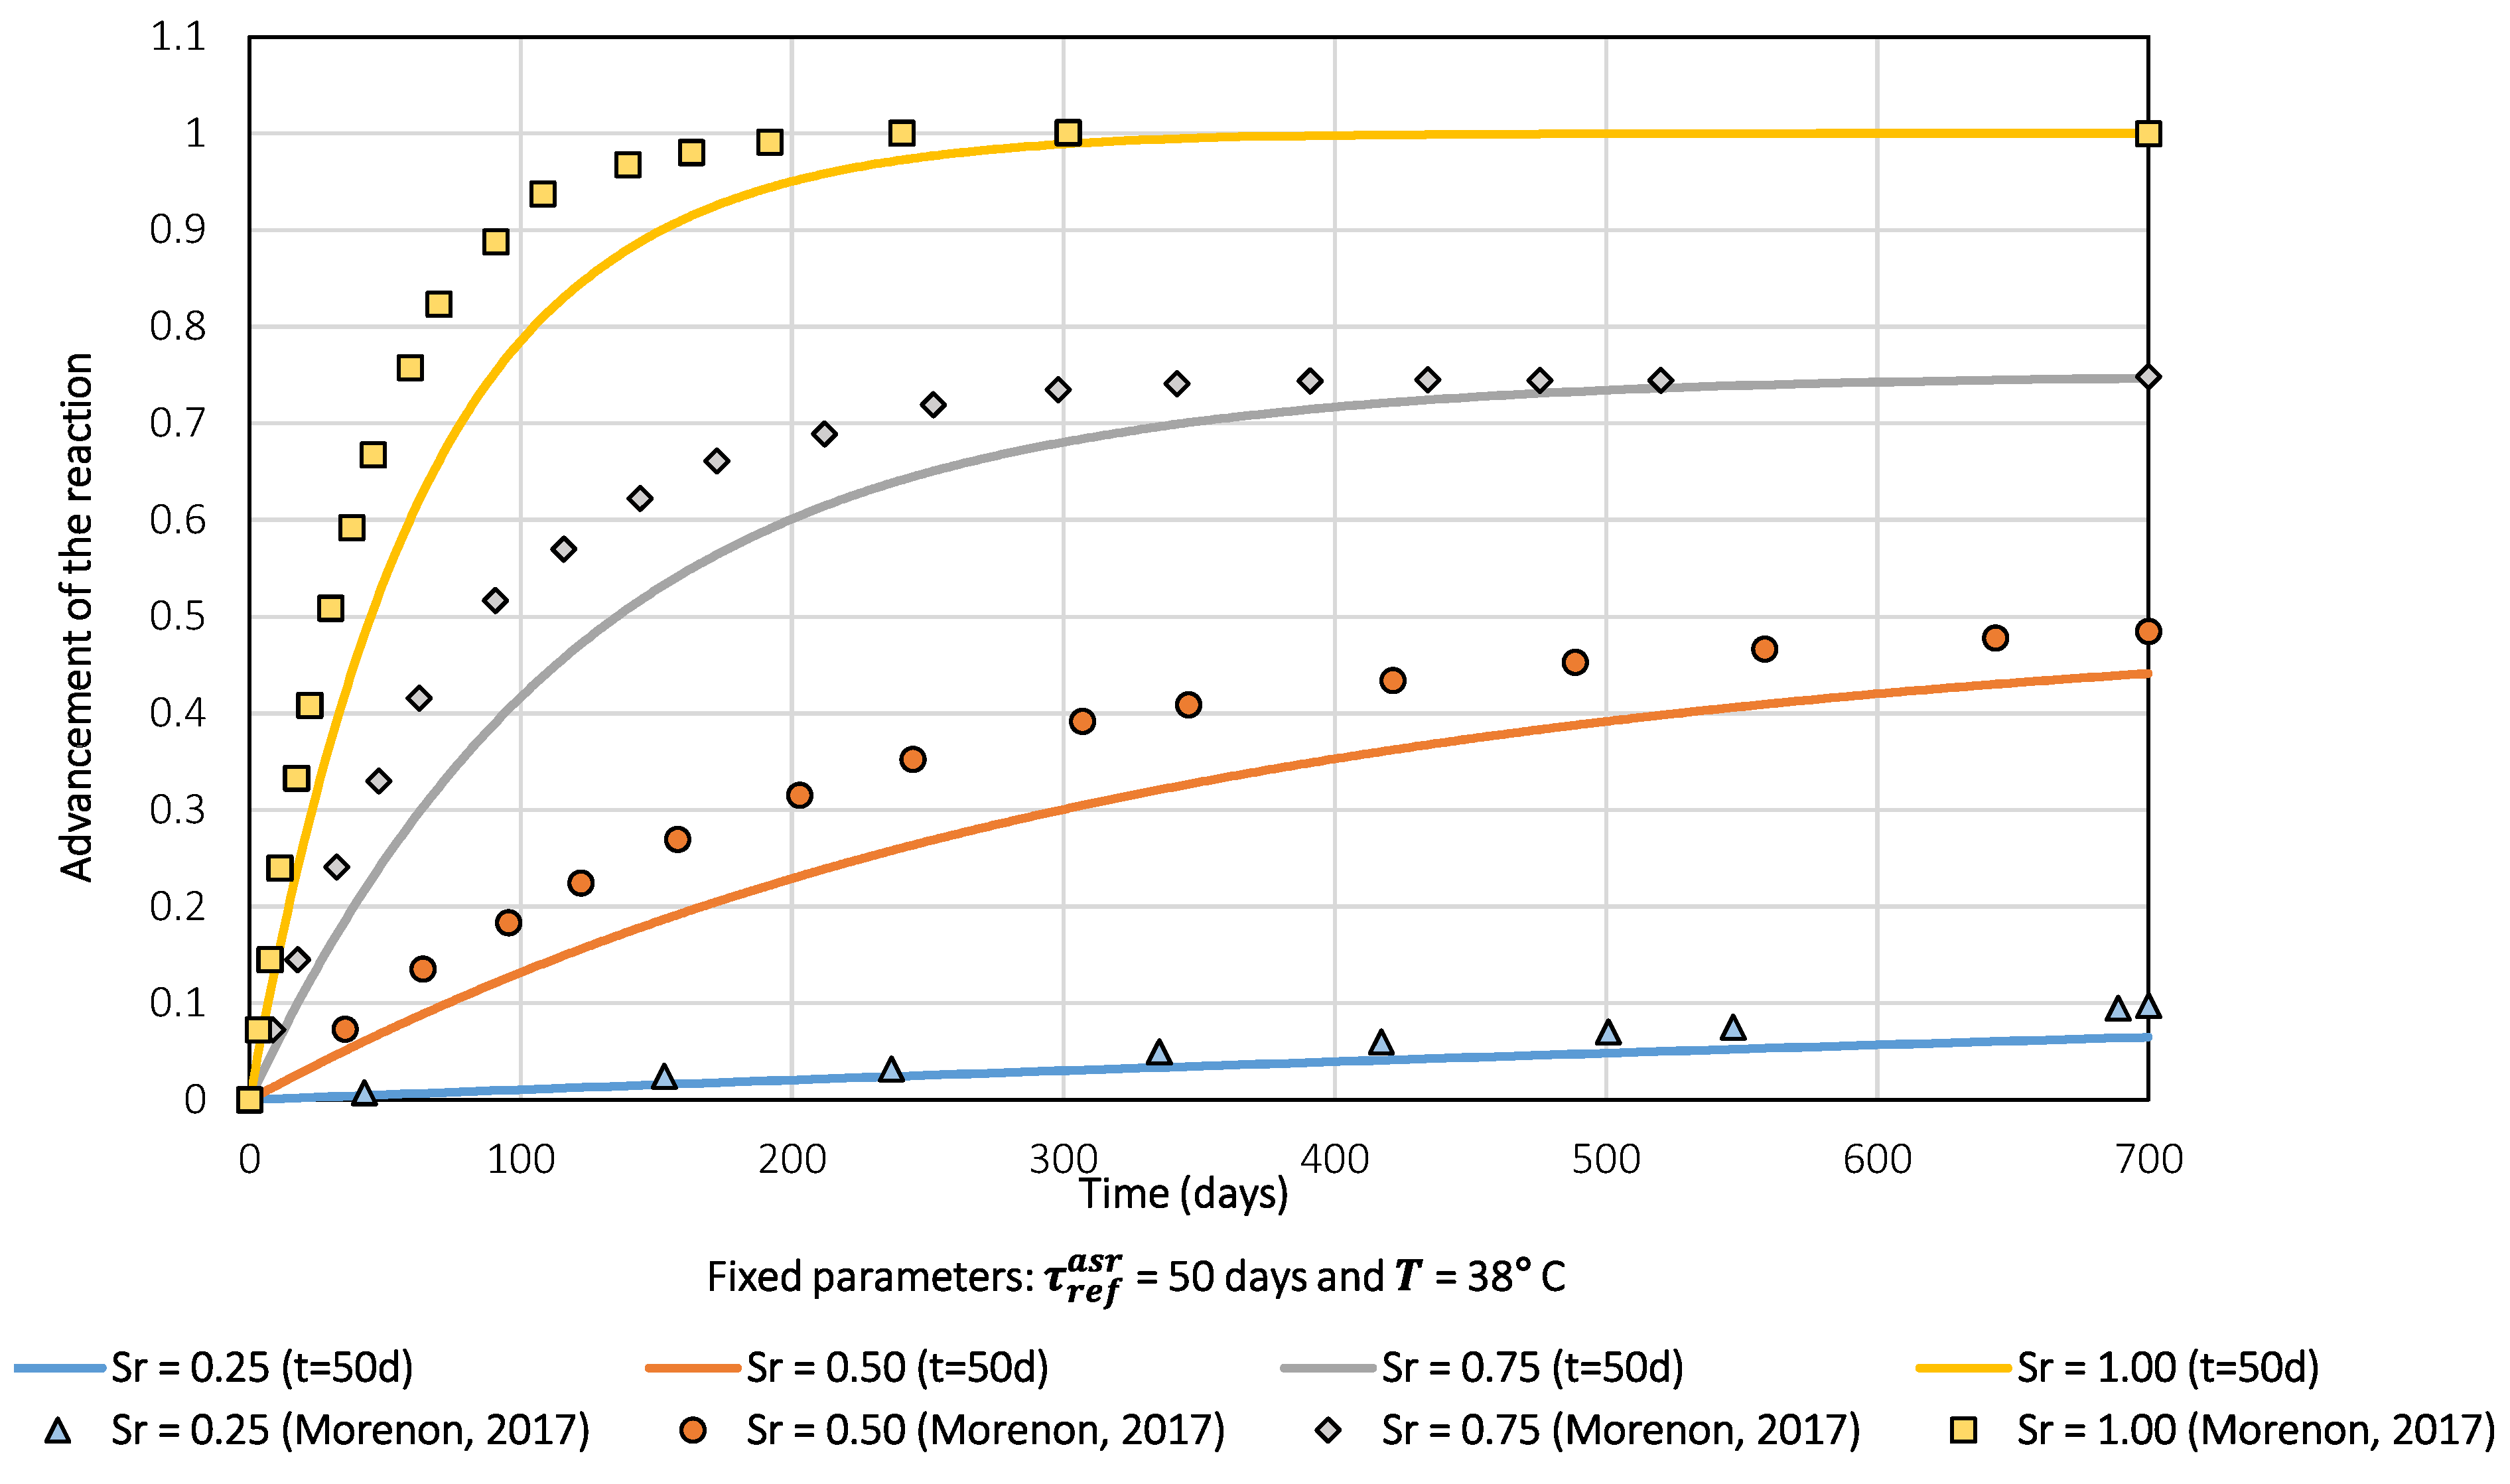
  • The effect of the degree of saturation showed the greatest discrepancies between the numerical models and experimental data. For a fixed temperature of 38 °C and a characteristic time of 50 days, the degree of saturation that led to the greatest differences was 50%. This discrepancy may be due to an alteration of the parameters presented in the lab tests, as the curves for the same parameters did not match.
Multiaxial creep tests
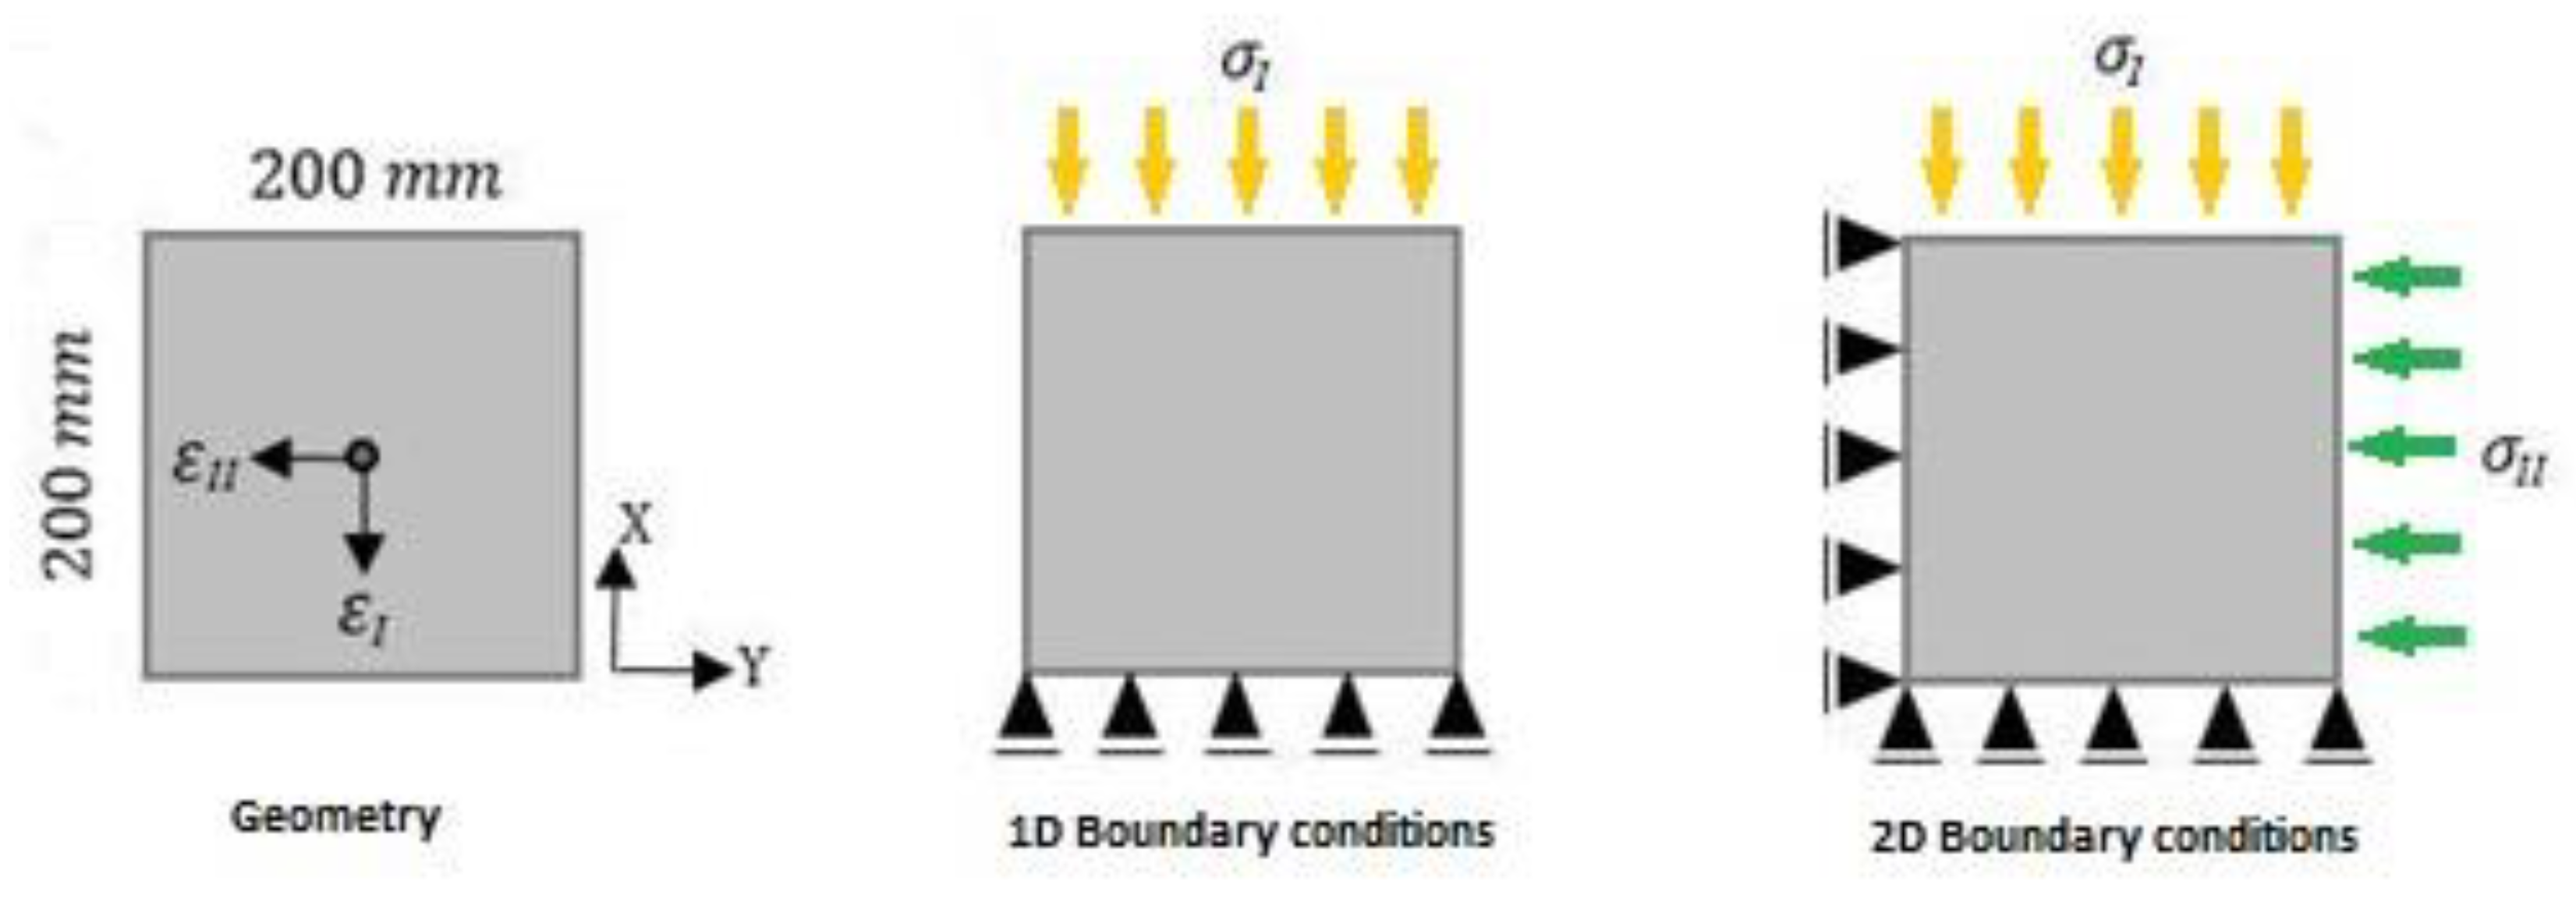
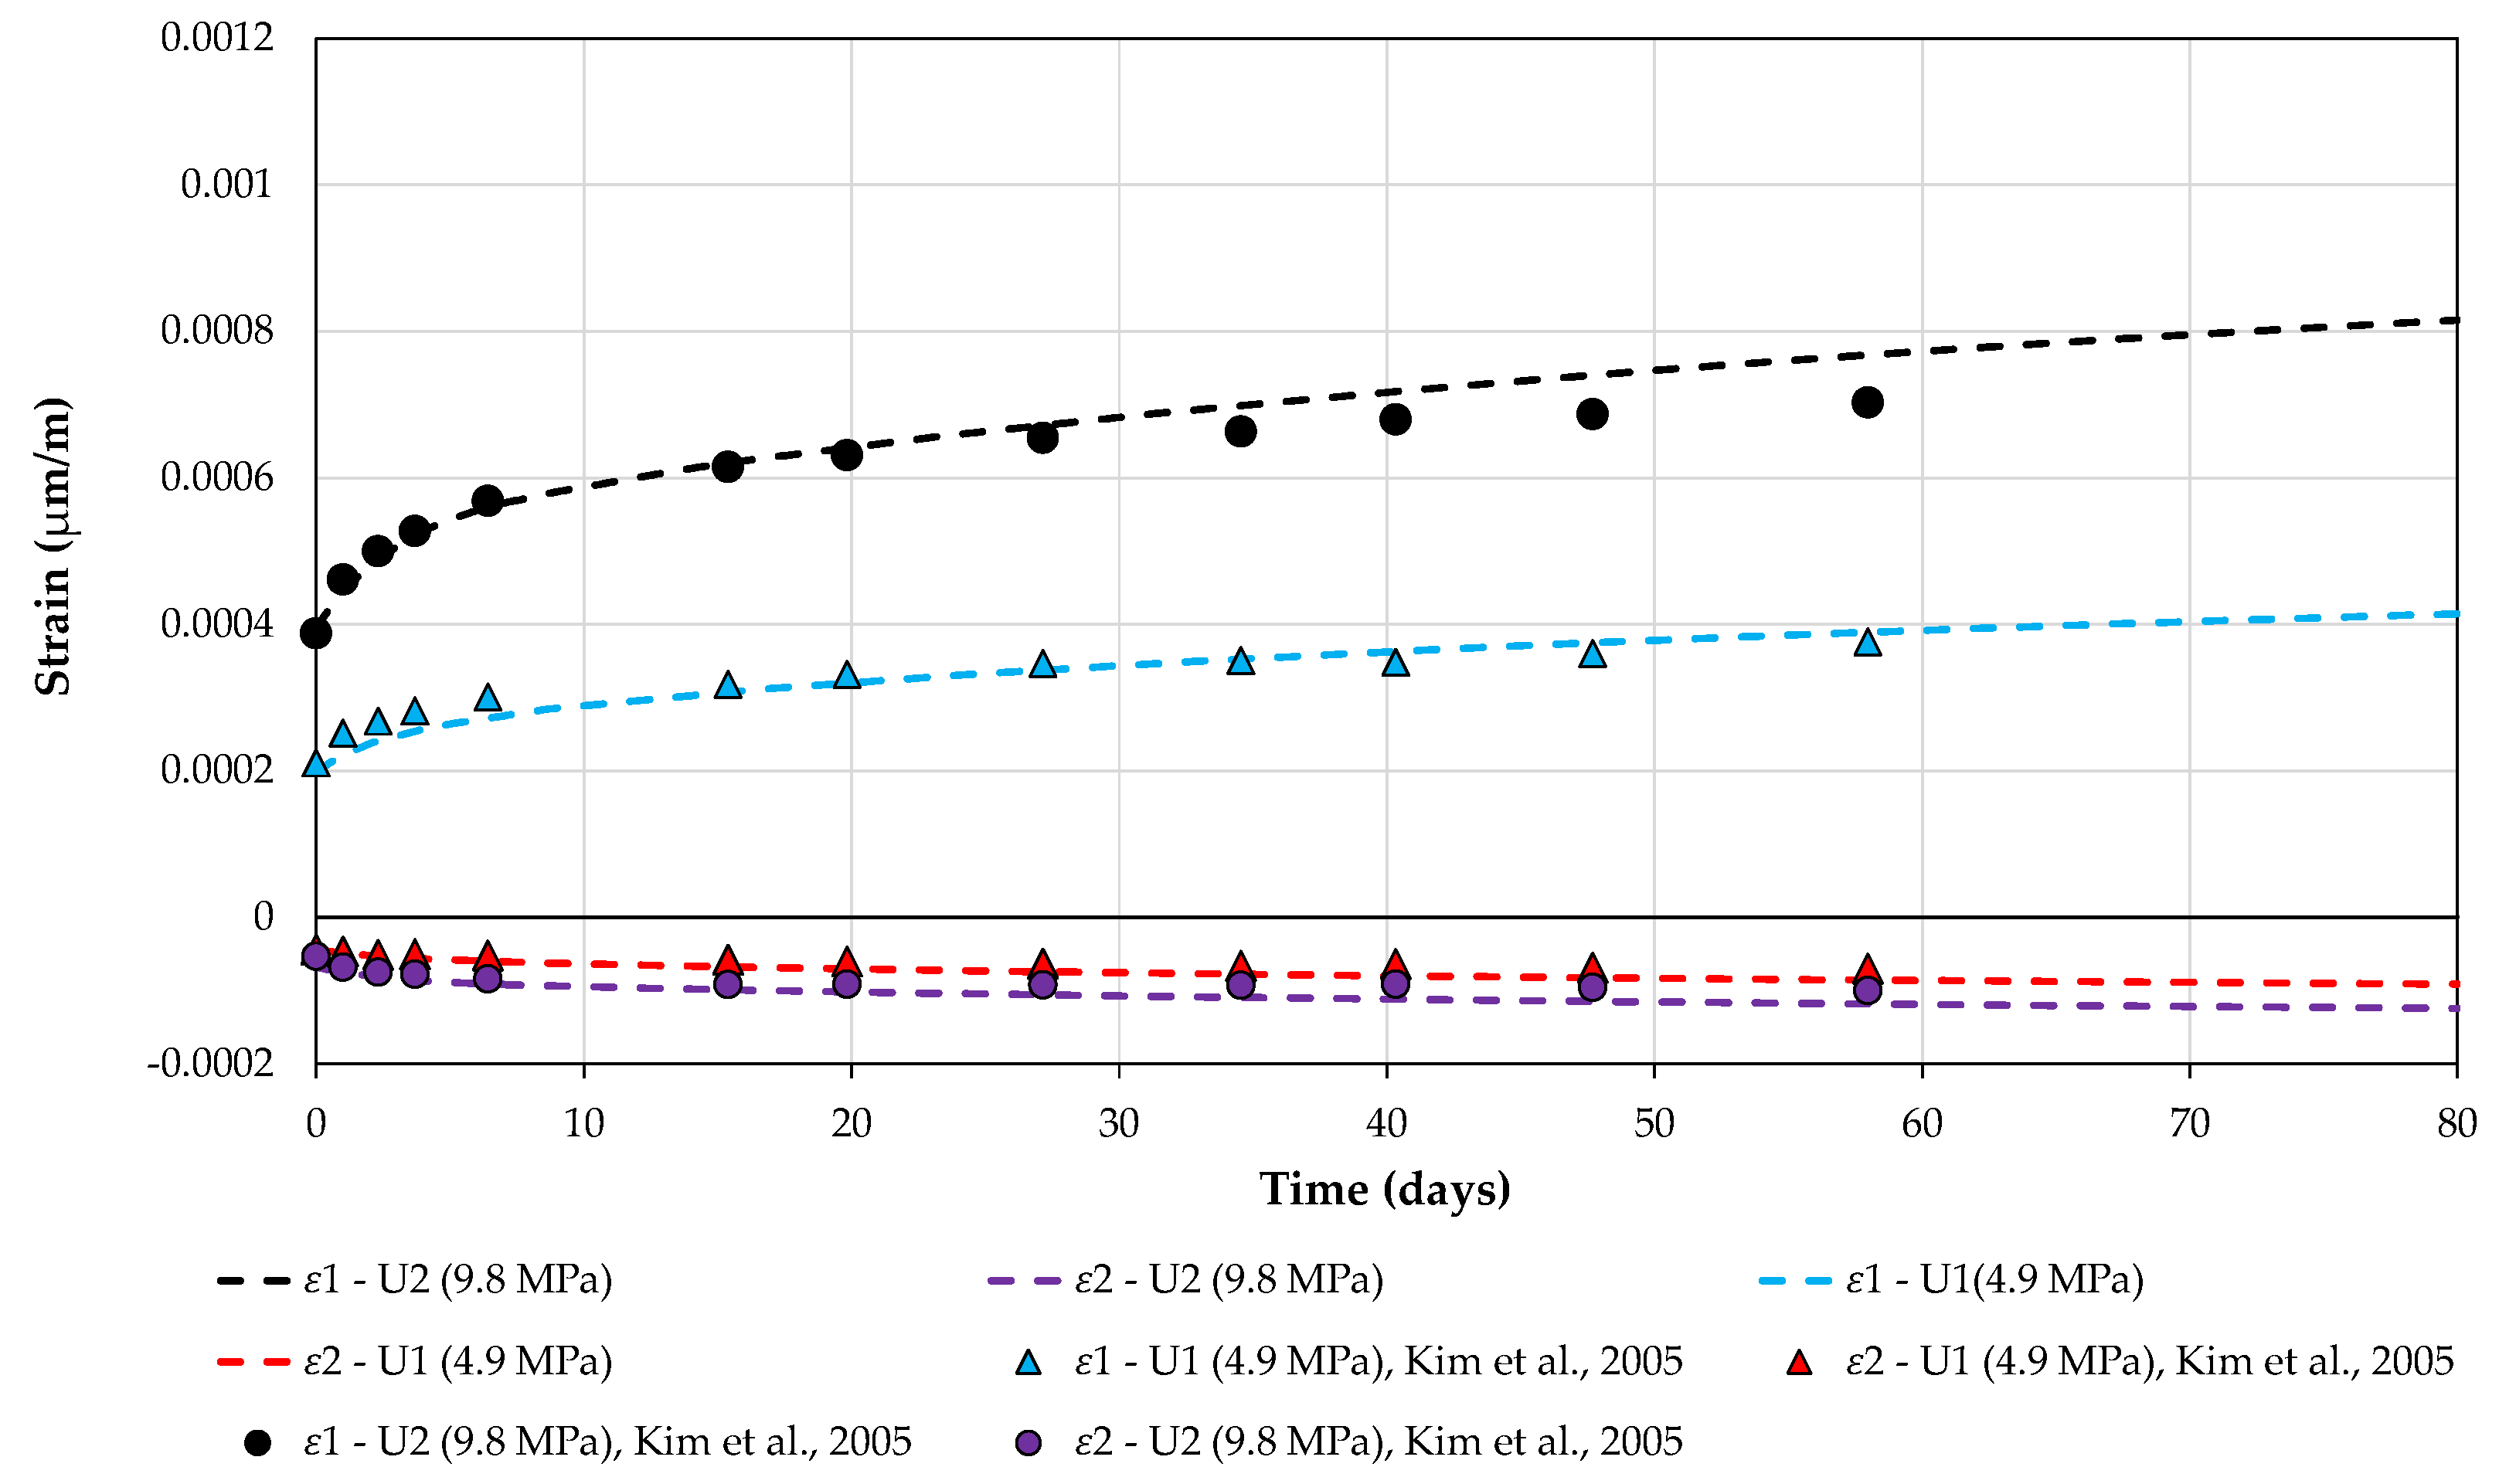
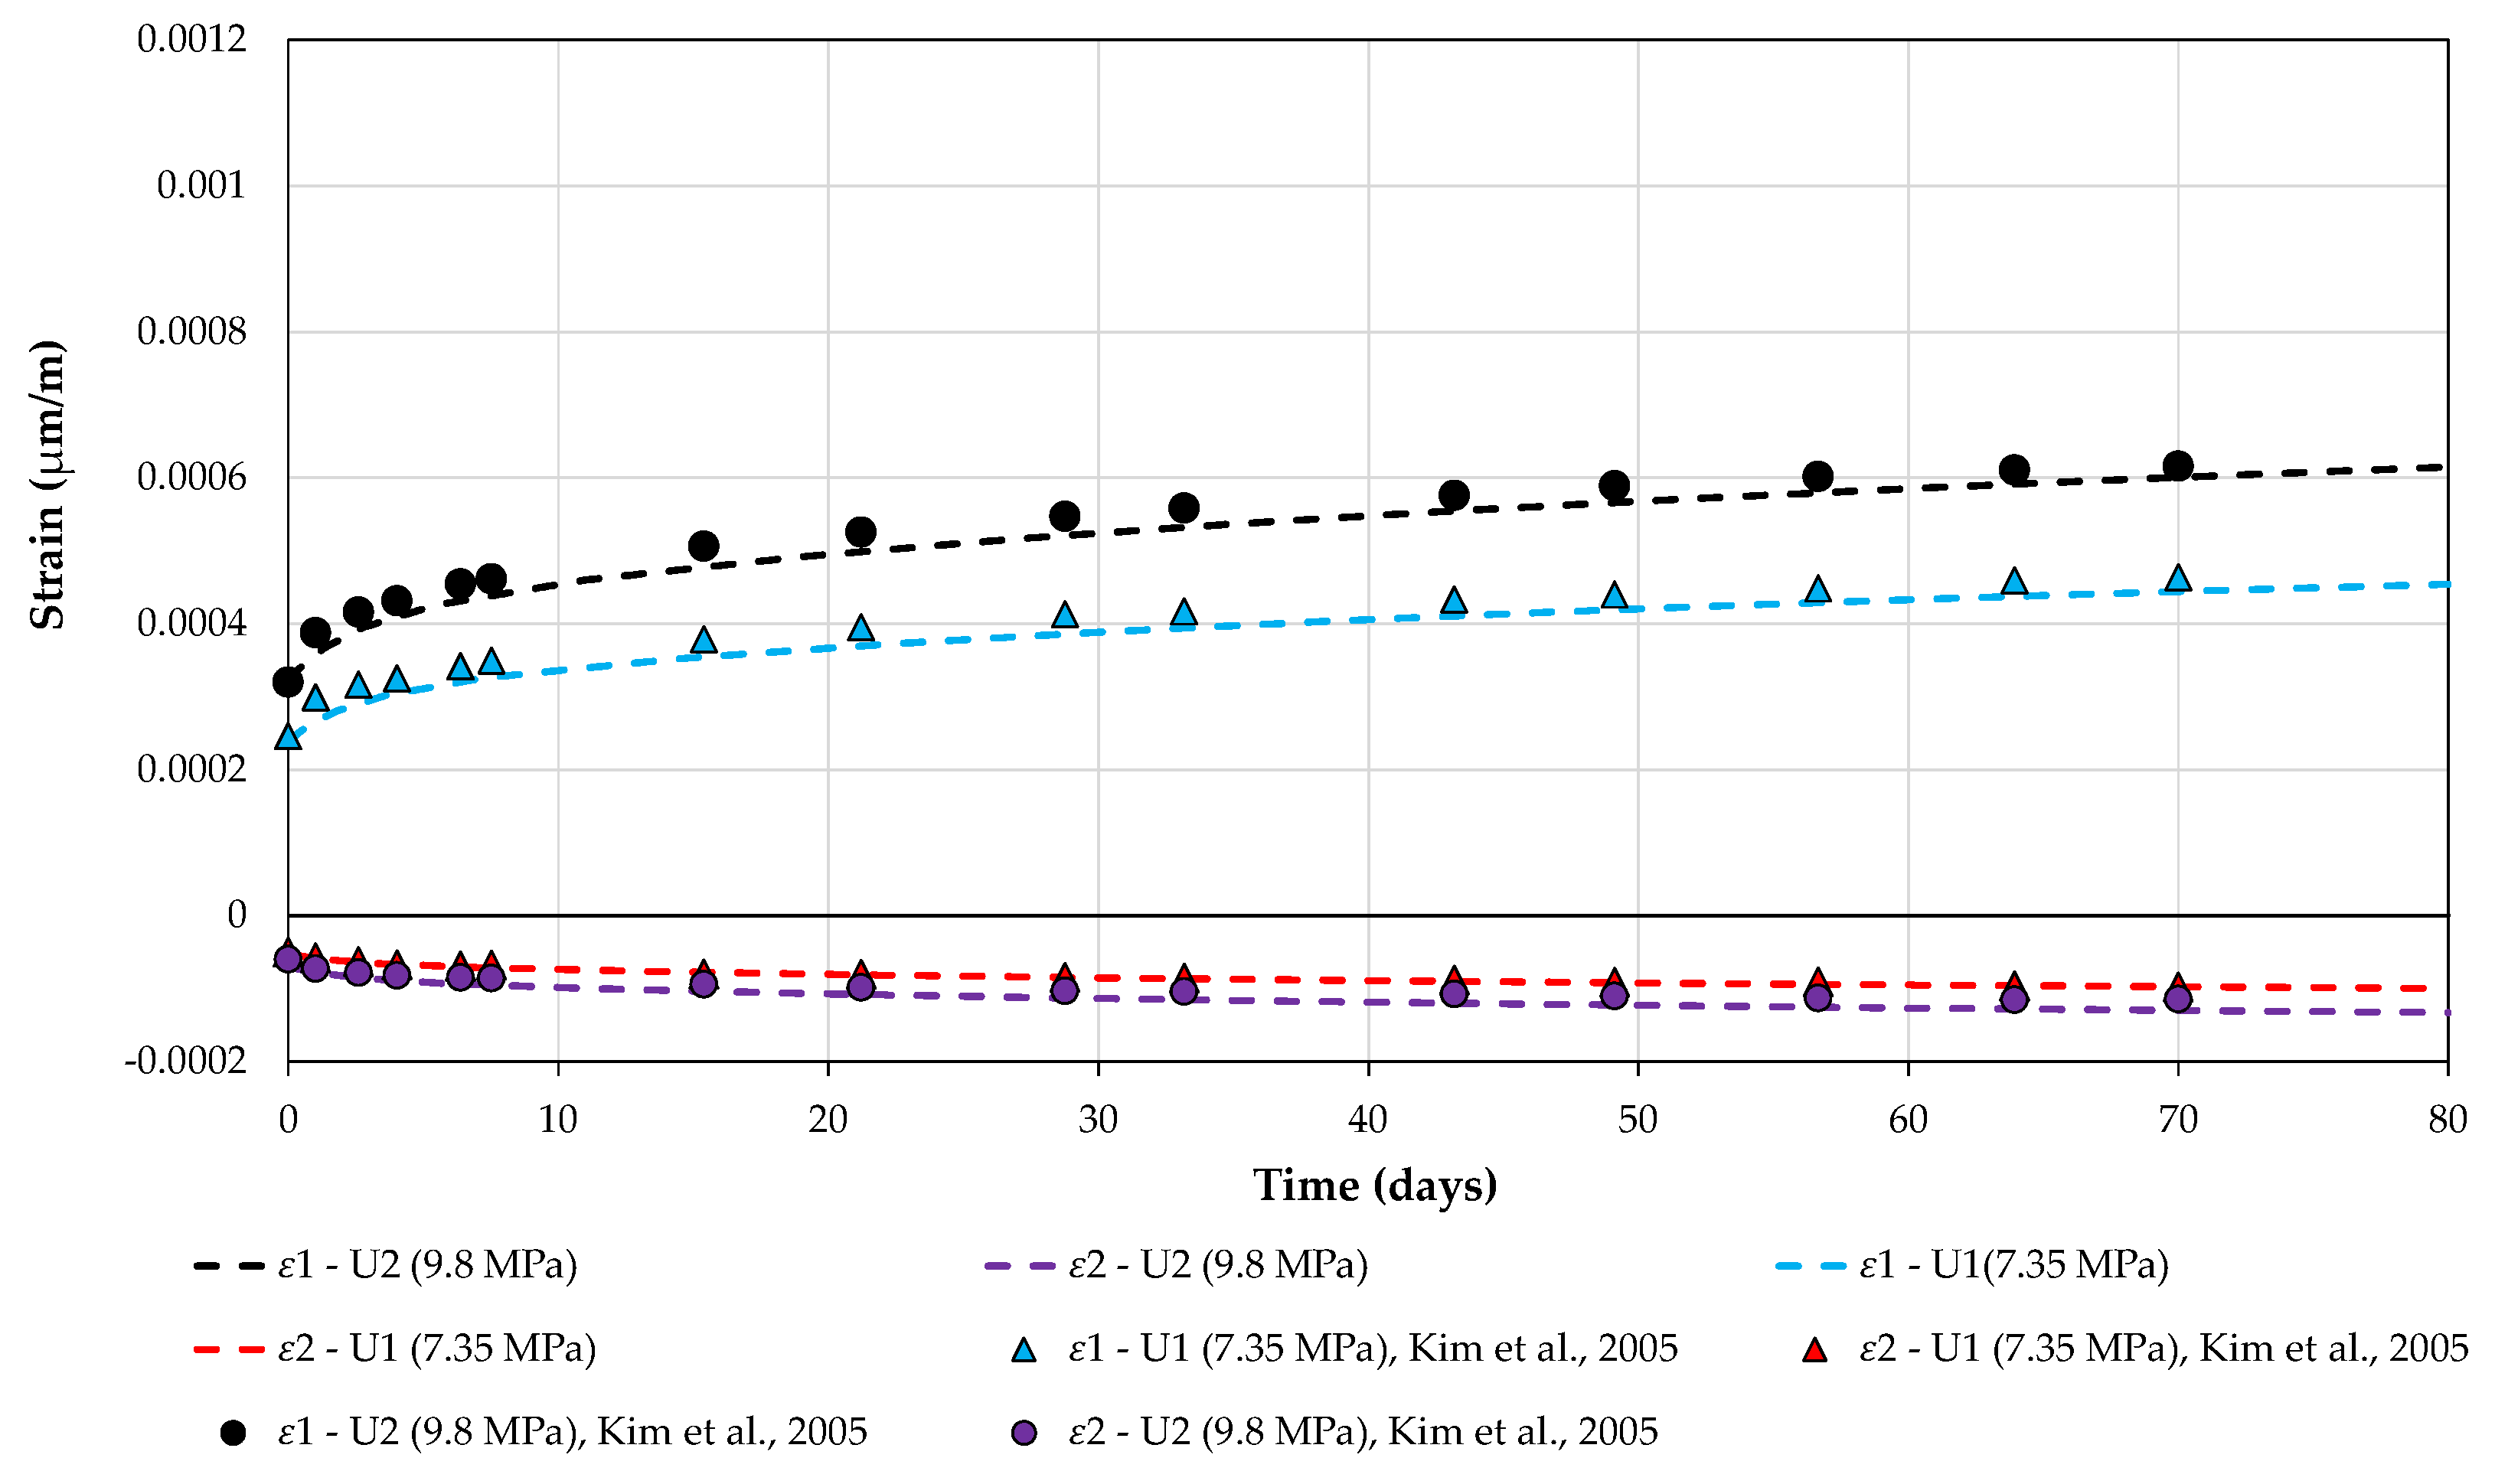
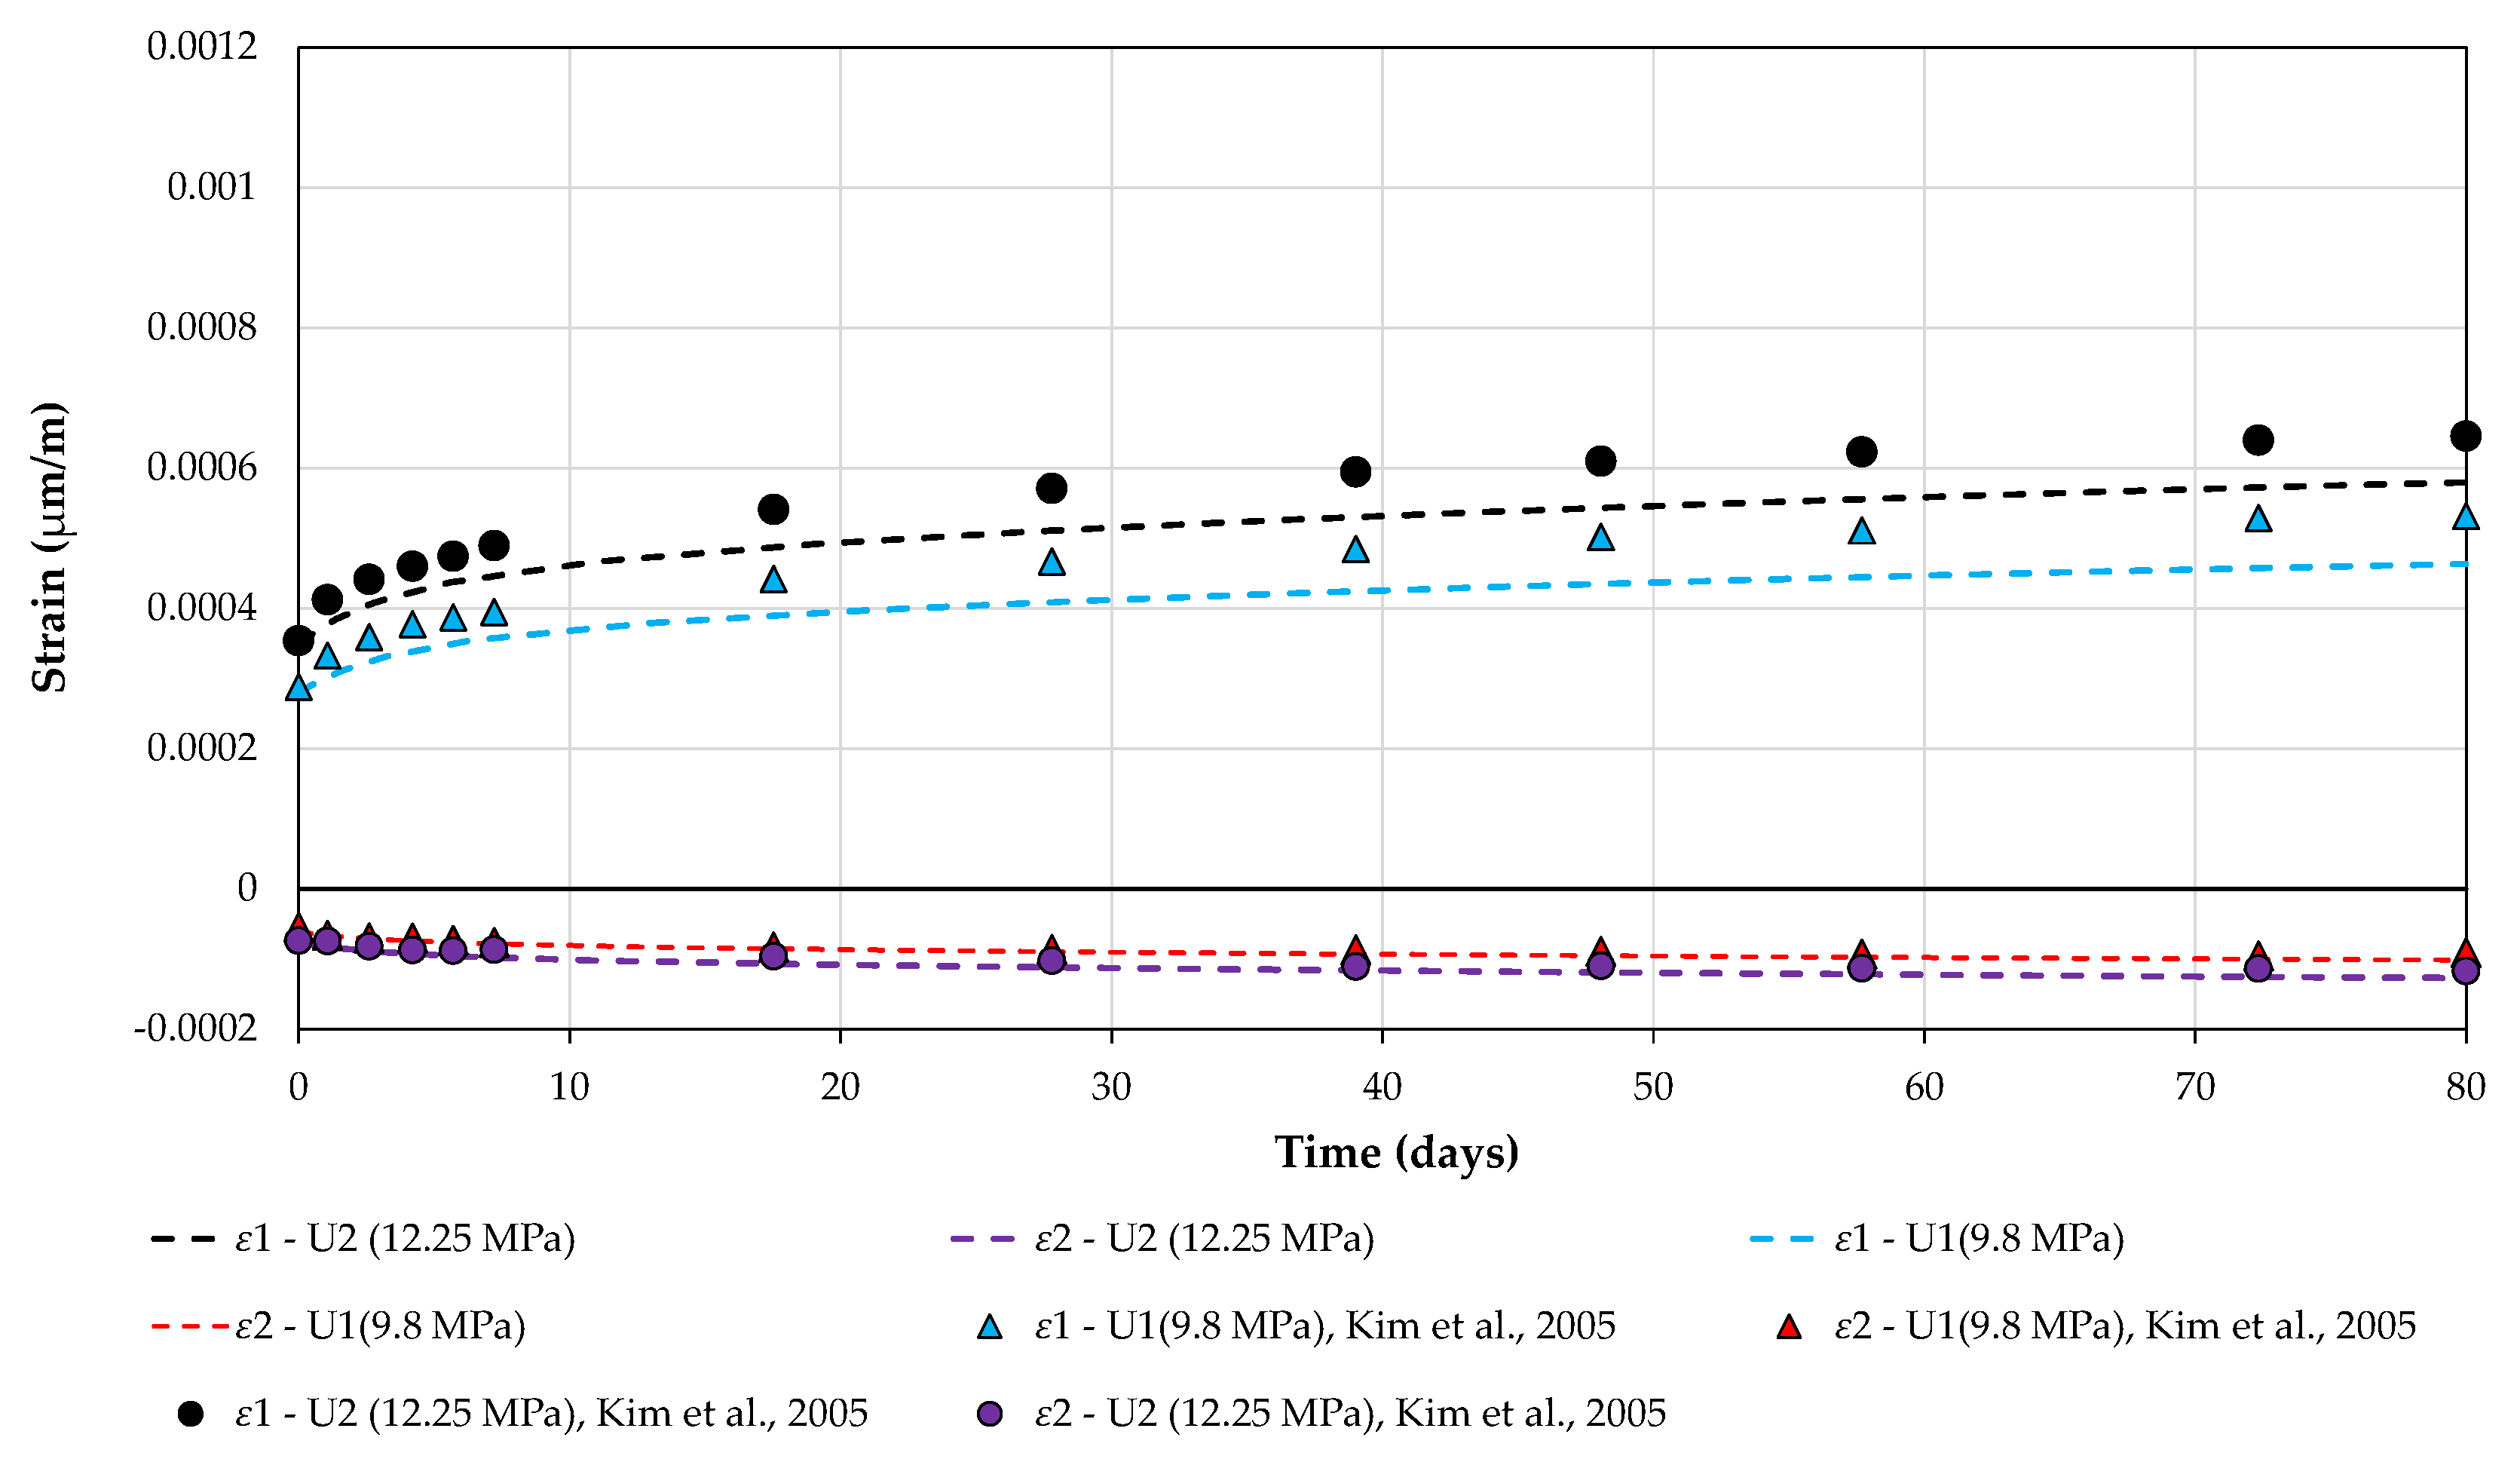
  • The uniaxial compression results showed a maximum discrepancy of approximately 10% between the simulation and experimental results, which is considered satisfactory for numerical simulations of the experimental benchmark.
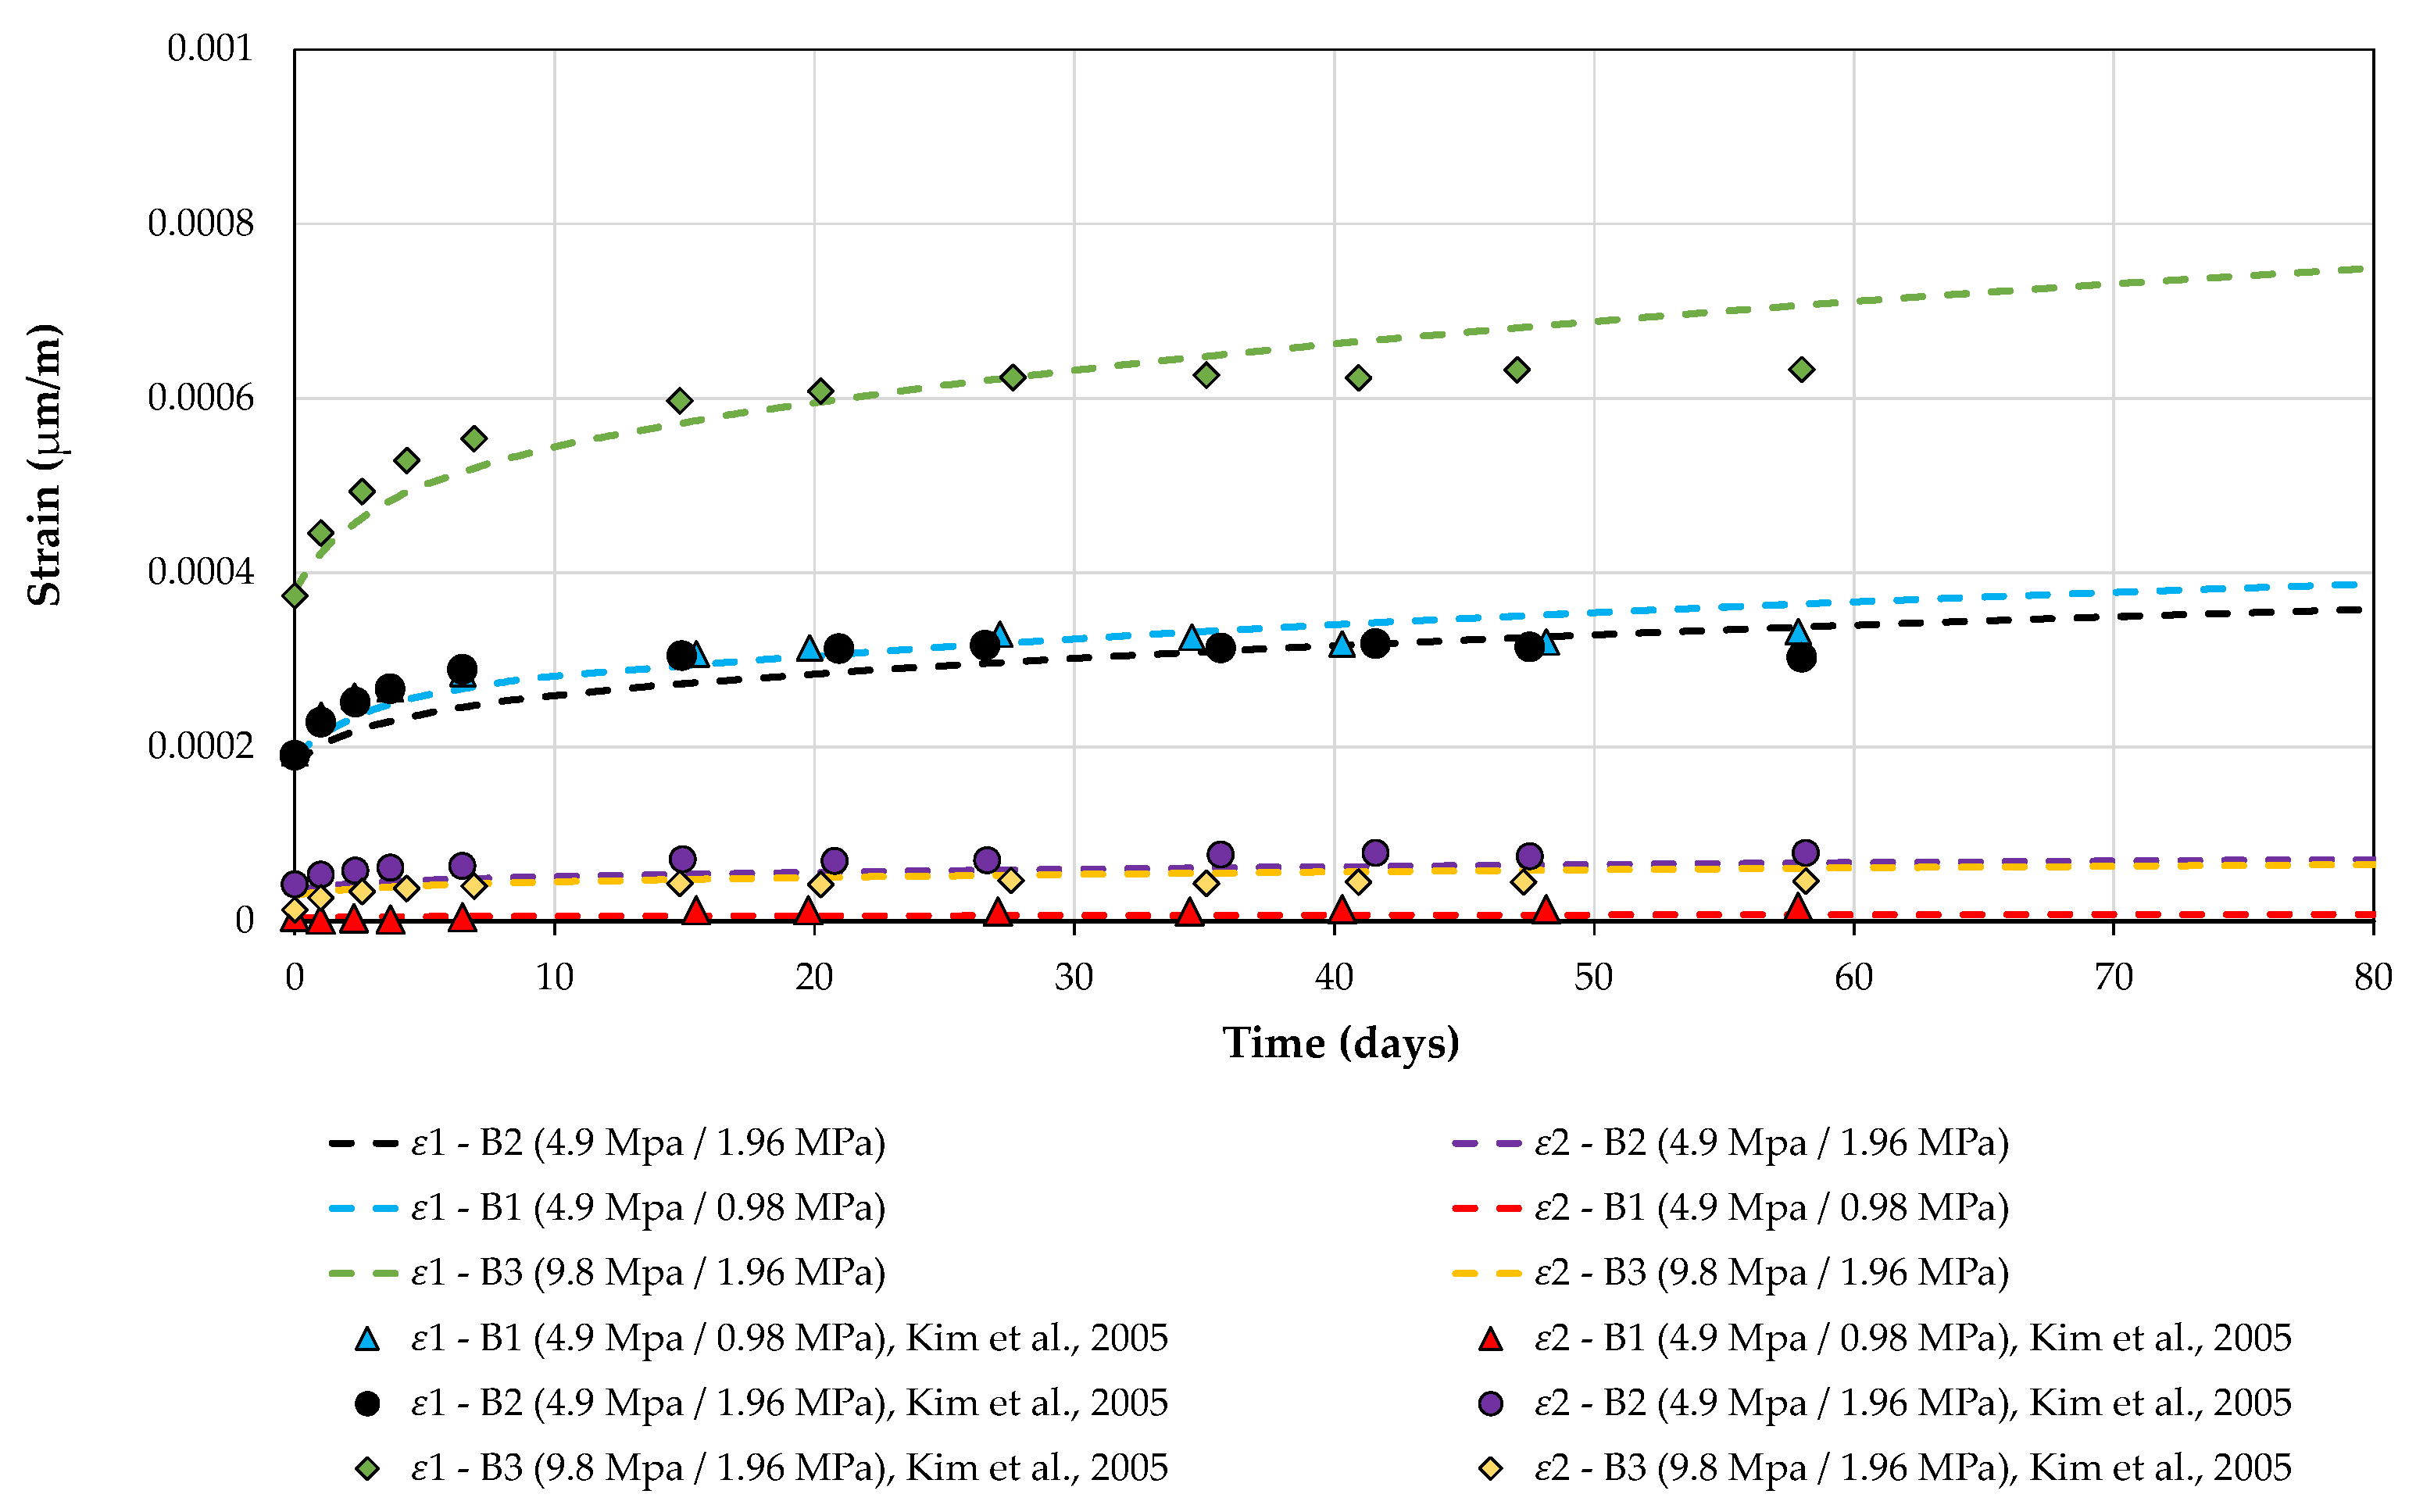
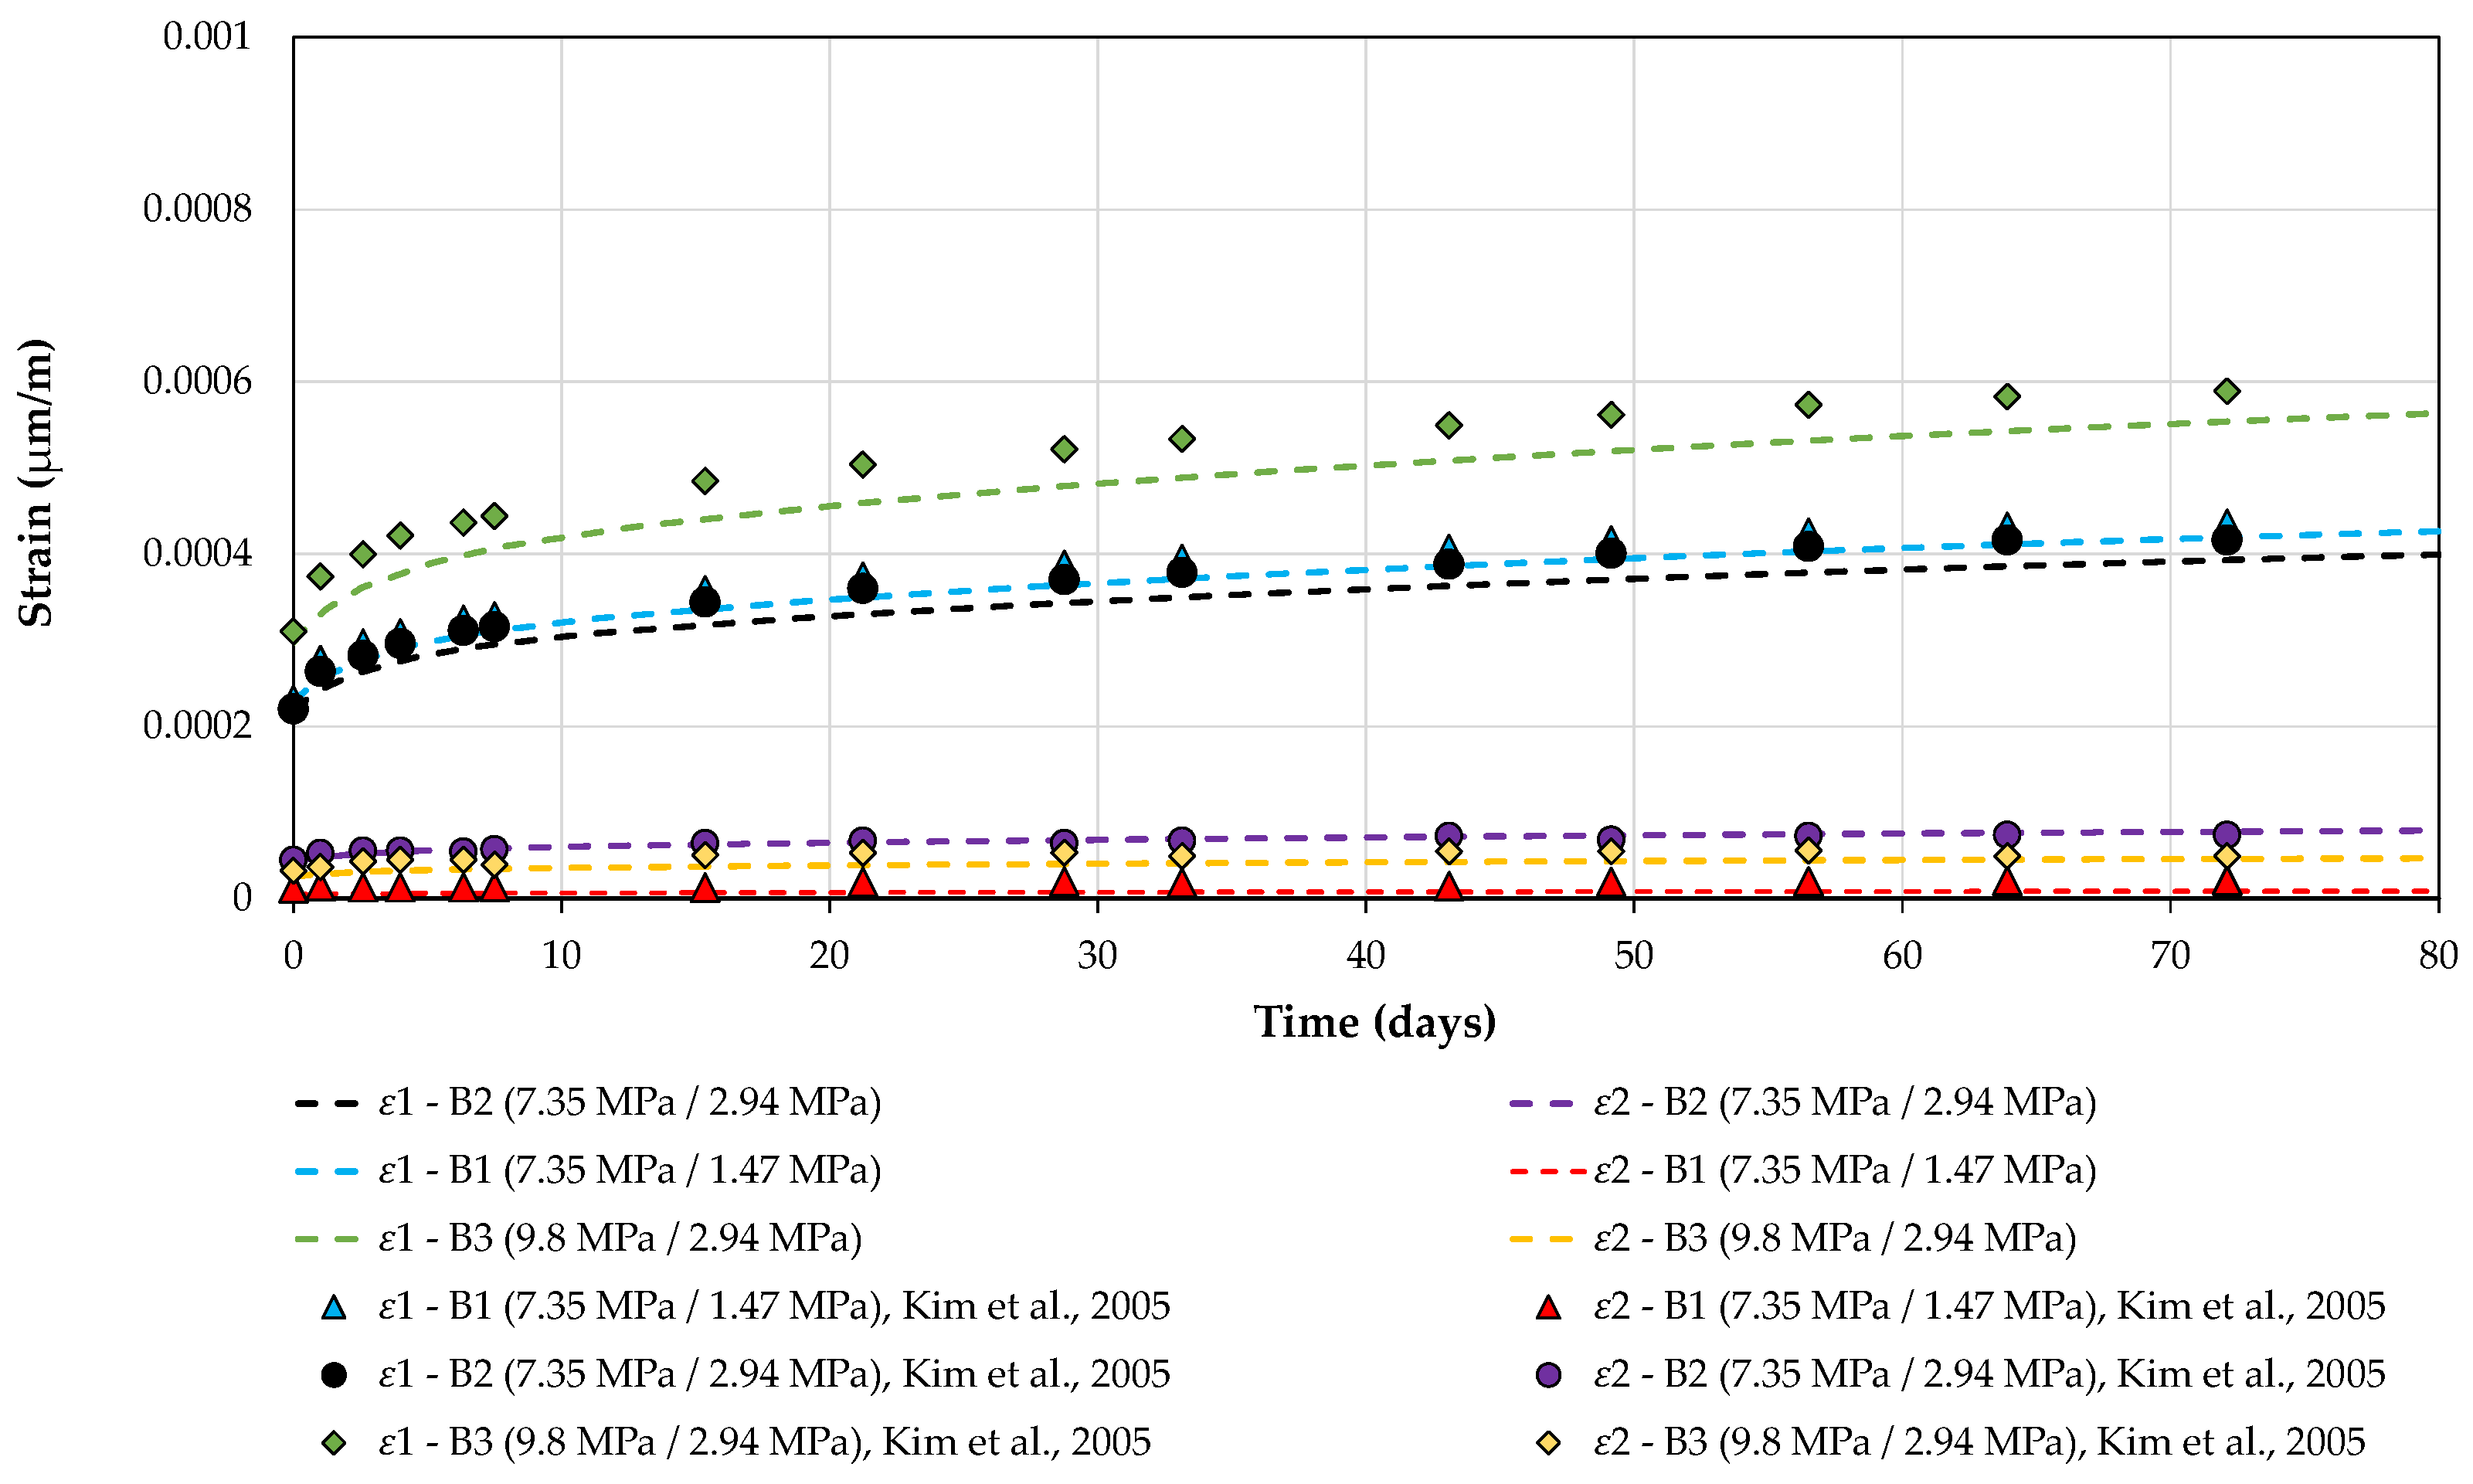
  • The biaxial compression results had a maximum discrepancy of approximately 13%, which is very close to the discrepancy found in the uniaxial compression comparison.
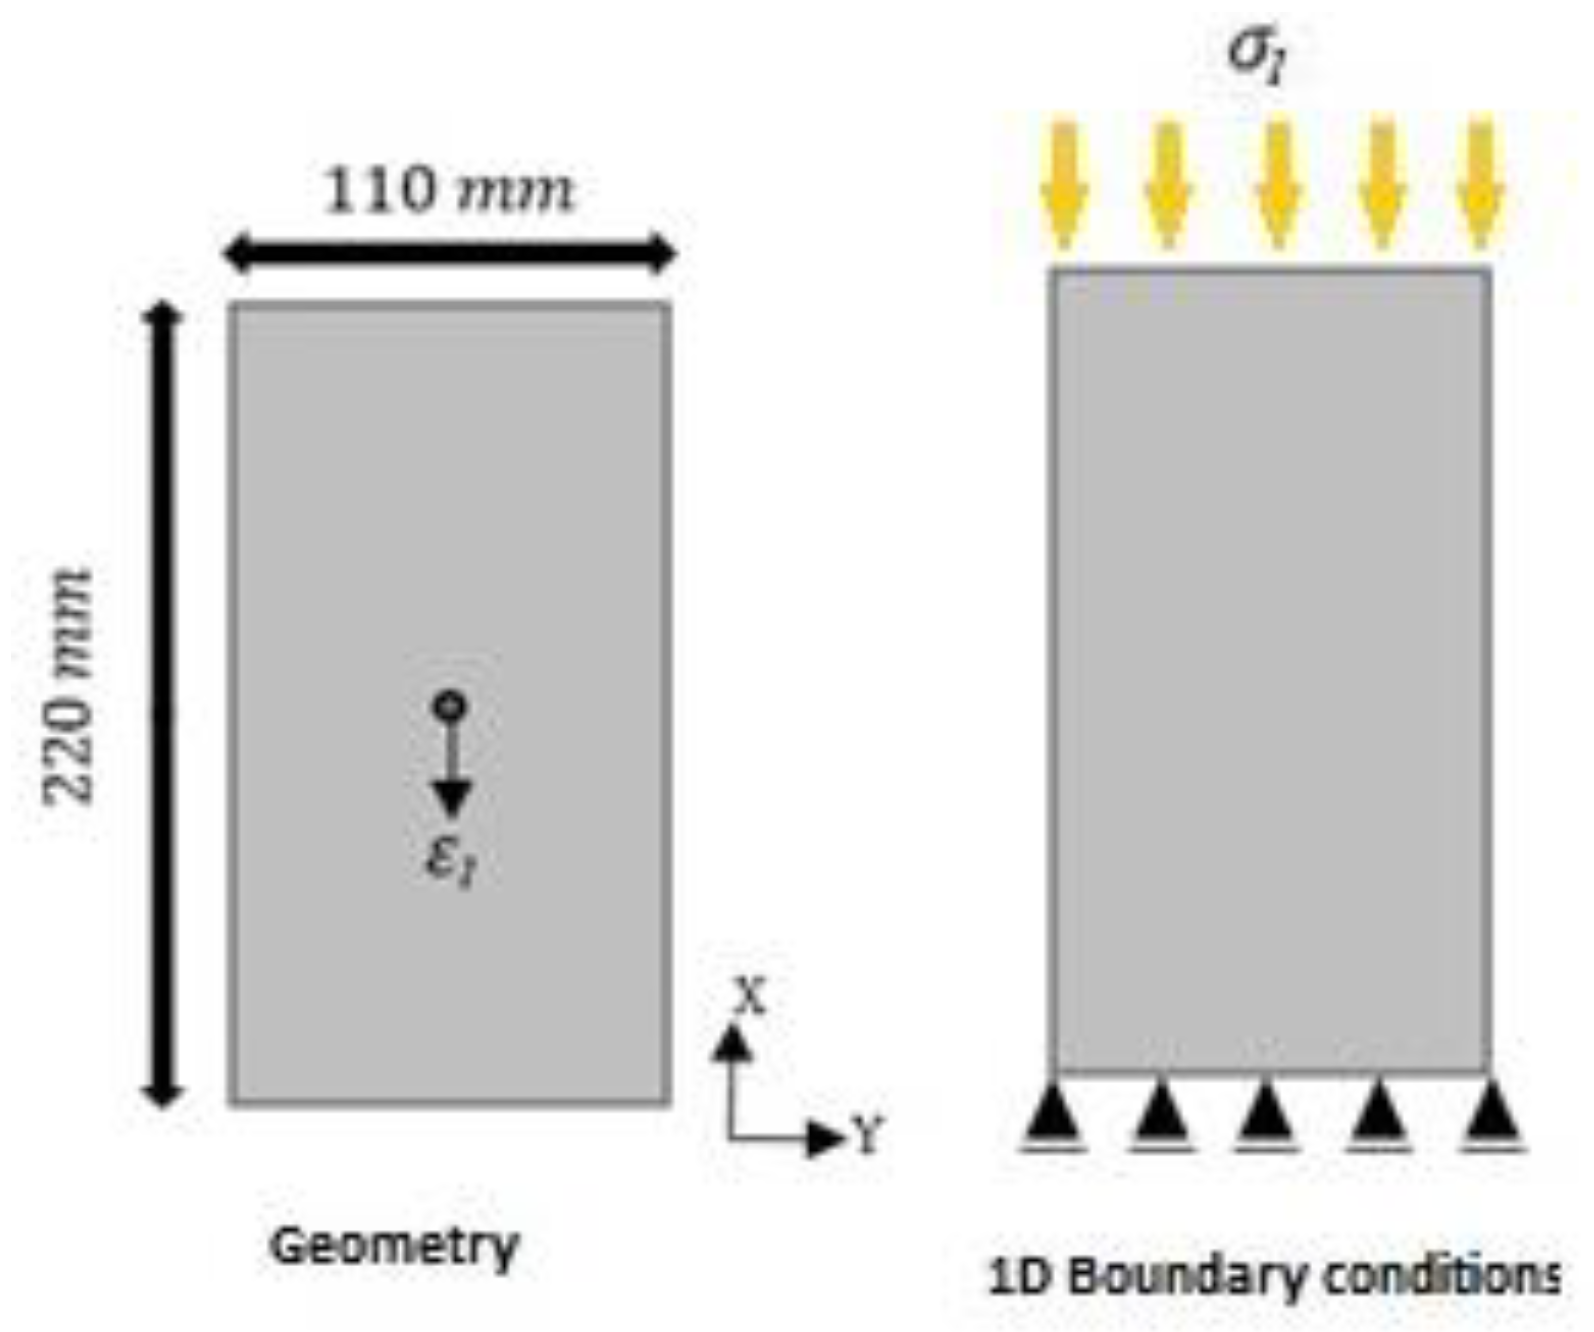
  • The discrepancy observed in strain εI (parallel to stress σI) was higher than the discrepancy observed in strain εII (parallel to stress σII). This suggests that higher loads lead to higher discrepancies, as σI was 2.5 and five times higher than σII. Additionally, the discrepancy is higher for longer periods of time, as the creep strain increases with time.

Author Contributions

All the authors contributed to the development, analysis, writing, and revision of the paper: Conceptualization, F.A.N.S., M.K.B. and M.T.; methodology, R.F.R., F.A.N.S., M.K.B. and M.T.; software, R.F.R. and F.A.N.S.; validation, F.A.N.S. and J.M.P.Q.D.; formal analysis, F.A.N.S., J.M.P.Q.D. and A.C.A.; investigation, R.F.R., F.A.N.S., M.K.B. and M.T.; writing—original draft preparation, R.F.R. and F.A.N.S.; writing—review and editing, F.A.N.S., J.M.P.Q.D. and A.C.A.; visualization, F.A.N.S. and J.M.P.Q.D.; supervision, F.A.N.S., M.K.B. and M.T.; funding acquisition, F.A.N.S. and J.M.P.Q.D. All authors have read and agreed to the published version of the manuscript.

Funding

This work is a result of the project “BlueHouseSim”, with reference 2022.06841.PTDC, funded by national funds (PIDDAC) through FCT/MCTES. In addition, this work was financially supported by Programmatic Funding-UIDP/04708/2020 (CONSTRUCT), funded by national funds through the FCT/MCTES (PIDDAC); and by FCT–Fundação para a Ciência e a Tecnologia through the individual Scientific Employment Stimulus 2020.00828.CEECIND.

Data Availability Statement

The data that support the findings of this study are available upon request from the authors.

Conflicts of Interest

The authors declare no conflict of interest.

References

  1. Comi, C.; Perego, U. Anisotropic damage model for concrete affected by alkali-aggregate reaction. Int. J. Damage Mech. 2011, 20, 598–617. [Google Scholar] [CrossRef]
  2. Silva, F.A.N.; Delgado, J.M.P.Q.; Azevedo, A.C.; Mahfoud, T.; Khelidj, A.; Nascimento, N.; Lima, A.G.B. Diagnosis and assessment of deep pile cap foundation of a tall building affected by internal expansion reactions. Buildings 2021, 11, 104. [Google Scholar] [CrossRef]
  3. Delgado, J.M.P.Q.; Nascimento, N.; Silva, F.A.N.; Azevedo, A.C. Diagnostic of Concrete Samples of Pile Caps Affected by Internal Swelling Reactions. Iran. J. Sci. Technol. Trans. Civ. Eng. 2021, 45, 1059–1071. [Google Scholar] [CrossRef]
  4. Silva, F.A.N.; Delgado, J.M.P.Q.; Azevedo, A.C.; Lira, I.S. Numerical analysis of bottle-shaped isolated struts concrete deteriorated by delayed ettringite formation. Iran. J. Sci. Technol. -Trans. Civ. Eng. 2021, 46, 169–184. [Google Scholar] [CrossRef]
  5. Silva, K.K.S.; Silva, F.A.N.; Mahfoud, T.; Khelidj, A.; Brientin, A.; Azevedo, A.C.; Delgado, J.M.P.Q.; De Lima, A.G.B. On the use of embedded fiber optic sensors for measuring early-age strains in concrete. Sensors 2021, 21, 4171. [Google Scholar] [CrossRef]
  6. Matos, A.M.; SILVA, F.A.N.; Azevedo, A.C.; Marins, J.F.; Delgado, J.M.P.Q. Alkali-reactivity of Pernambuco east shear zone coarse concrete aggregates: An experimental discussion. Constr. Build. Mater. 2022, 344, 128239. [Google Scholar] [CrossRef]
  7. Rajabipour, F.; Giannini, E.; Ideker, J.H.; Dunant, D.F. Alkali-silica reaction: Current understanding of the reaction mechanisms and the knowledge gaps. Cem. Concr. Res. 2015, 76, 130–146. [Google Scholar] [CrossRef]
  8. Grimal, E.; Sellier, A.; Le Pape, Y.; Bourdarot, E. Creep, shrinkage, and anisotropic damage in alkali-aggregate reaction swelling mechanism—Part I: A constitutive model. ACI Mater. J. 2007, 105, 227–235. [Google Scholar]
  9. Pan, J.W.; Feng, Y.T.; Wang, J.T.; Sun, Q.C.; Zhang, C.H.; Owen, D.R.J. Modeling of alkali-silica reaction in concrete: A review. Struct. Civ. Eng. 2012, 6, 1–18. [Google Scholar] [CrossRef]
  10. Thomas, M.; Folliard, K.; Drimalas, T.; Ramlochan, T. Diagnosing delayed ettringite formation in concrete structure. Cem. Concr. Res. 2008, 38, 841–847. [Google Scholar] [CrossRef]
  11. Broekmans, M.A. Guest editorial. Cem. Concr. Res. 2010, 40, 501. [Google Scholar] [CrossRef]
  12. Jensen, V. Alkali-silica reaction damage to Elgeseter Bridge, Trondheim, Norway: A review of construction, research and repair up to 2003. Mater. Charact. 2004, 53, 155–1770. [Google Scholar] [CrossRef]
  13. Ghannadi, P.; Kourehli, S.S.; Mirjalili, S. A review of the application of the simulated annealing algorithm in structural health monitoring (1995–2021). Frat. Ed. Integrità Strutt. 2023, 17, 51–76. [Google Scholar] [CrossRef]
  14. Thomas, M.D.A.; Fournier, B.; Folliard, K.J. Alkali-Aggregate Reactivity (AAR) Facts Book; Report No. FHWA-HIF-13-019; U.S. Department of Transportation—Federal Highway Administration: Springfield, VA, USA, 2013; 211p.
  15. Ponce, J.; Batic, O. Different manifestations of the alkali-silica reaction in concrete according to the reaction kinetics of the reactive aggregate. Cem. Concr. Res. 2006, 36, 148–1156. [Google Scholar] [CrossRef]
  16. Idorn, G.M. A discussion of the paper “Mathematical model for kinetics of alkali-silica reaction in concrete” by Z.P. Bazănt and A. Steffens. Cem. Concr. Res. 2001, 31, 1109–1110. [Google Scholar] [CrossRef]
  17. Garcia-Diaz, E.; Riche, J.; Bulteel, D.; Vernet, C. Mechanism of damage for the alkali–silica reaction. Cem. Concr. Res. 2006, 36, 395–400. [Google Scholar] [CrossRef]
  18. Ichikawa, T.; Miura, M. Modified model of alkali-silica reaction. Cem. Concr. Res. 2007, 37, 1291–1297. [Google Scholar] [CrossRef]
  19. Pourbehi, M.S. Numerical Modelling of Alkali Silica Reaction in Concrete Dams. Ph.D. Thesis, Stellenbosch University, Stellenbosch, WC, South Africa, 2018. [Google Scholar]
  20. Morenon, P. Modélisation des Reactions de Gonflement Interne des Bétons Avec Prise en Compte des Couplages Poro-Mécaniques et Chimiques. Ph.D. Thesis, Université Toulouse 3 Paul Sabatier, Toulouse, France, 2017. [Google Scholar]
  21. Gao, X.X.; Multon, S.; Cyr, M.; Sellier, A. Alkali-silica reaction (ASR) expansion: Pessimum effect versus scale effect. Cem. Concr. Res. 2013, 44, 25–33. [Google Scholar] [CrossRef]
  22. Multon, S.; Cyr, M.; Sellier, A.; Diederich, P.; Petit, L. Effects of aggregate size and alkali content on ASR expansion. Cem. Concr. Res. 2010, 38, 350–359. [Google Scholar] [CrossRef]
  23. Larive, C. Apports Combinés de L’expérimentation et de la Modélisation à la Compréhension de L’alcali-Réaction et de Ses effects Mécaniques. Ph.D. Thesis, Ecole Nationale des Ponts et Chaussées, Paris, France, 1997. [Google Scholar]
  24. Ulm, F.J.; Coussy, O.; Larive, C.; Kefei, L. Thermo-chemo-mechanics of ASR expansion in concrete structures. J. Eng. Mech. 2000, 126, 233–242. [Google Scholar] [CrossRef]
  25. Multon, S. Évaluation Expérimentale et Théorique des Effects Mécaniques de L’alcali-Réaction sur des Structures Modèles. Ph.D. Thesis, Université de Marne-la-Vallée, Marne-la-Vallée, Île-de-France, France, 2003. [Google Scholar]
  26. Multon, S.; Toutlemonde, F. Effect of applied stresses on alkali-silica reaction induced expansions. Cem. Concr. Res. 2006, 36, 912–920. [Google Scholar] [CrossRef]
  27. Dunant, C.F.; Scrivener, K.L. Effects of uniaxial stress on alkali-silica reaction induced expansion of concrete. Cem. Concr. Res. 2012, 42, 567–576. [Google Scholar] [CrossRef]
  28. Gautam, B.P.; Panesar, D.K. A new method of applying long-term multiaxial stresses in concrete specimens undergoing ASR, and their triaxial expansions. Mater. Struct. 2016, 49, 3495–3508. [Google Scholar] [CrossRef]
  29. Sellier, A.; Multon, S.; Buffo-Lacarrière, L.; Vidal, T.; Bourbon, X.; Guillaume, C. Concrete creep modelling for structural applications: Non-linearity, multi-axiality, hydration, temperature and drying effects. Cem. Concr. Res. 2016, 79, 301–315. [Google Scholar] [CrossRef]
  30. COMSOL Muliohysics® v. 5.5. COMSOL AB, Stockholm, Sweden. Available online: www.comsol.com (accessed on 18 February 2023).
  31. Kim, S.Y.; Kim, J.K.; Kim, Y.Y.; Kwon, S.H. Experimental studies on creep of sealed concrete under multiaxial stresses. Mag. Concr. Res. 2005, 57, 623–634. [Google Scholar] [CrossRef]
  32. Ladaoui, W.; Vidal, T.; Sellier, A.; Bourbon, X. Analysis of interactions between damage and basic creep of HPC and HPFRC heated between 20 and 80 °C. Mater. Struct. 2013, 46, 13–23. [Google Scholar] [CrossRef]
  33. Sellier, A.; Casaux-Ginestet, G.; Buffo-Lacarrière, L.; Bourbon, X. Orthotropic damage coupled with localized crack reclosure processing—Part I: Constitutive laws. Eng. Fract. Mech. 2013, 971, 148–1673. [Google Scholar] [CrossRef]
Figure 1. Effects of the characteristic time over the advancement of the reaction (experimental data of [20].
Buildings 13 02575 g001
Figure 2. Effects of temperature over the advancement of the reaction (experimental data of [20]).
Buildings 13 02575 g002
Figure 3. Effects of the saturation degree over the advancement of the reaction (experimental data of [20]).
Buildings 13 02575 g003
Figure 4. Differences in the reaction’s evolutions for the same primary parameters (experimental data of [20]).
Buildings 13 02575 g004
Figure 5. Schematic representation of the tests performed in [32], simulated.
Buildings 13 02575 g005
Figure 6. Evolution of the total strain for the 26 MPa compressive strength concrete under uniaxial compression (experimental data of [31]).
Buildings 13 02575 g006
Figure 7. Evolution of the total strain for the 44 MPa compressive strength concrete under uniaxial compression (experimental data of [31]).
Buildings 13 02575 g007
Figure 8. Evolution of the total strain for the 54 MPa compressive strength concrete under uniaxial compression (experimental data of [31]).
Buildings 13 02575 g008
Figure 9. Evolution of the total strain for the 26 MPa compressive strength concrete under biaxial compression (experimental data of [31]).
Buildings 13 02575 g009
Figure 10. Evolution of the total strain for the 44 MPa compressive strength concrete under biaxial compression (experimental data of [31]).
Buildings 13 02575 g010
Figure 11. Evolution of the total strain for the 54 MPa compressive strength concrete under biaxial compression (experimental data of [31]).
Buildings 13 02575 g011
Figure 12. Schematic representation of the tests performed in [32], simulated.
Buildings 13 02575 g012
Figure 13. Evolution of the total strain for the different temperatures in the creep test performed in [32].
Buildings 13 02575 g013
Table 1. Material parameters for gel volume calculation.
ParameterMeaningRange Value in Laboratory TestsUnit of MeasureCalibration Test
ϕ a s r , Maximum volume ratio of ASR gel 0 ~ 10 2 m³/m³Free-swelling test
τ r e f a s r Characteristic time of ASR 0 ~ 200 DaysFree-swelling test
S r t h , a s r Saturation degree threshold to activate ASR 0 ~ 0.1 -Swelling test for different hydric conditions
T r e f Reference temperature at which the test is carried outTemperature value -
E a s r Activation energy for the kinetics of ASR 40.00 J/molSwelling test for different temperatures
Table 2. Material parameters for intrapore pressure calculation.
ParameterMeaningRange in Laboratory TestsUnit of MeasureCalibration Test
ϕ a s r v Volume of porosity connected to the reactive sites 10 %   o f   ϕ a s r m³/m³Free-swelling test
b a s r Biot coefficient for ASR 0.1 ~ 0.25 -Restrained swelling test
M a s r Biot modulus for gel–matrix interaction 27,700 MPaFree-swelling test
Table 3. Material parameters to calculate permanent creep.
ParameterMeaningRange Value in Laboratory TestsUnit of Measure
τ r e f M Reference characteristic time associated with the Maxwell strain 14 Days
E w a Activation energy for water viscosity 17,000 J/mol
E p a Activation energy for differential dilatation between phases 25,000 J/mol
T r e f , c r e e p Reference temperature for which τ r e f M is fitted 20 °C
T t h r Temperature threshold for which the thermal damage appears and modifies the creep potential 40 °C
χ M Fitting parameter responsible for the non-linear behavior when the specific creep amplification increases with the loading rate.2-
ε r e f M Reference creep coefficient 0.9 × 10 4 -
Table 4. Material specifications to determine reversible creep.
ParameterMeaningRange Value in Creep TestsUnit of Measure
ψ K Fitting parameter to control the kinetics modification, adjusting the final amplitude of the reversible creep 4 ~ 5 -
τ r e f K Reference characteristic time associated with the Kelvin strain 0.70 days
Table 5. Loading scenarios for the multiaxial creep tests by [31].
Concrete Compressive Strength
(MPa)
Uniaxial CompressionBiaxial Compression
Stress Level 1 (MPa)Stress Level 2 (MPa)Stress Level 1 (MPa)Stress Level 2 (MPa)Stress Level 3 (MPa)
26 σ I = 4.9 σ I = 9.8 σ I = 4.9
σ I I = 0.98
σ I = 4.9
σ I I = 1.96
σ I = 9.8
σ I I = 1.96
44 σ I = 7.35 σ I = 9.8 σ I = 7.35
σ I I = 1.47
σ I = 7.35
σ I I = 2.94
σ I = 9.8
σ I I = 2.94
54 σ I = 9.8 σ I = 12.25 σ I = 9.8
σ I I = 1.96
σ I = 9.8
σ I I = 3.92
σ I = 12.25
σ I I = 3.92
Table 6. Main material parameters used to simulate creep tests performed by [31].
Concrete#ParameterValue
C1fc (MPa)26
E (MPa)24.010
υ 0.18
τ r e f K (days)2
τ r e f M (days)15
ε r e f M 10 × 10−5
ψ K 4
ε r e f E 211 × 10−6
C2fc (MPa)44.1
E (MPa)29.841
υ 0.18
τ r e f K (days)2
τ r e f M (days)15
ε r e f M 9 × 10⁻⁵
ψ K 4
ε r e f E 246 × 10−6
C3fc (MPa)54.3
E (MPa)34.006
υ 0.18
τ r e f K (days)3
τ r e f M (days)20
ε r e f M 7.5 × 10⁻⁵
ψ K 4
ε r e f E 288 × 10−6
Table 7. Main material parameters to simulate the creep tests performed in [32].
ParameterValue
fc (MPa)86
E (T = 20 °C) (MPa)34.800
E (T = 50 °C) (MPa)41.600
E (T = 80 °C) (MPa)45.450
υ 0.28
E p a (J/mol)23.700
τ r e f K (days)5
τ r e f M (days)10
ε r e f M 5.5 × 10⁻⁵
ψ K 5
ε r e f E 590 × 10−6
Disclaimer/Publisher’s Note: The statements, opinions and data contained in all publications are solely those of the individual author(s) and contributor(s) and not of MDPI and/or the editor(s). MDPI and/or the editor(s) disclaim responsibility for any injury to people or property resulting from any ideas, methods, instructions or products referred to in the content.

