Article

Passengers’ Perception of Acoustic Environment in the Airport Terminal: A Case Study of Tianjin Binhai International Airport

1
School of Architecture, Tianjin University, Tianjin 300072, China
2
Tianjin Binhai International Airport, Tianjin 300072, China
*
Author to whom correspondence should be addressed.
Buildings 2023, 13(10), 2585; https://doi.org/10.3390/buildings13102585
Submission received: 27 August 2023 / Revised: 3 October 2023 / Accepted: 11 October 2023 / Published: 13 October 2023
(This article belongs to the Section Building Energy, Physics, Environment, and Systems)

Abstract

:
This paper aims to investigate passengers’ perception of the acoustic environment in airport terminals. Airport terminals typically consist of several interconnected large spaces and have a noisy environment in China. A questionnaire survey was conducted among 221 passengers at the T2 terminal of Tianjin Binhai International Airport in China to explore their perception and attitude towards the acoustic environment. On-site measurements were also taken to obtain the noise levels in different areas. The results show that the sound pressure levels vary periodically, ranging from 60.7 dB(A) to 79.1 dB(A) across different areas. The acoustic environment lacks eventfulness and pleasantness, with nearly two-thirds of respondents expressing dissatisfaction. Public announcement is generally perceived as the loudest but most preferred sound, while other audible sources are given varying degrees of negative attitudes. The perceived loudness of aircraft and footstep sounds is not high, but their absence significantly improves overall evaluations. Furthermore, age influences the perceived vitality of the acoustic environment. This study is important for the improvement in the indoor environment of the terminal building and the satisfaction of passengers.

1. Introduction

Aviation transportation in China is currently undergoing rapid development [1]. By the end of 2021, a total of 248 airports had handled an impressive passenger throughput of 907 million [2]. The terminal, acting as a pivotal link between the landside and airside, serves not only as the central location for passengers during air travel but also plays a significant role in facilitating formalities, security screening operations, and other essential services for staff [3]. In the terminal, the acoustic environment is a vital component of the indoor environment [4], affecting the realization of the space function [5], occupants’ experiences and feelings [6,7,8,9], and even evacuation in an emergency.
The acoustic environment of large spaces was found to be different from the general spaces. As the volume of the space increased, the sound field appeared to have some obvious inconsistencies with the assumption of diffuse [10]. It was also found that people’s perceptions of the acoustic environment varied depending on the spatial function [4]. Currently, research on the acoustic environment of large spaces is mainly focused on high-speed rail stations [11,12], sports buildings [4], dining spaces [13,14], and shopping malls [15,16].
A comprehensive study by Du et al. [11] on the indoor environment of several high-speed railway stations found that among indoor thermal, natural, acoustic, and air environments, the acoustic environment has the greatest impact on passengers’ comfort. Similarly, Wu et al.’s [12] study on the acoustic environment of Chinese high-speed railway stations also revealed that various dominant sounds in different spaces lead to different evaluations of acoustic comfort. Rychtarikova [17] proposed a set of measurable monaural and binaural acoustic parameters based on the study of atrium spaces to describe the acoustic comfort of large halls. Chen et al.’s [4] research found that most sounds in sports buildings bring positive feelings to occupants, which is different from that in high-speed railway station waiting halls and exhibition halls. Furthermore, Chen et al.’s [13] questionnaire survey on two typical large-scale dining spaces found that the loudness, clarity, noise level, and preference of sounds are factors affecting customers’ evaluation of auditory comfort. Mistar et al. [14] developed a conceptual framework for classifying restaurant and identifying factors that affect auditory comfort. Chen et al. [15] and Alnuman et al. [16] conducted measurements of objective acoustic parameters such as sound pressure level (SPL) and reverberation time in shopping centers. Additionally, they conducted questionnaire surveys among the occupants to identify the primary factors influencing acoustic comfort and the impact of noise. Overall, acoustic comfort is a commonly used indicator for evaluating the acoustic environment in large spaces, and research in this area aims to improve the acoustic comfort of spaces through measurement and subjective evaluation.
Noise has always been a major environmental problem at airports [18], and research on the acoustic environment of airports mainly focuses on the external acoustic characteristics [19,20] and impacts on the surrounding environment. Airport terminals are typically large spaces with complex ambient acoustic environments [21,22]. However, research on this topic is very limited. Extensive research [23,24,25] in other types of buildings has demonstrated the significant impact of indoor environments on occupant comfort and satisfaction, with noise being a factor that cannot be ignored in this process. Research has shown that noise can increase people’s tension and anxiety [23,25] and can interfere with communication and hearing [24]. Passengers are exposed to various types of noise during their travels, such as aircraft noise, crowd noise, and the sound of luggage and footsteps. Passengers may need to raise their voices to hear others clearly, which can result in increased sound and higher noise levels [26,27,28]. This effect is called the “Lombard effect”, and ultimately this phenomenon will affect passengers’ travel experience and satisfaction.
A few studies have investigated the acoustic environment of terminal buildings. Wijingaarden et al. [9] measured the background noise level in the terminal of Schiphol Airport in the Netherlands. The measurement results show that the overall sound pressure level is between 55 dB (A) to 70 dB (A). Although the SPL in different areas has significant differences in value, the spectra is very similar. The research of Sayed [7] shows that the SPL in the terminal of Cairo Airport varies greatly throughout the day, and the staff’s satisfaction with the acoustic environment is very low. In China, Geng et al. [8] conducted a short-term measurement of the SPL of the terminal buildings in eight Chinese airports. Through investigating the subjective evaluation of passengers on the indoor physical environment, the author found that out of several indoor environment indicators, the satisfaction of the acoustic environment of eight airports is the lowest. Li et al. [29] conducted measurements in the waiting halls of five terminal buildings in China, and the results showed a significant negative correlation between SPL and passengers’ evaluation of loudness and auditory comfort. People’s perception of acoustic environments is not independently reliant on sound pressure level, it is also affected by the activities in the space and other factors of the environment. Therefore, conducting subjective surveys to gain in-depth insights into how individuals perceive acoustic environments in these unique spaces is necessary to enrich the field of research on acoustic environment perception in special spaces and to comprehend the acoustic environment requirements in certain contexts.
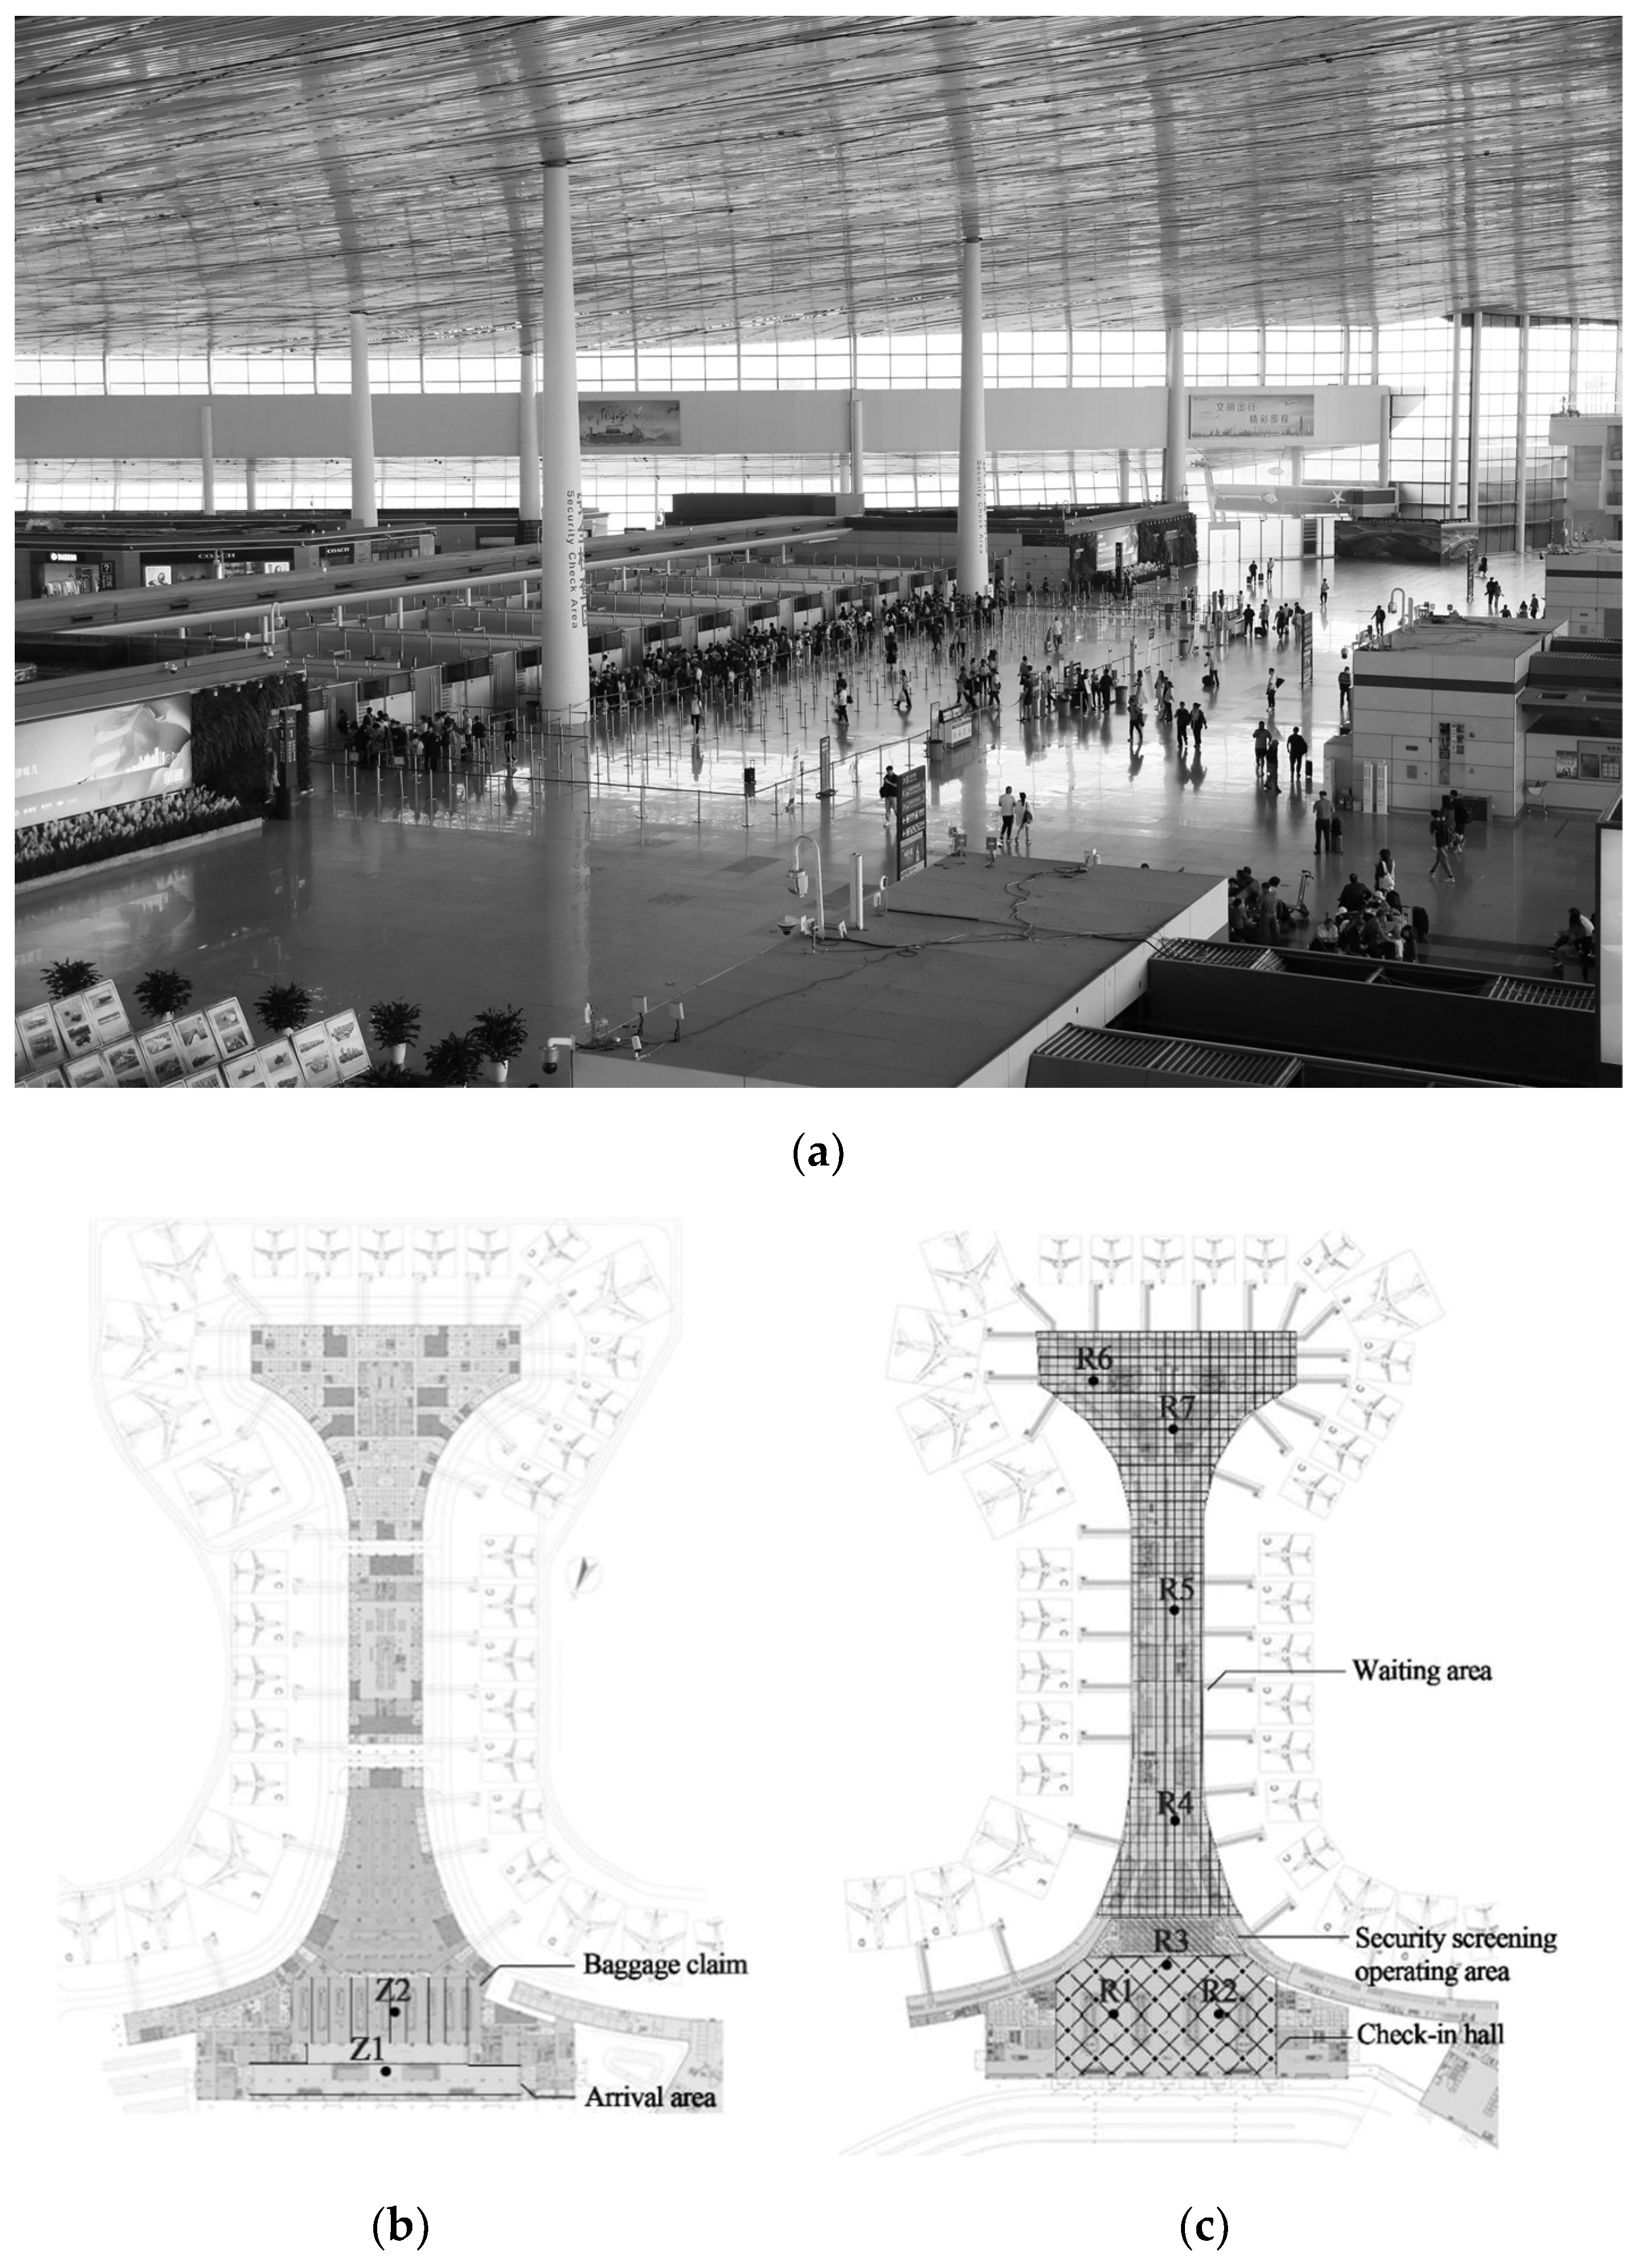
Therefore, for a country with a substantial passenger throughput, there is insufficient research of the acoustic environment of airport terminals in China. This study aims to address this gap by providing an insight into the current state of acoustic environments in airport terminals. This article takes the T2 terminal of Tianjin Binhai International Airport as the research object and intends to investigate its acoustic environment through on-site measurement and subjective evaluation to obtain the distribution characteristics of noise in different areas, and to understand the perception and attitudes of passengers towards the acoustic environment. This provides theoretical support for improving the acoustic environment of terminals in China.

2. Materials and Methods

2.1. Research Site

Tianjin Binhai International Airport (Figure 1a) is a 4F civil international airport whose airport transportation scale ranks in the top 10% of Chinese airports [2]. The T2 terminal is approximately 630 m in length and 400 m in width, with a total area of about 248,000 square meters and a volume of more than 579,000 cubic meters. The main functional spaces in the T2 terminal include the check-in hall, security screening operating area, waiting area, arrival area, and baggage claim. The results of this study can provide a reference for the acoustic design or improvement in similarly sized airport terminals.

2.2. On-Site Measurement

In order to assess the acoustic environment in the terminal, the SPL was measured at various locations during the airport’s main operation hours from 9:00 to 21:00 on 29 September 2021. A total of 8 measuring points were arranged in the check-in hall, security screening operating area, waiting area, arrival area, and baggage claim. The location of the measuring points is shown in Figure 1b,c.
Sound level meters (AWA5688) were used to collect the SPL at each site, and 1/3 octave band spectrum was recorded at the test points R3 and R6 simultaneously. The measurement process complies with ISO 1996-2: 2017 [30]. Before and after each measurement, a 94 dB acoustic calibrator was used to calibrate the sound level meters, ensuring that the deviation between the values was not greater than 0.5 dB [30]. Each measuring point was tested for a duration of 1 h, with a half-hour interval between tests. Finally, a total of 8 h of data were collected at each point. Considering that most people were sitting in the terminal, the mechanical was set to be 1.2 m from the ground and 1.5 away from the surround reflective surfaces to avoid the influences of reflection.

2.3. Questionnaires

The questionnaire (Figure 2) is mainly based on Method A of ISO/TS12913-2:2018 [31], and it was translated into Chinese. It consists of three parts: (1) respondents’ perception of sound sources inside the terminal building, including aircraft sound, crowd conversation sound, footstep sound, luggage sound, public broadcasting, and mechanical noise (air conditioning noise, etc.), which was evaluated using the Likert five-level scale method to assess perceived loudness (1 for ‘not at all’ to 5 for ‘completely dominant’) and sound source preference (1 for ‘very annoyed’ to 5 for ‘very liked’); (2) respondents’ overall evaluation of the acoustic environment, which includes quality evaluation, subjective loudness evaluation, coordination evaluation, and perceived affective quality, including ‘pleasant’, ‘chaotic’, ‘vibrant’, ‘uneventful’, ‘calm’, ‘monotonous’, ‘annoying’, ‘eventful’ (1 for ‘strongly disagree’ to 5 for ‘strongly agreed’); and (3) the age information of the respondents.
The questionnaires were randomly distributed to passengers at the check-in hall from 9:00 to 21:00 from 22 September to 30 September in 2021, and we ultimately collected 221 valid questionnaires, with an effective rate of 97.4%. The age composition of the respondents is shown in Figure 3. The proportion of respondents under 18 years old, 18–25 years old, 26–30 years old, 31–40 years old, 41–50 years old, and over 50 years old is 1.4%, 42.5%, 24.0%, 20.8%, 8.6%, and 2.7%, respectively.

2.4. Data Analysis

In the analysis of SPL, the average was calculated to represent the SPL measured within one hour. Mean values were also used in the analysis of the 1/3 octave band spectrum.
Psychoacoustic parameters describe a person’s auditory perception of the special properties of sound. The commonly used objective parameters of psychoacoustics include loudness, sharpness, fluctuation strength, and roughness. The four objective evaluation parameters were calculated using the software ArtemiS SUITE 7.0 for sound samples from two locations, R3 and R6, with significant differences. Among them, loudness was calculated according to ISO532-1 [32], sharpness was calculated using the DIN45692 algorithm [33], and fluctuation strength and roughness were analyzed based on Dr. Sottek, R’s auditory model [34].
Subjective survey data was imported into SPSS for statistical analysis. Mean values and percentages of subjective evaluation were used to analyze the respondents’ perceived loudness and preference for sound sources. Pearson correlation analysis was used by analyzing the score of subjective evaluation to analyze the relationship between perceived loudness and preference, perceived affective quality, and overall evaluation of the acoustic environment. As for perceived emotional quality of the acoustic environment, the average scores and standard deviations in the four dimensions (annoying, calm, chaotic, eventful) were calculated, and the point was plotted on the two-dimensional plane based on ISO TS 12913:3 standard [31] (Equation (1)). In order to identify the trends in how age influenced the four dimensions in perceived emotional quality, mean and standard deviation of subjective evaluation were computed for different age groups. To determine the impact of a certain sound on the overall evaluation, an independent samples t-test was conducted in the presence or absence of the sound source, with a grouping of ‘completely inaudible’ as 0 and ‘audible’ as 1. A one-way ANOVA was used to explore the relationship between age and perception of sound sources and overall evaluation by using the scores of the subjective evaluation.
P = (p-a) + cos45° (ca-ch) + cos45°(v-m)
E = (e-u) + cos45°(ch-ca) + cos45°(v-m),
where a is annoying, ca is calm, ch is chaotic, e is eventful, m is monotonous, p is pleasant, u is uneventful, and v is vibrant.

3. Results

3.1. Acoustic Environment Characteristics

3.1.1. Sound Pressure Level

The acoustic environment in the terminal varies in location and exhibits periodic changes throughout the day. The results show that the SPL in the terminal ranges from 60.7 dB (A) to 79.1 dB (A). Figure 4 shows the SPL in the main functional areas during the measurement period. Among them, SPL in the arrival area, baggage claim, and waiting area are close to each other, which are between 60 (A) and 65 dB (A) with small fluctuations. However, the SPL of the check-in hall shows a large fluctuation and a trend of gradually decreasing with time. The SPL in the security screening operating area fluctuates the most throughout the measurement period, with a maximum difference of 16.8 dB. The maximum fluctuations of SPL occur at 12:30 and 15:30. Through field observation, it was found that the fluctuations of the SPL are related to the sharp increase in the number of people in the security screening operating area because of the large number of aircrafts taking off during this period. After then, with the decrease in population, the SPL decreases rapidly.
The results also reflect the spatial distribution characteristics of the SPL. In all measurement periods, the SPL in the security screening operating area is higher than that in most areas, which is related to the high density of people in the security screening operating area and the large number of speakers. In more than half of the measurement periods, the SPL of the check-in hall is higher than that of the other areas. The SPL of the waiting area, baggage claim area, and arrival area is close to each other.

3.1.2. 1/3 Octave Band Spectrum

The difference in the sound spectrum is shown in Figure 5. R3 in the security screening operating area and R6 in the waiting area show significant differences: R3 shows the characteristics of a high sound pressure level at low frequency and medium frequency and a low sound pressure level at high frequency; R6 is characterized by a higher sound pressure level at intermediate frequency and a lower sound pressure level at low frequency and high frequency. The security screening operating area is greatly affected by the sound of mechanical noise, which has low-frequency sound accounting for a high proportion, resulting in a reduction in the clarity of public announcements. And it was found that staff need to use additional speakers to broadcast security information, which leads to increasing sound sources, making the acoustic environment noisier.

3.1.3. Psychoacoustic Parameters

Analysis of the psychoacoustic parameters is presented in Table 1. The results of loudness show that the values in the security screening area (R3) are significantly higher than those in the waiting hall (R6), indicating that people perceive louder sounds in the security screening area. In terms of sharpness, the values at R3 indicate a higher proportion of high-frequency spectra, giving a sharper acoustic environment. Regarding roughness, the results show that the security screening area at R3 is significantly lower than the waiting hall at R6. Lastly, the fluctuation strength of R3 is higher, indicating greater instability during the measurement period.
In summary, the security screening area at R3 exhibits greater loudness, sharpness, and fluctuation strength, leading to a more piercing sound environment. This suggests lower acoustic comfort, making it an area that requires particular attention.

3.2. Subjective Evaluation of Passengers

3.2.1. Perceived Loudness and Preference

Participants’ perceived loudness and preference for individual sound sources are shown in Figure 6 and Figure 7. The preference for a sound is formed in experience and reflects respondents’ basic perception of it. The public announcement was rated by the respondents as the loudest, with a mean of 3.70. Moreover, passengers rated public announcements as the most preferred sound, with an average score of 3.26. This may be because passengers typically have a strong demand for broadcasting, which plays an important role in information transmission and guidance in the terminal and is more likely to attract passengers’ attention and preference. Pearson correlation analysis results between perceived loudness and preference for individual sound sources in Table 2 reveal a significant negative correlation between perceived loudness and preference for public announcement at the 0.01 level, with a correlation coefficient of −0.191. This indicates that although a public announcement is the most preferred sound among travelers, exceeding a certain threshold can still have a negative impact on the evaluation. Therefore, it needs to be controlled within a certain range in practice.
Overall, the preference for sound sources in the airport terminal (as shown in Figure 7) indicates that travelers do not have a particularly strong preference for or hate towards sound sources. The percentage of respondents who rated the sound sources as ‘no feeling’ was the highest, ranging from 62% to 89%. This may be because travelers consider the sounds to be functional and inevitable, and so do not have strong emotions towards them. Specifically, the mean preference values of sound sources other than public announcement are all below three (2.83 ± 0.092), indicating a tendency towards negative evaluation. The lowest value is for crowd conversation sound (2.78), luggage sound (2.75), and mechanical sound (2.74). Among them, crowd conversation sound and luggage sound have the highest perceived loudness, with a mean of 2.88 and 2.54. They are generated by passenger activities and are closely related to passenger distribution, which makes them the main background sounds in the terminal and may have a negative impact due to their universality. Mechanical sound is often associated with minimal information and contents for passengers and may be perceived as annoying and disruptive. So, it is often considered as an interference that may affect users’ experience and comfort. Therefore, even though the perceived loudness of mechanical sound is low, it still has the lowest preference rating. In addition, the perception loudness of crowd conversation sound and mechanical sound is significantly negatively correlated with their preference evaluation, with correlation coefficients of −0.224 and −0.150, respectively. This indicates that these sounds will result in a lower preference for higher perceived loudness. The perception loudness of aircraft sound is the weakest, with a mean of 1.76, revealing that it is less prevalent in the terminal and may not attract passengers’ attention.

3.2.2. Perceived Effective Quality

The perceived affective quality of the acoustic environment can be represented on a two-dimensional plane, with the X-axis indicating the pleasantness provided by the sound environment and the Y-axis representing the eventfulness related to human activity and other events. The value (Table 3) was calculated based on the ISO TS 12913:3 standard [31]. The results (as shown in Figure 8) showed that the sound environment is in the fourth quadrant of the bi-dimensional model of pleasantness–eventfulness, indicating that the check-in hall lacks eventfulness and has relatively lower pleasantness for passengers.
The mean and standard deviations of the evaluation in each dimension were calculated for different age groups (as shown in Table 4). The results showed that the mean pleasantness dimension ranged from −0.33 to 1.71, while the mean score of the eventfulness dimension ranged from −0.83 to −0.09. The points representing each age group were plotted on the two-dimensional plane (as shown in Figure 8). The dimension of eventfulness is related to the temporal variation in various sounds or sound environments [35]. The evaluation of different age groups is relatively similar in the dimension of eventfulness, with no significant trend observed, indicating that passengers’ perception of sound diversity and variability are similar across different age groups. However, there were differences in the evaluation of pleasantness. Younger passengers tend to perceive the sound environment as annoying or unpleasant. This may be because younger passengers are more sensitive to loud, high-frequency, or sudden sounds and have lower tolerance. As age increases, the evaluation tends to be more positive and pleasant.
Pearson correlation analysis was conducted to explore the perceived loudness of sound sources and affective quality (as shown in Table 5). The results showed that in the dimension of pleasantness, there is a significant negative correlation between crowd conversation sound and ‘pleasant’ (R = −0.258, p < 0.01), while luggage sound is positively correlated with ‘annoying’, indicating that these two types of sound sources are the main factors that reduced passengers’ pleasant feelings. In the dimension of eventfulness, crowd conversation sound, public announcement, and mechanical sound are all significantly negatively correlated with ‘uneventful’ (R∈[−0.190, −0.139], p < 0.05), but they do not show a significant correlation with the dimension of eventfulness. In the dimension of calmness, crowd conversation sound and public announcement are significantly positively correlated with ‘chaotic’ (R∈[0.238, 0.305], p < 0.01) and significantly negatively correlated with ‘calm’ (R∈[−0.295, −0.290], p < 0.01), indicating that these two types of sound sources are associated with feelings of chaos for passengers. Aircraft sound is significantly positively correlated with ‘calm’ (R = 0.142, p < 0.05), which may be since aircraft sound is low-frequency with low perceived loudness, and when passengers can perceive it, the overall sound environment is usually quiet, giving people a sense of calmness. In the dimension of virality, public announcement is significantly negatively correlated with ‘vibrant’ (p = −0.162, p < 0.05), and luggage sound is significantly positively correlated with ‘monotonous’ (R = 0.182, p < 0.01).

3.2.3. Overall Evaluation of the Sound Environment

Figure 9 shows the overall evaluation of the respondents. Although the mean scores for the three dimensions were above, indicating a tendency towards positive evaluation, the distribution of respondents shows that 67.8% of passengers rated the sound environment as very bad, bad, or neither good nor bad in terms of sound environment quality; 61.5% of passengers chose very loud or moderately loud in the evaluation of noise level. In the evaluation of coordination, 70.2% of passengers chose slightly coordinated or moderately coordinated. This indicates that nearly two-thirds of passengers are still dissatisfied with the quality, noise level, and coordination of the terminal’s sound environment.
The relationship between the perceived loudness of sound sources and the overall evaluation was analyzed using Pearson correlation analysis (Table 6). The results show that crowd conversation sound, luggage sound, and public announcement are significantly negatively correlated with quality evaluation (R∈[−0.426, −0.178], p < 0.01), indicating that the higher the SPL of these sounds, the worse quality evaluation by the passengers. The correlation analysis results of the perceived loudness of each sound and overall sound environment show that the crowd conversation sound and public announcement are significantly positively correlated with loudness (R∈[0.168, 0.223], p < 0.01). This is related to the universality and dominance of them. Public announcements also contribute to the loudness of the environment due to the mixing of multiple systems and reduced clarity. In terms of the coordination between sound sources and the overall sound environment, crowd conversation and luggage sound are significantly negatively correlated with coordination (R∈[−0.166, −0.138], p < 0.05). Previous studies showed that the presence of uncomfortable and prominent high-frequency or low-frequency components would decrease the harmony of the environment [4]. In the terminal building, the sound of dragging luggage is unexpected and high-frequency, which significantly reduces the perceived harmony by passengers.
The analysis of the impact of a specific sound source on the overall evaluation of the acoustic environment revealed that the presence or absence of crowd conversation and mechanical sound do not show significant effects. The absence of aircraft, footsteps, and luggage sound has significant effects on improving the quality and coordination (p < 0.05) and reducing the perceived loudness (p < 0.05) of the acoustic environment. Among these sounds, the differences between aircraft and footstep sounds are relatively small, with mean differences of 0.054 and 0.040, respectively. Luggage sound has the largest impact on perceived loudness, with an average mean difference of 0.610 when it was absent, followed by footstep sound with a mean difference of 0.314. Footstep sound also shows significant differences in coordination evaluation, with an average mean increase of 0.273 when it is absent. In the absence of aircraft sound, coordination evaluation increases by 0.159.
In conclusion, aircraft and footstep sounds do not have a significant impact on the overall evaluation due to their lower perceived loudness. However, the absence of these two sounds significantly improves the evaluation of passengers. Crowd conversation sound has a significant impact on overall evaluation while decreasing the harmony and quality evaluation of the acoustic environment and resulting in increased loudness. But the absence of crowd conversation sound does not have a significant impact on overall evaluation, which may be because crowd conversation is the main background noise in transportation buildings such as terminals, and passengers are accustomed to it. In certain situations, some respondents have expressed discomfort with sudden human voices, so it is necessary to reduce sudden crowd sound and keep it at a lower level. The sound from dragging luggage significantly decreases the harmony and quality evaluation of the environment, but it significantly reduces the perceived loudness when absent, so it is an important sound source to be focused on in noise control. Public announcement, as a major sound source in the environment, usually has a positive correlation with loudness and a negative correlation with quality evaluation.

3.2.4. The Influence of Age on Perception of Sound Environment

Through one-way ANOVA analysis, the relationship between age and perceived loudness, preference, and overall evaluation of the sound environment was calculated (as shown in Table 7). The results showed that age does not directly impact the overall evaluation. But differences were observed in the perceived loudness of specific sounds and perceived affective quality. Older passengers show higher perceived loudness of aircraft sound. This may be because they are more sensitive to low-frequency sounds due to age-related changes in hearing. In addition, there was a significant positive correlation (p < 0.01) between age and perceived “vibrant” provided by the sound environment, indicating that younger individuals perceived a lower level of vitality in the sound environment.

4. Discussion

4.1. Comparison with the Physical Measurements of Previous Studies

The results of this study found that the SPL in the terminal during normal operation time ranges from 60.7 dB (A) to 79.1 dB (A). The minimum and maximum values were both higher than the 55 dB (A)–70 dB (A) obtained in the studies by Geng et al. [8] and Wijingaarden et al. [9], which may be related to differences in measurement duration and airports. Because SPL is related to many factors, such as flight and crowd density, the selection of a measurement period will have a great impact on the results. In terms of spectrum characteristics, significant differences were found in different areas in this study. In Wijingaarden et al.’s [9] study, the spectra of each area were similar. This may be because Wijingaarden et al. [9] defined the functional zone with a similar SPL. After taking the average value, the proportion of energy of each frequency band in different zones is close, so the spectrum is similar. In this study, the areas are classified only by function, and the spectrum diagram shows great differences.

4.2. Subjective Evaluation and Implications for Improving and Designing the Acoustic Environment of Airport Terminals

By understanding people’s reactions and evaluations of sound environments, it is possible to provide a basis for creating healthy sound environments. In this study, it was found that passengers do not have a significant preference for sound sources in terminal buildings (Figure 6), indicating high adaptability and tolerance. This is consistent with Li et al.’s [29] research, where passengers rated acoustic comfort higher than loudness. This reflects people’s positioning and expectations of acoustics in non-acoustic spaces such as transportation buildings, where functional needs are more important than comfort needs. In terms of demographic factors, age does not directly affect overall evaluations. However, from the view of the sound source and emotional perception, older passengers were more sensitive to low-frequency aircraft engine noise, while younger passengers tended to perceive the terminal building’s sound environment as lacking in vitality.
The practical implications of this study are that when designing and planning the acoustic environment in airport terminals, it is necessary to comprehensively consider the impact of different sound sources. In cases where cost is limited, in order to achieve a high evaluation, it is important to control the intensity of the most adverse sound sources, such as crowd conversation and luggage sound. Public announcement should be controlled appropriately to avoid being too low, which may affect users’ ability to hear and understand information, or too loud, which may result in a noisy acoustic environment and impact users’ comfort. When dealing with users of different ages, targeted design should be implemented in order to improve the coordination and comfort of the acoustic environment. For older individuals, special attention should be given to the SPL of public announcements to provide them with more information and guidance to help them better adapt to the airport environment. For example, measures can be taken before travel to provide them with information about airport procedures and regulations in advance, reducing unnecessary anxiety and confusion.

5. Conclusions

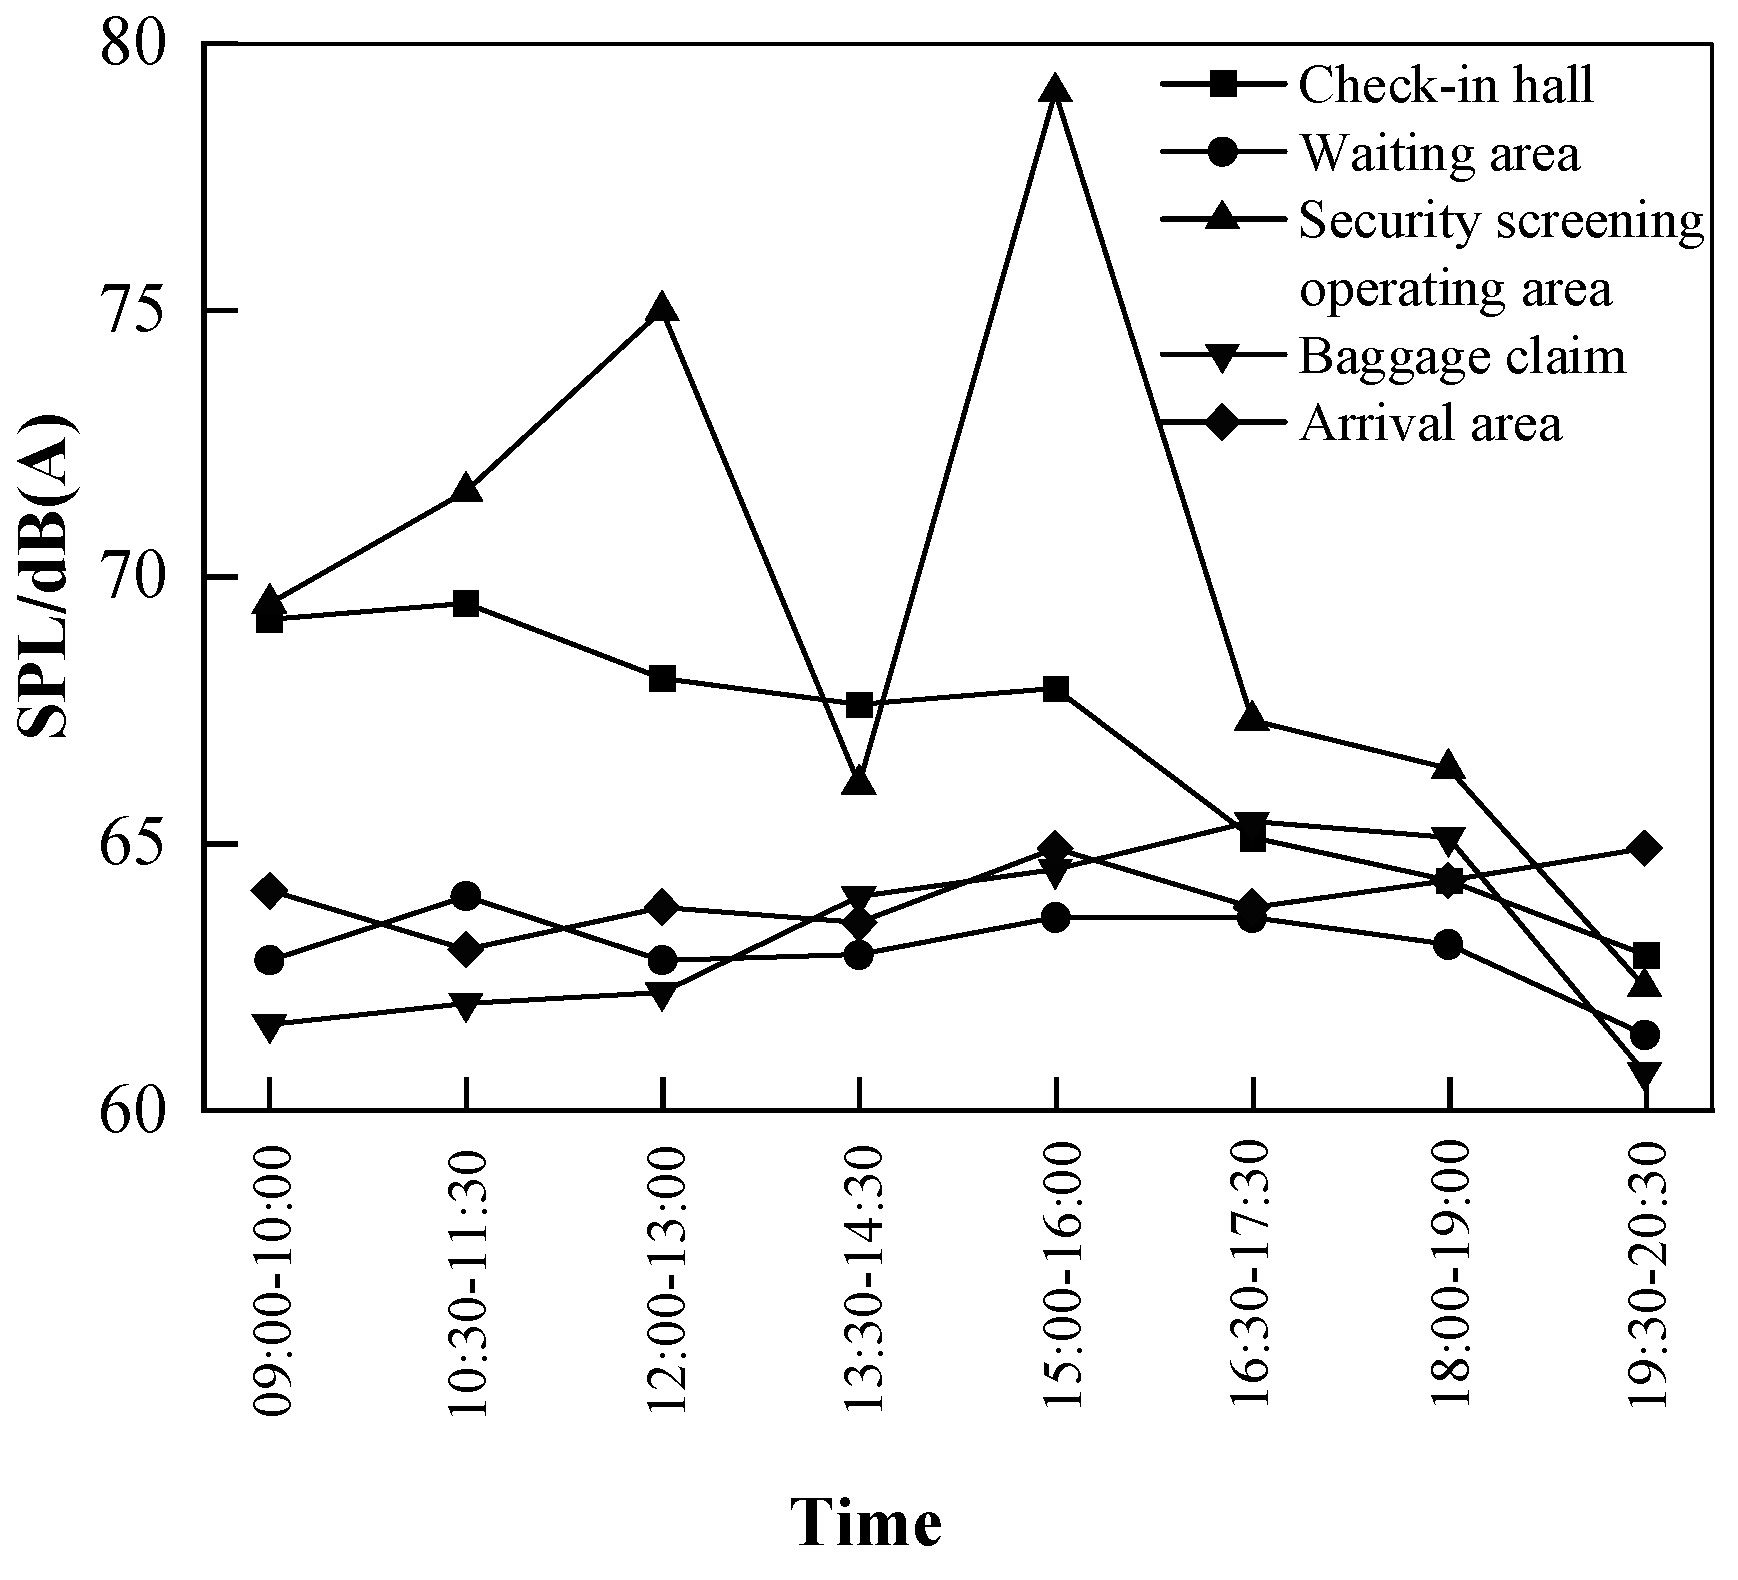
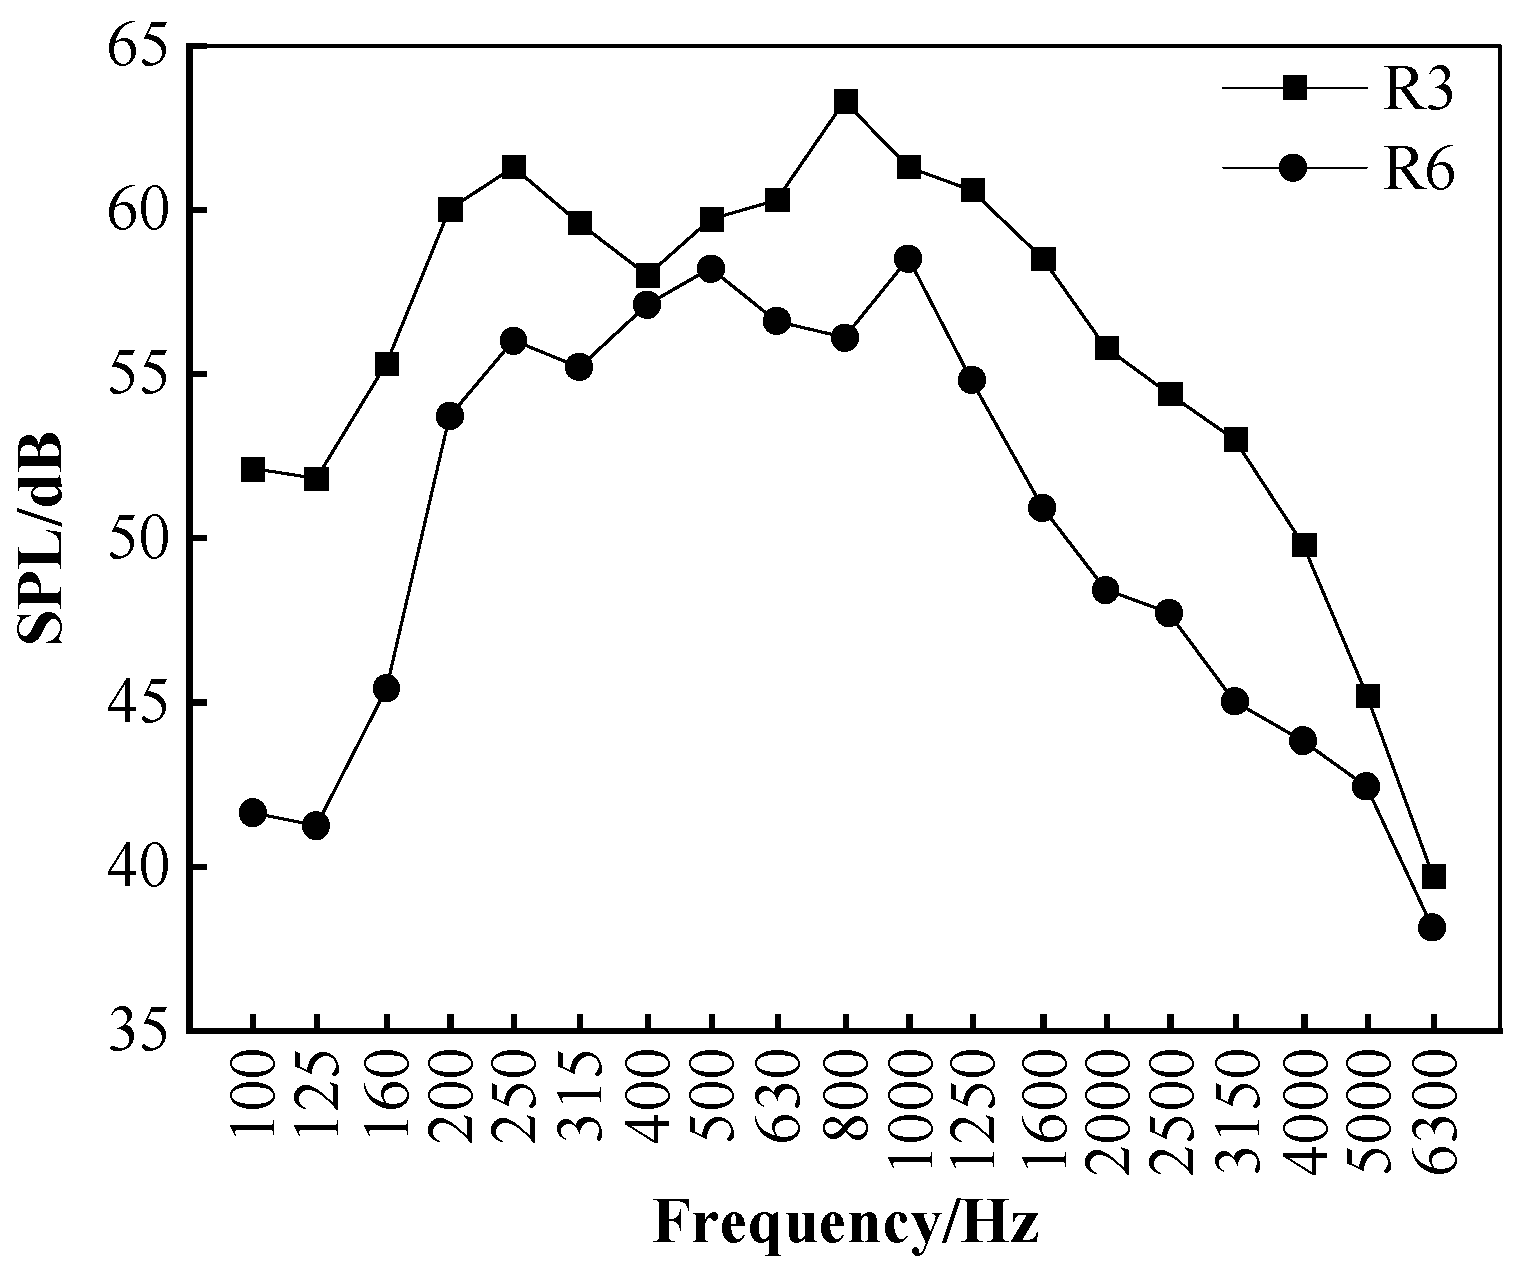
Through an on-site measurement and questionnaire survey, the acoustic environment in the T2 terminal of Tianjin Binhai International Airport was investigated. For the acoustic environment within the terminals over a day, the variation in SPL is highly significant. SPL exhibits periodic changes, and the overall SPL is between 60.7 dB (A) and 79.1 dB (A). There are significant differences in SPL, spectrum, and psychoacoustic parameters in different areas of the terminal, which provide insights into whether the current acoustic focus in different areas is on noise control or acoustic comfort. From the perspective of noise control, the spaces that needed to be focused on are the security screening operating area and check-in hall, which have the highest SPL and the largest fluctuation throughout the day.
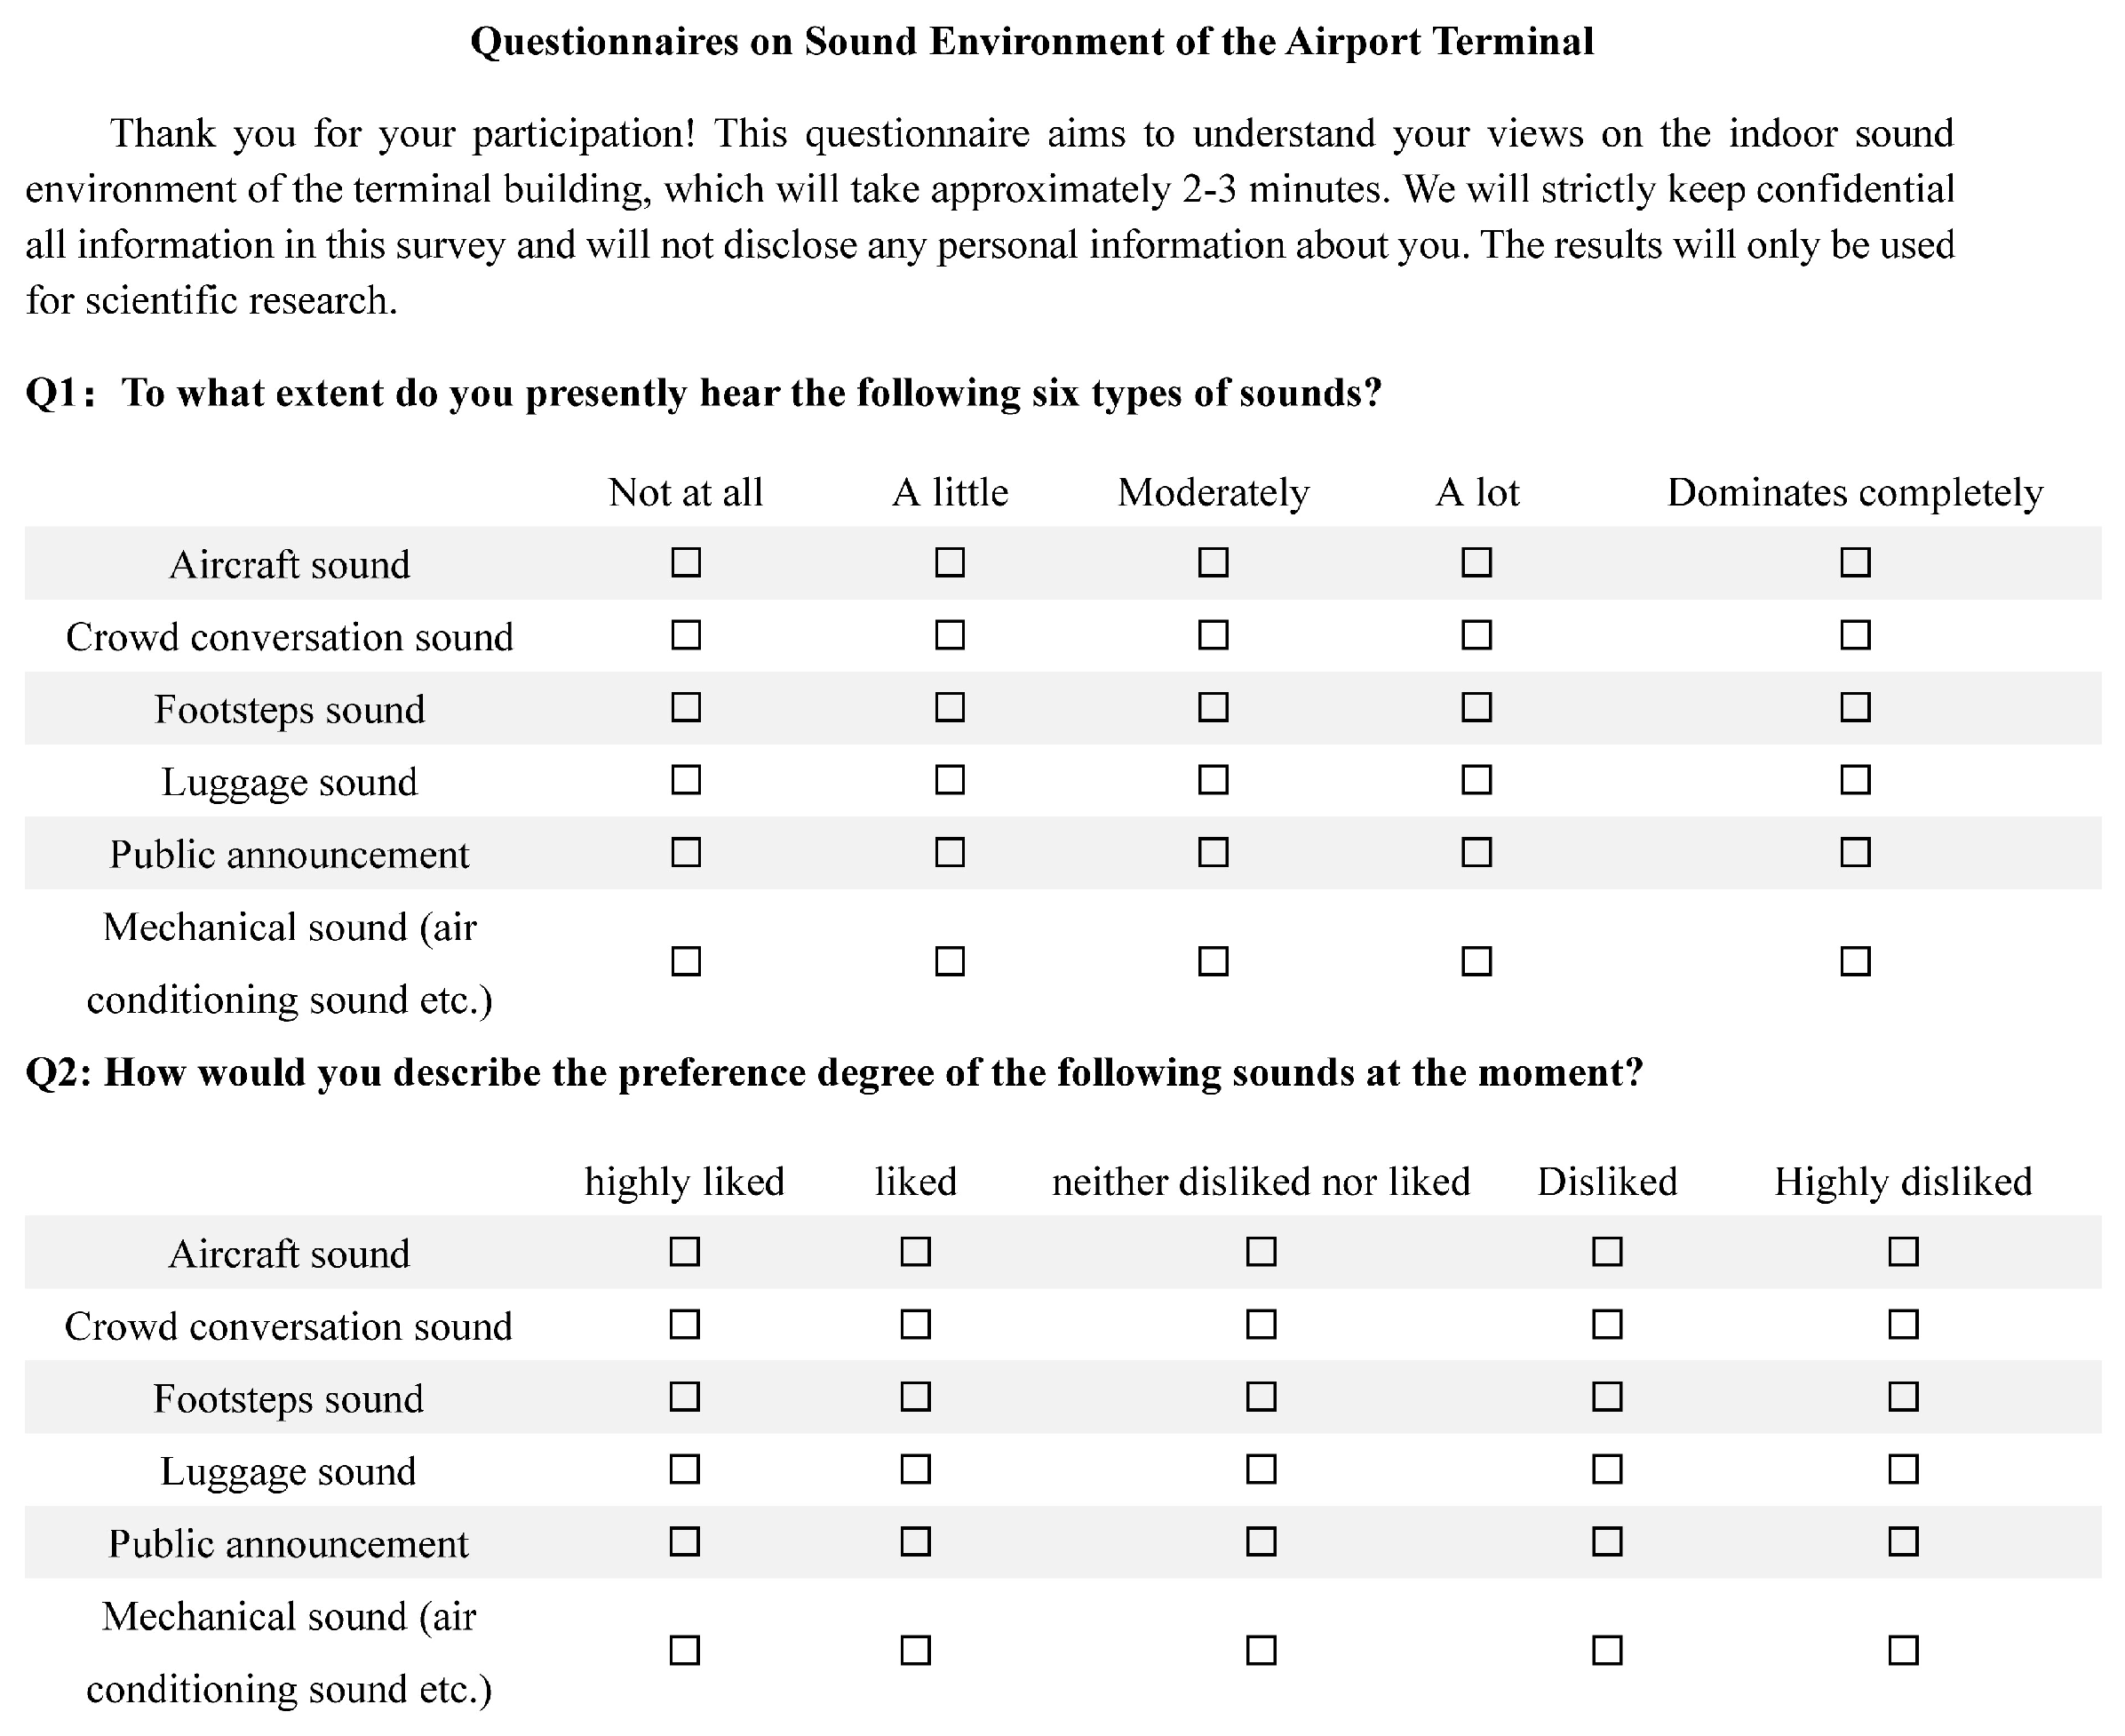
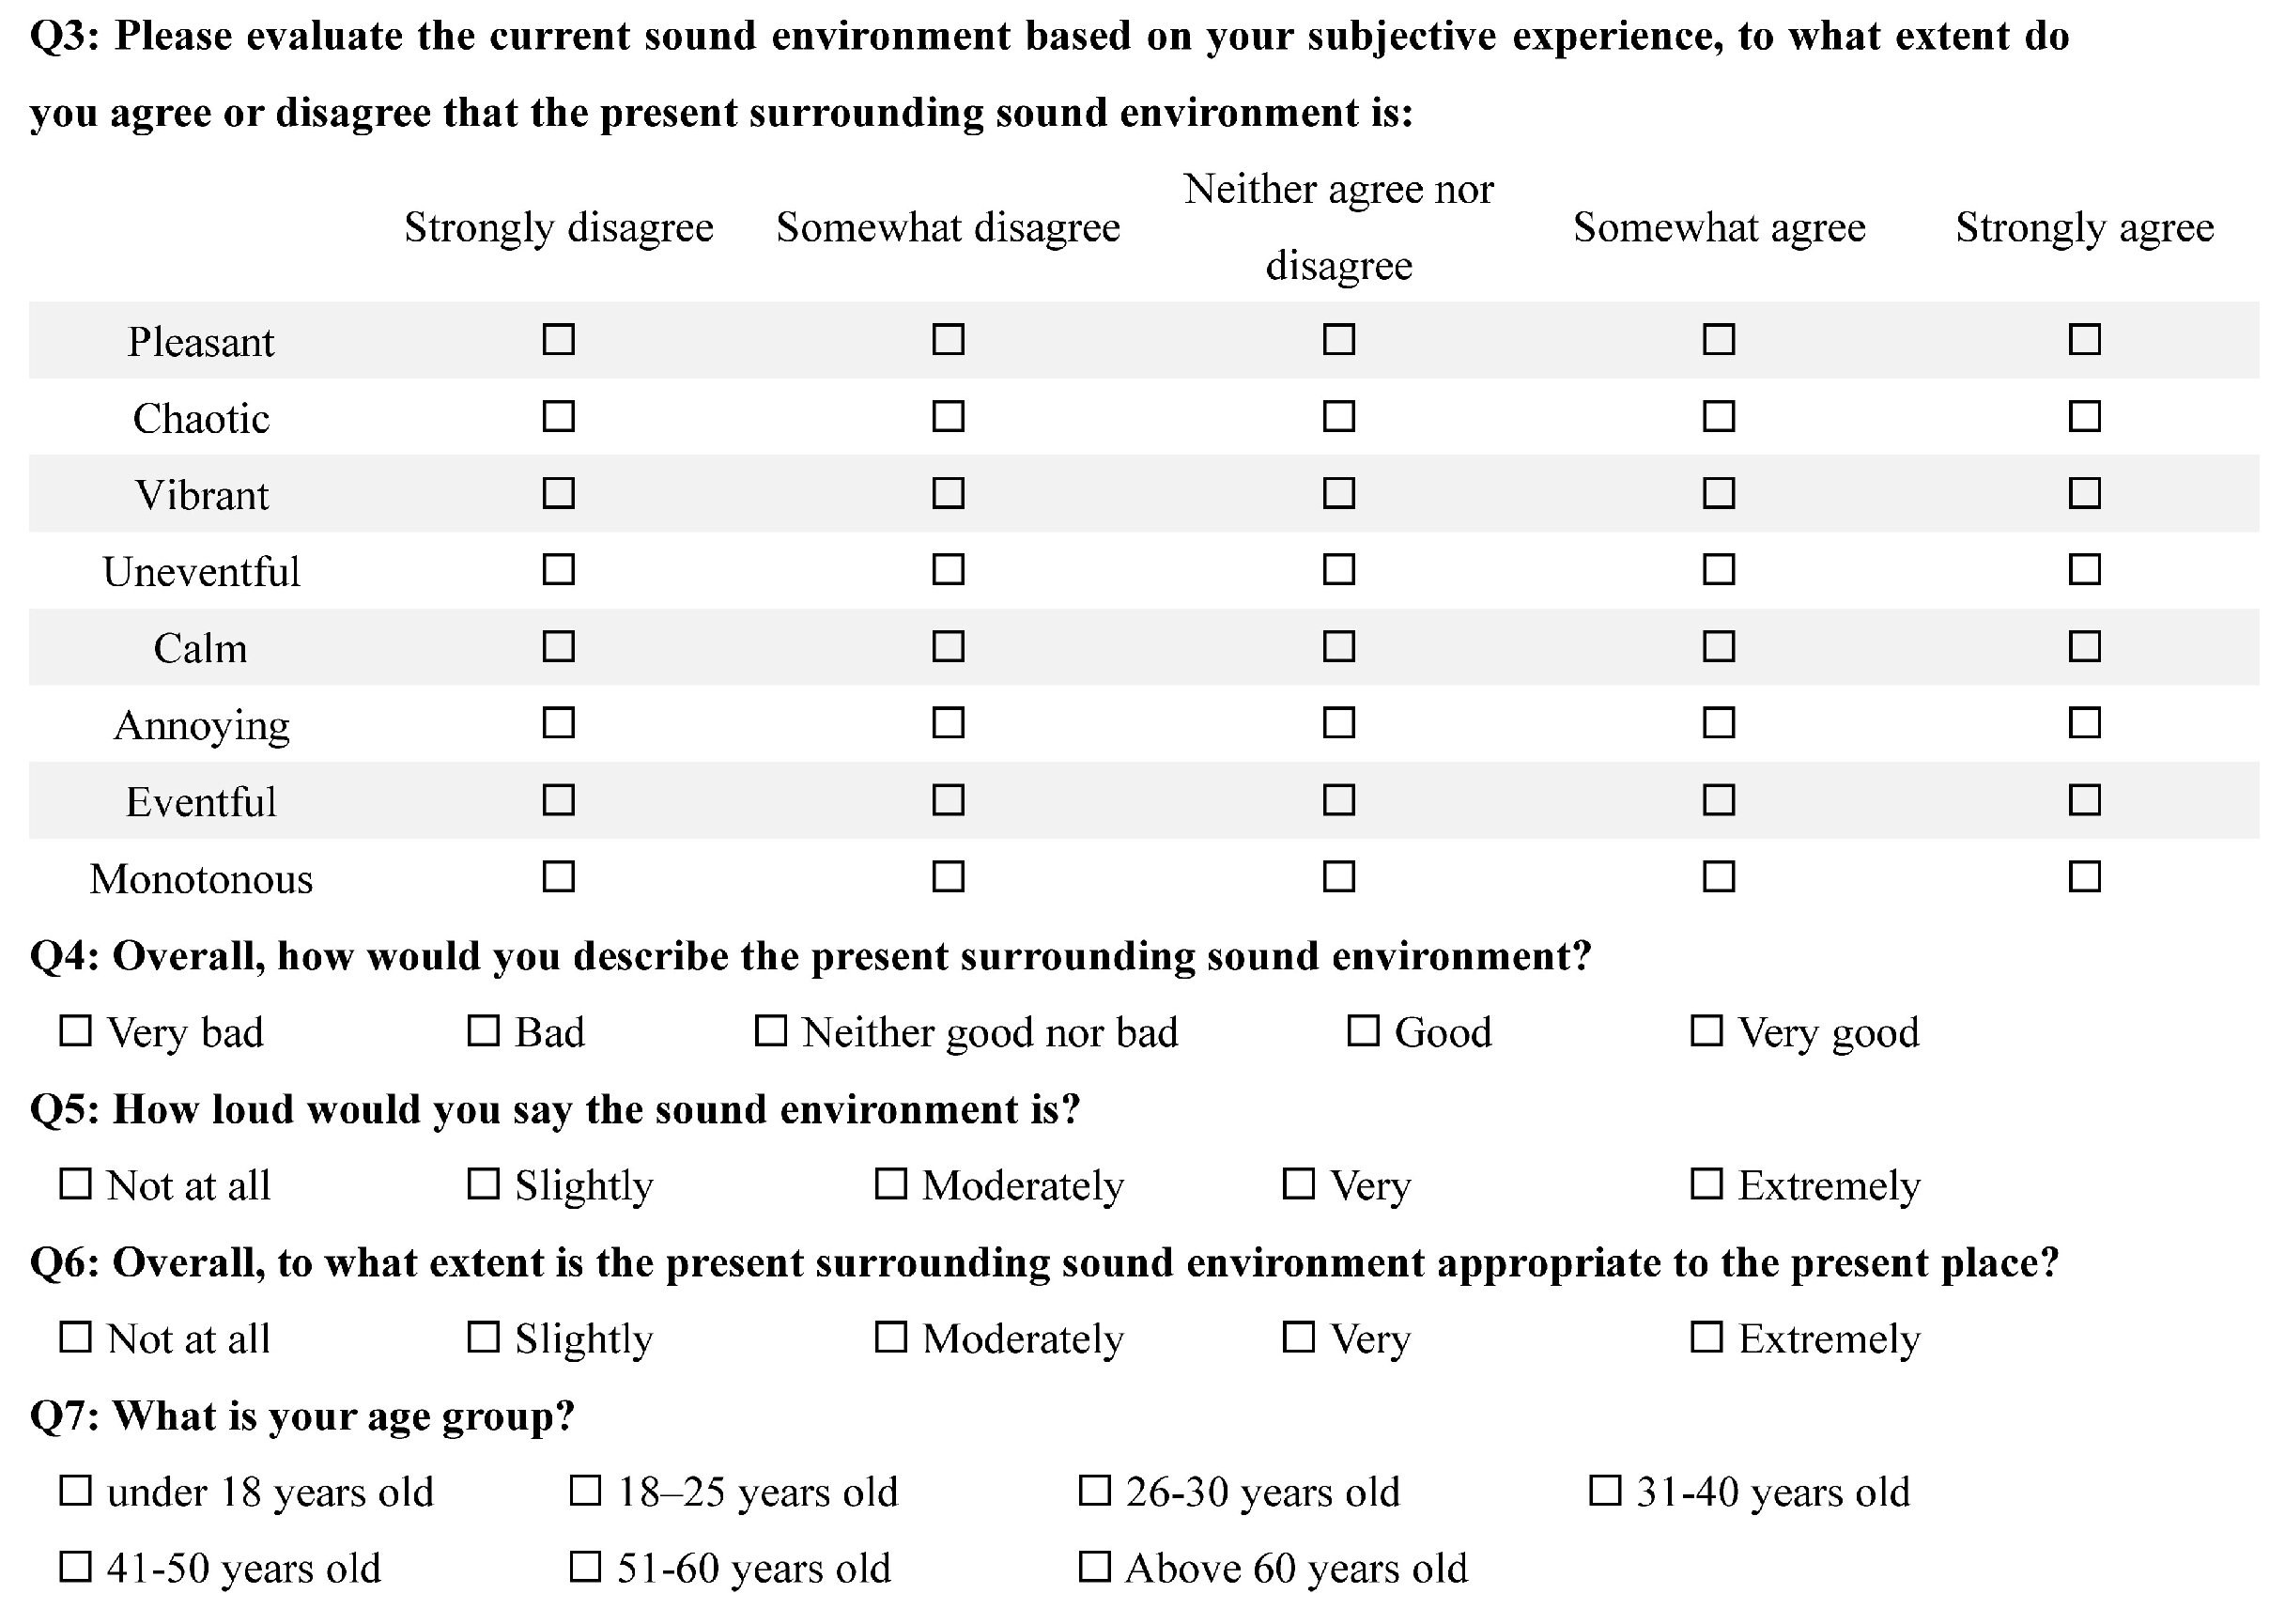
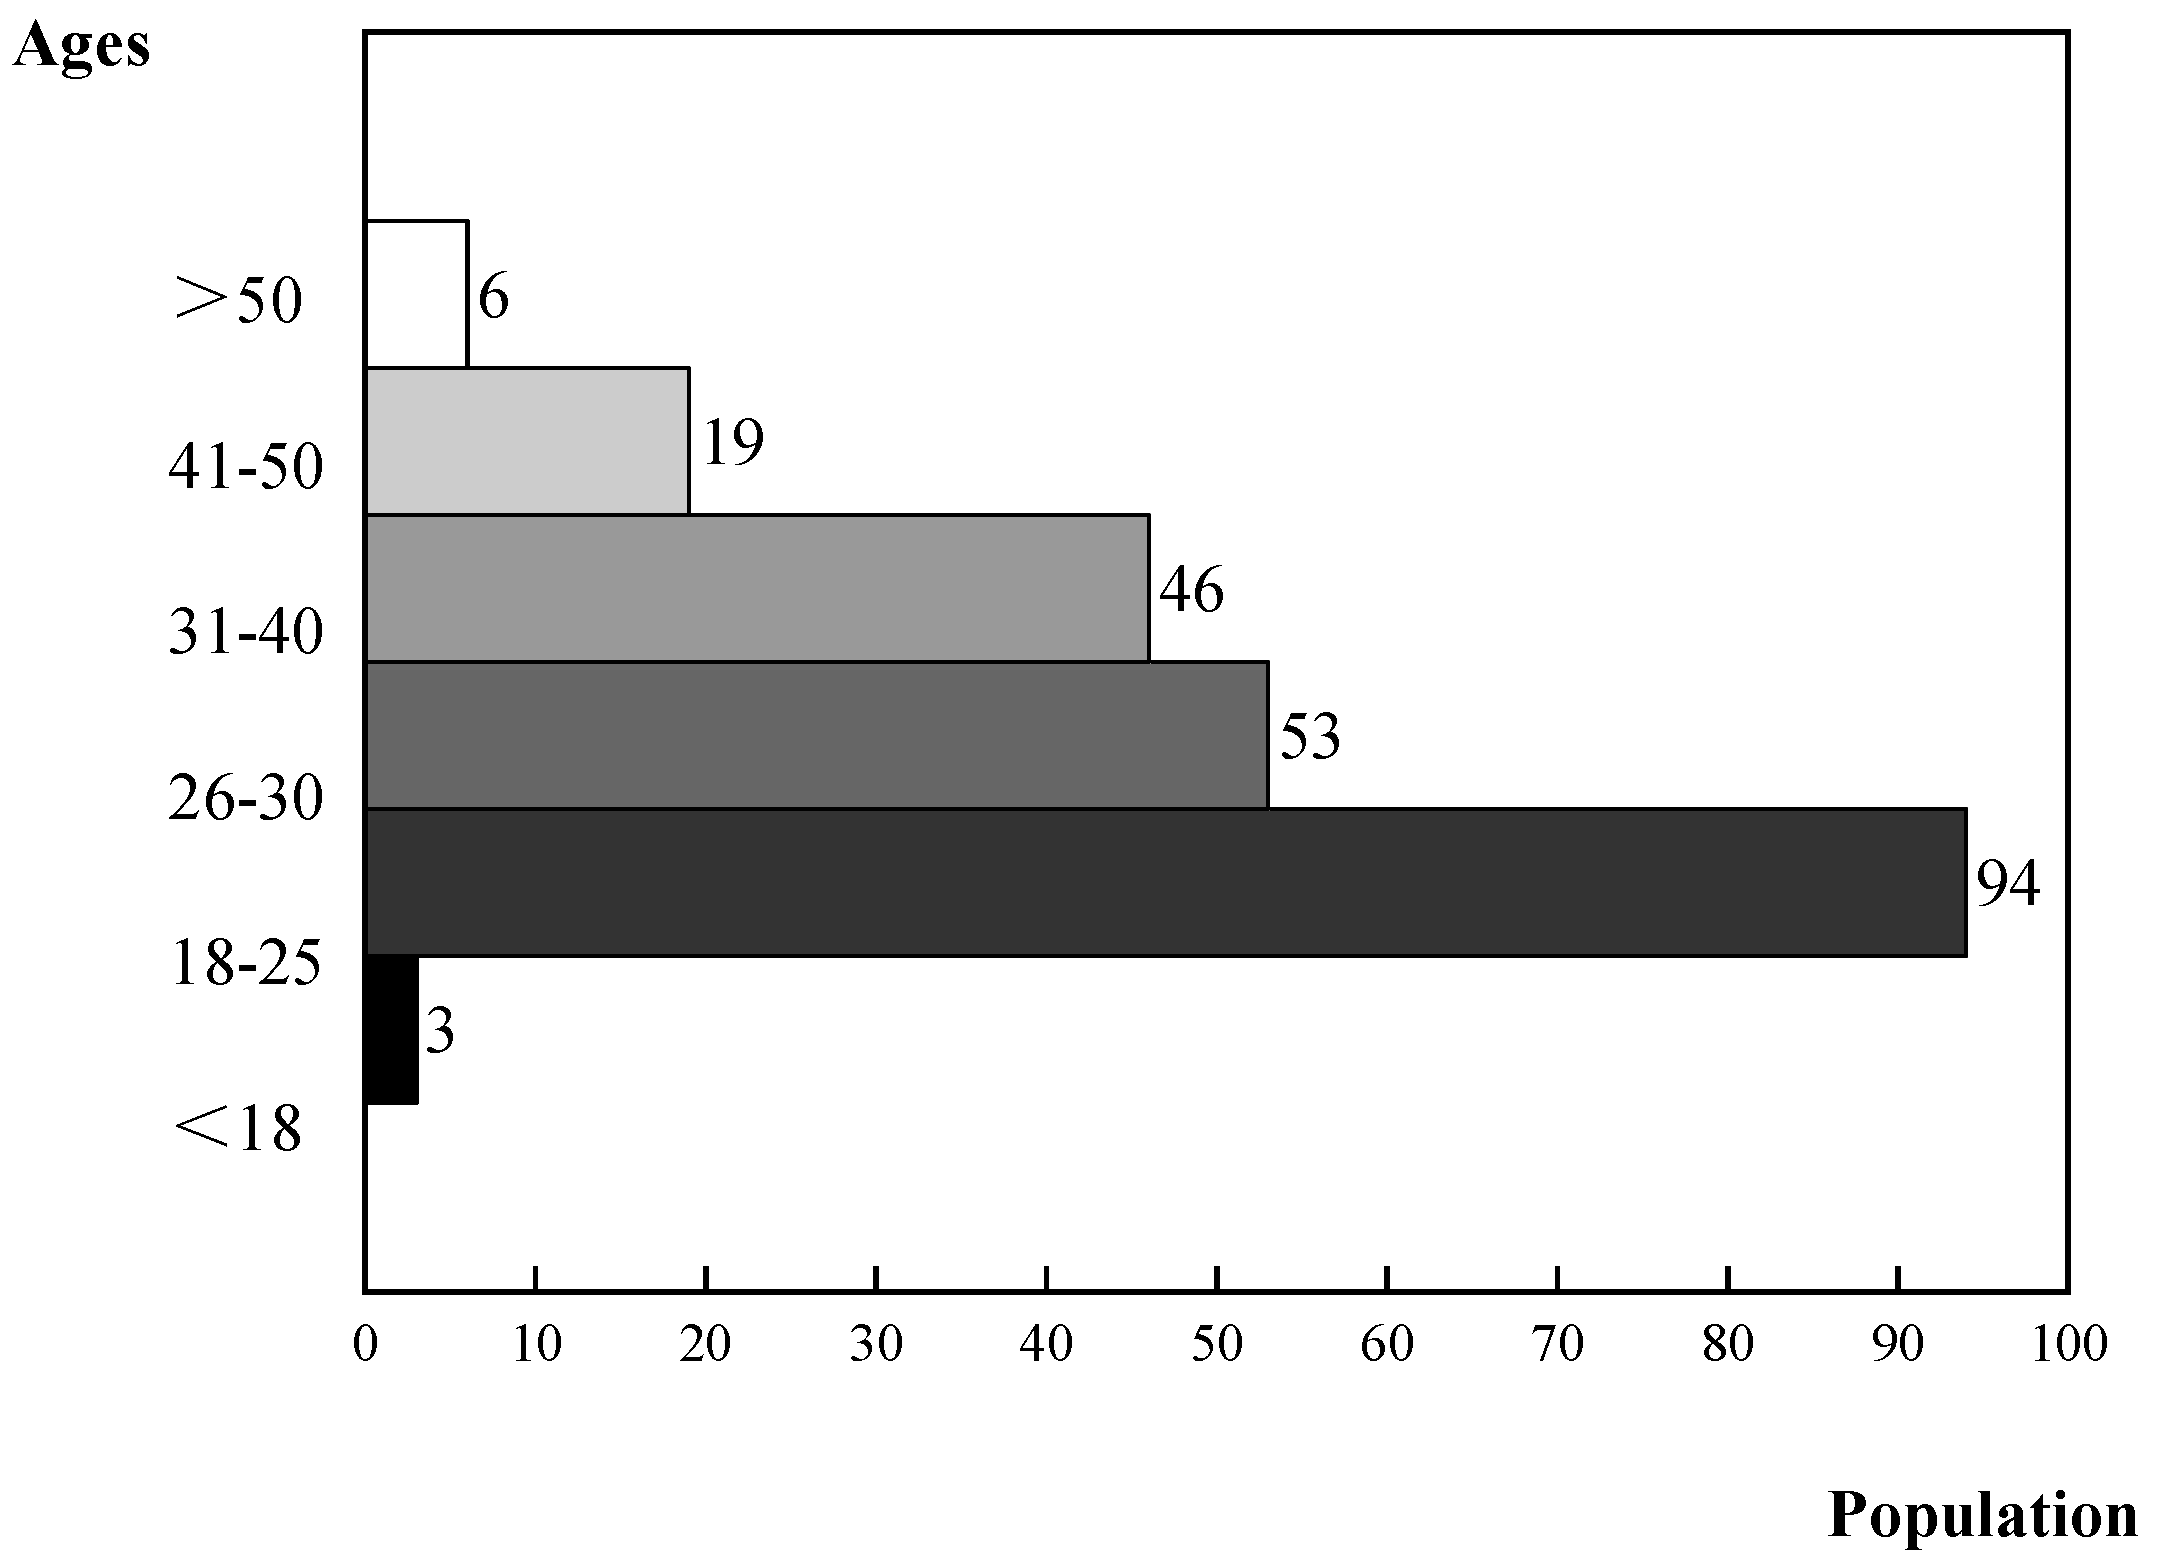
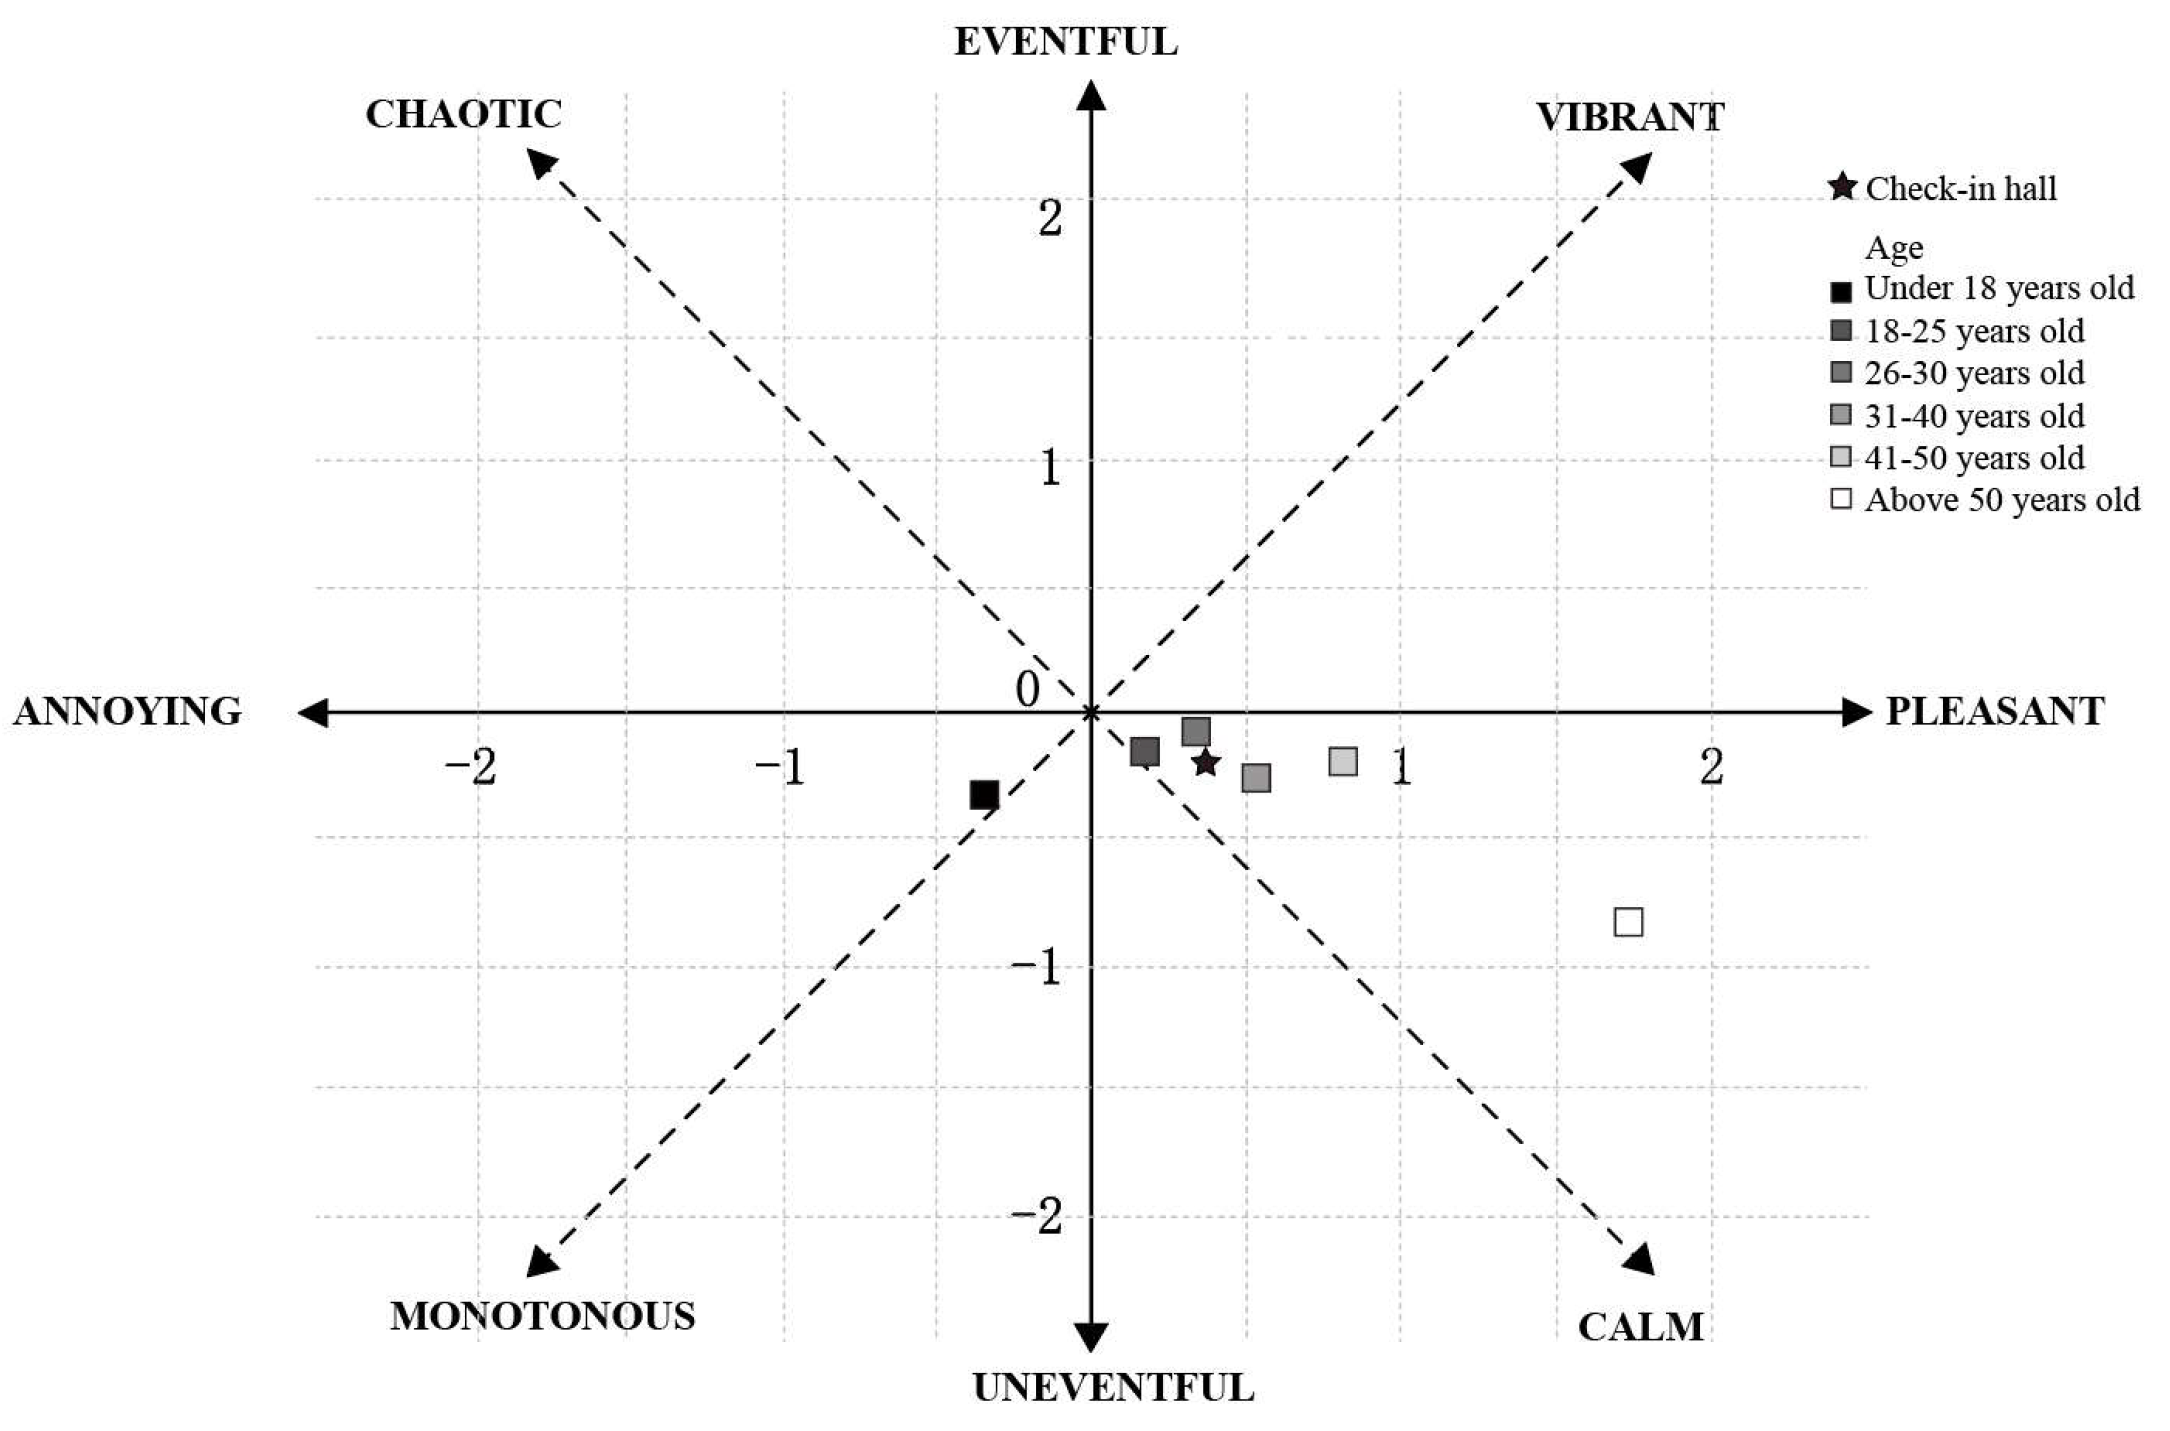
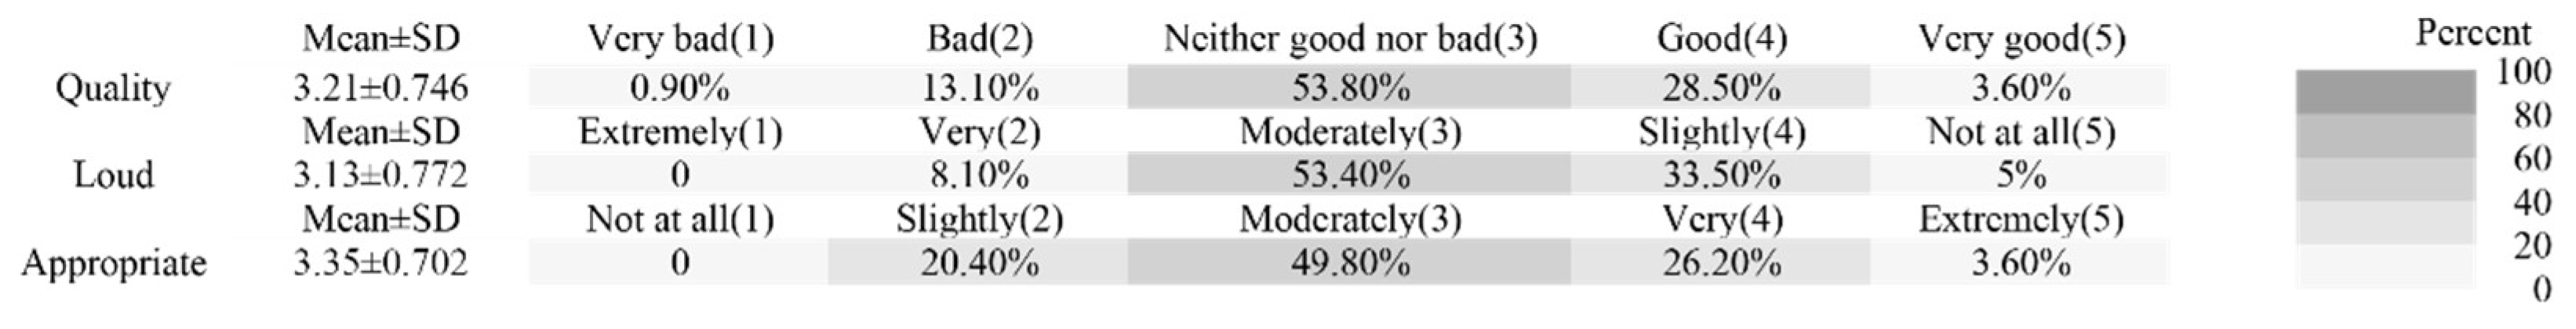
The results of the subjective survey offer methods to enhance acoustic comfort by creating a distinctive soundscape and control sound sources. Results show that the sound environment of the terminal is in the fourth quadrant of the perceived affective quality model, but the low values indicate a lack of eventfulness and pleasantness. Nearly two-thirds of passengers are dissatisfied with the quality, loudness, and coordination of the sound environment. In terms of specific sounds, passengers have the highest perceived loudness and preference for public announcement, but higher levels of it can result in negative evaluations. The evaluation of crowd conversation sound reflects passengers’ adaptation to higher noise levels in the terminal. Aircraft and footstep sounds do not significantly affect the overall evaluation of the sound environment due to their lower perceived loudness, but the absence of these two sounds significantly improves the evaluation. Analysis of age factors shows that younger passengers perceive less vitality provided by the sound environment.

Author Contributions

Conceptualization, H.M. and C.W.; data curation, H.M. and C.W.; formal analysis, M.L.; funding acquisition, Z.G., F.C., W.Z. and J.W.; investigation, M.L.; methodology, C.W.; project administration, H.M.; resources, Z.G., F.C., W.Z. and J.W.; software, M.L.; supervision, H.M.; validation, C.W.; visualization, M.L.; writing—original draft, M.L.; writing—review and editing, H.M., C.W. and M.L. All authors have read and agreed to the published version of the manuscript.

Funding

This research was funded by National Natural Science Foundation of China, grant number 51978454, and Tianjin Binhai International Airport Co., Ltd., grant number 2023XJD-0010.

Data Availability Statement

The data presented in this study are available on request from the corresponding author. The data are not publicly available due to the data also forms part of an ongoing study.

Conflicts of Interest

The authors declare no conflict of interest.

References

  1. Qiu, X.; Tan, B.; Pa, L. Exploring the prospective trends of large-scale airport terminals. World Archit. 2020, 6, 36–43+144–145. (In Chinese) [Google Scholar] [CrossRef]
  2. Civil Aviation Administration of China. 2021 Civil Aviation Airport Production Statistics Bulletin. [EB/OL]. Available online: https://www.mot.gov.cn/tongjishuju/minhang/202204/t20220408_3649981.html (accessed on 22 March 2022). (In Chinese)
  3. Architectural Design Information Set Editorial Committee. Architectural Design Information Set. In Division 7 Transportation Logistics Industry Municipal Administration, 3rd ed.; China Architecture & Building Press: Beijing, China, 2017. (In Chinese) [Google Scholar]
  4. Chen, J.; Ma, H. An impact study of acoustic environment on users in large interior spaces. Build. Acoust. 2019, 26, 139–153. [Google Scholar] [CrossRef]
  5. Brink, M.; Wirth, K.E.; Schierz, C.; Thomann, G.; Bauer, G. Annoyance responses to stable and changing aircraft noise exposure. J. Acoust. Soc. Am. 2008, 124, 2930–2941. [Google Scholar] [CrossRef] [PubMed]
  6. Bardisi, M.E. Noise solution for Alexandria Airports. In Proceedings of the Twelfth International Congress on Sound and Vibration, Lisbon, Portugal, 11–14 July 2005. [Google Scholar]
  7. Sayed, A.A. A Case Study of Cairo Airport Noise for Preserving Worker’s Hearing in Egypt. Acta Acust. United Acust. 2014, 100, 118–125. [Google Scholar] [CrossRef]
  8. Geng, Y.; Yu, J.; Lin, B.; Wang, Z.; Huang, Y. Impact of individual IEQ factors on passengers’ overall satisfaction in Chinese airport terminals. Build. Environ. 2017, 112, 241–249. [Google Scholar] [CrossRef]
  9. van Wijingaarden, S.J. Atsma, ambient noise inside airport terminal. In Proceedings of the INTER-NOISE and NOISE-CON Congress and Conference Proceedings, Seoul, Republic of Korea, 23–26 August 2020. [Google Scholar]
  10. Wang, C.; Ma, H.; Wu, Y.; Kang, J. Characteristics and prediction of sound level in extra-large spaces. Appl. Acoust. 2018, 134, 1–7. [Google Scholar] [CrossRef]
  11. Du, X. Investigation of indoor environment comfort in large high-speed railway stations in Northern China. Indoor Built Environ. 2020, 29, 54–66. [Google Scholar] [CrossRef]
  12. Wu, Y.; Kang, J.; Zheng, W.; Wu, Y. Acoustic comfort in large railway stations. Appl. Acoust. 2020, 160, 107137. [Google Scholar] [CrossRef]
  13. Chen, X.; Kang, J. Acoustic comfort in large dining spaces. Appl. Acoust. 2017, 115, 166–172. [Google Scholar] [CrossRef]
  14. Mistar, N.A.; Sulaiman, R.; Din, N.B.C. A Conceptual Framework for Acoustic Comfort Classification in Eatery Places: Critical Reviews of the Determining Factors. Acoust. Aust. 2020, 48, 337–348. [Google Scholar] [CrossRef]
  15. Alnuman, N.; Altaweel, M.Z. Investigation of the Acoustical Environment in A Shopping Mall and Its Correlation to the Acoustic Comfort of the Workers. Appl. Sci. 2020, 10, 1170. [Google Scholar] [CrossRef]
  16. Chen, B.; Kang, J. Acoustic Comfort in Shopping Mall Atrium Spaces—A Case Study in Sheffield Meadowhall. Arch. Sci. Rev. 2004, 47, 107–114. [Google Scholar] [CrossRef]
  17. Rychtarikova, M.; Urban, D.; Kassakova, M.; Maywald, C.; Glorieux, C. Perception of acoustic comfort in large halls covered by transparent structural skins. In Proceedings of the Meetings on Acoustics, Boston, MA, USA, 25–29 June 2017. [Google Scholar] [CrossRef]
  18. De Neufville, R. (Ed.) Airport Systems: Planning, Design, and Management, 2nd ed.; McGraw-Hill: New York, NY, USA, 2013. [Google Scholar]
  19. Strada, M.; Morandi, S.; Carbonari, A.; Lisiero, S. Acoustic impact evaluation and preliminary study for the Treviso airport acoustic classification. In Proceedings of the 5th European Conference on Noise Control, Naples, Italy, 19–21 May 2003; Volume 89. [Google Scholar]
  20. Arafa, M.H.; Osman, T.; Abdel-Latif, I.A. Noise assessment and mitigation schemes for Hurghada airport. Appl. Acoust. 2007, 68, 1373–1385. [Google Scholar] [CrossRef]
  21. Hammad, R.; Abdelazeez, M.; Sharqawi, B. Measurement of the noise level at Queen Alia Airport and its effect on employed persons. Appl. Acoust. 1989, 28, 221–228. [Google Scholar] [CrossRef]
  22. Wu, Y.; Xia, C.; Liang, J.; Yang, L.; Xing, R. Dynamic analysis on hearing loss among security staff in an airport of Beijing during five consecutive years. Occup. Health 2017, 33, 1559–1561. (In Chinese) [Google Scholar] [CrossRef]
  23. Brown, A.L.; Van Kamp, I. WHO Environmental Noise Guidelines for the European Region: A Systematic Review of Transport Noise Interventions and Their Impacts on Health. Int. J. Environ. Res. Public Health 2017, 14, 873. [Google Scholar] [CrossRef]
  24. Śliwińska-Kowalska, M.; Zaborowski, K. WHO Environmental Noise Guidelines for the European Region: A Systematic Review on Environmental Noise and Permanent Hearing Loss and Tinnitus. Int. J. Environ. Res. Public Health 2017, 14, 1139. [Google Scholar] [CrossRef]
  25. Clark, C.; Paunovic, K. WHO Environmental Noise Guidelines for the European Region: A Systematic Review on Environmental Noise and Quality of Life, Wellbeing and Mental Health. Int. J. Environ. Res. Public Health 2018, 15, 2400. [Google Scholar] [CrossRef]
  26. Wang, C.; Kong, X.; Yao, S.; Kang, J.; Yuan, J. Crowd noise and vocal power level in large college canteens in China. Appl. Acoust. 2021, 182, 108242. [Google Scholar] [CrossRef]
  27. Pick, H.L.; Siegel, G.M.; Fox, P.W.; Garber, S.R.; Kearney, J.K. Inhibiting the Lombard effect. J. Acoust. Soc. Am. 1989, 85, 894–900. [Google Scholar] [CrossRef]
  28. Brumm, H.; Zollinger, S.A. The evolution of the Lombard effect: 100 years of psychoacoustic research. Behaviour 2011, 148, 1173–1198. [Google Scholar] [CrossRef]
  29. Li, X.; Zhao, Y. Evaluation of sound environment in departure lounges of a large hub airport. J. Affect. Disord. 2023, 232, 110046. [Google Scholar] [CrossRef]
  30. ISO 1996-2: 2017; Acoustic—Description, Measurement and Assessment of Environmental Noise—Part 2: Determination of Sound Pressure Levels. ISO: Geneva, Switzerland, 2017.
  31. ISO/TS 12913-3-2019; Acoustics—Soundscape—Part 3: Data analysis. ISO: Geneva, Switzerland, 2018.
  32. ISO 532-1:2017; Acoustics-Methods for Calculating Loudness. ISO: Geneva, Switzerland, 2017.
  33. Stojanow, A.; Liebetrau, J. A review on conventional psychoacoustic evaluation tools, methods and algorithms. In Proceedings of the 2016 Eighth International Conference on Quality of Multimedia Experience (QoMEX), Lisbon, Portugal, 6–8 June 2016; pp. 1–6. [Google Scholar] [CrossRef]
  34. Sottek, R.; Genuit, K. Models of signal processing in human hearing. AEU—Int. J. Electron. Commun. 2005, 59, 157–165. [Google Scholar] [CrossRef]
  35. Axelsson, Ö.; Nilsson, M.E.; Berglund, B. A principal components model of soundscape perceptiona. J. Acoust. Soc. Am. 2010, 128, 2836–2846. [Google Scholar] [CrossRef]
Figure 1. Indoor environment and measuring points in T2 terminal building. (a) Indoor environment of the airport; (b) plan of first floor; (c) plan of second floor.
Buildings 13 02585 g001
Figure 2. Questionnaires on sound environment of airport in the airport terminal.
Buildings 13 02585 g002aBuildings 13 02585 g002b
Figure 3. Age composition of respondents.
Buildings 13 02585 g003
Figure 4. Sound pressure level (SPL) in main functional areas.
Buildings 13 02585 g004
Figure 5. Background noise spectrum at R3 and R6.
Buildings 13 02585 g005
Figure 6. Perceived loudness of sound sources.
Buildings 13 02585 g006
Figure 7. Preference evaluation of sound sources.
Buildings 13 02585 g007
Figure 8. Bi-dimensional model of pleasantness–eventfulness.
Buildings 13 02585 g008
Figure 9. Overall evaluation of the respondents.
Buildings 13 02585 g009
Table 1. Psychoacoustic parameters.
SpotsLoudness/SoneGFSharpness/AcumRoughness/AsperFluctuation Strength/Vacil
R31.7190.99010.03190.03226
R60.090370.2490.34990.01125
Table 2. Pearson correlation analysis between the perceived loudness and preference of each sound source.
Perceived Loudness
Aircraft SoundCrowd Conversation SoundFootstep SoundLuggage SoundPublic AnnouncementMechanical Sound
PreferenceAircraft sound−0.098
Crowd conversation sound −0.224 **
Footstep sound −0.078
Luggage sound −0.063
Public announcement −0.191 **
Mechanical sound −0.150 *
**. significance at 0.01 *. significance at 0.05.
Table 3. Mean and standard deviations of perceived affective quality.
DimensionsPleasantChaoticVibrantUneventfulCalmAnnoyingEventfulMonotonous
Mean ± SD3.10 ± 0.8203.05 ± 0.8753.15 ± 0.7903.33 ± 0.7882.90 ± 0.9072.79 ± 0.7993.12 ± 0.8162.85 ± 0.751
Table 4. Mean and standard deviations of perceived affective quality for different age groups.
Age GroupPleasantChaoticVibrantUneventfulCalmAnnoyingEventfulMonotonousPE
<183 ± 03 ± 03.33 ± 0.473.67 ± 0.473.33 ± 0.473.33 ± 0.473.33 ± 0.473.67 ± 0.47−0.33−0.33
18–252.97 ± 0.833.11 ± 0.873.04 ± 0.803.34 ± 0.742.83 ± 0.962.80 ± 0.783.16 ± 0.762.74 ± 0.710.18−0.18
26–303.11 ± 0.823.06 ± 0.943.15 ± 0.813.23 ± 0.842.79 ± 0.832.79 ± 0.813.13 ± 0.872.83 ± 0.840.35−0.09
31–403.24 ± 0.843.07 ± 0.903.11 ± 0.733.33 ± 0.892.87 ± 0.852.67 ± 0.863.07 ± 0.892.93 ± 0.760.54−0.26
41–503.32 ± 0.733.00 ± 0.463.63 ± 0.673.36 ± 0.673.36 ± 0.813.00 ± 0.463.16 ± 0.593.05 ± 0.510.81−0.21
>503.33 ± 0.472.00 ± 0.583.33 ± 0.753.67 ± 0.473.67 ± 0.472.67 ± 1.112.83 ± 1.073.00 ± 0.571.71−0.83
Table 5. Pearson correlation analysis between perceived loudness of sound sources and affective quality.
PleasantnessEventfulnessCalmnessVirality
PleasantAnnoyingEventfulUneventfulCalmChaoticVibrantMonotonous
Aircraft sound0.0670.031−0.0620.0080.142 *−0.112−0.0990.106
Crowd conversation sound−0.258 **0.0890.107−0.190 **−0.295 **0.305 **−0.103−0.022
Footstep sound−0.0540.095−0.0310.007−0.0050.1070.0160.074
Luggage sound−0.0610.149 *−0.042−0.0060.0270.071−0.0700.182 **
Public announcement−0.0980.1000.132−0.169 *−0.290 **0.238 **−0.162 *−0.124
Mechanical sound−0.083−0.014−0.048−0.139 *−0.0070.029−0.027−0.101
**. significance at 0.01 *. significance at 0.05.
Table 6. The relationship between the perceived loudness of sound sources and the overall evaluation.
ab
Quality EvaluationLoudnessCoordinationQuality
Evaluation
LoudnessCoordination
Aircraft sound0.000−0.074−0.0130.030 **/0.0540.248/0.0600.044 */0.159
Crowd conversation sound−0.426 **0.223 **−0.138 *0.530/1.2603.130/−1.1250.851/1.045
Footstep sound−0.0580.077−0.1060.002 **/0.0400.018 **/−0.3140.006 **/0.273
Luggage sound−0.178 **0.096−0.166 **0.995/0.6610.002 **/−0.6100.517/0.831
Public announcement−0.208 **0.168 **0.053///
Mechanical sound−0.0850.000−0.0210.073/0.1010.922/0.0170.271/0.063
**. significance at 0.01 *. significance at 0.05. a. Correlation coefficient and significance level of the perceived loudness of various sound sources and overall sound environment evaluation. b. p values of independent samples t-tests and mean differences on overall acoustic evaluated in the presence or absence of independent sound sources.
Table 7. ANOVA results of ages and evaluation of the sound environment.
FactorThe Perceived Loudness of the Individual Sound SourcePreferencePerceived Effective QualityQuality EvaluationOverall LoudnessCoordination
AgeAircraft sound (0.006 **)Vibrant (0.044 *)
**. significance at 0.01 *. significance at 0.05.
Disclaimer/Publisher’s Note: The statements, opinions and data contained in all publications are solely those of the individual author(s) and contributor(s) and not of MDPI and/or the editor(s). MDPI and/or the editor(s) disclaim responsibility for any injury to people or property resulting from any ideas, methods, instructions or products referred to in the content.

