Article

Influence of Carbon Nanofiber Content on the Fracture Mechanical Properties of Cement-Based Materials: Insights from Three-Point Bending and Nanoindentation Tests

School of Civil Engineering and Architecture, Zhongyuan University of Technology, Zhengzhou 450007, China
*
Author to whom correspondence should be addressed.
Buildings 2023, 13(10), 2594; https://doi.org/10.3390/buildings13102594
Submission received: 21 September 2023 / Revised: 11 October 2023 / Accepted: 12 October 2023 / Published: 14 October 2023

Abstract

:
Incorporating intelligent materials in concrete allows for self-sensing capabilities by reflecting the concrete’s strain and tensile status through the electrical properties. In order to enhance the self-diagnostic abilities of intelligent concrete, we conducted research on how intelligent materials affect the fracture mechanics of concrete. This study examines the fracture mechanical properties of the carbon nanofiber cement mortar and paste based on three-point bending and nanoindentation tests. The results showed that the carbon nanofiber content has negligible influence on the crack initiation toughness of the specimens. However, the instability toughness exhibited an initial increase followed by a decrease as the carbon nanofiber content increased. At a fiber content of 0.2%, the crack initiation toughness improved maximally by 13.1% compared to the control group. At a fiber content of 0.5%, both the ductility index and fracture energy increased with the nanofiber content, improving by 84% and 66.3%, respectively. The incorporation of carbon nanofibers did not alter the composition of cement paste hydration products; the fracture toughness of each hydration product varies from 0.14 to 0.59 MPa·m1/2. However, the fracture toughness of individual hydration products and un-hydrated particles is higher than the macroscopic three-point bending fracture toughness values of the specimens.

1. Introduction

Concrete holds an irreplaceable and significant role in the construction industry. However, rapid economic development has led to traditional concrete being unable to meet the demands of modern engineering projects. In the course of its development, concrete should adhere to the principles of green and sustainable growth, with sustainability and functionality influencing the future directions for its advancement. The incorporation of “intelligent materials” to concrete allows it to respond to external stimuli and facilitate ensuing solutions, thereby enabling self-diagnosis, self-regulation, and self-repair functionalities—an area garnering widespread attention [1,2]. Concrete itself does not possess self-sensing capabilities. However, when conductive intelligent materials are incorporated, the electrical properties of these materials can reflect the concrete’s inherent strain and tension, enabling self-sensing and self-detecting features. Consequently, this meets the goal of monitoring the health condition of the concrete. Common self-sensing concrete types mainly include those with added carbon fibers and optical fibers [3,4,5,6,7,8]. Erdem et al. [9] carried out an investigation on the damage that three different kinds of fiber had on self-sensing cement-based composites, revealing the effects of various types of fibers on concrete crack development and density. Tian et al. [10] studied the stress self-sensing of carbon-fiber-reinforced hydraulic concrete with varying fiber lengths and contents. Song et al. [11] proposed that multifunctional fiber-reinforced UHP (ultra-high-performance) concrete has integrated self-healing and sensing capacities suitable for in situ structural surveying. Seung et al. [12] explored the mixed effects of steel fibers and carbon nanotubes on the intelligent performance of UHP concrete. Rashid [13] used fiber geotextile to improve the bearing capacity of sandy soil. Yooprasertchai [14] adopted glass fiber reinforced polymer rods to strengthen the shearing ability of flat slabs.
Concrete is inherently a brittle material. The development of cracks can cause severe structural destruction in the form of fractures, compromising the material’s safety. Consequently, fracture performance is a critical mechanical property of cement-based materials. The incorporation of fibers impacts the fracture mechanics behavior of self-sensing concrete [15]. Following the occurrence of cracks in the microstructure of self-sensing concrete, the material’s conductivity decreases. However, with the addition of high-conductivity carbon fibers, changes in conductivity are observed. Thus, researching the impact of nanofiber on the fracture behavior of self-sensing concrete contributes to a more accurate characterization of crack development based on the material’s conductivity.
Common macroscopic test methods for evaluating fracture mechanical properties include the TPB (three-point bending) test [16,17,18,19,20,21] and the wedge-splitting test [22,23,24,25,26]. Zhang et al. [27] employed the TPB test to examine the impact of nano-SiO2 and PVA fibers on the fracture characteristics of cementitious compounds. Their findings indicate that an appropriate amount of nano-SiO2 and PVA fibers could enhance the fracture capabilities of cementitious composites. Nguyen et al. [28] researched the behavior of concrete reinforced with steel fiber from fracture energy, revealing that the ratio of local fracture energy to total fracture energy ranged from 0.38 to 0.82, while the ratio of elastic fracture energy to total fracture energy ranged from 0.02 to 0.08. Chaiyasarn [29] proposed an advanced inspection reporting system to inspect cracks in larger structures.
Nanoindentation tests—according to the theory of elastic contact mechanics—utilize a diamond indenter to measure the load–indentation depth curve during material indentation, thereby obtaining micromechanical parameters in the indentation area [30,31]. Initially, this testing was utilized to characterize the mechanical capabilities of different phases within cement-based materials for its test scales. According to linear elastic fracture theory, the fracture parameter of the specimen in the indentation area can be obtained from the surface crack dimensions, also known as the limit equilibrium method (LEM) [32]. However, for quasi-brittle materials like cement-based materials, direct observation of indentation cracks and their geometrical dimensions is challenging, rendering the LEM unsuitable for micro-fracture studies of cement-based materials. Some scholars have explored the microscale fracture performance of materials based on the principle of energy conservation [33,34]. Using the energy method, they utilized the relationship between the total energy expended during the compression process and the elastic, plastic, and fracture energies to characterize the material’s microscale fracture performance. Research indicates that this approach is applicable to quasi-brittle materials such as shale. The energy method allows for the estimation of energy parameters for different phases within composite materials at the microscale, providing insights for studying the microscale fracture capability of cement-based compounds. Owing to the heterogeneous nature of cement-based materials, obtaining the micromechanical properties and fracture parameters of various phases is crucial for understanding their macroscopic failure behavior [33].
Sustainability and functionality represent the future directions for the advancement of concrete; fracture performance is a critical safety indicator of cement-based materials. Consequently, it is important to study the influence of functional materials on the fracture mechanics of concrete. In this study, TPB and nanoindentation test methods were carried out to investigate the fracture-mechanical characteristics of the carbon nanofiber cement mortar and paste. Using the double-K fracture criterion, we derived the double-K fracture index. Digital image correlation (DIC) techniques were applied to analyze crack propagation patterns. According to the fundamentals of the energy theory and the load–displacement curves obtained from the nanoindentation tests, the fracture properties of different hydrated and un-hydrated particles in the specimen were analyzed. Our research findings hold significant theoretical implications for exploring the self-sensing behavior of concrete.

2. Experimental Study

2.1. Raw Materials and Experimental Equipment

To prepare carbon nanofiber cement mortar, the raw materials used included Ordinary Portland Cement (P·O42.5R) produced by Zhengzhou Tianrui Cement Co., Ltd. (Zhengzhou, China), the performance parameters of which are detailed in Table 1. Additionally, river sand with a particle magnitude smaller than 4 mm, XFM60 carbon nanofibers manufactured by Nanjing Xianfeng Nano Co., Ltd. (Nanjing, China) (physical parameters outlined in Table 2), polycarboxylate superplasticizer, and tap water from the laboratory were employed.
The experimental apparatus comprised an electronic scale with 0.01 g accuracy, an ultrasonic cleaner with an ultrasonic power of 100 W, a cement-sand mixer, a computer-controlled electronic flexural testing machine, a nanoindentation device, a metallographic sample grinder and polisher, and a drying oven.

2.2. Experimental Methodology
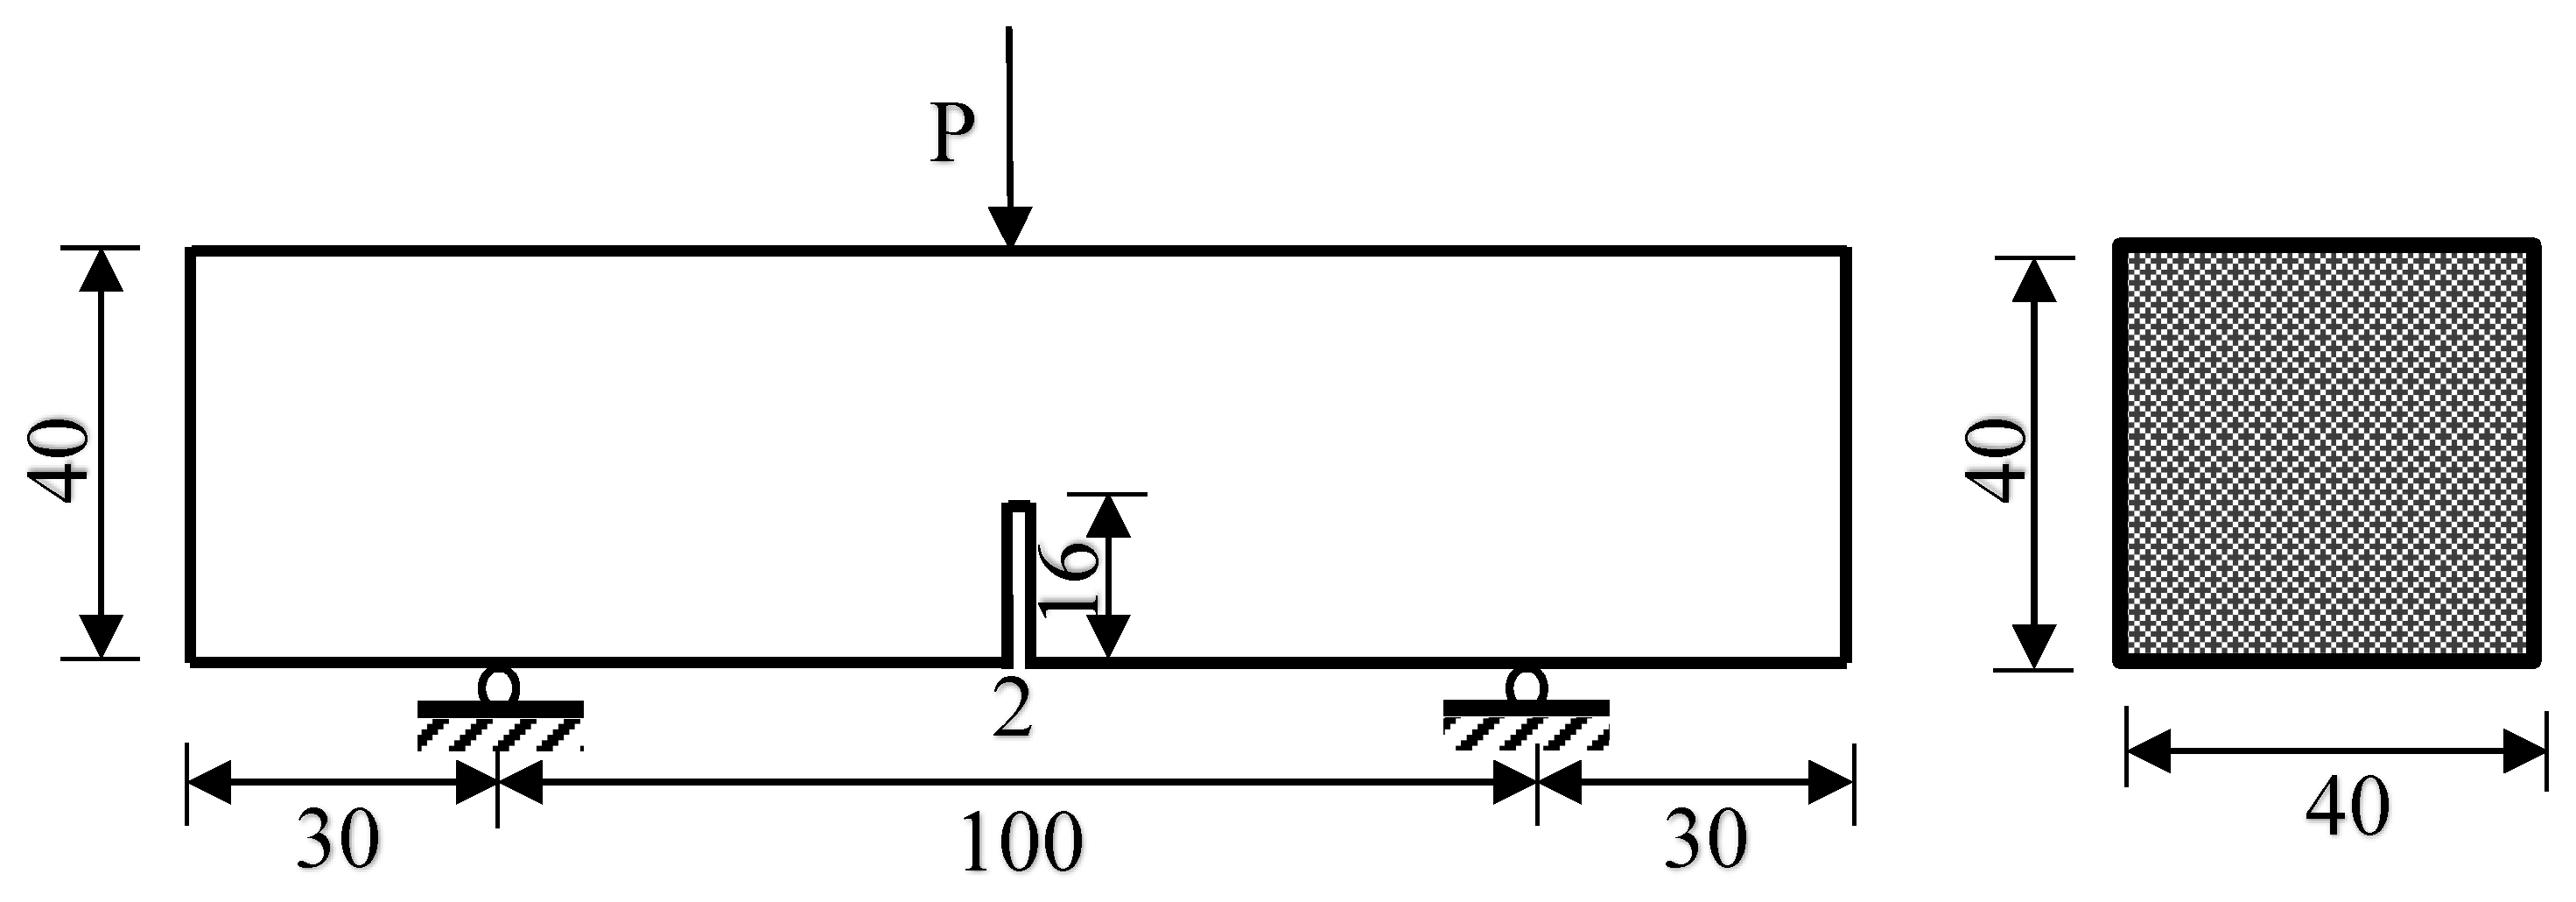
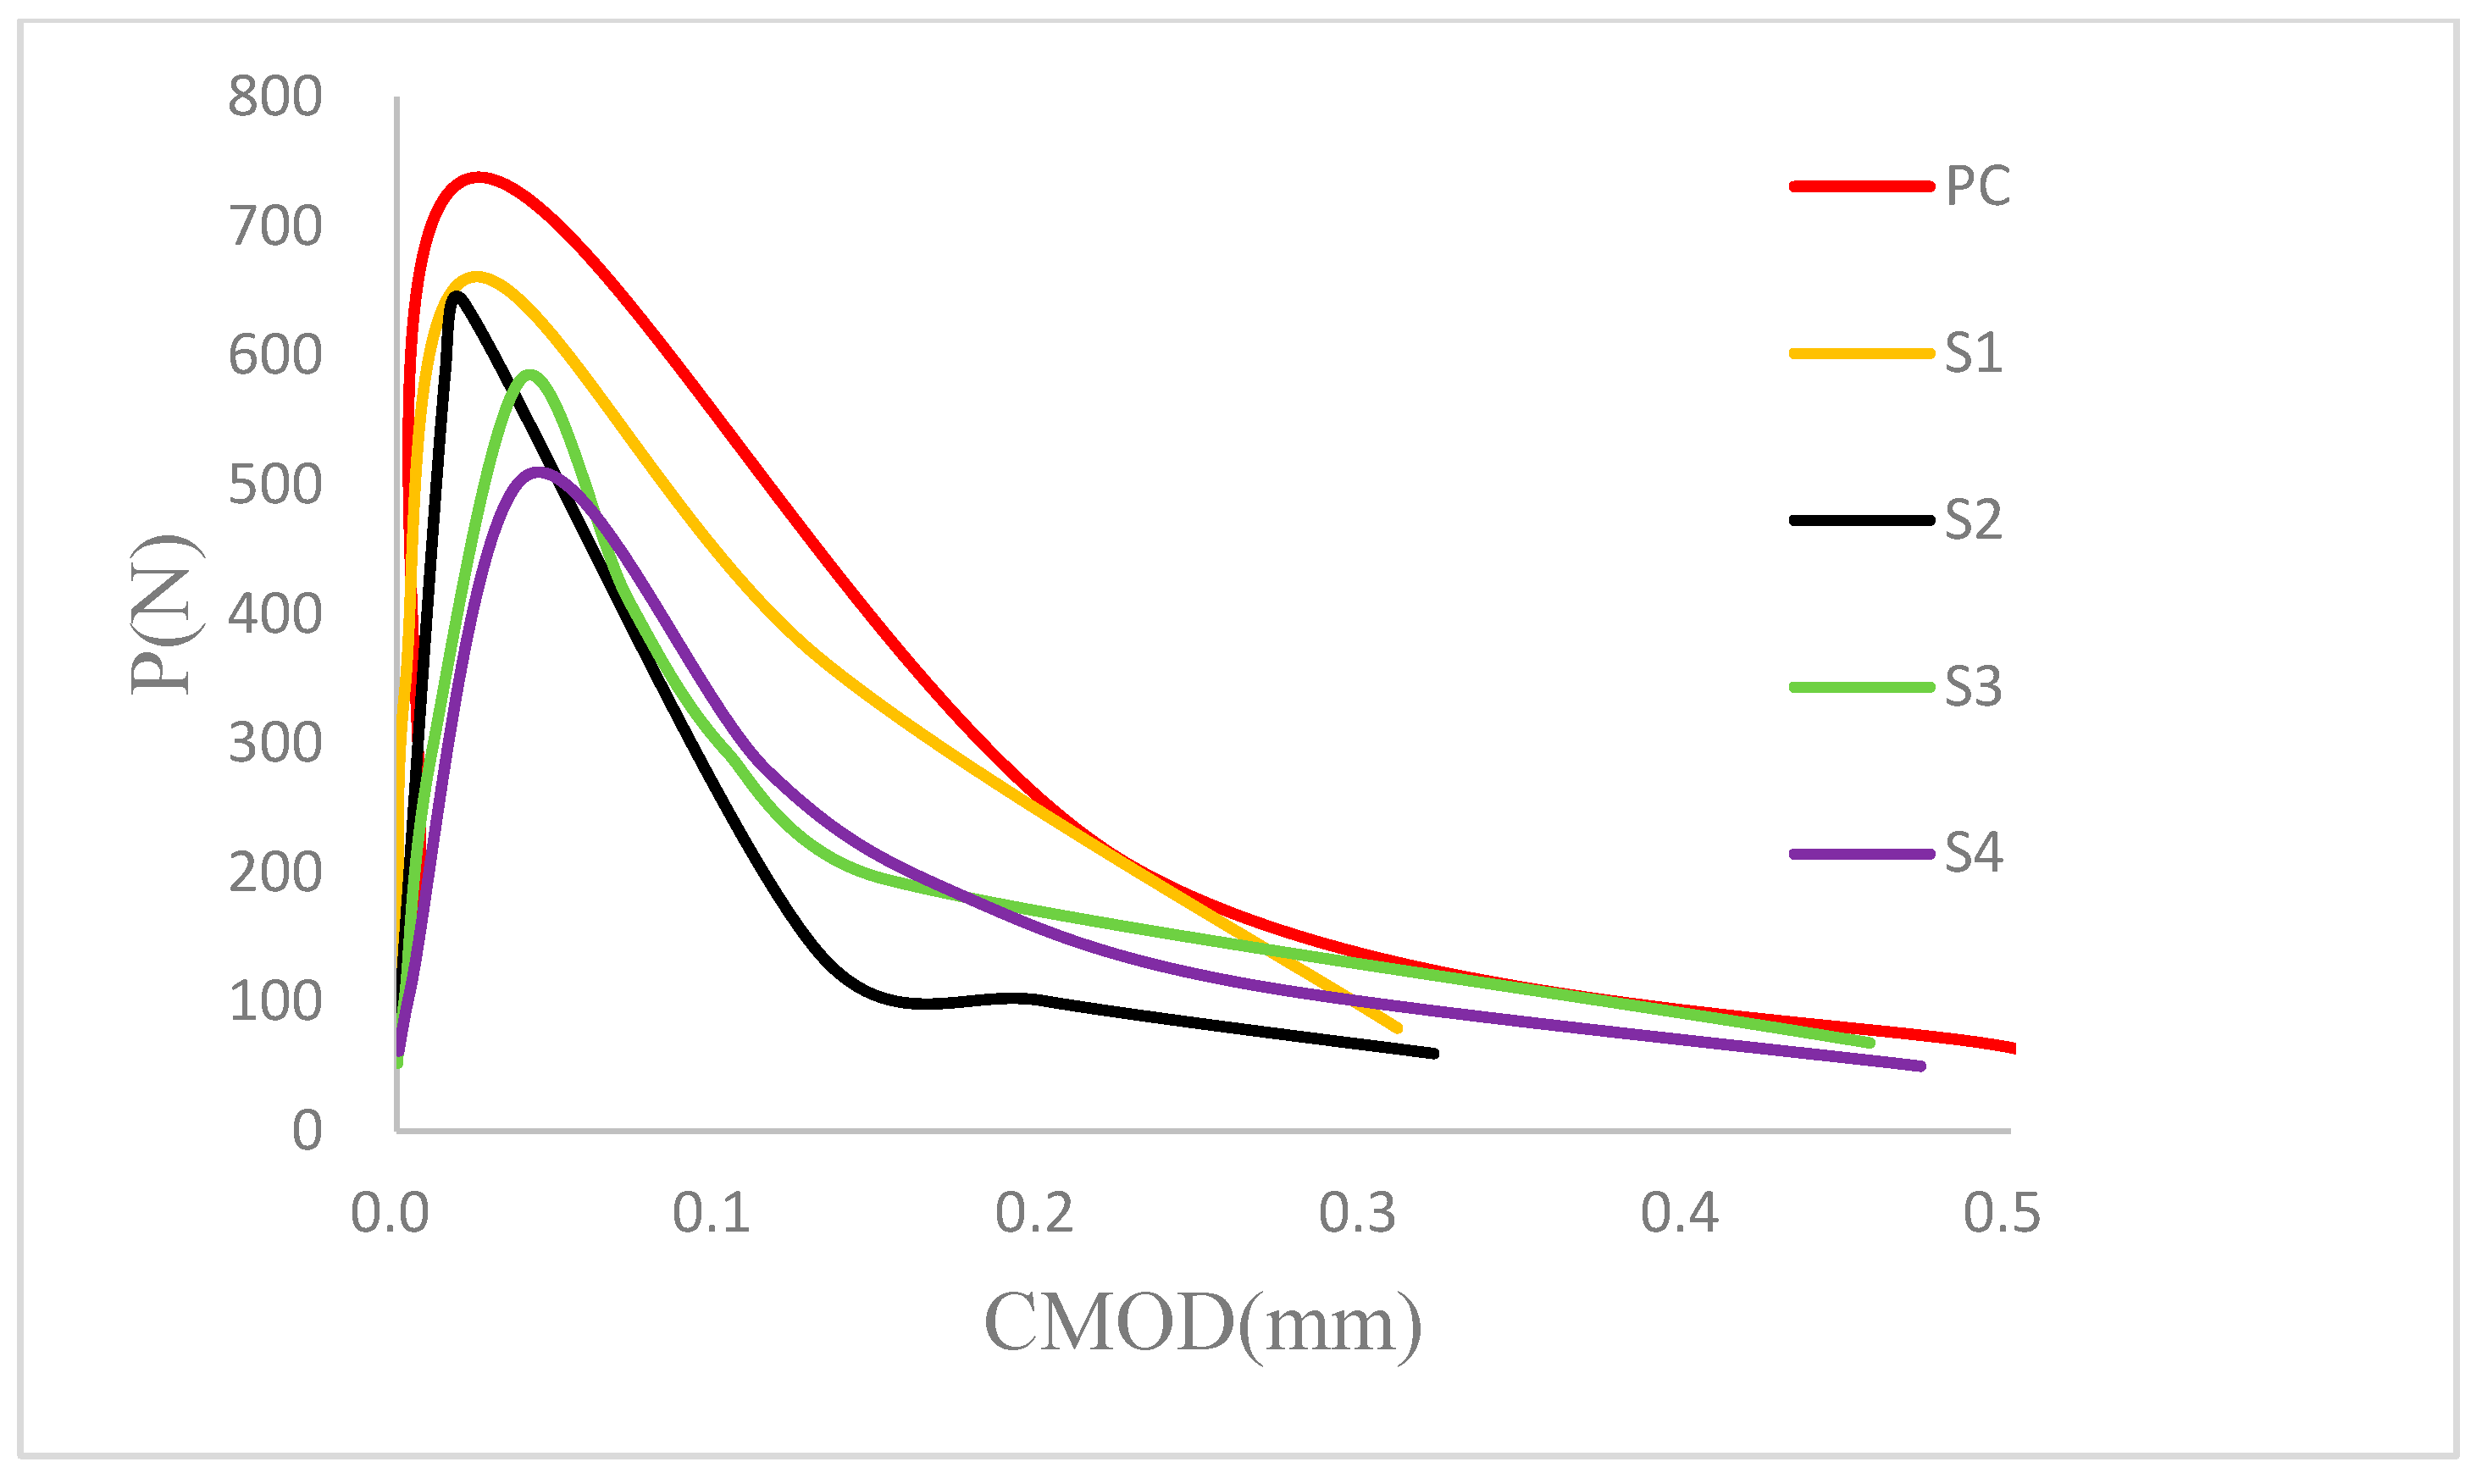
To obtain the impact of carbon nanofibers on the fracture characteristics of cement-based compounds from both macroscopic and microscopic perspectives, two sets of carbon nanofiber cement mortar and paste specimens were prepared. In each set, the water-to-cement ratio was kept at 0.4. The cement-to-sand ratio for the cement mortar was projected at 3:1. The superplasticizer accounted for 1% of the total cement mass, and the carbon nanofiber content varied at 0.1%, 0.2%, 0.3%, and 0.5% by the mass of the cement. Table 3 outlines the mix ratios for the carbon nanofiber cement mortar, where PC is the control group without carbon nanofibers and S1, S2, S3, and S4 represent fiber contents of 0.1%, 0.2%, 0.3%, and 0.5%, respectively. Table 4 details the mix ratios for the carbon nanofiber cement paste, with PC as the control group and N1, N2, N3, and N4 denoting fiber contents of 0.1%, 0.2%, 0.3%, and 0.5%, respectively.
To prepare high-performance cement mortar samples, polycarboxylate superplasticizer was first dissolved in tap water. Afterwards, a measured amount of carbon nanofibers was added to the solution, which was then uniformly mixed. The mixture underwent ultrasonic treatment for 60 min, effectively ensuring an even dispersion of components. Subsequently, the dispersion was incorporated into a mixture of cement and sand, resulting in a homogeneous compound after mixing for 3 min. This compound was then molded with dimensions of 40 × 40 × 160 (mm). After leveling, vibrating, and molding the mixture, the molds were demolded 24 h later and transferred to a standard curing room. Following a curing period of 28 days, the cement mortar samples were obtained for testing.
For the preparation of cement paste, raw materials were weighed, mixed, and molded according to Table 4. After aging the samples for 28 days, they were extracted and immersed in anhydrous ethanol for 24 h to halt the hydration process. The samples were then cut into squares with 10 mm edges. Then, the cube was embedded in a mold using a mixture of bisphenol A epoxy resin and phenolic resin curing agent (weight ratio 2:1). After demolding, a LAP-1000 metallographic sample polisher was used for the grinding and polishing treatment. The grit sizes of the sandpapers used were 120, 600, 1200, 2000, 4000, and 5000. The grinding time for each step was 20 min [35,36].
To prevent further hydration, a small amount of anhydrous ethanol was incrementally added during the grinding process, serving as both a lubricant and a coolant. The levels of fineness of the polishing suspensions employed were 2.5, 0.5, and 0.3 (μm), respectively, and the polishing time for each step was also 20 min [35,36]. Following the grinding and polishing steps, the samples were rinsed with anhydrous ethanol for 15 min to remove any residual polishing liquid or dislodged particles that may have adhered to the surfaces. Finally, the samples were examined under a microscope to confirm that their surface roughness was satisfactory and their imaging was clear, as illustrated in Figure 1.

2.3. TPB Test

To evaluate the fracture mechanics properties of carbon-nanofiber-reinforced cement-based composites, test beams with prefabricated cracks were used in a three-point bending experiment. A total of 15 bending specimens, each with detailed sizes of 40 × 40 × 160 (mm), were made across five diverse groups. The length of midspan was set at 100 mm, with a prefabricated crack height of 16 mm and a thickness of 2 mm shown in Figure 2. Testing was conducted using a computer-controlled electronic flexural testing machine in accordance with the norm DL/T5332-2005 [37], with the loading rate set at 0.12 mm/min. Load–displacement (P-δ) data were collected using the machine’s displacement acquisition system, while the P-CMOD (load–crack mouth opening displacement) data were obtained via extensometers. To capture the entire field of fracture evolution on the specimen’s surface, a DIC system was employed, which involved speckle spraying on the specimen, real-time imaging, and software analysis for strain evaluation.

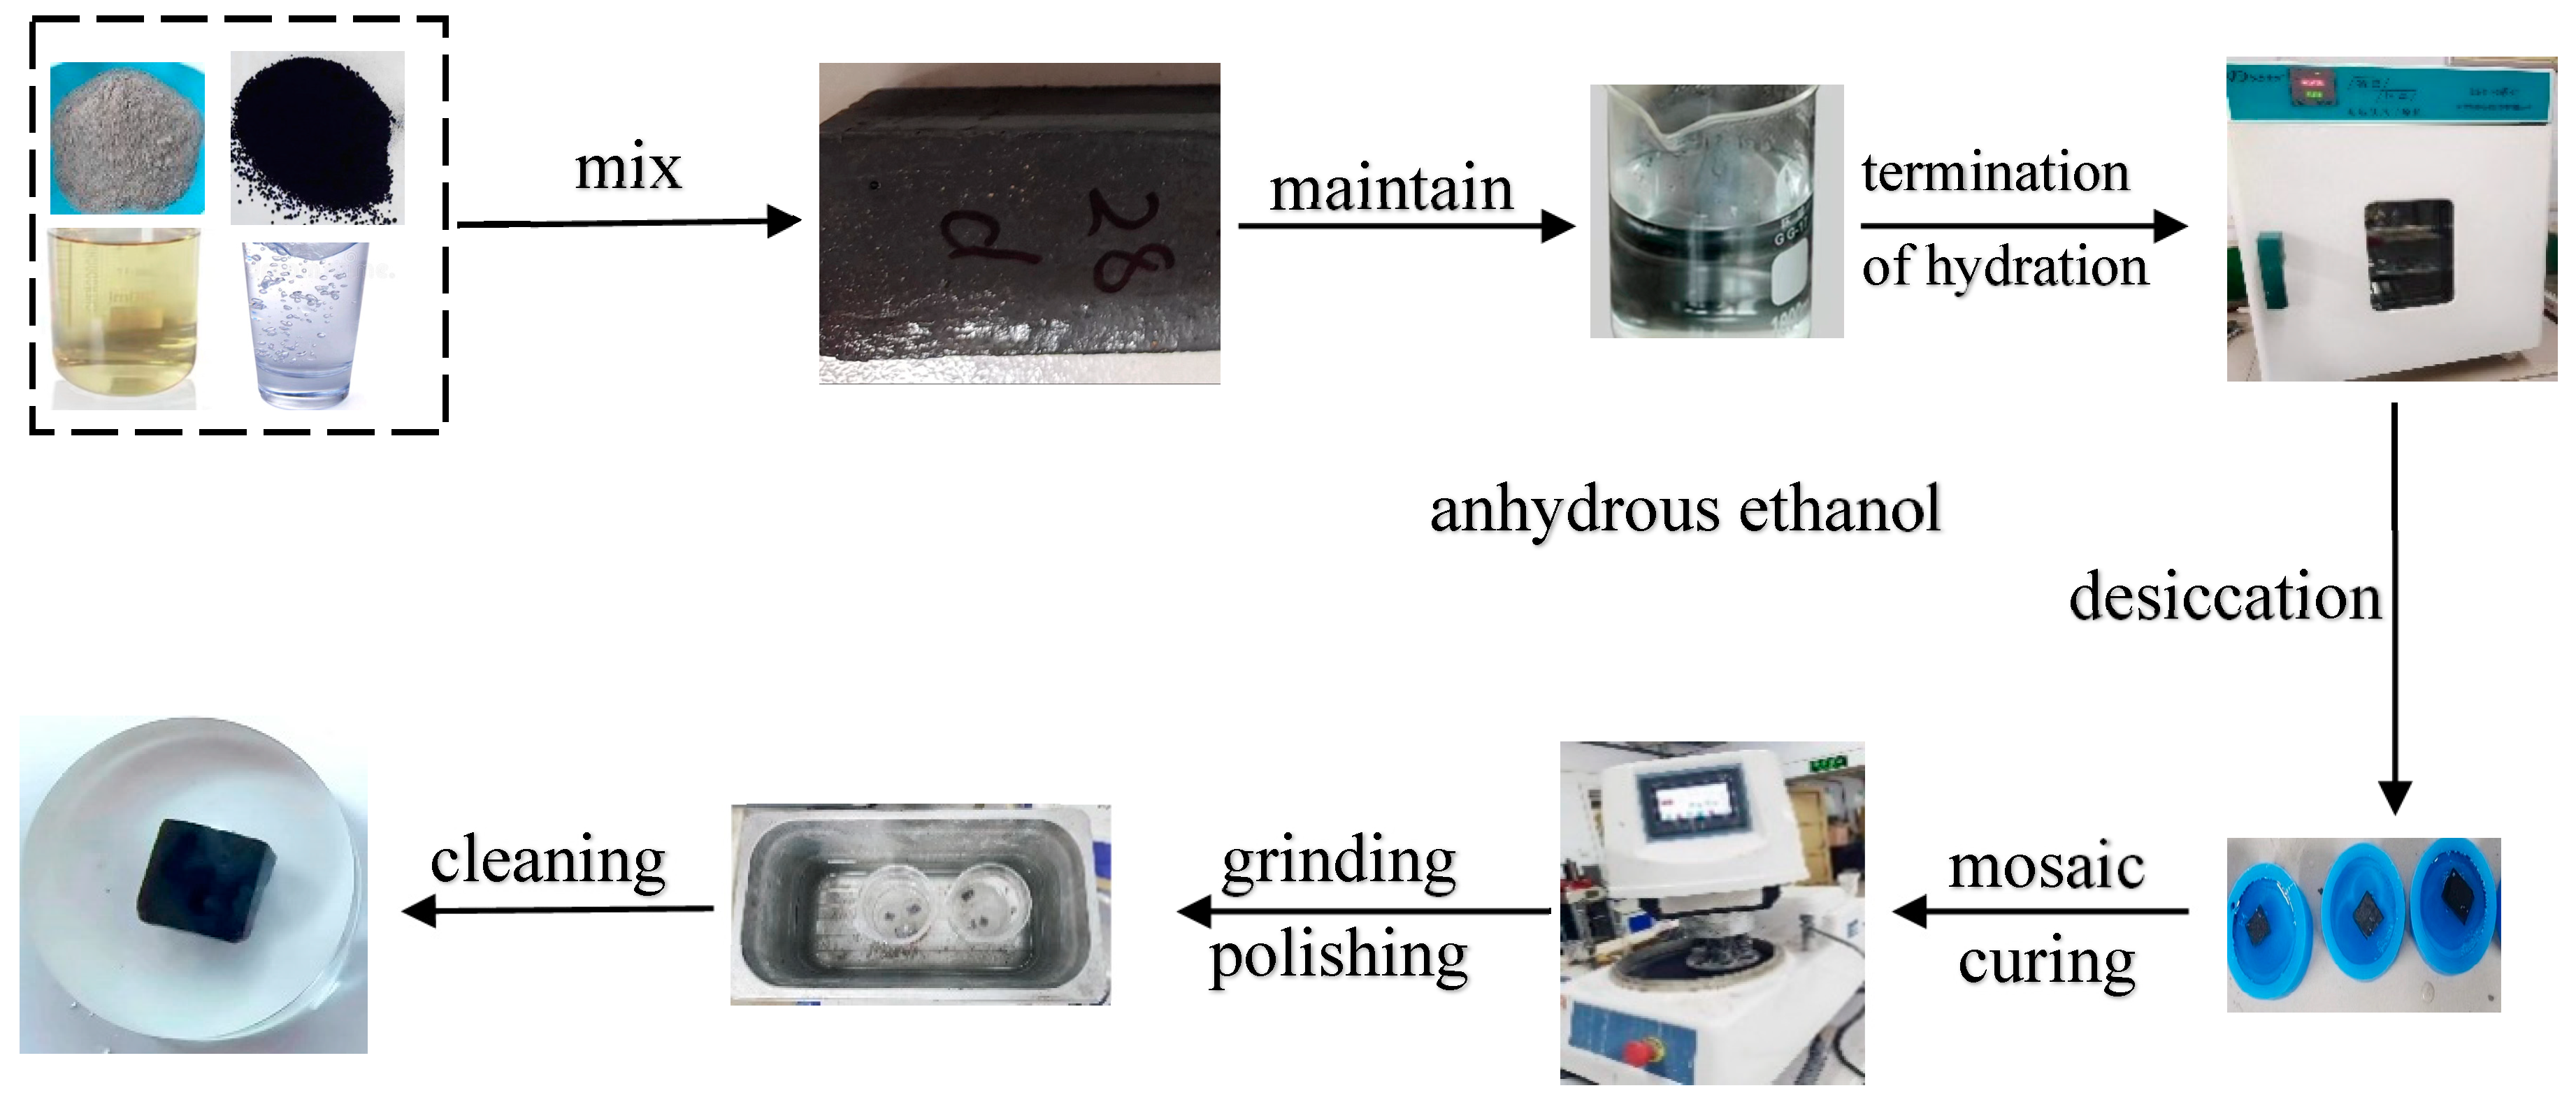
2.4. Nanoindentation Test

The nanoindentation test was conducted according to the standard JB/T 12721-2016 [38]. The fundamental principle of nanoindentation involves pressing a tip of known mechanical parameters into the material being tested, which has unknown properties. Hardness, elastic modulus, and other mechanical characteristics of the tested material are then inferred from the load–displacement curve [33].
Figure 3 illustrates the nanoindentation loading and unloading curves, where Pm represents the maximum load, h1 indicates the indentation depth corresponding to the maximum load during the loading phase, hm symbolizes the maximum depth of indentation, hf signifies the remained impression depth after entire unloading, hc indicates the contact depth of the indentation, and K indicates the contact stiffness, obtained from the gradient at the top of the offloading curve. The relationship between the stiffness and the reduced modulus Er is as follows:
E r = π 2 β A K
where A represents the touching area between the tip and the specimen being tested, and β signifies the shape factor of the head. For a Berkovich indenter, β is set at 1.034.
The material’s real elastic modulus E is related to the reduced modulus Er:
1 E r = 1 v i 2 E i + 1 v 2 E
where v is the Poisson’s ratio of the specimen being tested, and vi and Ei are the Poisson’s ratio and modulus of the indenter.
The hardness of the specimen under indentation is signified as:
H = P m A C .
The relationship between contact area AC and contact depth hc is:
A C = α h c 2 ,
where α is a parameter about the configuration of the indenter; for a Berkovich indenter, α = 24.5.
A Berkovich indenter was utilized to conduct nanoindentation tests. A 10 × 10 grid was set up on the surface of the cement samples, with a point-to-point distance of 40 μm. The maximum depth of indentation was applied at 2000 nm, and the hold time during the loading phase was 10 s.

3. Experimental Data Analysis and Results

3.1. Principles of Data Analysis

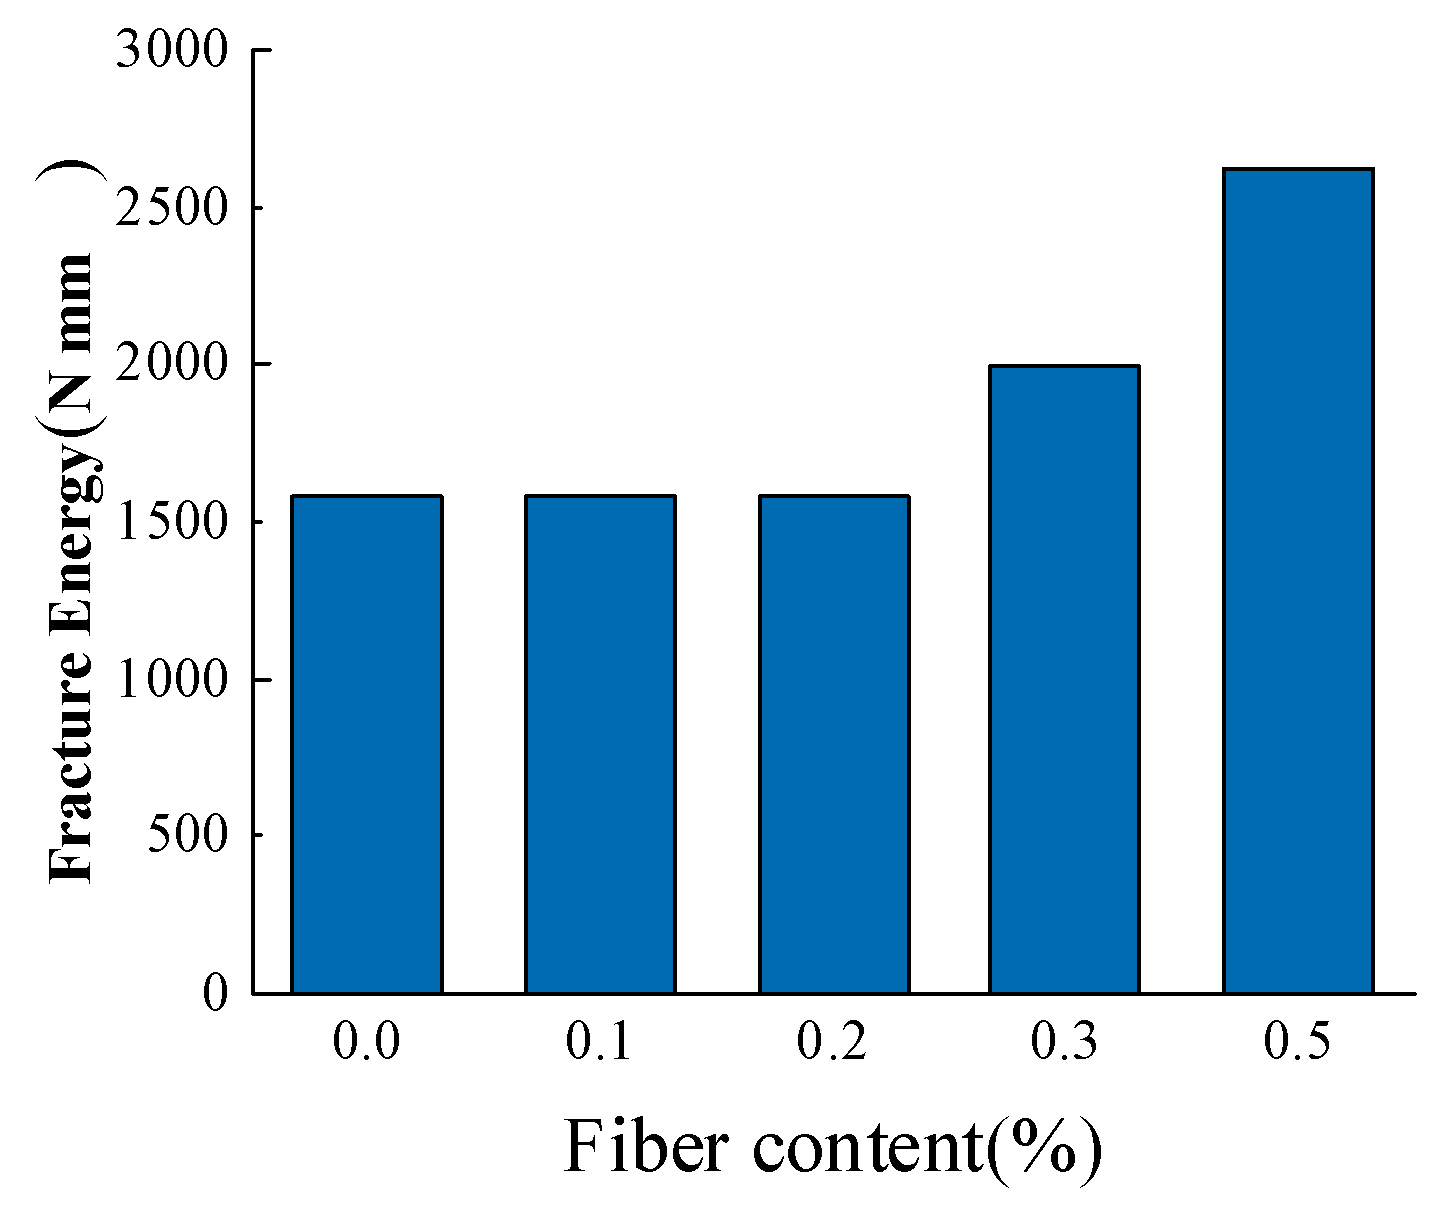
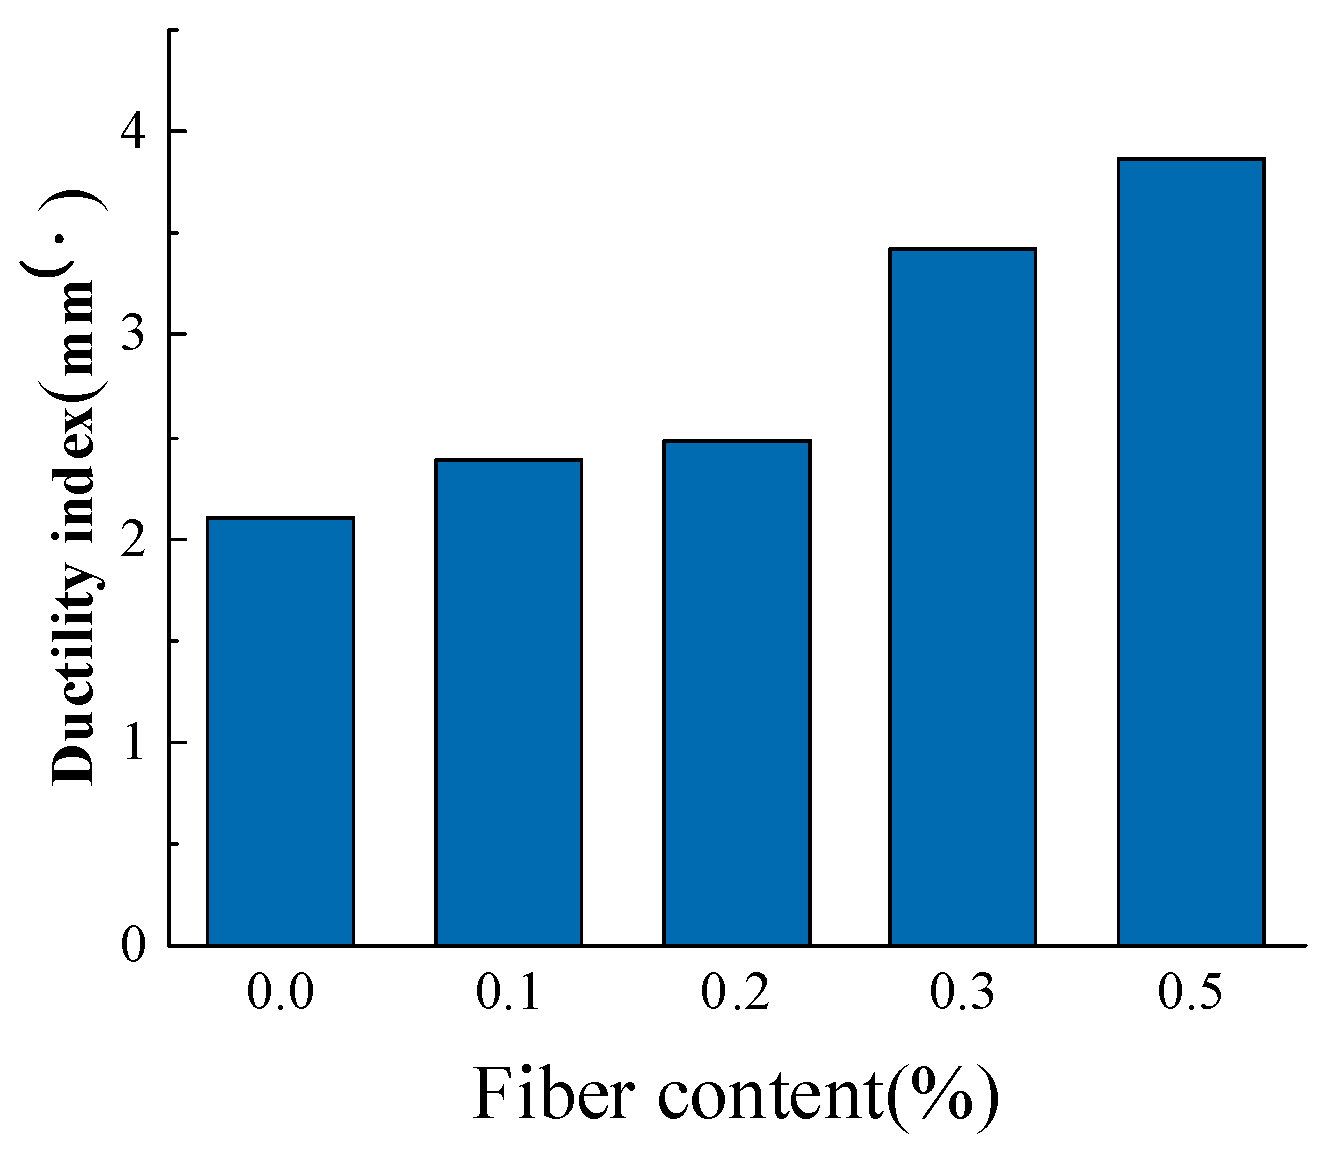
3.1.1. Fracture Parameters in the Bending Test

(1) Fracture toughness
The instability fracture toughness was determined using Professor Xu’s double-K fracture theory for concrete crack development [39,40,41,42], as outlined in [43]:
K I C S = 1.5 P max + m g 2 × 10 2 × 10 3 S a c 1 / 2 t h 2 f a
f a = 1.99 α 1 α × 2.15 3.93 α + 2.7 α 2 1 + 2 α × 1 α 3 / 2
α = a c h
where Pmax represents the peak load; m indicates the mass between the props, which was calculated from the tonnage of the specimen by factoring the S/L ratio; S represents the range between the two supports of the specimen; and g is taken as 9.81 m/s2. Other variables include ac as the crack length, t as the thickness of the specimen, h as the height of the specimen, and f (a) as the geometric shape factor dependent on ac.
The initiation toughness is given by [43]:
K I C Q = 1.5 F Q + m g 2 × 10 2 × 10 3 S a c 1 / 2 t h 2 f a
f a = 1.99 α 1 α × 2.15 3.93 α + 2.7 α 2 1 + 2 α × 1 α 3 / 2
α = a 0 h
where FQ stands for the initiation load, a0 represents the initial crack length (in mm), and f (a) is a geometric shape factor dependent on a0. The variables S, m, ac, t, and h share the same physical meanings as in Equation (5).
(2) Fracture energy
Fracture energy, considered as a nonlinear fracture parameter, quantifies the energy required to form a crack per unit area on the specimen. Based on the experimentally obtained load–displacement curve, the ductility index Du and the fracture energy GF were calculated according to the three-point bending theory recommended by the RILEM [44]:
G F = δ max P d δ + m g δ max B D a 0 = W 0 + m g δ max B H a 0
D u = G F / P max
where W0 represents the work performed by the load; B, H, and a0 correspond to the specimen’s width, height, and prefabricated crack height, respectively; and m is the mass between the specimen’s supports.

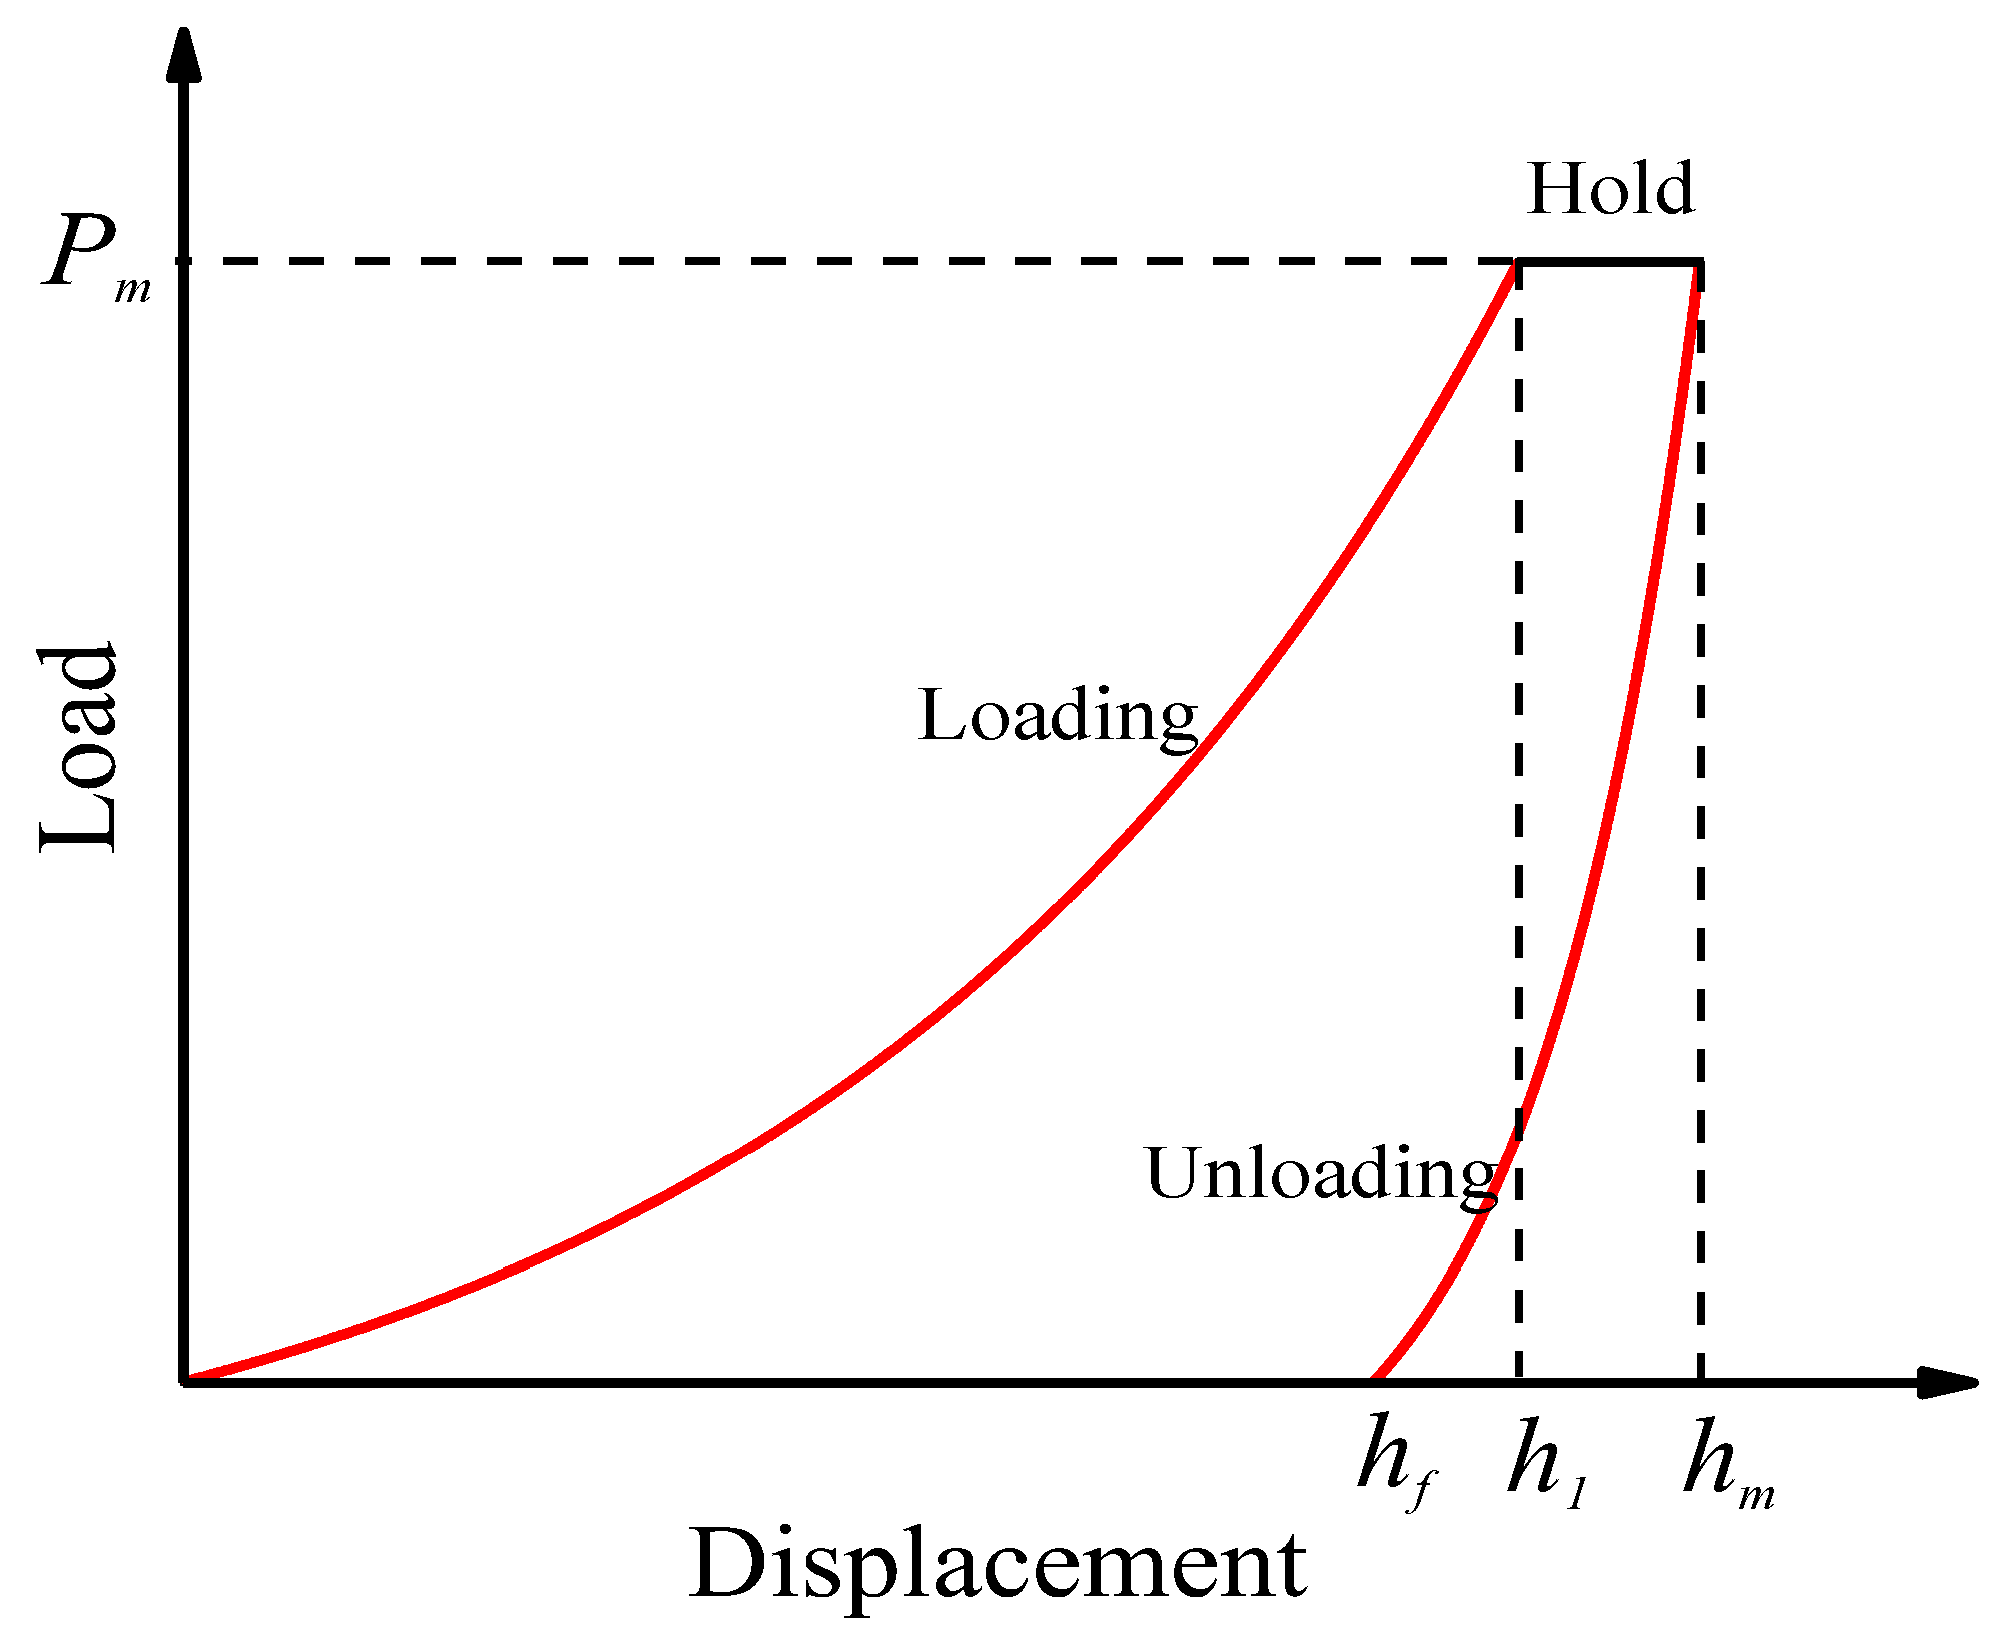
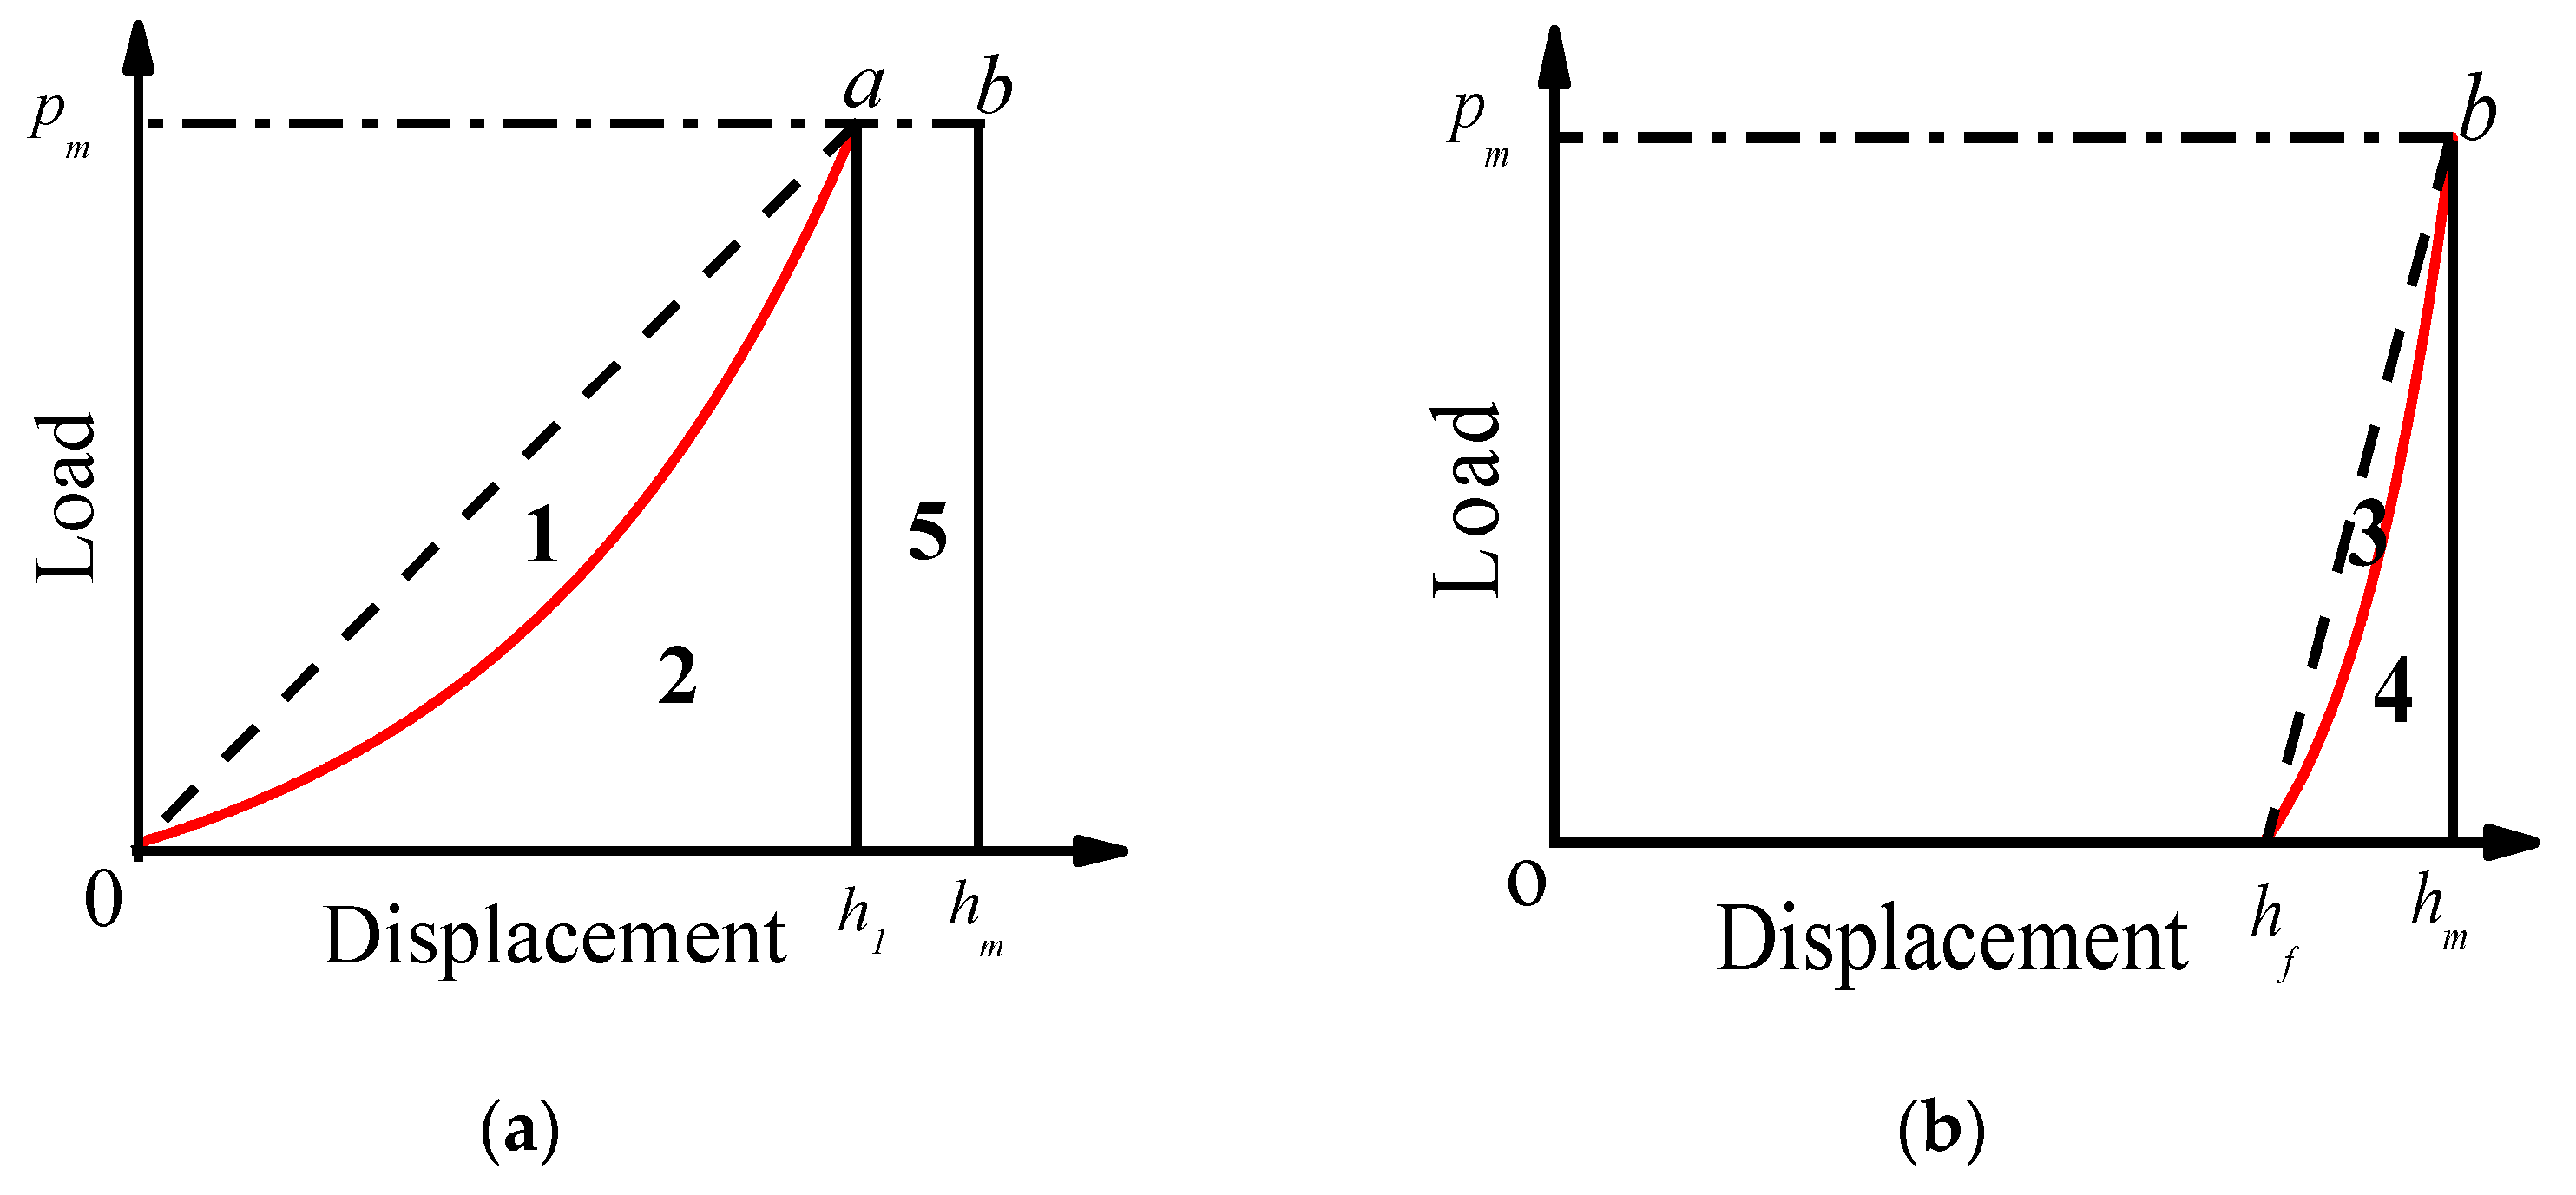
3.1.2. Nanoindentation Fracture Toughness

The fracture toughness was characterized from the load–displacement curves in nanoindentation based on the energy method [33,34]. According to the principles of classical elastic fracture theory, the critical energy dispersion rate Gc signifies the energy dissipated during the course of crack growth:
G c = W C A f r a
where Wc represents the fracture energy, and Afra signifies the area of energy release during fracture. The fracture toughness KIC, or critical stress intensity factor, is defined as follows:
K I C = G c E r
The energy dissipation in various segments throughout the experimental process is determined from the load–displacement curves, as depicted in Figure 4. The area enclosed by the loading curve oa, line ab, line bhm, and the x-axis represents the total energy W2 + W5 applied during the entire indentation process. The area composed by the unloading curve bhf, line bhm, and the x-axis corresponds to the elastic energy released while unloading W4. The area bounded by lines oa, ah1, and the x-axis represents the total calibration energy W1 + W2, ignoring material plasticity. Likewise, the area bounded by lines bhf, bhm, and the x-axis is the calibrated unloading energy W3 + W4.
During indentation testing, material plastic deformation and localized fracturing occur simultaneously. Assuming that the indentation measurement process is static or quasi-static and disregarding system errors and thermal dissipation, the relationship between the total energy applied W2 + W5 and fracture energy WC during the indentation process can be expressed as [45]:
W 2 + W 5 = W P + W 4 + W C
where WP is the purely plastic work, and its relationship with other indentation parameters is given by the following:
W P W P + W 4 = 1 3 m + 1 1 h f h m
where m is a test parameter related to the intrinsic properties of the material. Through calibration against various standard materials, a value of m = 1.35 was obtained.

3.2. Analysis of Experimental Results

The P-CMOD relationship described from the three-point bending tests is shown in Figure 5. It is apparent that all specimen groups display the typical phases of elastic behavior, stable crack propagation, and crack instability. The curves for the second and third phases are robust, indicating a certain bearing and deformation capacity in the zone of crack instability. With the increasing carbon nanofiber content, the maximum bearing capacity decreases, and the crack opening diminishes. This is mainly due to the bridging action of the introduced fibers [16], which inhibits crack growth.
The crack initial toughness, instability toughness, fracture energy, and ductility index for different carbon nanofiber cement mortars are depicted in Figure 6, Figure 7, Figure 8 and Figure 9. The results show that the amount of carbon fibers had a negligible impact on the initiation toughness, which suggests that in the initial stages of loading, the concrete particles primarily resist fracture failure. The instability toughness generally increased before decreasing with the employment of nanofibers but remained higher than that of the control specimen. When the addition of nanofibers was 0.2%, the initiation toughness developed maximally, improving by 13.1% compared to the control group. This suggests that an appropriate amount of carbon nanofibers can enhance the process of instability. Fracture energy progressively accelerated as the nanofiber content increased. At a fiber proportion of 0.5%, the fracture energy improved by 66.3% compared to the PC specimen. The carbon fibers played a bridging role in the fracture process of the specimens, inhibiting the development of cracks. Furthermore, the ductility index of specimens containing carbon fibers was higher than that of the control group. At a fiber content of 0.5%, the ductility index improved by 84%, ameliorating the brittleness of the concrete. The interface transition zone was improved, and the compact of the interface microstructure was increased due to the filling and activity effects of nanomaterials. The total energy required for crack propagation to failure increased correspondingly and ultimately manifested as increases in the initiation load, instability load, ductility index, and fracture energy of the specimen. However, too much nano powder is easy to agglomerate, which can increase the internal defects of the specimen, weaken the ability to resist crack propagation, and ultimately lead to the reduction in the crack initiation toughness.
By using DIC technology to analyze surface displacement changes, we studied the crack propagation patterns during the loading process of the specimens. Figure 10, Figure 11, Figure 12, Figure 13 and Figure 14 present the strain cloud maps of crack propagation in cement mortars with different amounts of carbon nanofibers, where a, b, and c correspond to the phases of elastic behavior, stable crack propagation, and crack instability, respectively.
From Figure 10, Figure 11, Figure 12, Figure 13 and Figure 14, it can be observed that the crack propagation patterns of all specimen groups are fairly consistent with their corresponding P-CMOD curves. The cracks develop primarily in the direction of the principal stress and ultimately result in elongated, narrow principal cracks. Specimens from the PC group display significant brittle characteristics. Upon reaching the peak load, the cracks rapidly expand, leading to failure. Furthermore, with an increase in the carbon nanofiber content, the areas of high strain during the elastic stage increase, while those produced during instability failure decrease—thus enhancing the brittle features of the cement-based materials. The pozzolanic effect of nanomaterials improves the arrangement of CH crystals and promotes the generation of C-S-H with higher density. Hydration products and nanoparticles have a filling effect, leading to a decrease in the number of pores. The compact of the interface lead to the increases in the bonding strength and the energy required for failure, and reduces the range of high strain zones during instability and failure.
The fracture mechanics behavior of different hydration products in cement pastes with varying carbon nanofiber contents were obtained from nanoindentation experiments. These parameters were calculated using Equations (1)–(4) and (13)–(16), as provided in Table 5.
Based on the data presented in Table 5, it is evident that the elastic moduli and hardness values of various hydration products in carbon nanofiber cement pastes fell within the range specified by other researchers for phase compositions and elastic moduli [46]. Consequently, the incorporation of carbon nanofibers did not alter the composition of the hydration particles. Moreover, the fracture toughness of these hydration products generally aligned with the ranges reported in the literature for hardened cement paste [47]. With the incorporation of carbon nanofibers, the fracture toughness values of low- and high-density C-S-H (calcium silicate hydrate) gel and un-hydrated particles in the various specimens increased, all exceeding those in the control group. However, for ultra-high-density calcium silicate gel, a trend of initial increase followed by a decrease was observed as the amount of carbon nanofibers increased. The pozzolanic effect of nanomaterials led to the increase in fracture values of low-density and high-density C-S-H gel in the specimens, which explains the influence of the incorporation of carbon nanofibers on the macro-fracture properties of the specimens from the microscopic composition.
Furthermore, the fracture toughness values for low-, high-, and ultra-high-density hydrated calcium silicate gels, as well as un-hydrated particles, were significantly higher than those derived from macroscopic three-point bending tests. This suggests that the degree of bonding between various constituent phases within the specimens and the performance of the interfacial transition zones play a pivotal role in the specimens’ fracture mechanical properties.

4. Conclusions

This study focused on the impact of carbon nanofibers on the fracture mechanical behaviors of cement-based composites. Through macroscopic three-point bending tests and microscopic nanoindentation tests, we analyzed how the carbon nanofiber content in the specimens affected various parameters such as fracture toughness, fracture energy, ductility index, and hydration products. We can draw the following conclusions:
During the loading process, the specimens exhibited typical phases: an elastic stage, a stable crack propagation stage, and a crack instability stage. As the amount of carbon nanofibers increased, the maximum bearing capacity decreased, while the crack opening displacement also diminished. The incorporated fibers could act as bridges, thereby inhibiting crack growth.
The carbon nanofiber content had little effect on the initiation toughness of the specimens. However, the instability toughness generally exhibited a trend of initial augmentation followed by a reduction with the increasing carbon nanofiber addition. Specifically, the initiation toughness reached its peak improvement at a fiber content of 0.2%, showing a 13.1% increase compared to the control group. Both fracture energy and ductility index gradually increased along with the addition of nanofibers. At a fiber addition of 0.5%, they improved by 66.3% and 84%, respectively, compared to the no-fiber specimen, ameliorating the brittleness of the concrete.
The incorporation of carbon nanofibers had no impact on the composition of hydration particles in the cement paste. However, the fracture toughness values for all hydration products and un-hydrated particles were significantly higher than those derived from macroscopic TPB tests. The fracture toughness of each hydration product varied from 0.14 to 0.59 MPa·m1/2. This indicates that the interfacial transition zones played a pivotal part in determining the macroscopic fracture characteristics of the specimens.
This study contributes to the research of intelligent concrete crack monitoring theory and further guides the maintenance and overhaul of civil engineering.

Author Contributions

Conceptualization, J.W. and Y.S.; writing, Z.L.; data analysis, Y.D. All authors have read and agreed to the published version of the manuscript.

Funding

This paper was funded by the Key Scientific Research Project Plan of Colleges and Universities in Henan Province, China (Grant No. 20ZX009).

Institutional Review Board Statement

Not applicable.

Informed Consent Statement

Not applicable.

Data Availability Statement

Data are contained within the article.

Conflicts of Interest

The authors declare no conflict of interest.

References

  1. Yang, H.; Tao, B.; Qiu, H.; Liang, D. Self-diagnosis and self-repair using hollow-center optical fiber in smart structure. Opt. Optoelectron. Insp. Control 2000, 4221, 264–269. [Google Scholar]
  2. Han, B. Smart Concrete with Self-x Capabilities. In Proceedings of the the 3rd China International Composite Technology Conference, Hangzhou, China, 21–23 October 2017; p. 24. [Google Scholar]
  3. Zhong, S.; Yu, Z. Development and utilization of intelligent concrete. Build. Mater. Dev. Orientat. 2010, 8, 39–40. [Google Scholar]
  4. Phase, K.; Boy, O.; Jia, Z.; Xin, Z.; Yong, Z.; Shu, L. Research progress and application of self-diagnosis and self-healing function of intelligent concrete. Build. Mater. Dev. Orientat. 2022, 20, 12–14. [Google Scholar] [CrossRef]
  5. Hong, W. Development and utilization of intelligent concrete. Green Build. Mater. 2017, 10, 79. [Google Scholar] [CrossRef]
  6. Wen, Z. Research and development of intelligent concrete. Sci. Technol. Econ. Mark. 2008, 2, 29–30. [Google Scholar]
  7. Yoo, D.-Y.; Kim, S.; Lee, S.H. Self-sensing capability of ultra-high-performance concrete containing steel fibers and carbon nanotubes under tension. Sens. Actuators A. Phys. 2018, 276, 125–136. [Google Scholar] [CrossRef]
  8. Kim, M.K.; Kim, D.J.; An, Y.-K. Electro-mechanical self-sensing response of ultra-high-performance fiber-reinforced concrete in tension. Compos. Part B 2018, 134, 254–264. [Google Scholar] [CrossRef]
  9. Erdem, S.; Hanbay, S.; Blankson, M.A. Self-sensing damage assessment and image-based surface crack quantification of carbon nanofibre reinforced concrete. Constr. Build. Mater. 2017, 134, 520–529. [Google Scholar] [CrossRef]
  10. Tian, X.; Hu, S.; Xu, Y.; Qi, H.; Xue, X. Self-sensing study of stress in low-doped carbon fiber reinforced hydraulic concrete. J. Build. Eng. 2023, 76, 107249. [Google Scholar] [CrossRef]
  11. Song, F.; Chen, Q.; Zheng, Q. Multifunctional ultra-high performance fibre-reinforced concrete with integrated self-sensing and repair capabilities towards in-situ structure monitoring. Compos. Struct. 2023, 321, 117240. [Google Scholar] [CrossRef]
  12. Lee, S.H.; Kim, S.; Yoo, D.-Y. Hybrid effects of steel fiber and carbon nanotube on self-sensing capability of ultra-high-performance concrete. Constr. Build. Mater. 2018, 185, 530–544. [Google Scholar] [CrossRef]
  13. Rashid, A.S.A.; Shirazi, M.G.; Mohamad, H.; Sahdi, F. Bearing capacity of sandy soil treated by Kenaf fibre geotextile. Environ. Earth Sci. 2017, 76, 1–6. [Google Scholar] [CrossRef]
  14. Ekkachai, Y.; Ratchanon, D.; Titi, A.; Raktipong, S.; Jira, J.; Panuwat, J.; Qudeer, H. Remediation of Punching Shear Failure Using Glass Fiber Reinforced Polymer (GFRP) Rods. Polymers 2021, 13, 2369. [Google Scholar]
  15. Waqas, A.; Mehran, K.; Piotr, S. Effect of Short Fiber Reinforcements on Fracture Performance of Cement-Based Materials: A Systematic Review Approach. Materials 2021, 14, 1745. [Google Scholar]
  16. Su, L.; Qian, L.; Wei, L.; De, W. Fracture performance of reclaimed aggregate concrete modified by nanomaterials. J. Build. Mater. 2022, 25, 1151–1159. [Google Scholar]
  17. Li, D.; Sun, S.; Lv, F.; Tian, Y.; Jin, X. Effect of fiber on fracture properties of high performance cement-based composites. Shanxi Archit. 2022, 48, 135–139. [Google Scholar] [CrossRef]
  18. Chang, N.; Pang, Q.L.; Scholar, A.S.; Nan, Z. Study on fracture performance of arch specimens of steel fiber cement composites. Concrete 2022, 72–76. [Google Scholar]
  19. Yu, T.; Jian, X.; Ice, S. Fracture properties and crack propagation process of reclaimed mortar under three-point bending. J. Build. Sci. Eng. 2023, 10, 1–7. [Google Scholar]
  20. Ma, G.; Li, J.; Zhou, X.; Zhang, L.; Qiu, P.; Yu, Y. Application of Asymmetric Notched Semi-Circular Bending Specimen to Evaluate Mixed-Mode I-II Fracture Behaviors of Sandstone. Fractal Fract. 2022, 6, 336. [Google Scholar] [CrossRef]
  21. Chen, H.H.N.; Su, R.K.L.; Fok, S.L.; Zhang, H.G. Fracture behavior of nuclear graphite under three-point bending tests. Eng. Fract. Mech. 2017, 186, 143–157. [Google Scholar] [CrossRef]
  22. Ri, L.S.; Tao, X. Fracture test of steel fiber reinforced concrete under wedge splitting test. Sichuan Build. Mater. 2015, 41, 14–18. [Google Scholar]
  23. Min, D.; Liang, W.; Jianming, Z. Experimental study on fracture performance of long age intermediate low heat concrete. Concrete 2021, 57–60. [Google Scholar]
  24. Si, W.; Li, W.; Wen, W. Mesoscopic numerical simulation of wedge splitting and three-point bending fracture of concrete. J. Comput. Mech. 2016, 33, 321–327, 342. [Google Scholar]
  25. García-González, J.; Barroqueiro, T.; Evangelista, L.; Brito, J.; Belie, N.; Pozo, J.M.-d.; Juan-Valdés, A. Fracture energy of coarse recycled aggregate concrete using the wedge splitting test method: Influence of water-reducing admixtures. Mater. Struct. 2017, 50, 120. [Google Scholar] [CrossRef]
  26. Wang, B.; Qianhao, T. Influence of different stirring speed on fracture properties of wedge splitting specimens. Mech. Adv. Mater. Struct. 2022, 29, 3317–3323. [Google Scholar] [CrossRef]
  27. Zhang, P.; Kang, L.; Guo, J.; Wang, J. Fracture properties of nano-SiO2 and PVA fiber reinforced cement-based composites. J. Build. Mater. 2021, 24, 908–915. [Google Scholar]
  28. Duy-Liem, N.; My, N.-T.L.; Dong-Joo, K.; Jiandong, S. Direct tensile self-sensing and fracture energy of steel-fiber-reinforced concretes. Compos. Part B Eng. 2020, 183, 107714. [Google Scholar]
  29. Krisada, C.; Apichat, B.; Hisham, M.; Mingliang, Z.; Sirisilp, K.; Nakhorn, P. Integrated pixel-level CNN-FCN crack detection via photogrammetric 3D texture mapping of concrete structures. Autom. Constr. 2022, 140, 104388. [Google Scholar]
  30. Oliver, W.C.; Pharr, G.M. Measurement of hardness and elastic modulus by instrumented indentation: Advances in understanding and refinements to methodology. J. Mater. Res. 2004, 19, 3–20. [Google Scholar] [CrossRef]
  31. Bielinski, D.M. Use of nanoindentation technique for studying polymeric materials. Przem. Chem. 2012, 91, 1492–1497. [Google Scholar]
  32. Anstis, G.R.; Chantikul, P.; Lawn, B.R.; Marshall, D.B. A Critical Evaluation of Indentation Techniques for Measuring Fracture Toughness: I, Direct Crack Measurements. J. Am. Ceram. Soc. 1981, 64, 533–538. [Google Scholar] [CrossRef]
  33. Ying, F.; Yu, P.; Shi, X.; Qiang, Z. Characterization of nanoindentation microfracture properties of steel fiber mortar. J. Ceram. 2018, 46, 1593–1602. [Google Scholar] [CrossRef]
  34. Jun, J.; Ji, S.; Dong, H. Test and calculation method of fracture toughness of calcium silicate hydrate based on nano-indentation. J. Ceram. 2018, 46, 1067–1073. [Google Scholar] [CrossRef]
  35. Yong, W.; Pei, C.; Li, Z.; Wei, T.; Jia, F. Effect of MgO/ sodium silicate composite on hydration and mechanical properties of alkali slag. J. Build. Mater. 2023, 26, 186–192. [Google Scholar]
  36. Li, C.; Chang, Z.; Chen, J. Effect of metakaolin on mechanical properties and microstructure of reactive powder concrete. Silic. Bull. 2021, 40, 1162–1169. [Google Scholar] [CrossRef]
  37. DL/T 5332-2005; Code for Fracture Test of Hydraulic Concrete. University H: Nanjing, China, 2005.
  38. JB/T 12721-2016; Technical Specification for In Situ Nanoindentation/Scratch Tester for Solid Materials. Chinese Industry Standard: Beijing, China, 2016.
  39. Shi, X.; Guo, Z. Double K fracture criterion for crack propagation of concrete structures. J. Civ. Eng. 1992, 32–38. [Google Scholar]
  40. Yin, X.; Li, Q.; Wang, Q.; Reinhardt, H.W.; Xu, S. The double-K fracture model: A state-of-the-art review. Eng. Fract. Mech. 2023, 277, 108988. [Google Scholar] [CrossRef]
  41. Jianmin, L.O.U.; Guohui, Z.H.A.N.G.; Zhendong, Y.A.N.G.; Junchong, S.U.N.; Hu, L.I. Experimental study on double K fracture characteristics of wet concrete based on wedge splitting method. Silic. Bull. 2022, 41, 3107–3114, 3137. [Google Scholar] [CrossRef]
  42. Army, Q.S.; Nan, C.; Pengjie, L.; Jiang, Y. Double K fracture characteristics of recycled concrete three-point curved beams mixed with lithium slag. J. Jilin Univ. 2021, 51, 2121–2127. [Google Scholar] [CrossRef]
  43. Juan, W.; Wen, W.; Yao, X.; Hong, C.; Da, W. Effect of nano-SiO2 on fracture behavior of rubber concrete. J. Build. Mater. 2023, 26, 731–738. [Google Scholar]
  44. Xiao, G.; Yin, L. Test method for fracture energy of short fiber reinforced concrete. In Proceedings of the The fifth National Fiber Cement and Fiber Concrete Academic Conference, Guangzhou, China, 4–9 September 1994; pp. 152–155. [Google Scholar]
  45. Chen, J.; Bull, S.J. Indentation fracture and toughness assessment for thin optical coatings on glass. J. Phys. D Appl. Phys. A Europhys. J. 2007, 40, 5401. [Google Scholar] [CrossRef]
  46. Li, X.; Hong, Y.; Yin, J.; Fang, D.; Jie, H. Nanomechanical properties of steel fiber-cement base interface transition zone. J. Ceram. 2016, 44, 1134–1146. [Google Scholar] [CrossRef]
  47. Nadeau, J.S.; Mindess, S.; Hay, J.M. Slow Crack Growth in Cement Paste. J. Am. Ceram. Soc. 1974, 57, 51–54. [Google Scholar] [CrossRef]
Figure 1. Flow chart of nanoindentation samples.
Buildings 13 02594 g001
Figure 2. Details of the TPB test (mm).
Buildings 13 02594 g002
Figure 3. Loading and unloading curves.
Buildings 13 02594 g003
Figure 4. Schematic diagram of energy division. (a) Loading energy; (b) unloading energy.
Buildings 13 02594 g004
Figure 5. P-CMOD curve.
Buildings 13 02594 g005
Figure 6. Initiation toughness.
Buildings 13 02594 g006
Figure 7. Instability toughness.
Buildings 13 02594 g007
Figure 8. Fracture energy.
Buildings 13 02594 g008
Figure 9. Ductility index.
Buildings 13 02594 g009
Figure 10. Crack propagation diagram of the PC group. (a) elastic behavior; (b) stable crack propagation; (c) crack instability.
Buildings 13 02594 g010
Figure 11. Crack propagation diagram of the S1 group. (a) elastic behavior; (b) stable crack propagation; (c) crack instability.
Buildings 13 02594 g011
Figure 12. Crack propagation diagram of the S2 group. (a) elastic behavior; (b) stable crack propagation; (c) crack instability.
Buildings 13 02594 g012
Figure 13. Crack propagation diagram of the S3 group. (a) elastic behavior; (b) stable crack propagation; (c) crack instability.
Buildings 13 02594 g013
Figure 14. Crack propagation diagram of the S4 group. (a) elastic behavior; (b) stable crack propagation; (c) crack instability.
Buildings 13 02594 g014
Table 1. Basic physical parameters of cement.
GradeDensity (g/cm3)Specific Surface Area (m2/kg)Fineness (%)
(>80 µm)
Water Requirement of Normal Consistency (%)
42.53.023270.3129.8
Table 2. Basic physical parameters of carbon nanofibers.
Diameter (nm)Density
(g/cm3)
PuritySpecific Surface Area (m2/kg)Length (µm)
50–200<2.1>95%>181–15
Table 3. Mix ratios for the carbon nanofiber cement mortar.
SpecimenCement (g)Sand
(g)
Water
(g)
Superplasticizer (%)Carbon Nanofiber (%)
PC450135018010
S1450135018010.1
S2450135018010.2
S3450135018010.3
S4450135018010.5
Table 4. Mix ratios for the carbon nanofiber cement paste.
SpecimenCement
(g)
Water
(g)
Superplasticizer (%)Carbon Nanofiber (%)
PC45018010
N145018010.1
N245018010.2
N345018010.3
N445018010.5
Table 5. Modulus, hardness, and fracture toughness of hydration products in carbon nanofiber cement pastes.
Product NameSpecimenElastic Modulus (GPa)Hardness (GPa)Fracture Toughness (MPa·m1/2)
Low-density calcium silicate gelPC22.620.710.52
N122.040.80.73
N218.970.640.68
N321.830.920.61
N417.60.620.57
High-density calcium silicate gelPC25.461.130.66
N125.431.180.88
N226.520.980.79
N328.771.170.8
N426.91.040.67
Ultra-high-density calcium silicate gelPC43.451.210.54
N140.261.210.69
N240.31.190.64
N340.451.210.32
N440.091.260.34
Un-hydrated particlesPC143.77.911.63
N1131.126.872.27
N2123.176.732.1
N3127.777.181.77
N4130.236.691.79
Disclaimer/Publisher’s Note: The statements, opinions and data contained in all publications are solely those of the individual author(s) and contributor(s) and not of MDPI and/or the editor(s). MDPI and/or the editor(s) disclaim responsibility for any injury to people or property resulting from any ideas, methods, instructions or products referred to in the content.

