
Indoor Environmental Quality Optimisation Model for Institutional Care Rooms of Elderly People


Abstract
:1. Introduction
2. Importance of IEQ Parameters to the Elderly
2.1. Visual Comfort
2.2. Acoustical Comfort
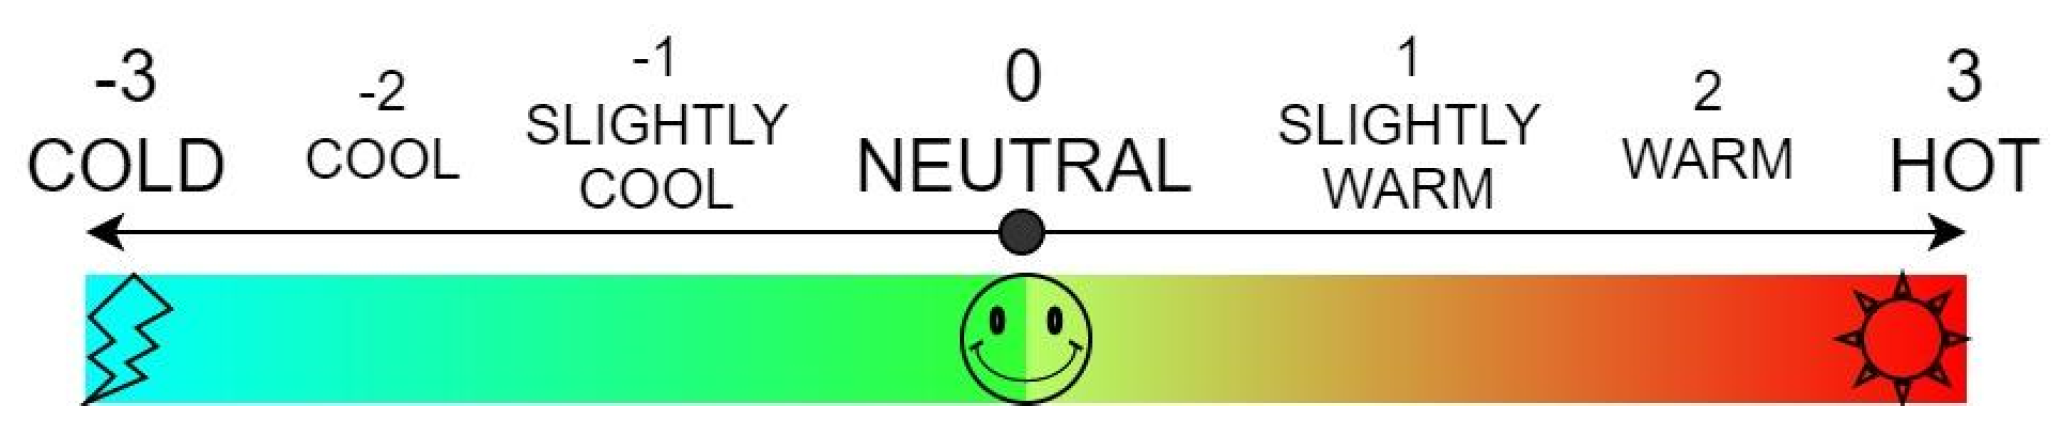
2.3. Thermal Comfort
2.4. Indoor Air Quality (IAQ)
2.5. IEQ Optimisation through Weighted Schemes
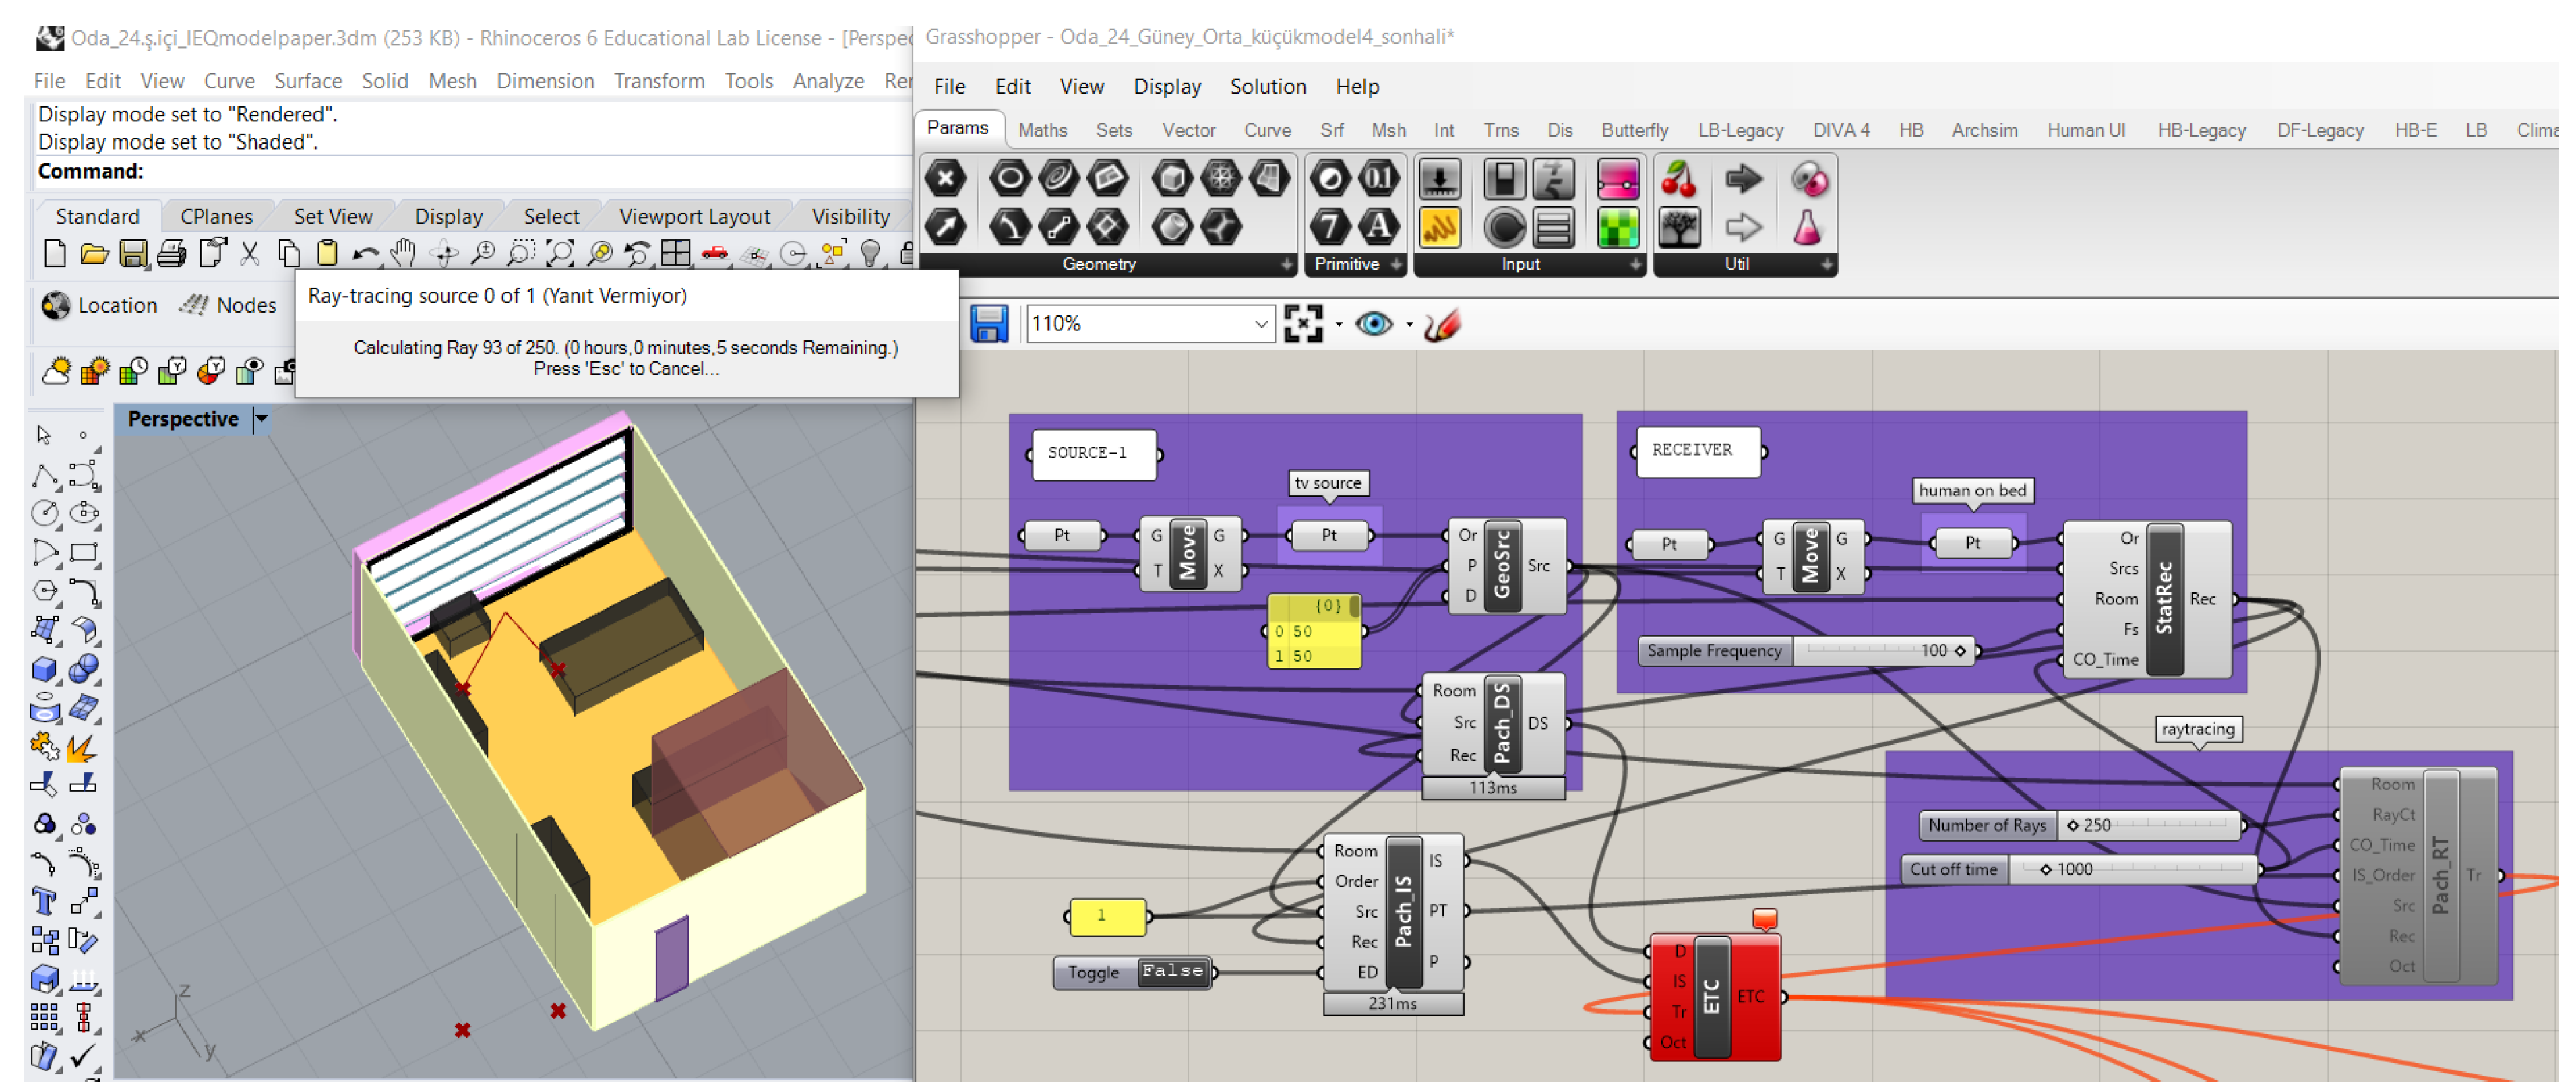
3. Methodology

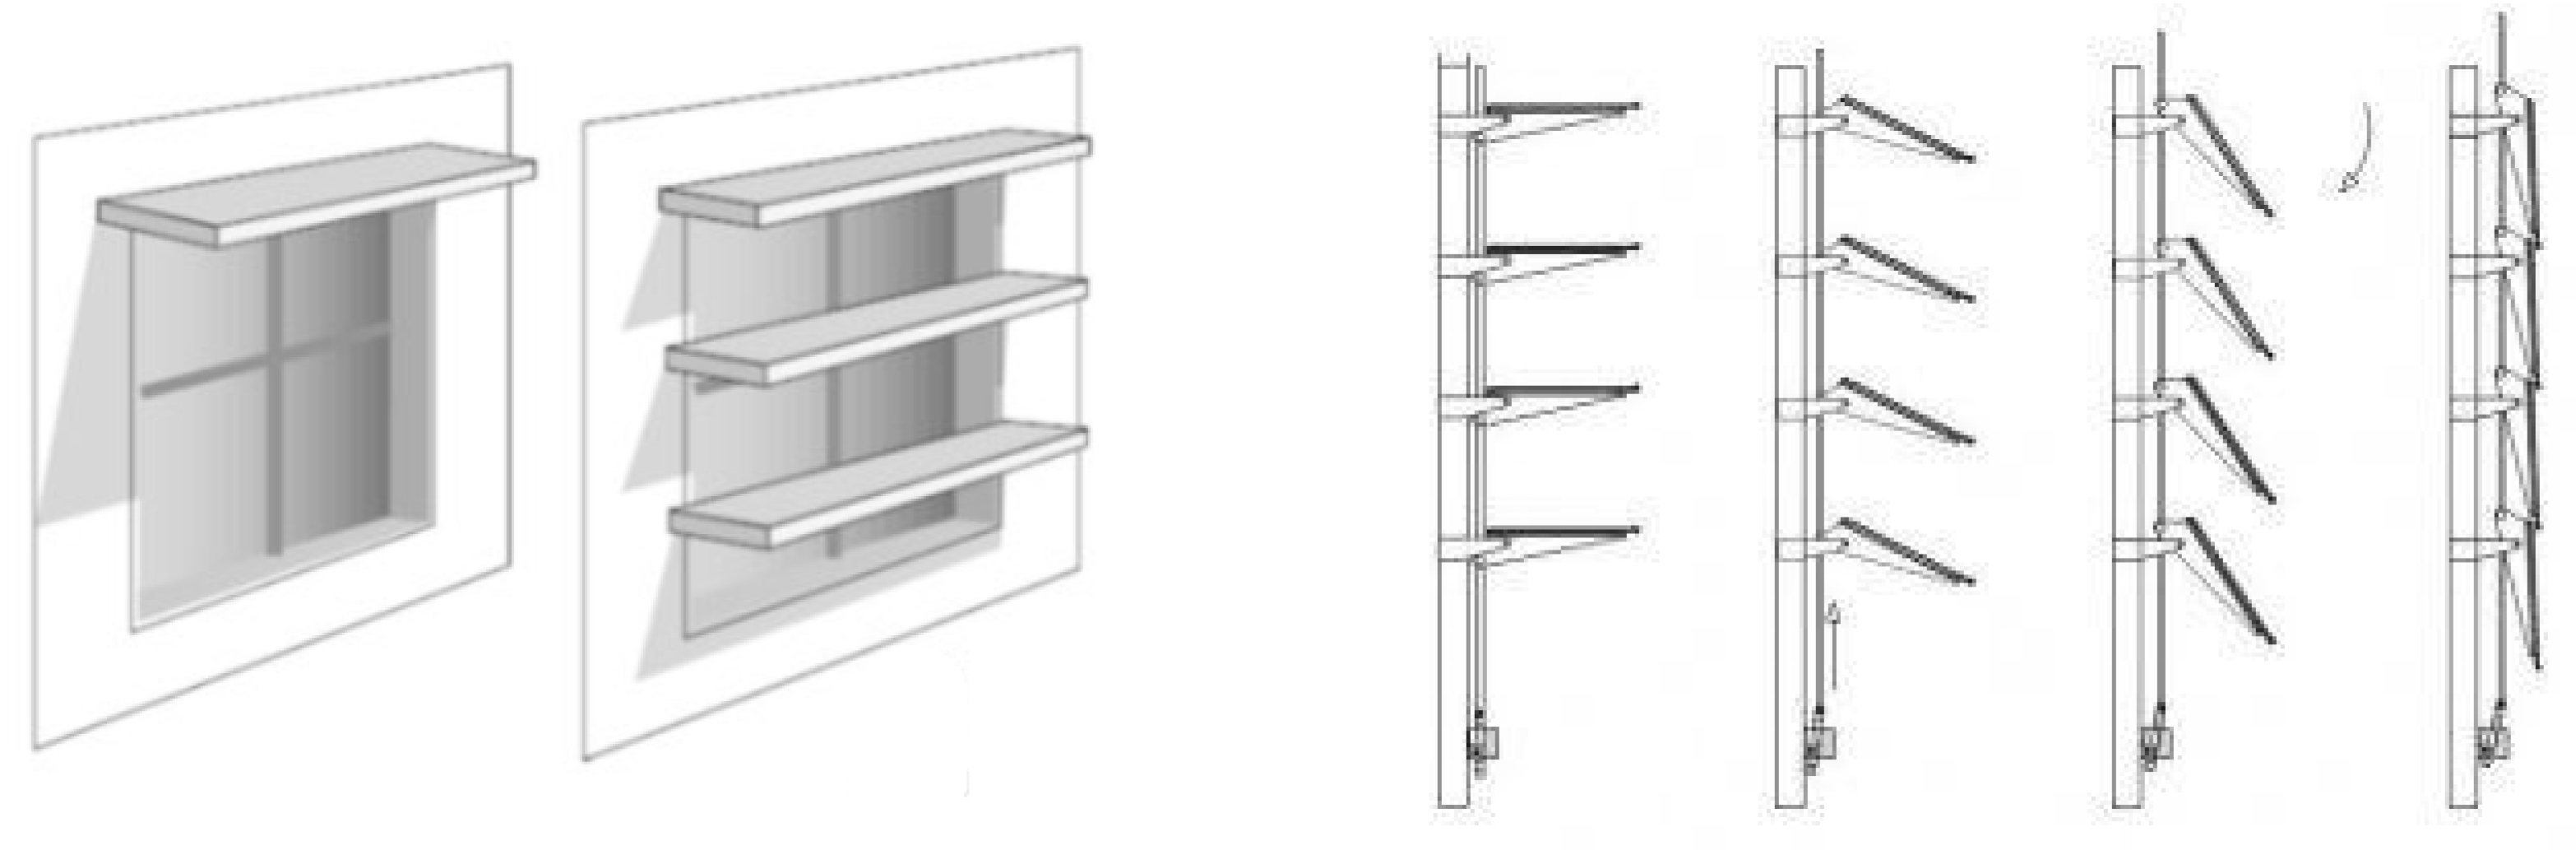
3.1. Parametric Form Generation
- Area of the room is taken as 24 m2 (with grid system).
- The studied room is placed at 10 m height of the building at the 3rd level.
- The scenario is created based on an urban (inner city) location, which means having surrounding buildings and a main street in front of the room.
- The location is selected as Ankara in Turkey.
- All performance indicators are calculated based on annual climatic conditions.
- The considered room is placed in the middle part, i.e., there are other neighbouring rooms next to the studied room in this paper. Therefore, the room has 3 interior walls and 1 exterior wall.
- The exterior wall has a window whose dimensions are changing, since the window-to-wall (WWR) ratio is one of the decision variables.
- The exterior wall is oriented in a south direction, which also has the main street in front.
- The door is at the side of the corridors and the bathroom is placed next to the door that corresponds to the entrance to the room from the corridors of the main building (Figure 2).
- Double glazing–12 mm air gap–wood joinery;
- Double glazing–16 mm air gap–wood joinery;
- Double glazing–12 mm air gap–PVC joinery;
- Double glazing–16 mm air gap–PVC joinery;
- Low-e double glazing with 12 mm air gap–PVC joinery;
- Low-e double glazing–16 mm air gap–PVC joinery.
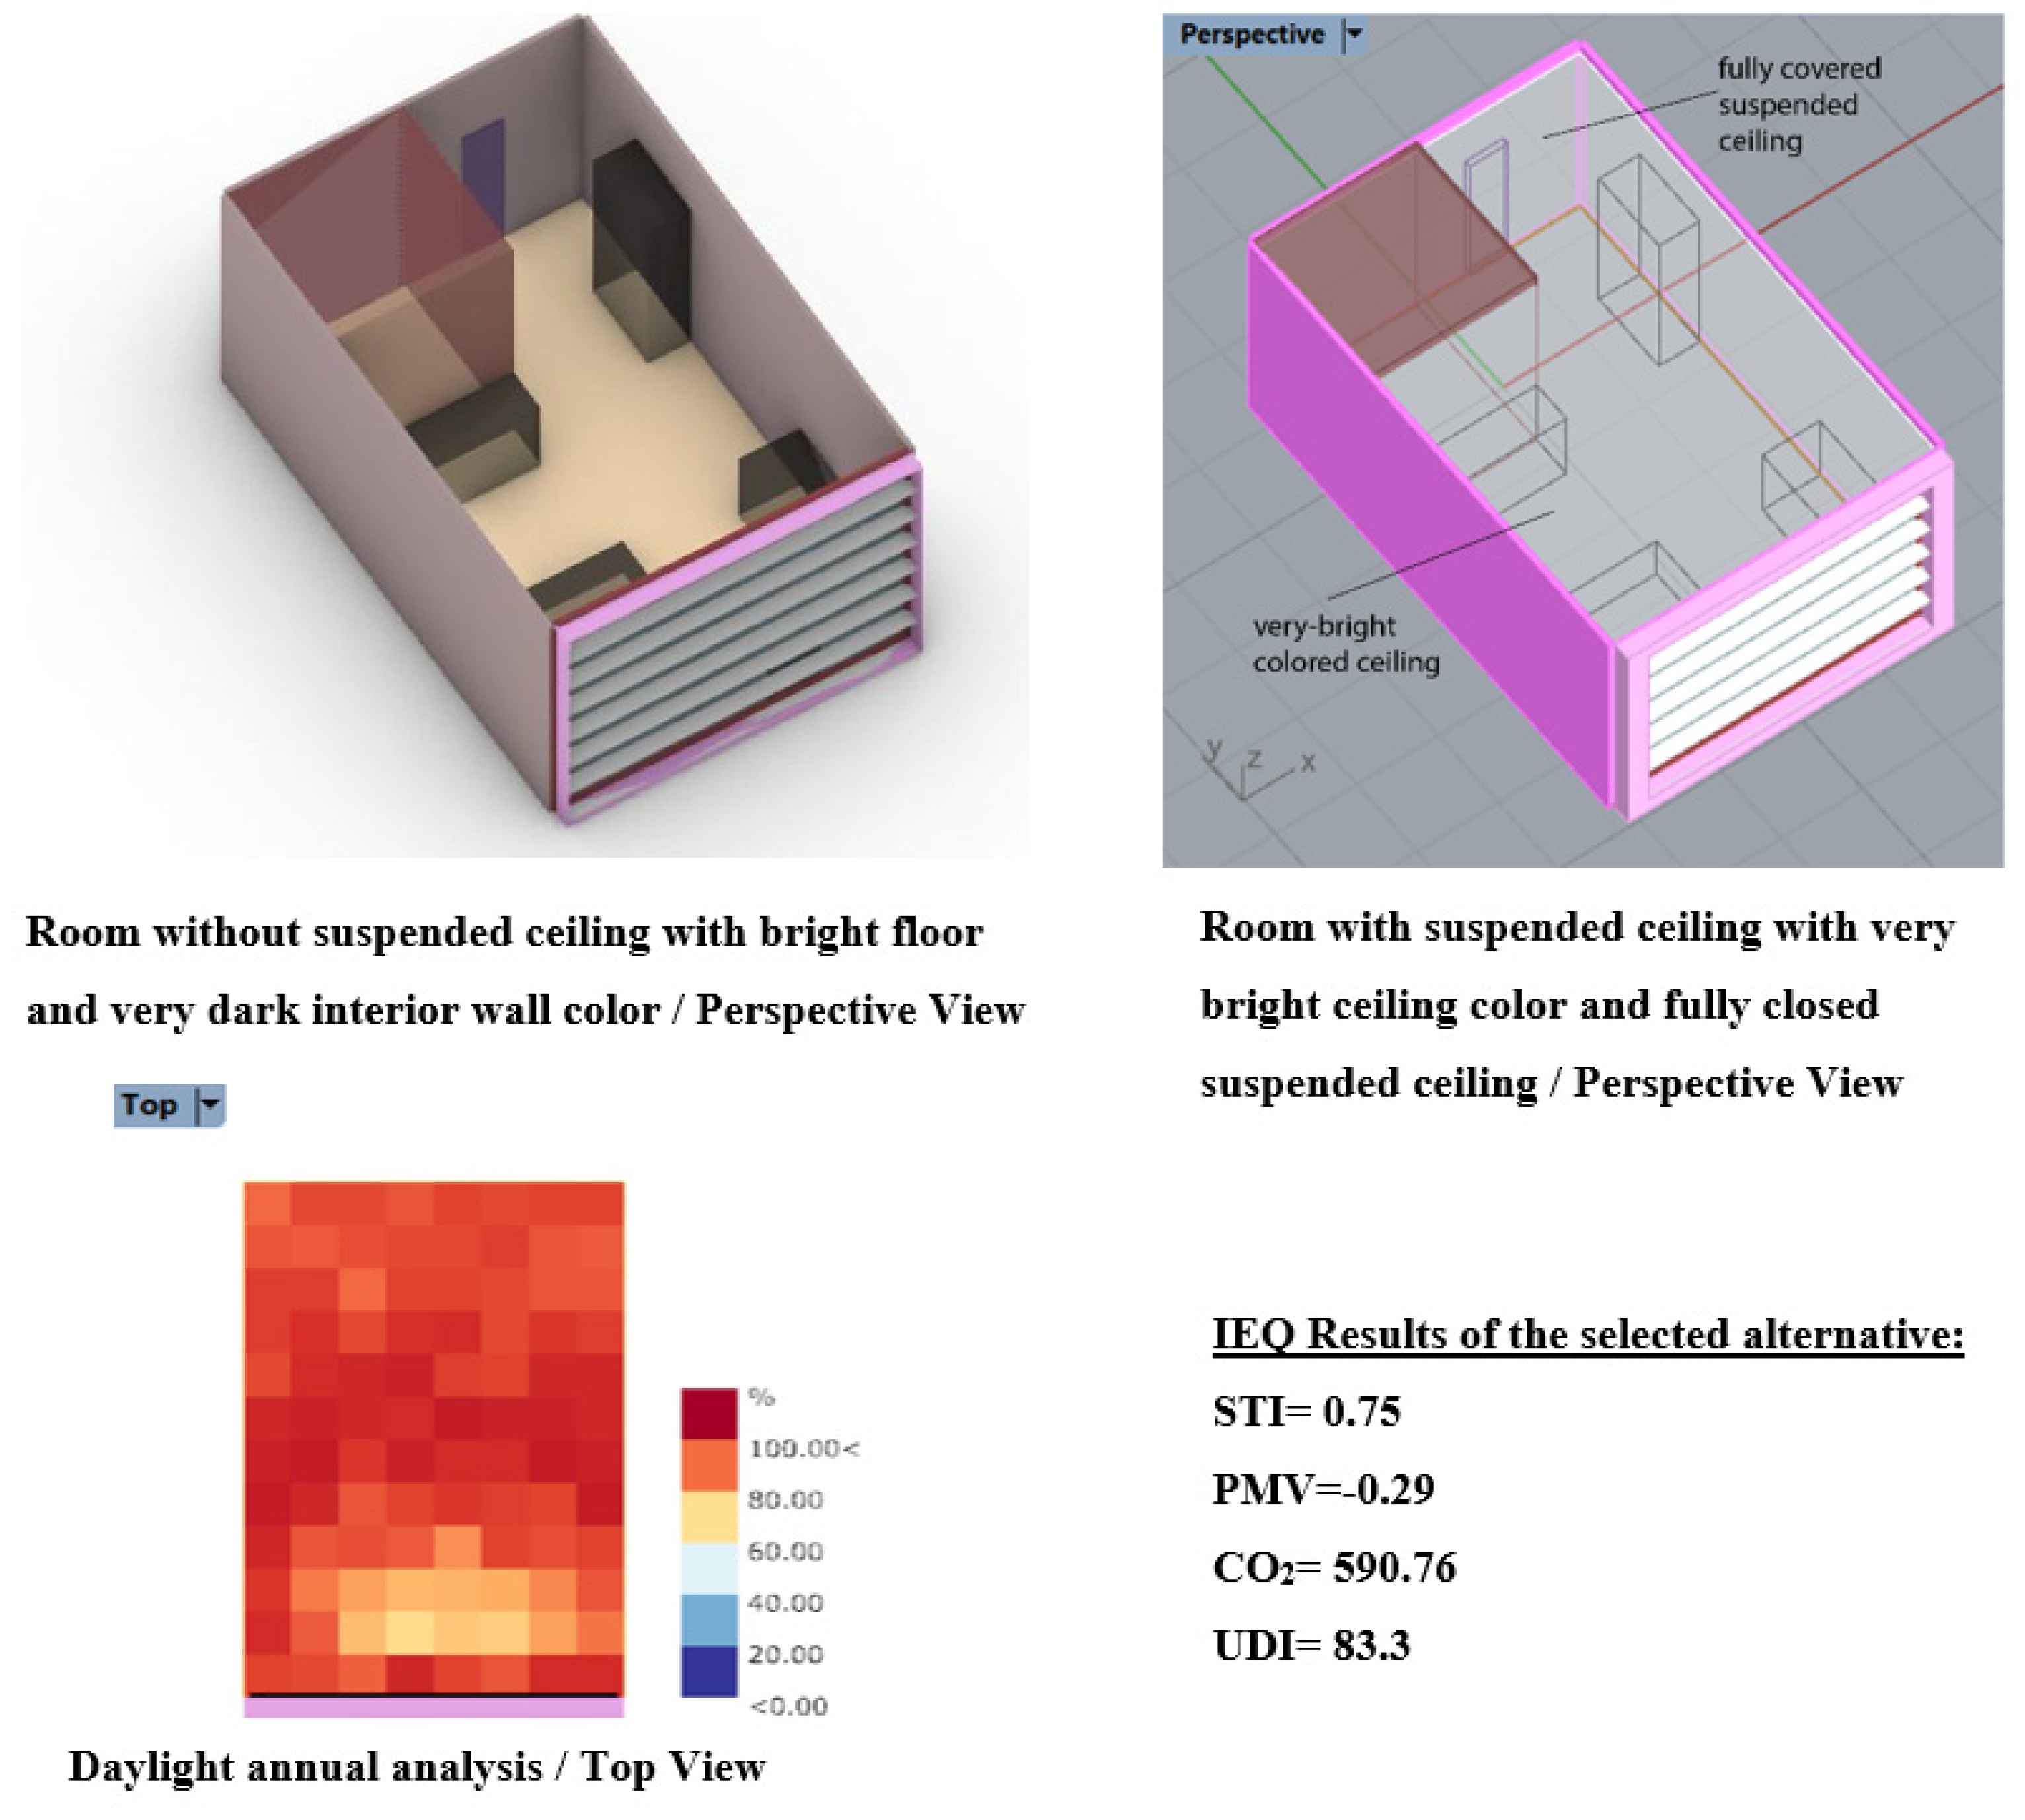
- Ceiling 1: 15 cm ceiling + half 10 mm suspended ceiling;
- Ceiling 2: 15 cm ceiling + full 15 mm additional suspended ceiling;
- Ceiling 3: 15 cm ceiling + no suspended ceiling + 10 mm painted plywood.
3.2. Performance Evaluation for IEQ Parameters
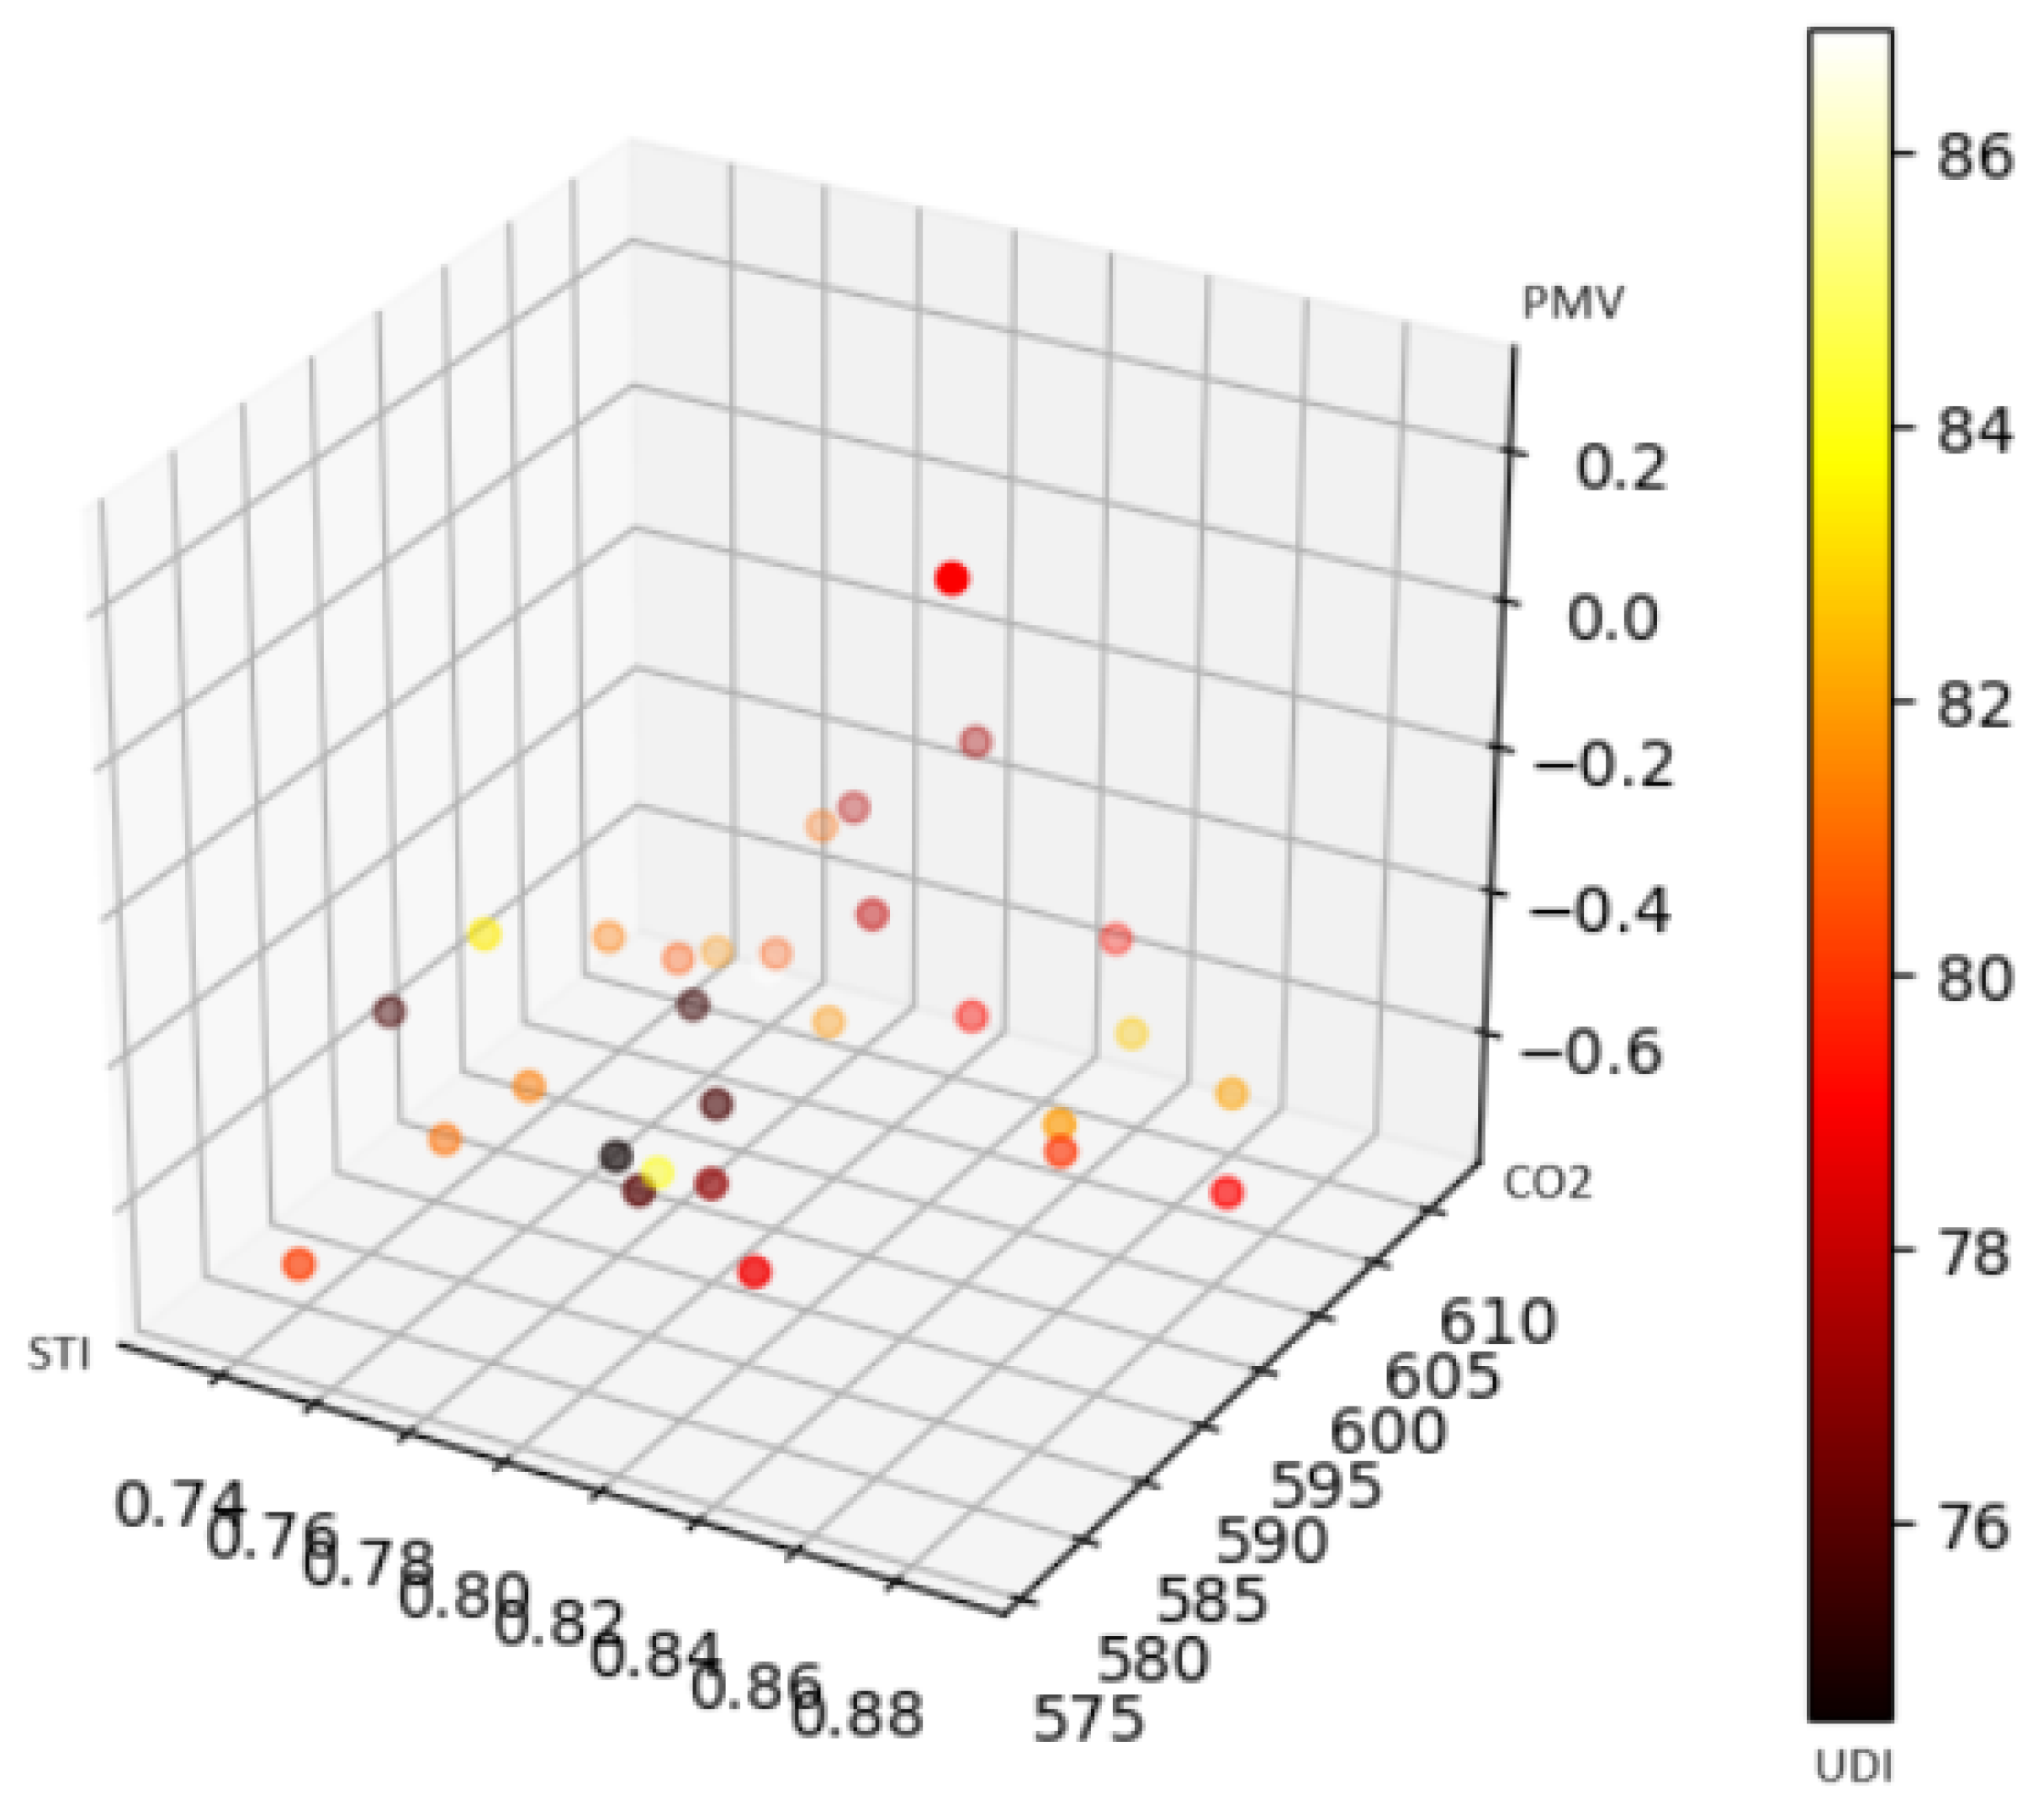
3.2.1. Objective Functions
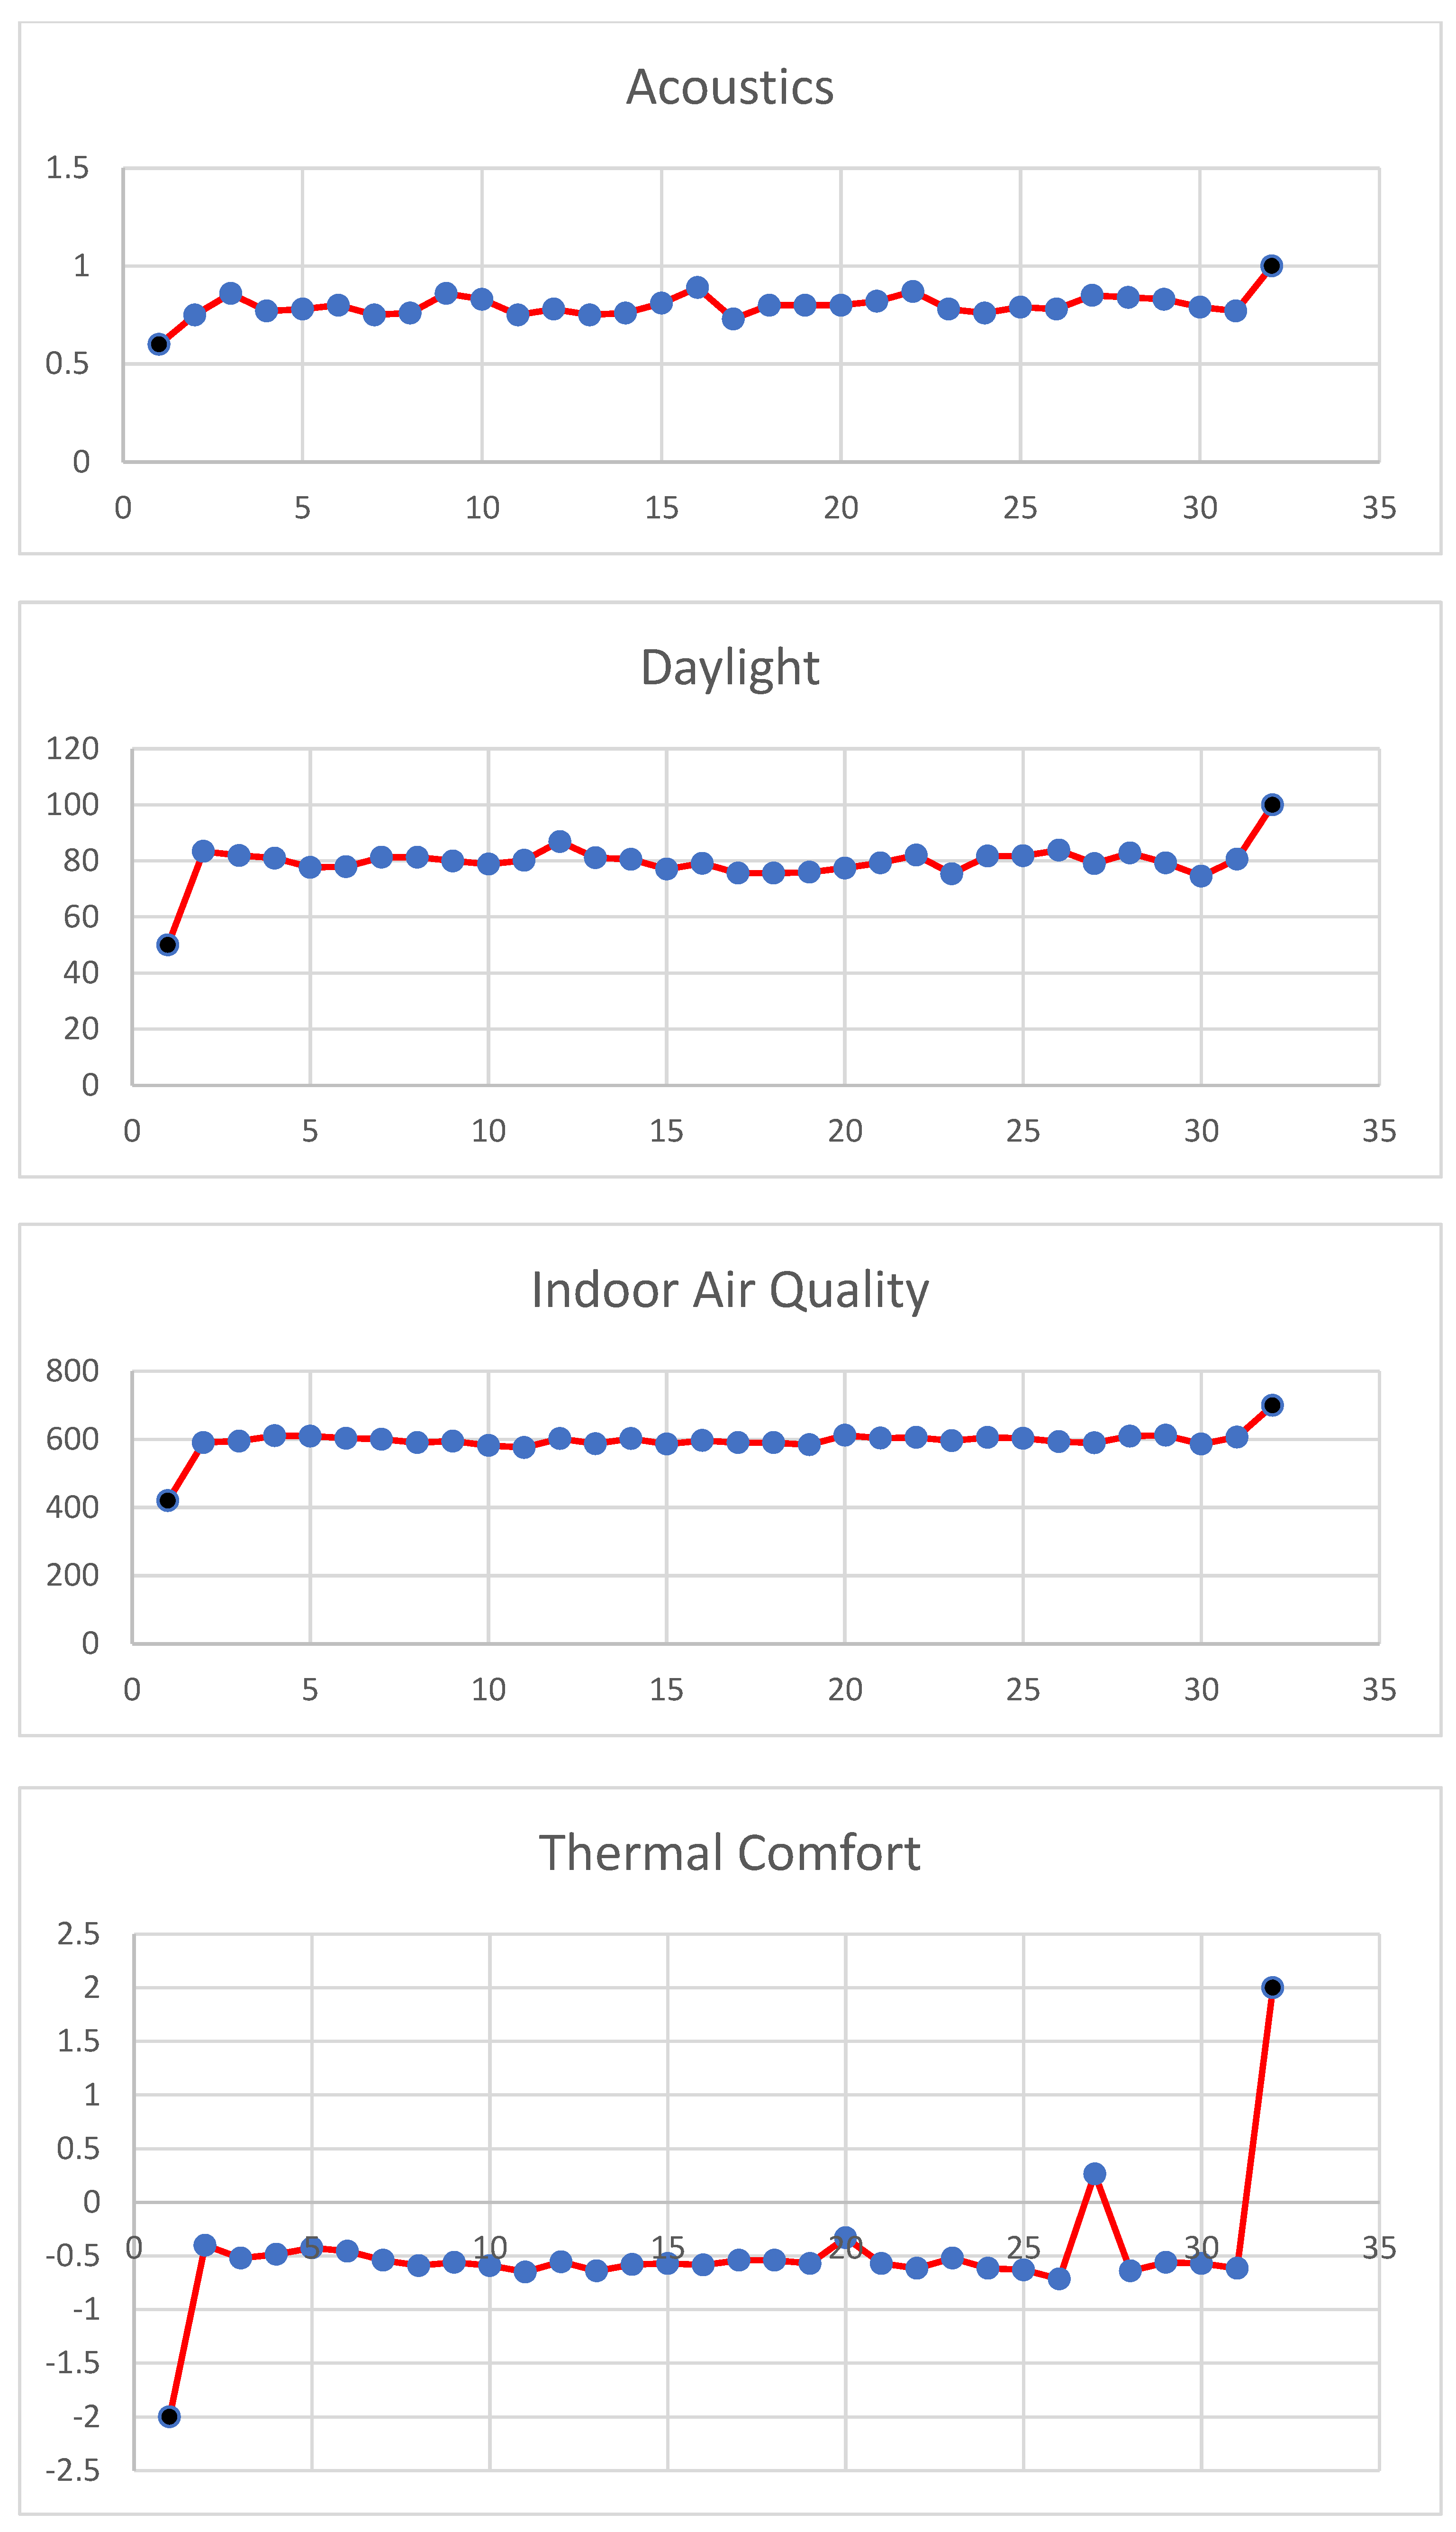
Thermal Comfort: Predicted Mean Vote (PMV)
- Air speed (the velocity of air circulating through the building zone);
- Internal air temperature (can be measured by dry bulb temperature);
- Mean radiant temperature (the average amount of heat that is radiated into the building from surfaces);
- Relative humidity (how much moisture vapour is in the air as a percentage).
- In addition, it uses two expected parameters:
- Activity rate (can be expected by using the metabolism rate and external work of the user);
- Clothing level (the amount and type of clothing and the ratio of exposed/unexposed skin, e.g., 0.25 clo can be T-shirt and shorts).
Daylight Comfort: Useful Daylight Illuminance (UDI)
Acoustics Comfort: Speech Transmission Index (STI)
Indoor Air Quality: CO2 Concentration
3.2.2. Weighted Summation of IEQ
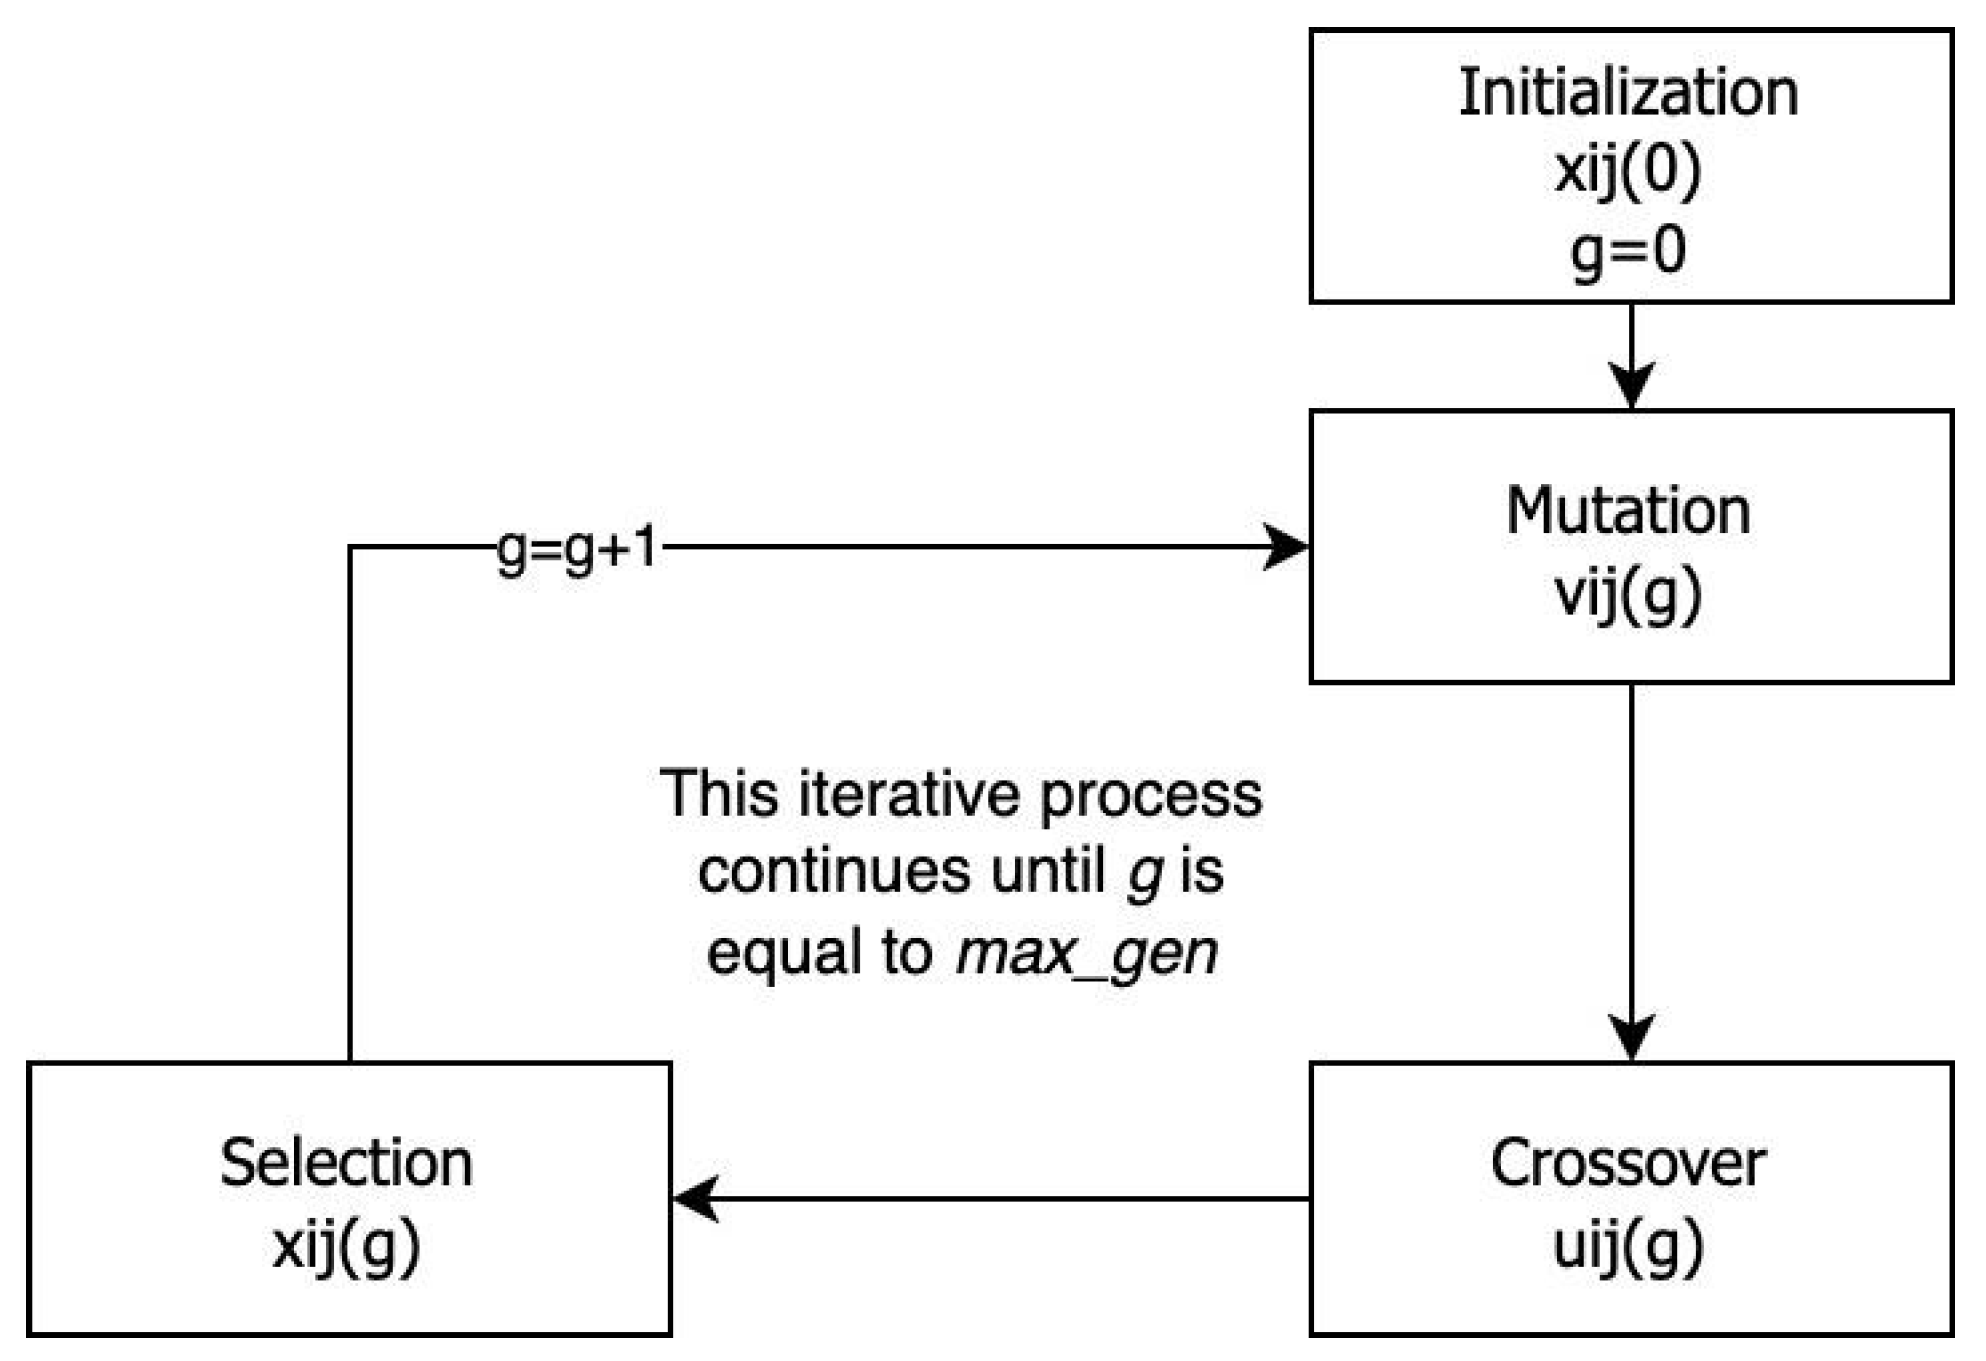
3.3. Optimisation Algorithm
4. Results
4.1. Computational Results
4.2. Discussion on Architectural Results
5. Conclusions
6. Limitations and Future Work
Author Contributions
Funding
Acknowledgments
Conflicts of Interest
References
- Meade, R.D.; Akerman, A.P.; Notley, S.R.; McGinn, R.; Poirier, P.; Gosselin, P.; Kenny, G.P. Physiological factors characterizing heat-vulnerable older adults: A narrative review. Environ. Int. 2020, 144, 105909. [Google Scholar] [CrossRef]
- Kutsal, G. Spatial Priorities of Older Adults for Social Participation in a Senior Center. Master’s Thesis, İhsan Doğramacı Bilkent University, Ankara, Türkiye, 2016. [Google Scholar]
- Bluyssen, P.M. The Indoor Environment Handbook; Earthscan: London, UK, 2009. [Google Scholar]
- Caniato, M.; Zaniboni, L.; Marzi, A.; Gasparella, A. Evaluation of the main sensitivity drivers in relation to indoor comfort for individuals with autism spectrum disorder. Part 2: Influence of age, co-morbidities, gender and type of respondent on the stress caused by specific environmental stimuli. Energy Rep. 2022, 8, 2989–3001. [Google Scholar] [CrossRef]
- Buildings Performance Institute Europe. How to Integrate Indoor Environmental Quality within National Long-Term Renovation Strategies; Buildings Performance Institute Europe: Brussels, Belgium, 2019. [Google Scholar]
- Pinto, M.; Lanzinha, J.; Viegas, J.; Infante, C.; Freire, T. Quality of the Indoor Environment in Elderly Care Centers in Two Cities in Central Portugal: Viseu and Covilhã. Int. J. Environ. Res. Public Health 2019, 16, 3801. [Google Scholar] [CrossRef]
- Belo, J.; Carreiro-Martins, P.; Papoila, A.L.; Palmeiro, T.; Caires, I.; Alves, M.; Nogueira, S.; Aguiar, F.; Mendes, A.; Cano, M.; et al. The impact of indoor air quality on respiratory health of older people living in nursing homes: Spirometric and exhaled breath condensate assessments. J. Environ. Sci. Health Part A 2019, 54, 1153–1158. [Google Scholar] [CrossRef] [PubMed]
- Mendes, A.; Bonassi, S.; Aguiar, L.; Pereira, C.; Neves, P.; Silva, S.; Mendes, D.; Guimarães, L.; Moroni, R.; Teixeira, J.P. Indoor air quality and thermal comfort in elderly care centers. Urban Clim. 2015, 14, 486–501. [Google Scholar] [CrossRef]
- Edrees, A.M.; Kamel, S.; Sabry, H.; Nessim, A. Visual Comfort in Elder Care Facilities: Promoting Environmental Gerontology Theory. In Towards Implementation of Sustainability Concepts in Developing Countries, Advances in Science, Technology & Innovation; Springer International Publishing: Berlin/Heidelberg, Germany, 2021; pp. 227–241. [Google Scholar] [CrossRef]
- Guerry, E.; Gălățanu, C.D.; Canale, L.; Zissis, G. Luminance Contrast Assessment for Elderly Visual Comfort Using Imaging Measurements. Procedia Manuf. 2019, 32, 474–479. [Google Scholar] [CrossRef]
- Davies, W.J.; Cox, T.J.; Kearon, A.T.; Longhurst, B.J.; Webb, C.L. Towards Room Acoustics for an Elderly Population. Proc. Inst. Acoust. 2000, 22, 459–466. Available online: http://usir.salford.ac.uk/2439/ (accessed on 3 July 2022).
- Gordon-Salant, S. Hearing loss and aging: New research findings and clinical implications. J. Rehabilit. Res. Dev. 2005, 42, 9–24. [Google Scholar] [CrossRef]
- Hughes, C.; Natarajan, S. Summer thermal comfort and overheating in the elderly. Build. Serv. Eng. Res. Technol. 2019, 40, 426–445. [Google Scholar] [CrossRef]
- Hughes, C.; Natarajan, S.; Liu, C.; Chung, W.J.; Herrera, M. Winter thermal comfort and health in the elderly. Energy Policy 2019, 134, 110954. [Google Scholar] [CrossRef]
- Jiao, Y.; Yu, H.; Yu, Y.; Wang, Z.; Wei, Q. Adaptive thermal comfort models for homes for older people in Shanghai, China. Energy Build. 2020, 215, 109918. [Google Scholar] [CrossRef]
- Tao, Y.X.; Zhu, Y.; Passe, U. Modeling and data infrastructure for human-centric design and operation of sustainable, healthy buildings through a case study. Build. Environ. 2020, 170, 106518. [Google Scholar] [CrossRef]
- Zuo, Q.; MaloneBeach, E.E. Assessing Staff Satisfaction with Indoor Environmental Quality in Assisted Living Facilities. J. Inter. Des. 2017, 42, 67–84. [Google Scholar] [CrossRef]
- Jin, Y.; Wang, F.; Carpenter, M.; Weller, R.B.; Tabor, D.; Payne, S.R. The effect of indoor thermal and humidity condition on the oldest-old people's comfort and skin condition in winter. Build. Environ. 2019, 174, 106790. [Google Scholar] [CrossRef]
- Mui, K.W.; Wong, L.T.; Fong, K.N.K.; Wong, W.W.Y. Evaluation of Indoor Environment Quality of Elderly Centers of Hong Kong. Int. J. Hous. Sci. 2008, 32, 121–131. [Google Scholar]
- Tsoulou, I.; Andrews, C.J.; He, R.; Mainelis, G.; Senick, J. Summertime thermal conditions and senior resident behaviors in public housing: A case study in Elizabeth, NJ, USA. Build. Environ. 2020, 168, 106411. [Google Scholar] [CrossRef]
- Soble, A.J. Holistic Indoor Environmental Quality & Energy Simulation: Generative Design Assessment Methodology for Heritage Building Retrofits. Ph.D. Thesis, Carleton University, Ottawa, ON, Canada, 2020. [Google Scholar]
- Sinoo, M.M.; van Hoof, J.; Kort, H.S. Light conditions for older adults in the nursing home: Assessment of environmental illuminances and colour temperature. Build. Environ. 2011, 46, 1917–1927. [Google Scholar] [CrossRef]
- Chen, Y.; Fan, J.; Zhou, T. A theoretical approach for therapeutic artificial supplementary lighting in elderly living spaces. Build. Environ. 2021, 197, 107876. [Google Scholar] [CrossRef]
- Delepeleire, J.; Bouwen, A.; Deconinck, L.; Buntinx, F. Insufficient Lighting in Nursing Homes. J. Am. Med. Dir. Assoc. 2007, 8, 314–317. [Google Scholar] [CrossRef]
- Brawley, E.C. Enriching lighting design. NeuroRehabilitation 2009, 25, 189–199. [Google Scholar] [CrossRef]
- Joseph, A.; Choi, Y.-S.; Quan, X. Impact of the Physical Environment of Residential Health, Care, and Support Facilities (RHCSF) on Staff and Residents: A Systematic Review of the Literature. Environ. Behav. 2016, 48, 1203–1241. [Google Scholar] [CrossRef]
- Plischke, H.; Linek, M.; Zauner, J. The opportunities of biodynamic lighting in homes for the elderly: Melanopic measurements and experiences from three senior citizen facilities. Curr. Dir. Biomed. Eng. 2018, 4, 123–126. [Google Scholar] [CrossRef]
- White, M.D.; Ancoli-Israel, S.; Wilson, R.R. Senior Living Environments: Evidence-Based Lighting Design Strategies. Meta-Analysis 2013, 7, 60–78. [Google Scholar] [CrossRef] [PubMed]
- Figueiro, M.G.; Plitnick, B.; Roohan, C.; Sahin, L.; Kalsher, M.; Rea, M.S. Effects of a Tailored Lighting Intervention on Sleep Quality, Rest–Activity, Mood, and Behavior in Older Adults With Alzheimer Disease and Related Dementias: A Randomized Clinical Trial. Sleep Med. 2019, 15, 1757–1767. [Google Scholar] [CrossRef] [PubMed]
- Konis, K.; Mack, W.J.; Schneider, E.L. Pilot study to examine the effects of indoor daylight exposure on depression and other neuropsychiatric symptoms in people living with dementia in long-term care communities. Clin. Interv. Aging 2018, 13, 1071–1077. [Google Scholar] [CrossRef] [PubMed]
- Shen, E.; Hu, J.; Patel, M. Energy and visual comfort analysis of lighting and daylight control strategies. Build. Environ. 2014, 78, 155–170. [Google Scholar] [CrossRef]
- Harris, R.W.; Reitz, M.L. Effects of Room Reverberation and Noise on Speech Discrimination by the Elderly. Int. J. Audiol. 1985, 24, 319–324. [Google Scholar] [CrossRef]
- Leung, M.-Y.; Yu, J.; Chow, H. Impact of indoor facilities management on the quality of life of the elderly in public housing. Facilities 2016, 34, 564–579. [Google Scholar] [CrossRef]
- Ventry, I.; Weinstein, B. The Hearing Handicap Inventory For The Elderly: A New Tool. Ear Hear. 1982, 3, 128–134. [Google Scholar] [CrossRef]
- Yu, J.; Ma, G.; Jiang, X. Impact of the built environment and care services within rural nursing homes in China on quality of life for elderly residents. Eng. Constr. Arch. Manag. 2017, 24, 1170–1183. [Google Scholar] [CrossRef]
- Peng, J.; Zeng, Y.; Zhao, L.; Zeng, J. An investigation of acoustical environments in the elderly care facilities. Appl. Acoust. 2018, 137, 45–50. [Google Scholar] [CrossRef]
- Sloane, P.D.; Mitchell, C.M.; Weisman, G.; Zimmerman, S.; Foley, K.M.L.; Lynn, M.; Calkins, M.; Lawton, M.P.; Teresi, J.; Grant, L.; et al. The Therapeutic Environment Screening Survey for nursing homes (TESS-NH): An observational instrument for assessing the physical environment of institutional settings for persons with dementia. Res. Pract. Alzheimers Dis. 2003, 7, 138–145. [Google Scholar]
- Berglund, B.; Lindvall, T.; Schwela, D.H. Guidelines for Community Noise. In Noise & Vibration Worldwide; World Health Organization: Geneva, Switzerland, 1995; Volume 31, pp. 1–141. Available online: http://multi-science.metapress.com/openurl.asp?genre=article&id=doi:10.1260/0957456001497535 (accessed on 23 April 2021).
- Potter, R.; Sheehan, B.; Cain, R.; Griffin, J.; Jennings, P.A. The Impact of the Physical Environment on Depressive Symptoms of Older Residents Living in Care Homes: A Mixed Methods Study. Gerontologist 2018, 58, 438–447. [Google Scholar] [CrossRef]
- Jonsson, O.; Östlund, B.; Warell, A.; Hornyánszky, E.D. Furniture in Swedish Nursing Homes: A Design Perspective on Perceived Meanings within the Physical Environment. J. Inter. Des. 2014, 39, 17–35. [Google Scholar] [CrossRef]
- AANSI/ASHRAE Standard 55-2017; Thermal Environmental Conditions for Human Occupancy: ANSI/ASHRAE Standard 55-2017 (Supersedes ANSI/ASHRAE Standard 55-2013) Includes ANSI/ASHRAE Addenda Listed in Appendix N. ASHRAE: Peachtree Corners, GA, USA, 2017.
- Schellen, L.; Lichtenbelt, W.D.V.M.; Loomans, M.G.L.C.; Toftum, J.; De Wit, M.H. Differences between young adults and elderly in thermal comfort, productivity, and thermal physiology in response to a moderate temperature drift and a steady-state condition. Indoor Air 2010, 20, 273–283. [Google Scholar] [CrossRef] [PubMed]
- Enomoto-Koshimizu, H.; Isoda, N.; Yanase, T. Effect of the Radiant Heating on the Elderly. In Proceedings of the 13th Triennial Congress of the International Ergonomics Association, Tampere, Finland, 29 June–4 July 1997; pp. 433–435. [Google Scholar]
- Van Hoof, J.; Hensen, J. Thermal comfort and older adults. Gerontechnology 2006, 4, 223–228. [Google Scholar] [CrossRef]
- Garssen, J.; Harmsen, C.; De Beer, J. The effect of the summer 2003 heat wave on mortality in the Netherlands. Eurosurveillance 2005, 10, 165–168. [Google Scholar] [CrossRef]
- van Hoof, J.; Kort, H.; Hensen, J.; Duijnstee, M.; Rutten, P. Thermal comfort and the integrated design of homes for older people with dementia. Build. Environ. 2010, 45, 358–370. [Google Scholar] [CrossRef]
- Fan, G.; Xie, J.; Yoshino, H.; Yanagi, U.; Hasegawa, K.; Wang, C.; Zhang, X.; Liu, J. Investigation of indoor thermal environment in the homes with elderly people during heating season in Beijing, China. Build. Environ. 2017, 126, 288–303. [Google Scholar] [CrossRef]
- Jiao, Y.; Yu, H.; Wang, T.; An, Y.; Yu, Y. Thermal comfort and adaptation of the elderly in free-running environments in Shanghai, China. Build. Environ. 2017, 118, 259–272. [Google Scholar] [CrossRef]
- Jin, Y.; Wang, F.; Payne, S.R.; Weller, R.B. A comparison of the effect of indoor thermal and humidity condition on young and older adults' comfort and skin condition in winter. Indoor Built Environ. 2022, 31, 759–776. [Google Scholar] [CrossRef]
- Cena, K.M.; Spotila, J.R.; Ryan, E.B. Effect of Behavioral Strategies and Activity on Thermal Comfort of the Elderly; Drexel University: Philadelphia, PA, USA, 1988. [Google Scholar]
- Unlu, F.; Yıldırım, K. Exploring the Knowledge Level of Interior Architecture and Environmental Design Students’ on Indoor Air Pollutants. MEGARON/Yıldız Tech. Univ. Fac. Archit. E-J. 2016, 10, 622–636. [Google Scholar] [CrossRef]
- Marques, G.; Pitarma, R. Indoor Air Quality Monitoring for Enhanced Healthy Buildings. In Indoor Environmental Quality; BoD—Books on Demand: Norderstedt, Germany, 2018; pp. 137–144. Available online: https://www.intechopen.com/books/advanced-biometric-technologies/liveness-detection-in-biometrics (accessed on 9 June 2023).
- Laurini, E.; De Vita, M.; De Berardinis, P. Monitoring the Indoor Air Quality: A Case Study of Passive Cooling from Historical Hypogeal Rooms. Energies 2021, 14, 2513. [Google Scholar] [CrossRef]
- Mata, T.M.; Felgueiras, F.; Martins, A.A.; Monteiro, H.; Ferraz, M.P.; Oliveira, G.M.; Gabriel, M.F.; Silva, G.V. Indoor Air Quality in Elderly Centers: Pollutants Emission and Health Effects. Environments 2022, 9, 86. [Google Scholar] [CrossRef]
- Scialla, P. Healthy Aging and the Critical Importance of Indoor Air Quality. McKnights Senior Living, 2022. Available online: https://www.mcknightsseniorliving.com/home/resources/partner-content/healthy-aging-and-the-critical-importance-of-indoor-air-quality/ (accessed on 30 April 2023).
- Piasecki, M.; Kostyrko, K.; Pykacz, S. Indoor environmental quality assessment: Part 1: Choice of the indoor environmental quality sub-component models. J. Build. Phys. 2017, 41, 264–289. [Google Scholar] [CrossRef]
- Chiang, C.M.; Chou, P.C.; Lai, C.M.; Li, Y.Y. A Methodology to Assess the Indoor Environment in Care Centers for Senior Citi-zens. Build. Environ. 2001, 36, 561–568. Available online: www.elsevier.com/locate/buildenv (accessed on 12 July 2021).
- Ncube, M.; Riffat, S. Developing an indoor environment quality tool for assessment of mechanically ventilated office buildings in the UK—A preliminary study. Build. Environ. 2012, 53, 26–33. [Google Scholar] [CrossRef]
- Cao, B.; Ouyang, Q.; Zhu, Y.; Huang, L.; Hu, H.; Deng, G. Development of a multivariate regression model for overall satisfaction in public buildings based on field studies in Beijing and Shanghai. Build. Environ. 2012, 47, 394–399. [Google Scholar] [CrossRef]
- Heinzerling, D.; Schiavon, S.; Webster, T.; Arens, E. Indoor environmental quality assessment models: A literature review and a proposed weighting and classification scheme. Build. Environ. 2013, 70, 210–222. [Google Scholar] [CrossRef]
- Leccese, F.; Rocca, M.; Salvadori, G.; Belloni, E.; Buratti, C. Towards a holistic approach to indoor environmental quality assessment: Weighting schemes to combine effects of multiple environmental factors. Energy Build. 2021, 245, 111056. [Google Scholar] [CrossRef]
- Ekici, B.; Cubukcuoglu, C.; Turrin, M.; Sariyildiz, I.S. Performative computational architecture using swarm and evolutionary optimisation: A review. Build. Environ. 2019, 147, 356–371. [Google Scholar] [CrossRef]
- Abay, Z.G.; Ünver, R. Yaşlılıkta Görsel Konfor ve Huzurevi Örneği İncelemesi. In Proceedings of the IX. Ulusal Aydınlatma Sempozyumu, Izmir, Turkiye, 18–19 October 2017; pp. 131–138. [Google Scholar]
- ANSI/ASHRAE 55:2013; Thermal Environmental Conditions for Human Occupancy. ANSI/ASHRAE: Atlanta, GA, USA, 2013; Volume 2013. [CrossRef]
- ASHRAE Handbook Committee. ASHRAE Fundamental Handbook; ASHRAE Handbook Committee: Atlanta, GA, USA, 2001. [Google Scholar]
- ISO 7730 2005-11-15; Ergonomics of the Thermal Environment: Analytical Determination and Interpretation of Thermal Comfort Using Calculation of the PMV and PPD Indices and Local Thermal Comfort Criteria. International Organization for Standardization: Geneva, Switzerland, 2005.
- Mardaljevic, J.; Andersen, M.; Roy, N.; Christoffersen, J. Daylighting Metrics: Is There a Relation between Useful Daylight Illuminance and Daylight glare Probability? VELUX A/S, Adalsvej. In Proceedings of the Building Simulation and Optimization Conference BSO12, Loughborough, UK, 10–11 September 2012; Available online: https://infoscience.epfl.ch/record/179939?ln=en (accessed on 3 July 2023).
- Nabil, A.; Mardaljevic, J. Useful daylight illuminances: A replacement for daylight factors. Energy Build. 2006, 38, 905–913. [Google Scholar] [CrossRef]
- Zomorodian, Z.S.; Tahsildoost, M. Assessing the effectiveness of dynamic metrics in predicting daylight availability and visual comfort in classrooms Window to Wall Ratio. Renew. Energy 2018, 134, 669–680. [Google Scholar] [CrossRef]
- Brzezicki, M.; Regucki, P.; Kasperski, J. Optimization of Useful Daylight Illuminance for Vertical Shading Fins Covered by Photovoltaic Panels for a Case Study of an Office Room in the City of Wroclaw, Poland. Buildings 2021, 11, 637. [Google Scholar] [CrossRef]
- Ward, G.; Shakespeare, R. Rendering with Radiance: The Art and Science of Lighting Visualization; Morgan Kaufmann Publishers Inc.: Burlington, MA, USA, 1998. [Google Scholar]
- Mardaljevic, J.; Nabil, A. The Useful Daylight Illuminance Paradigm: A Replacement for Daylight Factors; The Gateway: Leicester, UK, 2005. [Google Scholar]
- van Schoonhoven, J.; Rhebergen, K.S.; Dreschler, W.A. Towards measuring the Speech Transmission Index in fluctuating noise: Accuracy and limitations. J. Acoust. Soc. Am. 2017, 141, 818–827. [Google Scholar] [CrossRef]
- Bain-Reguis, N.; Smith, A.; Martin, C.H.; Currie, J. Indoor CO2 and Thermal Conditions in Twenty Scottish Primary School Classrooms with Different Ventilation Systems during the COVID-19 Pandemic. Pollutants 2022, 2, 180–204. [Google Scholar] [CrossRef]
- ASHRAE Board of Directors. ASHRAE Position Document on Indoor Carbon Dioxide; ASHRAE: Peachtree Corners, GA, USA, 2022; Available online: https://www.ashrae.org/file library/about/position documents/pd_indoorcarbondioxide_2022.pdf (accessed on 1 June 2023).
- Marr, L.; Miller, S.; Prather, K.; Haas, C.; Bahnfleth, W.; Corsi, R.; Tang, J.; Herrmann, H.; Pollitt, K.; Ballester, J.; et al. FAQs on Protecting Yourself from COVID-19 Aerosol Transmission. 2021. Available online: https://tinyurl.com/FAQ-aerosols (accessed on 9 June 2023).
- Ascione, F.; Bianco, N.; De Masi, R.F.; De’rossi, F.; Vanoli, G.P. Energy retrofit of an educational building in the ancient center of Benevento. Feasibility study of energy savings and respect of the historical value. Energy Build. 2015, 95, 172–183. [Google Scholar] [CrossRef]
- Storn, R.; Price, K. Differential evolution—A simple and efficient heuristic for global optimization over continuous spaces. J. Glob. Optim. 1997, 11, 341–359. [Google Scholar] [CrossRef]
- Brest, J.; Greiner, S.; Boskovic, B.; Mernik, M.; Zumer, V. Self-adapting control parameters in differential evolution: A compar-ative study on numerical benchmark problems. IEEE Trans. Evol. Comput. 2006, 10, 646–657. [Google Scholar] [CrossRef]
- Mallipeddi, R.; Suganthan, P.; Pan, Q.; Tasgetiren, M. Differential evolution algorithm with ensemble of parameters and mutation strategies. Appl. Soft Comput. 2011, 11, 1679–1696. [Google Scholar] [CrossRef]
- Cubukcuoglu, C.; Ekici, B.; Tasgetiren, M.F.; Sariyildiz, S. OPTIMUS: Self-adaptive differential evolution with ensemble of mu-tation strategies for grasshopper algorithmic modeling. Algorithms 2019, 12, 141. [Google Scholar] [CrossRef]


| Design Variable | Notation | Unit | Variable Type | Range |
|---|---|---|---|---|
| Shading Device Angle | degree | continuous | ||
| Glazing Ratio | percentage | continuous | ||
| Blind Position | position | discrete | ||
| Suspended Ceiling Type | number | discrete | ||
| Dry Bulb Temperature Summer | degree | continuous | [23–27] | |
| Dry Bulb Temperature Winter | degree | continuous | [20–22.5] | |
| Relative Humidity Summer | percentage | continuous | [30–60] | |
| Relative Humidity winter | percentage | continuous | [30–60] | |
| Interior Wall Type | number | discrete | ||
| Glazing Type | number | discrete | ||
| Exterior Wall Type | number | discrete | ||
| Interior Wall Colour | number | discrete | ||
| Floor Colour | number | discrete | ||
| Ceiling Colour | number | discrete | ||
| Lighting Density | kWh/m2 | continuous | [3–30] |
| Rep.1 | Rep.2 | Rep.3 | Rep.4 | Rep.5 | Min | Max | Avg | Std.Dev | |
|---|---|---|---|---|---|---|---|---|---|
| 0.7213 | 0.7077 | 0.7274 | 0.7236 | 0.7134 | 0.7077 | 0.7274 | 0.7187 | 0.007993 | |
| Elderly Room Result |  | 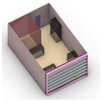 |  |  |  |
| Design Variable | Result |
|---|---|
| Shading device angle | 0 |
| Glazing Ratio | 0.74 |
| Blind Position | 0: horizontal |
| Suspended Ceiling Type | 1: fully covered |
| Dry Bulb Temperature Summer | 26 |
| Dry Bulb Temperature Winter | 22.5 |
| Relative Humidity Summer | 60 |
| Relative Humidity winter | 59.9 |
| Interior Wall Type | 2 |
| Glazing Type | 0 |
| Exterior Wall Type | 15 |
| Interior Wall Colour | 0: very dark_20% reflectance value |
| Floor Colour | 2: bright_30% reflectance value |
| Ceiling Colour | 4: very bright_90% reflectance value |
| Lighting Density | 26.36 |
| Wall 15-EPS (40 mm-u:0.035 W/mK-Brick Exterior Wall with Thermal Insulation Material | |
| 1. Layer | Lime mortar, lime-cement mortar |
| 2. Layer | Walls made with AB grade bricks using regular mortar |
| 3. Layer | Polystyrene-Particle Foam |
| 4. Layer | Lime mortar, lime-cement mortar |
Disclaimer/Publisher’s Note: The statements, opinions and data contained in all publications are solely those of the individual author(s) and contributor(s) and not of MDPI and/or the editor(s). MDPI and/or the editor(s) disclaim responsibility for any injury to people or property resulting from any ideas, methods, instructions or products referred to in the content. |
© 2023 by the authors. Licensee MDPI, Basel, Switzerland. This article is an open access article distributed under the terms and conditions of the Creative Commons Attribution (CC BY) license (https://creativecommons.org/licenses/by/4.0/).
Share and Cite
Cubukcuoglu, C.; Cilasun Kunduraci, A.; Asadollahi Asl Zarkhah, S. Indoor Environmental Quality Optimisation Model for Institutional Care Rooms of Elderly People. Buildings 2023, 13, 2625. https://doi.org/10.3390/buildings13102625
Cubukcuoglu C, Cilasun Kunduraci A, Asadollahi Asl Zarkhah S. Indoor Environmental Quality Optimisation Model for Institutional Care Rooms of Elderly People. Buildings. 2023; 13(10):2625. https://doi.org/10.3390/buildings13102625
Chicago/Turabian StyleCubukcuoglu, Cemre, Arzu Cilasun Kunduraci, and Sahar Asadollahi Asl Zarkhah. 2023. "Indoor Environmental Quality Optimisation Model for Institutional Care Rooms of Elderly People" Buildings 13, no. 10: 2625. https://doi.org/10.3390/buildings13102625