
Simulation Analysis of Supply Chain Resilience of Prefabricated Building Projects Based on System Dynamics
Abstract
:1. Introduction
2. Literature Review
2.1. Prefabricated Building
2.2. Supply Chain Resilience
2.3. Supply Chain Resilience of Prefabricated Building Project
3. Materials and Methods
3.1. Supply Chain Resilience Evaluation System for Prefabricated Building Project
3.2. Analytic Hierarchy Process
- (1)
- Judgment matrix construction and weight value calculation
- (2)
- Weight vector calculation
- (3)
- Consistency test
3.3. System Dynamics Model
- (1)
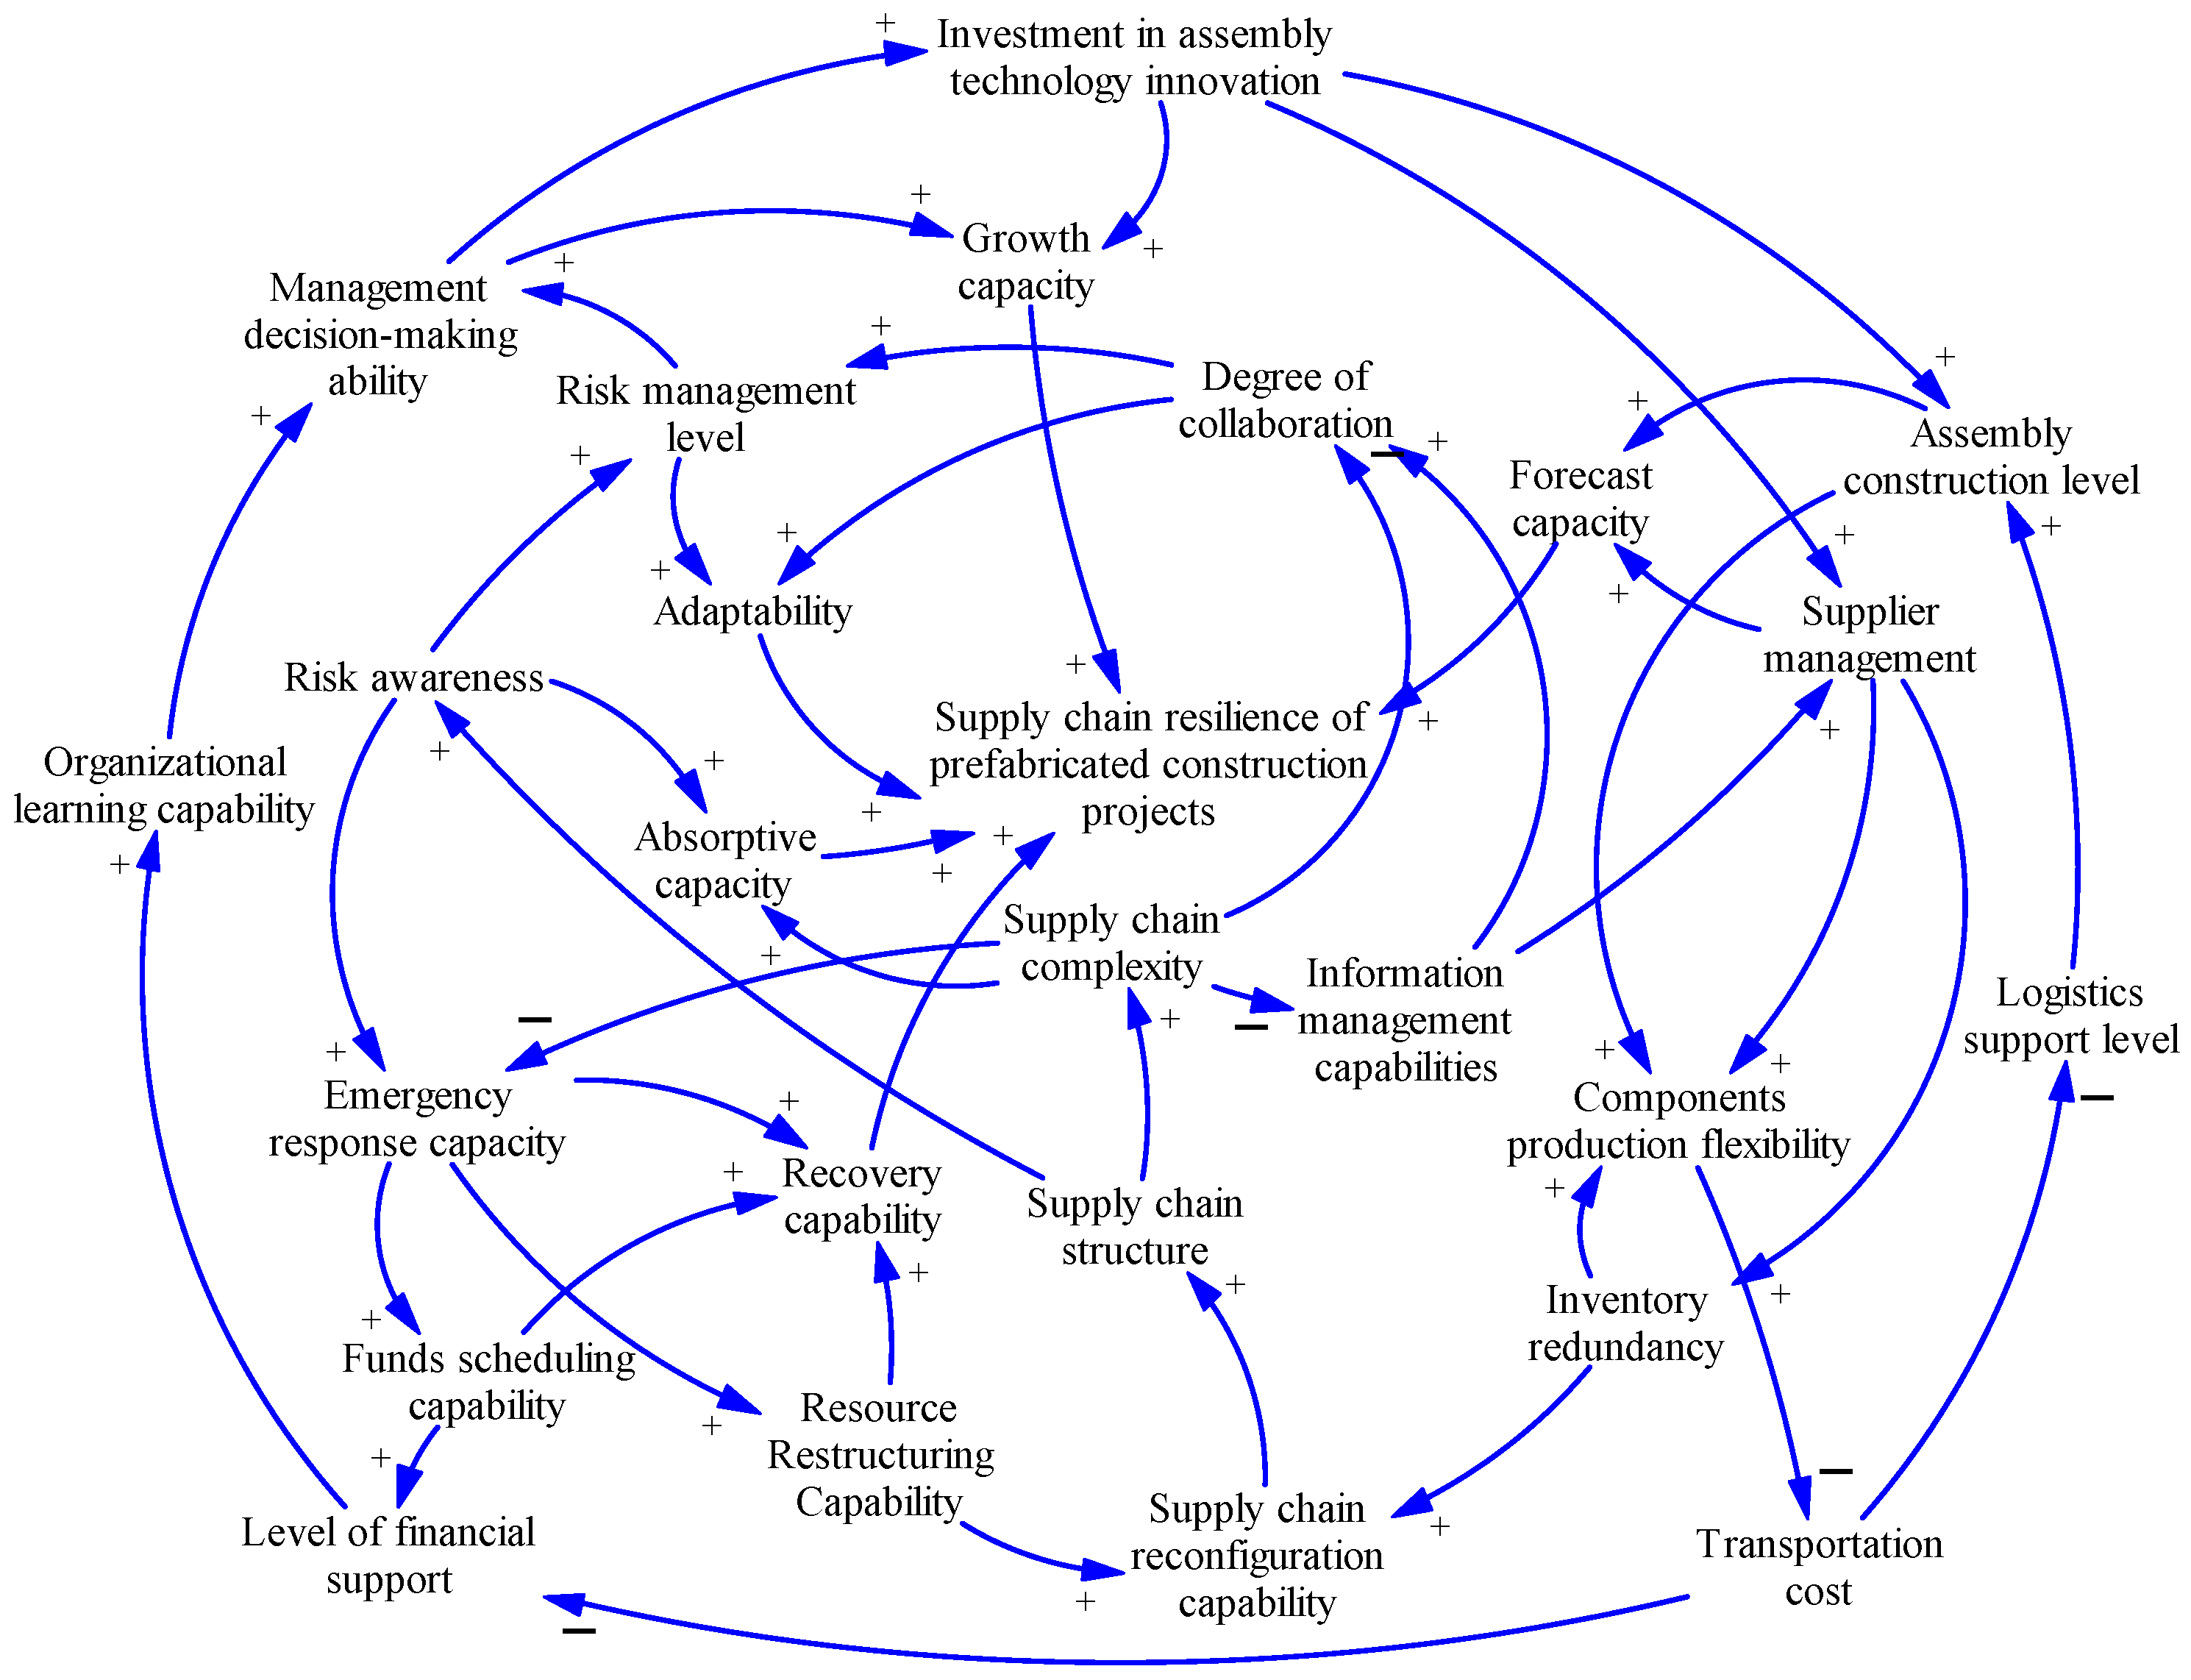
- Causal loop diagram
- (2)
- System stock-flow diagram
- (1)
- State variables
- (2)
- Rate variable
- (3)
- Auxiliary variables and constants
4. Case Analysis and Results
4.1. Project Overview
4.2. Data Processing
- (1)
- Determination of evaluation index weight
- (2)
- Constructing a cause and effect diagram
- (3)
- Constructing stock flow diagrams
- (4)
- Determination of simulation model formula
4.3. Model Imitation and Analysis
- (1)
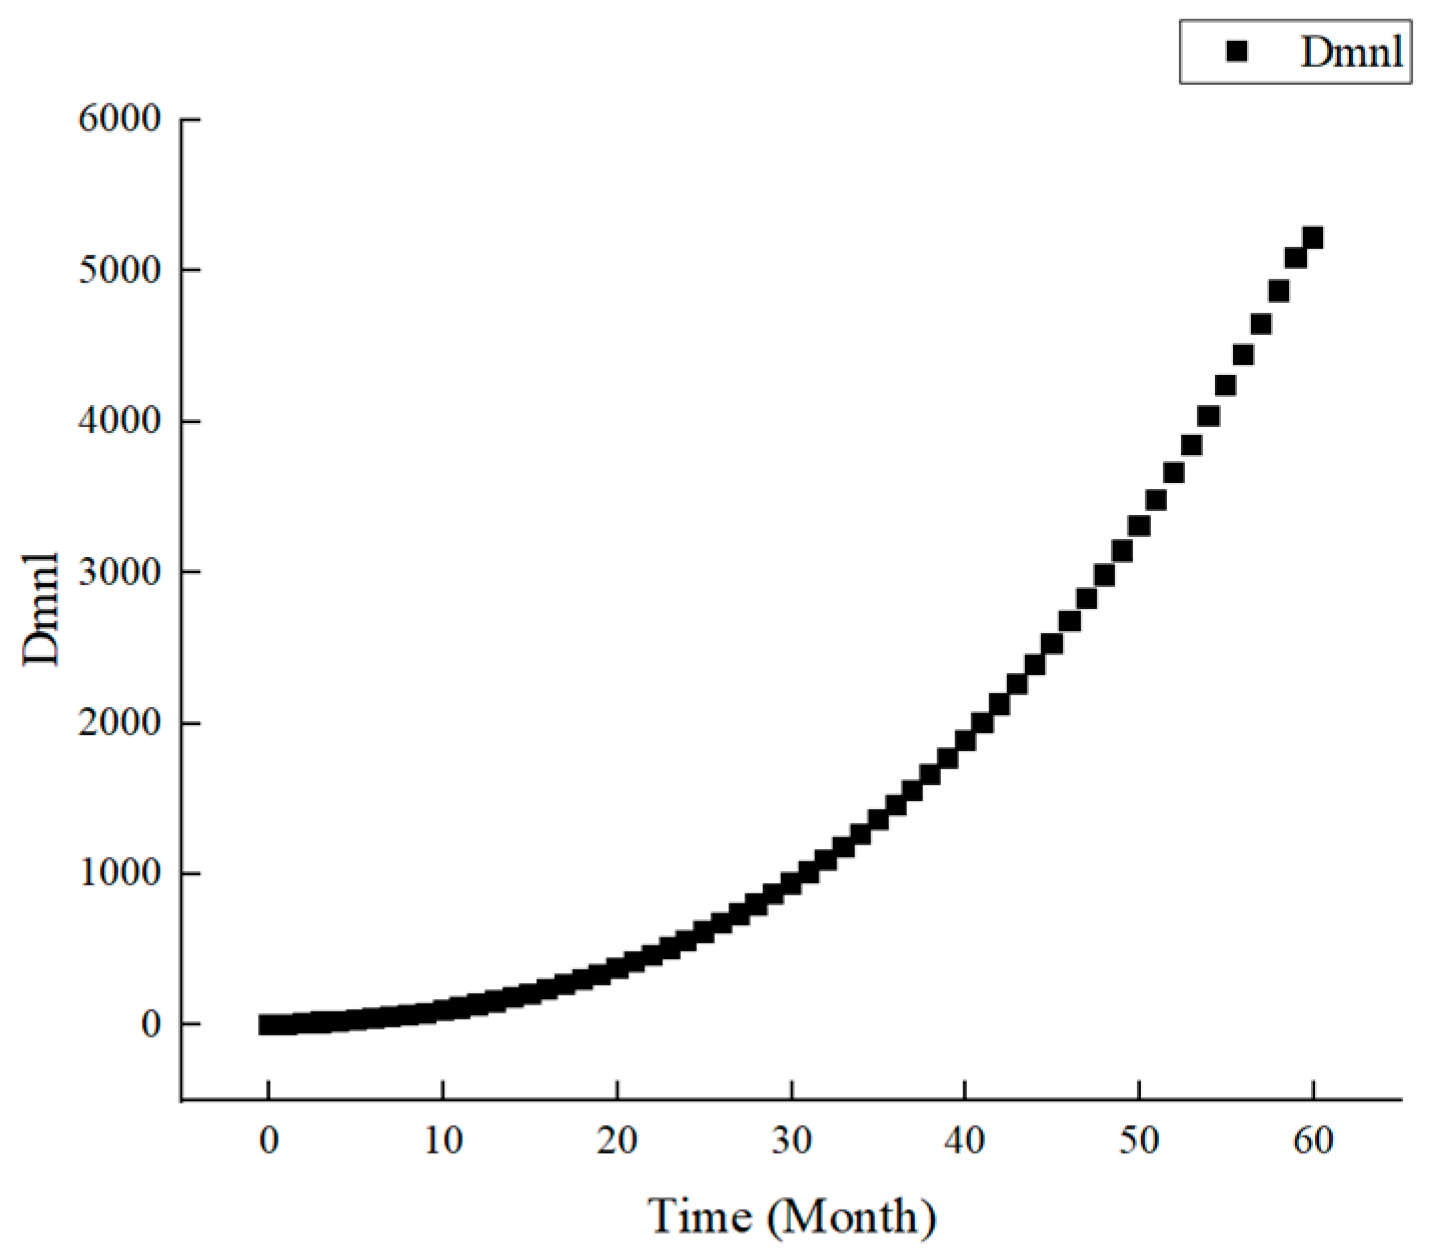
- Supply chain resilience prediction analysis of YWC project
- (2)
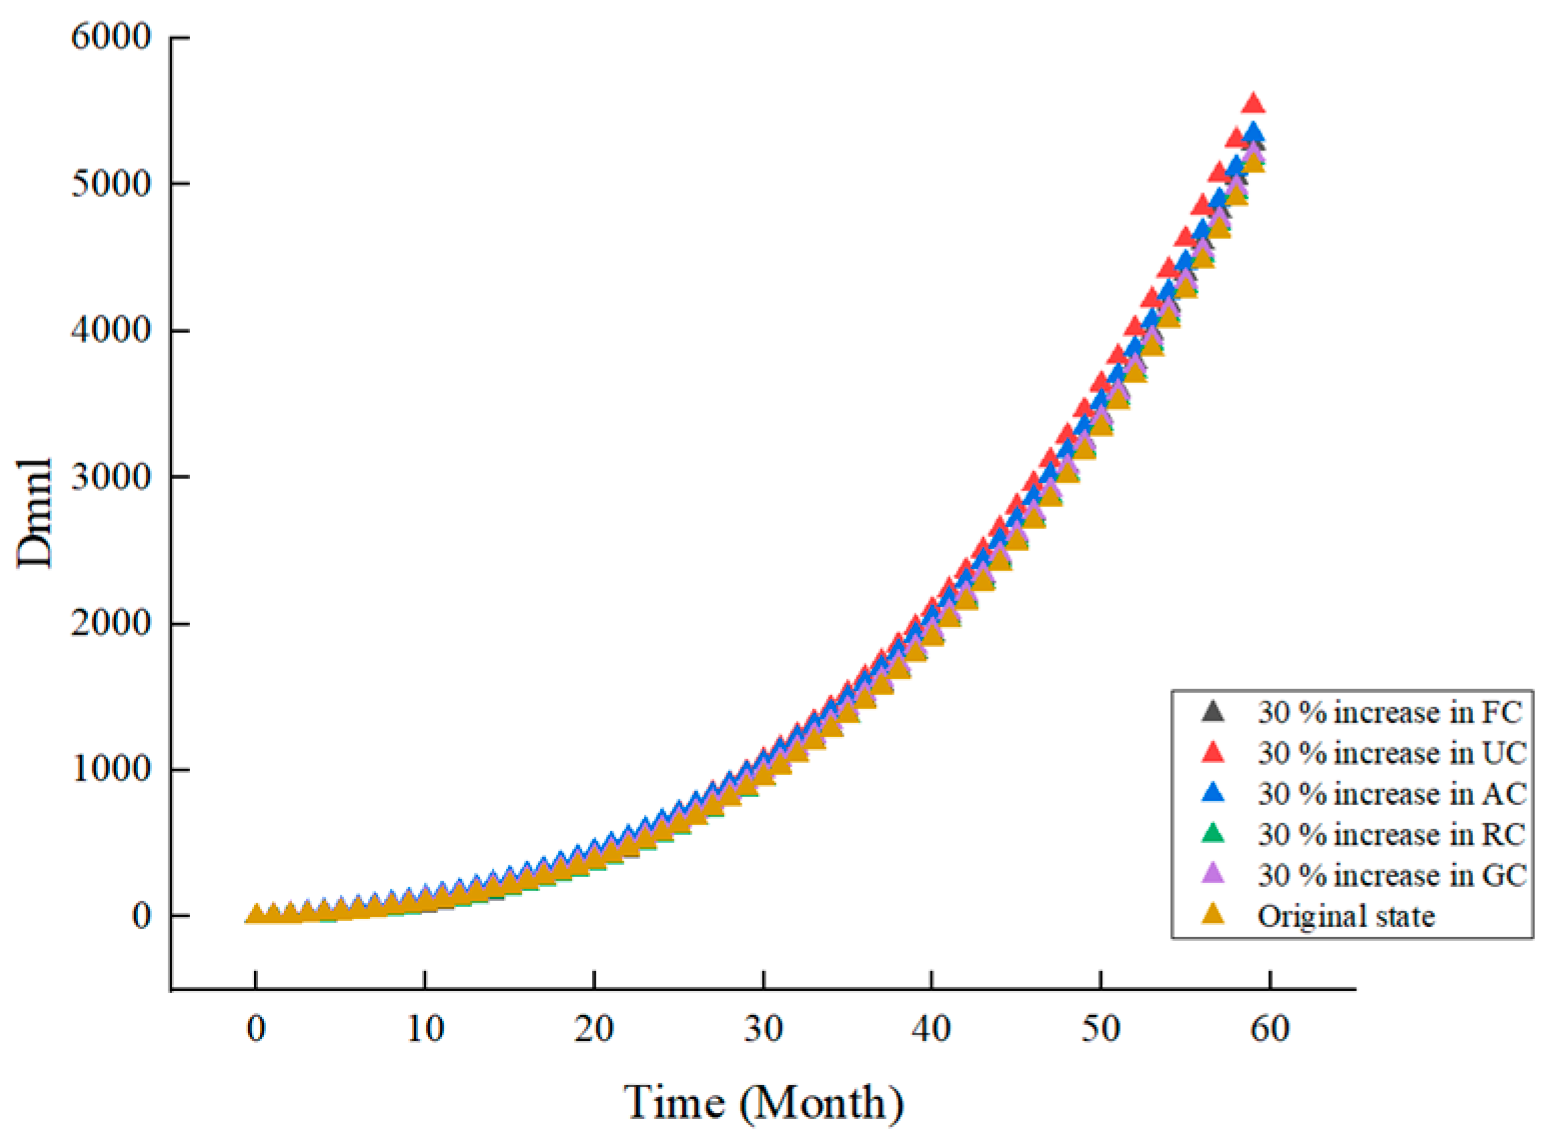
- Comparative analysis of subsystem change schemes
- (3)
- Comparative analysis of secondary sub-factor change schemes
5. Discussions and Suggestions
5.1. Discussions
5.2. Suggestions
- (1)
- Augment risk prevention and management awareness.
- (2)
- Cultivate internal and external collaborative mechanisms.
- (3)
- Enhance logistics competencies.
6. Conclusions
- (1)
- The supply chain within prefabricated building projects exudes complexity, entailing a myriad of participants and a tightly-knit connectivity amongst them. Consequently, the entirety of the system can be accurately characterized as an integrated, nonlinear, multi-feedback dynamic system. The deployment of System Dynamics (SD) for crafting a system dynamics model affords not only a more precise reflection of the intricate causal interrelations among factors but also a quantitative depiction of the system’s lateral evolution under the influence of assorted variables.
- (2)
- Insights derived from simulation forecasting illuminate a notable fragility in the overall risk resilience, principally attributed to an experiential deficit in refining technology, management, and emergency response within the supply chain system of prefabricated building projects during initial phases. However, a subsequent elevation is observable in the level of assembly technology, capital allocation among chain participants, risk awareness of node enterprises, and collective risk mitigation capacities, propelling the overarching anti-risk caliber of the prefabricated assembly construction project supply chain along an exponential growth trajectory.
- (3)
- Perturbations in disparate subsystems give rise to divergent risk-resilience levels within the prefabricated assembly construction project supply chain. Notably, the absorptive capacity subsystem emerges as a pivotal entity, exerting a prominently amplifying effect on the risk-resilience caliber of the prefabricated building engineering supply chain, thereby situating itself as a linchpin within the entire risk-resilience framework of the prefabricated building engineering supply chain.
- (4)
- An examination into the modulation of single-factor variables reveals that the most sensitive secondary sub-factors within each subsystem encompass risk awareness, logistics support level, collaboration degree, supply chain reconfiguration aptitude, and management strategy decision-making capability. These elements, therefore, crystallize as paramount factors in enhancing the resilience level of the supply chain within prefabricated building projects.
Author Contributions
Funding
Data Availability Statement
Conflicts of Interest
References
- Huang, G.L.; Zhang, C.; Wei, X.L. Research on green supply chain model of prefabricated building. Build. Econ. 2019, 40, 48–52. [Google Scholar] [CrossRef]
- Han, L.H.; Yin, Q.L.; Liu, J.W. Performance evaluation of prefabricated building supply chain based on grey clustering. J. Qingdao Univ. Technol. 2020, 41, 50–56. [Google Scholar]
- Lu, J.; Wang, J.; Song, Y.; Yuan, C. Influencing Factors Analysis of Supply Chain Resilience of Prefabricated Buildings Based on PF-DEMATEL-ISM. Buildings 2022, 12, 1595. [Google Scholar] [CrossRef]
- Wu, Q.; Zhu, J.; Cheng, Y. The effect of cross-organizational governance on supply chain resilience: A mediating and moderating model. J. Purch. Supply Manag. 2023, 29, 1008. [Google Scholar] [CrossRef]
- Li, N.X.; Wang, H.W.; Mei, J.Z. Risk early warning of prefabricated building supply chain based on cloud matter-element theory. J. Civ. Eng. Manag. 2020, 37, 123–129. [Google Scholar] [CrossRef]
- Ali, R.H.; Siamak, N.; Seyed, F.G. Integrated scheduling of suppliers and multi-project activities for green construction supply chains under uncertainty. Autom. Constr. 2021, 122, 5805. [Google Scholar] [CrossRef]
- Lin, Y.; Hao, M.M. Research on cost control of steel structure assembly building based on DEMATEL-ISM model. Constr. Econ. 2022, 43, 54–60. [Google Scholar] [CrossRef]
- Kamali, M.; Hewage, K. Development of performance criteria for sustainability evaluation of modular versus conventional construction methods. J. Clean. Prod. 2017, 142, 3592–3606. [Google Scholar] [CrossRef]
- Gan, V. BIM-Based Building Geometric Modeling and Automatic Generative Design for Sustainable Offsite Construction. J. Constr. Eng. Manag. 2022, 148, 4022. [Google Scholar] [CrossRef]
- Lee, D.M.; Lee, S. Digital Twin for Supply Chain Coordination in Modular Construction. Appl. Sci. 2021, 11, 5909. [Google Scholar] [CrossRef]
- Ma, X.Y.; Huang, M.Z.; Yang, M.X. Research on the influencing factors of supply chain resilience: Based on SEM and fsQCA method. Syst. Eng. Theory Pract. 2023, 43, 2484–2501. [Google Scholar]
- Koronis, E.; Ponis, S.T. Introducing corporate reputation continuity to support organizational resilience against crises. J. Appl. Bus. Res. 2012, 28, 283–290. [Google Scholar] [CrossRef]
- Holcomb, M.C.; Ponomarov, S.Y.; Manrodt, K.B. The Relationship of Supply Chain Visibility to Firm Performance. Supply Chain Forum Int. J. 2011, 12, 32–45. [Google Scholar] [CrossRef]
- Aldrighetti, R.; Battini, D.; Ivanov, D. Increasing supply chain resilience through efficient redundancy allocation: A risk-averse mathematical model. IFAC-PapersOnLine 2021, 54, 1011–1016. [Google Scholar] [CrossRef]
- Kong, F.H.; Li, J. Flexible operation and promotion strategy of OEM supply chain under supply disruption risk. China Manag. Sci. 2018, 26, 152–159. [Google Scholar] [CrossRef]
- Xu, W.; Xiong, S.; Proverbs, D.; Zhong, Z. Evaluation of humanitarian supply Chain resilience in flood disaster. Water 2021, 13, 2158. [Google Scholar] [CrossRef]
- Moosavi, J. Simulation-based assessment of supply chain resilience with consideration of recovery strategies in the COVID-19 pandemic context. Comput. Ind. Eng. 2021, 160, 107593. [Google Scholar] [CrossRef] [PubMed]
- Chen, L.; Hong, Y.D.; Chi, Z. A resilience measure for supply chain systems considering the interruption with the cyber-physical systems. Reliab. Eng. Syst. Saf. 2020, 199, 106869. [Google Scholar] [CrossRef]
- Pavlov, A.; Ivanov, D.; Dolgui, A. Hybrid Fuzzy-Probabilistic Approach to Supply Chain Resilience Assessment. IEEE Trans. Eng. Manag. 2018, 65, 303–315. [Google Scholar] [CrossRef]
- Qian, C.H.; Miao, S.H. Elasticity evaluation of prefabricated building supply chain based on interval intuitionistic fuzzy number. Constr. Econ. 2021, 42, 43–47. [Google Scholar] [CrossRef]
- Yu, J.Y.; Zhang, Y.N.; Liu, W.D. Study on the temporal and spatial heterogeneity of global cross-border e-commerce logistics resilience under the impact of the epidemic. Geogr. Res. 2021, 40, 3333–3348. [Google Scholar]
- Rice, J.B.; Caniato, F. Building a secure and resilient supply network. Supply Chain Manag. Rev. 2003, 7, 22–30. [Google Scholar]
- Brandon-Jones, E.; Squire, B. A contingent resource-based perspective of supply chain resilience and robustness. J. Supply Chain Manag. 2014, 50, 55–73. [Google Scholar] [CrossRef]
- Colicchia, C.; Creazza, A. Information sharing in supply chains: A review of risks and opportunities using the systematic literature network analysis(SLNA). Supply Chain Manag. Int. J. 2019, 24, 5–21. [Google Scholar] [CrossRef]
- Shang, J.; Chen, M. Development Trend of Industrial Chain Supply Chain and Regional Spatial Restructuring Governance—Ased on the Perspective of Informatization and Security Resilience. Urban Dev. Res. 2023, 30, 103–111. [Google Scholar]
- Wang, Y.Q.; Qu, Y.Y. System dynamics simulation of imported crude oil supply chain network flexibility under environmental disturbance. J. Syst. Manag. 2019, 28, 983–990. [Google Scholar]
- Li, W.A.; Ma, Y. How to construct an effective mechanism of supply chain resilience? Contemp. Econ. Manag. 2022, 44, 27–38. [Google Scholar] [CrossRef]
- Ji, Y.; Qi, L.; Liu, Y.; Liu, X.; Li, H.X. Assessing and Prioritising Delay Factors of Prefabricated Concrete Building Projects in China. Appl. Sci. 2018, 8, 2324. [Google Scholar] [CrossRef]
- Kamyar, K.; Mohammad, M. The impact of Engineering, Procurement and Construction Phases on Project Performance: A Case of Large-scale Residential Construction Project. Buildings 2019, 9, 15. [Google Scholar] [CrossRef]
- Zhu, L.; Chen, J.Y.; Yuan, J.F. Research on key influencing factors of resilience of prefabricated building supply chain based on ISM. J. Civ. Eng. Manag. 2020, 37, 108–114. [Google Scholar] [CrossRef]
- Li, Y. Research on risk management of prefabricated housing supply chain. J. Qingdao Univ. Technol. 2018, 24, 45–56. [Google Scholar]
- Chen, C. Research on Partnership Management of Prefabricated Building Supply Chain. J. Beijing Jiaotong Univ. 2020, 14, 14–22. [Google Scholar] [CrossRef]
- Yamin, M.A. Investigating the Drivers of Supply Chain Resilience in the Wake of the COVID-19 Pandemic: Empirical Evidence from an Emerging Economy. Sustainability 2021, 13, 11939. [Google Scholar] [CrossRef]
- Sun, Y.Q.; Tian, Y. Research on Key Risks of Prefabricated Construction Supply Chain Based on Complex Network Theory. Build. Econ. 2020, 41, 79–83. [Google Scholar] [CrossRef]
- Zhu, Z.Y.; Wu, W.Z. Research on the impact of EPC mode assembly building supply chain resilience based on SEM. J. Anhui Jianzhu Univ. 2022, 30, 92–98+110. [Google Scholar]
- Fan, X.M.; Lu, M.Y. Influencing factors and evaluation of supply chain resilience of automobile enterprises under the new coronavirus epidemic. Ind. Technol. Econ. 2020, 39, 21–28. [Google Scholar] [CrossRef]
- Wang, Q.K.; Duan, H.L.; Shen, C.X. Research on the influencing factors of the flexible supply chain of prefabricated buildings. Build. Econ. 2021, 42, 79–82. [Google Scholar] [CrossRef]
- Qi, F.Z.; Zhang, L.L. Research on supply chain resilience evaluation and early warning based on improved grey prediction model. Ind. Technol. Econ. 2022, 41, 100–107. [Google Scholar] [CrossRef]
- Zhou, T.; Zhou, Y.P.; Guo, Y.C. Multi-dimensional interpretation of prefabricated building industry chain and evaluation of influencing factors of supply chain autonomy and controllability. J. Archit. Sci. Eng. 2022, 39, 192–203. [Google Scholar] [CrossRef]
- Liu, J.G.; Zhou, Y.X.; Li, J. Analysis of supply chain resilience comprehensive optimization path selection model. J. Harbin Inst. Technol. 2014, 46, 101–106. [Google Scholar]
- AbuMoeilak, L.; AlQuraidi, A.; AlZarooni, A. Critical Success Factors for Building Information Modeling Implementation as a Sustainable Construction Practice in the UAE. Buildings 2023, 13, 1406. [Google Scholar] [CrossRef]
- Lu, Z.N.; Zhang, C.H.; Luo, Y.S. Research on performance evaluation of green supply ch ain of manufacturing enterprises under the goal of ‘ double carbon. Eco-economy 2023, 39, 58–66. [Google Scholar]
- Hao, Q.W.; Guo, Q.J.; Jia, Z. Vulnerability simulation analysis of subway system based on ANP-SD. Railw. Stand. Des. 2018, 62, 118–123. [Google Scholar] [CrossRef]
- Huang, J.; She, J.W.; Yuan, X.M. Simulation of urban flood resilience based on system dynamics-Taking Nanjing as an example. Resour. Environ. Yangtze River Basin 2020, 29, 2519–2529. [Google Scholar]


| First Grade Indexes | Second Index | Reference |
|---|---|---|
| Forecast capacity | Supply chain structure (FC1) | [3,33,34] |
| Supply chain complexity (FC2) | [35,36] | |
| Risk awareness (FC3) | [3] | |
| Uptake capacity | Prefabricated construction level (UC1) | [3,33] |
| Logistics support level (UC2) | [3,33,37] | |
| Supplier management (UC3) | [34,36] | |
| Components production flexibility (UC4) | [34,36,37] | |
| Adapt capacity | Information management capability (AC1) | [11,37,38] |
| The degree of collaboration (AC2) | [11,26] | |
| Inventory redundancy (AC3) | [35,36,38] | |
| Risk management level (AC4) | [38,39,40] | |
| Recovery capacity | Funds scheduling capacity (RC1) | [20,37] |
| Emergency response capability (RC2) | [20,38] | |
| Resource reengineering capability (RC3) | [37,38] | |
| Supply chain reconfiguration capability (RC4) | [37,39] | |
| Growth capacity | Organizational learning ability (GC1) | [36,38] |
| Assembly technology innovation investment (GC2) | [3,37,39] | |
| Management strategic decision-making ability (GC3) | [16,38,40] |
| Scale | Explanation |
|---|---|
| 1 | The two factors are equally important when compared |
| 3 | Comparing the two factors, the former is slightly more important than the latter |
| 5 | Comparing the two factors, the former is significantly more important than the latter |
| 7 | Comparing the two factors, the former is very important than the latter |
| 9 | Comparing the two factors, the former is extremely more important than the latter |
| 2, 4, 6, 8 | The median value of the above neighboring judgments |
| Order | 1 | 2 | 3 | 4 | 5 | 6 | 7 | 8 | 9 |
|---|---|---|---|---|---|---|---|---|---|
| RI | 0 | 0 | 0.58 | 0.9 | 1.12 | 1.24 | 1.38 | 1.41 | 1.46 |
| First Grade Indexes | Weight | Second Index | Weight |
|---|---|---|---|
| Forecast capacity | 0.1207 | Supply chain structure (FC1) | 0.1834 |
| Supply chain complexity (FC2) | 0.1652 | ||
| Risk awareness (FC3) | 0.6514 | ||
| Uptake capacity | 0.3525 | Assembly construction level (UC1) | 0.1365 |
| Logistics support level (UC2) | 0.3378 | ||
| Supplier management (UC3) | 0.2994 | ||
| Components production flexibility (UC4) | 0.2263 | ||
| Adapt capacity | 0.2153 | Information management capability (AC1) | 0.1911 |
| The degree of collaboration (AC2) | 0.2671 | ||
| Inventory redundancy (AC3) | 0.1072 | ||
| Risk management level (AC4) | 0.4346 | ||
| Recovery capacity | 0.0968 | Funds scheduling capacity (RC1) | 0.1073 |
| Emergency response capacity (RC2) | 0.3412 | ||
| Resource reengineering capacity (RC3) | 0.1791 | ||
| Supply chain reconfiguration capacity (RC4) | 0.3724 | ||
| Growth capacity | 0.2148 | Organizational learning capacity (GC1) | 0.2535 |
| Assembly technology innovation investment (GC2) | 0.2193 | ||
| Management strategic decision-making capacity (GC3) | 0.5272 |
| SD Equation | |
|---|---|
| The influence level of forecast ability | INTEG (forecast capacity change, 0) |
| Forecast capacity variation RFC | 0.1834 × FC1 + 0.1652 × FC2 + 0.6514 × FC3 |
| The influence level of uptake ability | INTEG (uptake capacity change,0) |
| Uptake capacity variation RUC | 1.0875 × forecast capacity influence level + 0.1365 × UC1 + 0.3378 × UC2 + 0.2994 × UC3 + 0.2263 × 1.0375 × UC4 |
| The influence level of adapt capacity | INTEG (adapt capacity change, 0) |
| Adapt capacity variation RAC | 1.1875 × forecast capacity influence level + 1.475 × uptake capacity influence level + 0.1911 × AC1 + 0.2671 × 1.4375 × AC2 + 0.1072 × AC3 + 0.4346 × 1.4063 × AC4 |
| The influence level of recovery capacity | INTEG (recovery capacity change, 0) |
| Recovery capacity variation RRC | 1.3688 × adaptive capacity influence level + 0.1073 × RC1 + 0.3412 × RC2 + 0.1791 × RC3 + 0.3724 × 1.2813 × RC4 |
| The influence level of growth capacity | INTEG (growth capacity change, 0) |
| Growth capacity variation RGC | 1.2 × adaptability influence level + 1.1963 × recovery capacity influence level + 0.2535 × GC1 + 0.2193 × 1.4313 × GC2 + 0.5272 × 1.0125 × GC3 |
| Supply chain resilience of prefabricated building project | 0.1207 × forecast capacity influence level + 0.3525 × uptake capacity influence level + 0.2153 × adaptability capacity influence level + 0.0968 × recovery capacity influence level + 0.2148 × growth capacity influence |
| Time (Month) | Original State | FC Increased by 30% | UC Increased by 30% | AC Increased by 30% | RC Increased by 30% | GC Increased by 30% |
|---|---|---|---|---|---|---|
| 0 | 0 | 0 | 0 | 0 | 0 | 0 |
| 10 | 68.04 | 71.86 | 100.2 | 112.57 | 74.23 | 97.84 |
| 20 | 314.00 | 330.49 | 397.69 | 406.26 | 334.08 | 373.61 |
| 30 | 834.45 | 877.27 | 990.39 | 977.63 | 876.14 | 923.86 |
| 40 | 1727.52 | 1815.26 | 1977.8 | 1924.82 | 1798.53 | 1846.74 |
| 50 | 3092.93 | 3249.13 | 3460.98 | 3347.53 | 3200.96 | 3241.95 |
| 60 | 5031.96 | 5285.25 | 5542.59 | 5347.06 | 5184.73 | 5210.79 |
| Subsystem | Factor Changes | Final Toughness Level | Subsystem | Factor Changes | Final Toughness Level |
|---|---|---|---|---|---|
| Forecast capacity | FC1 + 0.5 | 5481.32 | Growth capacity | GC1 + 0.5 | 5693.52 |
| FC2 + 0.5 | 5305.6 | GC2 + 0.5 | 5624.23 | ||
| FC3 + 0.5 | 5915.82 | GC3 + 0.5 | 5956.82 | ||
| Uptake capacity | UC1 + 0.5 | 5292.24 | GC4 + 0.5 | 5297.48 | |
| UC2 + 0.5 | 6153.88 | Recovery capacity | RC1 + 0.5 | 5742.69 | |
| UC3 + 0.5 | 5760.83 | RC2 + 0.5 | 5551.14 | ||
| UC4 + 0.5 | 5546.93 | RC3 + 0.5 | 5824.37 | ||
| Adapt capacity | AC1 + 0.5 | 5550.12 | |||
| AC2 + 0.5 | 6169.53 | ||||
| AC3 + 0.5 | 5279.71 | ||||
| AC4 + 0.5 | 6547.91 |
Disclaimer/Publisher’s Note: The statements, opinions and data contained in all publications are solely those of the individual author(s) and contributor(s) and not of MDPI and/or the editor(s). MDPI and/or the editor(s) disclaim responsibility for any injury to people or property resulting from any ideas, methods, instructions or products referred to in the content. |
© 2023 by the authors. Licensee MDPI, Basel, Switzerland. This article is an open access article distributed under the terms and conditions of the Creative Commons Attribution (CC BY) license (https://creativecommons.org/licenses/by/4.0/).
Share and Cite
Liu, W.; Liu, Z. Simulation Analysis of Supply Chain Resilience of Prefabricated Building Projects Based on System Dynamics. Buildings 2023, 13, 2629. https://doi.org/10.3390/buildings13102629
Liu W, Liu Z. Simulation Analysis of Supply Chain Resilience of Prefabricated Building Projects Based on System Dynamics. Buildings. 2023; 13(10):2629. https://doi.org/10.3390/buildings13102629
Chicago/Turabian StyleLiu, Wei, and Zixuan Liu. 2023. "Simulation Analysis of Supply Chain Resilience of Prefabricated Building Projects Based on System Dynamics" Buildings 13, no. 10: 2629. https://doi.org/10.3390/buildings13102629