Article

The Net Zero Emissions Decision Model of the Sustainable Path of Chinese Business Parks

1
State Grid Hebei Electric Power Co., Ltd., Shijiazhuang 050057, China
2
Department of Energy and Power Engineering, Tsinghua University, Beijing 100084, China
3
Development Research Center of State Grid Hebei Electric Power Co., Ltd., Shijiazhuang 050057, China
4
Department of Management Science and Engineering, Central University of Finance and Economics, Beijing 102206, China
5
China Forestry Group Corporation, Beijing 100036, China
6
CSCEC-TAISEI Construction, Ltd., Beijing 100029, China
7
Institute of Energy, Environment and Economy, Tsinghua University, Beijing 100084, China
*
Author to whom correspondence should be addressed.
Buildings 2023, 13(10), 2638; https://doi.org/10.3390/buildings13102638
Submission received: 21 September 2023 / Revised: 14 October 2023 / Accepted: 16 October 2023 / Published: 19 October 2023
(This article belongs to the Section Building Energy, Physics, Environment, and Systems)

Abstract

:
Business parks account for 30% of China’s total carbon emissions. Exploring emissions reduction approaches for business parks is crucial to achieve a net-zero emissions target, as well as for achieving a representative example for all types of emissions entities. Business parks mainly adopt two types of emissions reduction approaches: energy-saving renovations and purchasing carbon reduction products. However, there are limited studies focusing on the optimal combinations of the two approaches for reaching net-zero emissions and evaluating the cost effectiveness. To find a feasible and quantified way to build net-zero business park, a comprehensive path decision model is proposed. The problem is broken down into two parts: the optimal carbon reduction portfolio and the optimal electricity saving were researched. For the optimal product portfolio, the Markowitz theory is employed to balance the risk of carbon reduction products with the expected cost. In the part of optimal electricity saving, considering a ten-year life cycle, the total cost includes renovation investment, carbon reduction products cost, and cost saving of electricity consumption reduction. Based on the energy consumption, technical, and price data, the combination of energy-saving renovations and carbon reduction products is optimized. The model suggests a business park can save 24% of energy consumption through renovation investment and purchase CCER as 66% of the carbon reduction product portfolio. Taking only purchasing carbon reduction products as a benchmark to assess economic efficiency, implementing an optimized level of energy-saving renovation is found to save 16% of the comprehensive cost for the life cycle required to achieve zero carbon emissions. This model provides a new comprehensive optimization idea that will help future parks make decisions to achieve zero-carbon emission targets.

1. Introduction

1.1. Background

Reducing greenhouse gas emissions is a significant challenge. As urbanization and industrialization have developed, excessive emissions have been a major cause for climate issues [1]. Countries signed the Paris Agreement in 2015, aiming to achieve net zero emissions by mid-century [2]. China had proposed the goal of peaking before 2030 and neutrality before 2060. 25% of China’s GDP comes from the business park (a park has one or more business entities’ offices or factories with consolidated organization and management) economics [3] and 31% of the emissions come from business parks. In business parks, factories are sharing facility infrastructures that could lead to high feasibility and efficiency in emissions reduction. The high emissions level and emissions reduction efficiency of business parks indicate great potential for emissions reduction [4,5]. Meanwhile, factories and their supply chains are requiring business parks to reach sustainability [6]. In October 2021, the State Council announced: “The Implementation Methodologies for Reaching the carbon peaking in 2030,” which proposed the goal of “building the first batch of global leading net-zero business parks” and “selecting 100 representative cities and parks” for carbon peaking pilot projects [7]. Reaching net zero emissions for business parks is crucial.

1.2. Literature Review
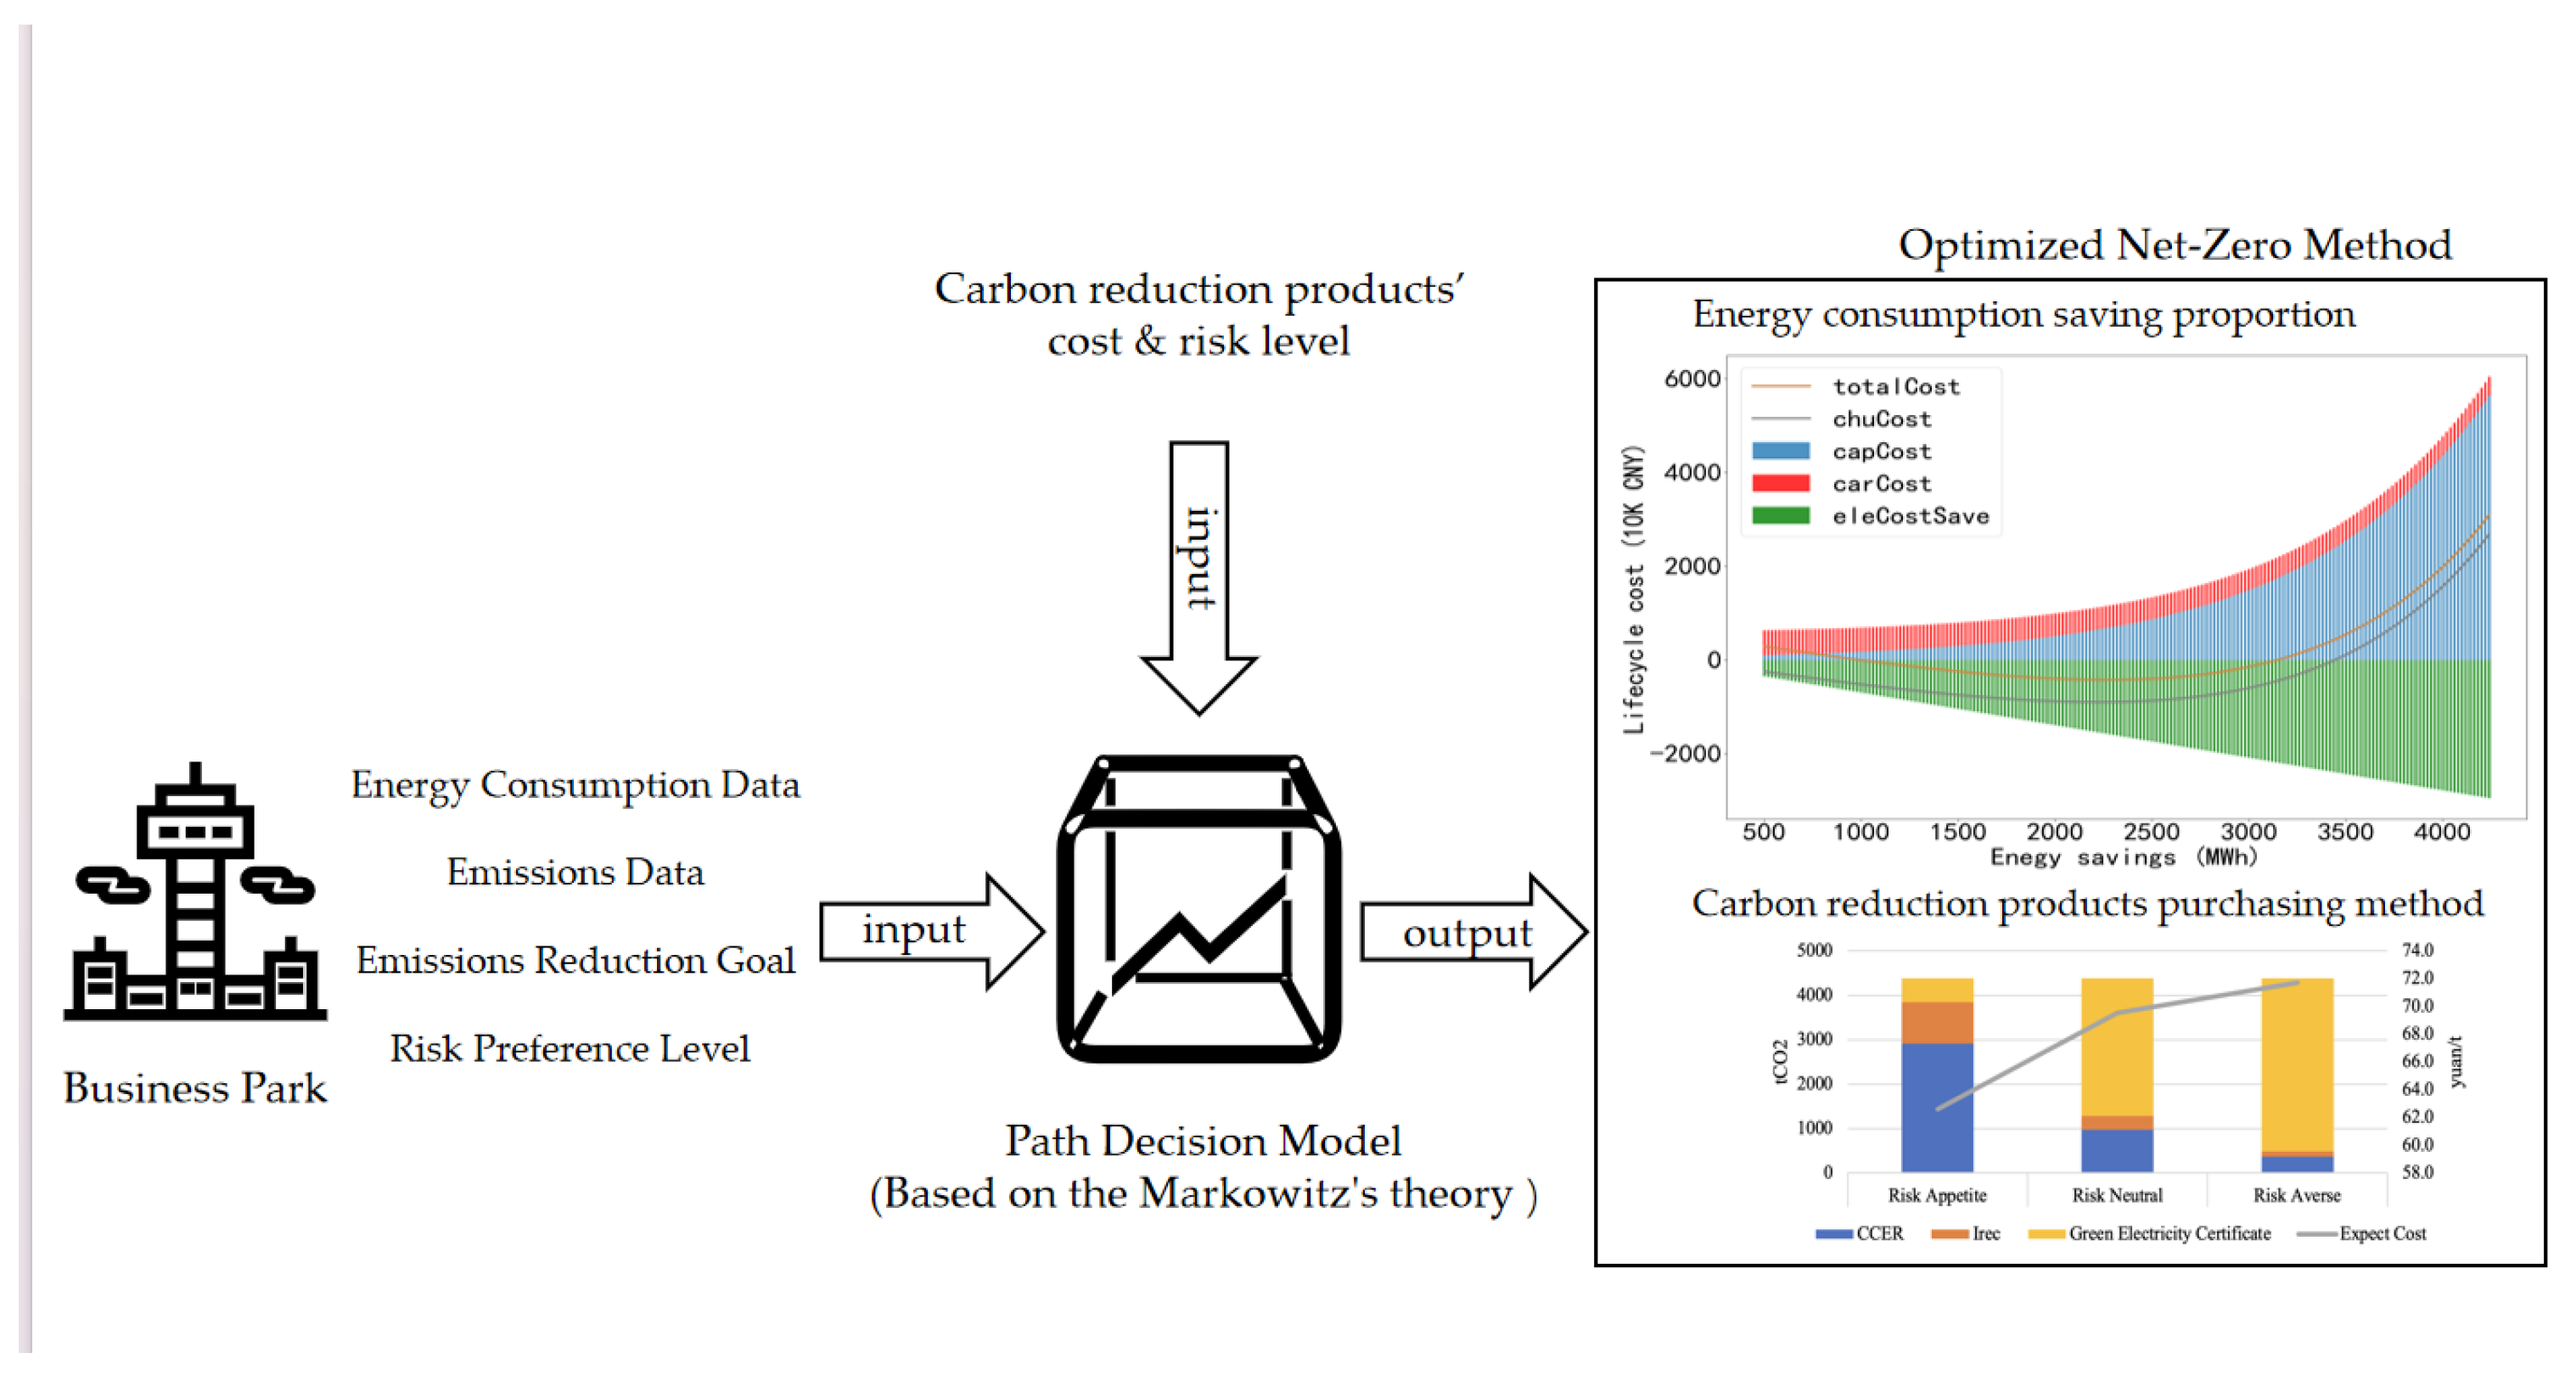
This paper is primarily related to two strands of literatures. The first strand involves carbon emissions reduction methods. Based on previous studies, the traditional approach of building net-zero parks was to improve on energy-saving renovations (e.g., change to energy saving LED lights, innovate the manufacturing processes to improve energy consuming efficiency, etc.). Pop et al. (2022) proposed that energy conservation and efficiency had been crucial for both consumers and companies under today’s business and technology context [8]. With the development of the carbon emissions reduction and energy consumption technologies, Chen et al. (2020) discovered that China had reduced carbon emissions through technology development during 2005–2015 [9]. Tian et al. (2013) and Wang et al. (2014) both proposed that industrial park chose to reduce carbon emissions through energy-saving retrofitting in the production processes [10,11]. In 2023, Ozarisoy, B., and Altan, H. utilized actual data and model to study the building’s retrofitting for improving energy performance [12]. Wei et al. (2022) had based on a Shanghai area industrial factory park’s actual heat and electricity consumption requirement to reduce the park’s emissions level through utilizing photovoltaic, hydrogen energy, and energy storage technologies [13].
On the other hand, with the development of carbon markets and relevant systems, purchasing carbon reduction products (e.g., purchasing carbon credits such as the China Certified Emissions Reduction, procurement of renewable energy, and relevant certificates such as the International Renewable Energy Certificate) also became a main method in offsetting parks’ emissions. As a form of green public procurement, purchasing emissions carbon reduction products could drive circular economy and encourage procurement of sustainable innovation [14]. Zhang et al. (2023) had proposed to reduce a building’s carbon emissions only by energy renovations is challenging, instead, Zhang et al. (2023) suggested to purchase carbon reduction products, such as China Certified Emissions Reduction (CCER) and green electricity to realize carbon offsets [15]. Also, carbon offsets can be realized by both self-generated carbon credits and trading. Sun (2023) had studied the emissions reduction method design of an industrial park in cold regions and built a synthetic model that considered the greenbelts and photovoltaic carbon credits that came from the park but did not consider the possibilities to reach out and purchase carbon reduction products [16]. For instance, Hubei Carpet Industrial Park achieved success in reducing emissions by purchasing carbon reduction products, and the Jinfeng Technology Smart Park in Beijing Yizhuang offset all its emissions by purchasing CCER [17]. However, Feng et al. (2018) also proposed even in short-term purchasing such carbon reduction products can minimize the cost, it is not the best choice for absolute emissions reduction in the long-term [18].
The second strand of literature involves optimization models. The Markowitz theory is widely used in building optimization models. Alabi et al. (2021) had proposed a novel model for zero-carbon multi-energy system (ZCMES) covering energy storage aging influence and integrated demand response (IDR) and utilized Markowitz mean-variance theory to optimize the risk level while operating the system to further decrease the possibility of failure and improve the system reliability [19]. Song et al. (2022) utilized the Markowitz theory to build a quantitative trading model for list company’s investment to realize the maximized expected return with lower risk [20]. Zhong et al. (2020) had built an optimization model to deal with the uncertainty and spatial-temporal correlation of multi-wind farms while balancing the supply side, the transmission side, as well as the demand side. On the demand side, Markowitz theory was used to access the influence of psychological preference on the energy cost [21].
In the first strand of the literature review, it was found that relying solely on energy-saving renovations was insufficient for achieving net-zero emissions goals in business parks. On the other hand, by employing only purchasing carbon reduction products business parks will be criticized as “green washing” for not physically reducing any emissions. In the second strand of literature, the Markowitz theory was found to be rarely used for designing a model for carbon emission reduction approaches. Unfortunately, there are very limited studies that focus on the optimization of combining these two methods with integrated quantitative models. Therefore, a novel quantitative method is thought to be designed based on the Markowitz theory to realize the optimization between energy-saving renovations and purchasing carbon reduction products, which we believe is the key for business parks to realize net zero emissions.

1.3. Framework

The goal of studying the scientific methodology for business park operators to achieve net zero emissions in the most cost-efficient way was established. As a result, the following questions will be answered by constructing a quantitative methodology. For business parks with different set-ups and risk preference levels, how should the parks balance the emissions reductions from energy-saving renovations and purchasing carbon reduction products? Meanwhile, how should they select the carbon reduction products that fit the parks’ aim and what should be the most efficient amount of purchasing?
As shown in Figure 1, the open-sourced data of various carbon reduction products’ prices is utilized by us, combined above with the actual energy consumption data of the park, and the risk preference of different parks. A net zero emission decision model is developed based on Markowitz theory to optimize the combinations of energy-saving renovation cost and carbon reduction product purchasing. The optimized net-zero emissions approach for business parks in a 10-year life cycle is designed by us.

2. Materials and Methods

2.1. Park Energy Consumption and Carbon Emission Benchmarks

An example was chosen, namely a business park with an area of 100,000 square meters, located in Northern China. The park has office spaces accounting for over 60% and a small portion dedicated to commercial, hotel, and industrial sectors. The actual annual energy consumption and emissions data for this business park are used as the baseline, as shown in Table 1. These data include not only electricity consumption (Scope 1 direct emissions) but also the consumption of natural gas and steam (Scope 2 indirect emissions) [22].

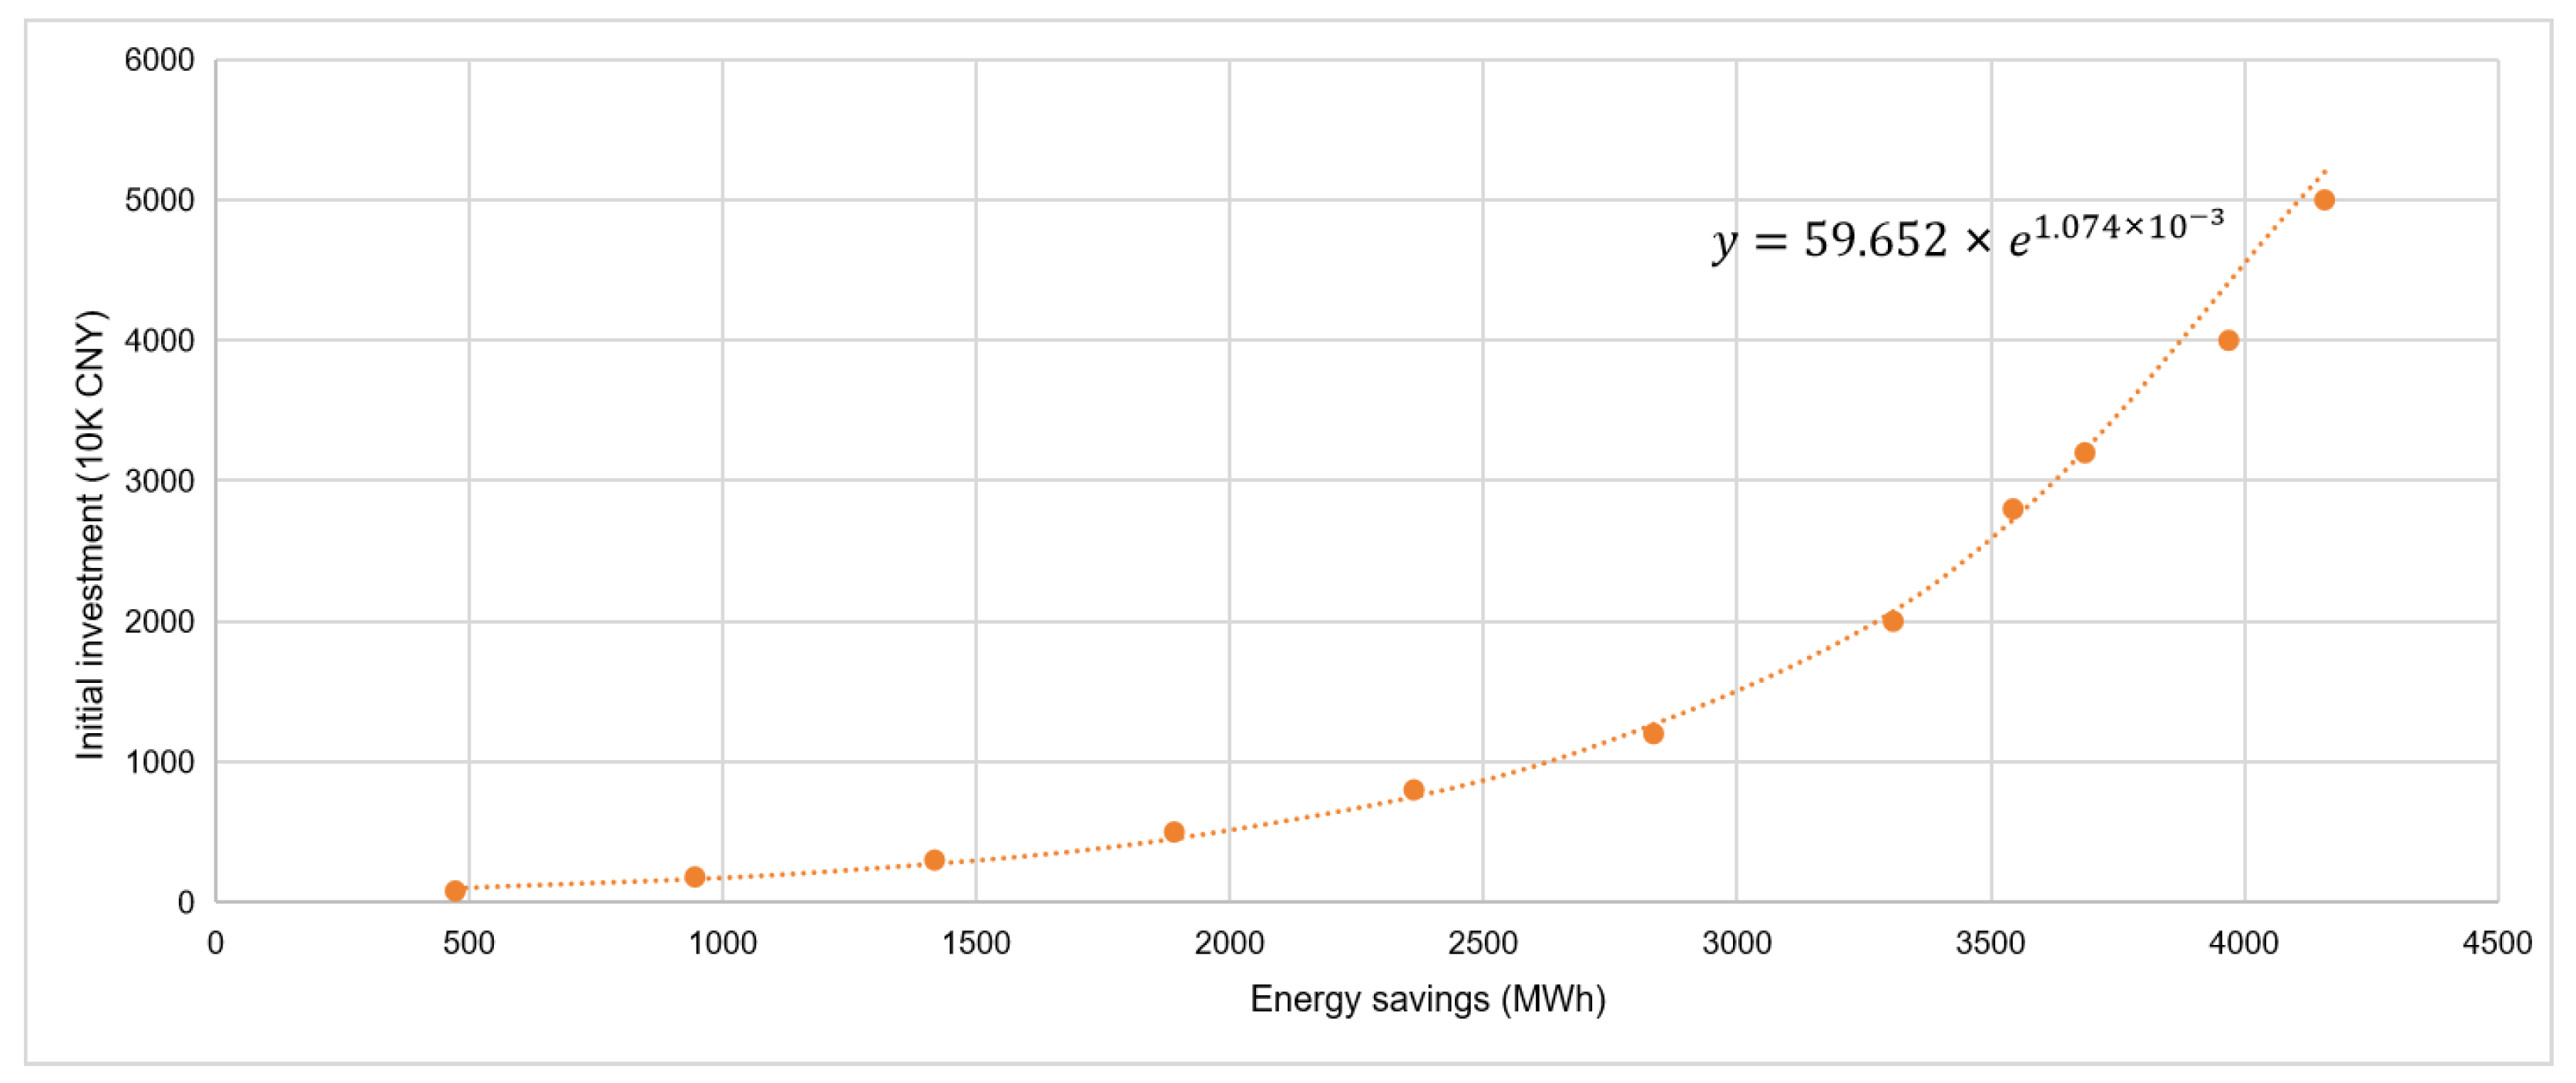
2.2. Initial Investment and Energy Saving of Energy-Saving Renovation

The park reduces its energy consumption through building energy-saving renovations and improving the efficiency of energy supply equipment [23,24]. Meanwhile, buildings could utilize retrofitting, objective strategies applications to further reduce the buildings’ energy consumption level. Ozarisoy, B. (2022) had proposed that utilizing natural ventilation and sunshades could reduce up to 53% of the cooling energy consumption [25].
Energy-saving renovations mainly focus on electricity usage, while other energy sources, such as natural gas for cooking and heating, are influenced by factors such as user habits, building characteristics, and specific needs, making it difficult to reduce their usage through energy-saving renovations [26,27]. Therefore, only electricity-related renovations are considered. The actual renovation project of a business park in East China is taken as a reference, giving the relationship function between energy-saving renovation cost and electricity saving. The original data of power saving and initial investment for energy-saving renovation are shown in Table 2, and a regression fitting analysis is performed on this data.
The relationship function between the initial investment f (in CNY) and the energy-saving amount E (in MWh) in this model is assumed as follows, as shown in Figure 2.
f E = 59.652 × e 1.074 × 10 3 × E ,   E ( 0 ,   4250 ]
With the increase of energy-saving amount E , the slope of the curve increase (Figure 2). The marginal cost of energy saving is incremental. Thus, energy saving-renovation is not cost-effective approach for reach net zero emissions.

2.3. Carbon Reduction Products and Decision-Making Methods

2.3.1. Green Electricity Certificate (GEC)

GECs are electronic certificates issued by the government to identify and verify the amount of non-hydro renewable energy delivered to the grid by power generation companies [28]. The purchase price of Green Electricity Certificates is relatively stable. GECs are considered risk-free products with stable prices.
The price and risk level of GEC in Equation (2) are defined.
r g = E r g = 73             σ g = 0
where r g is the average price of GEC, with an of 44.5 CNY/MWh for subsidy-free wind power Green Electricity Certificates, equivalent to 73 CNY/ t C O 2 , E r g is the price expectation of r g , σ g is the standard deviation of GECs.

2.3.2. International Renewable Energy Certificate (I-REC)

I-REC is an international renewable energy certification system that provides reliability for renewable energy procurement [29]. It has been widely used in areas that aim to reduce emissions by increasing the use of renewable energy. However, I-REC allows emission reductions to include both government subsidies and carbon reduction benefits, which has been a controversial practice. As a result, many businesses or governments have raised questions about purchasing I-REC, suspecting that it may involve misleading green claims. Therefore, there is a certain level of risk associated with the purchase of I-REC not being recognized. Here, the probability of recognition is set at 50%, with a cost of 8 CNY/ t C O 2 based on the average price of I-REC in 2022 [30]. In this case, the price and the possibility of I-REC in Equation (3) are defined.
r i 1 = 8 ,             P i 1 = 0.5
where r i 1 is the price of I-REC, which is 8 CNY/ t C O 2 , with the probability P i 1 of 50%.
Assuming a 50% probability of I-REC not being recognized, if it is not recognized, the buyer would need to pay additional costs for other carbon reduction products to compensate for the shortfall, in addition to the cost of purchasing I-REC. It is assumed that in this scenario, an additional purchase of Green Electricity Certificates would be required at a price of 73 CNY/ t C O 2 . In this case, the price and the possibility in Equation (4) are defined.
r i 2 = 8 + 73 ,             P i 2 = 0.5
where r i 2 is the price when I-REC not being recognized, equal to 81 CNY/ t C O 2 and the probability P i 2 is 50%.
The price expectation and standard deviation of I-REC are defined in Equations (5) and (6):
E r i = k = 1 3 r c k × P c k = 44.5
σ i = k = 1 3 ( E r c r c k ) 2 × P c k = 36.5
E r i is the price expectation of I-REC, 44.5 CNY/ t C O 2 . σ i is standard deviation of I-REC, with value of 36.5 CNY/ t C O 2 .

2.3.3. Chinese Certified Emission Reductions (CCER)

CCER is an emission reduction certificate issued by the national voluntary emission reduction management agency, representing voluntary emissions reduction amount that was certified by Chinese officials [31]. According to the average transaction price of CCER on the Beijing Carbon Emissions Rights Electronic Exchange in May 2022–2023, the benchmark price for CCER is set at 83 CNY/ t C O 2 [32]. According to calculation of data from the Beijing Emissions Trading Platform, there is a 37.5% probability that the price will remain unchanged at the end of the year, a 50% probability of a 20% price increase, and a 12.5% probability of a price decrease. In the case of price stability or increase, the business park can pay a 1.5% transaction fee to sell CCER [33] and then purchase Green Electricity Certificates which cost is r g . In the case of a price decrease, the situation remains unchanged. Assuming the cost is r c and the probability is P, the price expectation and probability of the three scenarios are shown in Equations (7)–(9):
r c 1 = r g + 0.15 × 83 ,       P c 1 = 0.375             r g   i s   t h e   p u r c h a s e   c o s t   o f   g r e e n   e l e c t r i c i t y
r c 2 = 83 ,       P c 2 = 0.125
r c 3 = r g 0.185 × 83 ,       P c 3 = 0.5
r c 1 represents the unchanged price in the end of the year, and P c 1 represents the probability of this situation. Similarly, r c 2 , r c 3 , P c 2 , P c 3 represent the increased price and decreased price in the end of the year, and the probability of these two situations.
Based on assumptions, the price expectation and standard deviation of CCER:
E r c = i = 1 3 r c i × P c i = 67.51
σ c = i = 1 3 ( E r c r c i ) 2 × P c i = 10.13
E r c is the price expectation of CCER, 67.51 CNY/ t C O 2 . σ c is standard deviation of I-REC, with value of 10.13 CNY/ t C O 2 .

2.4. Path Decision Modeling

The path decision model is a systematic and structured approach used to analyze and evaluate different paths and strategies [34]. It breaks down complex problems into manageable components and considers multi-objective optimization and risk control to address the achievement of net zero emissions. This model can meet the needs and preferences of stakeholders while dealing with uncertainty. A decision model is utilized to balance two issues: first, seeking the optimal combination of annual purchases of carbon reduction products, considering the relationship between price expectation and risks, and aiming for low risk and minimal price expectation. Second, minimizing the sum of the initial investment for energy-saving renovations and the total cost of purchasing carbon reduction products annually. Therefore, a decision model has been established to determine the optimal path for achieving net zero emissions in a business park by minimizing the life cycle costs [35,36]. To validate the feasibility of the model, simulated experiments are conducted using the energy consumption and actual data from energy-saving renovations in the park, as well as data on carbon reduction product prices and market acceptance. The experiments assess the costs and risks associated with different emission reduction paths.

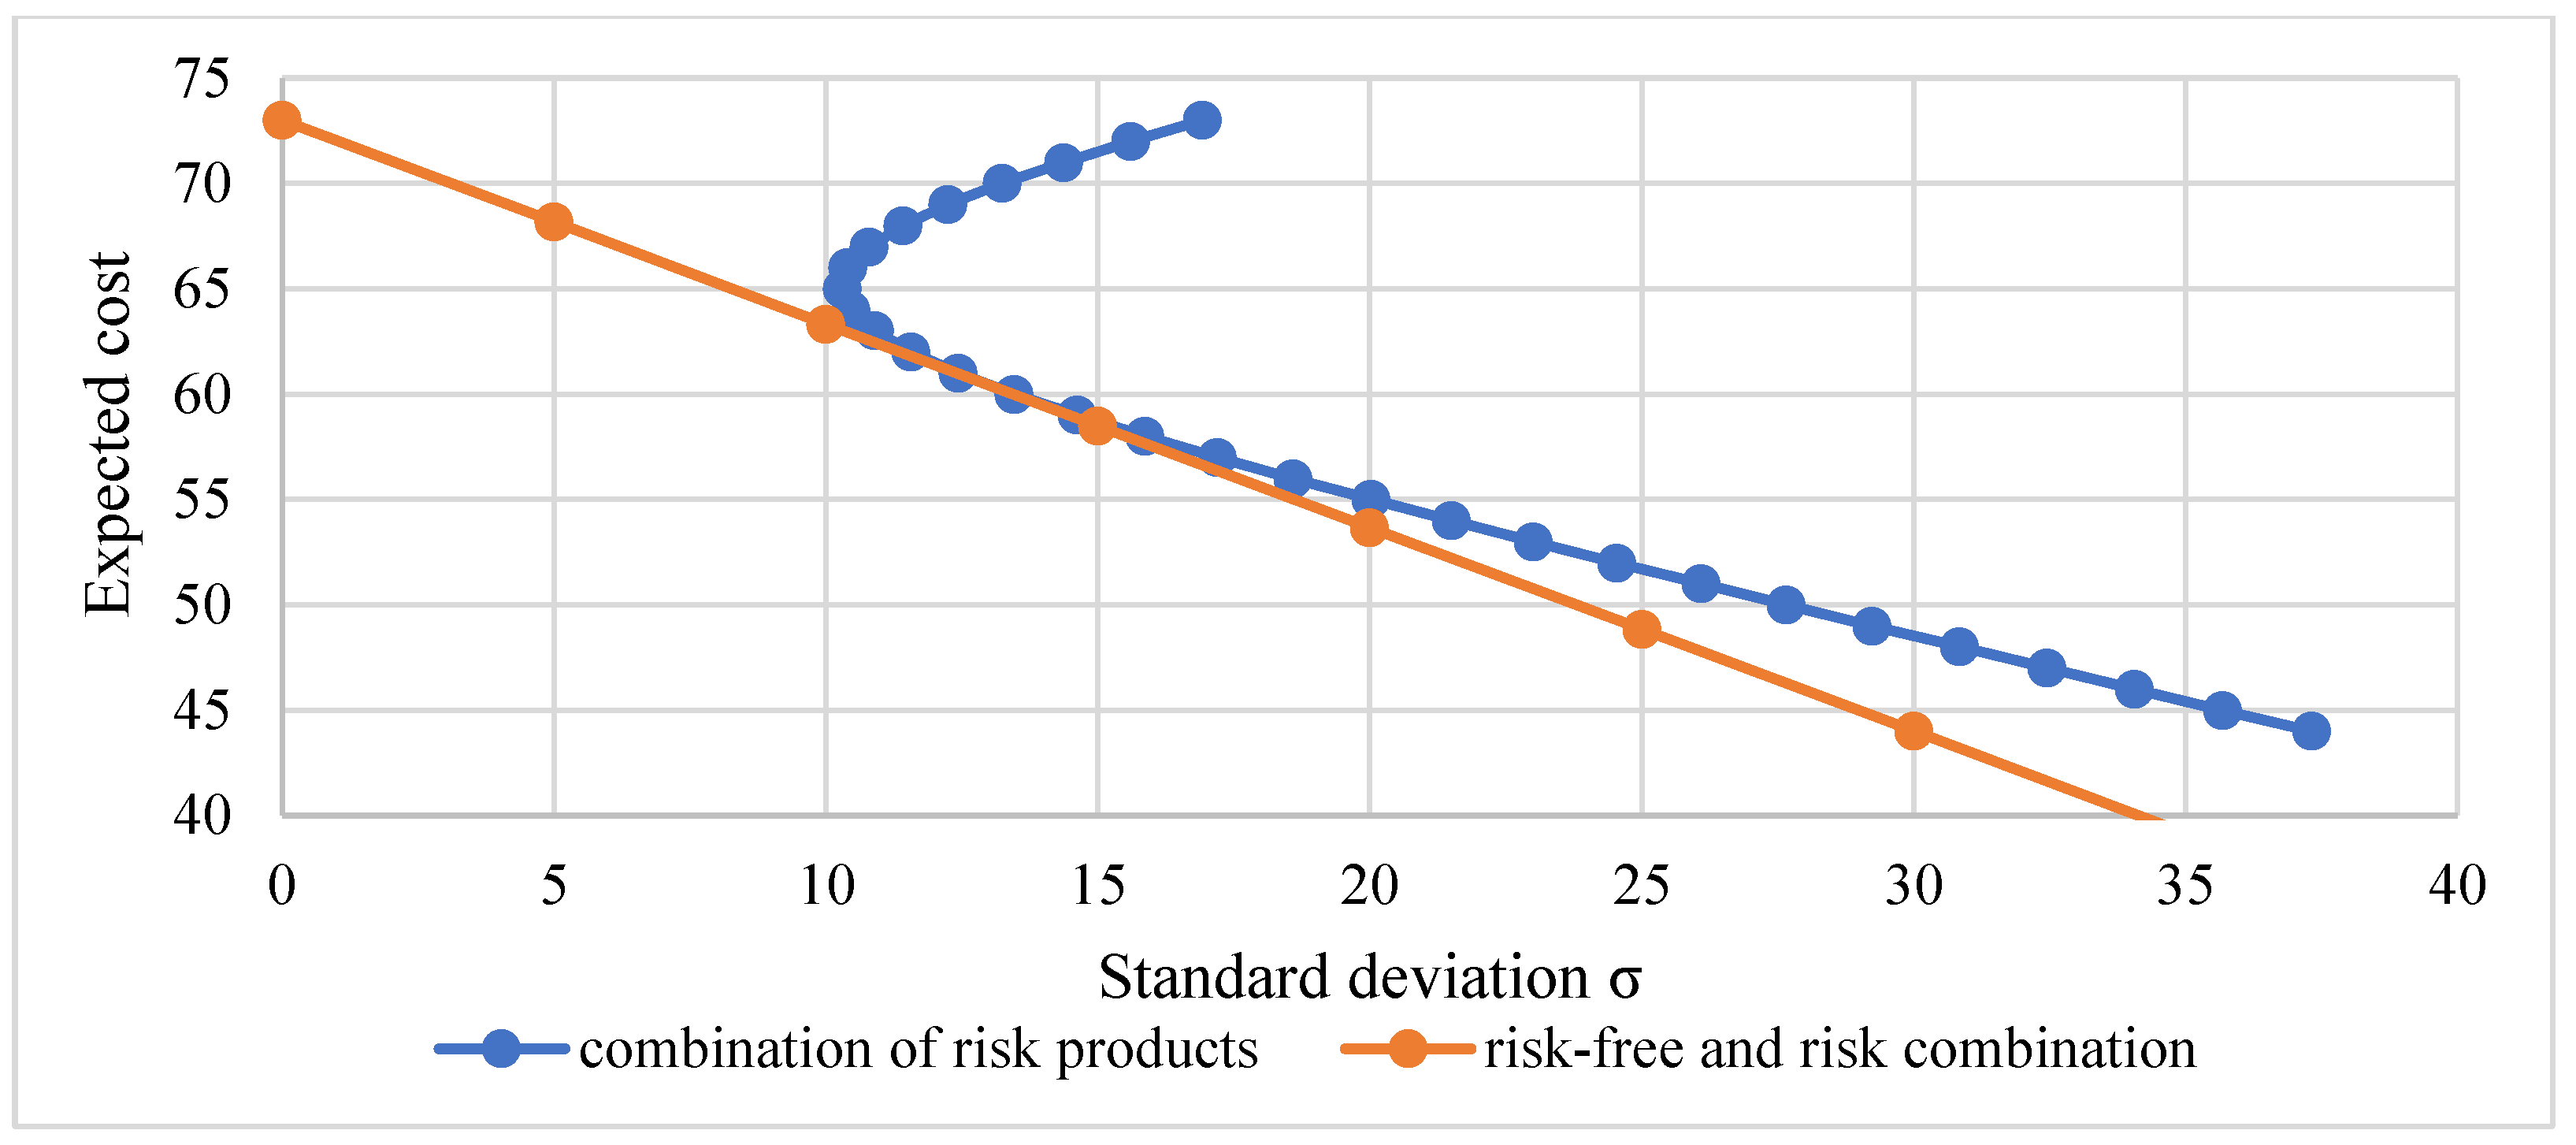
2.4.1. Calculate the Optimal Combination of Carbon Reduction Products

Referring to the approach of risk product allocation in finance [37], the combination of risk products is first executed, and the functional relationship between their risk standard deviation and costs is calculated. Then, based on the risk preferences of the buyer, a specific combination of risk and risk-free products seeks an optimized combination that meets the requirements.
The calculation of the risk product combination refers to the Markowitz theory, and the function relationship between the standard deviation and cost of the risk product combination is given by the following formula [38], as shown in Equation (12).
E r e T V 1 E r e is noted as A
σ p 2 = V 1 E r e A 1 μ p 1 T V V 1 E r e A 1 μ p 1 = μ p 1 A 1 E r e T V 1 E r e A 1 μ p 1 = μ p 1 A 1 μ p 1
where E r represents the vector of price expectation for the products, e represents the unit vector, V represents the covariance matrix between the risk products which means V is a symmetric matrix, and μ p and σ p represent the price expectation and variance of the risk product combination.
For calculation, the matrix A’s element is set as below equation:
A = E r T V 1 E r E r T V 1 e e T V 1 E r e T V 1 e : : = a b b c
Substitute A into the Equation (12):
σ p 2 1 c μ p b c 2 d c 2 = 1
In this model, after incorporating the CCER and IREC products, the cost-standard deviation curve of the risk combination is shown by the blue curve in Figure 3.
Based on the calculation of the risk product combination, risk-free products were also considered in the calculation. At this point, it is necessary to consider how to determine the allocation weights of carbon reduction products based on the curve of the risk products and the prices of the risk-free products. Similarly, according to Markowitz’s product portfolio theory, the equation for the price expectation of the combination of the risk product and risk-free product has been established.
E r d = r f + σ d σ p E r p r f
In Equation (15), the risk product cost is defined as r p , the price expectation as E ( r p ) , and the standard deviation as σ p . Risk-free product cost is defined as r f . Assuming that the proportion of risk products is y, the price expectation of the entire portfolio D is E r d , and the standard deviation of the entire portfolio is σ d .
The relationship between price expectation and standard deviation for the risk-free and risk portfolios is linear, with a slope:
s = 1 σ p E r p r f
In this problem, the variable s represents the cost reduction obtained by assuming risk. Consequently, s has a negative value, with lower values being preferable. If a straight line has a fixed y-intercept, when the line is tangent to the curve in Figure 3, this line has the maximum slope. Therefore, the line passing through the intercept r f and tangent to the cost-standard deviation curve of the risk portfolio is the optimal product allocation line.
The subscripts 1 and 2 represent two types of risk products, and the subscript f represents the risk-free product. ω represents the weight of risk product 1 in the risk product portfolio, and ρ represents the correlation coefficient between risk product 1 and risk product 2. The goal is to minimize the value of s, which means finding the derivative of s to ω and set the derivative to be zero. The value of ω is calculated by Equation (17).
ω = E r 1 r f σ 2 2 E r 2 r f ρ σ 1 σ 2 E r 1 r f σ 2 2 + E r 2 r f σ 1 2 E r 1 r f + E r 2 r f ρ σ 1 σ 2
At this point, the optimal combination of risk products has been determined in the presence of risk-free products. For ease of calculation and comprehension, the optimal risk product combination will be considered as a new risk product—T.
The next step is to determine the weights of the risk-free and risk product combinations. When the risk-free product is combined with the new risk product, each point on the orange allocation line represents a feasible combination. At this point, the buyer needs to make a decision on the optimal combination for themselves. This decision-making process involves a trade-off between risk and cost. Depending on the degree of risk aversion, different combination strategies will be chosen. Therefore, to quantitatively address this issue, the utility function U of the buyer is introduced, which is also derived from utility functions used in investment risk products [39,40] in Equation (18).
U = E r + 1 2 A σ 2
The objective of optimizing product configuration is to achieve the minimum cost for carbon emissions under a partially uncertain pricing system. Therefore, in the utility function, E(r) represents the price expectation, and A is the risk aversion coefficient. The paper aims to find a combination with low price expectation and low risk. Thus, the problem can be formulated as Equation (19):
M i n y * U = r f + y * E r T r f + 1 2 A y * 2 σ T 2
Apparently,
y * = r f E r T A σ T 2
where y * represents the weight of risk product T in the best product portfolio.
Thus, the weights of each product in the optimal carbon reduction product allocation have been determined.
From the above formulas, it can be observed that the weights of the risk products depend on the value of the risk aversion coefficient A. In this problem, a larger value of A indicates a greater aversion to risk for the buyer. Based on empirical data, for risk-seeking individuals, A is set to 0.1. For risk-neutral individuals, A is set to 0.3. For risk-averse individuals, A is set to 0.8. In this case, the variance can be considered as a penalty term in the function, meaning that the higher the value of A σ 2 , the lower the likelihood of selecting that particular combination [41,42]. Subsequently, the focus will be on analyzing and calculating the risk-neutral buyers.

2.4.2. Initial Investment and Annual Carbon Reduction Product Purchase Cost Optimization

The aforementioned calculation processes represent the annual optimal configuration of carbon reduction products within a single year. Similarly, the park can also achieve a reduction in carbon emissions through energy-saving retrofitting. The relationship between the initial investment for energy-saving retrofitting and the energy-saving quantity has been described earlier. In this model considering the lifespan of equipment, it is assumed that the carbon reduction achieved through energy-saving renovations can be maintained for 10 years. Equation (21) represents the cost for 10-year life cycle of a net-zero park, the lowest cost in the life cycle can be derived.
min f E + i = 1 10 M e l e E + M c a r E ( 1 + i ) i
The annual cost-saving for electricity consumption M e l e ( E ) is calculated based on total energy saving amount E . To achieve the optimal pathway for a zero-carbon park, a balance needs to be struck between the initial investment, subsequent annual cost savings from energy reduction, and the cost of purchasing carbon reduction products. Assuming a risk-free three-year government bond interest rate of 3.25%, and given a specific risk preference, the cost of carbon reduction products is represented as M c a r E . The calculation process is as described above, with the optimization objective of minimizing the overall life cycle cost. Furthermore, it is generally accepted that the energy-saving ratio achieved through energy-saving renovations cannot exceed 40–45% of the total energy consumption [43]. In this case, the park’s baseline energy consumption is 9450 MWh, so the maximum energy-saving rate is set at 4250 MWh.
Simulation calculations are conducted for different energy-saving quantities by integrating the calculation methodology, boundary conditions for energy consumption and energy-saving retrofitting, and input parameters for carbon reduction products mentioned above. An implementation pathway model for optimizing zero-carbon parks is constructed to minimize the overall lifecycle cost. This model is then executed in a Python 3.6 environment.

2.5. Model Framework

In the Park Decision Model, the problem is broken down into two parts: the optimal carbon reduction portfolio and the optimal electricity saving. For the optimal product portfolio, the risk of carbon reduction products is balanced with the expected cost through the application of the Markowitz theory, achieving cost reductions at the expense of taking a certain amount of risk. In the process of optimizing the product portfolio, the effective frontier curve of expectation-standard deviation is initially calculated by combining risk products and identifying the tangent point between the frontier curve and the cost of risk-free products. These tangent points present the optimal risky product portfolio. Then, according to the risk-utility function U, the cost of risk is quantified, and combined with the risk appetite of the park, the overall optimal product purchase combination is obtained. In the optimal electricity-saving part, numerical calculation methods are employed in the model to calculate the life-cycle cost under varying electricity savings, including the initial investment in energy-saving renovation, the purchase cost of carbon reduction products, and the cost reduction caused by electricity saving. According to the calculation results, the optimal result is found, including electricity saving amount and optimal carbon reduction product portfolio. The model framework is shown in Figure 4.

3. Results

Current price information for carbon reduction products is used as a reference, and the approach for optimizing net zero emissions preferred by risk-conscious buyers is further analyzed. Meanwhile, the optimized combination of electricity savings and carbon reduction product purchasing is defined. In addition, based on this result, sensitivity analysis is conducted in both risk preference selection and future carbon market prediction scenarios.

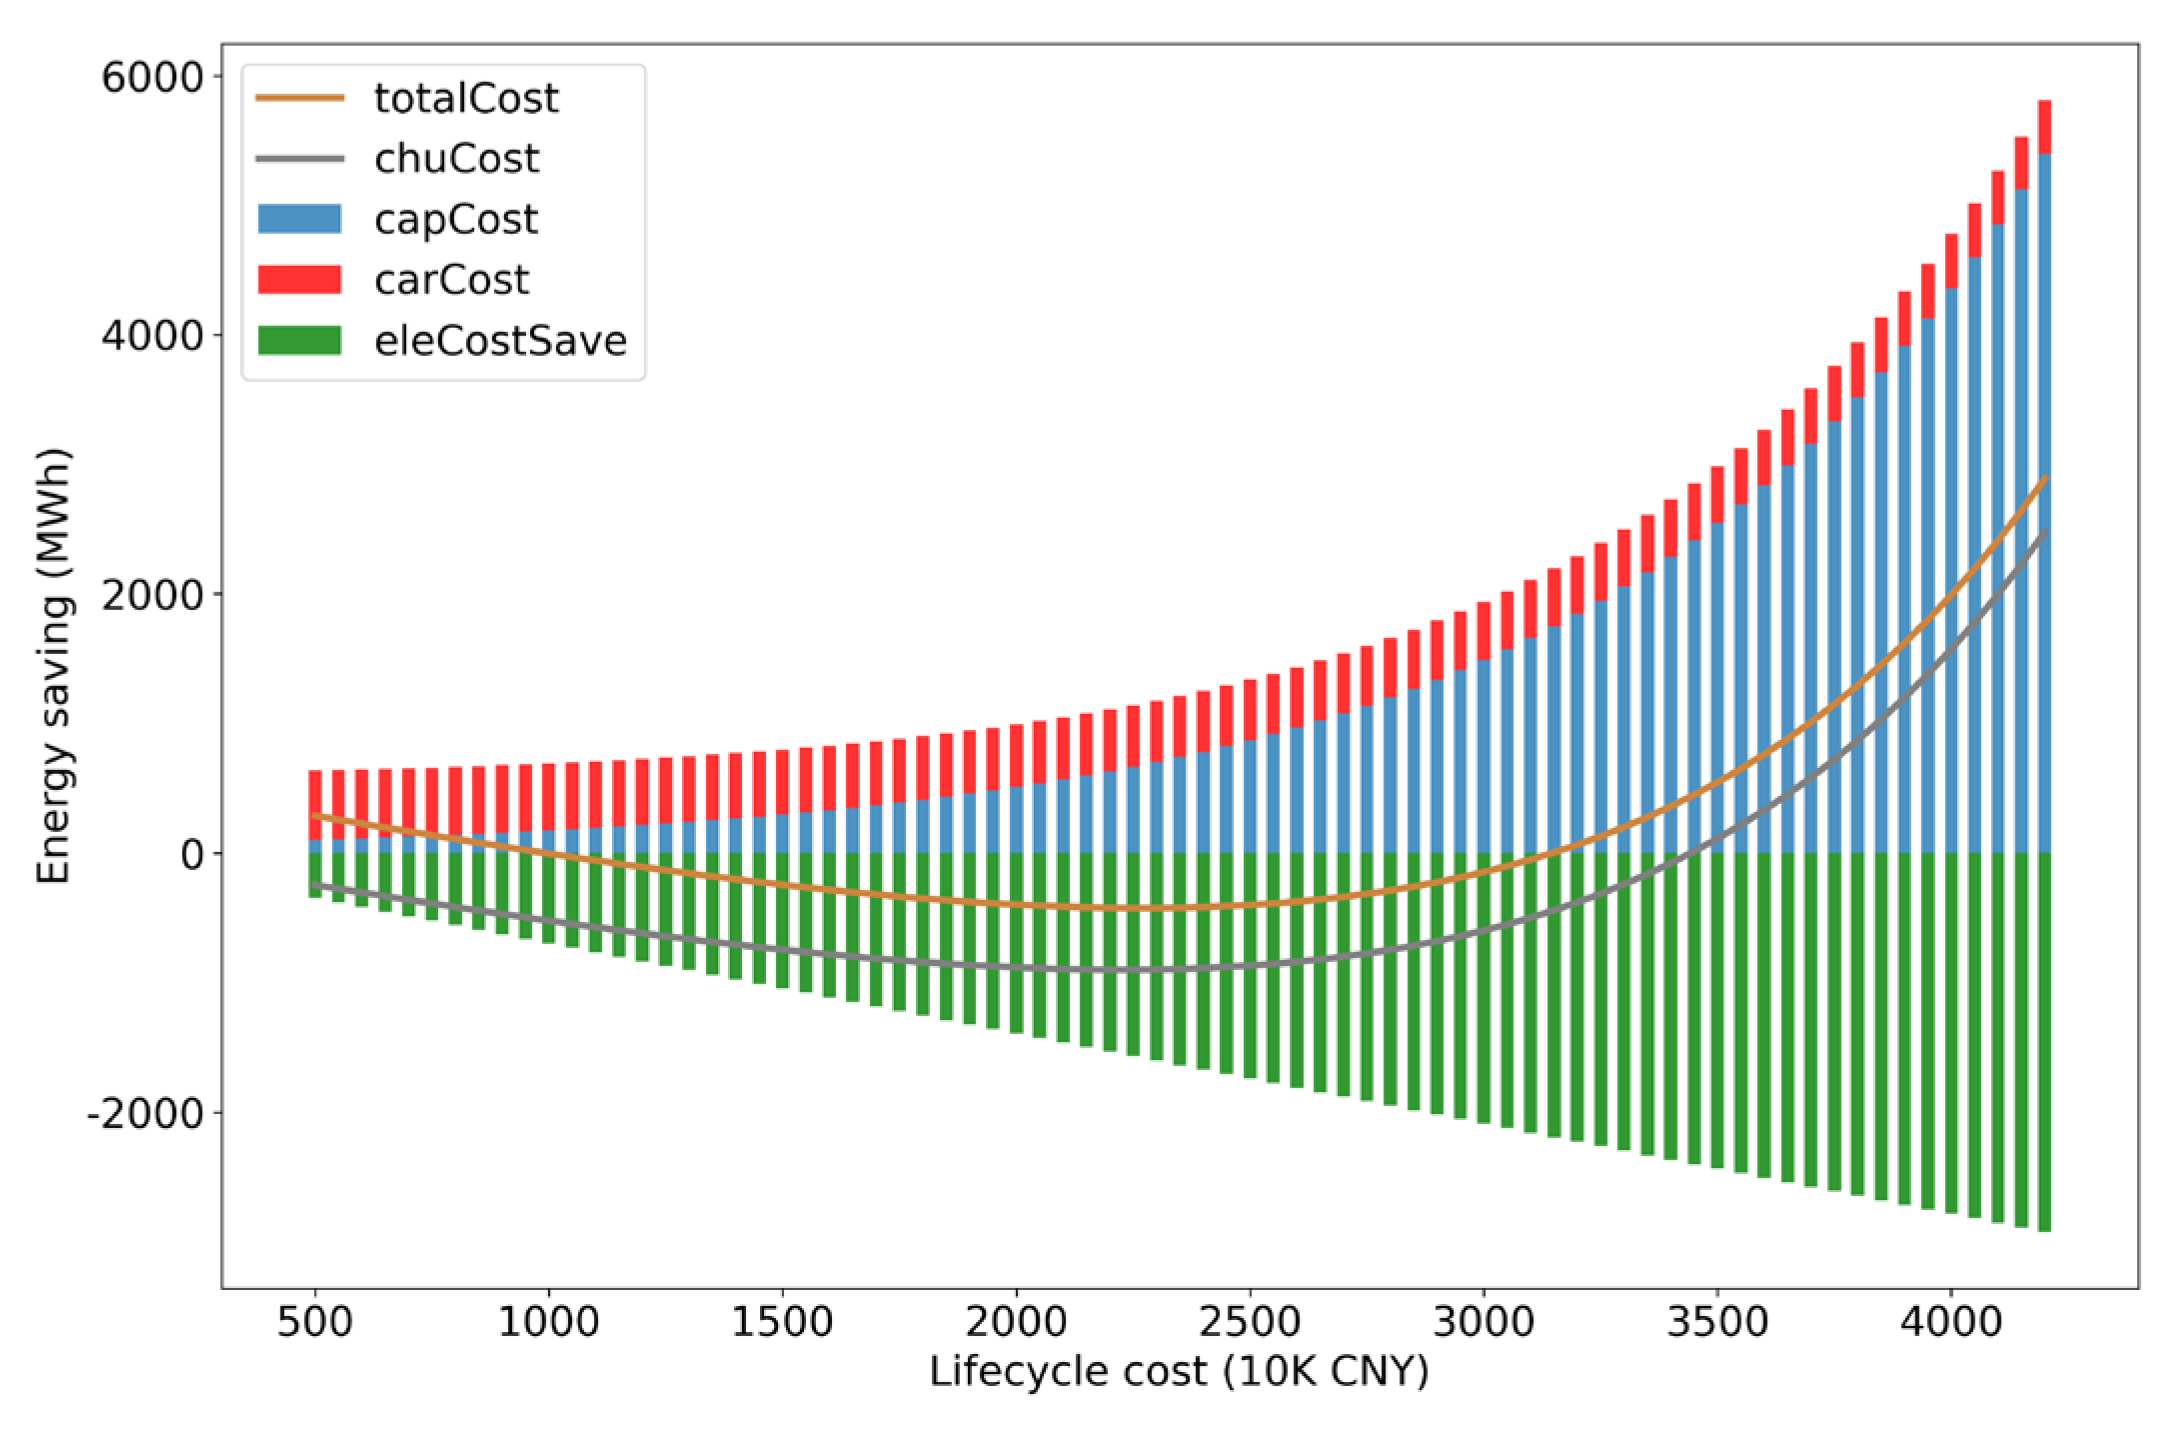
3.1. Baseline Scenario

Based on the mentioned risk preference type, assume a risk aversion coefficient of 0.1, which indicates that the buyer is willing to take on some risk to achieve lower price expectation. Building upon this assumption, this model proceeds with the calculations and plots the park’s overall lifecycle costs under different energy savings levels. These costs include the initial investment for energy-saving renovations, the purchasing cost of carbon reduction products, and the cost savings from electricity conservation resulting from the energy-saving renovations.
In Figure 5, the blue bar represents the initial investment (capCost) for energy-saving renovations, the red bar represents the optimal carbon reduction product purchasing cost (carCost) for the entire lifecycle (10 years), and the green bar represents the cost savings from electricity conservation (eleCostSave) resulting from the energy-saving renovations. By summing up these three components, the overall lifecycle cost of implementing a zero-carbon park under different levels of energy savings is obtained, as depicted by the brown curve (totalCost). The gray curve represents the cost considering only the initial investment for energy-saving renovations and the cost savings from electricity conservation. From the graph, it can observe that as the level of energy savings increases, the overall lifecycle cost initially decreases and then starts to rise.
The trend of the integrated curve of energy-saving initial investment and electricity cost is initially decreasing and then increasing. While the curve is decreasing, the users select low-cost energy-saving renovations as a starting point since the initial cost for saving a specific amount of energy is relatively low. The comprehensive cost is decreasing since electricity prices dominate it. However, when more advanced renovations or technologies are needed to save the same amount of energy, the comprehensive cost starts to increase. As research by Kim et al. (2022) has shown, implementing energy-saving technologies brings benefits in terms of electricity savings, but the costs and applicability of these technologies may vary. When the application scale increases, energy-saving increases significantly [43]. Therefore, the lowest point of the curve shifts to the right, and the optimal energy-saving amount is chosen as 2270 MWh, which is 24% of the total energy consumption of the park. This implies that business parks are willing to firstly invest more initial capital in energy-saving technologies to reduce emissions. This result also aligns with the original intention of the emissions trading system design, which aims to encourage energy-saving and emission-reduction behavior among users through the price of the allowances rather than solely relying on carbon offsetting and avoiding the occurrence of “green-washing” phenomena.
Under this most optimized approach in carbon reduction purchasing, the energy-saving quantity is 2270 MWh, and the annual carbon emissions for Scope 1 are 4379.8 t C O 2 The carbon reduction products purchasing portfolio for Scope 1 is listed in Table 3. Under this circumstance, the risk aversion factor is low, so the buyer could take certain risks to reduce the cost of the buyer’s purchasing. Consequently, the amount of CCER would be the largest in the buyer’s purchasing portfolio, I-REC comes next, and GEC will follow. On the other hand, the Scope 2 emissions would be entirely offset by CCER purchased.

3.2. Risk Appetite Sensitivity Analysis

Various risk aversion coefficients would lead to diverse purchasing decisions and portfolios. A risk aversion coefficient of 0.3 is assumed as risk neutral, and 0.8 is assumed as risk-averse for proceeding with the sensitivity analysis. Figure 6 indicates the relationship between the energy-saving amount and the life cycle cost. Figure 6a represents a risk aversion coefficient of 0.3 and Figure 6b represents a risk aversion coefficient of 0.8. Figure 4 and Figure 5 share the trend of decreasing before increasing and the same pivoting point at 2270 MWh, where the risk preference level is making a very limiting impact. Further analysis shows that for all risk-averse level buyers, when the risk aversion coefficient increase, both purchasing amount of risk-free products and the price expectation of purchasing portfolio increase. However, the price expectation increases from 62.6 CNY per ton to 71.7 CNY per ton. After conversion, the carbon reduction product cost for 1 MWh power is only 5.5 CNY which is insignificant compared to 750 CNY electricity cost for 1 MWh power. Therefore, the risk aversion level did not affect the curve’s trend. At the same time, the energy-saving amount was limited to integers, as the variation was insignificant; the pivoting point variation was not within an integer accuracy. Comparing Figure 6a and Figure 6b, different risk preferences are found to have minor impacts on the life cycle cost.
Different risk preferences result in different optimal combination (in Figure 7). With the risk preferences decreasing, the expected cost of carbon reduction products increases and the proportion of risk-free products (i.e., GEC) increases. Risk averse purchasers have to pay more for reducing the risks. Meanwhile, in all results, I-REC was selected as the lowest purchasing amount due to its low degree of recognition and high risk. Therefore, the result suggests reducing the purchase of I-REC to avoid high risk.

3.3. Carbon Market Price Rising

The sensitivity analysis reveals that as the carbon reduction products depreciate, the average price, which could fluctuate around 35–45 CNY/MWh due to various factors such as different risk preferences, whereas the electricity price is around 800 CNY/MWh. Therefore, the result is mainly decided by the cost of electricity and the investment amount on energy-saving renovation. However, as China is proactively progressing the carbon neutrality policies in domestic and international contexts, the Carbon Market price is expected to increase. Based on the prediction by Zhang and Huang (2022), the carbon price could reach 175 CNY/ton which is about 250% of the current price. When this carbon price was input into the model, the most optimized energy-saving level was increased to 2350 MWh, 25% of the total consumption [44,45]. Meanwhile, when the carbon price increases continuously, the cost to reduce emissions through energy-saving renovations could be lower than the carbon price. As a result, business parks would be more motivated to reduce emissions through energy-saving renovations which aligns with the national strategy’s initial intention.

4. Conclusions and Discussion

4.1. Conclusions

The optimization model is proposed to guide the best approaches for business parks to achieve their net zero emissions goals. In the optimization model, Markowitz theory is referred to for balancing the relationship between risk and expected cost, which attempts to obtain the optimal point of risk and benefit by optimizing the portfolio of carbon reduction products. Considering factors of energy-saving renovation investment and effectiveness, carbon reduction products purchasing price and potential risks, and also the park’s energy consumption situation, the risk preferred buyer was suggested to save 24% of energy consumption through renovation investment and purchase CCER as 66% of the carbon reduction product portfolio. The risk aversion sensitivity analysis indicates that when the carbon reduction product price difference is far less than the cost difference of electricity, the risk aversion level will not affect the optimized energy-saving renovation amount. However, the risk aversion level would affect the purchasing percentage of various carbon reduction products, where risk averse buyers would buy more low-risk products. More importantly, when the carbon market price rises, the optimized energy-saving renovation amount will go up.

4.2. Discussion

According to the results, implementation of energy-saving renovations to reduce emissions levels is suggested for all business parks. Our economic efficiency is benchmarked through the purchase of carbon reduction products. Compared to only utilizing carbon reduction product purchasing to reduce emissions, implementing an optimized level of energy-saving renovation would save 16% comprehensive cost for the life cycle. Moreover, as the carbon market price increases, the investment in energy-saving renovation should also increase.
For purchasing carbon reduction products, the parks could customize their purchasing portfolio based on their risk aversion level and avoid over-purchasing I-REC. Risk averse buyers could select more GEC that is risk-free. Meanwhile, the results suggest that the policymakers launch more policies to encourage business parks to perform energy-saving renovations.

4.3. Future Work

This study considers energy-saving renovation and carbon reduction product purchasing as two main approaches in modeling the optimized net zero emissions approach. However, the research has some limitations. First, due to the limited information on carbon reduction products’ prices, the assumptions are relatively simple and ignore the fluctuation during the year. Secondly, only three typical types of carbon reduction products were selected as there are some other options. The decision model focuses on considering diverse affecting factors. However, actual users could input the new factors such as price fluctuation, and park energy consumption changes into the model, which would add more meaning to the model.

Author Contributions

Conceptualization, X.W. (Xu Wu) and X.W. (Xinhao Wang); Data curation, Y.Y. and X.X.; Methodology, G.T., Y.Y., Y.C. and X.W. (Xinhao Wang); Software, Y.Y., Y.C., B.Y. and X.W. (Xu Wu); Validation, Y.Y. and B.Y.; Writing—original draft, G.T.; Writing—review and editing, X.W. (Xu Wu) and X.X. All authors have read and agreed to the published version of the manuscript.

Funding

This research was funded by National Natural Science Foundation of China (No. 71974109, 72140005), Mobility Programme (M-0708), Project of IUR cooperation between Tsinghua University and China Forestry Group Corporation on Forestry carbon sink development, Tsinghua University-China Three Gorges Corporation Joint Research Center for Climate Governance Mechanism and Green Low-carbon Transformation Strategy, and Tsinghua-Toyota Joint Research Institute Cross-discipline Program.

Data Availability Statement

The data presented in this study are available on request from the corresponding author. The data are not publicly available due to privacy restrictions.

Conflicts of Interest

The authors declare no conflict of interest. The funders had no role in the design of the study; in the collection, analyses, or interpretation of data; in the writing of the manuscript; or in the decision to publish the results.

References

  1. Yang, S.; Yang, D.; Shi, W.; Deng, C.; Chen, C.; Feng, S. Global evaluation of carbon neutrality and peak carbon dioxide emissions: Current challenges and future outlook. Environ. Sci. Pollut. Res. 2022, 30, 81725–81744. [Google Scholar] [CrossRef] [PubMed]
  2. The United Nations. Paris Agreement. 2015. Available online: https://heinonline.org/HOL/LandingPage?handle=hein.journals/intlm55&div=46&id=&page= (accessed on 15 August 2016).
  3. Houkai, W. The Strategic Choice and Policy Reconstruction to Promote Coordinated Regional Development. New Urban 2023, 6, 25–30. [Google Scholar]
  4. Chen, L.J. Carbon Dioxide Emissions from Industrial Parks Account for 31% of the Country, and the Four Strategic Paths Promote Carbon Emission Reduction in Parks. CECC-China. 15 March 2021. Available online: http://www.cecc-china.org/index/other/detail.html?id=25284 (accessed on 9 July 2023).
  5. Zhou, L.; Chen, Y.; Yu, Y. Optimization of Comprehensive Energy System in Low-Carbon Parks Based on Ladder Carbon Trading. Electrotechnical 2023, 8, 58–61+65. [Google Scholar] [CrossRef]
  6. Lăzăroiu, G.; Ionescu, L.; Andronie, M.; Dijmărescu, I. Sustainability Management and Performance in the Urban Corporate Economy: A Systematic Literature Review. Sustainability 2020, 12, 7705. [Google Scholar] [CrossRef]
  7. China’s State Council. Circular of the State Council on Printing and Distributing the Action Plan for Carbon Peak Peak by 2030. Central People’s Government of the People’s Republic of China, 26 October 2021. Available online: https://www.gov.cn/zhengce/content/2021-10/26/content_5644984.htm (accessed on 10 July 2023).
  8. Pop, R.A.; Dabija, D.C.; Pelau, C.; Dinu, V. Usage Intentions, Attitudes, and Behaviours towards Energy-Efficient Applications during the COVID-19 Pandemic. J. Bus. Econ. Manag. 2022, 23, 668–689. [Google Scholar] [CrossRef]
  9. Feng, J.-C.; Yan, J.; Yu, Z.; Zeng, X.; Xu, W. Case Study of an Industrial Park toward Zero Carbon Emission. Appl. Energy 2018, 209, 65–78. [Google Scholar] [CrossRef]
  10. Tian, J.; Guo, Q.; Chen, Y.; Li, X.; Shi, H.; Chen, L. Study on Industrial Metabolism of Carbon in a Chinese Fine Chemical Industrial Park. Environ. Sci. Technol. 2013, 47, 1048–1056. [Google Scholar] [CrossRef]
  11. Wang, H.; Lei, Y.; Wang, H.; Liu, M.; Yang, J.; Bi, J. Carbon Reduction Potentials of China’s Industrial Parks: A Case Study of Suzhou Industry Park. Energy 2013, 55, 668–675. [Google Scholar] [CrossRef]
  12. Ozarisoy, B.; Altan, H. Limitations: Developing an Evidence-Based Energy Policy Framework to Asset Robust Energy Performance Evaluation and Certification Schemes. In Handbook of Retrofitting High Density Residential Buildings; Springer: Cham, Switzerland, 2023; pp. 617–640. [Google Scholar] [CrossRef]
  13. Wei, X.; Qiu, R.; Liang, Y.; Liao, Q.; Klemeš, J.J.; Xue, J.; Zhang, H. Roadmap to carbon emissions neutral industrial parks: Energy, economic and environmental analysis. Energy 2022, 238, 121732. [Google Scholar] [CrossRef]
  14. Lăzăroiu, G.; Ionescu, L.; Uță, C.; Hurloiu, I.; Andronie, M.; Dijmărescu, I. Environmentally Responsible Behavior and Sustainability Policy Adoption in Green Public Procurement. Sustainability 2020, 12, 2110. [Google Scholar] [CrossRef]
  15. Zhang, S.; Wang, K.; Xu, W. Carbon Offset Constraint Limit of Green Electricity Trading and Carbon Trading in Zero Carbon Buildings. China National Knowledge Infrastructure, 2023. Available online: www.cnki.net (accessed on 1 August 2023).
  16. Sun, Y. Industrial Park’s Carbon Emissions Reduction Design Study Based on Multi-objective Optimization Model. Master’s Thesis, Shandong Jianzhu University, Shandong, China, 2023. [Google Scholar]
  17. Mei, X.; Zhang, M.; Liu, S.-T.; Qu, Z.-H. Study on Operational Feasibility of Park Based on Zero Carbon Model. In Volume 23: Proceedings of the 3rd International Conference on Green Energy, Environment and Sustainable Development (GEESD2022); Advances in Transdisciplinary Engineering Series; IOS Press: Amsterdam, The Netherlands, 2022; pp. 416–421. [Google Scholar] [CrossRef]
  18. Chen, J.; Gao, M.; Mangla, S.K.; Song, M.; Wen, J. Effects of technological changes on China’s carbon emissions. Technol. Forecast. Soc. Chang. 2020, 153, 119938. [Google Scholar] [CrossRef]
  19. Alabi, T.M.; Lu, L.; Yang, Z. A novel multi-objective stochastic risk co-optimization model of a zero-carbon multi-energy system (ZCMES) incorporating energy storage aging model and integrated demand response. Energy 2021, 226, 120258. [Google Scholar] [CrossRef]
  20. Song, D.; Lu, W.; Zhu, J. Quantitative Analysis of Value Investment Strategy of Listed Companies in New Energy Industry under the Goal of “Double Carbon”. Nat. Sci. J. Harbin Norm. Univ. 2022, 38, 5–13. [Google Scholar]
  21. Zhong, J.; Li, Y.; Cao, Y.; Tan, Y.; Peng, Y.; Zeng, Z.; Cao, L. Stochastic optimization of integrated energy system considering network dynamic characteristics and psychological preference. J. Clean. Prod. 2020, 275, 122992. [Google Scholar] [CrossRef]
  22. Fantozzi, F.; Bartocci, P. Carbon Footprint as a Tool to Limit Greenhouse Gas Emissions. In Greenhouse Gases; IntechOpen: London, UK, 2016. [Google Scholar]
  23. Le, T.-H.; Chang, Y.; Park, D. Renewable and Nonrenewable Energy Consumption, Economic Growth, and Emissions: International Evidence. Energy J. 2020, 41, 73–92. [Google Scholar] [CrossRef]
  24. Larionov, A.; Metechko, L.; Davydov, A.; Davydov, D. Prospects for the Development of Green and Energy Efficient Technologies in Construction. MATEC Web Conf. 2018, 193, 04027. [Google Scholar] [CrossRef]
  25. Ozarisoy, B. Energy effectiveness of passive cooling design strategies to reduce the impact of long-term heatwaves on occupants’ thermal comfort in Europe: Climate change and mitigation. J. Clean. Prod. 2022, 330, 129675. [Google Scholar] [CrossRef]
  26. Harputlugil, T.; de Wilde, P. The Interaction between Humans and Buildings for Energy Efficiency: A Critical Review. Energy Res. Soc. Sci. 2021, 71, 101828. [Google Scholar] [CrossRef]
  27. Li, C.Z.; Zhang, L.; Liang, X.; Xiao, B.; Tam, V.W.Y.; Lai, X.; Chen, Z. Advances in the Research of Building Energy Saving. Energy Build. 2022, 254, 111556. [Google Scholar] [CrossRef]
  28. Zhao, F.; Bai, F.; Liu, X.; Liu, Z. A Review on Renewable Energy Transition under China’s Carbon Neutrality Target. Sustainability 2022, 14, 15006. [Google Scholar] [CrossRef]
  29. Jia, H.; Liu, D.; Zhuo, G.; Feng, Y.; Han, Y. Review for Global Practices of Renewable Energy Certificates. In Proceedings of the 2023 8th Asia Conference on Power and Electrical Engineering (ACPEE), Tianjin, China, 14–16 April 2023; pp. 642–646. [Google Scholar]
  30. International Renewable Energy Certificates: The I-REC Standard (Part-I). Ccarbon.info. 27 April 2023. Available online: https://www.ccarbon.info/part-i-international-renewable-energy-certificates-the-i-rec-standard/ (accessed on 4 July 2023).
  31. Lo, A.Y.; Cong, R. After CDM: Domestic Carbon Offsetting in China. J. Clean. Prod. 2017, 141, 1391–1399. [Google Scholar] [CrossRef]
  32. Song, X.; Zhang, W.; Ge, Z.; Huang, S.; Huang, Y.; Xiong, S. A Study of the Influencing Factors on the Carbon Emission Trading Price in China Based on the Improved Gray Relational Analysis Model. Sustainability 2022, 14, 8002. [Google Scholar] [CrossRef]
  33. Beijing Emissions Electronic Trading System. Available online: https://www.bjets.com.cn/article/jyxx/?92 (accessed on 1 July 2023).
  34. Kiker, G.A.; Bridges, T.S.; Varghese, A.; Seager, P.T.P.; Linkov, I. Application of Multicriteria Decision Analysis in Environmental Decision Making. Integr. Environ. Assess. Manag. 2005, 1, 95–108. [Google Scholar] [CrossRef]
  35. Weyel, P.; Harry, M. Markowitz—Portfolio Theory and the Financial Crisis; Grin Publishing: Munich, Germany, 2011. [Google Scholar]
  36. Liu, Q.; Sun, Y.; Wu, M. Decision-Making Methodologies in Offshore Wind Power Investments: A Review. J. Clean. Prod. 2021, 295, 126459. [Google Scholar] [CrossRef]
  37. Lee, W. Practical Applications of Risk-Based Product Allocation: A New Answer to an Old Question? Pract. Appl. 2013, 1, 1–3. [Google Scholar] [CrossRef]
  38. deLlano-Paz, F.; Martínez Fernandez, P.; Soares, I. Addressing 2030 EU Policy Framework for Energy and Climate: Cost, Risk and Energy Security Issues. Energy 2016, 115, 1347–1360. [Google Scholar] [CrossRef]
  39. Dow, J.; da Costa Werlang, S.R. Uncertainty Aversion, Risk Aversion, and the Optimal Choice of Portfolio. In Uncertainty in Economic Theory; Taylor & Francis: Abingdon, UK, 2010; pp. 419–428. [Google Scholar]
  40. Frijns, B.; Koellen, E.; Lehnert, T. On the Determinants of Portfolio Choice. J. Econ. Behav. Organ. 2008, 66, 373–386. [Google Scholar] [CrossRef]
  41. Brick, K.; Visser, M.; Burns, J. Risk Aversion: Experimental Evidence from South African Fishing Communities. Am. J. Agric. Econ. 2012, 94, 133–152. [Google Scholar] [CrossRef]
  42. Choi, T.-M.; Li, D.; Yan, H. Mean–Variance Analysis for the Newsvendor Problem. IEEE Trans. Syst. Man Cybern. Part A Syst. Hum. 2008, 38, 1169–1180. [Google Scholar] [CrossRef]
  43. Li, B.; Han, S.; Wang, Y.; Wang, Y.; Li, J.; Wang, Y. Feasibility Assessment of the Carbon Emissions Peak in China’s Construction Industry: Factor Decomposition and Peak Forecast. Sci. Total Environ. 2020, 706, 135716. [Google Scholar] [CrossRef]
  44. Jang, D.; Kim, J.; Kim, D.; Han, W.-B.; Kang, S. Techno-Economic Analysis and Monte Carlo Simulation of Green Hydrogen Production Technology through Various Water Electrolysis Technologies. Energy Convers. Manag. 2022, 258, 115499. [Google Scholar] [CrossRef]
  45. Zhang, X.; Huang, X.; Zhang, D.; Geng, Y.; Tian, L.; Fan, Y.; Chen, W. Research on the Pathway and Policies for China’s Energy and Economy Transformation toward Carbon Neutrality. J. Manag. World 2022, 38, 35–55. [Google Scholar] [CrossRef]
Figure 1. The conceptual framework developed to illustrate the logical methodology of this study.
Buildings 13 02638 g001
Figure 2. Relationship function graph between initial investment and energy-saving amount.
Buildings 13 02638 g002
Figure 3. Cost-standard deviation relationship of riskless and risk products.
Buildings 13 02638 g003
Figure 4. The model framework: electricity saving and carbon reduction product portfolio.
Buildings 13 02638 g004
Figure 5. Lifecycle costs of implementing a zero-carbon park under different levels of energy savings.
Buildings 13 02638 g005
Figure 6. The relationship between power saving and the cost of the whole life cycle. (a) Risk aversion coefficient of 0.3, (b) Risk aversion coefficient of 0.8.
Buildings 13 02638 g006
Figure 7. The decision model results of three park buyers with different risk preferences.
Buildings 13 02638 g007
Table 1. Energy Consumption.
Energy ConsumptionCarbon Emission/tCO2
Electricity (Scope 1)9450 MWh5764.5
Natural gas (Scope 2)1.603 million m33399.7
Steam (Scope 2)2000 t709.1
Table 2. Relationship between renovation initial investment and energy-saving.
Inti Investment/10 k CNYElectricity Saving/MWh
80472.5
180945
3001417.5
5001890
8002362.5
12002835
20003307.5
28003543.75
32003685.5
40003969
50004158
Table 3. Carbon Reduction Product Purchasing Combination.
Purchase   Quantity   t C O 2 Expected   Cost   ¥ / t C O 2
CCER290866.5
I-REC93744.5
GEC53573
Total438062.6
Disclaimer/Publisher’s Note: The statements, opinions and data contained in all publications are solely those of the individual author(s) and contributor(s) and not of MDPI and/or the editor(s). MDPI and/or the editor(s) disclaim responsibility for any injury to people or property resulting from any ideas, methods, instructions or products referred to in the content.

