Article

Estimation of Rooftop Solar Photovoltaic Potential Based on High-Resolution Images and Digital Surface Models

1
Economic and Technological Research Institute of State Grid Hebei Electric Power Co., Ltd., Shijiazhuang 050021, China
2
State Key Laboratory of Resources and Environmental Information System, Institute of Geographic Sciences and Natural Resources Research, Chinese Academy of Sciences, Beijing 100101, China
3
College of Resource and Environment, University of Chinese Academy of Sciences, Beijing 100049, China
*
Author to whom correspondence should be addressed.
Buildings 2023, 13(11), 2686; https://doi.org/10.3390/buildings13112686
Submission received: 18 September 2023 / Revised: 18 October 2023 / Accepted: 20 October 2023 / Published: 25 October 2023
(This article belongs to the Section Building Energy, Physics, Environment, and Systems)

Abstract

:
Buildings are important components of urban areas, and the construction of rooftop photovoltaic systems plays a critical role in the transition to renewable energy generation. With rooftop solar photovoltaics receiving increased attention, the problem of how to estimate rooftop photovoltaics is under discussion; building detection from remote sensing images is one way to address it. In this study, we presented an available approach to estimate a building’s rooftop solar photovoltaic potential. A rapid and accurate rooftop extraction method was developed using object-based image classification combining normalized difference vegetation index (NDVI) and digital surface models (DSMs), and a method for the identification of suitable rooftops for solar panel installation by analysing the geographical restrictions was proposed. The approach was validated using six scenes from Beijing that were taken using Chinese Gaofen-2 (GF-2) satellite imagery and Pleiades imagery. A total of 176 roofs in six scenarios were suitable for PV installation, and the estimated photovoltaic panel area was 205,827 m2. The rooftop photovoltaic potential was estimated to total 22,551 GWh. The results indicated that the rooftop photovoltaic potential estimation method performs well.

1. Introduction

Under the background of climate change, carbon dioxide reduction has become a worldwide extremely urgent task and is the transformation of the world’s energy systems. Solar energy has received limited attention as a kind of new renewable energy. In recent years, driven by technological progress, the photovoltaic (PV) power generation industry, which is one of the most scientific and sensible ways to utilize solar energy, has achieved rapid development. In 2020, 127 GW of new PV power generation were installed globally, bringing the cumulative installed capacity to 707 GW. Among the available technologies, rooftop PV is the inevitable trend of the coming decades. Understanding rooftop PV potential is critical for the development and utilization of solar energy. However, the maximum rooftop PV potential remains unknown because it is difficult to obtain a rooftop map in most parts of the world.
Some researchers have studied estimating the PV potential in different regions using different methods. F.M. Kouhestani et al. used a multi-criteria approach based on geo-graphic information systems (GIS) and light detection and ranging (LiDAR) to estimate rooftop photovoltaic electricity potential of buildings in the city of Lethbridge [1]. E.C. Kutlu et al. modelled five different modules with different efficiencies and module sizes in Helioscope to calculate the suitable roof area for PV panels in Ankara [2]. T. Vries et al. reconstructed virtual 3D roof segments using aerial imagery and simulated PV modules using a fitting algorithm to calculate rooftop PV potential [3]. S. Joshi et al. presented a high-resolution global assessment of rooftop solar photovoltaics potential using big data, machine learning and geospatial analysis [4]. The PV-available rooftop can be obtained by simulating the building structure. This method has high accuracy, but it is only suitable for a small range because high-precision data is rare. For large-scale PV potential maps, the area available for PV is usually estimated by rooftop map, directly or indirectly. In this case, two factors affect the accuracy of PV potential: the accuracy of the rooftop map and the estimation method of the available area of the rooftop, which usually uses coefficients.
A rooftop map is the first requirement for evaluating the rooftop PV potential. Building detection from aerial and satellite images has long been a major research area, especially with recent improvements in remote sensing techniques. However, building extraction is difficult due to different roofing materials, complicated and heterogeneous external shapes, and environmental influences [5]. Several approaches have been developed for building extraction. Traditional methods used to recognize buildings are mainly manual visualization and pixel-based classification. Since the manual extraction of buildings from satellite images requires qualified domain experts and a large amount of time and money, researchers have been working for many years on developing automated building detection methods. Pixel-based classification includes supervised and unsupervised classification [6,7]. Supervised classification analyses the attribute information of each known class and sets the classification rules to classify other unknown pixels [8,9]. Unsupervised classification first clusters pixels to some classes with similar attributes, and then labels the pixels of each class [10,11]. Currently, object-oriented extraction methods are some of the most commonly used building detection algorithms. This method included two steps of segmentation. First, pixels with the same or similar spectral values are grouped into individual objects. Second, individual objects are labelled with the appropriate classes based on the object’s features [12]. For high-resolution satellite remote sensing images, the method has become accepted as an efficient method for building identification since the combination of spectral, shape, and textural features can fully utilize a wealth of information [13]. In addition, the incorporation of some multisource information (such as vector data, vegetation index, and the digital surface model (DSM) may assist the object-based image classification in solving the problem. It may also achieve a better understanding and higher accuracy than utilizing remote images from a remote sensor alone [12]. The normalized difference vegetation index (NDVI) is often used to distinguish impervious surfaces and vegetation [14]. DSM extracted from stereo optical imagery can be used as auxiliary information for building extraction, since the spatial resolution of satellite stereo data is increasing [15]. In this case, the addition of NDVI and DSM in the two key steps of object-oriented extraction method should improve the accuracy of building detection.
The PV-available rooftop is the basis of PV potential assessment. Some analyses divide the buildings into commercial and industrial buildings and residential buildings [16]. Some researchers divided the rooftops into flat roofs and sloped rooftops based on the difference in the roof inclination [17]. Others assessed it at a city scale, deriving the rooftop area from the satellite images without considering the details of the rooftops [18]. On a micro level, most of the considered factors for selection of suitable rooftops for solar panel installation are related to the geographical effects, such as rooftop geometry, trees shading effects, superstructures located on rooftops, and rooftop inclination [19]. Not all rooftops are suitable for installing PV panels. The selection of suitable sites for solar panel installation is heavy, time consuming, and less accurate. Therefore, quickly identifying the rooftop suitable for installing photovoltaic and assessing PV potential is urgently needed for further develop rooftop photovoltaics and promote clean energy.
This research explores an operational rooftop PV potential evaluation based on GF-2 satellite images. The primary objective of this study was to develop a rapid and accurate rooftop extraction approach, using object-based image classification combining high-resolution NDVI and DSM, and to propose an approach to the identification of suitable rooftops for solar panel installation. Firstly, the NDVI and DSM were used in object-based image classification to extract building rooftops. Then, the geographical restrictions were used to extract the photovoltaic rooftops available rooftops by analysing the rooftop area and standard deviation of the DSM. Finally, an estimate of rooftop PV potential was performed, taking various influencing factors into account, such as shading, PV panel efficiencies, and average solar insolation in the region. This result can be used to direct relevant government departments.

2. Materials and Methods
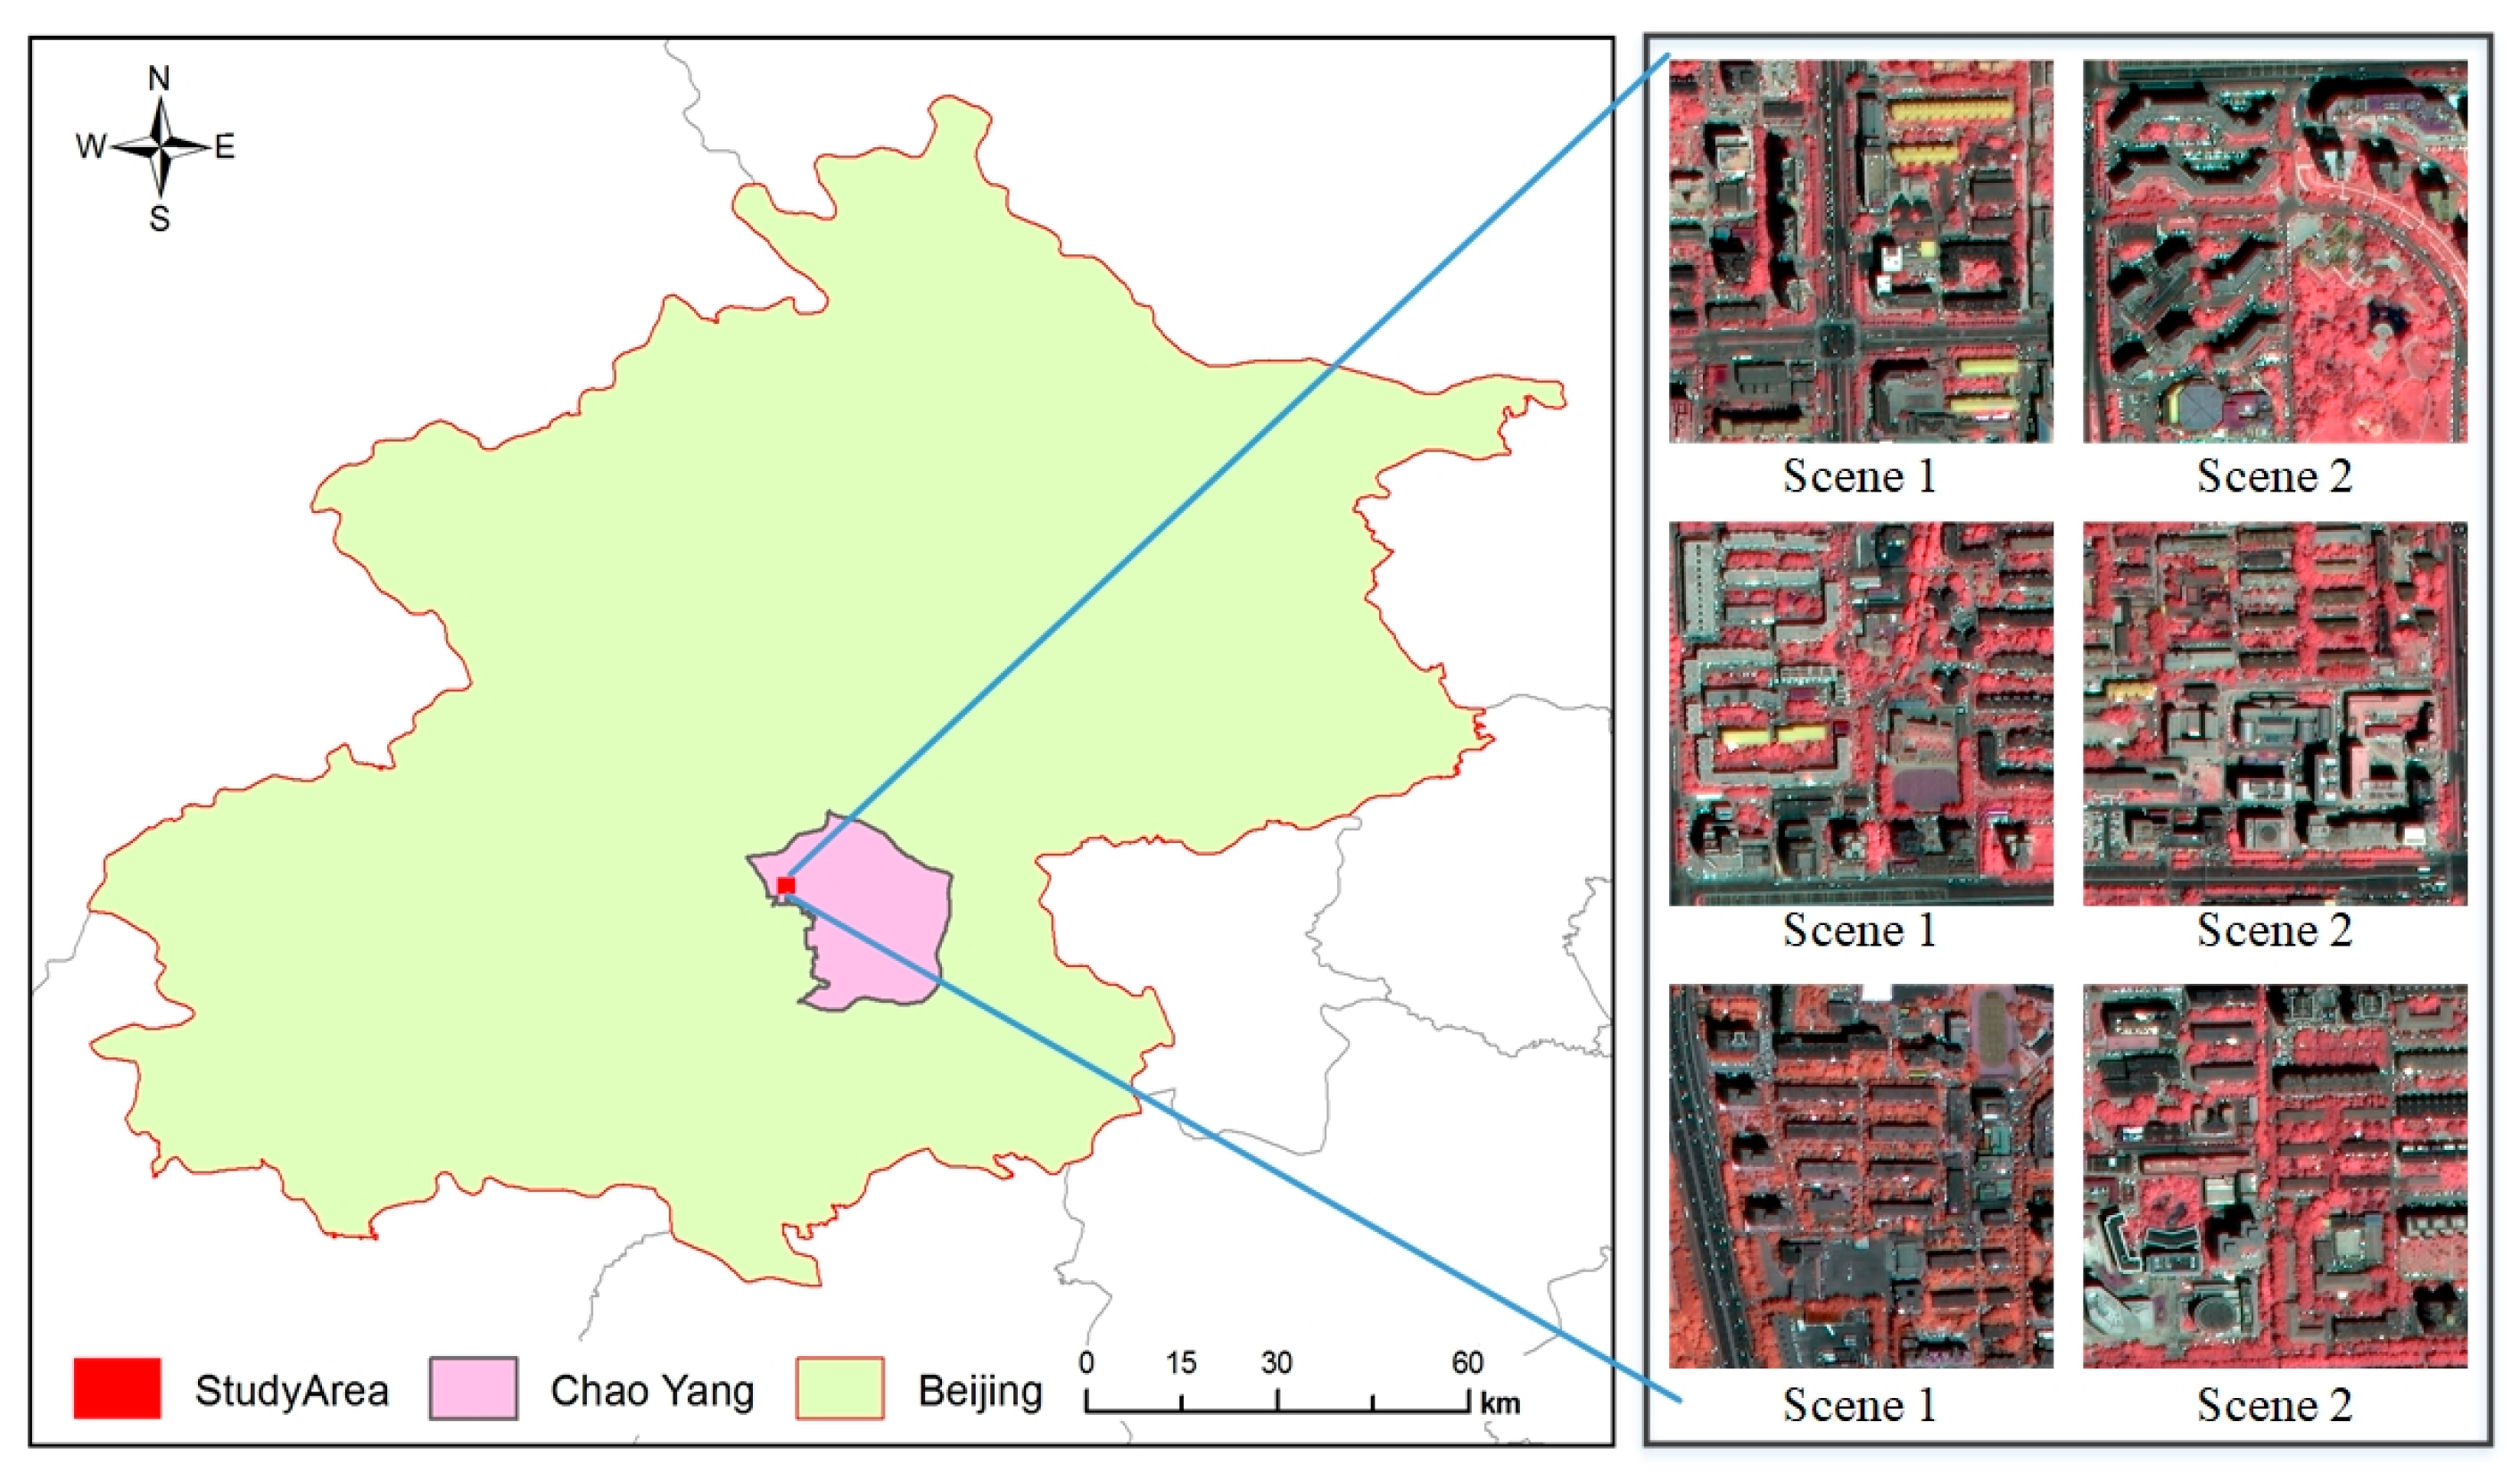
A total of six typical scenes were selected from the Chao Yang district of Beijing, China to implement and validate our proposed approach, using high-resolution images, NDVI, DSM, and surface solar radiation.

2.1. Study Area

The developed building detection methodology was tested on six typical scenes selected from the Chao Yang district of Beijing, China. These scenes had different building densities and types (Figure 1).
The district regular residential area is under the government’s planning, and all kinds of infrastructure are included. Thus, in this area there are various types of buildings such as residential, industrial, and commercial, with different colours, sizes, and shapes. Figure 1 illustrates the test scenes in false colour composites. The areas covered by the urban scenes were 400 m × 400 m for all scenes. In Scenes 1, 3, 4, and 6, there are 29, 40, 35, and 41 buildings with various shapes and colours, respectively. The buildings distribution is complex. In contrast, in Scenes 2 and 5, there are approximately 15 and 26 buildings with similar shapes, and the buildings have regular distribution and flat rooftops. Various types of buildings in 6 scenes are better to validate our proposed approach.

2.2. Datasets and Software
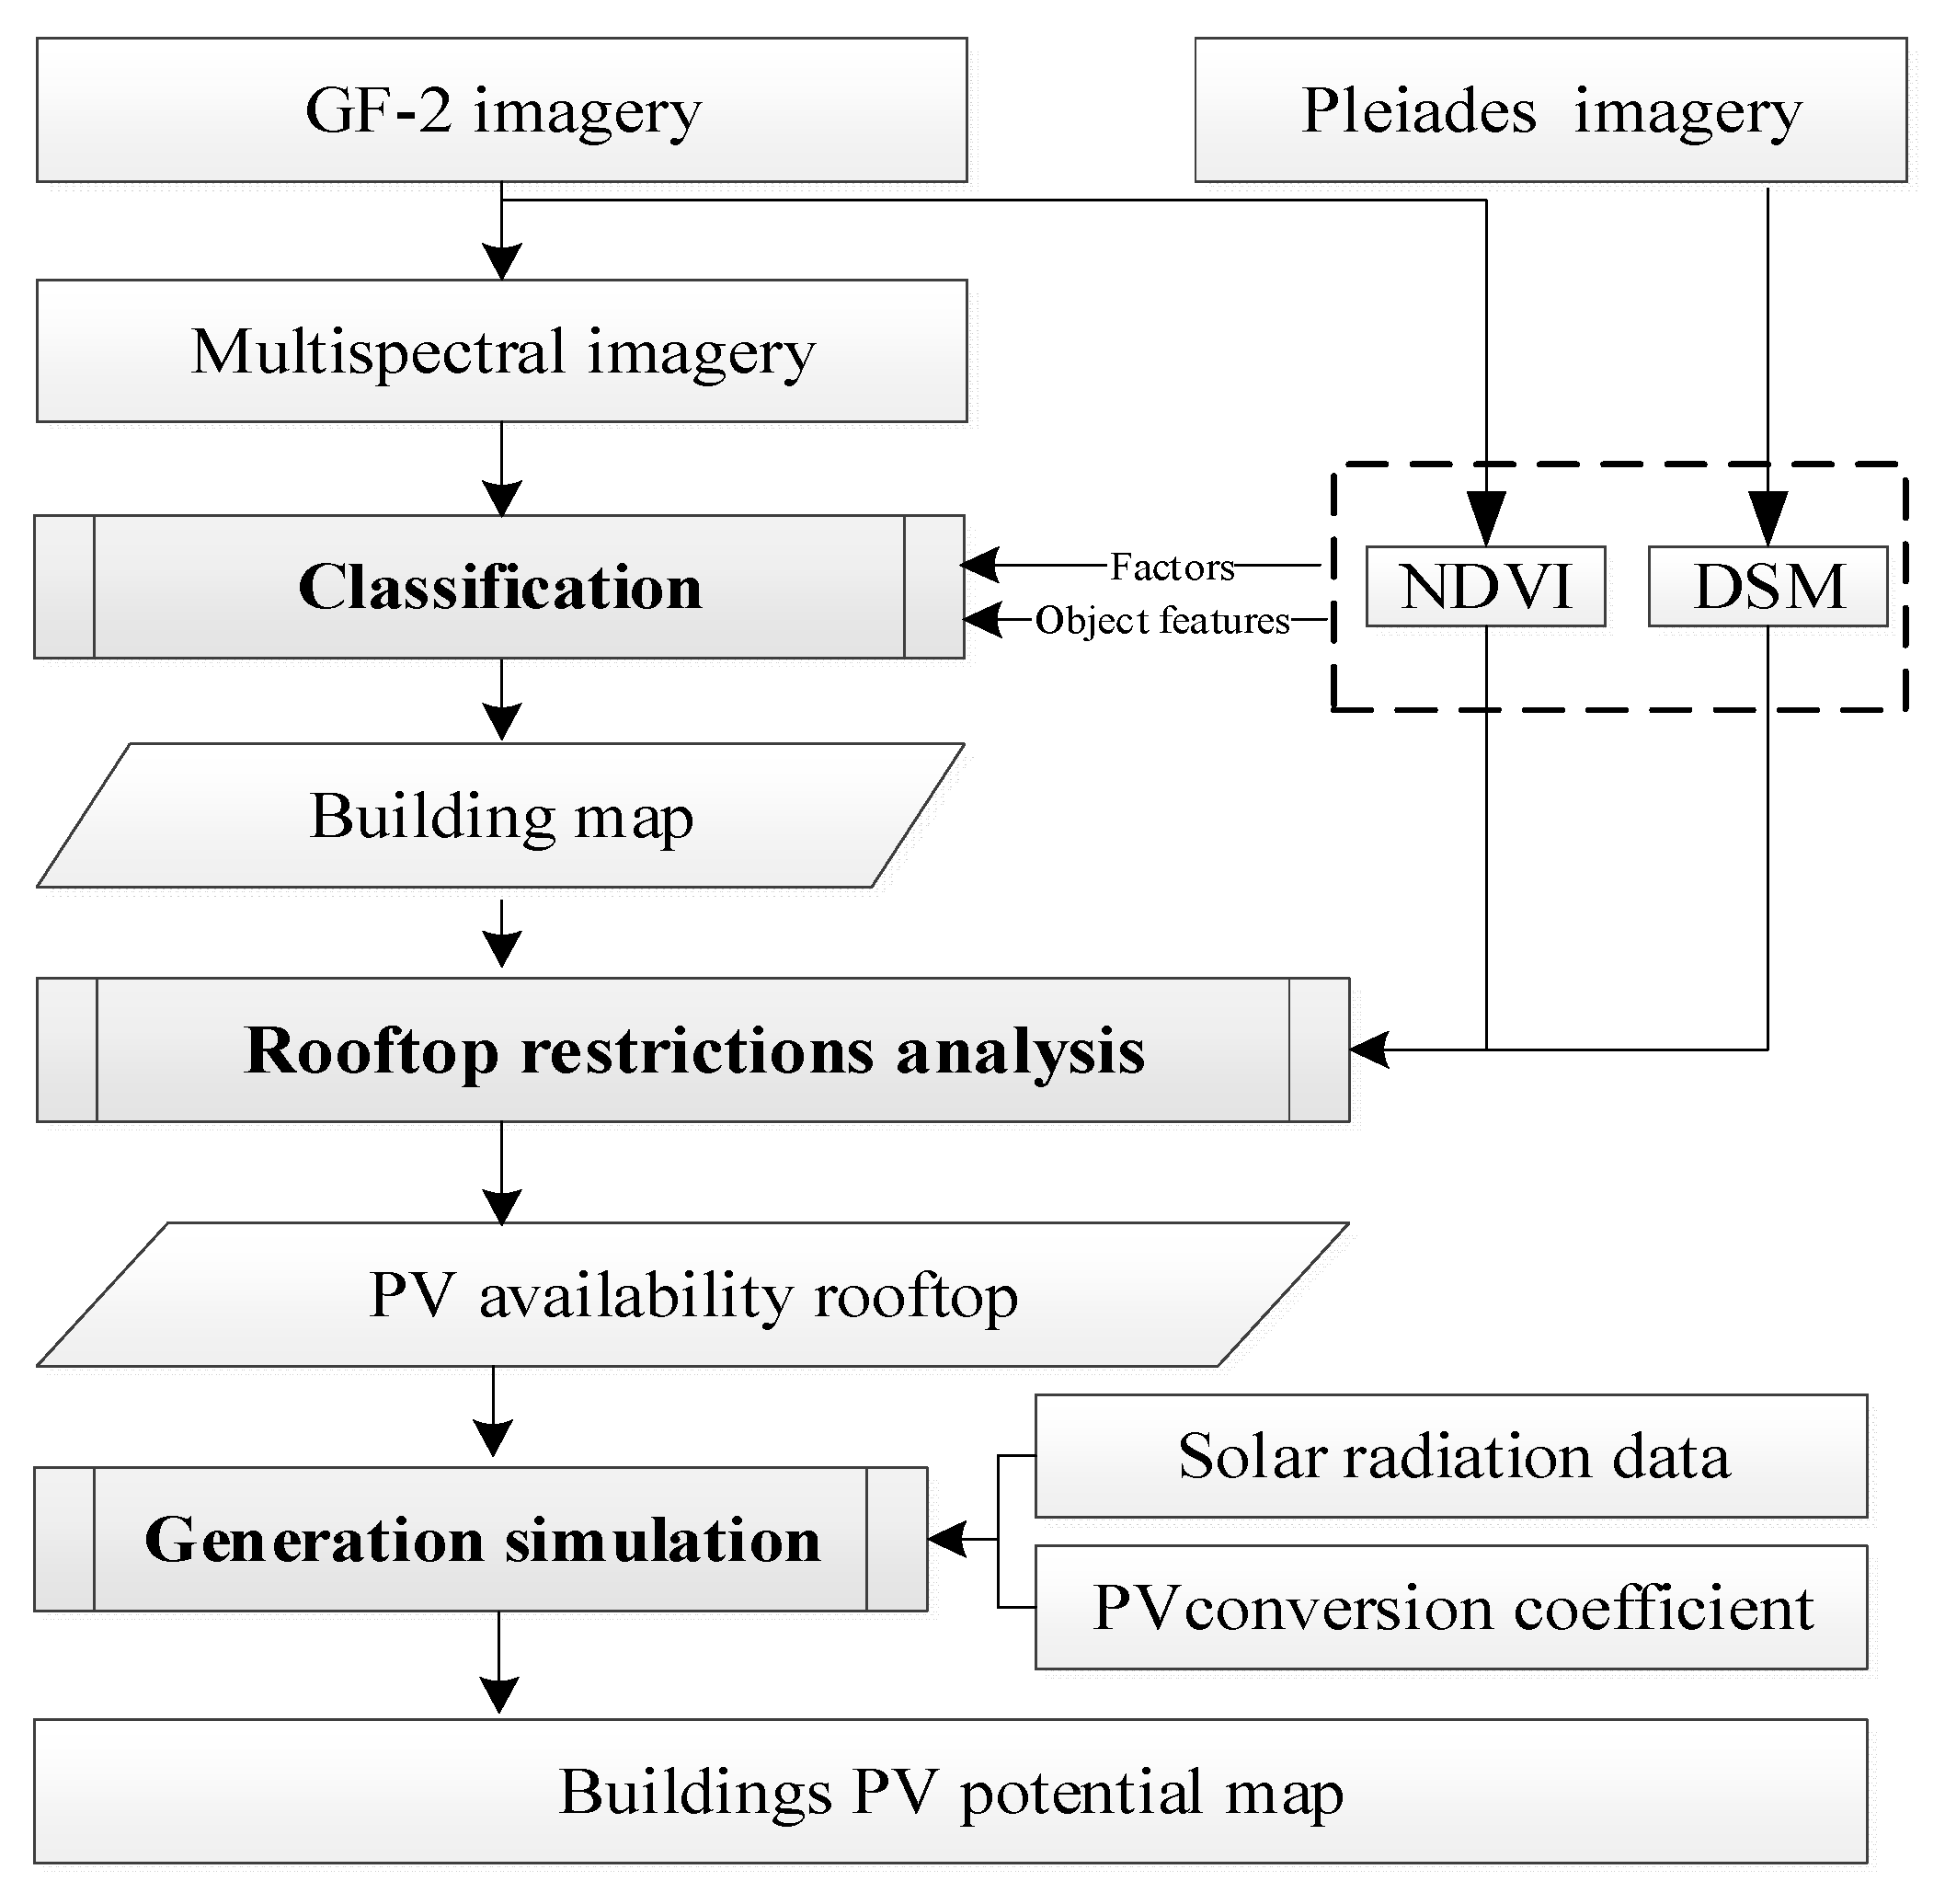
The high-resolution images were acquired in August 2017 from the GF-2 satellite launched by China. The GF-2 imagery includes a panchromatic band (450–900 nm) at 1 m spatial resolution and four multispectral bands consisting of one near-infrared (NIR) band (450–520 nm) and three visible (RGB) bands with green (520–590 nm), red (630–690 nm), and blue (770–890 nm) at 4 m. The data preprocessing included radiation correction, geometric correction, and pansharpening.
NDVI is the best indicator of vegetation growth and can reflect the condition of surface vegetation. NDVI was calculated based on the red and near infrared bands of the GF-2 images.
The DSM was generated from Pleiades images. It was resampled to 1 m, which is the same as the resolution of the GF-2 data. Subsequently, the GF-2 data, NDVI, and DSM were merged into an image with 6 bands.
High-resolution (3 h, 10 km) global surface solar radiation (1983–2018) (HGSSR) was used for the calculation of photovoltaic power generation. The dataset was generated by an improved physical parameterization scheme using ISCCP-HXG cloud products, ERA5 reanalysis data, and MODIS aerosol and albedo products. Based on these, the average annual solar radiation was calculated.
A program was developed using C# language based on Visual Studio Code. This was used as the implementation tool for the proposed approach.

2.3. Methodology

A three-step procedure was used in this study to analyse the available rooftop PV potential, as shown in Figure 2. In Step 1, the building map was extracted by the object-based classification method based on GF-2 imagery and Pleiades imagery. NDVI and DSM were used to optimize the object-based classification method. The height information was expressed as DSM, and the spectral information was enhanced by NDVI. They were embodied in both the segmentation and classification of the object-based classification method. In Step 2, rooftop restriction was analysed; the rooftops that were not suitable for PV were removed by calculating the ratio of rooftop area and standard deviation of the DSM. In Step 3, PV potential was evaluated based on the solar radiation data and PV conversion coefficients consist of solar energy received directly by PV panels, PV module conversion efficiency, and operating efficiency.

2.3.1. Building Extraction

The object-based image classification of this study consisted of multiresolution segmentation and rule-based classification. Multiresolution segmentation takes pixels as the base unit and merges adjacent pixels with similar attributes based on a local homogeneity criterion [20]. The process starts with a separate object, calculates the heterogeneity between it and its four neighbouring pixels or objects. Subsequently, the separate object and one neighbouring pixel or object with the smallest heterogeneity are merged, and the large object is formed in several loops [21]. With the growing heterogeneity during object merging processing, a heterogeneity threshold is set, thereby determining whether the pair of imaged objects needs to be merged and whether to end the segmentation process. Heterogeneity (f) is weighted by spectral heterogeneity and shape heterogeneity of the merged image object combining NDVI and DSM.
NDVI is the most typical vegetation index and is an effective tool for distinguishing vegetation from nonvegetation. In general, the objects were classified as vegetation if NDVI was greater than 0 and as nonvegetation (including buildings, road, water, etc.) if NDVI was less than 0. Therefore, whether NDVI is positive or negative plays a determinative role in the process of segmentation. DSM, which can efficiently describe complex building environments, was used as a constraint. Buildings have accidental and unexpected characteristics because they are designed and built by people instead of formed naturally. The DSMs of buildings and other land cover types are significantly different and have clear and distinct demarcations. Therefore, DSM can be used as an important factor to calculate heterogeneity. The formula to calculate heterogeneity can be expressed as follows [20]:
f = w N D V I · ( w 1 h c o l o r + w 2 h s h a p e + w 3 h D S M )
where w N D V I   describes the influence of NDVI. w 1 , w 2 ,   and w 3   are the weights of spectral, shape, and DSM heterogeneity, respectively. Hcolor, hshape, and hDSM are the spectral, shape, and DSM heterogeneity, respectively.
The influence of NDVI w N D V I   can be calculated by the mean NDVIs of paired merging objects ( N D V I _ m e a n ), which is the ratio of the difference and the sum of the mean reflectance at NIR and red bands. The formula is shown as follows:
N D V I _ m e a n = ( N I R _ m e a n R _ m e a n ) ( N I R _ m e a n + R _ m e a n )
w N D V I = 1 ,   N D V I _ m e a n 1 · N D V I _ m e a n 2 > 0 w N D V I = 0 ,   N D V I _ m e a n 1 · N D V I _ m e a n 2 < 0
where N D V I _ m e a n 1 and N D V I _ m e a n 2   are the mean NDVIs of paired merging objects.
hDSM is the difference of the DSM of two merging objects and consists of two factors: the difference between the two mean DSMs and the difference of DSM in public edges. In previous studies [22], DSM was considered as a layer, such as a spectrum band, and its standard deviation was a factor of spectral heterogeneity.
Rule-based classification was used to detect buildings based on the imaged objects after performing full image segmentation rather than using single pixels. The rule set should be proposed by analysing the characteristics and attributes of the imaged object’s features, including buildings, roads, and trees. To improve the classification efficiency, it is necessary to combine the approach with expert human knowledge. For example, vegetation, including forests and grasslands, has high NDVI values and low brightness. Buildings have higher DSMs than other land cover types, and water has very low brightness. This information can be used to create rules for vegetation, asphalt, and concrete [13]. For each object, one rule or a set of rules was created and defined as the class description. The characteristics of buildings, relative to other types, were more obvious. In this study, we detected buildings by defining the rules and constraints of buildings based on the characteristics of the spectral, shape, and textural features.

2.3.2. Rooftop Restriction

Buildings have different shapes because of their design and use; therefore, not all building rooftops are suitable for the installation of rooftop solar PV systems. Furthermore, because the roof facilities are installed on the rooftop and the irregularity of the roof area, some rooftops or some portions of the rooftop are not suitable for the installation of PV systems, as shown in Figure 3.
In this study, the ratio of rooftop area and standard deviation of the DSM (RASD) was defined to describe the rooftop availability for PV systems. If the RASD is too large, it is considered unsuitable for PV installation. The formula is shown as follows:
RASD = 1 N 1 i = 1 N ( x i x _ _ ) 2 A r e a × 100 %
where N is the number of pixels in the rooftop object, xi is the value of DSM, x ¯ is the mean DSM of a rooftop, and Area is the rooftop area.
In addition, the effective area of solar PV panels installed on the rooftops of buildings is smaller than the rooftop area because of some chimneys, air conditioning, and other facilities. An effective photovoltaic available roof area ratio (PVAR) needs to be defined. PVAR was set according to RASD. The smaller RASD is, the more facilities there are on the rooftop or the more uneven the rooftop, and the larger PVAR is. Conversely, the larger RASD is, the smaller PVAR is.
According to the relevant literature [23] and taking samples of a few rooftops, the PVAR ranged from 0 to 0.75, as shown in Table 1.

2.3.3. PV Potential Evaluation

Based on the solar radiation data, the building rooftop PV annual output was estimated. There are three steps to converting solar energy into electricity: (1) solar energy received directly by PV panels. Under ideal conditions, it is believed that the PV-available rooftop can be covered with PV panels, so that the solar radiation obtained by PV panels is the product of solar radiation and the effective area of roof photovoltaic; (2) PV module conversion efficiency, which is the efficiency of converting solar energy by PV panels into electricity, and it is determined by the type of photovoltaic panel, such as monocrystalline silicon and multicrystalline silicon; and (3) operating efficiency, which represents that the PV system will lose part of its energy during operation. The formula is shown as follows [17]:
E = A p × G × η × λ = A × P V A R × G × η × λ
where E is the building rooftop PV annual output;   A p is the area of PV panels; A is the area of the area so the rooftop; G is the amount of solar energy received in a year, namely the average annual solar radiation; and η is the PV module conversion efficiency; the PV modules selected and η are different. Multicrystalline silicon is adopted for PV panels, and η is 15.5% [24]. λ is the operating efficiency of the photovoltaic system, and a conservative value of 0.75 is adopted [25].

2.3.4. Accuracy Assessment

In this study, the quality metrics used to evaluate the building extraction results included completeness, correctness, and score. The pixels were labelled true positive (TP), false positive (FP), and false negative (FN) [26]; they were used to calculate the quality metrics of completeness, correctness, and score, as illustrated in Table 2 [27].

3. Results and Discussion

Based on the proposed methodology, a rooftop potential assessment was conducted. The results of classification, PV rooftop extraction and PV potential, were presented and discussed in this section.

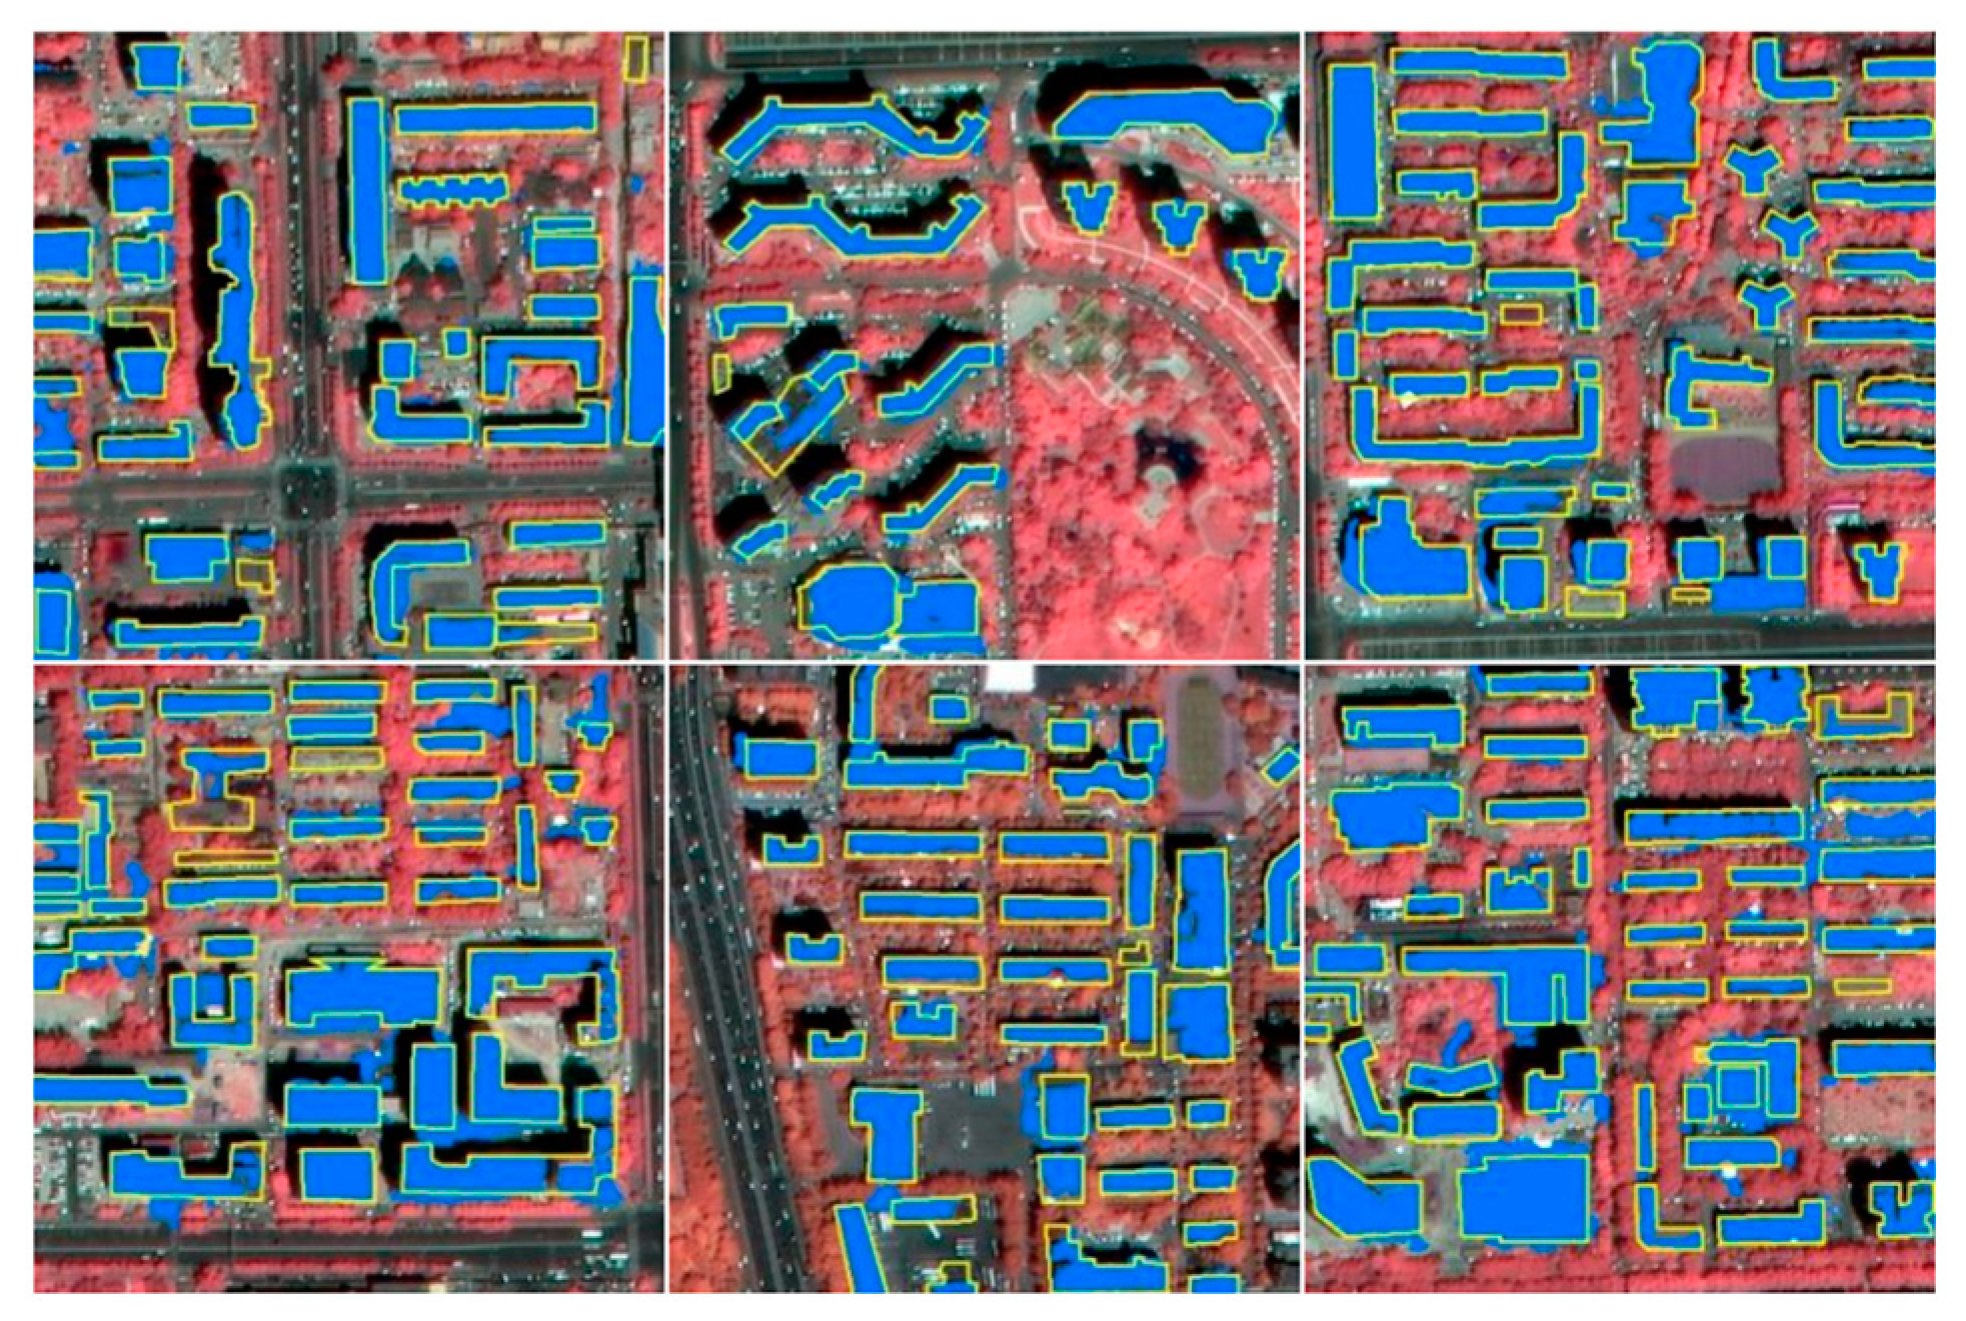
3.1. Results Classification

The classifications were performed, and the results were labelled TP, FP, and missed building pixels FN, as illustrated in Figure 4. According to the results, the optimized approach was highly robust and convincing. Most buildings were successfully extracted, and their positions were accurate. In some scenes, a few missing buildings may be due to the irregularity of some buildings, which were not standard shapes (e.g., rectangle or circle) and whose edges could not be extracted successfully, the complexity of some buildings (which may be composed of smaller buildings with varying heights and shapes), a slight difference between background and the buildings (which was not enough to distinguish buildings from the background), or other factors.
Based on TP, FP, and FN, completeness, correctness, and score were calculated to quantitatively evaluate the building extraction. Their results are listed in Table 3. The results indicated that there were fewer missing building pixels than incorrectly detected pixels for most scenes. Only in Scene 5 was the correctness larger than the completeness. The maximum and the minimum completeness of the six scenes were 86.97% and 78.63%, respectively. The maximum and the minimum correctness were 86.95% and 74.89%, respectively. The scores over the six scenes show no great difference, ranging from 79.11% to 84.1%. The minimums of the three metrics all appeared in Scene 5. It is possible that this occurred due to small differences between background and buildings. On the whole, the optimized approach shows 82.92% overall completeness, 79.58% overall correctness, and 81.21% overall score for all scenes. Therefore, the building extraction method was successful.

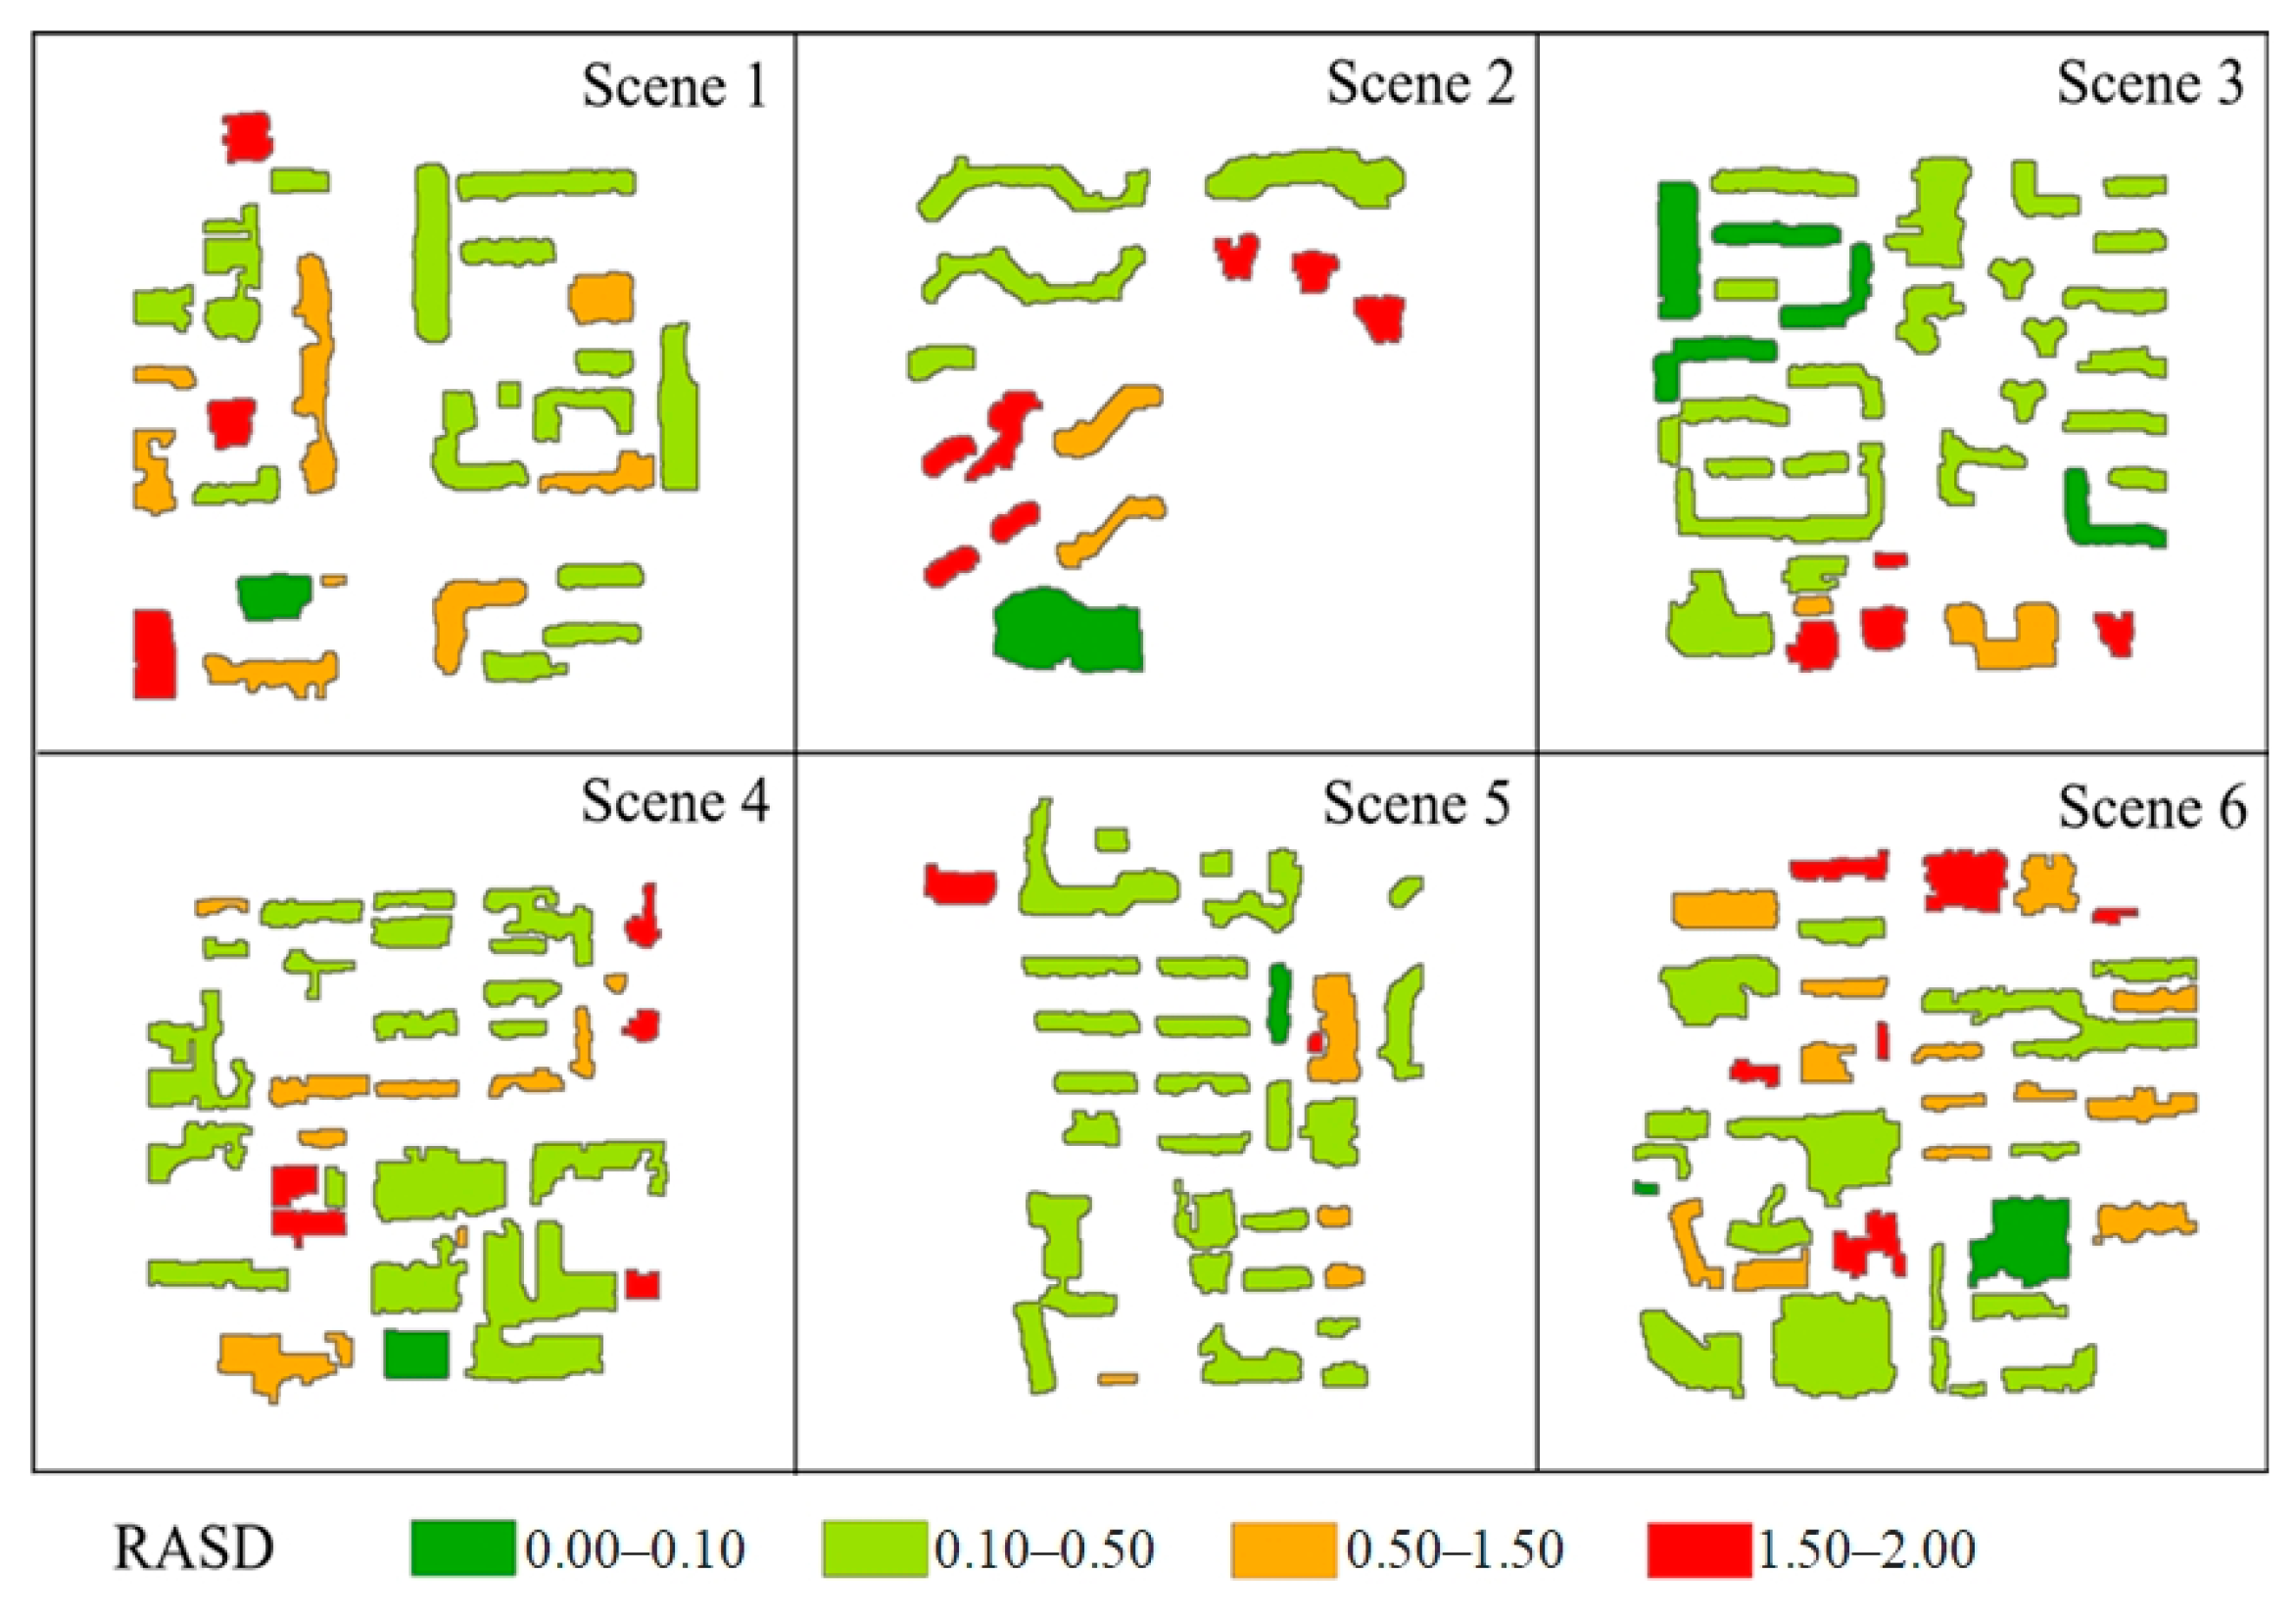
3.2. Results PV Rooftop Extraction

The classification results were postprocessed by the morphological method to solve the problems of small areas, holes, and burrs. Corrosion and expansion operations were used to smooth the boundary, remove small sliver polygons, and fill the hole. Then, RASD was used to eliminate the rooftops that are not suitable for photovoltaic installation, as shown in Figure 5. Overall, most RASDs of rooftops in the six scenes are low. In Scene 1, Scene 2, and Scene 3, RASDs were less than 2, which indicated that the rooftop facilities were fewer and that the rooftops were relatively level in these scenes; thus, the rooftops in these scenes were suitable for PV installations. In the other three scenes, there are seven rooftops with high RASDs (greater than 2), and two of them are distributed in Scene 4, three in Scene 5, and two in Scene 6. In this study, rooftops with RASDs greater than 2 were considered unsuitable for photovoltaic installations through field surveys and expert consultations. To summarize, a total of 176 roofs in six scenarios were suitable for PV installation. Without the use of these two indices, the seven rooftops that are not suitable for the installation of photovoltaic panels, will be counted in the calculation of PV potential, as a result of this the calculated PV capacity is larger than the actual.

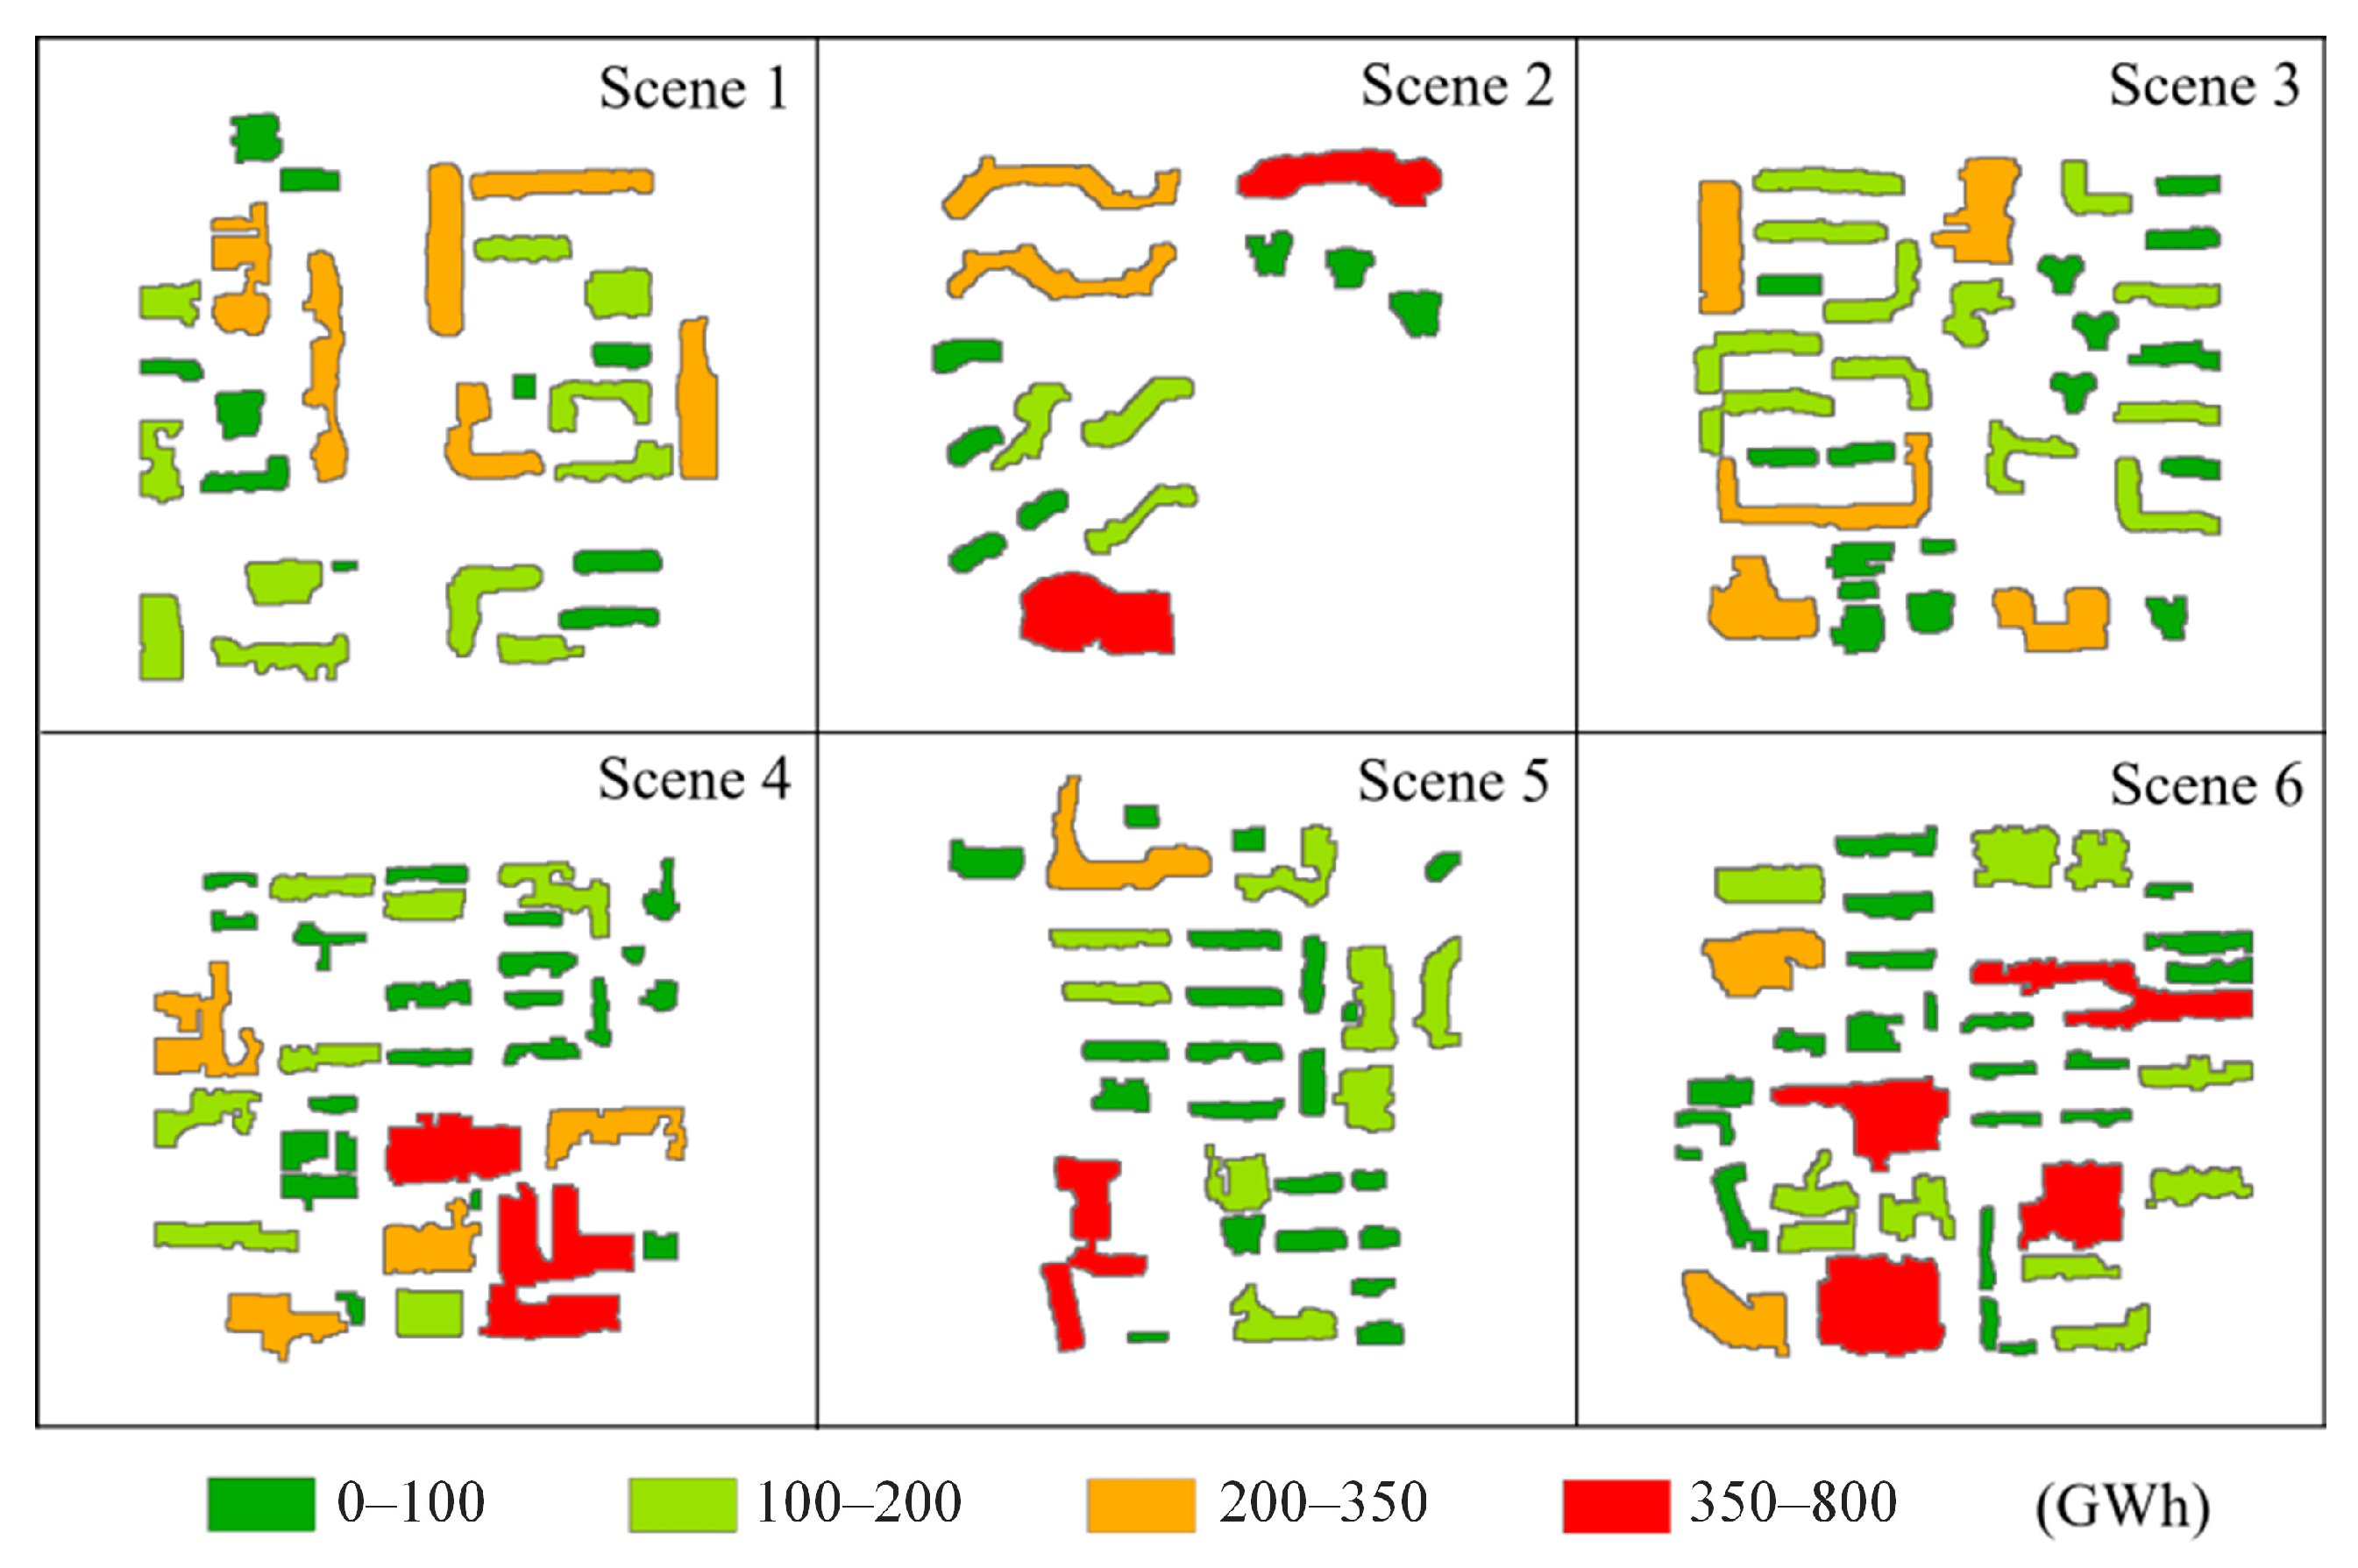
3.3. Results PV Potential

The estimated PV panels areas in the six scenarios were 35,218 m2, 21,700 m2, 37,855 m2, 38,062 m2, 28,748 m2, and 44,244 m2, respectively. Based on radiation data, PV panel area and other parameters, the potential power and energy outputs from the rooftops in six scenes are presented in Figure 6. The rooftop PV potential in the six scenarios was estimated to be 22,551 GWh and the annual power generation per unit area was 0.11 GWh/m2. Scene 6 had the highest PV potential of 4813 GWh, and Scene 2 had the lowest PV potential of 2359 GWh. With the improvement of photovoltaic technology and the decline in the price of photovoltaic products, the utilization potential of building roof PV systems is bound to gradually improve.
As can be seen from the Figure 6, the photovoltaic power generation of each rooftop is mainly affected by the rooftop area. For selection of rooftops to install PV systems, many factors need to be considered, such as solar radiation, rooftop geometry, rooftop inclination and slope, shadows, etc., depending on data availability. Compared to [17], which classified the roofs into different types and extracted the information of different types of rooftops, this study took a simpler approach to analysis the rooftop availability. In [20], the area of rooftop was used to estimate the rooftop PV potential at the urban scale without consideration of rooftop suitability. Ref. [19] used a national dataset consist of around 9.6 million vector polygons to compute PV potential, which, in contrast to the data in our study, are readily available. Our study neglected to calculate certain complex parameters to reduce the dependence on data and improve the practicality of the method. Furthermore, we studied individual rooftops over a large area. With the development of the PV economic potential, this can promote the development of rooftop photovoltaics because building owners will only consider investing in rooftop PV when these facilities make economic sense.

4. Conclusions

This study introduced a method to estimate the rooftop PV potential based on GF-2 imagery combined with NDVI and DSM. The object-based image classification method was improved by adding NDVI and DSM to identify the building map, and RASD was defined to extract the PV-available rooftops and estimate the area of photovoltaic panels. Then, the solar radiation, PV module conversion efficiency, and operating efficiency were used to calculate the PV generation. The method was applied to the selected area of Beijing, and six scenes were selected for PV potential assessment. The results indicated that a total of 176 roofs in six scenarios were suitable for PV installation. The estimated PV panels areas in the six scenarios are 35,218 m2, 21,700 m2, 37,855 m2, 38,062 m2, 28,748 m2, and 44,244 m2, respectively. The rooftop PV potential was estimated to total 22,551 GWh. Therefore, the performance of the rooftop PV potential estimation method performs well.
In this study, the solar radiation data are the global surface solar radiation (3 h, 10 km) which is more suitable for large-scale photovoltaic potential assessment. In future, high-precision PV potential assessment should consider using measured solar radiation data with higher temporal–spatial resolution. In addition, it is necessary to evaluate the energy efficiency and economic benefits, comprehensively considering the whole life cycle of panels, cost, power generation, pollution, and emission reduction.

Author Contributions

Conceptualization, Y.H.; methodology, Y.H.; software, B.Y.; validation, B.Y.; resources, M.W.; data curation, Z.L.; writing—original draft preparation, M.H. and Y.H.; writing—review and editing, M.H.; and project administration, M.W. All authors have read and agreed to the published version of the manuscript.

Funding

This research was funded by State Grid Hebei Electric Power Co., Ltd., Potential survey of photovoltaic and pumped-storage resources based on high-resolution satellite images. Grant B704JY210065.

Data Availability Statement

Not applicable.

Conflicts of Interest

The authors declare no conflict of interest.

Abbreviations

The table below lists several abbreviations.
AbbreviationsDefinitionAbbreviationsDefinition
DSMDigital surface modelFNFalse negative
FPFalse positiveGF-2Chinese gaofen-2
GISGeographic information systemsHGSSRHigh-resolution (3-h, 10 km) global surface solar radiation (1983–2018)
NDVINormalized difference vegetation Index PVPhotovoltaic
RASDThe ratio of rooftop area and standard deviation of the DSMPVARAn effective photovoltaic-available roof area ratio
TPTrue positiveAThe area of PV modules on the rooftop
A p The area of PV panels fHeterogeneity
GThe amount of radiation received on a photovoltaic modulehcolorThe spectral heterogeneity
hDSMThe DSM heterogeneityhshapeThe shape heterogeneity
NThe number of pixels in the rooftop object N D V I _ m e a n The mean NDVIs of paired merging objects
N D V I _ m e a n 1 The mean NDVIs of paired merging objects. N D V I _ m e a n 2 The mean NDVIs of paired merging objects.
w 1   The weights of spectral heterogeneity w 2   The weights of shape heterogeneity
w 3   The weights of DSM heterogeneity w N D V I   The influence of NDVI
ηThe PV module conversion efficiencyλThe operating efficiency of the photovoltaic system
xiThe value of DSM x ¯ The mean DSM of a rooftop

References

  1. Kouhestani, F.M.; Byrne, J.; Johnson, D.; Spencer, L.; Hazendonk, P.; Brown, B. Evaluating solar energy technical and economic potential on rooftops in an urban setting: The city of Lethbridge, Canada. Int. J. Energy Environ. Eng. 2019, 10, 13–32. [Google Scholar] [CrossRef]
  2. Kutlu, E.C.; Durusoy, B.; Ozden, T.; Akinoglu, B.G. Technical potential of rooftop solar photovoltaic for Ankara. Renew. Energy 2022, 185, 779–789. [Google Scholar] [CrossRef]
  3. Vries, T.; Bronkhorst, J.; Vermeer, M.; Donker, J.; Isabella, O. A quick-scan method to assess photovoltaic rooftop potential based on aerial imagery and LiDAR. Sol. Energy 2020, 209, 96–107. [Google Scholar] [CrossRef]
  4. Joshi, S.; Mittal, S.; Holloway, P.; Shukla, P.R.; Gallachóir, B.; Glynn, J. High resolution global spatiotemporal assessment of rooftop solar photovoltaics potential for renewable electricity generation. Nat. Commun. 2021, 12, 5738. [Google Scholar] [CrossRef] [PubMed]
  5. Gao, C.X.; Xie, M.H.; Song, N. Building extraction from color remote sensing imagery based on DSM and shadows. J. Zhengzhou Univ. Light Ind. (Nat. Sci. Ed.) 2015, 30, 5. [Google Scholar]
  6. Protopapadakis, E.; Doulamis, A.; Doulamis, N.; Maltezos, E. Stacked Autoencoders Driven by Semi-Supervised Learning for Building Extraction from near Infrared Remote Sensing Imagery. Remote Sens. 2021, 13, 371. [Google Scholar] [CrossRef]
  7. Sharma, D.; Singhai, J. An unsupervised framework to extract the diverse building from the satellite images using Grab-cut method. Earth Sci. Inform. 2021, 14, 777–795. [Google Scholar] [CrossRef]
  8. Joshi, A.; Dhumka, A.; Dhiman, Y.; Rawat, C.; Ritika. A Comparative Study of Supervised Learning Techniques for Remote Sensing Image Classification. In Soft Computing: Theories and Applications; Springer: Singapore, 2022; pp. 49–61. [Google Scholar]
  9. Kong, H.; Liu, J.B. High Spatial Resolution Remote Sensing Image Classification Based on Pixel Shape Index Method. J. Phys. Conf. Ser. 2021, 1952, 022054. [Google Scholar] [CrossRef]
  10. Kulkarni; Namita, M. Crop Identification Using Unsuperviesd ISODATA and K-Means from Multispectral Remote Sensing Imagery. Int. J. Eng. Res. Appl. 2018, 7, 45–49. [Google Scholar] [CrossRef]
  11. Pugazhenthi, A.; Kumar, L.S. Automatic Cloud Segmentation from INSAT-3D Satellite Image via Improved K-Means and Improved Fuzzy C-Means Clustering. IET Image Process. 2019, 14, 5. [Google Scholar]
  12. Pendyala, G.K.V.; Kalluri, H.K.; Rao, V.C. An Efficient Multi-stage Object-Based Classification to Extract Urban Building Footprints from HR Satellite Images. Trait. Du Signal Signal Image Parole 2021, 1, 38. [Google Scholar] [CrossRef]
  13. Balenovi, I. An Evaluation of Pixel- and Object-Based Tree Species Classification in Mixed Deciduous Forests Using Pansharpened Very High Spatial Resolution Satellite Imagery. Remote Sens. 2021, 13, 1868. [Google Scholar]
  14. Valderrama-Landeros, L.; Flores-De-Santiago, F.; Kovacs, J.M.; Flores-Verdugo, F. An assessment of commonly employed satellite-based remote sensors for mapping mangrove species in Mexico using an NDVI-based classification scheme. Environ. Monit. Assess. 2018, 190, 23. [Google Scholar] [CrossRef] [PubMed]
  15. Pu, R.; Landry, S. Mapping urban tree species by integrating multi-seasonal high resolution pleiades satellite imagery with airborne LiDAR data. Urban For. Urban Green. 2020, 53, 126675. [Google Scholar] [CrossRef]
  16. Chen, B.; Che, Y.; Wang, J.; Li, H.; Yu, L.; Wang, D. An estimation framework of regional rooftop photovoltaic potential based on satellite remote sensing images. Glob. Energy Interconnect. 2022, 5, 281–292. [Google Scholar] [CrossRef]
  17. Song, X.; Huang, Y.; Zhao, C.; Liu, Y.; Lu, Y.; Chang, Y.; Yang, J. An Approach for Estimating Solar Photovoltaic Potential Based on Rooftop Retrieval from Remote Sensing Images. Energies 2018, 11, 3172. [Google Scholar] [CrossRef]
  18. Zhong, T.; Zhang, Z.; Chen, M.; Zhang, K.; Zhou, Z.; Zhu, R.; Wang, Y.; Lü, G.; Yan, J. A city-scale estimation of rooftop solar photovoltaic potential based on deep learning. Appl. Energy 2021, 298, 117132. [Google Scholar] [CrossRef]
  19. Walch, A.; Castello, R.; Mohajeri, N.; Scartezzini, J.-L. Big data mining for the estimation of hourly rooftop photovoltaic potential and its uncertainty. Appl. Energy 2020, 262, 114404. [Google Scholar] [CrossRef]
  20. Baatz, M.; Schpe, A. An optimization approach for high quality multi-scale image segmentation. Beiträge AGIT-Symp. 2000, 12, 12–23. [Google Scholar]
  21. Haque, M.E.; Al-Ramadan, B.; Johnson, B.A. Rule-based land cover classification from very high-resolution satellite image with multiresolution segmentation. J. Appl. Remote Sens. 2016, 10, 036004. [Google Scholar] [CrossRef]
  22. Mullachery, B. Application of DSM and Supervised Image Classification Method for Sun-Exposed Rooftops Extraction. In Future of Information and Communication Conference; Springer: Cham, Switzerland, 2021; pp. 28–46. [Google Scholar]
  23. Singh, R.; Banerjee, R. Estimation of rooftop solar photovoltaic potential of a city. Sol. Energy 2015, 115, 589–602. [Google Scholar] [CrossRef]
  24. Mendis, T.; Huang, Z.; Xu, S.; Zhang, W. Economic potential analysis of photovoltaic integrated shading strategies on commercial building facades in urban blocks: A case study of Colombo, Sri Lanka. Energy 2020, 194, 116908. [Google Scholar] [CrossRef]
  25. Bao, Z.; Shi, R.; Huang, Y.; Song, X. Photovoltaic generation potential and developmental suitability in southern Hebei. Energy Rep. 2023, 9, 795–805. [Google Scholar] [CrossRef]
  26. Sumer, E.; Turker, M. An adaptive fuzzy-genetic algorithm approach for building detection using high-resolution satellite images. Comput. Environ. Urban Syst. 2013, 39, 48–62. [Google Scholar] [CrossRef]
  27. Guo, Z.; Du, S.; Li, M.; Zhao, W. Exploring GIS knowledge to improve building extraction and change detection from VHR imagery in urban areas. Int. J. Image Data Fusion 2016, 7, 42–62. [Google Scholar] [CrossRef]
Figure 1. The false colour pansharpened GF-2 images for Scenes 1–6.
Buildings 13 02686 g001
Figure 2. Flow chart of rooftop PV potential assessment.
Buildings 13 02686 g002
Figure 3. Example of different roof structure.
Buildings 13 02686 g003
Figure 4. Building extraction by manual method (yellow outlines) and optimized method (solid blue).
Buildings 13 02686 g004
Figure 5. The PV available rooftops in six scenes.
Buildings 13 02686 g005
Figure 6. PV potential map in six scenes.
Buildings 13 02686 g006
Table 1. The PVAP values correspond to the RASD values.
IndexValue
RASD0–0.10.1–0.50.5–11–2≥2
PVAR0.750.70.650.60
Table 2. Metrics of classification accuracy assessment.
MetricsFormulaExplanation
Completeness C o m p l e t e n e s s = T P T P   +   F N × 100 % TP is the area of the extracted building for both the manual and automated method. FP is the area of the extracted building only in the automated method. FN is the area of the extracted building only in the manual method.
Correctness C o r r e c t n e s s = T P T P   +   F P × 100 %
Score S c o r e = 2   ×   C o m p l e t e n e s s   ×   C o r r e c t n e s s C o m p l e t e n e s s   +   C o r r e c t n e s s
Table 3. The accuracy analysis of building extraction by the two methods.
ScenesCompleteness (%)Correctness (%)Score (%)
Scene183.8574.8979.11
Scene286.9779.2282.91
Scene386.0782.2284.10
Scene480.1876.8978.50
Scene578.6386.9582.58
Scene683.4378.8881.09
Disclaimer/Publisher’s Note: The statements, opinions and data contained in all publications are solely those of the individual author(s) and contributor(s) and not of MDPI and/or the editor(s). MDPI and/or the editor(s) disclaim responsibility for any injury to people or property resulting from any ideas, methods, instructions or products referred to in the content.

