Article

Comparative Investigation of Axial Bearing Performance and Mechanism of Continuous Flight Auger Pile in Weathered Granitic Soils

1
Guangzhou Metro Design & Research Institute Co., Ltd., Guangzhou 510080, China
2
School of Civil and Environmental Engineering, Harbin Institute of Technology, Shenzhen 518055, China
*
Author to whom correspondence should be addressed.
Buildings 2023, 13(11), 2707; https://doi.org/10.3390/buildings13112707
Submission received: 8 September 2023 / Revised: 20 October 2023 / Accepted: 24 October 2023 / Published: 26 October 2023
(This article belongs to the Special Issue Advances in Foundation Engineering for Building Structures)

Abstract

:
Axial bearing performance and mechanism of continuous flight auger (CFA) pile in weathered granitic soils, i.e., a widespread special soil in South China, were investigated by field test in this study. Load–settlement responses of four CFA piles were examined, and evolutions of shaft/base resistances were captured by ultra-weak fiber Bragg gratings (UWFBG) with a reflectivity ≤−40 dB. Performances of CFA piles were compared with those of a slurry displacement (SD) pile at the same site, thirteen pretensioned spun high-strength concrete (PHC) piles in the literature and empirical data in design code. Test results show that the ultimate bearing capacity of the CFA pile is highest among different pile types, and typically is twice that of the SD pile. Again, CFA pile produces the highest shaft resistances at 140 kPa and 153 kPa in two weathered granitic soils, while the base resistance of 3080 kPa is between those of the SD pile and the PHC pile. By field excavation, the superior mechanism of the CFA pile is suggested to avoid the formation of in-between bentonite layers and prevent preferential baseflow along fissures, both of which can weaken the soil–pile interface. Overall, this study provides fundamental data through UWFBG and explanations based on field observations which underpin the need for developing a design code specified for CFA piles in South China.

1. Introduction

Continuous flight auger (CFA) pile is a type of drilled foundation, where a hollow stem auger is first drilled to the design depth, and then retrieved simultaneously with the pumping of high fluidity concrete by high pressure (typically 500 kPa~1 MPa) [1,2]. After the auger is fully removed, the rebar cage is inserted into the fresh concrete, if needed. CFA pile offers an economic, fast, low-noise, and bentonite-free solution for constructing foundations. It has become increasingly popular in foundation engineering in South China, where a low-carbon city pilot policy is being implemented with the aim of concurrently encouraging green economic growth and improving people’s quality of life.
Axial bearing performances of CFA piles in various kinds of soils have been investigated, either by laboratory test or by field test. For instance, Gavin et al. [3] conducted in-field compression and tension load tests on the CFA piles in boulder clay, and very high shaft resistances (>400 kPa) were observed from the interpretation of the strain gauge reading. Neely [4] analyzed the bearing performances of 66 CFA piles in sand from the literature. He found that the shaft resistance is independent of the relative density of sand, but strongly correlated to the cone penetration test (CPT) or standard penetration test (SPT) result. Other works were extended to soft clay [5], silty soil [6], lodgement till [7], and mixed soil [8]. Moreover, Pession and Tsuha [9] has developed a CFA-based energy pile and examined its in-field performance with different configurations in layered soil. Based on the data from the above works and others, Ibrahim et al. [10] developed a generalized regression neural network to predict the load–settlement response of CFA piles at different sites, and the soil properties, pile dimensions, and others were taken as inputs. Doan and Lehane [11] proposed a new CPT-based design approach for CFA piles where the soil behavior index was considered. Similar work can also be found in Mihálik et al. [12]. Nevertheless, Zacarin et al. [13] reported a seasonal variation of shaft resistances of CFA piles in unsaturated soil; that is, the time-dependent soil property should be considered in predicting CFA capacity.
Performance of CFA piles has been also examined by comparing them with other conventional pile types. Jung et al. [14] reported that the production rate of CFA piles is five times higher than that of dilled shafts. From a series of model tests, Kassem et al. [2] observed that the axial capacity of CFA piles is approximately twice of that of bored piles, which is attributed to an increase of the pile diameter by the high-pressure pumping of concrete and a higher interface roughness caused by auger rotation. Farrell et al. [7] reported a shaft resistance of 230 kPa in lodgement till, which was of a similar magnitude of the driven pile. Such a finding contradicts the viewpoint of O’Neill [15], in which the bearing capacity of driven piles excels significantly over that of augered piles. Such a finding is also observed by Cherian [16] from the measurement via strain gauge. Using the fiber optic sensor (FOS) system, which is based on the Brillouin optical time domain analysis, Liu et al. [17] found that the shaft resistance and total bearing capacity of CFA piles is inferior to screw displacement piles, which essentially can be regarded as another pile type improved from CFA piles.
These research findings consistently show that CFA piles yield a satisfactory bearing capacity in different soil conditions, which is usually superior to other pile types, probably due to its special installation method. In South China, the bearing performance and mechanisms of CFA piles is still worthy of being investigated. The reason is twofold. First, engineering practices suggest that due to the widespread existence of weathered granitic soil, the bearing capacity varies significantly with the pile installation method in South China. Note that such a kind of soil is reported to be fissure-rich and may disintegrate under water [18,19]. For instance, the shaft resistance in completely decomposed granite soil for SD piles is estimated at 28~48 kPa by Design Code for Building Foundations in Guangdong Province DBJ 15-31-2016 [20], i.e., the same to that of high plastic silt/clay, while those of other bored piles are given as 120~140 kPa, i.e., 3~5 times higher. Second, CFA piles have not been systematically tested in South China, and no reliable test data are available to update the design code. The mainstream pile type is the slurry displacement (SD) pile and pretensioned spun high-strength concrete (PHC) pile. So far, the design code in South China (i.e., DBJ 15-31-2016) [20] provides empirical values of shaft and base resistances only for bored piles (e.g., SD piles) and driven piles (e.g., PHC piles).
In order to promote CFA piles in South China, its axial bearing performance and mechanism should be systematically investigated, especially in the weathered granitic soil, i.e., a widespread special soil in South China where the soil–pile interface can be significantly weakened. To achieve this goal, an in-field examination on CFA piles was performed at a site in Guangzhou. In the following texts, details of the field test were first delineated, including the site description, test program, and test method. Then, the axial bearing performance of CFA piles in terms of the bearing capacity and shaft/base resistance, and a comprehensive comparison with the SD pile, PHC pile, and empirical data in the design code are given to demonstrate the superiority/inferiority of CFA piles in South China. Finally, the bearing mechanism for the superiority/inferiority of CFA piles is achieved from the observation of the soil–pile interface response by field excavation.

2. Details of Field Test

2.1. Site Description

The test site was located at a latitude of ~23°8′7″ N and a longitude of ~113°32′35″ E, which is the roadside of Kaichuang Avenue, Huangpu District of Guangzhou, as shown in Figure 1. The site was clean and flat, which was convenient for pile installation. By site investigation, four soil layers, i.e., plain fill, silty sand, granitic residual soil (GRS), and completely decomposed granite (CDG) soil, are found on the top of ground, which is a typical soil profile in South China. Both GRS and CDG soil belong to the weathered granitic soil. Physical properties of these four soil layers are summarized in Table 1. Since all the test pile bases are in CDG soil, details of the beneath soils/rocks are not given here. Water table is as shallow as 1.70~3.80 m below the surface, according to a site investigation. Yet, CRS and CDG soils are not fully saturated, with a degree of saturation of 86% and 82%, respectively (see Table 1). Possibly, it is because the fissures exist in these soils but are filled with air. Liquid limit, plastic index, and the SPT N value of the soils have been measured, which are further used to determine the empirical values of shafts and base resistances at the ultimate state using the design code of DBJ 15-31-2016 [20]. As mentioned, the installation method significantly alters the bearing capacity, especially in weathered granitic soil. The empirical shaft resistance in GRS and CDG soil between SD piles and other bored piles are different.

2.2. Test Program

In this study, the bearing performance of CFA piles was investigated by measuring the load–settlement response, characterizing the shaft/base resistance, and comparing them with other conventional pile types (i.e., bored pile and driven pile). Based on this point, CFA pile and SD pile were both installed in the field test. For the SD pile, the bentonite support fluid was used. As driven piles may induce ground heave during installation and further bias the result of neighboring piles, such a kind of pile was not installed here. Still, associated test data have been extracted from the literature for further comparison (see later discussion). Figure 2 displays the installation process of a CFA pile, including the drilling and withdrawal of the auger stem (Figure 2a,b) and the insertion of a rebar cage (Figure 2c). Obviously, no bentonite support fluid was used, which is more eco-friendly compared to the SD pile. Soil was extracted with the stem, without ground heave, which may result in fewer disturbances on adjacent structures compared to the driven pile. All these demonstrate the advantage of CFA piles from the viewpoint of positive externality in economics.
In total, there were four CFA piles and one SD pile installed at the site. The locations of the piles are again shown in Figure 1. Distances between piles are adequate to avoid the overlapping of stress fields during tests. Dimensions of the piles are given in Table 2. Length of CFA pile varies from 13 to 17 m, and diameter varies from 600 to 800 mm. Note that the settings here are similar to those in the engineering practice. Dimensions of the SD pile (i.e., SD-1) were identically set to those of the CFA pile (i.e., CFA-1) in order to provide a comparative understanding on the bearing performance of the CFA pile.
The soil profile of each pile, i.e., the thicknesses of the penetrated soil layers, is given in Table 3. The profiles are similar among each other, since the pile distance is arranged appropriately. All the pile bases are in the CDG soil; therefore, it is assumed that all piles should behave as frictional piles instead of end-bearing piles. Using the soil profile in Table 3 and the empirical values of shaft/base resistance in Table 1, the ultimate bearing capacity of each pile can be estimated. The measured bearing capacity will be compared to the estimated one in a later context, which in essence compares the bearing performances between CFA piles and other kind of bored piles.
Static load tests were performed on the piles following the code for testing of building foundations in Guangdong Province DBJ/T 15-60-2019 [21], as shown in Figure 3. The load was applied incrementally on the pile head, and the resultant settlement under each load was measured. The test was terminated once the following criteria were met: (a) the settlement gradually increases to over 60 mm (i.e., reaching the ultimate state gradually); (b) the settlement increment induced by the current load is 5 times larger than the last load, and meanwhile the total settlement is greater than 40 mm (i.e., reaching the ultimate state suddenly). Note that there are some other criteria for test termination in the code, but they were not met in this study and therefore not described here. Under the first criterion, the ultimate bearing capacity is determined as the load corresponding to the settlement of 40 mm. Under the second criterion, the ultimate bearing capacity is identified as the load before the occurrence of a sudden settlement increase.

2.3. Deployment of UWFBG Sensing Technique

Ultra-weak fiber Bragg gratings (UWFBG) were deployed along with the static load test to three piles, i.e., CFA-1, CFA-3, and SD-1, with the aim of characterizing the bearing performance fundamentally from the aspect of the soil–pile interface behavior. UWFBG has a very low reflectivity ≤−40 dB (i.e., 0.01%), enabling a quasi-static distributed strain measurement with a low noise-to-signal ratio, which is more cost-effective than Brillouin-based FOS technology. The deployment method of the UWFBG is shown in Figure 3. The spacing of the grating is 1 m. The fiber was firmly attached to the longitudinal bar of the steel cage through the fixed points, and thereby the fiber deforms together with the pile. Near the pile base, the fiber was turned to the ferrule and then to another longitudinal bar. Such an arrangement can provide an averaged measurement along two bars, eliminating the bias from the pile tilting. Moreover, measurements can be carried out even if the fiber on either bar is broken. A signal demodulator was connected to the fiber at the pile head, and under each load, the measurements were executed by the demodulator.
The implementation process of UWFBG sensing technology is displayed in Figure 4. First, a broad-band light is generated by a tunable laser. Then, it is regulated to a pulse-type one by the computer-controlled pulse generator and electro-optic modulator, and is amplified by the erbium-doped fiber amplifier. Such a light passes thought the circulator and is input into the fiber with UWFBG sensors. When the light meets a UWFBG sensor, a narrow-band light is reflected with wavelengths the same to that of the grating center. The transmission light meets the next UWFBG sensor, generating another reflection light, and so on. Each reflection passes through the circulator, and is processed by photoelectric detector and analogue-to-digital conversion to interpret the spectrum. All these components and processes have been condensed in the signal demodulator.
The working principal of UWFBG is that the change in temperature and strain can shaft the center wavelength at grating. In this study, it is plausible to ignore the effect of air temperature, since the sensors are buried in the ground. Then, according to Her and Lin [22], from the measured wavelength at the grating, the axial strain therein can be given as
ε i , j = μ λ i , j λ 0 , j
where εi,j is the axial strain at the jth grating when the ith incremental load is applied; μ is the strain coefficient, which has been calibrated as 831 με/nm before static load test; and λi,j and λ0,j are the measured wavelength under the ith incremental load and before loading. Then, assuming that the pile is withing the elasticity scope, the axial stress at the grating can be derived using the Hooke’s law as [23]
σ i , j = E ε i , j
where σi,j is the axial stress at the jth grating under the ith incremental load, and E is the Young’s modulus of the reinforced concrete of the pile, which is 3.15 × 10⁴ MPa. Furthermore, based on the static equilibrium of a pile element, the average shaft resistance between two grating can be formulated as [24]
q i , j = E A σ i , j σ i , j + 1 π D L = E D 4 L ε i , j ε i , j + 1
where qi,j is the shaft resistance between the jth and j + 1th gratings; D is the pile diameter (see Table 2 for each pile); A is the pile sectional area; and L is the axial distance between the two gratings, which is 1 m here.

3. Test Results and Discussion

In the following text, the bearing performance of CFA piles was delineated from the viewpoints of the ultimate bearing capacity and the resistance in each soil layer. Therefore, the load–settlement responses are first shown and discussed. Then, the evolutions of shaft and base resistances are given and discussed.

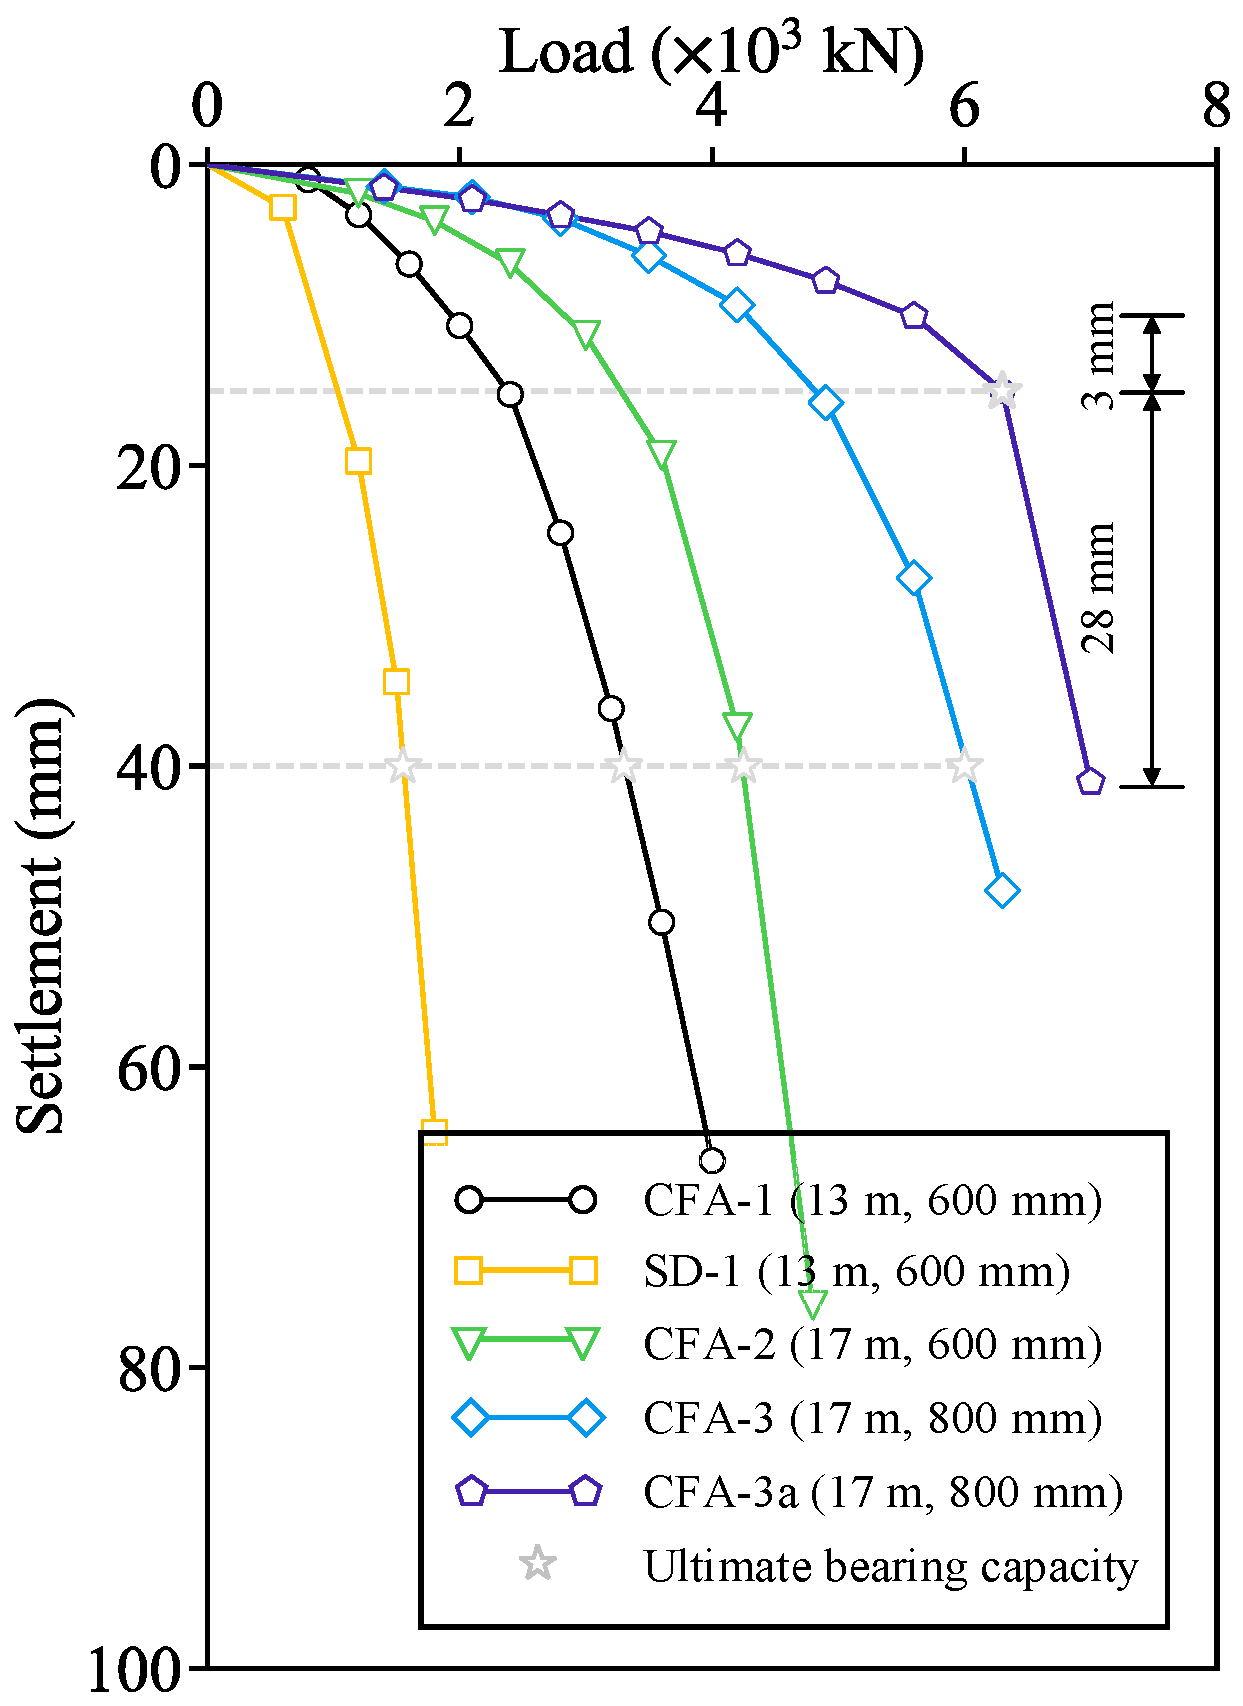
3.1. Load–Settlement Response and Ultimate Bearing Capacity

Load–settlement curves of four CFA piles and one SD pile are shown in Figure 5. Comparing CFA-1 and SD-1, which have the same dimensions of 13 m in length and 600 mm in diameter, it can be observed that initially under a small load that is still within the elasticity scope, CFA pile have a greater soil–pile stiffness than SD pile. As the load increases, the difference on the settlement increases as well. Under the settlement of 40 mm (i.e., the first criterion mentioned in Section 2.2), CFA-1 meets the ultimate bearing capacity (UBC) as 3300 kN, while SD-1 meets the UBC as 1550 kN. Essentially, the UBC of CFA piles is twice that of SD piles in the typical test field of South China, which is exactly the same to the observation in other different sites by Kassem et al. [2]. The reason may be twofold: first, the soil–pile interface of CFA pile can be enhanced by its special installation method; second, the interface of SD pile may be weakened by the use of bentonite support fluid. These reasons will be examined later from the sensing results of the UWFBG.
For CFA-2 which has a length of 17 m and a diameter of 600 mm, the settlement gradually increases together with the load, similar to the response of CFA-1. The associated UBC is determined as 4280 kN at the settlement of 40 mm. For CFA-3 which has a length of 17 m and a greater diameter of 800 mm, the UBC is measured as 6020 kN. Comparing CFA-2 and CFA-3, it can be found that the UBC of CFA pile is proportional to the diameter. Namely, the soil–pile interface of CFA pile does not vary in diameter. Again, such a statement will be inspected using the UWFBG measurement results in later context. CFA-3a exhibits a similar response at the early stage as CFA-3, since they have the same pile dimensions. However, CFA-3a later experiences a brittle failure mode, where a sudden increase in settlement occurs after the load of 6300 kN. The UBC of CFA-3a is therefore determined as 6300 kN, according to the second criterion mentioned in Section 2.2. Nevertheless, the difference of UBC between CFA-3 and CFA-3a is less than 5%, indicating that the variability of CFA pile performance is minute.
All the measured UBCs have been summarized in Table 4. Using the empirical values of shaft and base resistances in Table 1 and the soil profile in Table 2, the estimated UBCs are also provided in Table 4. Note that the estimated UBC for CFA piles represent that for the bored pile other than SD piles. As can be seen for SD-1, the measured value is slightly greater than the estimated one by 12.3%, demonstrating that the estimation using the design code of DBJ 15-31-2016 [20] indeed is reliable. In the meantime, such a matching confirms that the use of bentonite does undermine the soil–pile interface resistance, which may be the most severe in the weathered granitic soil. Differently, for each CFA pile, it can be seen that the measured result is significantly greater than the estimated one, at least by 34.2%. On average, the excess is 45.1%. As known, the bored pile can preserve the K0 condition between soil and pile. Based on this viewpoint and the comparison result, the installation of CFA piles may enhance the lateral stress along the interface and consequently enhance the interfacial resistance.
From the literature, the in-field performances of thirteen PHC piles in South China are collected for further comparison [25,26,27]. To be concise, all the data have been summarized in Appendix A. Using these data, the mean UBC of a PHC pile with a length of 17 m and a diameter of 600 mm is estimated as 3549 kN, and the coefficient of variation is calculated as 12.3%. Note that for PHC piles, the interfacial stress can be enhanced from the K0 condition by pile driving. Referring to the UBC of 4280 kN in CFA-2 and the minute difference of ~5% between CFA-3 and CFA-3a, it is believed that CFA pile generally yields a greater bearing capacity than PHC piles in South China with a less variability. The reason may be that the high-pressure pumping of concrete better compacts the soil than pile driving does. So far, by comparison among the in-field test data, the estimated results using design codes and the data available in the literature, owing to the installation method, CFA piles are found to provide a bearing capacity higher than other commonly used piles in South China, i.e., the PHC pile and the bored pile. Specifically, the UBC follows: CFA pile > PHC pile > bored pile (no bentonite) > SD pile.

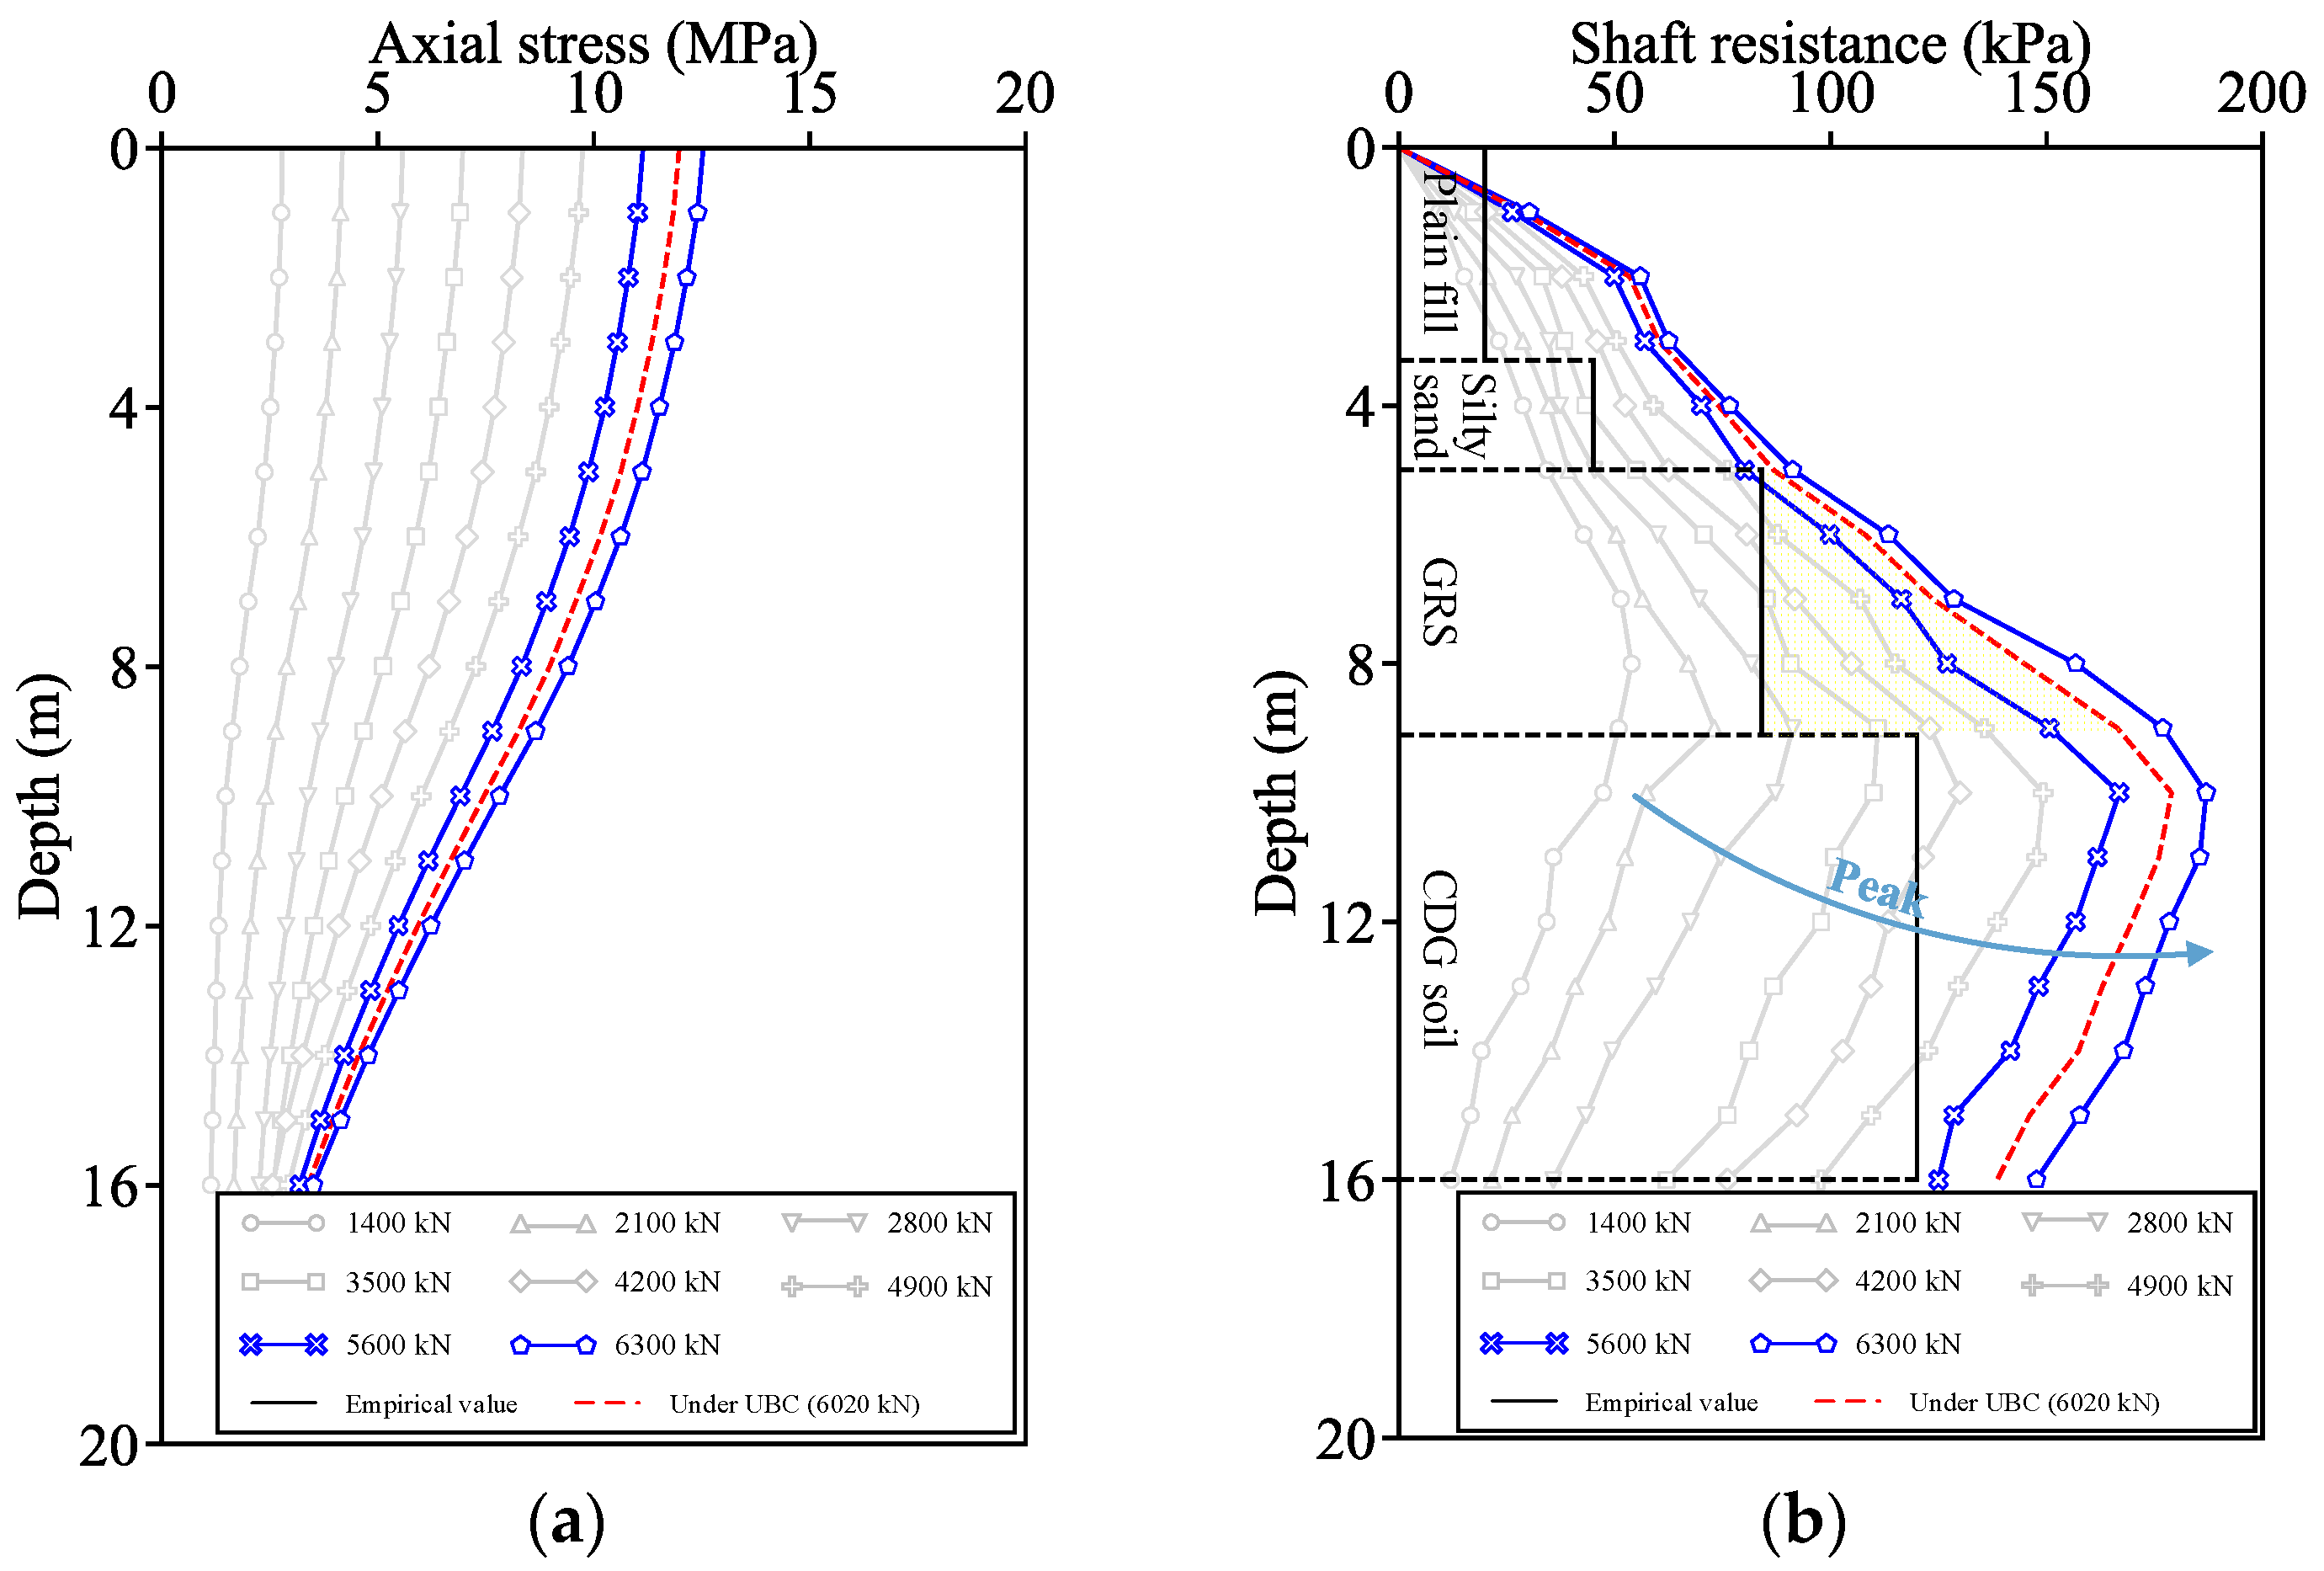
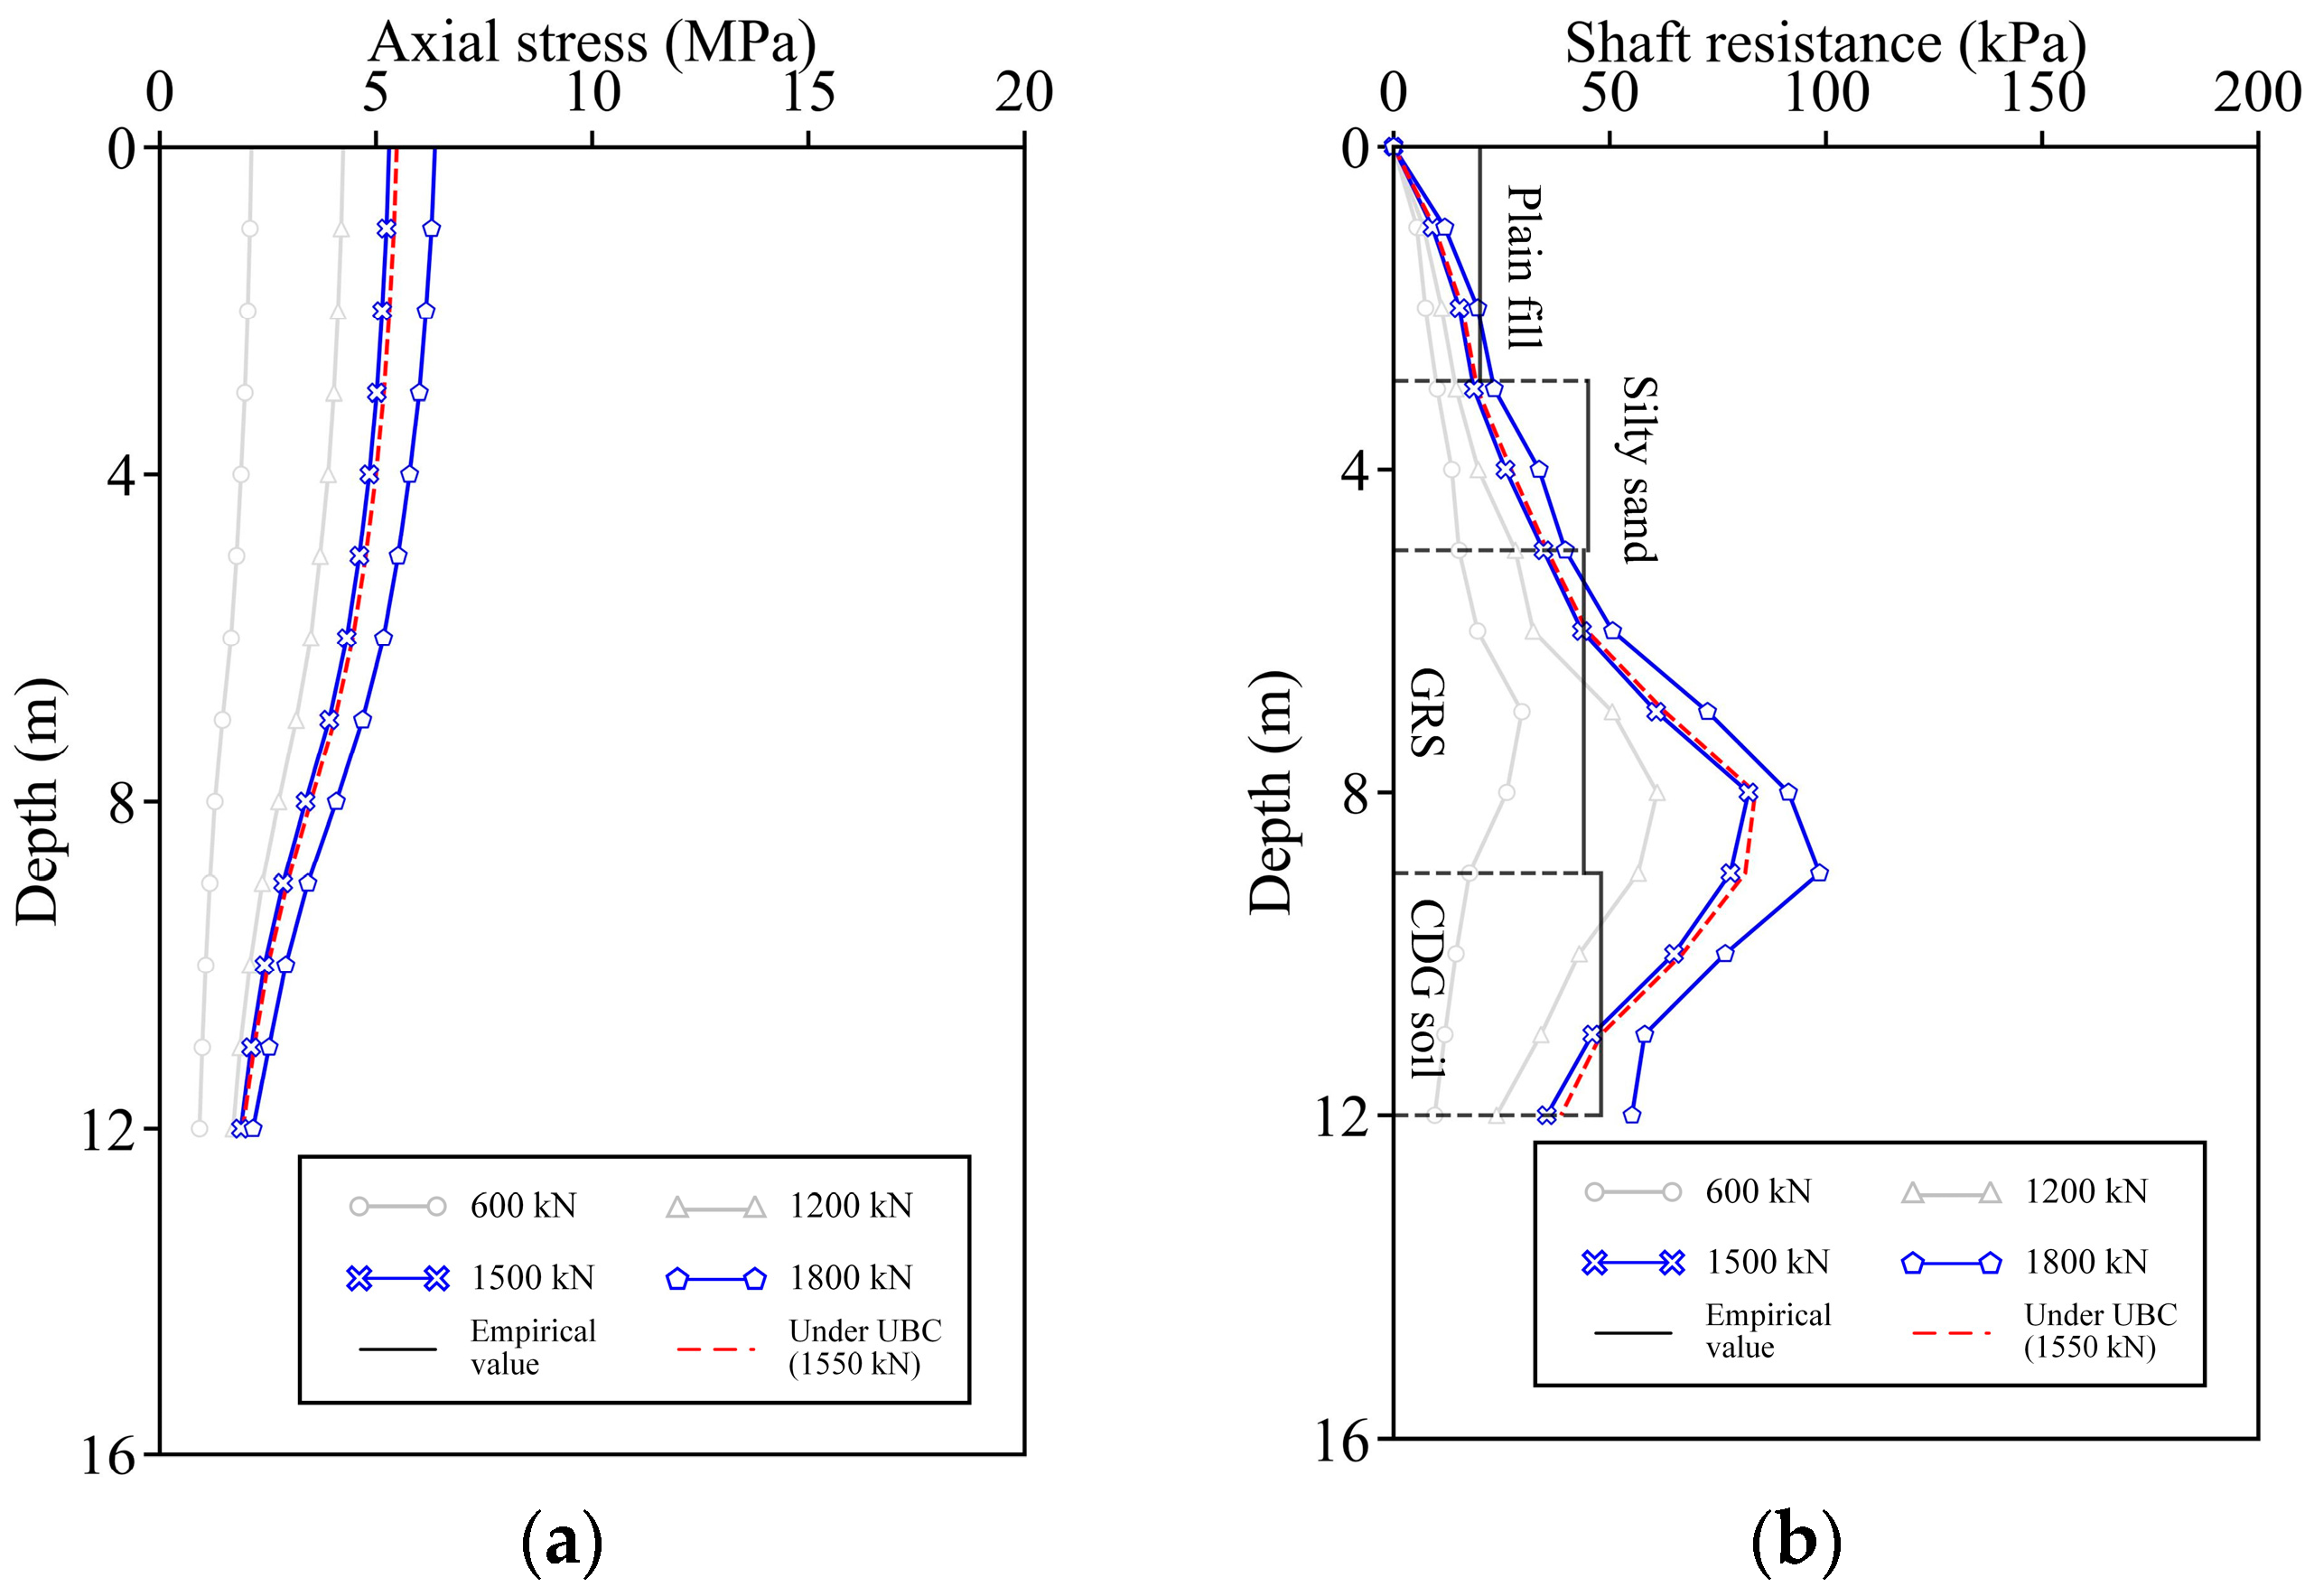
3.2. Evolution of Axial Stress and Shaft Resistance

Sensing technology of UWFBG has been applied to CFA-1, CFA-3, and SD-1 in this study in order to quantitatively elucidate the bearing performance of CFA pile from the point of shaft/base resistance. Following the interpretation method in Equations (1)–(3), the evolutions of axial stress and shaft resistance for CFA-1 are obtained and displayed in Figure 6. As can be seen in Figure 6a, under a certain load, the axial stress generally decreases along with the depth. Near the pile head, the curve is still flat with a moderate reduction, while near the pile base, the reduction becomes distinct. As the load increases, the axial stress at different soil layer keeps increasing. Consequently, the axial stress distribution pattern with depth is independent of the load. According to Equation (3), the evolution pattern of axial stress is fundamentally regulated by the development of shaft resistance with soil–pile relative displacement.
Figure 6b shows the distribution and evolution of shaft resistance in CFA-1. As the load increases, similar to the axial stress, the shaft resistance in each soil layer keeps increasing. No strain softening where the shaft resistance is reduced during the test is observed, which contradicts to the observation in Reddy et al. [28] from the direct shear test and the analytical model by Liu et al. [29]. The reason may be that the interface response is related not only to the soil properties, but also to the stress state, which is different between direct shear and the field. Along the depth, the resistance gradually increases but turns to decrease near the pile base. The peak of shaft resistance emerges and maintains at the CRS layer. It is because the whole CDG soil layer is within the restriction of pile base, and the resistance in this layer cannot fully develop to reach the peak. It is likely that when the penetrated CDG soil layer is thick enough, the peak can locate at some place of CDG soil, which is beyond the restriction of the pile base. Such a statement will be verified from the results of CFA-3, which has a thicker CDG soil layer than CFA-1. The peak of the distribution is driven deeper into the ground by loading; that is, the load is transferred more deeply into the soil.
In Figure 6b, the two blue curves denote the responses under the load of 3200 kN and 3600 kN, respectively. The response under UBC, which is between these two loads, is therefore obtained by linear interpolation (see the red line). In the meantime, the empirical value of shaft resistance in each soil layer from Table 1 is plotted in the figure for comparison (see the black lines). Note that these empirical values represent the interfacial behavior of bored piles without using bentonite support fluid. In plain fill and silty sand, the measured shaft resistances at UBC distributes around the empirical value to some extent. In GRS and CDG soil, the resistances exceed the empirical values greatly throughout the whole layer. The difference between the measured value and empirical value is further filled with yellow color for the convenience of comparison. Therefore, the superiority of the CFA pile over the bored pile is originated from the enhancement in weathered granitic soil. More quantitative and comparative discussion on the shaft resistance will be given later.
Figure 7 shows the evolutions of axial stress and shaft resistance in CFA-3. As can be seen in Figure 7a, the evolution pattern of axial stress is similar to that of CFA-1 in Figure 6a. Still, a difference can be observed near the pile base; that is, as the load increases, the axial stress near the pile base increases slightly. It is indicated that for a longer pile, the load increment is born more by the shaft resistance and less by the base resistance. For the shaft resistance in Figure 7b, the evolution pattern is found similar to that in Figure 6b; that is, the resistance first increases with the depth but drops near the base. The shaft resistance in each soil layer, as expected, is generally greater than that of CFA-1, having a better development and bearing more load. For instance, in the weathered granitic soils, the shaft resistance at UBC can almost reach 200 kPa (see the red line). Furthermore, as the load increases, the peak position is driven from the CRS layer into the CDG soil layer deeper than that of CFA-1. In essence, the shaft resistance can be better developed in some part of CDG soil which is beyond the restriction of pile base. The empirical values for the bored pile (other than SD pile) are again plotted in the figure for comparison. The excess of measured value over empirical value can be found in every soil layer and is most outstanding in the weather granitic soils, as hinted by the yellow-filled area.
UWFBG sensing results are also obtained for SD-1 and shown in Figure 8. Figure 8a displays the evolution of axial stress, which has the same pattern as those of CFA-1 and CFA-3. The consistency demonstrates that the axial stress distribution is principally regulated by the soil profile. Figure 8b presents the evolution of shaft resistance, and again a similar pattern is observed. However, the shaft resistance at UBC is much lower than those of CFA piles (see Figure 6b and Figure 7b). The empirical values for SD piles from design code of DBJ 15-31-2016 [20] is plotted in the figure as well. Note that the values of SD pile in GRS and CDG are only 44 kPa and 48 kPa, respectively, which are much lower than those in Figure 6b and Figure 7b, because the design code suggests that the bentonite support fluid can significantly weaken the soil–pile interface. By comparison, it can be seen that the measured resistances in plain fill and silty sand is slightly lower than the empirical values. In the two weathered granitic soils, the measured resistances distribute around the empirical values, agreeing well with the design code. To a great extent, Figure 6, Figure 7 and Figure 8 have identified the origin of the superiority of the CFA pile over the SD pile in bearing capacity: the soil–pile interface can be enhanced in the CFA pile by its special installation method, especially in weathered granitic soil, but weakened in SD piles by bentonite support fluid.

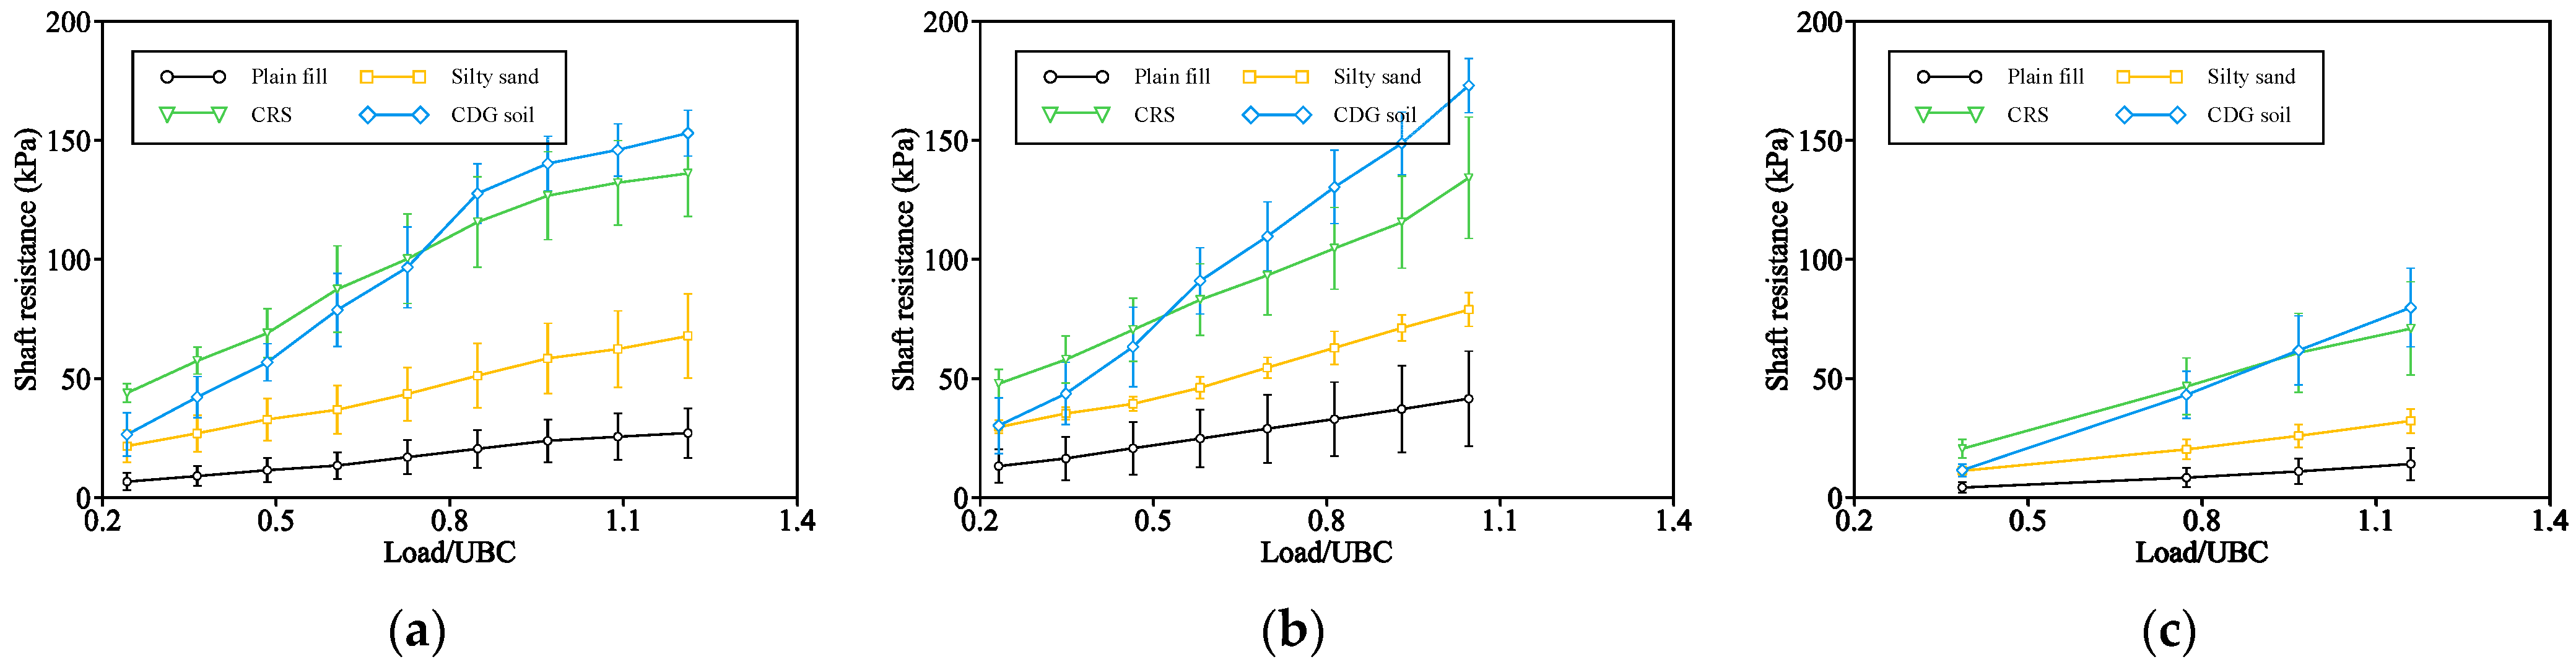
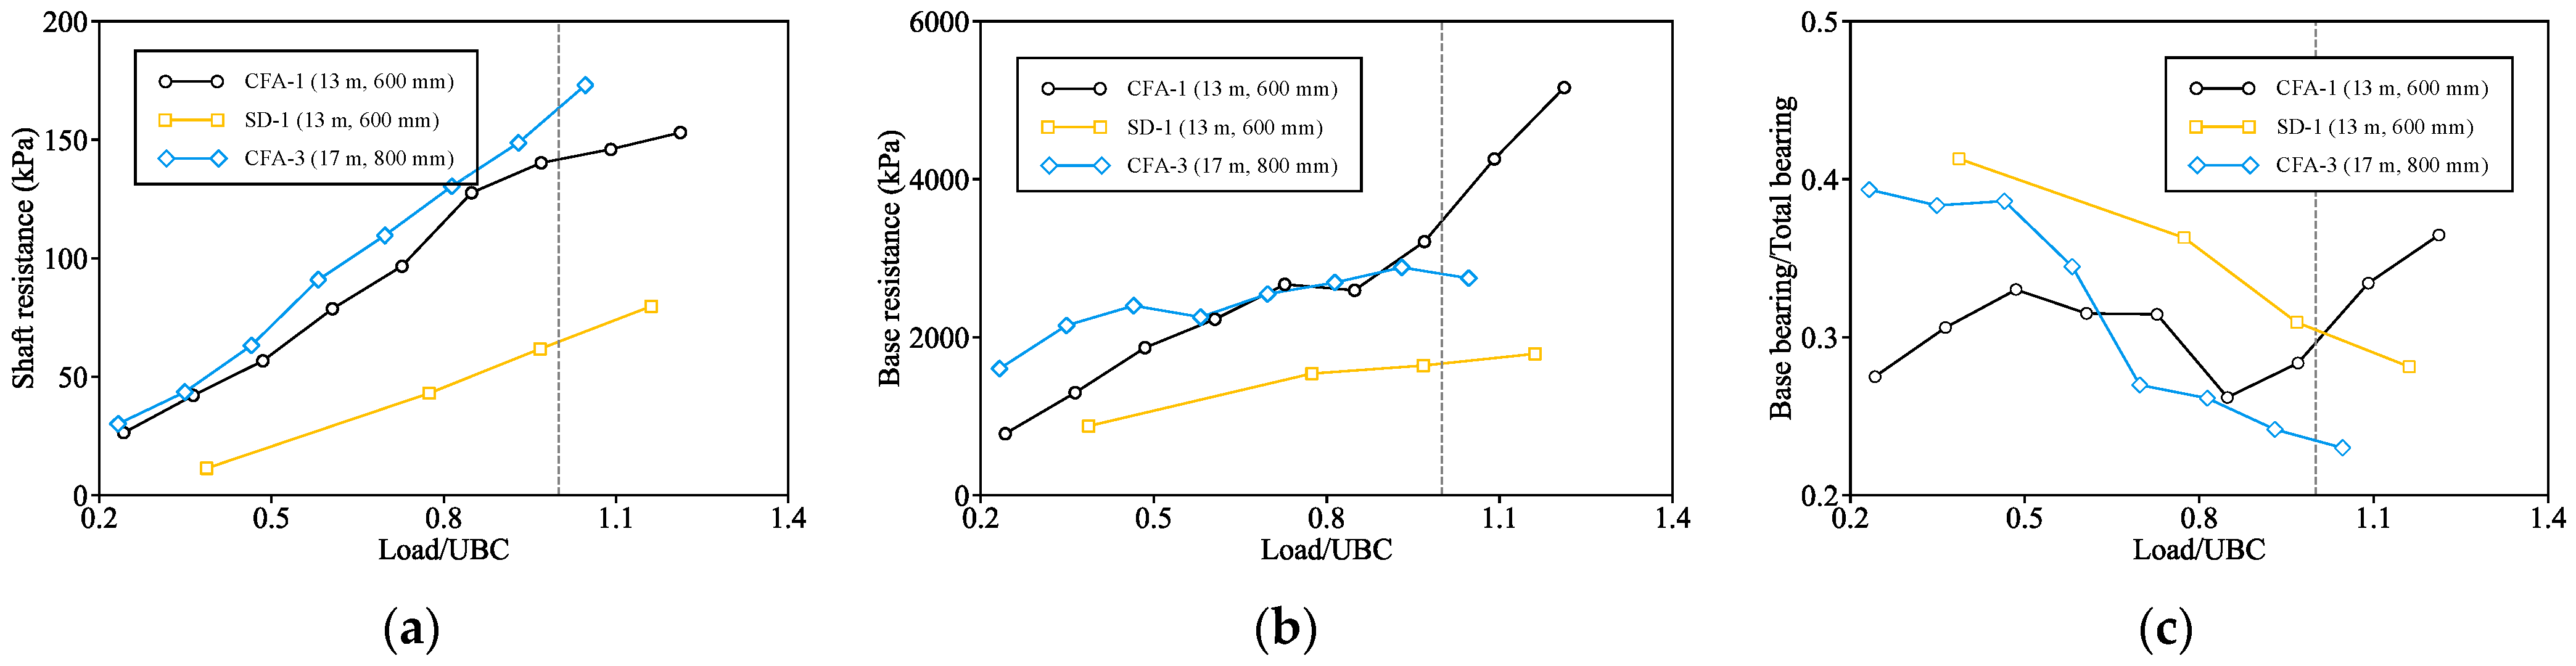
3.3. Shaft and Base Resistances in Different Soil Layers

With the UWFBG sensing results, the shaft and base resistance in different soil layers can be separated, which is important to the design of CFA piles. First, the shaft resistance in each soil layer is calculated by averaging the distribution along a layer. The standard deviation relative to the mean in each layer can be further calculated. Second, the base resistance is obtained by deducting the shaft resistance from the total bearing capacity. Note that since there is no UWFBG sensor mounted right at the pile base, the shaft resistance between the base and 1 m above the base is not provided. Still, it is plausible to assume that the value between 1 m and 2 m above the base is applicable to this value-absent pile section.
Following the above manner, the evolutions of (average) shaft resistances in each layer with load for CFA-1, CFA-3, and SD-1 are provided in Figure 9. The error bar in the figure denotes the standard deviation. Note that the curve in the figure is similar to the load transfer function and is therefore important to predict the load–settlement response of the whole pile. As can be seen in Figure 9, the evolution patterns are similar among the three piles. Generally, the shaft resistances increase along with the load in all soil layers. The values in the plain fill and silty sand are much lower than those in the CRS and CDG soil. All curves are quite linear except the one in CDG soil of CFA-1 (see Figure 9a). This curve appears to be hyperbolic, where the resistance may approach an upper bound. In addition, commonly among Figure 9a–c, it can be observed that the resistance in the CDG soil is initially lower but eventually surpasses it in CRS. The turning point emerges before the ratio of load/UBC of 0.8 for CFA pile and after 0.8 for SD pile. The reason for this change may be that shaft resistance in the CDG soil is initially prohibited by the base at a smaller settlement, but gets developed under larger settlements afterwards. Such an interplay between pile shaft and base can be considered to improve current models of load transfer function in the future [30].
Evolutions of shaft resistance in the CDG soil from Figure 9a–c are extracted and plotted together in Figure 10a for comparison. Evolutions of base resistance in this soil are also calculated and compared in Figure 10b. As expected in Figure 10a, the two curves of shaft resistance of CFA pile are significantly higher than that of the SD pile. In addition, these two curves are close to each other, suggesting that the enhancement of the CFA pile on soil–pile interface is independent of pile dimensions. Similarly, in Figure 10b, two curves of base resistance of CFA piles are far above that of SD pile; that is, the installation method of CFA piles not only strengthens the pile shaft but also the pile base. These two curves are close to each other to some extent. In CFA-1, the base resistance keeps increasing together with the load, but in CFA-3, fluctuations occur from time to time. Typically near the UBC, CFA-3 tends to drop down and cannot provide a higher resistance. The discrepancy between the two piles indicates that the development of base resistance is influenced by the pile length. Nevertheless, at least the values at the UBC on these two curves are similar (see the indication by the dashed line). The base resistance is analyzed in a more meaningful manner, as shown in Figure 10c; that is, the ratio of base bearing over total bearing is calculated. For SD-1 and CFA-3, the proportion of base bearing continuously decreases, and therefore the shaft takes more load as the pile head settles down. In contrast, the base response of CFA-1 fluctuates, demonstrating the complexity on the interplay between pile shaft and pile base. The average value throughout the whole test process is about 0.31 for both CFA piles. At the UBC, the value is 0.3 and 0.23 for CFA-1 and CFA-3, respectively. Note that based on the results here, a ratio of 0.3 has been used to estimate the UBC for a PHC pile with a length of 17 m and a diameter of 600 mm in Appendix A.
From Figure 9 and Figure 10, the shaft and base resistances at UBC are extracted and summarized in Table 5 for detailed comparison. In addition, the empirical values and the value ranges (i.e., the data in bracket) from the design code are included. Using Table 5, the interfacial enhancement of the CFA pile can be quantitatively understood. Specifically, the measured shaft resistance of the CFA pile is 140 kPa and 153 kPa in CRS and CDG soil, respectively. Shaft resistance in CRS is highest for CFA piles, followed by PHC piles, bored piles (no bentonite), and SD piles. The value of 140 kPa excels the empirical range of 74~94 kPa for PHC piles. Note that the empirical range of PHC piles indeed is similar to that of bored piles. The reason may be twofold: first, the effect of high-pressure concrete better increases the later soil–pile stress than the pile driving; second, even for driven piles, the soil–pile interface can be weakened. The second reason will be further discussed in Section 4. Superiority of CFA piles on the shaft resistance can also be found in CDG soil. The value of 153 kPa almost reaches the upper bound of the empirical range of PHC pile, and again has exceeded the value range of bored pile. Therefore, to a great extent, when designing CFA piles, it can be regarded as PHC piles in the aspect of shaft resistance, or a unique code should be developed.
In terms of base resistance, the measured value for a CFA pile is 3080 kPa. The measured value for a SD pile is 1670 kPa, much more similar to the empirical one of 1400 kPa, which is identical for bored piles with or without the use of bentonite. The similarity agrees with the design code of DBJ 15-31-2016 [20]; the use of bentonite in weathered granitic soil only affects the shaft resistance. Moreover, it confirms that the installation method of CFA piles can enhance both the shaft and base resistances. The empirical value of PHC pile is 5000 kPa. Base resistance of CFA pile is potentially comparable to that of PHC pile, since in Figure 10b, the measured value has reached 5160 kPa under the ratio of load/UBC of 1.2. Nevertheless, to be conservative, when designing CFA piles, the base resistance should be selected between those of PHC piles and bored piles, and twice of that of bored piles is reasonable. In short, owing to the installation method of CFA piles, the base resistance may follow: PHC pile > CFA pile > bored pile.

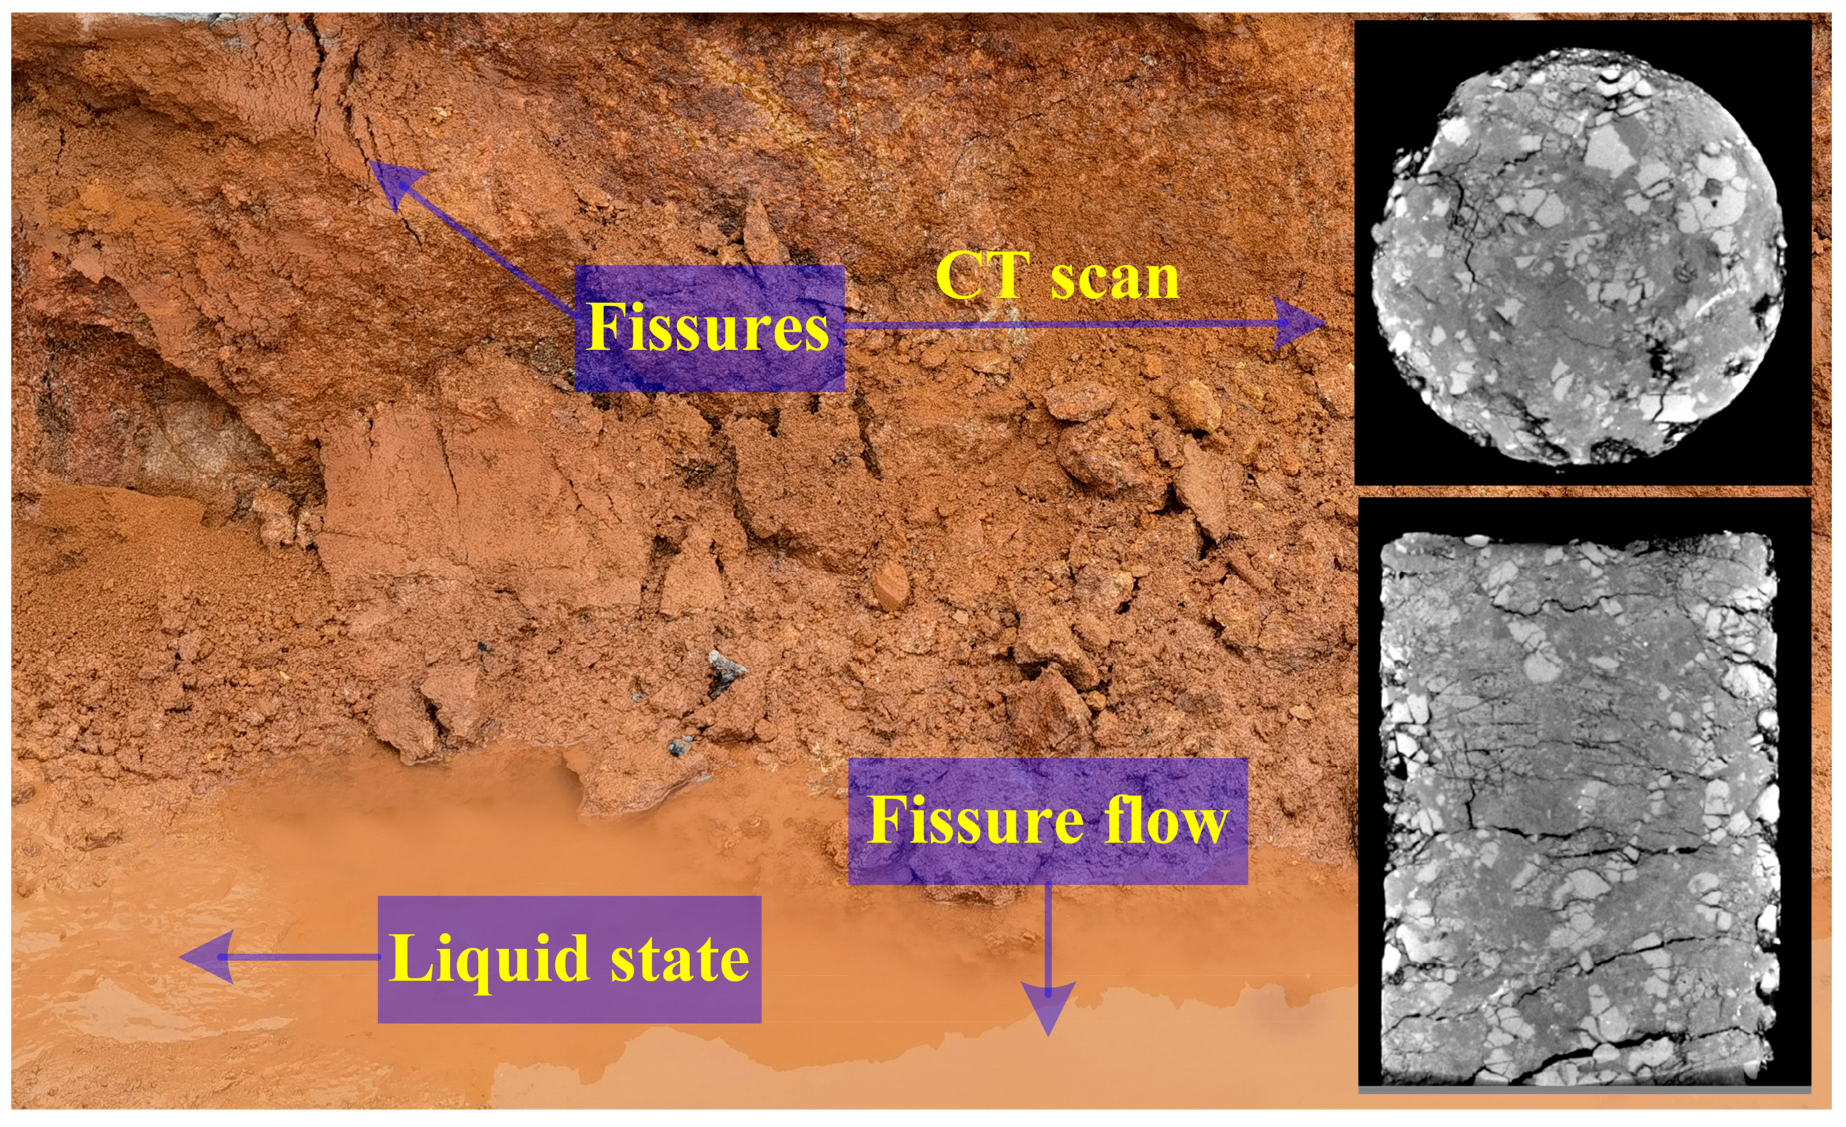
4. Bearing Mechanism of CFA Pile

From the static load test, the superiority of the CFA pile over other pile kinds (i.e., PHC pile and bored pile) has been observed in terms of the ultimate bearing capacity. From the UWFBG sensing result, the superiority of a CFA pile can also be found on the shaft resistance, especially in the weathered granitic soils. For the base resistance, a CFA pile is between the PHC pile and the bored pile. In addition to characterize the bearing performance of a CFA pile, the underlying mechanism of its superiority is also studied here. This question can be comparatively answered from two sides: the first side is how the soil–pile interface is strengthened by the installation method of a CFA pile; the second side is how the interface is weakened by the installation method of other kinds of piles.
In this context, a field excavation was carried out in order to visually inspect the soil–pile interface response. Figure 11 is the photo of the interface of the SD pile in the field. Beyond expectations, a very thick bentonite layer (≥8 cm) exists between the soil and pile. The surface texture of bentonite indicates that this layer has been sheared. Such a layer is different to the filter cake, which is usually formed in porous media by filtration [31,32] and seldom occurs in cohesive soil according to the pore-throat analysis [33,34]. Instead, it may be formed by the Van der Waals attraction of the fine content in the soil (see the soil–bentonite interface) and also the gravity; that is, the pumping of concrete cannot fully squeeze the bentonite out from the borehole. Therefore, the soil–pile interface becomes soil–bentonite–pile interface, which must reduce the real pile diameter and also result in greater deformation under the same load. In other words, a smaller load which corresponds to the ultimate bearing capacity is required to reach the settlement of 40 mm. Above all, it is the in-between bentonite layer that weakens the soil–pile interface of the SD pile. For the CFA pile, the occurrence of the bentonite layer can be avoided since no bentonite is used; therefore, the CFA pile performs better than the SD pile.
Figure 12 is the exposure of weathered granitic soil after excavation. In fact, such a process is similar to the boring of pile holes, which to some extent shows the soil–pile interface of bored piles (no bentonite). It can be seen by the naked eye that this kind of soil is fissure-rich. Through X-ray computerized tomography (CT) scans on the undisturbed sample of weathered granitic soil, the fissure-rich feature is confirmed (see the insets in the figure). Originally, the fissure is filled with air and the soil around it is unsaturated. That is why the degrees of saturation of GRS and CDG soil are measured as only 86% and 82%, respectively. The undisturbed soil state must provide a high resistance. However, after the hole is bored, the fissure is connected to the atmosphere. Then, the baseflow may develop preferentially along the fissure. As can be seen in Figure 12, after half an hour, a large amount of groundwater has streamed out. The water content of the interface soil is thereby increased, and the soil becomes liquid-like locally when the liquid limit is met. Without doubt, such a disturbed soil state provides a relatively low resistance. Above all, it is the transition between unsaturated state and saturated state of the fissure-rich weathered granitic soil that weakens the soil–pile interface of bored pile (no bentonite). For the CFA pile, the soil is not connected to the atmosphere during the installation, since the pumping of concrete and withdrawal of auger stem are executed concurrently. Namely, the unsaturated state can be preserved by the CFA pile, and thereby CFA piles provide a bearing capacity higher than bored piles (no bentonite). It is worthy to note that this phenomenon may be unique in weathered granitic soil; that is, in other kinds of cohesive soils, such an improvement may not be seen by CFA piles, since there is no fissure for preferential baseflow development to soften the interface, while in non-cohesive soil, the resistance is independent of the groundwater.
For the PHC pile, the driving process can increase the lateral stress state by cavity expansion and further enhance the soil–pile interface, while for bored pile, the K0 condition is preserved. Therefore, the empirical shaft resistance of the PHC pile is higher than that of bored piles (see Table 5). CFA piles can enhance the interface in a manner similar to pile driving, since high-pressure concrete (about 500 kPa~1 MPa) is injected into the pile hole during installation. Note that 500 kPa is equal to the K0 condition of soil 50 m below the ground, much deeper than the pile base in this study. In this regard, the expansion by the high-pressure concrete is comparable to that of pile driving. Meanwhile, according to the laboratory measurement by Seo et al. [35], CFA piles have a very rough and irregular surface, compared with PHC piles, which can further enhance the coefficient of soil–pile shaft friction. Moreover, PHC pile driving indeed shears and weakens the soil, and it needs a great amount of time to restore the shaft resistance by soil creep. Such a process is called pile setup effect or aging effect, and has been extensively reported in the literature [36,37]. At the pile base, the soil is continuously compacted by PHC pile driving, while the soil is only transiently compacted by the high-pressure concrete in CFA piles. Therefore, the base resistance of CFA piles does not exceed that of PHC piles.
Above all, as the formation of the in-between bentonite layer and preferential baseflow along the fissure in the soil are prevented and cavity expansion is induced by high-pressure concrete, CFA piles can yield higher shaft resistances than PHC piles and bored piles. As soil is compressed by the driving of PHC piles while soil is softened by bentonite or baseflow in bored piles, the base resistance of CFA piles is between those of PHC piles and bored piles. Still, all the observations are made after the static load test, not during the loading process. Therefore, better understanding may be achieved by model tests with transparent soil [38,39] or muti-phase large-deformation simulations [40,41].

5. Conclusions

In this study, a comparative investigation on the axial bearing performance and mechanism of CFA piles in weathered granitic soil has been conducted. The focus has been on the ultimate bearing capacity and soil–pile interface response (i.e., shaft resistance and base resistance). Results of CFA piles have been thoroughly compared with those of SD piles, bored piles (no bentonite), and PHC piles. The salient findings of this study are as follows.
  • Axial bearing capacity of CFA piles in weathered granitic soil is found to be superior to PHC piles and bored piles with or without use of bentonite support slurry. Typically, the UBC of CFA piles is twice that of SD piles.
  • With the aid of UWFBG sensing technology, shaft resistance in GRS and CDG soils are measured as 140 kPa and 153 kPa, respectively, both exceeding the empirical range of bored piles and close to the upper bounds of PHC piles. Base resistance is measured as 3080 kPa, between those of bored piles and PHC piles.
  • The reason for the superiority of CFA piles is based on avoiding the formation of bentonite layers between soils and piles, which occurs in SD piles, and preventing the preferential baseflow along fissures, which occurs in other bored piles. In addition, high-pressure concrete can compact the soil laterally, similar to PHC pile driving.
Overall, with the aid of UWFBG sensing technology and field excavation, the bearing performance and mechanisms of CFA piles in the weathered granitic soil have been clearly revealed. Data in this study provide some new insights on the application of CFA piles in South China, with comparisons to PHC piles and bored piles, and furthermore may help develop a design code specified for CFA piles. Nevertheless, the test site of this study only involved four kinds of soils, i.e., plain fill, silty sand, GRS, and CDG soil. Some soil layers are occasionally thin (≤2 m; see the silty sand in Figure 7b) and the response therein may not be well characterized by the UWFBG with a grating spacing of 1 m. Therefore, in the future, more test sites should be selected to thoroughly examine the bearing performance of CFA piles in different kinds of soils. In addition, a higher grating spacing for UWFBG should be applied to better characterize the shaft and base resistances of CFA piles in these soils.

Author Contributions

Conceptualization, Z.L. (Zhili Li) and Y.S.; data curation, Y.S. and Z.L. (Zhaofeng Li); formal analysis, S.Z. and Y.S.; funding acquisition, Y.S. and C.L.; investigation, Z.L. (Zhaofeng Li); methodology, X.Z.; project administration, X.Z. and Z.X.; resources, Z.L. (Zhaofeng Li); supervision, X.Z. and Z.X.; validation, S.Z., Y.S. and C.L.; visualization, X.Z.; writing—original draft, Z.L. (Zhaofeng Li); writing—review and editing, Z.L. (Zhaofeng Li). All authors have read and agreed to the published version of the manuscript.

Funding

This research was supported by National Natural Science Foundation of China (Grant No. 52209126 and 52239008), Guangdong Basic and Applied Basic Research Foundation (Grant No. 2023A1515012860), Shenzhen Science and Technology Program (Grant No. GXWD20220818152909001 and KQTD20210811090112003).

Data Availability Statement

No new data were created or analyzed in this study. Data sharing is not applicable to this article.

Conflicts of Interest

The authors declare no conflict of interest. The funders had no role in the design of the study; in the collection, analyses, or interpretation of data; in the writing of the manuscript; or in the decision to publish the results.

Appendix A

In-field test data on thirteen PHC piles are retrieved from Kuang [25], Zheng and Zhang [26], and Zhang et al. [27] and summarized in Table A1. The locations of these piles are in Shenzhen and Foshan, both of which are near to the test site in this study and have similar soil profiles as in Table 3. The soils at pile base are all weathered granitic soils. The static load test or high-strain dynamic pile test were performed by these authors, and these two methods have been verified to provide similar UBCs for the same pile. For each static load test, the ultimate settlement is greater than 40 mm, and thereby, the two criteria to determine the UBC mentioned in Section 2.2 can be applied. The pile dimensions (i.e., length and diameter) and measured UBC are given in the table.
However, the dimensions of these PHC piles are quite different to those of CFA piles in this study. For the sake of comparison, the PHC pile with a length of 17 m and a diameter of 600 mm is estimated from the data of each pile. However, two assumptions have to be made, which are plausible based on the observations in this study. First, it is assumed that the proportion of base bearing to total bearing is 0.3 for such a hypothetical PHC pile, which is based on the result in Figure 10c. Second, it is assumed that the shaft bearing is proportional to the pile length and diameter, while the base bearing is proportional to the square of pile diameter.
Table A1. Data of ultimate bearing capacity of PHC pile in the literature.
ReferenceLocationPile LabelLength
(m)
Diameter
(mm)
Soil at Pile Base †Test Type *Settlement
(mm)
Measured UBC (kN)UBC for 17 m ϕ600 (kN)
Kuang [25]Shenzhen518400CDGSLT>4023403729
916400GRSSLT>4020603598
Zheng and Zhang [26]FoshanZK123.4500CDGGSLT>4028002769
ZK323.4500CDGGSLT>4030002967
ZK522.4500CDGGSLT>4045004606
Zhang et al. [27]FoshanSZ130500CDGGHSDPT--3988.83223
SZ230500CDGGHSDPT--4217.43407
SZ330500CDGGHSDPT--4371.73532
SZ430500CDGGHSDPT--44413588
SZ530500CDGGHSDPT--4233.63420
SZ630500CDGGHSDPT--4868.33933
SZ730500CDGGHSDPT--4401.83556
SZ830500CDGGHSDPT--4708.93804
† CDG—completely decomposed granite; GRS—granitic residual soil; CDGG—completely decomposed granitic gneiss; * SLT—static load test; HSDPT—high-strain dynamic pile test.

References

  1. Derbyshire, P. PAPER 2 Continuous flight auger piling in the UK. In Piling and Ground Treatment; Thomas Telford Publishing: London, UK, 1984; pp. 87–92. [Google Scholar]
  2. Kassem, M.; Heidari, M.; Soliman, A.; El Naggar, M.H. Comparison of axial performance of bored and continuous flight augered large-scale model piles in sand. Innov. Infrastruct. Solut. 2022, 7, 326. [Google Scholar] [CrossRef]
  3. Gavin, K.; Cadogan, D.; Twomey, L. Axial resistance of CFA piles in Dublin Boulder Clay. Proc. Inst. Civ. Eng. Geotech. Eng. 2008, 161, 171–180. [Google Scholar] [CrossRef]
  4. Neely, W.J. Bearing capacity of auger-cast piles in sand. J. Geotech. Eng. 1991, 117, 331–345. [Google Scholar] [CrossRef]
  5. King, G.; Dickin, E.; Lyndon, A.; Wei, M. The influence of rate of loading on the behaviour of continuous-flight-auger bored piles in soft clay. Geotech. Geol. Eng. 2000, 18, 139–153. [Google Scholar] [CrossRef]
  6. Leetsaar, L.; Korkiala-Tanttu, L.; Kurnitski, J. CPT, CPTu and DCPT methods for predicting the ultimate bearing capacity of cast in situ displacement piles in silty soils. Geotech. Geol. Eng. 2023, 41, 631–652. [Google Scholar] [CrossRef]
  7. Farrell, E.R.; Lawler, M.L. CFA pile behaviour in very stiff lodgement till. Proc. Inst. Civ. Eng. Geotech. Eng. 2008, 161, 49–57. [Google Scholar] [CrossRef]
  8. Coleman, D.M.; Arcement, B.J. Evaluation of design methods for auger cast piles in mixed soil conditions. In Deep Foundations 2002: An International Perspective on Theory, Design, Construction, and Performance; American Society of Civil Engineers: Reston, VA, USA, 2002; pp. 1404–1420. [Google Scholar]
  9. Pessin, J.; Tsuha, C.d.H.C. In-field performance of continuous flight auger (CFA) energy piles with different configurations. Appl. Therm. Eng. 2023, 224, 120113. [Google Scholar] [CrossRef]
  10. Ibrahim, F.; Alzo’ubi, A.; Odhabi, H. A generalized regression neural network model to predict CFA piles performance using borehole and static load test data. Arab. J. Sci. Eng. 2023, 48, 4403–4419. [Google Scholar] [CrossRef]
  11. Doan, L.; Lehane, B. CPT-based design method for axial capacities of drilled shafts and auger cast-in-place piles. J. Geotech. Geoenviron. Eng. 2021, 147, 04021077. [Google Scholar] [CrossRef]
  12. Mihálik, J.; Gago, F.; Vlček, J.; Drusa, M. Evaluation of methods based on CPTu testing for prediction of the bearing capacity of CFA piles. Appl. Sci. 2023, 13, 2931. [Google Scholar] [CrossRef]
  13. Zacarin, J.G.M.X.; Da Silva, B.O.; Tsuha, C.H.C.; Vilar, O.M. Seasonal variation of the shaft resistance of CFA piles in unsaturated soil: A case study. Can. Geotech. J. 2023, 18, 04018104. [Google Scholar] [CrossRef]
  14. Jung, C.; Martinez-Rojas, J.C.; Zaldivar, S.; Monroy, R.; Méndez, G.; Kim, J. Comparative Study on Performance of CFA Piles and Drilled Shafts in Dos Bocas, Mexico. In Proceedings of the Geo-Congress 2023, Los Angeles, CA, USA, 26–29 March 2023; pp. 1–13. [Google Scholar]
  15. O’Neill, M.W. Review of Angered Pile Practice Outside the United States. In Design and Construction of Auger Cast Piles, and Other Foundation Issues; GEOTILL: Fishers, IN, USA, 1994; pp. 3–9. [Google Scholar]
  16. Cherian, A. Static Behavior of Strain Gauge Instrumented Continuous Flight Auger (CFA) Piles. Jordan J. Civ. Eng. 2022, 16, 229–241. [Google Scholar]
  17. Liu, B.; Zhang, D.; Xi, P. Mechanical behaviors of SD and CFA piles using BOTDA-based fiber optic sensor system: A comparative field test study. Measurement 2017, 104, 253–262. [Google Scholar] [CrossRef]
  18. Chen, R.; Liu, L.; Li, Z.; Deng, G.; Zhang, Y.; Zhang, Y. A novel vertical stress-controlled apparatus for studying suffusion along horizontal seepage through soils. Acta Geotech. 2021, 16, 2217–2230. [Google Scholar] [CrossRef]
  19. Lu, K.-K.; Yin, J.-H.; Lo, S.-C. Modeling small-strain behavior of Hong Kong CDG and its application to finite-element study of basement-raft footing. Int. J. Geomech. 2018, 18, 04018104. [Google Scholar] [CrossRef]
  20. DBJ 15-31-2016; Design Code for Building Foundation. Guangdong Province of Housing and Urban-Rural Construction Department: Guangzhou, China, 2016.
  21. DBJ/T 15-60-2019; Code for Testing of Building Foundation. Guangdong Province of Housing and Urban-Rural Construction Department: Guangzhou, China, 2019.
  22. Her, S.-C.; Lin, W.-N. Simultaneous measurement of temperature and mechanical strain using a fiber Bragg grating sensor. Sensors 2020, 20, 4223. [Google Scholar] [CrossRef]
  23. Lurie, A.I. Theory of Elasticity; Springer Science & Business Media: Berlin, Germany, 2010. [Google Scholar]
  24. Wu, Y.; Liu, J.; Chen, R. An analytical analysis of a single axially-loaded pile using a nonlinear softening model. Geomech. Eng. 2015, 8, 769–781. [Google Scholar] [CrossRef]
  25. Kuang, J. Examination on bearing capacity of PHC pile during rest time in some site. Guangdong Archit. Civ. Eng. 2006, 7, 63–65. [Google Scholar]
  26. Zheng, Y.; Zhang, J. Experimental study on prestressed concrete tube-pile bearing stratum softening in water in Shunde district. Guangdong Archit. Civ. Eng. 2011, 12, 57–61. [Google Scholar]
  27. Zhang, X.; Li, R.; Zheng, Y.; Zeng, Z.; Li, G. Field experimental study on prestressed concrete tube-pile bearing stratum softening in strong weathered rock formation of Shunde area. Sci. Sin. Technol. 2016, 46, 975–986. [Google Scholar]
  28. Reddy, E.S.; Chapman, D.; Sastry, V. Direct shear interface test for shaft capacity of piles in sand. Geotech. Test. J. 2000, 23, 199–205. [Google Scholar]
  29. Liu, J.; Xiao, H.; Tang, J.; Li, Q. Analysis of load-transfer of single pile in layered soil. Comput. Geotech. 2004, 31, 127–135. [Google Scholar] [CrossRef]
  30. Fellenius, B.H.; Rahman, M.M. Load-movement response by tz and qz functions. Geotech. Eng. J. SEAGS AGSSEA 2019, 50, 11–19. [Google Scholar]
  31. Lam, C.; Jefferis, S.A.; Martin, C.M. Effects of polymer and bentonite support fluids on concrete–sand interface shear strength. Géotechnique 2014, 64, 28–39. [Google Scholar] [CrossRef]
  32. Lam, C.; Jefferis, S.A.; Suckling, T.P.; Troughton, V.M. Effects of polymer and bentonite support fluids on the performance of bored piles. Soils Found. 2015, 55, 1487–1500. [Google Scholar] [CrossRef]
  33. Li, Z.; Wang, Y.-H.; Chow, J.K.; Su, Z.; Li, X. 3D pore network extraction in granular media by unifying the Delaunay tessellation and maximal ball methods. J. Pet. Sci. Eng. 2018, 167, 692–701. [Google Scholar] [CrossRef]
  34. Li, Z.; Wang, Y.-H.; Ma, C.; Mok, C.M.B. Experimental characterization and 3D DEM simulation of bond breakages in artificially cemented sands with different bond strengths when subjected to triaxial shearing. Acta Geotech. 2017, 12, 987–1002. [Google Scholar] [CrossRef]
  35. Seo, H. 3D roughness measurement of failure surface in CFA pile samples using three-dimensional laser scanning. Appl. Sci. 2021, 11, 2713. [Google Scholar] [CrossRef]
  36. Jardine, R.J.; Standing, J.R.; Chow, F.C. Some observations of the effects of time on the capacity of piles driven in sand. Géotechnique 2006, 56, 227–244. [Google Scholar] [CrossRef]
  37. Zhang, Z.; Wang, Y.-H. Examining setup mechanisms of driven piles in sand using laboratory model pile tests. J. Geotech. Geoenviron. Eng. 2015, 141, 04014114. [Google Scholar] [CrossRef]
  38. Stanier, S.A.; Black, J.A.; Hird, C.C. Modelling helical screw piles in soft clay and design implications. Proc. Inst. Civ. Eng. Geotech. Eng. 2014, 167, 447–460. [Google Scholar] [CrossRef]
  39. Yuan, B.-X.; Chen, W.-W.; Jiang, T.; Wang, Y.-X.; Chen, K.-P. Stereo particle image velocimetry measurement of 3D soil deformation around laterally loaded pile in sand. J. Cent. S. Univ. 2013, 20, 791–798. [Google Scholar] [CrossRef]
  40. Arab, M.G.; Abdelmoghni, M.; Akl, S.A.; Dif, A. Numerical modeling of unfavorable CFA pile drilling conditions. Geotech. Geol. Eng. 2020, 38, 6869–6889. [Google Scholar] [CrossRef]
  41. Li, Z.; Chow, J.K.; Li, J.; Tai, P.; Zhou, Z. Modeling of flexible membrane boundary using discrete element method for drained/undrained triaxial test. Comput. Geotech. 2022, 145, 104687. [Google Scholar] [CrossRef]
Figure 1. Site of field test and layout of test piles.
Buildings 13 02707 g001
Figure 2. Photos of the CFA pile installation: (a) drilling with auger stem; (b) withdrawal of auger stem and concreting; (c) insertion of rebar cage.
Buildings 13 02707 g002
Figure 3. Deployment method of UWFBG sensors in the static load test.
Buildings 13 02707 g003
Figure 4. Implementation of UWFBG sensing technology.
Buildings 13 02707 g004
Figure 5. Load–settlement curves of test piles.
Buildings 13 02707 g005
Figure 6. Stress evolution of CFA-1: (a) axial stress; (b) shaft resistance.
Buildings 13 02707 g006
Figure 7. Stress evolution of CFA-3: (a) axial stress; (b) shaft resistance.
Buildings 13 02707 g007
Figure 8. Stress evolution of SD-1: (a) axial stress; (b) shaft resistance.
Buildings 13 02707 g008
Figure 9. Evolution of shaft resistance in different soil layer: (a) CFA-1; (b) CFA-3; (c) SD-1.
Buildings 13 02707 g009
Figure 10. Comparison of soil–pile behavior in CDG soil: (a) shaft resistance; (b) base resistance. (c) base bearing/total bearing.
Buildings 13 02707 g010
Figure 11. Disclosure of interface of slurry displacement pile in field. (a) existence of bentonite layer between soil and pile concrete. (b) thickness of the in-between bentonite layer.
Buildings 13 02707 g011
Figure 12. Disclosure of weathered granitic soil in field.
Buildings 13 02707 g012
Table 1. Soil stratum and properties in test site.
Soil NameBulk DensityMoisture ContentDegree of SaturationLiquid LimitPlastic IndexSPT N ValueEmpirical Shaft Resistance *Empirical Base Resistance
(g/cm3)(%)(%)(%)(-)(-)(kPa)(kPa)
Plain fill1.9524.319039.2016.106.820-
Silty sand1.8831.50---10.545-
GRS1.9125.048636.2112.5220.484 (44)1200
CDG soil1.9721.058232.9011.3236.7120 (48)1400
* Data inside and outside the bracket denote the values of slurry displacement piles and other bored piles, respectively.
Table 2. Details of test piles.
Pile LabelTypeLength
(m)
Diameter
(mm)
Remark
CFA-1Continuous flight auger13600With UWFBG data
SD-1Slurry displacement13600With UWFBG data
CFA-2Continuous flight auger13800-
CFA-3Continuous flight auger17800With UWFBG data
CFA-3aContinuous flight auger17800-
Table 3. Soil profiles of test piles (Units are in meters).
CFA-1SD-1CFA-2CFA-3CFA-3a
Plain fill3.12.93.53.33.1
Silty sand3.02.11.01.73.0
GRS3.04.04.04.13.4
CDG3.94.04.57.97.5
Table 4. Measured and estimated ultimate bearing capacity of test piles.
Pile LabelMeasured UBC
(kN)
Estimated UBC
(kN)
Difference
(kN)
Difference
(%)
CFA-133002120118055.7%
SD-11550138017012.3%
CFA-242803190109034.2%
CFA-360204310171039.7%
CFA-3a63004180212050.7%
PHC pile--3549----
Table 5. Measured and empirical resistance at UBC in CSR and CDG.
Type of PileCRSCDG Soil
Shaft Resistance (kPa)Shaft Resistance (kPa)Base Resistance (kN)
CFA pile (this study)1401533080
SD pile (this study)57601670
SD pile (design code) *44 (28~48)48 (28~48)1400 (1400–2000)
Bored pile (no bentonite; design code)84 (58~94)120 (120~140)1400 (1400–2000)
PHC pile (design code)88 (74~94)140 (140~160)5000 (5000–7000)
* Data in bracket are the empirical value range from the design code.
Disclaimer/Publisher’s Note: The statements, opinions and data contained in all publications are solely those of the individual author(s) and contributor(s) and not of MDPI and/or the editor(s). MDPI and/or the editor(s) disclaim responsibility for any injury to people or property resulting from any ideas, methods, instructions or products referred to in the content.

