
Experimental Study of Hardening Small Strain Model Parameters for Strata Typical of Zhengzhou and Their Application in Foundation Pit Engineering
 ,
,
Abstract
:1. Introduction
2. Materials and Methods
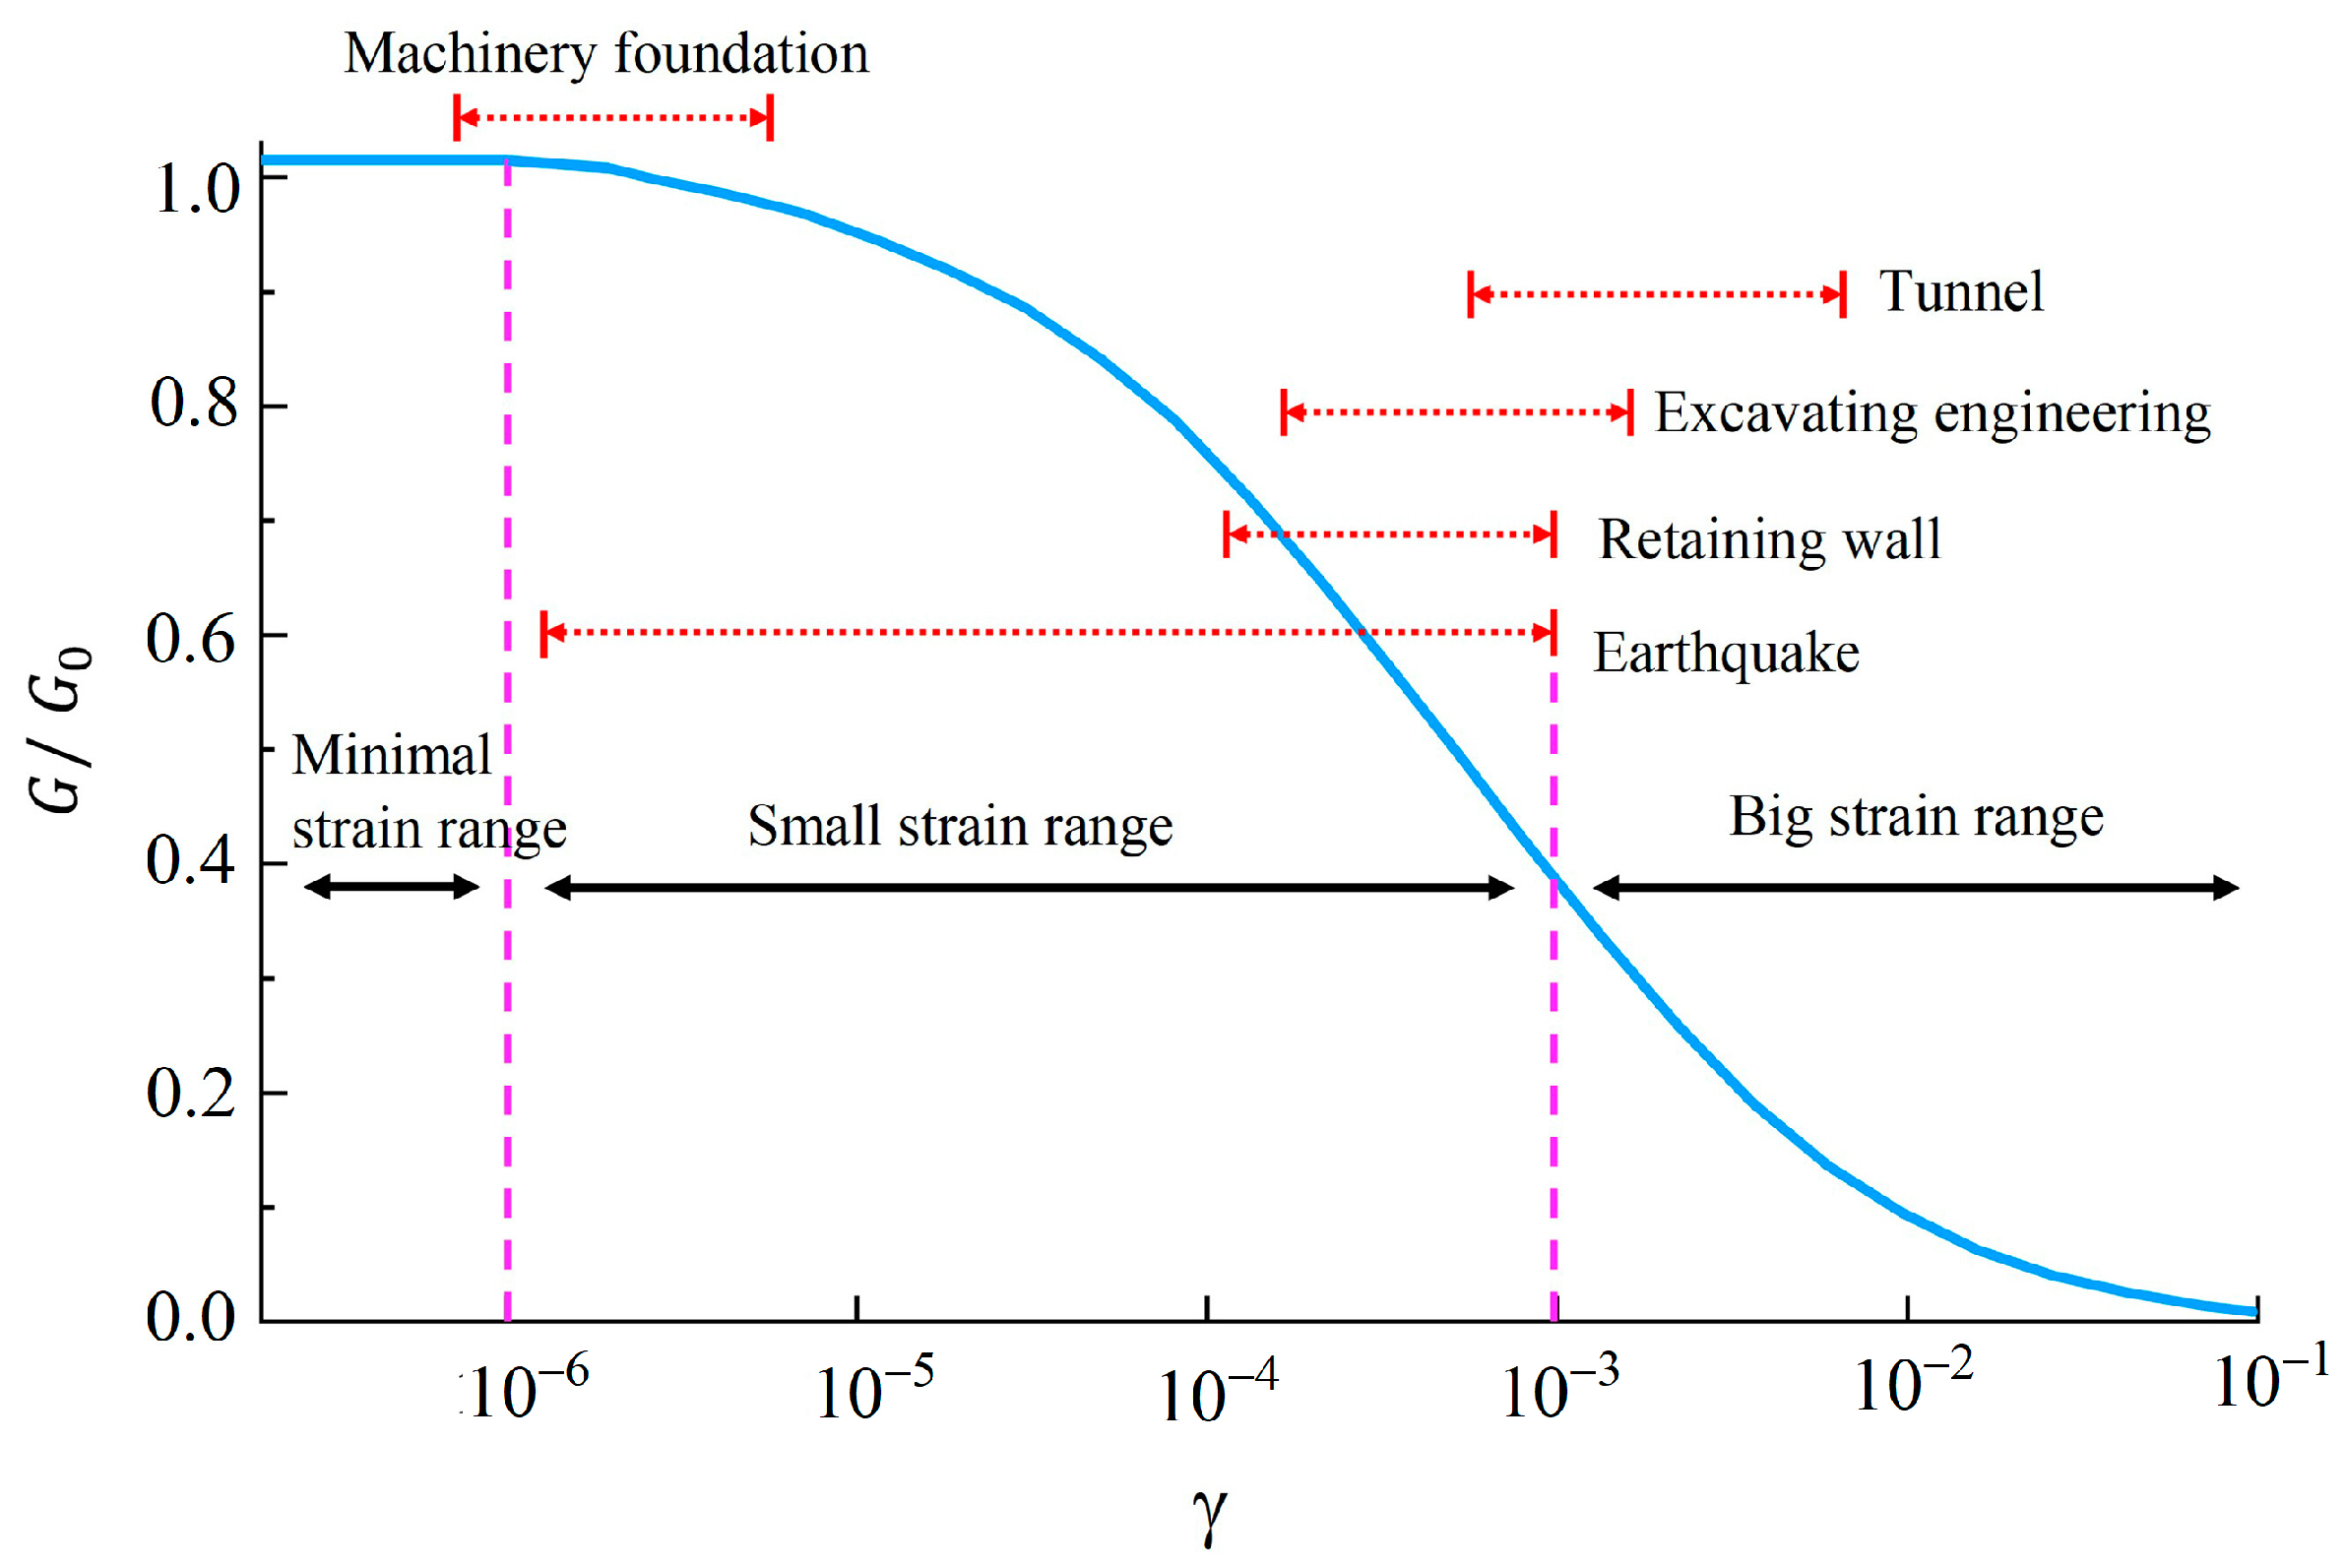
2.1. Introduction of HSS Model Parameters
2.2. Experimental Materials
2.3. Experimental Methods
2.3.1. Standard Consolidation Test
2.3.2. Triaxial Consolidated Drained (CD) Test
2.3.3. K0 Consolidation Test
2.3.4. Triaxial Loading–Unloading Test
2.3.5. Resonant Column Test
3. HSS Model Parameter Test Results
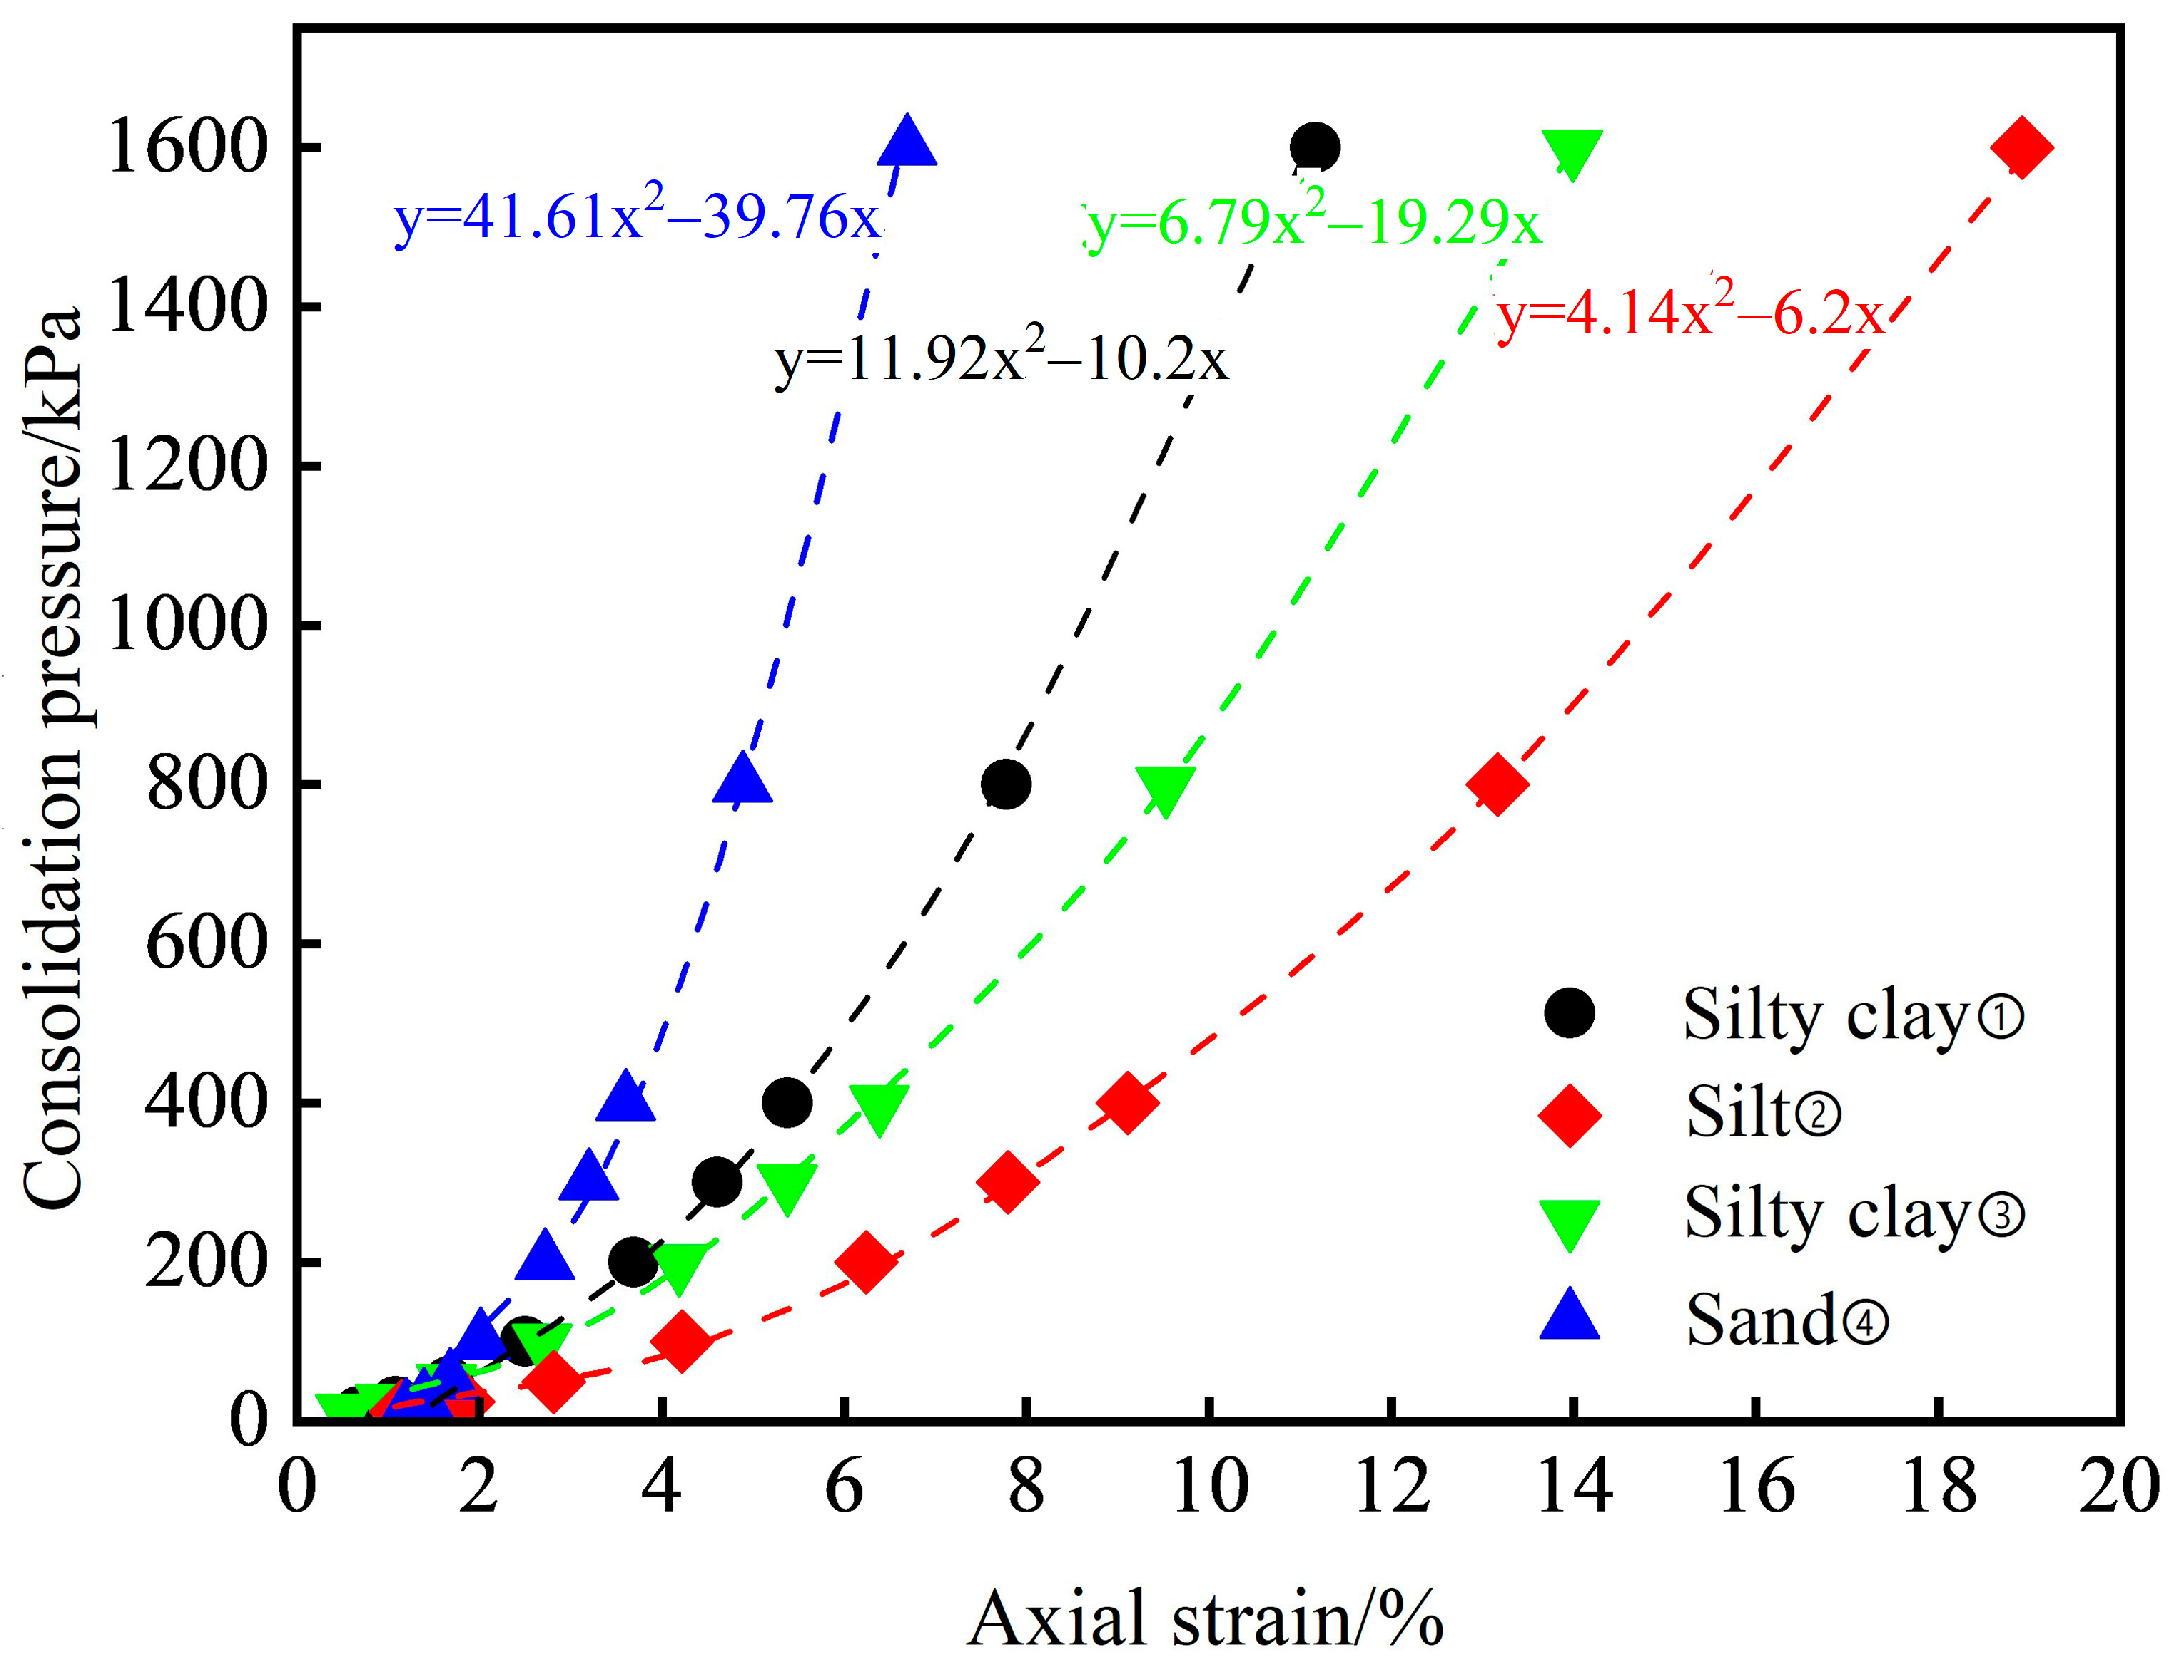
3.1. Standard Consolidation Test
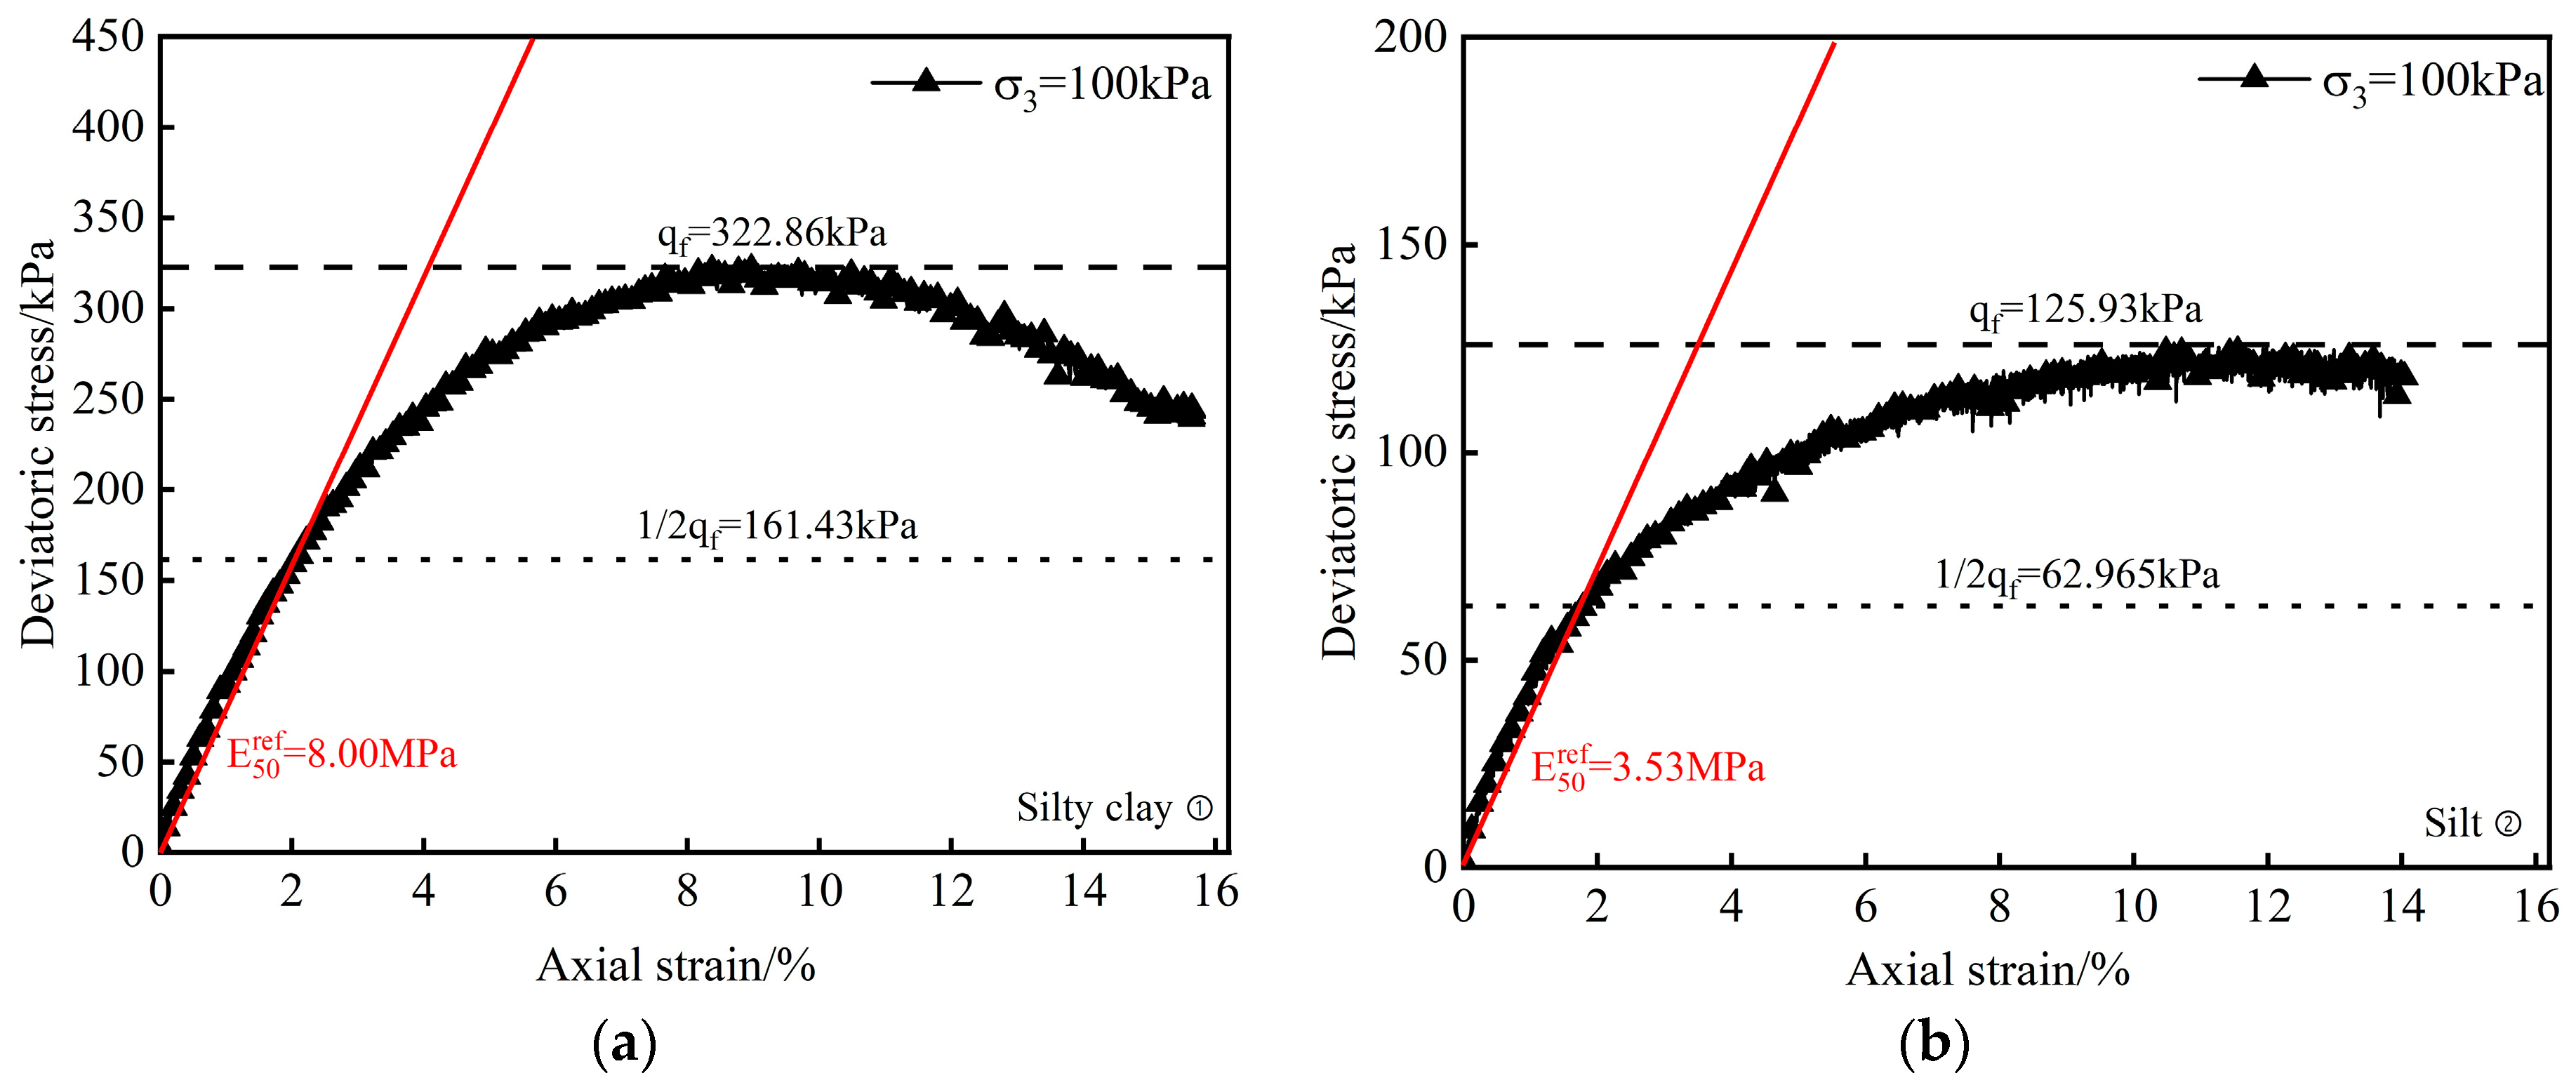
3.2. Triaxial Consolidated Drained (CD) Test
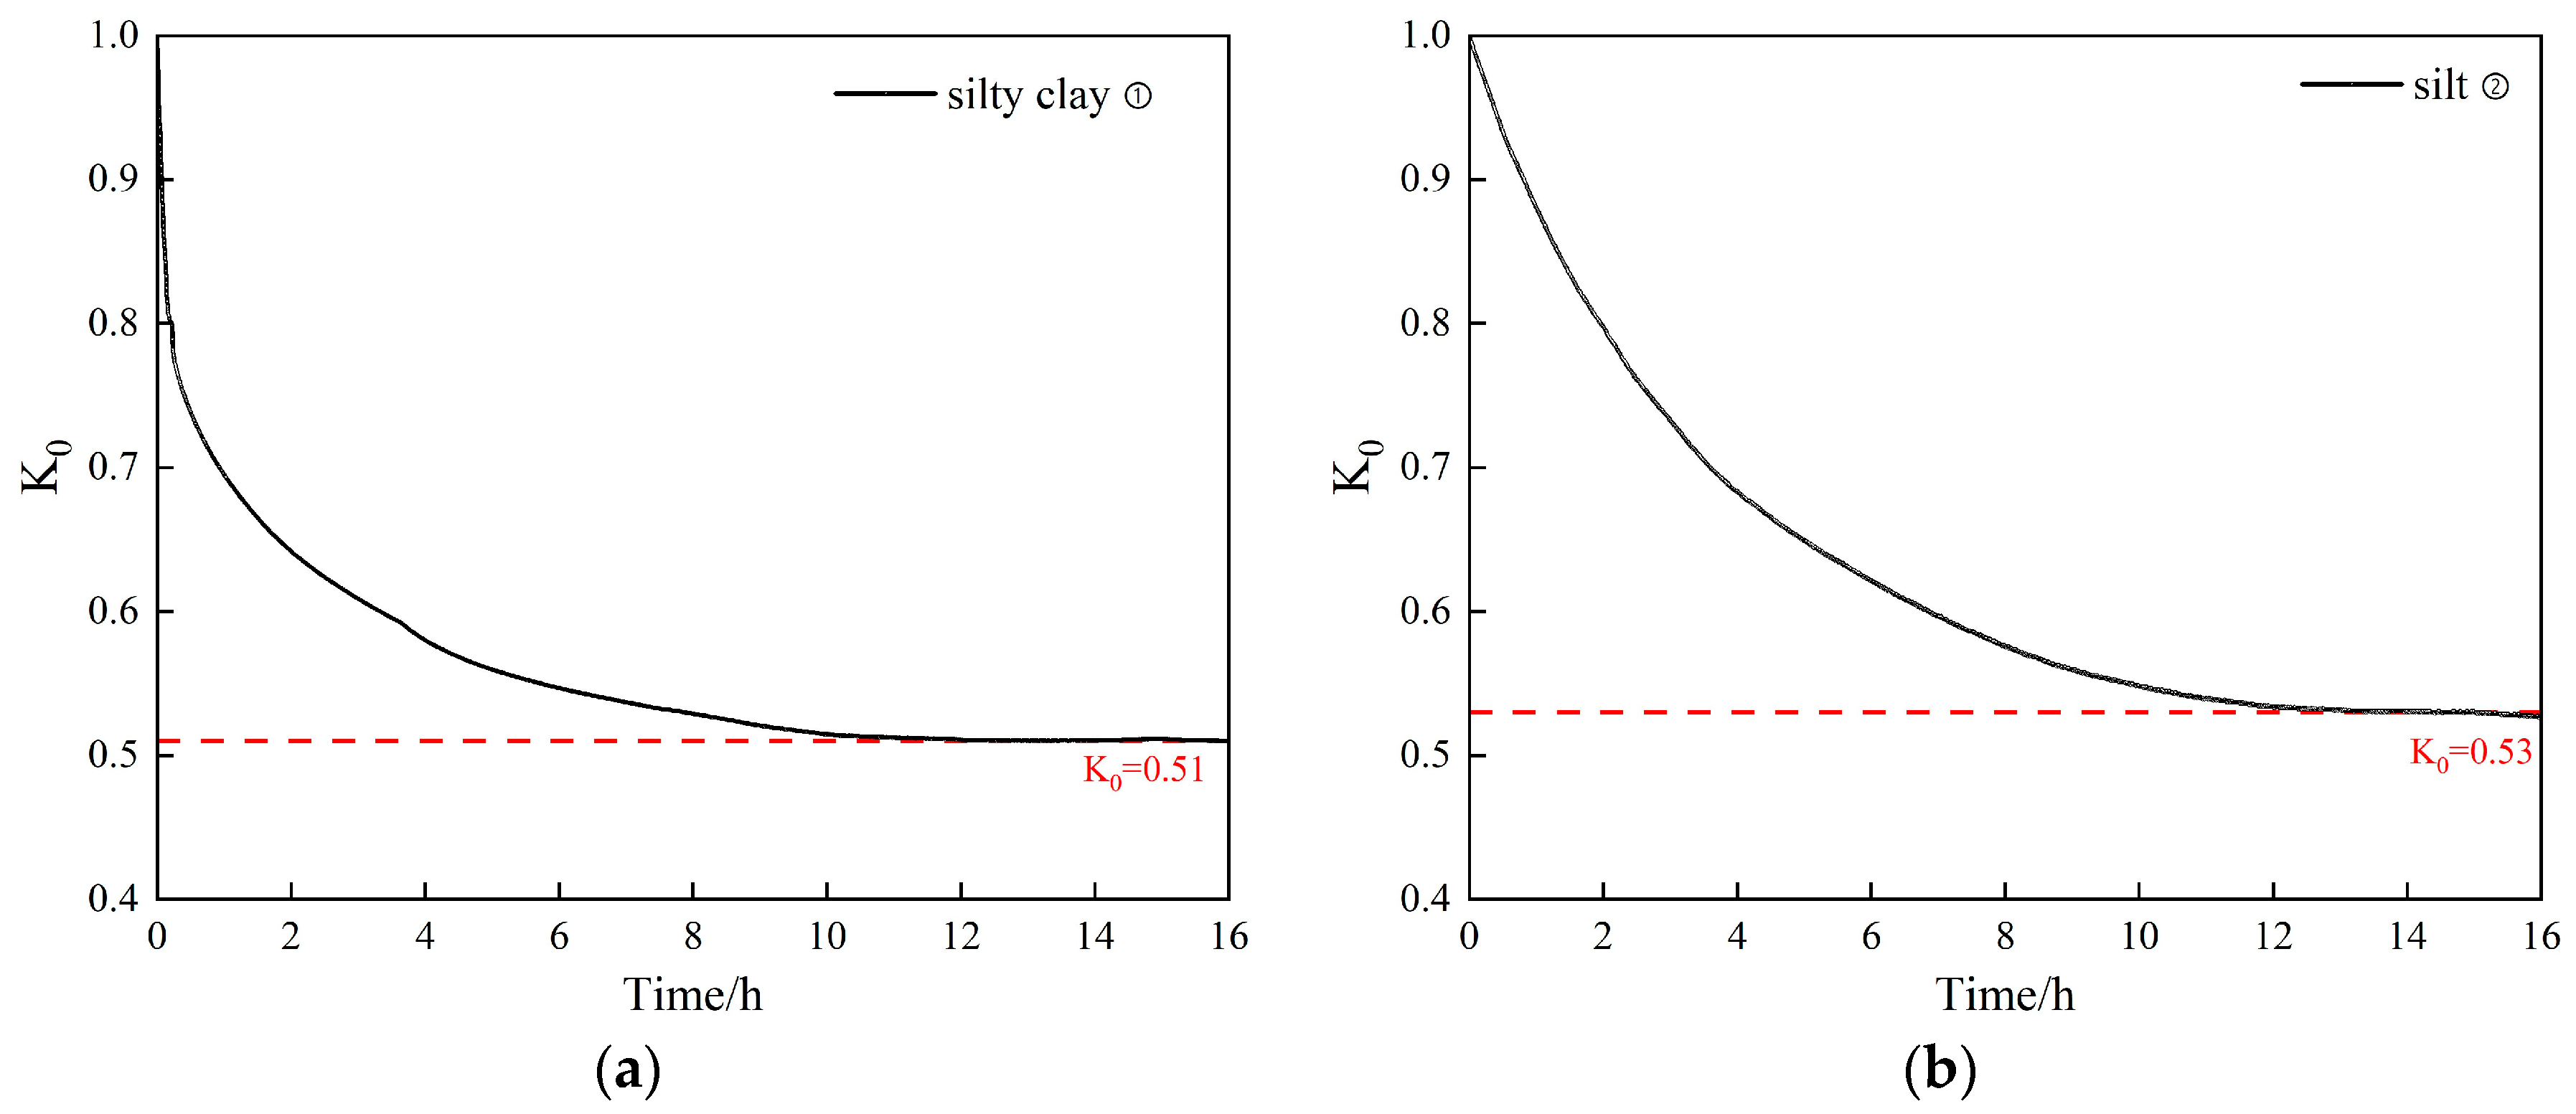
3.3. K0 Consolidation Test
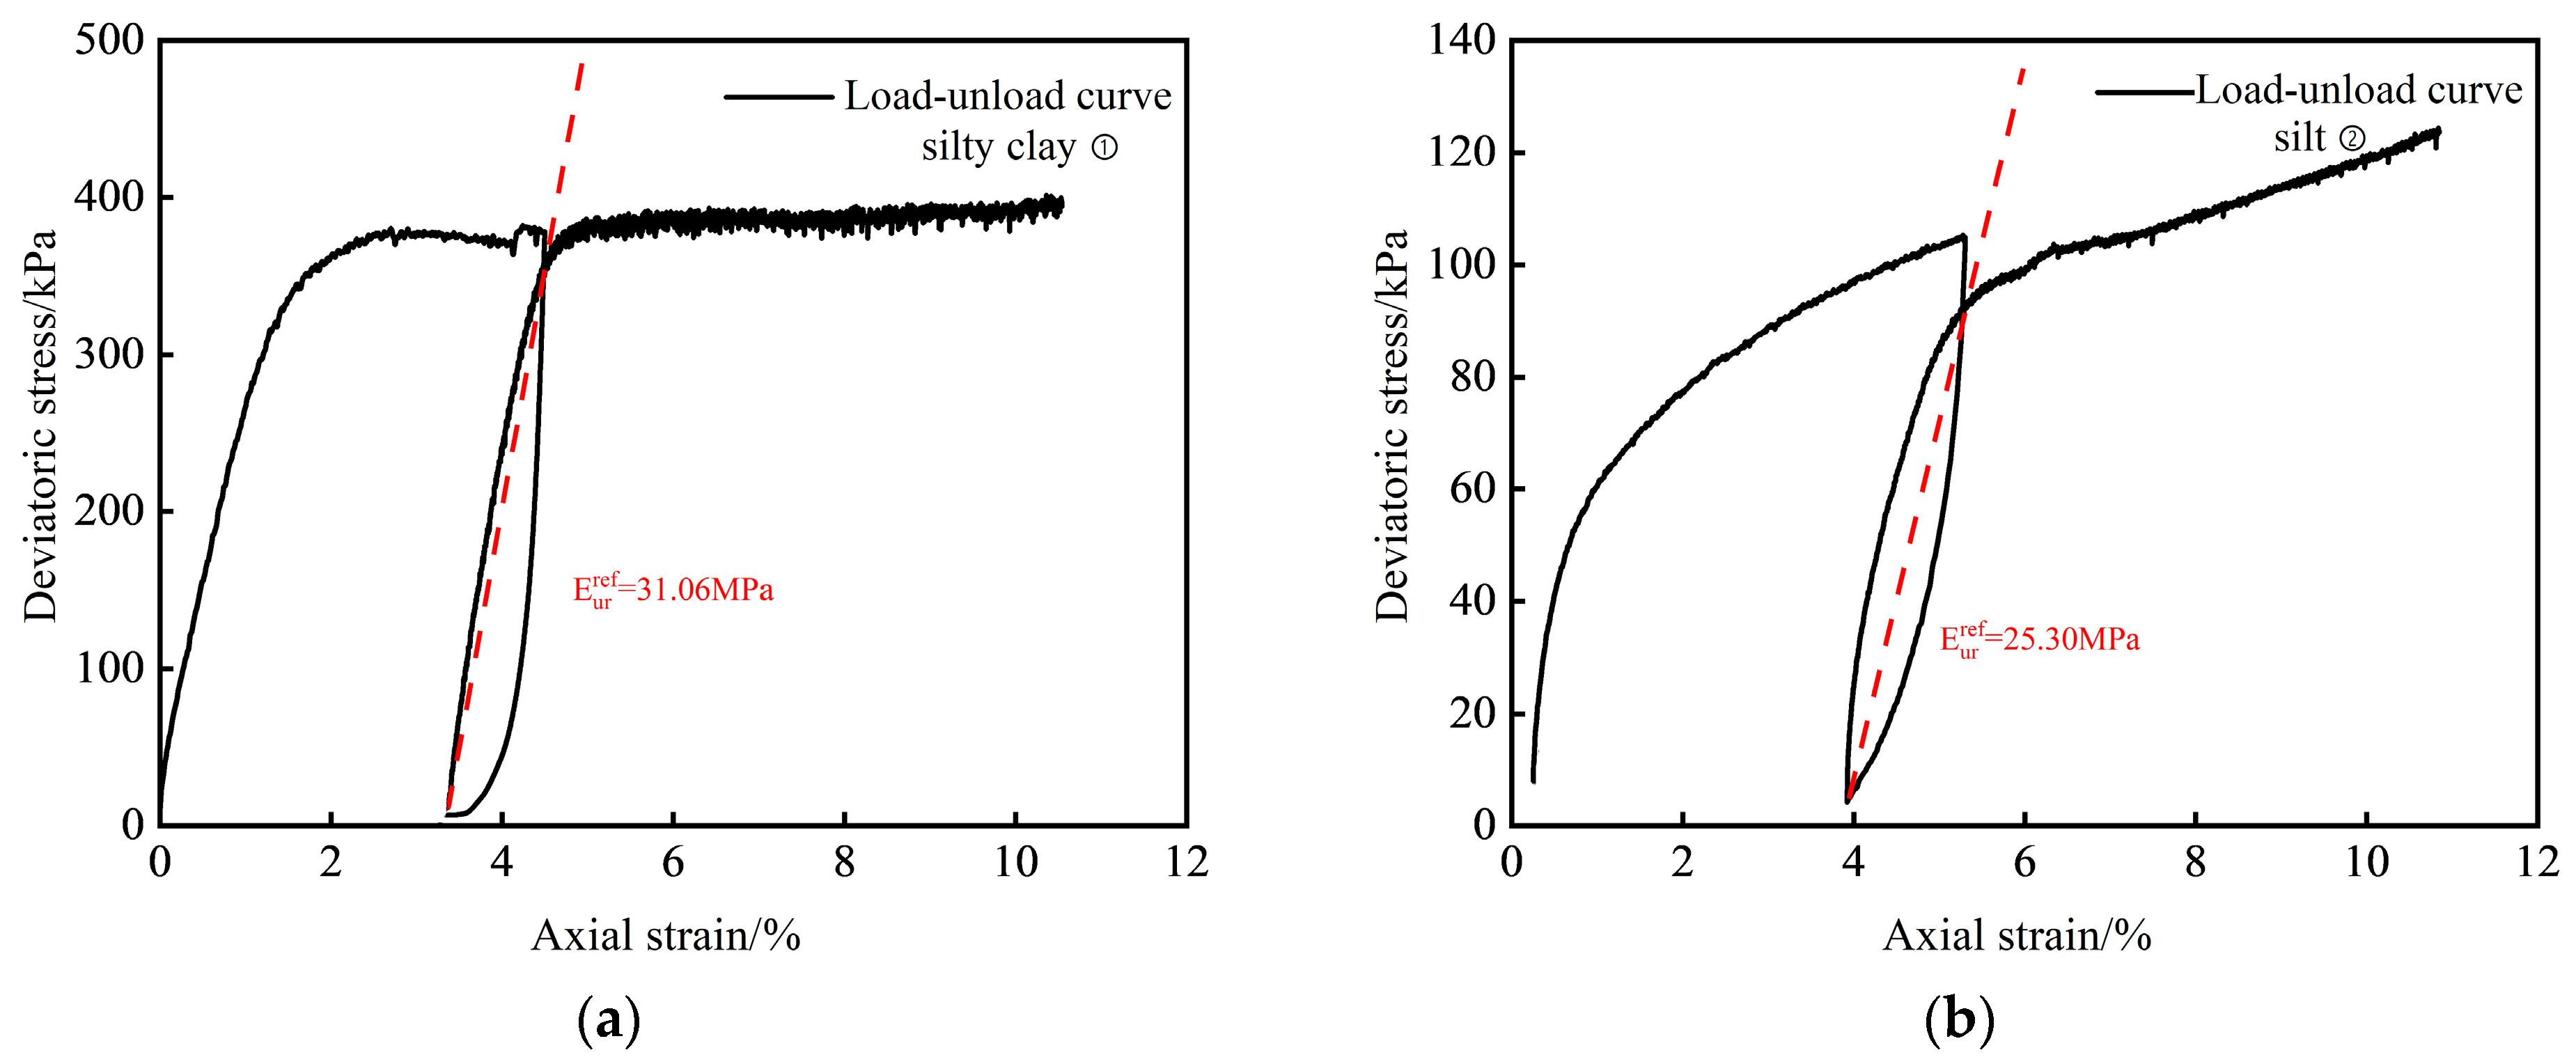
3.4. Triaxial Loading–Unloading Test
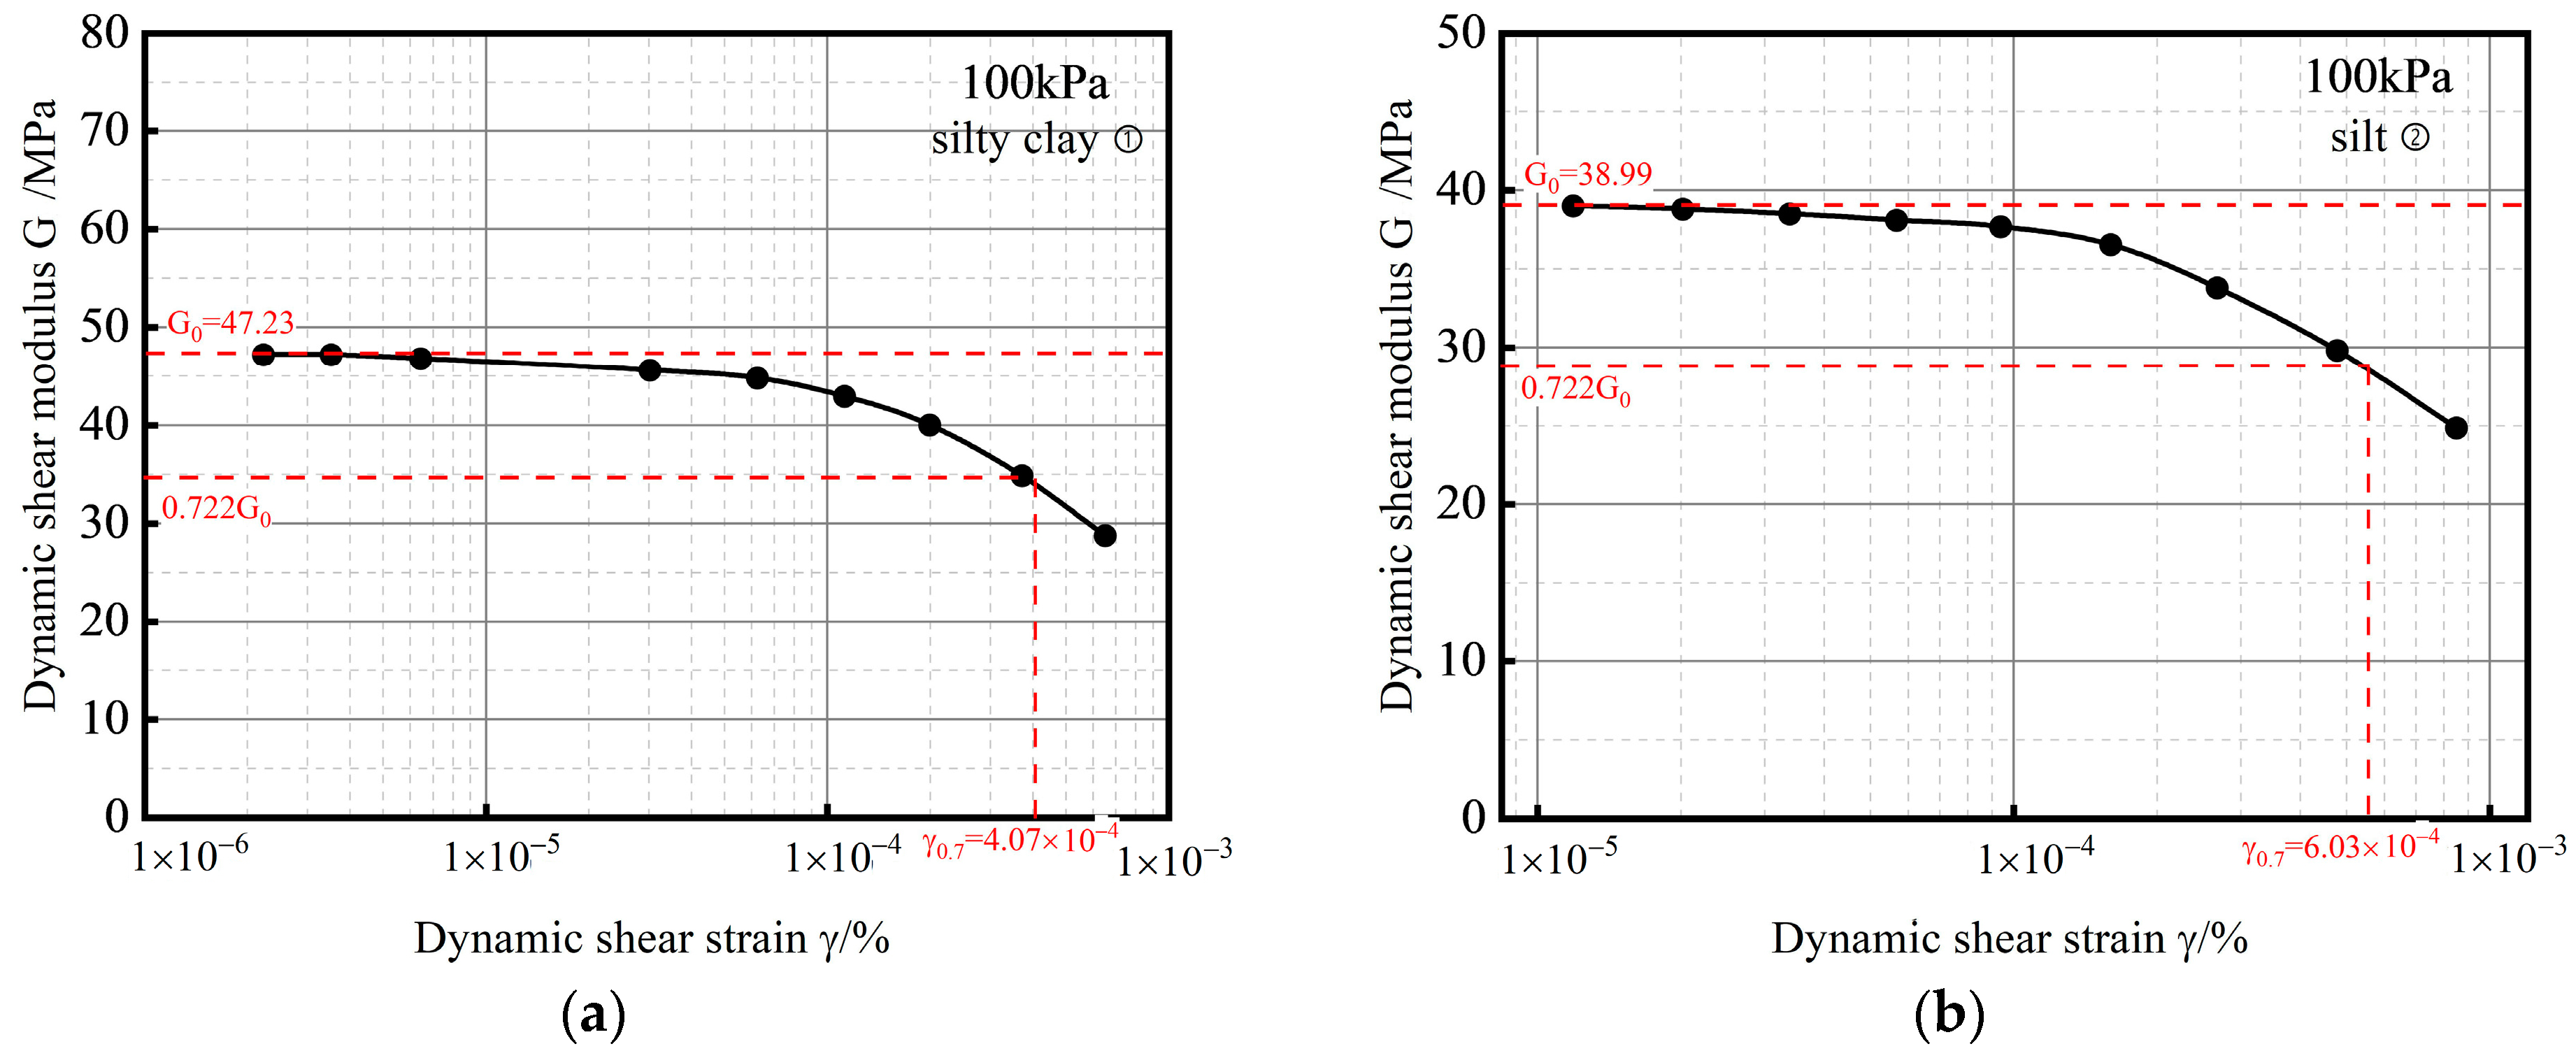
3.5. Resonant Column Test
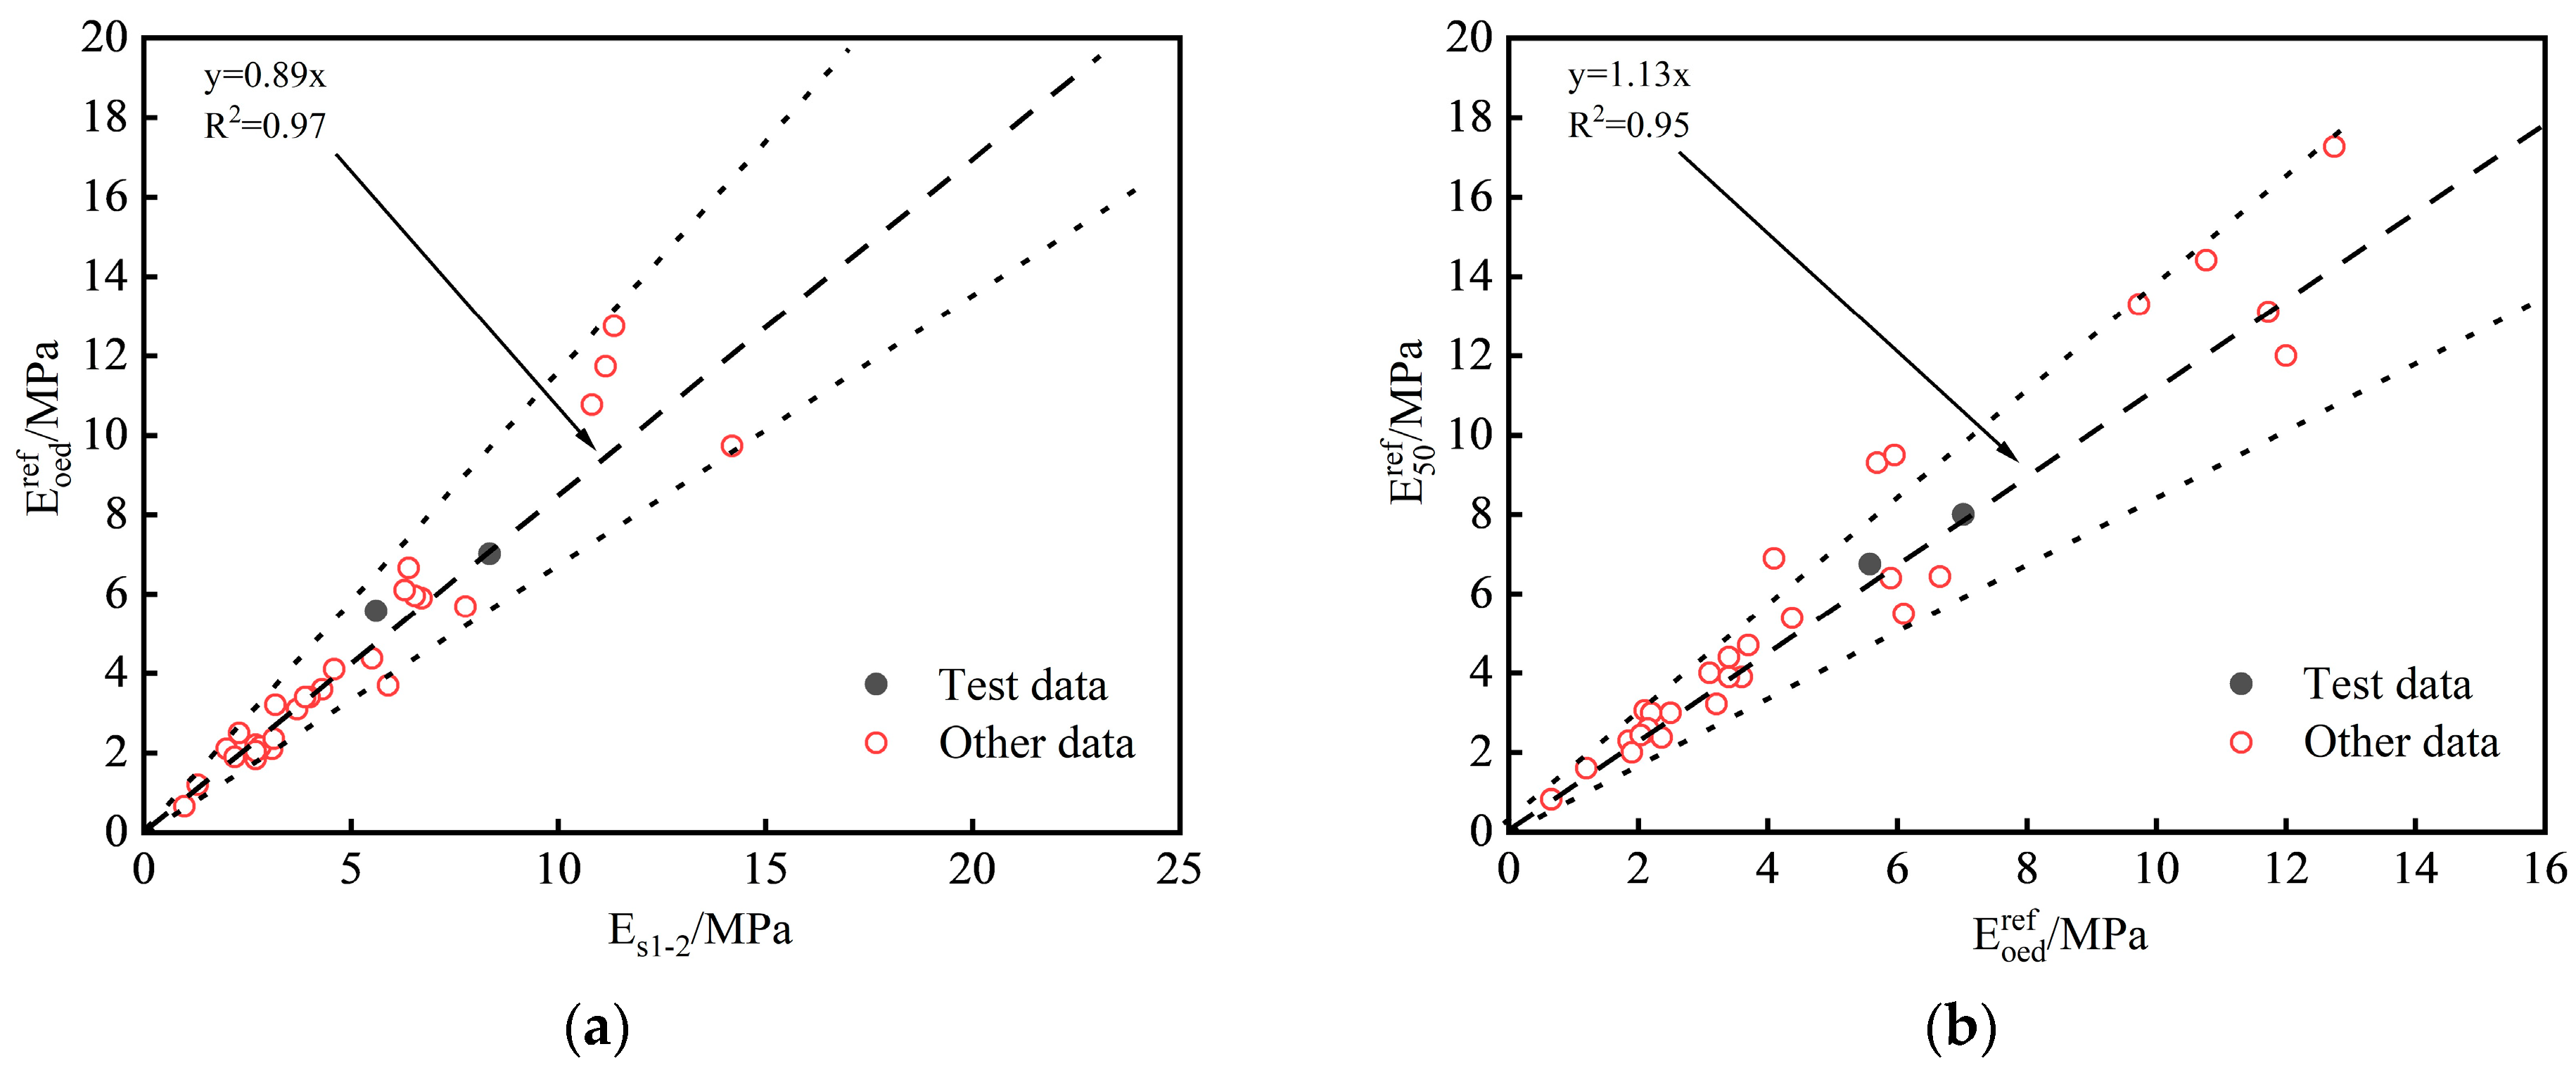
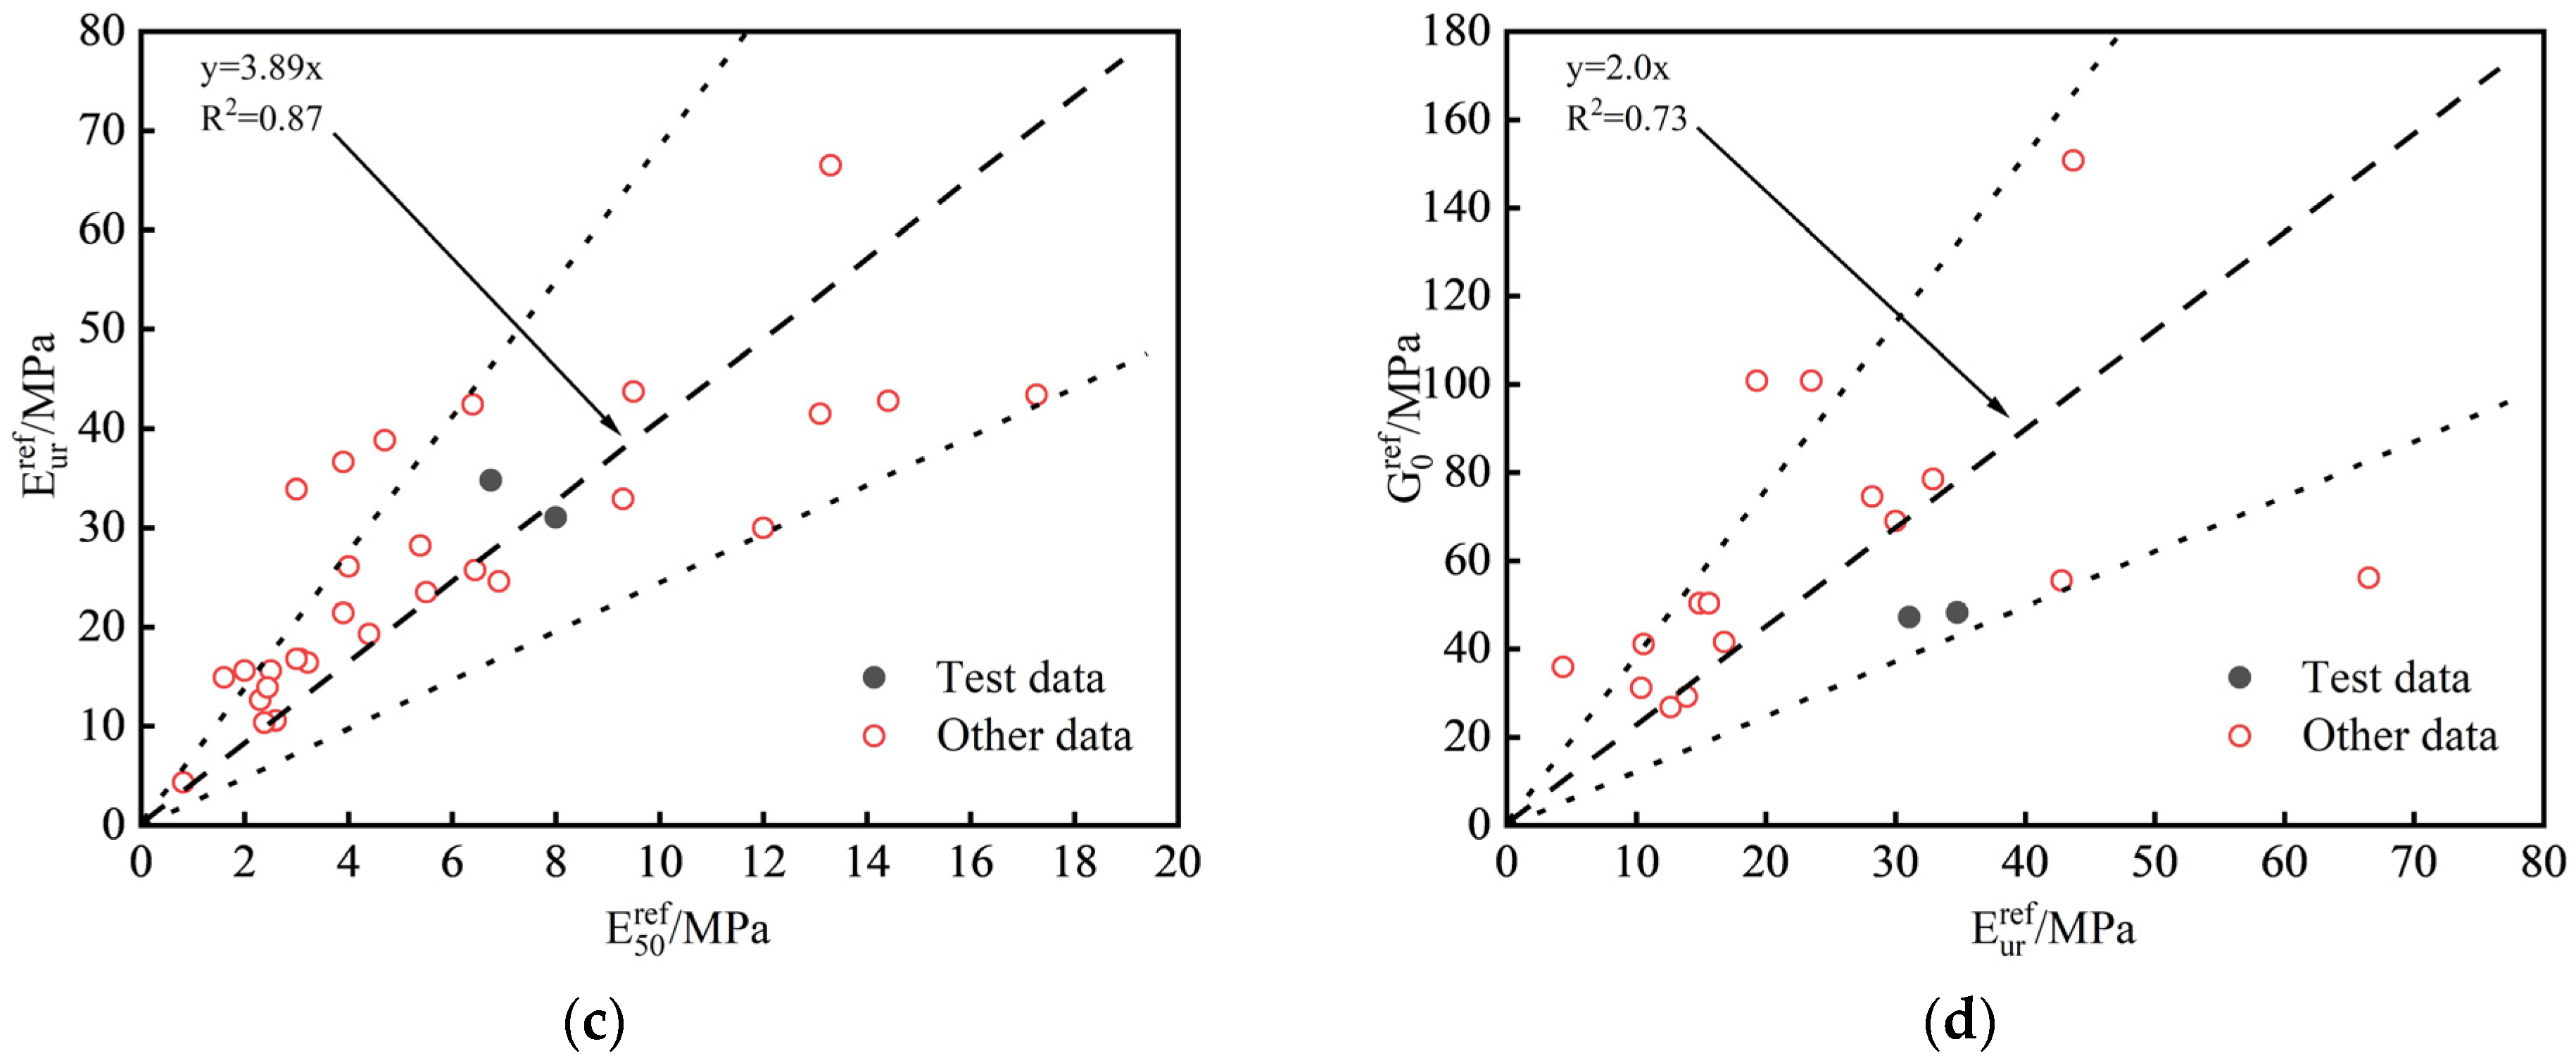
3.6. Statistical Analysis of HSS Model Parameters
4. Numerical Simulation of Foundation Pit
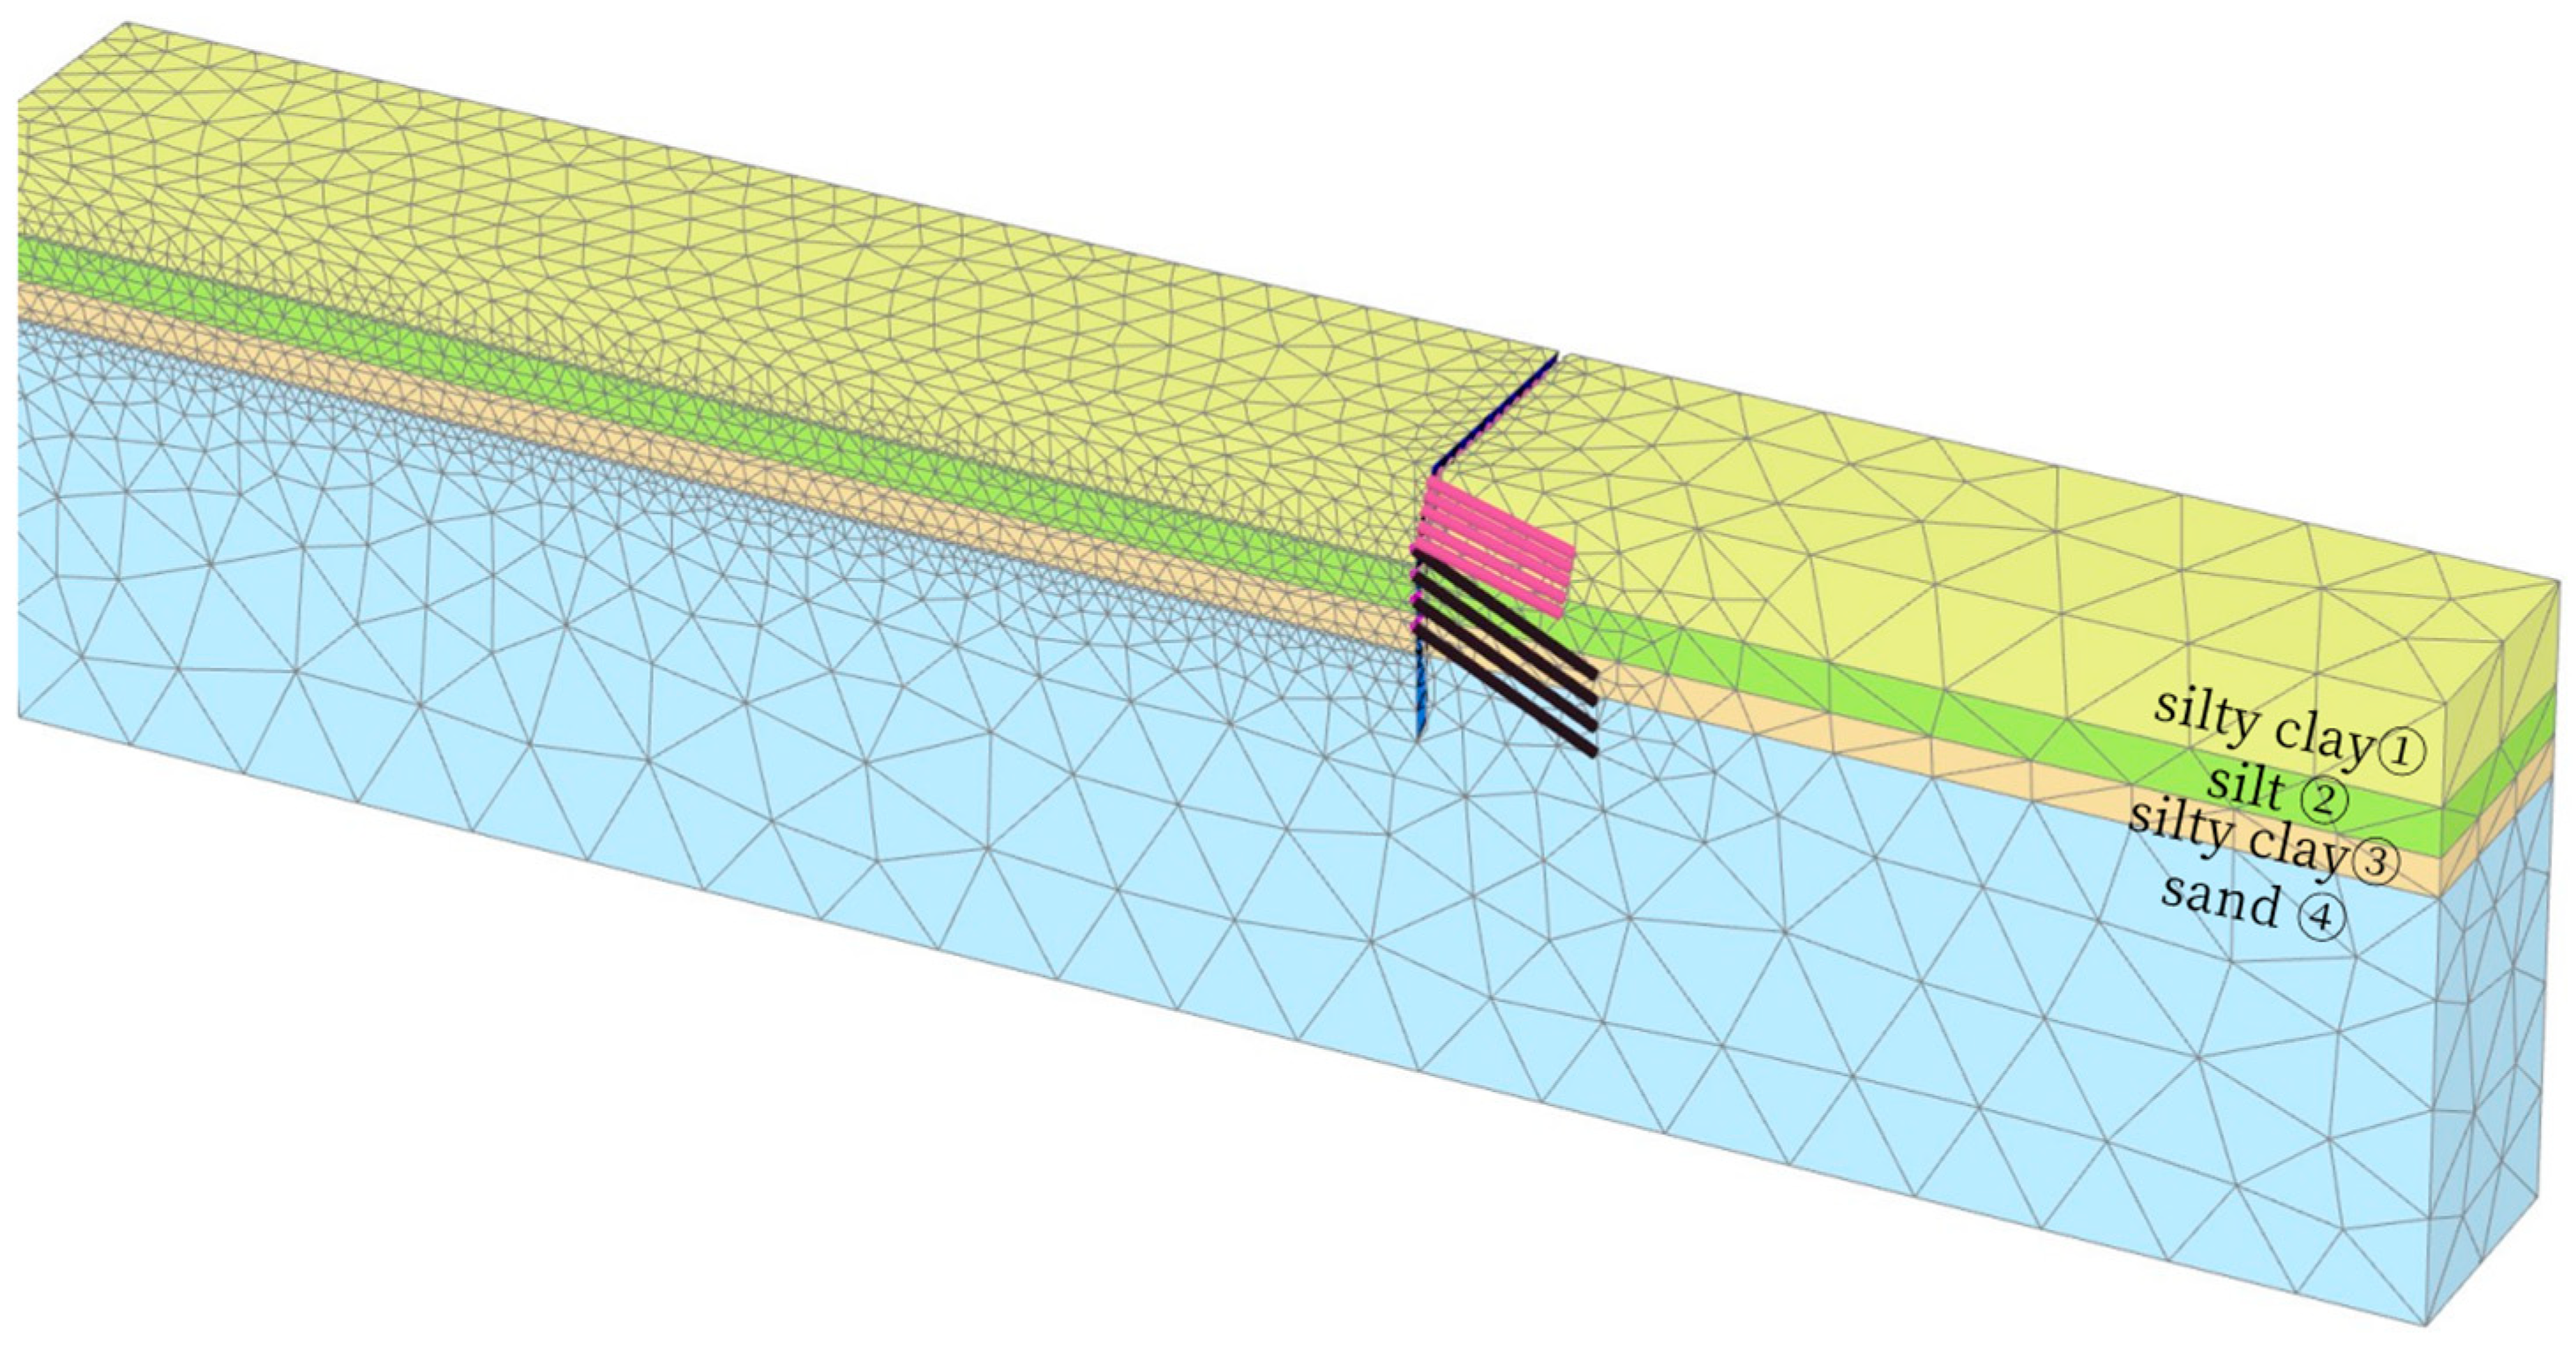
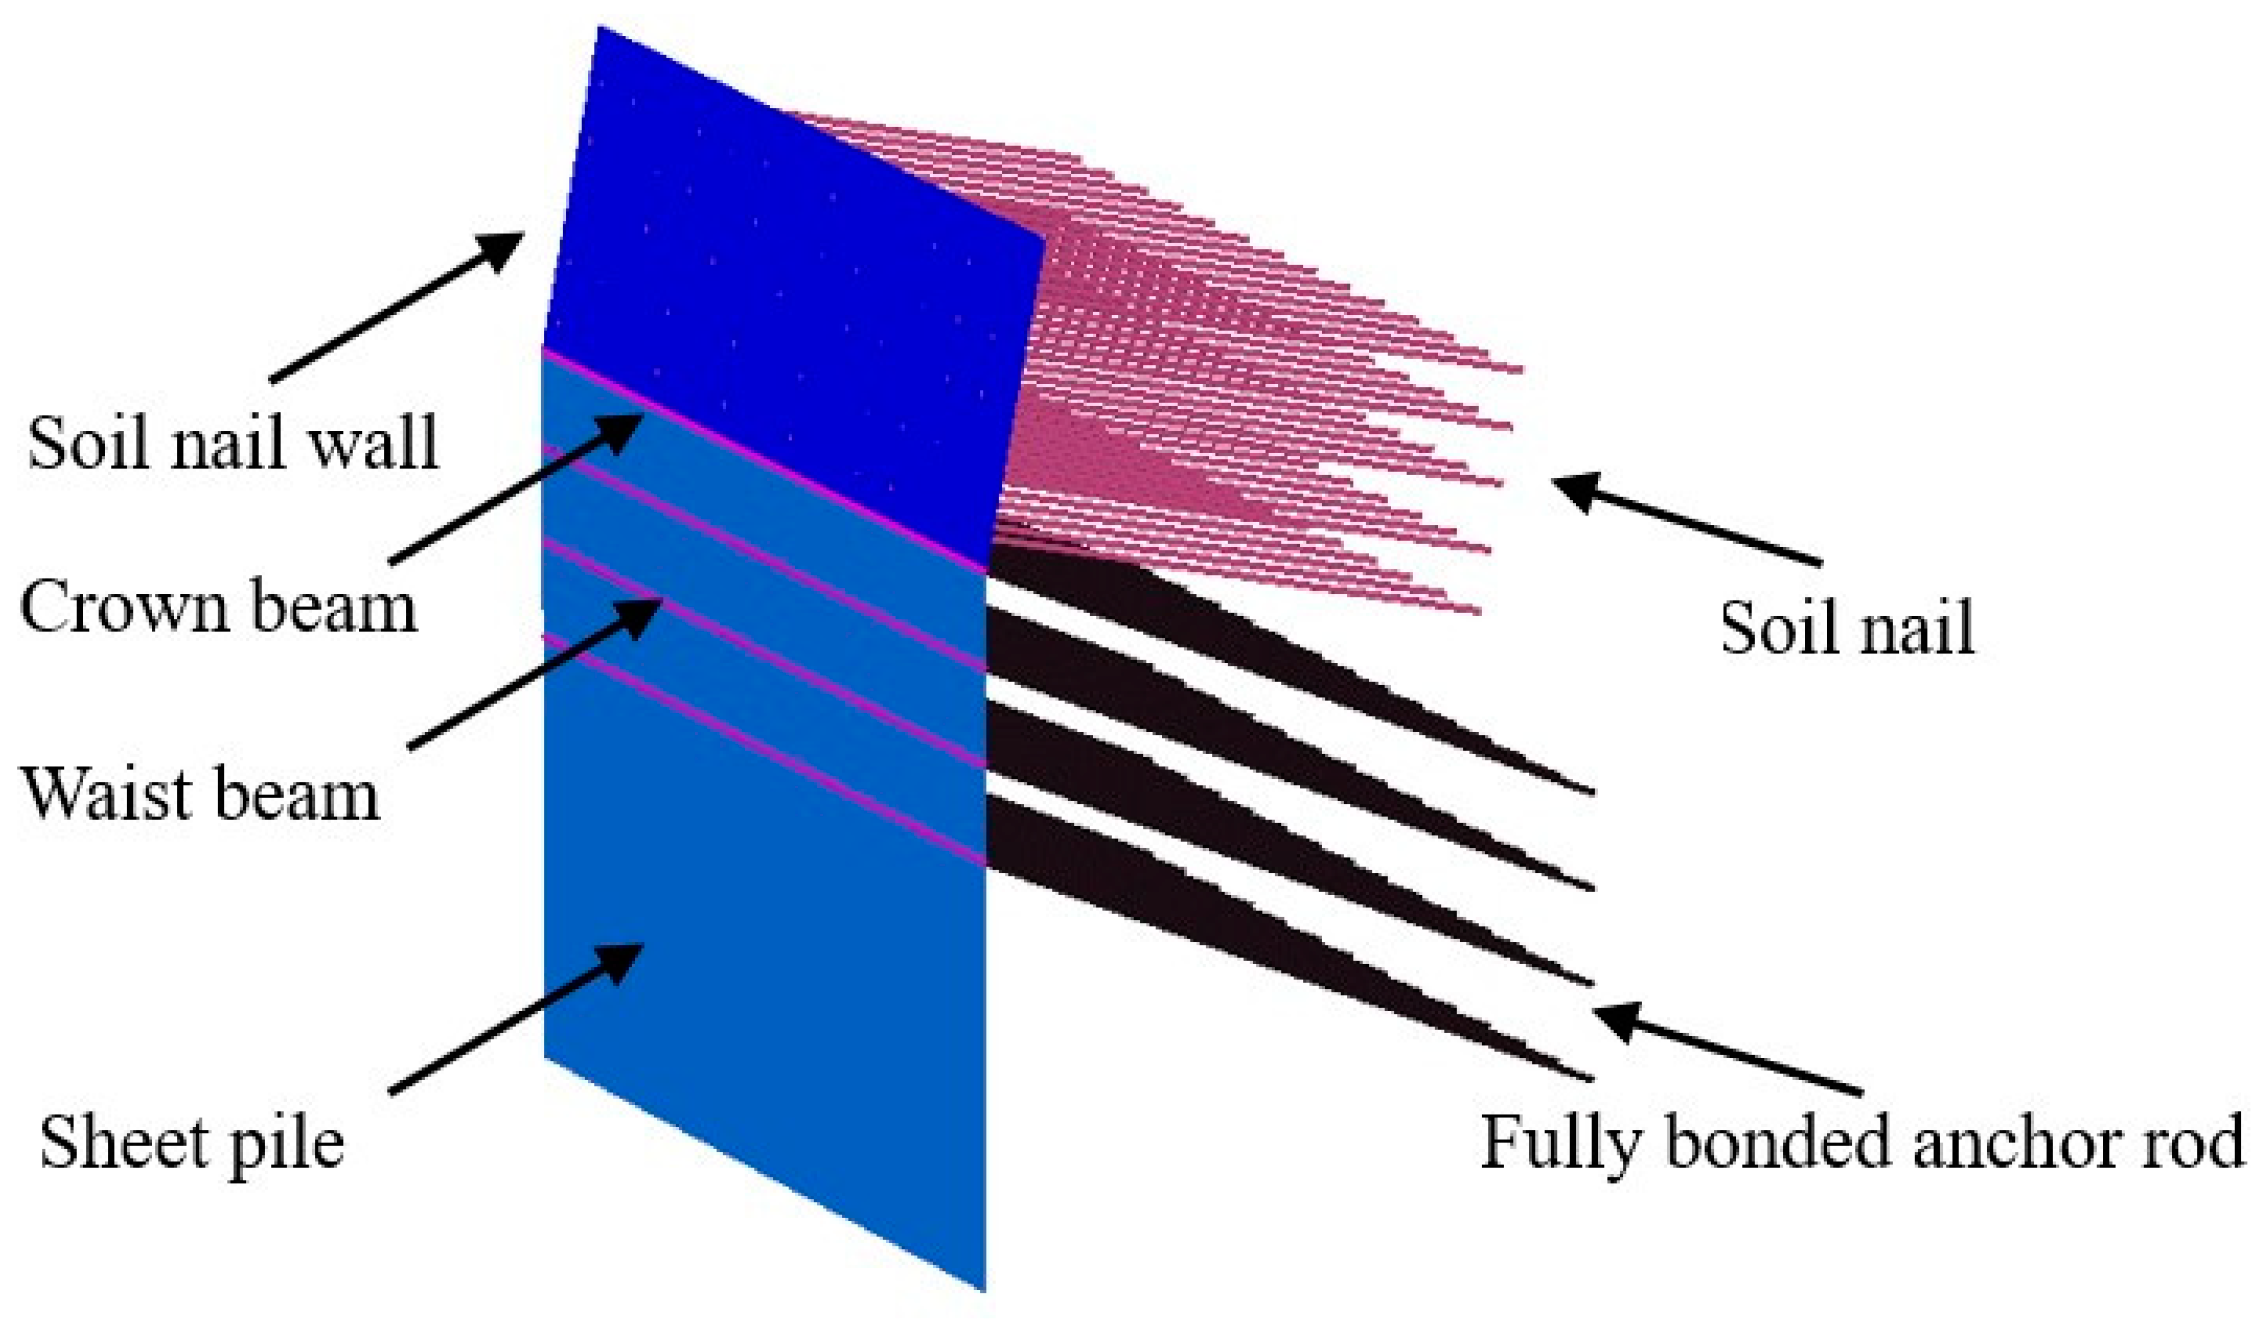
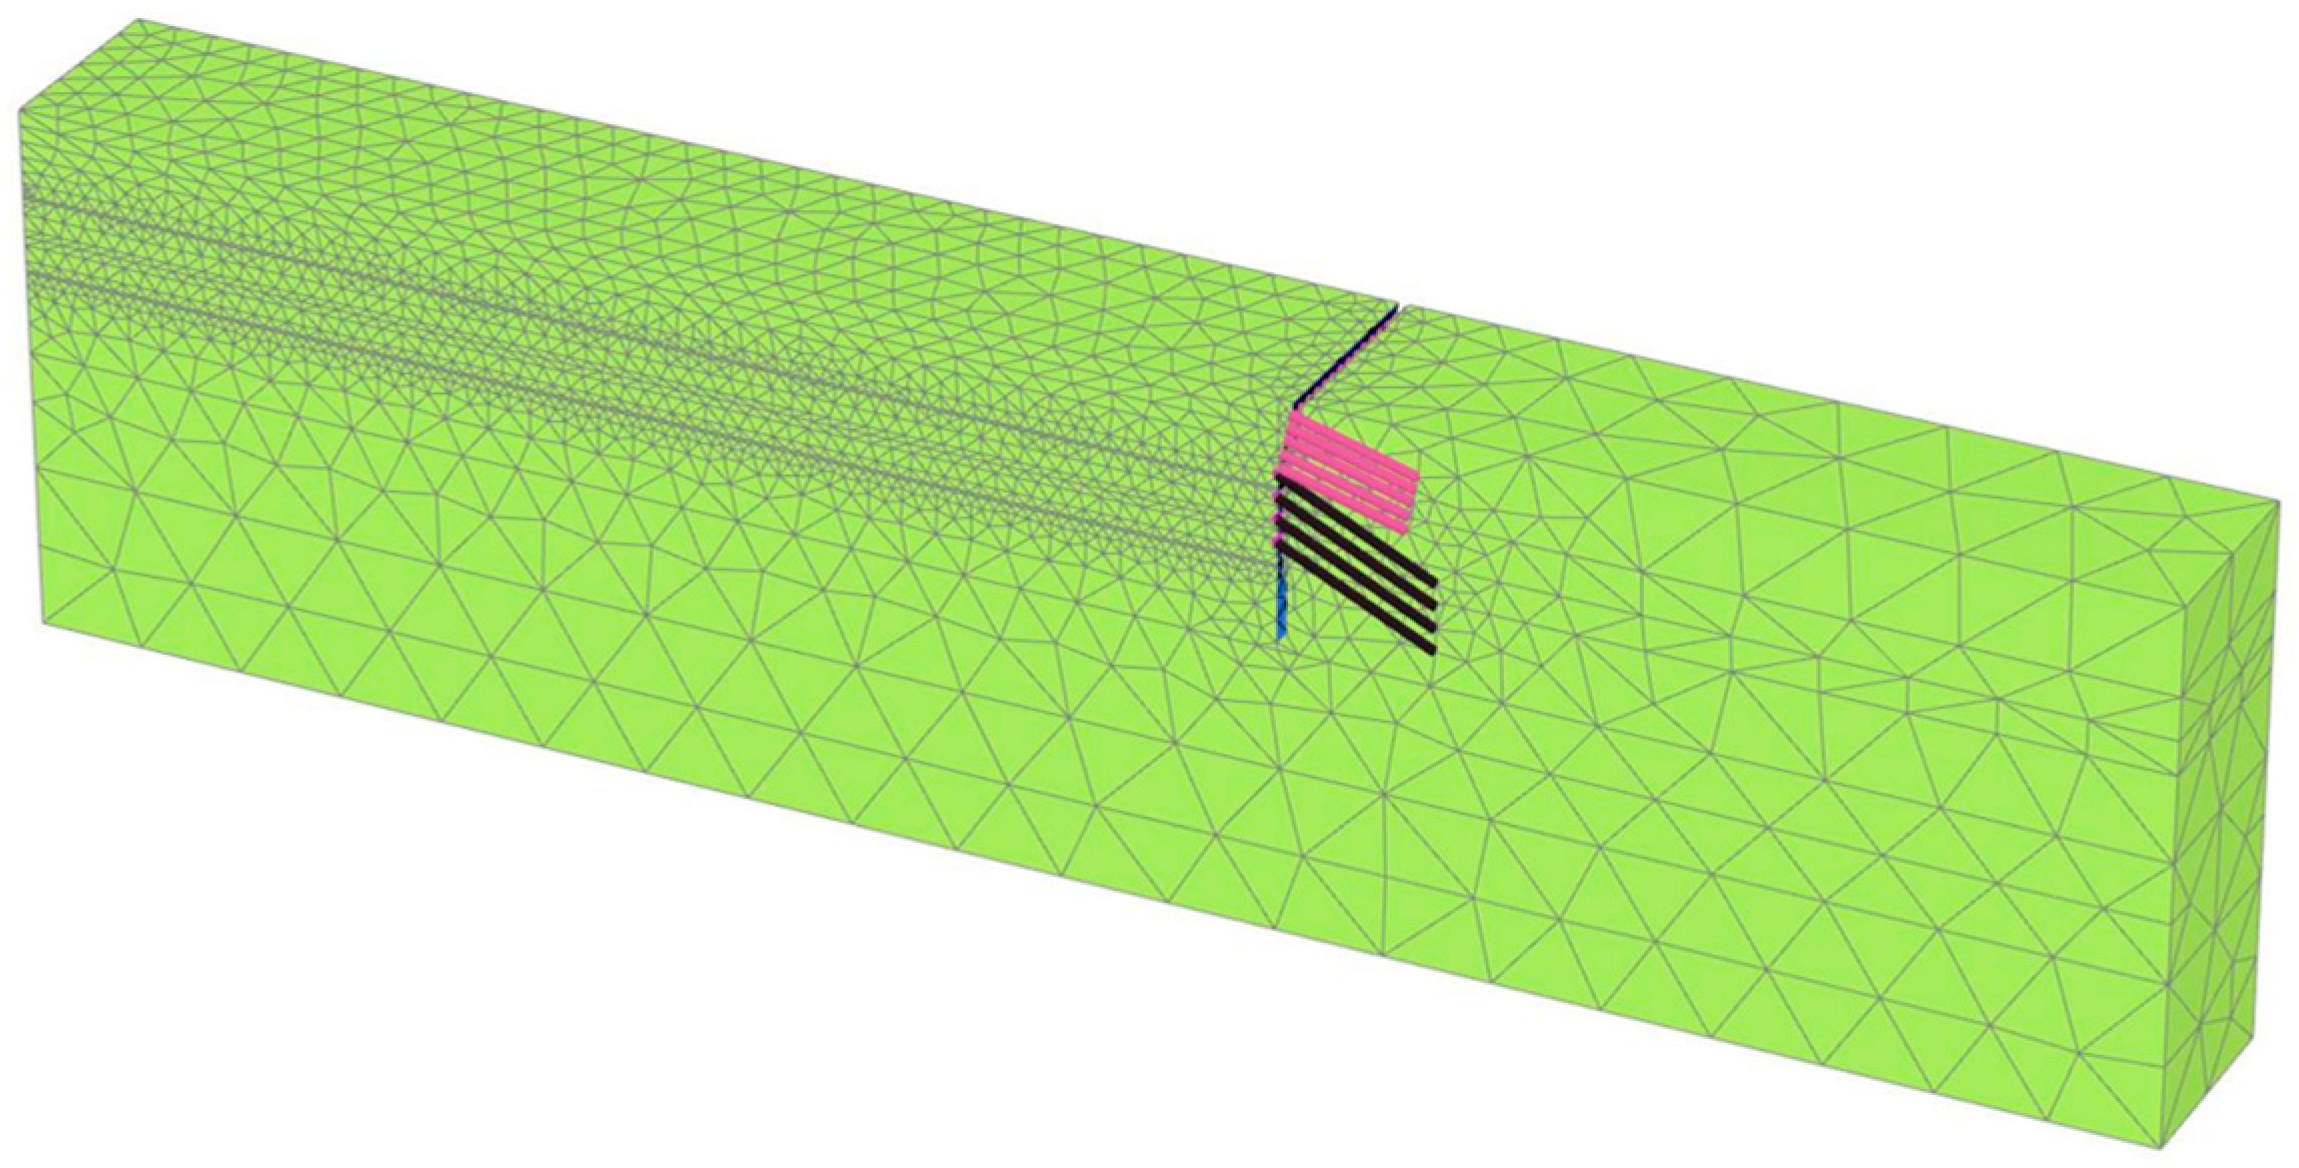
4.1. Establishment of Finite Element Model
4.2. Verification of HSS Model Parameters
4.3. Analysis of Three-Dimensional Finite Element Calculation Results
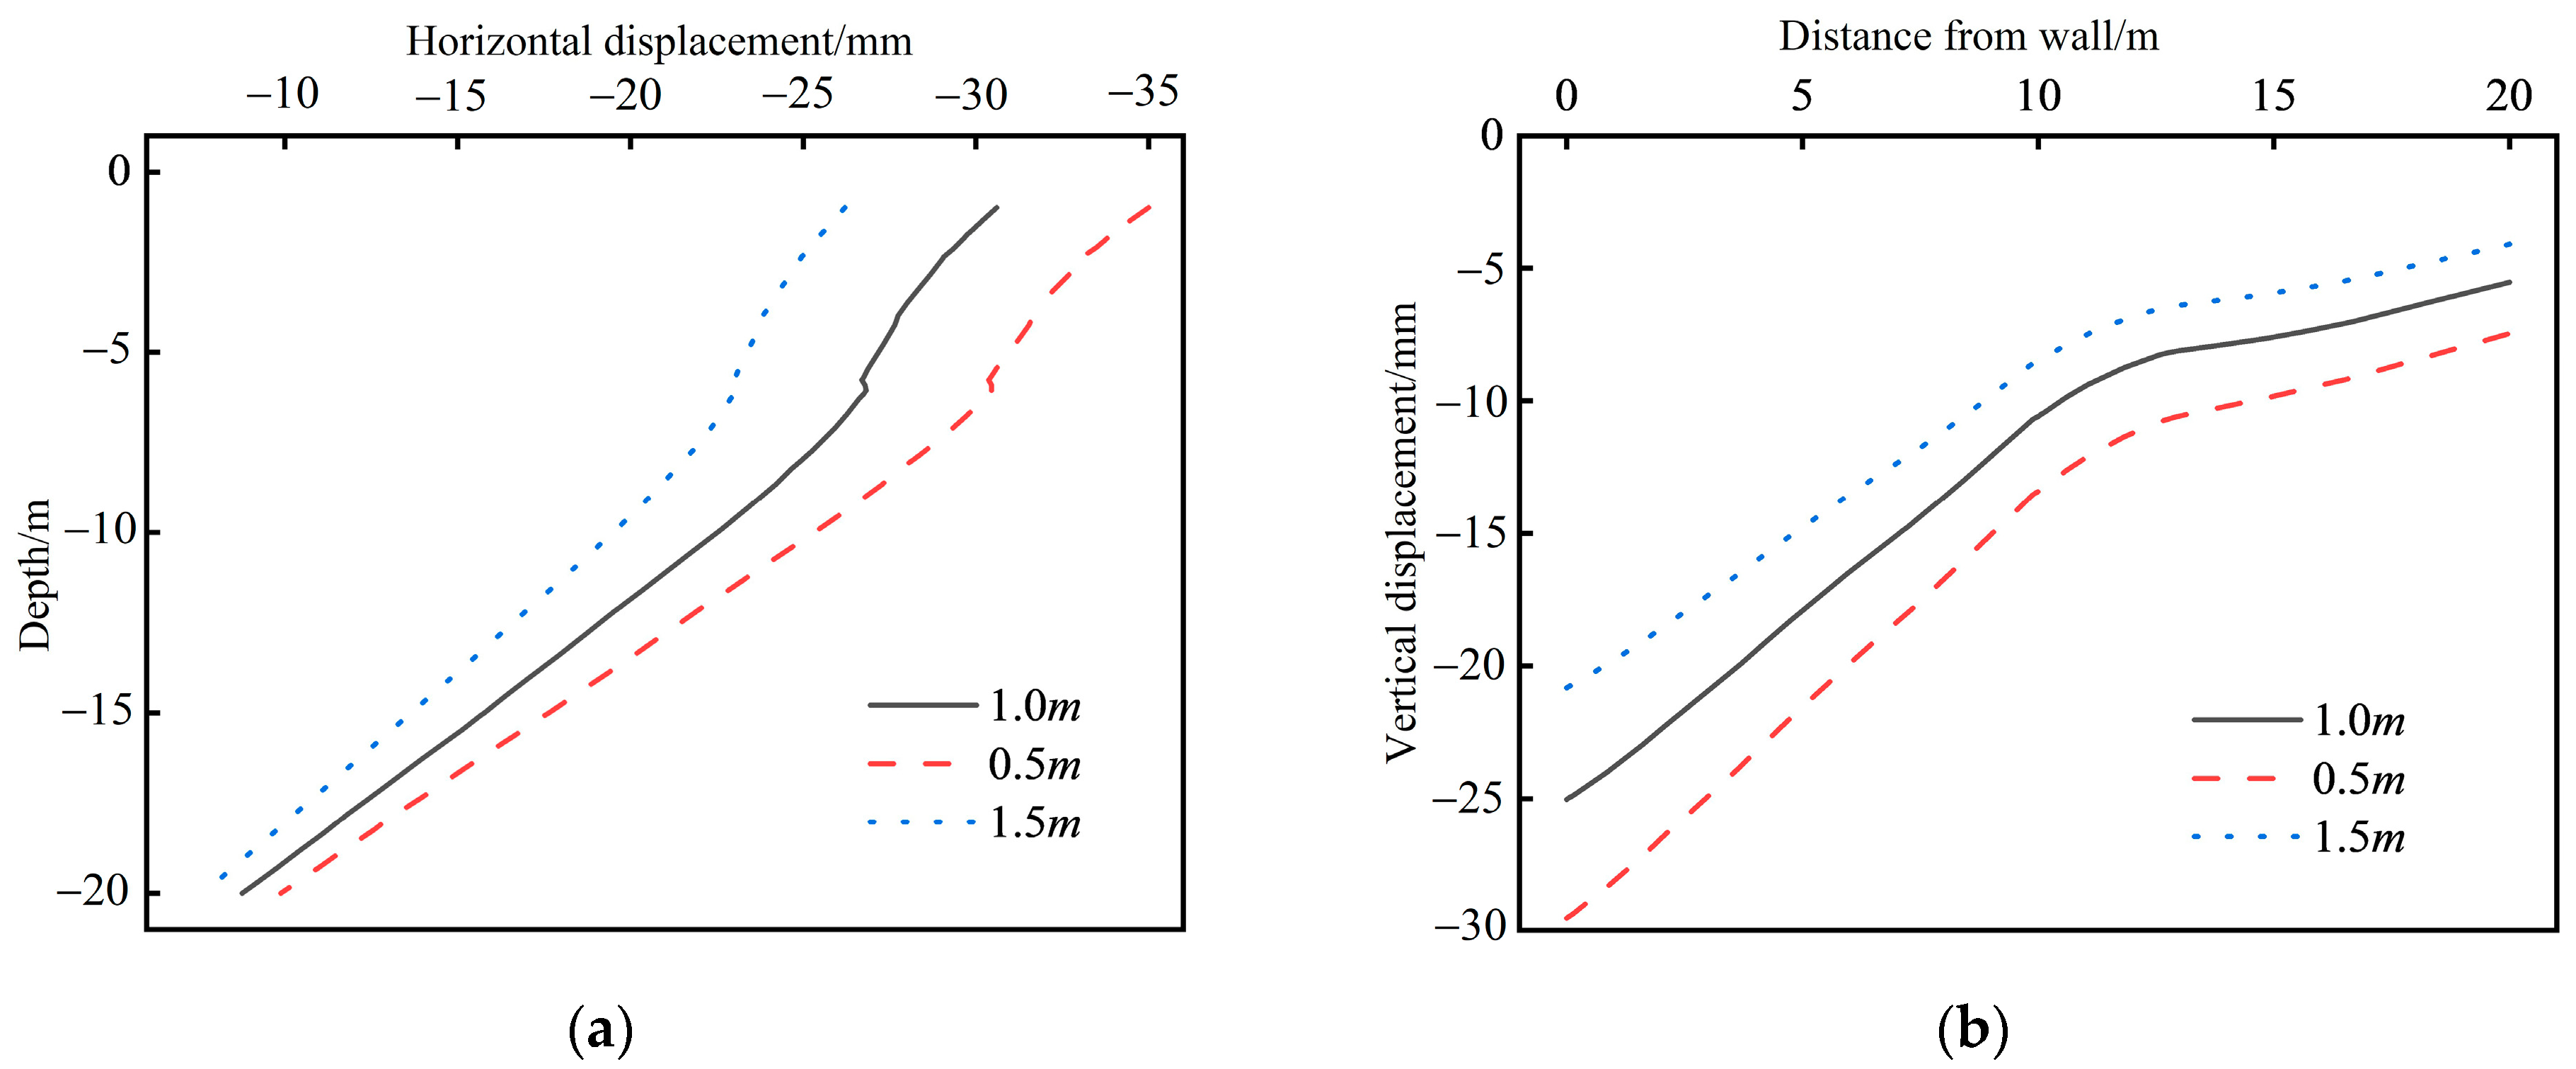
4.3.1. Horizontal Displacement
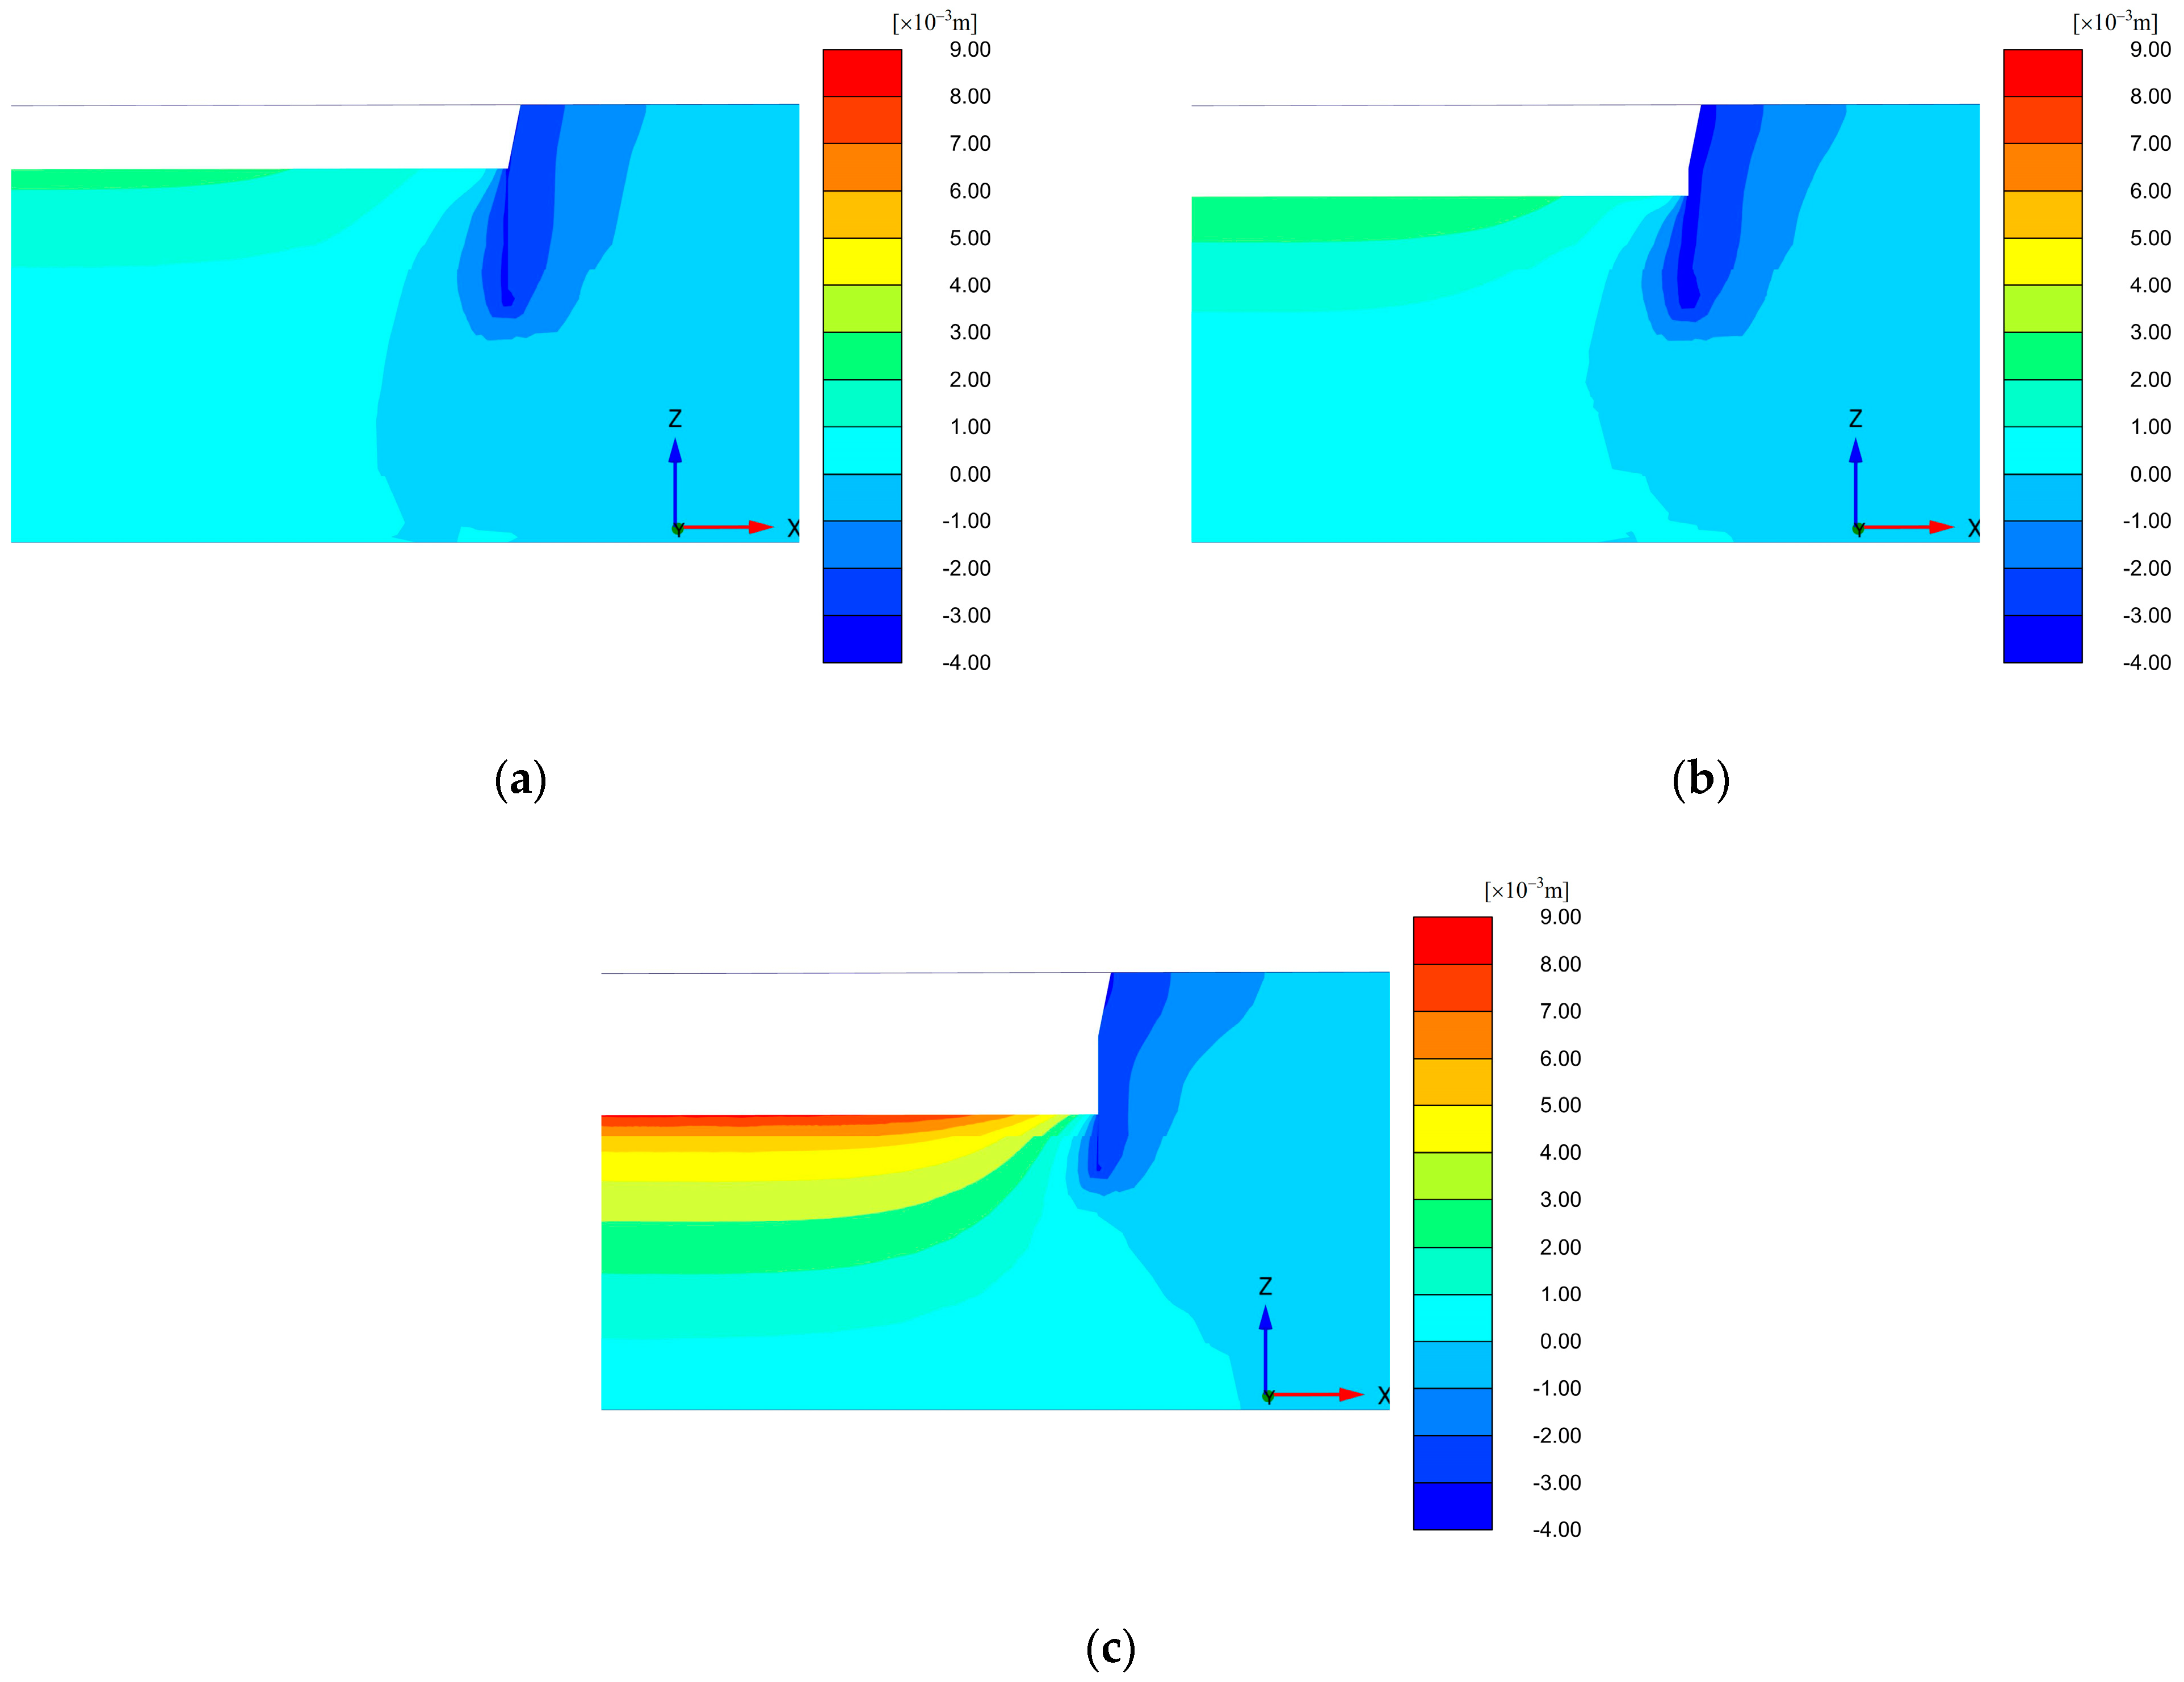
4.3.2. Vertical Displacement
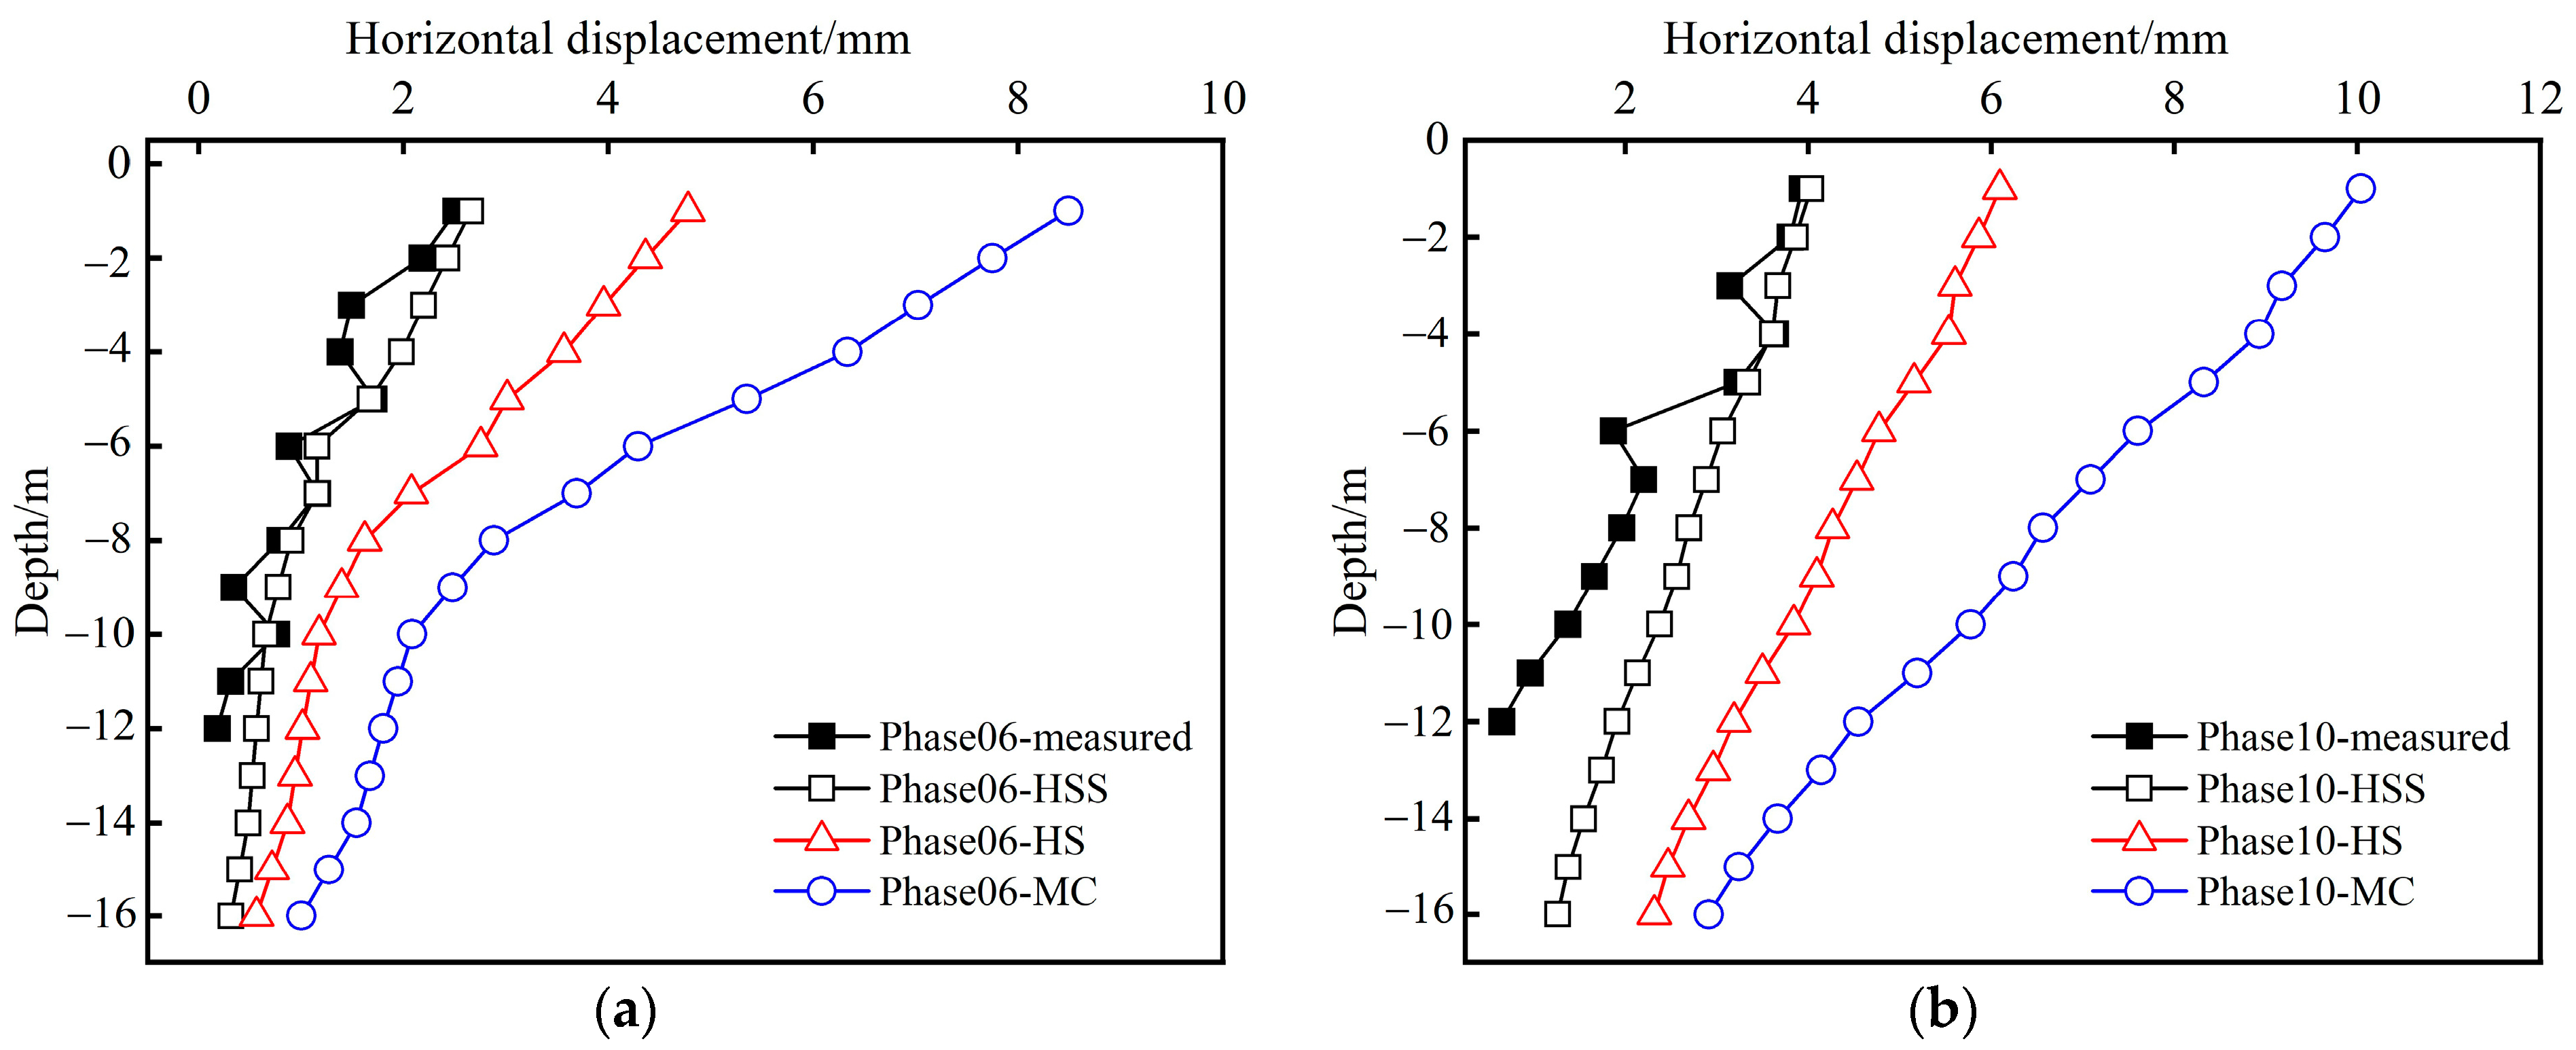
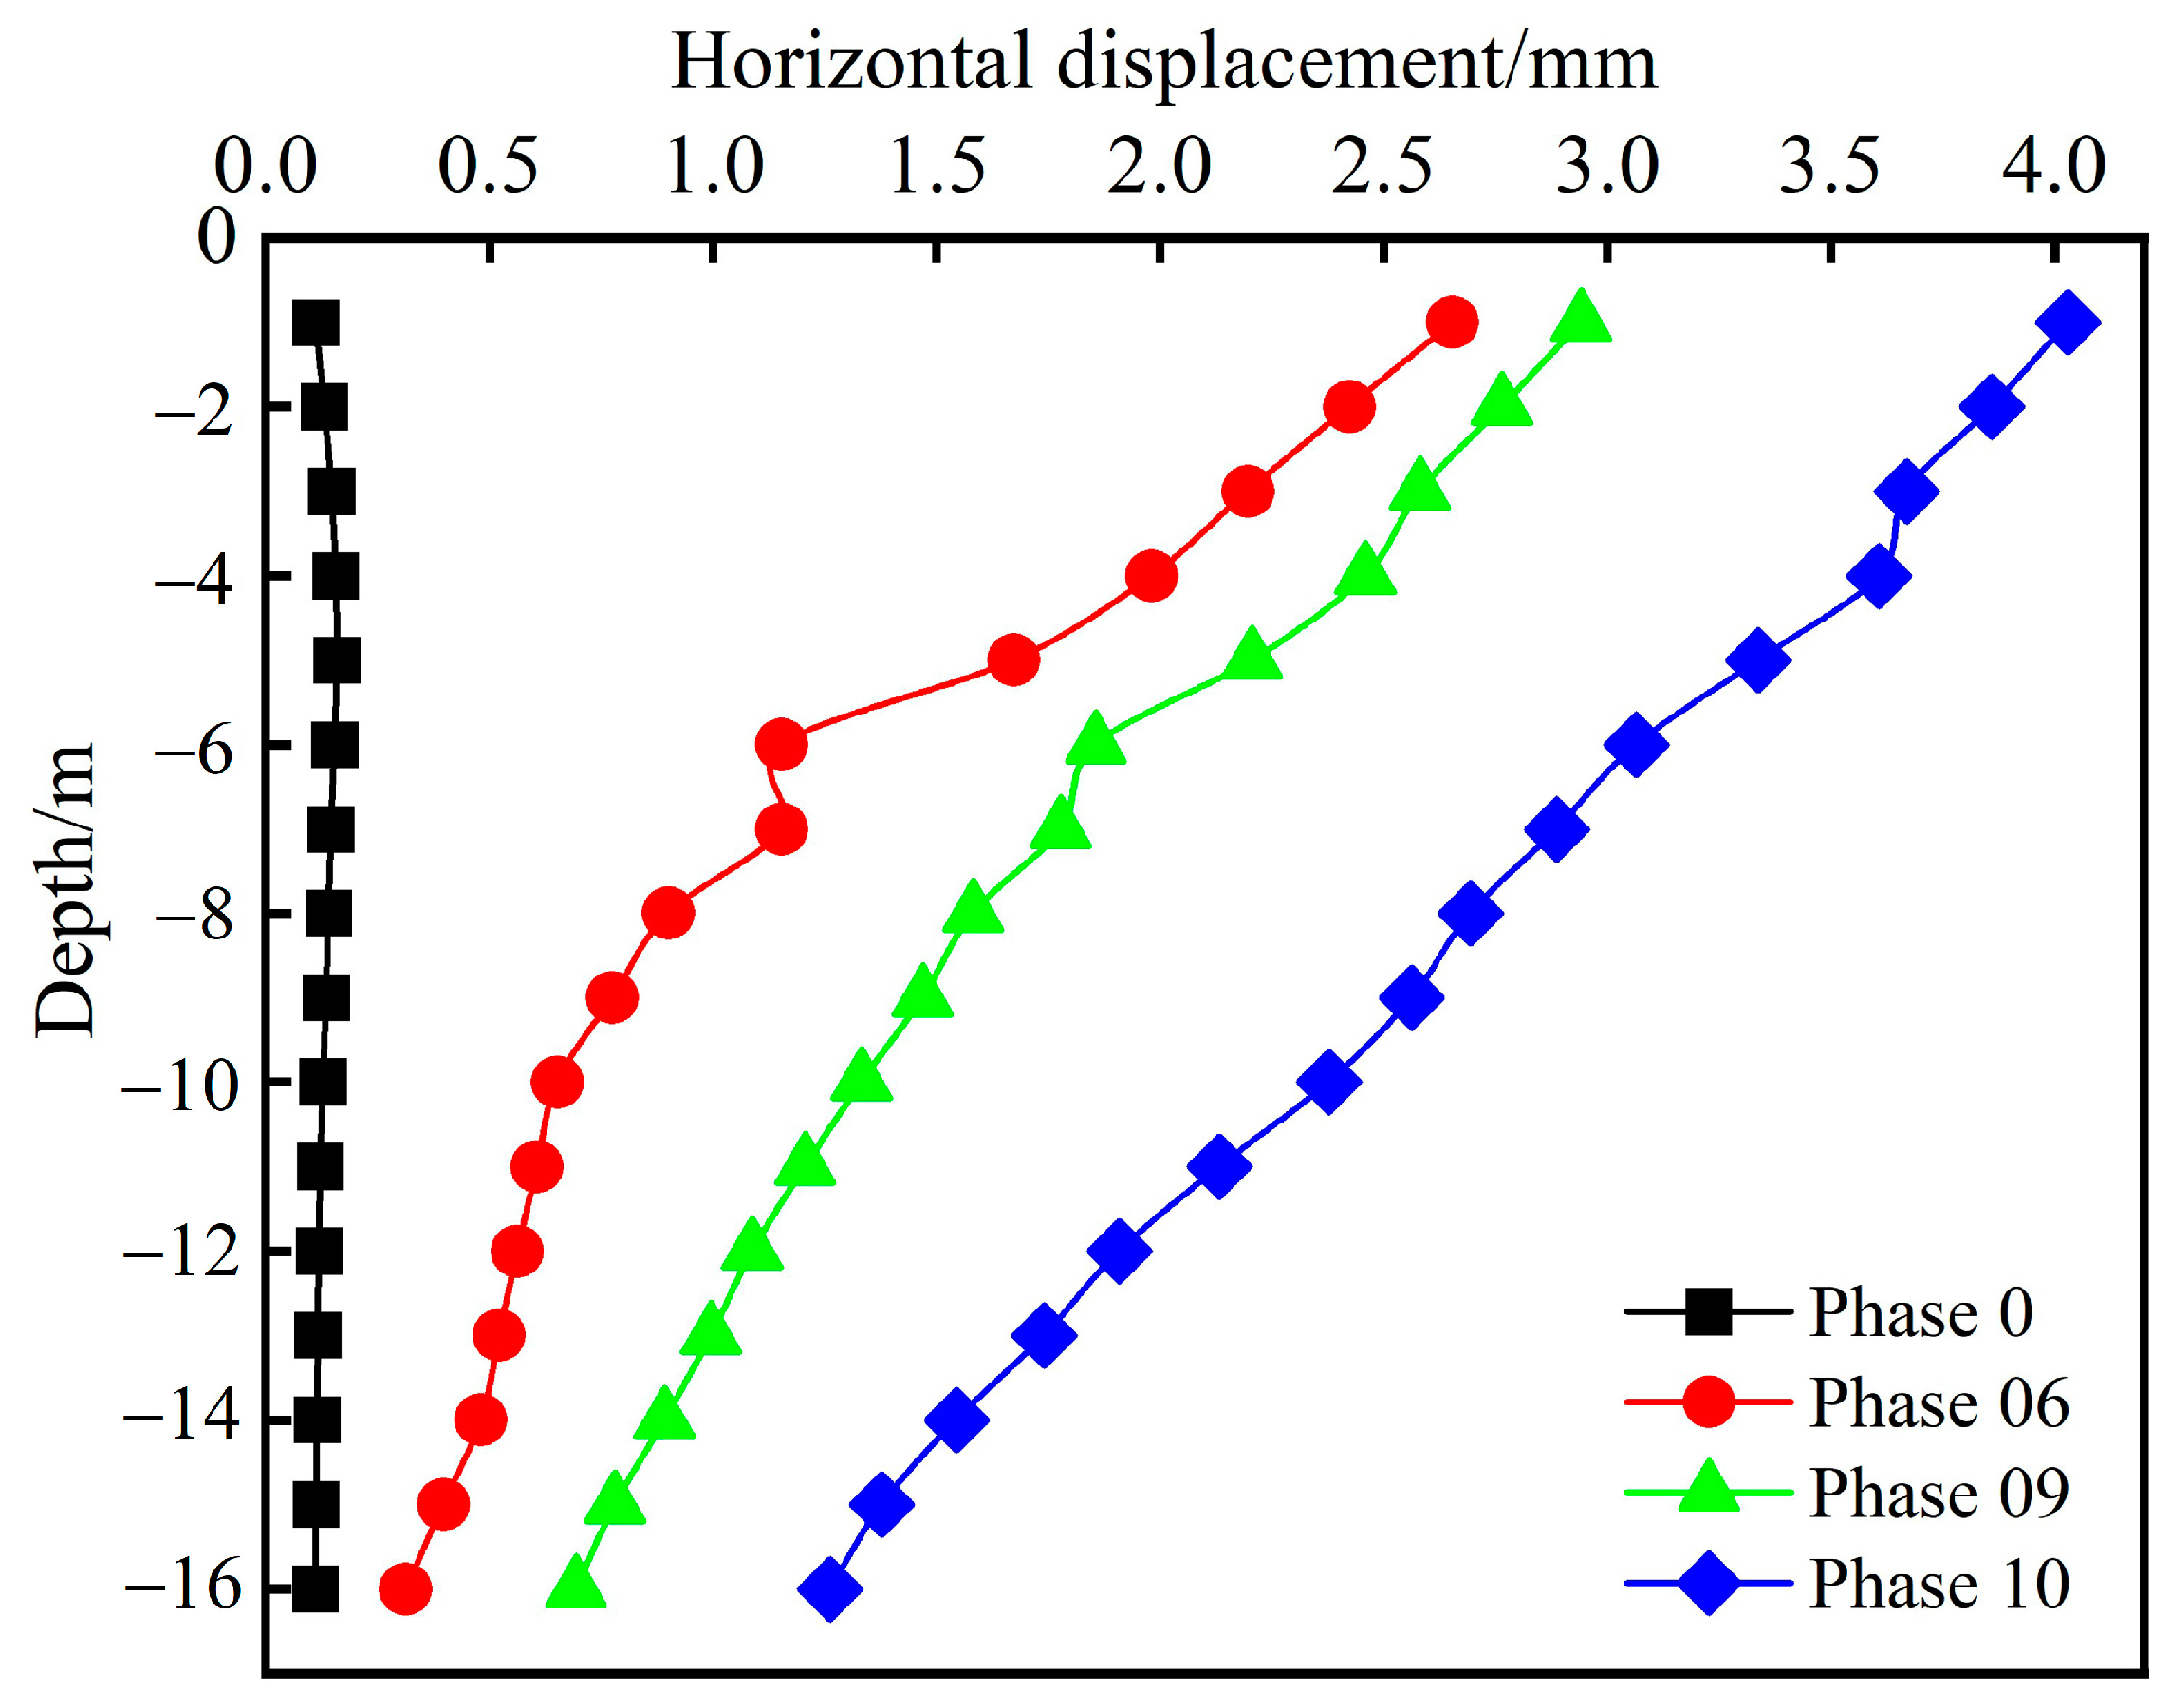
4.3.3. Deep-Level Horizontal Displacement of Supporting Structure
4.3.4. Vertical Displacement of Soil behind the Wall
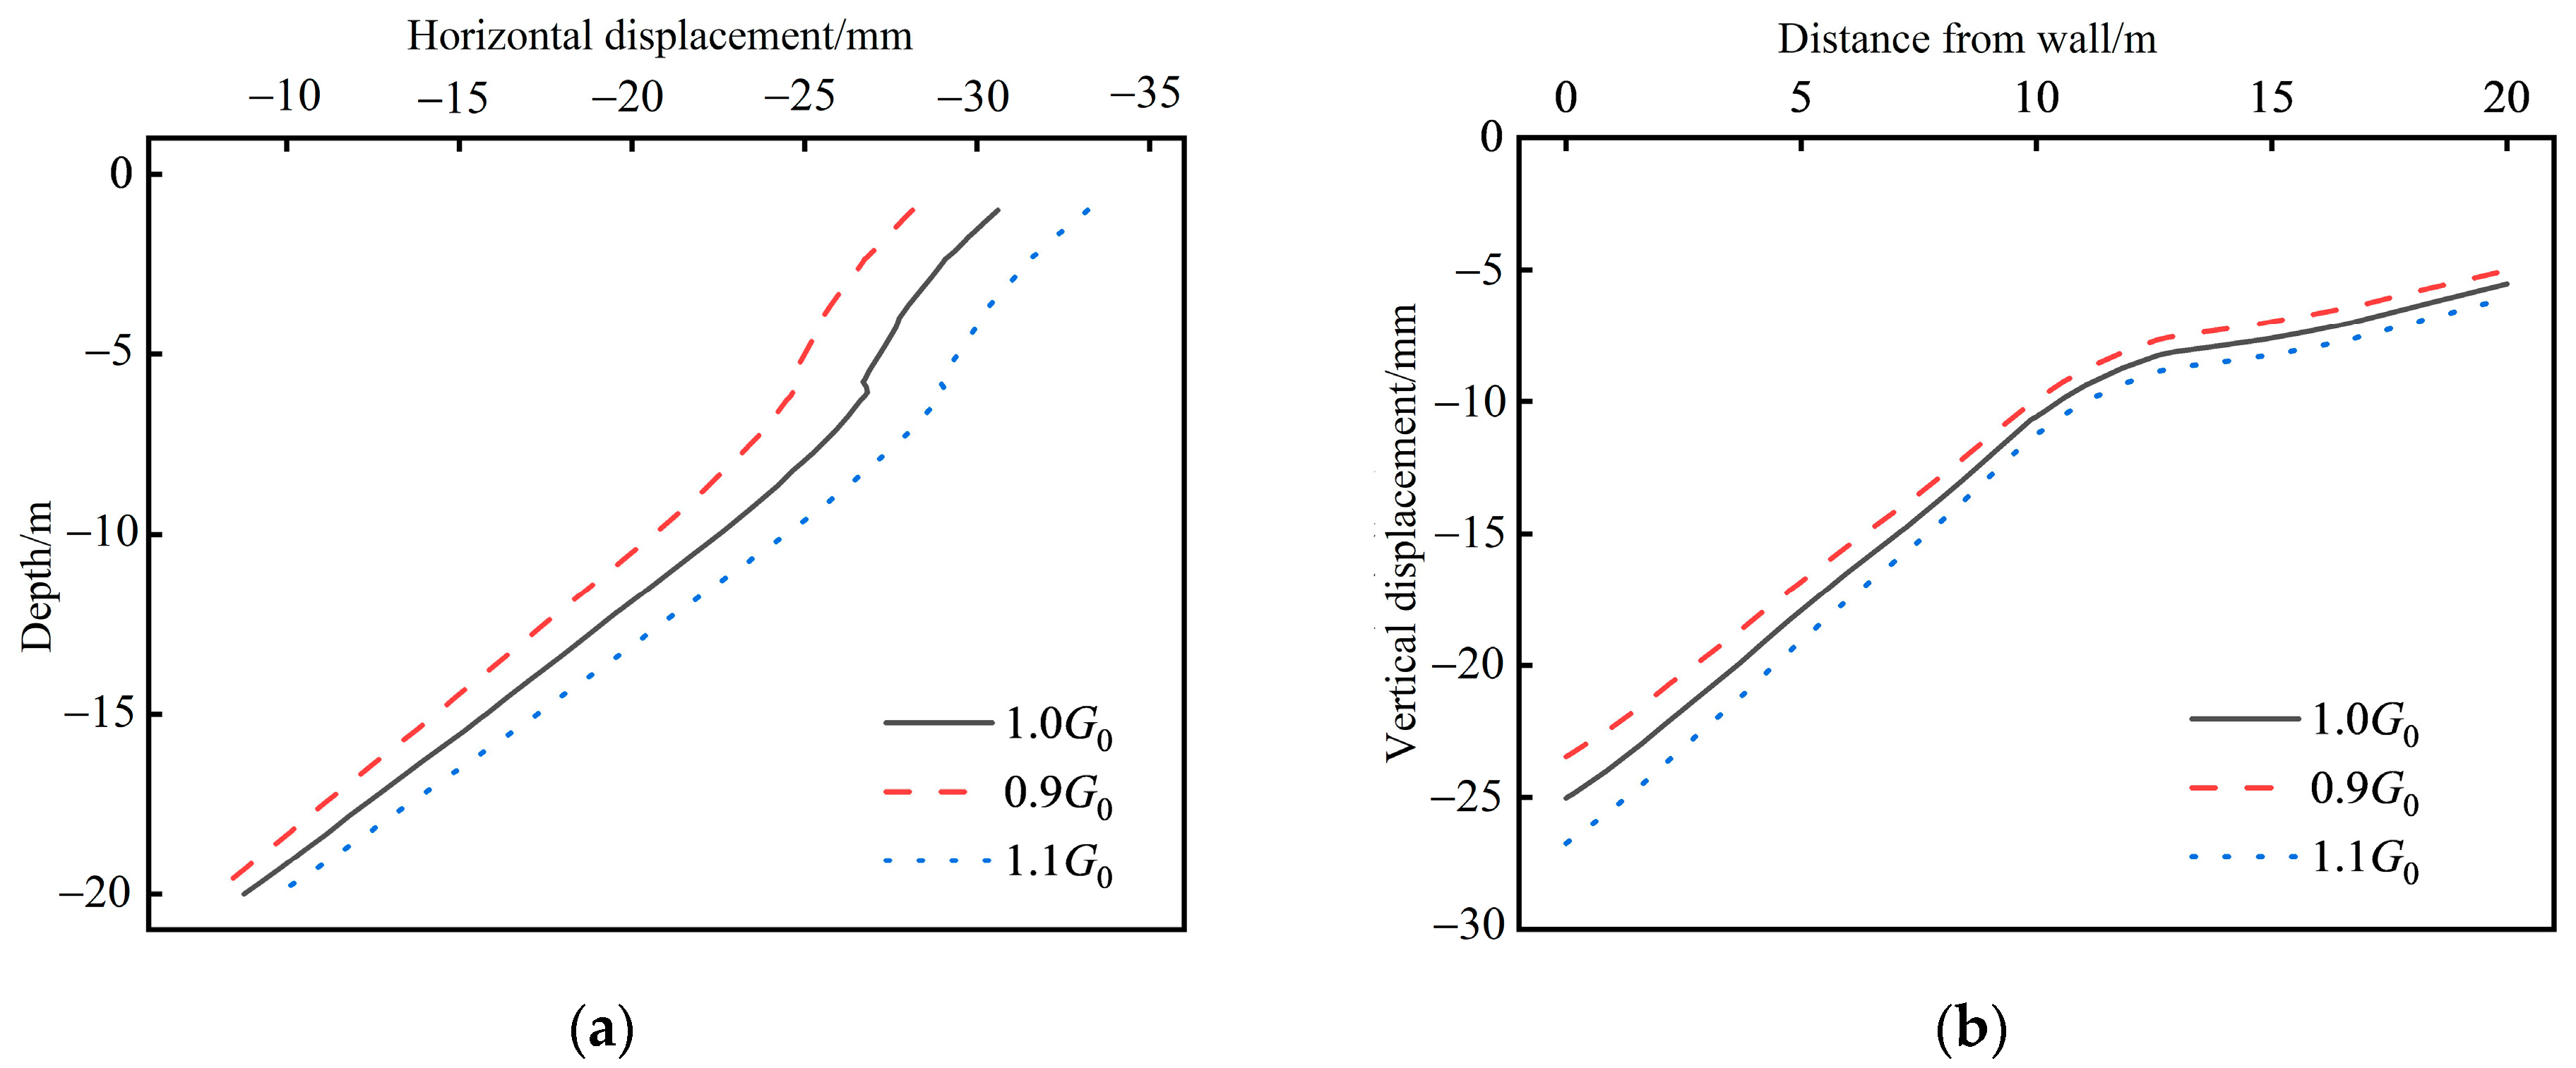
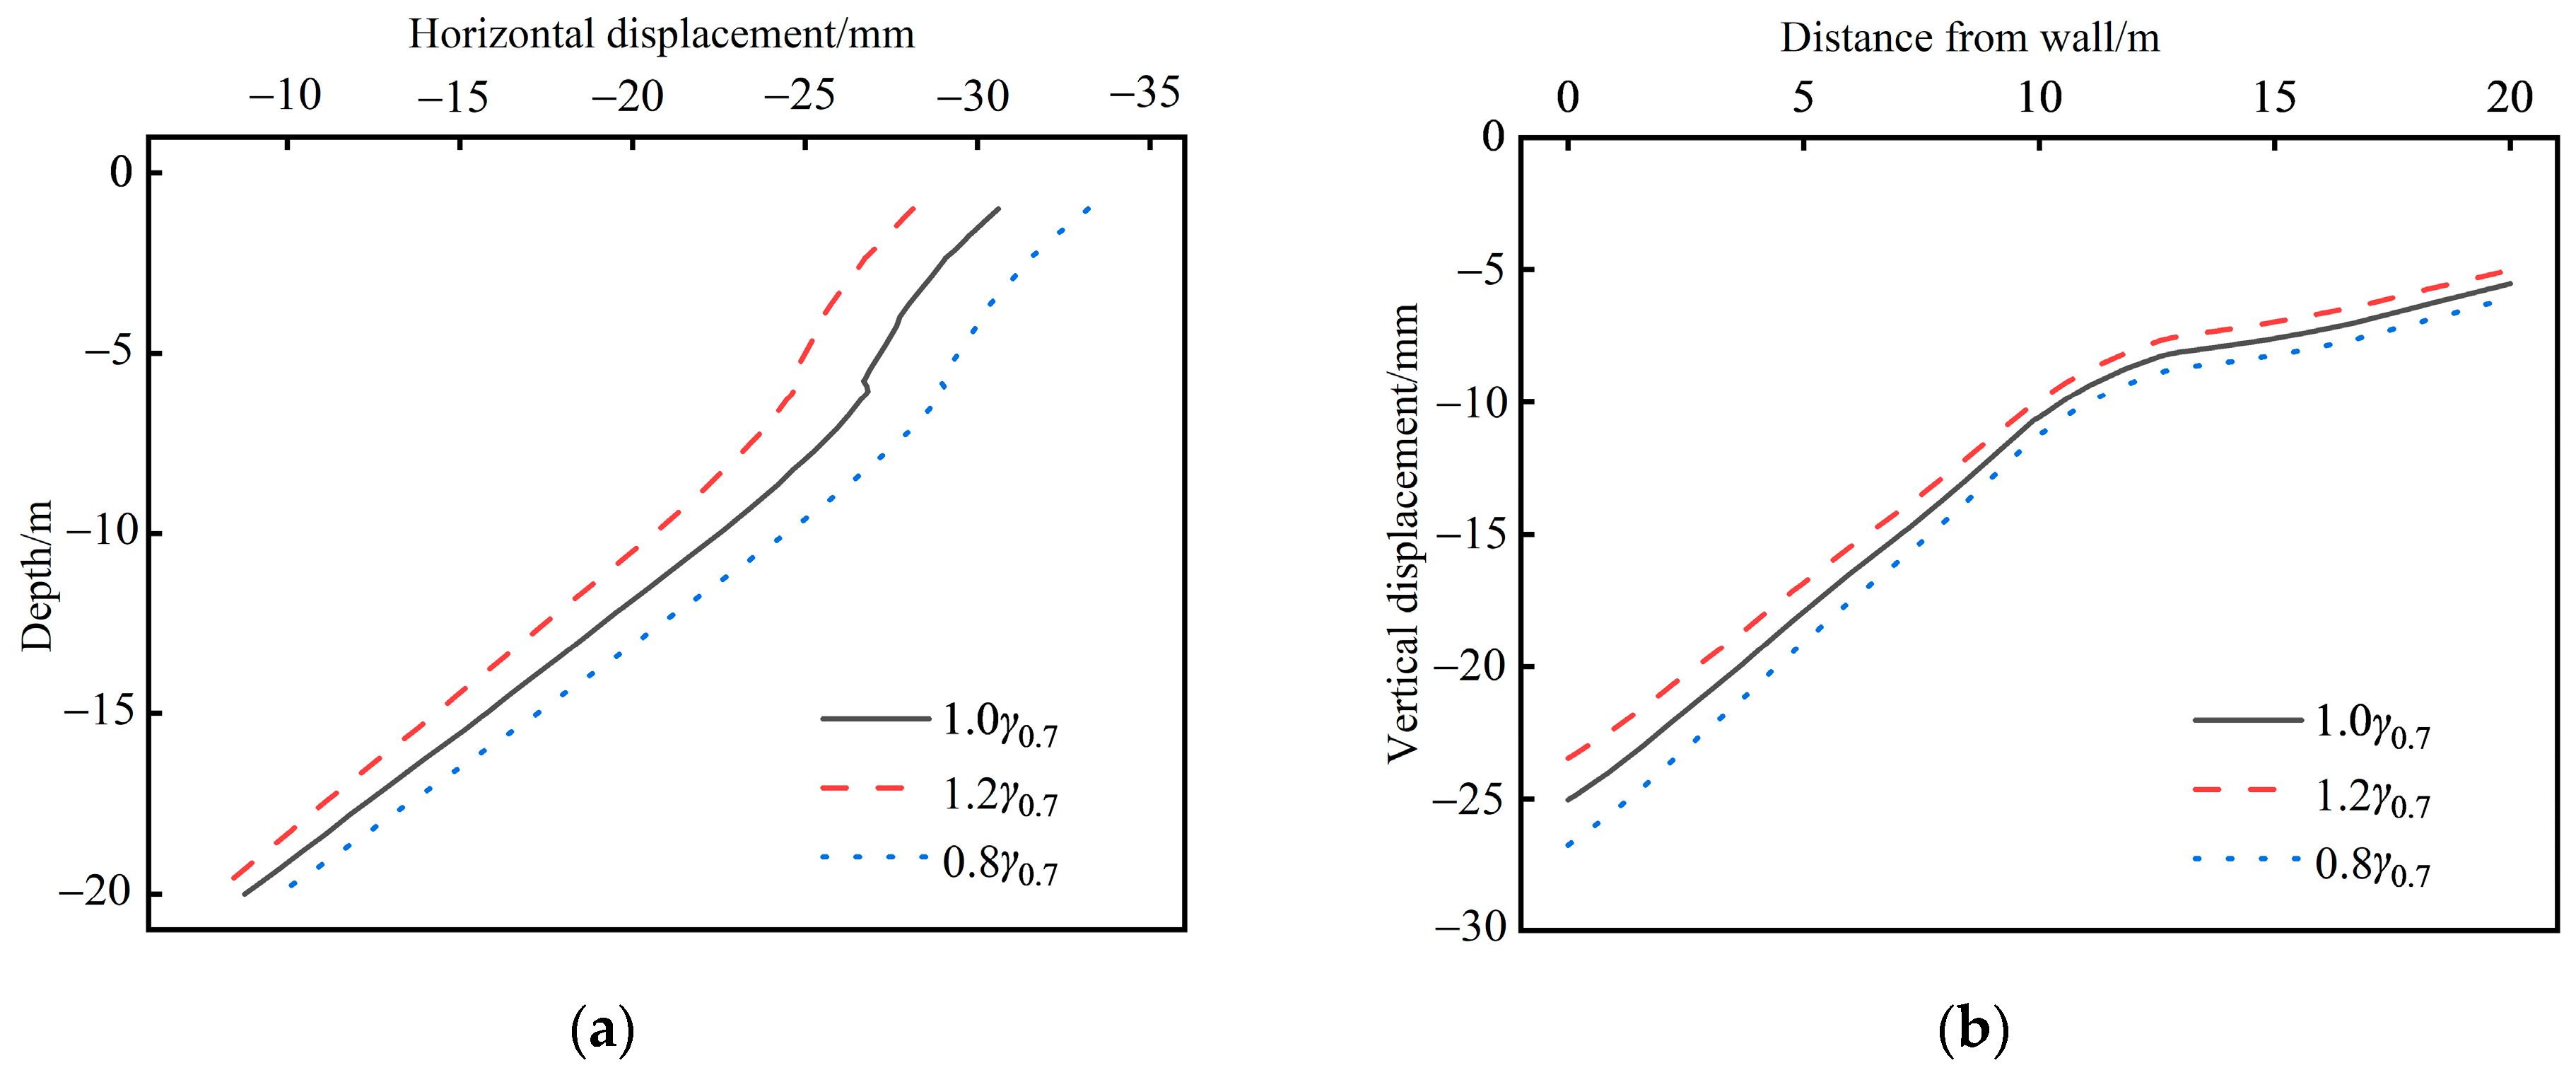
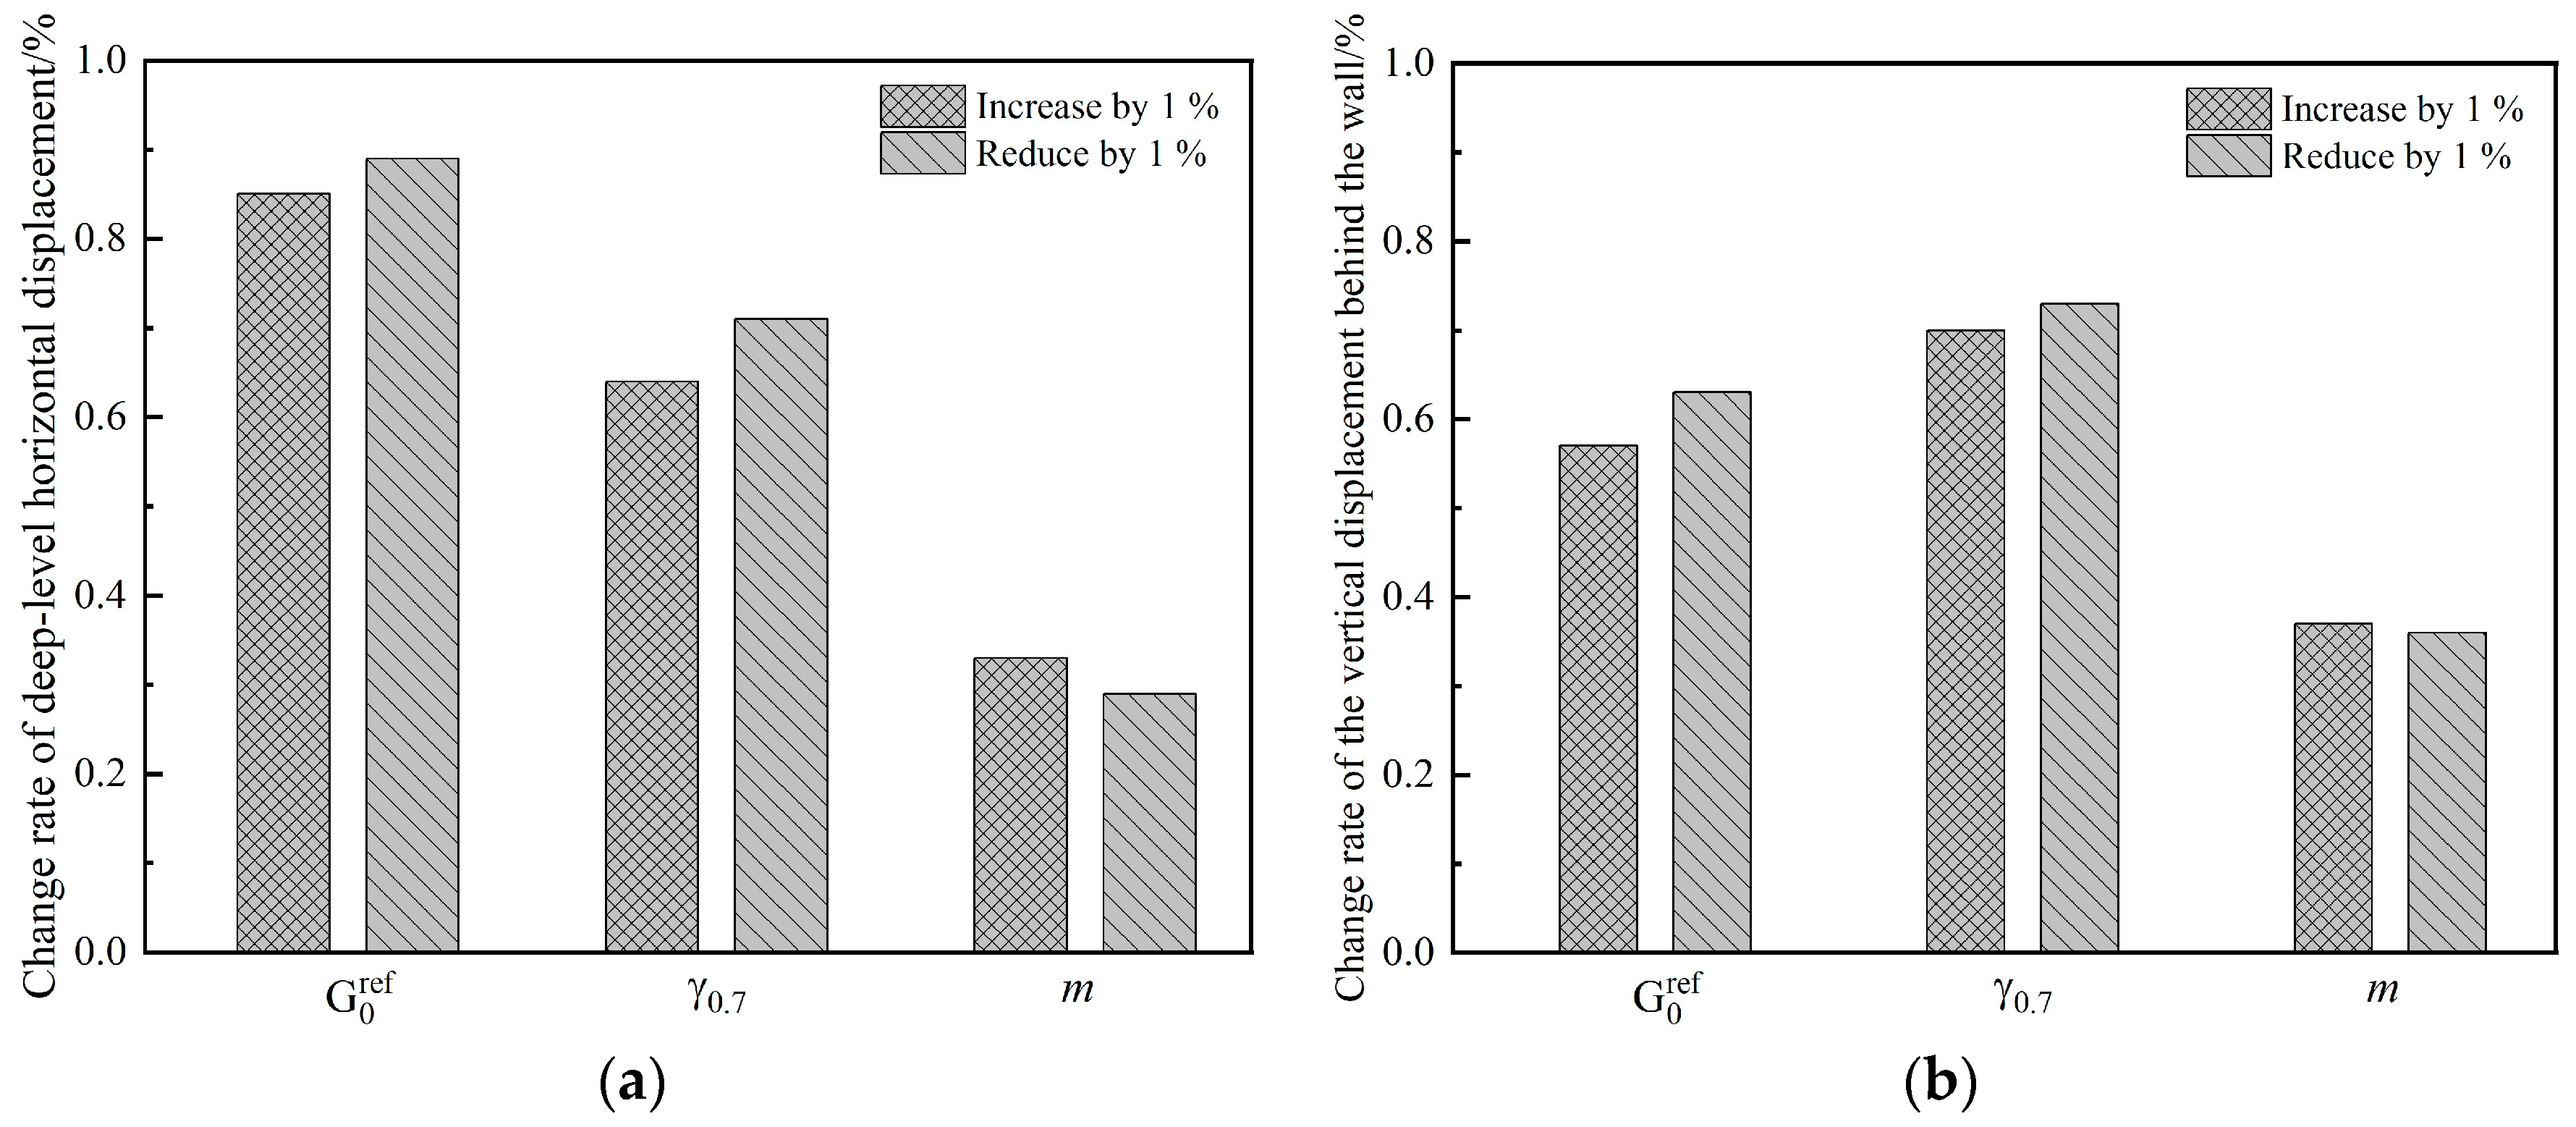
4.4. Sensitivity Analysis of HSS Model Parameters
4.4.1. Sensitivity Analysis Method
4.4.2. Sensitivity Analysis of Different Parameters
4.4.3. Sensitivity Analysis Results
5. Discussion
6. Conclusions
- (1)
- The values of the HSS model parameters of strata typical of the Zhengzhou area were obtained through standard consolidation tests, triaxial consolidation drainage (CD) tests, K0 consolidation tests, triaxial loading–unloading tests, and resonance column tests. The parameter value method was verified in the actual project, and a general HSS model parameter value method suitable for the soil formations typical of this area was obtained.
- (2)
- A proportional relationship between different moduli was established by statistically analyzing the main HSS parameter values across various regions, ensuring parameter value rationality and significantly reducing testing time.
- (3)
- The simulation results were compared with the measured data and the calculation results of the HS model and the MC model. The calculation results of the MC model were quite different from the measured values, and the HS model was between the MC model and the HSS model. The HSS model was more accurate when considering the small strain characteristics of the soil than the HS model or the MC model.
- (4)
- The small strain parameters and significantly influenced the deformation of the foundation pit. was particularly sensitive to the deep-level horizontal displacement of the supporting structure, while was more responsive to the vertical displacement of the soil behind the wall. Furthermore, a decrease in parameter values had a higher sensitivity than an increase.
Author Contributions
Funding
Data Availability Statement
Acknowledgments
Conflicts of Interest
References
- Likitlersuang, S.; Teachavorasinskun, S.; Surarak, C. Small strain stiffness and stiffness degradation curve of Bangkok Clays. Soils Found. 2013, 53, 498–509. [Google Scholar] [CrossRef]
- Alzabeebee, S. Numerical analysis of the interference of two active machine foundations. Geotech. Geol. Eng. 2020, 38, 5043–5059. [Google Scholar] [CrossRef]
- Jardine, R.J.; Potts, D.M.; Fourie, A.B. Studies of the influence of non-linear stress-strain characteristics in soil-structure interaction. J. Géotech. 1986, 36, 377–396. [Google Scholar] [CrossRef]
- Atkinson, J.H.; Sallfors, G. Experimental determination of soil properties. In Proceedings of the 10th ECSMFE, Florence, Italy, 26–30 May 1991; Volume 3, pp. 915–956. [Google Scholar]
- Roscoe, K.H.; Burland, J.B. On the Generalized Stress-strain Behavior of “Wet” Clays; Cambridge University Press: Cambridge, UK, 1968; pp. 535–609. [Google Scholar]
- Schanz, T.; Vermeer, P.A.; Bonnier, P.G. The Hardening Soil Model: Formulation and Verification. Beyond 2000 Comput. Geotech. Balkema 1999, 1, 281–297. [Google Scholar]
- Fu, Y.; He, S.; Zhang, S. Parameter analysis on hardening soil model of soft soil for foundation pits based on shear rates in Shenzhen Bay, China. Adv. Mater. Sci. Eng. 2020, 2020, 1–11. [Google Scholar] [CrossRef]
- Pramthawee, P.; Jongpradist, P.; Kongkitkul, W. Evaluation of hardening soil model on numerical simulation of behaviors of high rockfill dams. Songklanakarin J. Sci. Technol. 2011, 33, 325–334. [Google Scholar]
- Benz, T. Small-Strain Stiffness of Soils and Its Numerical Consequences; Institut für Geotechnik Universität Stuttgart: Stuttgart, Germany, 2007. [Google Scholar]
- Benz, T.; Vermeer, P.A.; Schwab, R. A small-strain overlay model. Int. J. Numer. Anal. Methods Geomech. 2009, 33, 25–44. [Google Scholar] [CrossRef]
- Benz, T.; Schwab, R.; Vermeer, P. Small-strain stiffness in geotechnical analyses. Bautechnik 2009, 86, 16–27. [Google Scholar] [CrossRef]
- Kung, G.T.; Ou, C.Y.; Juang, C.H. Modelling small-strain behaviour of Taipei clays for finite element analysis of braced excavations. Comput. Geotech. 2009, 36, 304–319. [Google Scholar] [CrossRef]
- Schweiger, H.; Scharinger, F.; Lüftenegger, R. 3D finite element analysis of a deep excavation and comparison with in situ measurements. In Proceedings of the Geotechnical Aspects of Underground Construction in Soft Ground, Shanghai, China, 10–12 April 2008; pp. 193–199. [Google Scholar]
- Huynh, Q.T.; Lai, V.Q.; Boonyatee, T. Verification of soil parameters of hardening soil model with small-strain stiffness for deep excavations in medium dense sand in Ho Chi Minh City. Vietnam. Innov. Infrastruct. Solut. 2022, 7, 15. [Google Scholar] [CrossRef]
- Li, L.; Liu, J.; Li, K.; Huang, H.; Ji, X. Study of parameters selection and applicability of HSS model in typical stratum of Jinan. J. Rock Soil Mech. 2019, 40, 4021–4029. [Google Scholar]
- Gu, X.; Liu, W.; Chen, X. Experimental study on HSS model parameters for marine soft soils in Yangjiang, Guangdong Province. J. Chin. J. Geotech. Eng. 2021, 43, 41–44. [Google Scholar]
- Du, Z.; Zhang, Z.; Wang, L.; Zhang, J.; Li, Y. Effect of Moisture Content on the Permanent Strain of Yellow River Alluvial Silt under Long-Term Cyclic Loading. Sustainability 2023, 15, 13155. [Google Scholar] [CrossRef]
- Liu, J.; Xiao, J. Experimental study on the stability of railroad silt subgrade with increasing train speed. Geotech. Geoenviron. Eng. 2010, 136, 833–841. [Google Scholar] [CrossRef]
- Li, M.; Li, Y.; Islam, M.R. Effects of water content and interface roughness on the shear strength of silt–cement mortar interface. Soils Found. 2021, 61, 1615–1629. [Google Scholar] [CrossRef]
- Wang, Y.; Kong, L.; Wang, Y. Analysis of influence of shield tunneling on overlying underground pipelines based on HSS model. IOP Conf. Ser. Mater. Sci. Eng. 2018, 423, 012017. [Google Scholar] [CrossRef]
- ASTM D854-14; Standard Test Methods for Specific Gravity of Soil Solids by Water Pycnometer. ASTM International: West Conshohocken, PA, USA, 2014.
- ASTM D4318-10; Standard Test Methods for Liquid Limit, Plastic Limit, and Plasticity Index of Soils. ASTM International: West Conshohocken, PA, USA, 2010.
- ASTM D422-63; Standard Test Method for Particle-Size Analysis of Soils. ASTM International: West Conshohocken, PA, USA, 2007.
- ASTM D698-12; Standard Test Methods for Laboratory Compaction Characteristics of Soil Using Standard Effort. ASTM International: West Conshohocken, PA, USA, 2021.
- Liang, F.; Jia, Y.; Ding, Y. Experimental study on parameters of HSS model for soft soils in Shanghai. Chin. J. Geotech. Eng. 2017, 39, 269–278. [Google Scholar]
- Clayton, C.R.I. Stiffness at small strain: Research and practice. Géotechnique 2011, 61, 5–37. [Google Scholar] [CrossRef]
- Cha, M.; Santamarina, J.C.; Kim, H.S. Small-strain stiffness, shear-wave velocity, and soil compressibility. J. Geotech. Geoenviron. Eng. 2014, 140, 06014011. [Google Scholar] [CrossRef]
- Brinkgreve, R.B.J.; Kappert, M.H.; Bonnier, P.G. Hysteretic damping in a small-strain stiffness model. In Proceedings of the Numerical Methods in Geotechnical Engineering, NUMOG X, Rhodes, Greece, 25–27 April 2007; pp. 737–742. [Google Scholar]
- Liu, D.; Li, X.; Xie, D. Numerical Simulation Analysis of Deep Foundation Pit Engineering Based on HS-Small Constitutive Modell. J. Phys. Conf. Ser. 2022, 2148, 012026. [Google Scholar]
- Obrzud, R.F. On the use of the Hardening Soil Small Strain model in geotechnical practice. Num. Geotech. Struct. 2010, 16, 1–17. [Google Scholar]
- Gu, X.; Wu, R.; Liang, F.; Gao, G. On HSS model parameters for Shanghai soils with engineering verification. Rock Soil Mech. 2021, 42, 833–845. [Google Scholar]
- Chen, Y.; Luo, M.; Xia, W.; He, P. Statistical analysis of existing test results of HSS model parameters for soft soils. Chin. J. Geotech. Eng. 2021, 43, 197–201. [Google Scholar]
- Wang, W.; Wang, H.; Xu, Z. Study of parameters of HS-Small model used in numerical analysis of excavations in Shanghai area. J. Rock Soil Mech. 2013, 34, 1766–1774. [Google Scholar]
- Xie, D.; Guan, F.; Ding, W. Determination and sensitivity analysis of the parameters of hardening soil model with small strain stiffness. J. China Earthq. Eng. J. 2017, 39, 898–906. [Google Scholar]
- Shi, Y.; Ruan, J.; Wu, C. Small strain of HS-small model of typical strata in Xiamen area parameter sensitivity analysis. Sci. Technol. Eng. 2017, 17, 100–105. [Google Scholar]


| Model Parameter | Determination Method |
|---|---|
| Reference tangent modulus value | Standard consolidation test |
| Effective cohesion , effective internal friction angle , failure ratio and reference secant modulus value | Triaxial consolidated drained (CD) test |
| Initial static lateral pressure coefficient | K0 consolidation test |
| Loading–unloading modulus value | Triaxial loading–unloading test |
| Initial dynamic shear modulus value and shear strain corresponding to the initial dynamic shear modulus at 70% strain | Resonant column test |
| Dilation angle | For sand, when > 30°, take ( − 30) and when < 30°, take 0°; for clay and silt, generally take 0° |
| Power exponent of stiffness–stress level correlation m | For silt and sand, m = 0.5; for clay, m = 0.5–1.0 |
| Loading–unloading Poisson’s ratio | 0.2 |
| Reference stress | 100 kPa |
| Stratum | Water Content w/% | Density ρ/g·cm−3 | Plasticity Index IP |
|---|---|---|---|
| Silty clay ① | 10.35 | 1.80 | 12.04 |
| Silt ② | 11.27 | 2.02 | 6.64 |
| Silty clay ③ | 14.49 | 1.85 | 14.10 |
| Sand ④ | 15.20 | 2.00 | ND |
| Parameter | Silty Clay ① | Silt ② | Silty Clay ③ | Sand ④ |
|---|---|---|---|---|
| /MPa | 8.00 | 3.53 | 6.75 | 10.66 |
| /MPa | 7.02 | 4.12 | 5.58 | 14.60 |
| /MPa | 31.60 | 25.30 | 34.76 | 46.08 |
| m | 0.60 | 0.60 | 0.60 | 0.60 |
| /kPa | 10.80 | 5.20 | 9.66 | 0.45 |
| /° | 29.80 | 19.95 | 28.50 | 37.70 |
| /° | 0.00 | 0.00 | 0.00 | 0.00 |
| 0.67 | 0.82 | 0.60 | 0.68 | |
| 0.51 | 0.53 | 0.51 | 0.58 | |
| 0.20 | 0.20 | 0.20 | 0.20 | |
| /kPa | 100 | 100 | 100 | 100 |
| /MPa | 47.23 | 38.99 | 48.23 | 55.72 |
| Stratum | /MPa | ||||
|---|---|---|---|---|---|
| Silty clay ① | 8.35 | 0.84 | 1.14 | 4.13 | 1.52 |
| Silt ② | 4.47 | 0.92 | 0.86 | 7.73 | 1.54 |
| Silty clay ③ | 5.61 | 0.99 | 1.21 | 5.00 | 1.39 |
| Sand ④ | 21.16 | 0.69 | 0.73 | 4.32 | 1.21 |
| Supporting Structure | Simulation Unit Type | Elastic Modulus E/Pa | Thickness, Diameter, or Size/m |
|---|---|---|---|
| Soil nail wall | Plate element | 0.08 | |
| Sheet pile | Plate element | 0.7 | |
| Soil nail | Embedded pile element | 0.12 | |
| Fully bonded anchor rod | Embedded pile element | 0.18 | |
| Crown beam | Beam element | 0.7 × 0.5 | |
| Waist beam | Beam element | 0.18 × 0.02 |
| Construction Step | Working Condition |
|---|---|
| Phase 0 | Calculation of initial stress field |
| Phase 1 | The first layer of earthwork excavation, the first layer of soil nail construction |
| Phase 2 | The second layer of earthwork excavation, the second layer of soil nail construction |
| Phase 3 | The third layer of earthwork excavation, the third layer of soil nail construction |
| Phase 4 | The fourth layer of earthwork excavation, the fourth layer of soil nail construction |
| Phase 5 | The fifth layer of earthwork excavation, shotcrete surface construction |
| Phase 6 | The sixth layer of earthwork excavation, sheet pile and crown beam construction, the first layer of fully bonded anchor rod construction |
| Phase 7 | The seventh layer of earthwork excavation, the second layer of fully bonded anchor rod construction, foundation pit dewatering |
| Phase 8 | The eighth layer of earthwork excavation, the third layer of fully bonded anchor rod construction, foundation pit dewatering |
| Phase 9 | The ninth layer of earthwork excavation, the fourth layer of fully bonded anchor rod construction, foundation pit dewatering |
| Phase 10 | The final earthwork excavation, foundation pit dewatering |
Disclaimer/Publisher’s Note: The statements, opinions and data contained in all publications are solely those of the individual author(s) and contributor(s) and not of MDPI and/or the editor(s). MDPI and/or the editor(s) disclaim responsibility for any injury to people or property resulting from any ideas, methods, instructions or products referred to in the content. |
© 2023 by the authors. Licensee MDPI, Basel, Switzerland. This article is an open access article distributed under the terms and conditions of the Creative Commons Attribution (CC BY) license (https://creativecommons.org/licenses/by/4.0/).
Share and Cite
Cao, M.; Zhang, Z.; Du, Z.; Wang, L.; Lv, Y.; Zhang, J.; Wang, Y. Experimental Study of Hardening Small Strain Model Parameters for Strata Typical of Zhengzhou and Their Application in Foundation Pit Engineering. Buildings 2023, 13, 2784. https://doi.org/10.3390/buildings13112784
Cao M, Zhang Z, Du Z, Wang L, Lv Y, Zhang J, Wang Y. Experimental Study of Hardening Small Strain Model Parameters for Strata Typical of Zhengzhou and Their Application in Foundation Pit Engineering. Buildings. 2023; 13(11):2784. https://doi.org/10.3390/buildings13112784
Chicago/Turabian StyleCao, Mingming, Zheng Zhang, Zibo Du, Lei Wang, Yang Lv, Jingwei Zhang, and Yinwei Wang. 2023. "Experimental Study of Hardening Small Strain Model Parameters for Strata Typical of Zhengzhou and Their Application in Foundation Pit Engineering" Buildings 13, no. 11: 2784. https://doi.org/10.3390/buildings13112784