Abstract
Each year, an enormous amount of construction waste is produced worldwide. The reuse of construction waste in construction works is a sustainable solution. The present research work utilized recycled brick aggregates in the production of concrete. The resulting concrete exhibited substandard splitting tensile, flexural, and compressive properties. Steel fibers were used to improve these substandard properties of recycled brick aggregate concrete. The volume fractions of 1%, 2%, and 3% for steel fibers were mixed in concrete, whereas recycled brick aggregates were obtained from solid fired-clay bricks, hollow fired-clay bricks, and cement–clay interlocking bricks. The compressive strength was enhanced by up to 35.53% and 66.67% for natural and recycled brick aggregate concrete, respectively. Strengthened flexural specimens demonstrated up to 8765.69% increase in the energy dissipation. Specimens strengthened with steel fibers showed substantially improved splitting tensile, flexural, and compressive responses. Separate equations were proposed to predict the peak compressive strength, strain at peak compressive strength, elastic modulus, and post-peak modulus of recycled brick aggregate concrete. The proposed regression equations were utilized in combination with an existing compressive stress–strain model. A close agreement was observed between experimental and predicted compressive stress–strain curves of recycled brick aggregate concrete.
1. Introduction
Numerous studies report the extensive production of structural waste each year [1,2]. Currently, China produces approximately 400 million tons of brick waste annually [1], whereas Japan, the USA, and Europe produce approximately 77 million, 317 million, and 510 million tons of structural waste each year, respectively [3,4]. The total construction waste that is produced annually in China is roughly estimated at 1.8 billion tons [5]. These numbers are alarming in the sense that the waste material must be treated and disposed properly to eliminate its carbon footprint. These numbers are expected to rise with time as studies have predicted the concrete demand to be as high as 18 billion tons by the year 2050 [6], with per capita usage around 3 tons [7]. Globally, the total building waste being generated is estimated to be 2.5 billion tons, with concrete as the major constituent [8].
Researchers have boosted their efforts to reuse structural waste in the production of new concrete [9,10,11,12], with the main finding being recycled aggregate concrete (RAC) having substandard mechanical properties. Vrijders and Desmyter [13] concluded that recycled aggregates tend to absorb more water than natural aggregates. As a result, the porosity of recycled aggregates was found to be 10% higher than that of natural aggregates. In addition, the replacement of 20% and 50% natural aggregates with recycled aggregates reduced the compressive strength of RAC by 11% and 20% of its actual value, respectively. In the case of 100% replacement of natural aggregates with recycled aggregates, the compressive strength of RAC was found to be 30% lower than that of natural aggregate concrete [14]. It has been found that recycled aggregates tend to affect the compressive strength more than the flexural or tensile strength [15]. Medina et al. [16] also reported 39% reduction in the compressive strength of RAC when 40% of natural aggregates were replaced with recycled aggregates. The particle density of RAC was found to be 5–10% lower than that of concrete with natural aggregates attributed to mortar adhered to the surface of recycled aggregates [17]. Jiang et al. [18] stated that the reduction in the mechanical properties of RAC could be avoided by limiting the replacement ratio of natural aggregates below 30%. Based on Nixon [19], the creep, shrinkage, and peak strain of concrete could be improved by the addition of recycled aggregates. However, a consensus on the substandard mechanical behavior of RAC is widely accepted [20].
The substandard properties of RAC have so far limited its use mainly to non-structural applications [21]. However, the aim is to extend the use of RAC to structural applications by improving its mechanical behavior. Numerous studies have pointed out the potential of fiber-reinforced polymer (FRP) jackets in enhancing the behavior of structural members [22,23,24,25,26,27]. A few studies are available highlighting the performance of FRP jackets in the case of RAC. For instance, glass and carbon FRP jackets were utilized by Gao et al. [28] to improve the ultimate compressive strength and strain of RAC. Tang et al. [29] noticed a significant enhancement in the axial ductility and peak compressive strength of RAC after strengthening with carbon FRP jackets. Han et al. [30] employed naphthalate/terephthalate composites to strengthen RAC and reported improvements in the ultimate compressive strength, strain, and axial ductility. Further, the enhancements in mechanical properties of RAC were found to be more dependent on the confinement stiffness than on the replacement ratio of natural aggregates. Though FRP composites have proved to improve the substandard behavior of RAC, their high cost cannot be overlooked [31,32,33,34,35]. It is, therefore, necessary to study alternate cheaper solutions with equivalent efficiency.
The present research work aims to investigate and enhance the substandard properties of concrete constructed with recycled brick aggregates. For this purpose, a solution in the form of internal steel fibers was selected. Steel fibers have previously been used in strengthening applications of structural members. Harajli [36] utilized steel fibers to improve the bond behavior between lap-spliced bars and surrounding concrete. It was observed that the brittle splitting tensile failure of substandard lap splices could be avoided by the addition of internal steel fibers. Song and Hwang [37] added steel fibers to concrete at the volume fractions of 0.5%, 1.0%, 1.5%, and 2.0%. The maximum compressive strength was witnessed at the volume fraction of 1.5%, whereas the splitting tensile strength of concrete enhanced as the volume fraction of steel fibers increased. In addition, Olivito and Zuccarello [38] reported substantial enhancement in the direct tensile strength of concrete with the addition of steel fibers. Kachouh et al. [39] examined the performance of steel fibers in improving the behavior of concrete fabricated using recycled concrete aggregates. Recycled aggregates were utilized as 70% and 100% replacements of natural aggregates. A RAC replacement ratio of 70% in conjunction with a steel fiber volume fraction of 1% was suggested to produce concrete with a limited loss of up to 5% in the design cylinder compressive strength. Kaplan et al. [40] varied recycled concrete aggregate percentages as 0%, 50%, and 100% in concrete and steel fibers volume fractions as 0%, 1%, and 2%. Test results indicated that concrete with the 50% replacement ratio of recycled aggregates and strengthened with the 1% volume fraction of steel fibers provided the same or even better mechanical properties than those of unstrengthened natural aggregate concrete.
The addition of steel fibers to concrete with volume fractions ranging from 0.5% to 3% can lead to noticeable enhancements in mechanical properties. The performance of steel fibers in the case of recycled brick aggregate concrete (RBAC) is yet to be evaluated. Therefore, this is a novel study that explores the improvements in mechanical properties of RBAC imparted by steel fibers. This study aims to fill this gap by investigating (1) the performance of RBAC with and without steel fibers, (2) the effect of the volume fraction of steel fibers on the enhancements in mechanical properties, and (3) the development of stress–strain models for RBAC strengthened with steel fibers. Accurate and reliable analytical expressions are key to the design of structures, especially in the realm of the performance-based design. Therefore, this research also proposes analytical expressions to trace the complete compressive stress–strain response of RBAC strengthened with steel fibers.
2. Experimental Program
2.1. Test Matrix
The test matrix involved a total of 16 specimen types, with three specimens tested for each type. The specimens were categorized into four groups. Four specimen types were tested in each group comprising one specimen type without strengthening, whereas the remaining specimen types were strengthened with 1%, 2%, or 3% volume fractions of steel fibers, as listed in Table 1. Each specimen type in Table 1 was tested under the compressive, splitting tensile, and flexural loadings. Specimens in group 1 did not incorporate recycled aggregates, while specimens in the remaining groups were prepared by replacing 50% of natural coarse aggregates with recycled brick aggregates. Groups 2, 3, and 4 were differentiated based on the type of bricks used for recycled aggregates. Recycled brick aggregates were obtained from solid fired-clay bricks (Type A), hollow fired-clay bricks (Type B), and cement–clay interlocking bricks (Type C) for groups 2, 3, and 4, respectively. A four-part nomenclature was utilized to identify each specimen type. The first part, i.e., CMP, SP, and FLX, represents specimens under the compressive, splitting tensile, and flexural loadings, respectively. The second part indicates the presence or type of recycled brick aggregates (i.e., NA = natural coarse aggregates, CBA = crushed brick of Type A, CBB = crushed brick of Type B, and CBC = crushed brick of Type C). The third part, i.e., SF, commonly denotes steel fibers, and the fourth part demonstrates the volume fraction of steel fibers, i.e., 0%, 1%, 2%, or 3%. In addition, CON represents the control specimen.

Table 1.
Details and categorization of test specimens.
2.2. Details and Preparation of Test Specimens
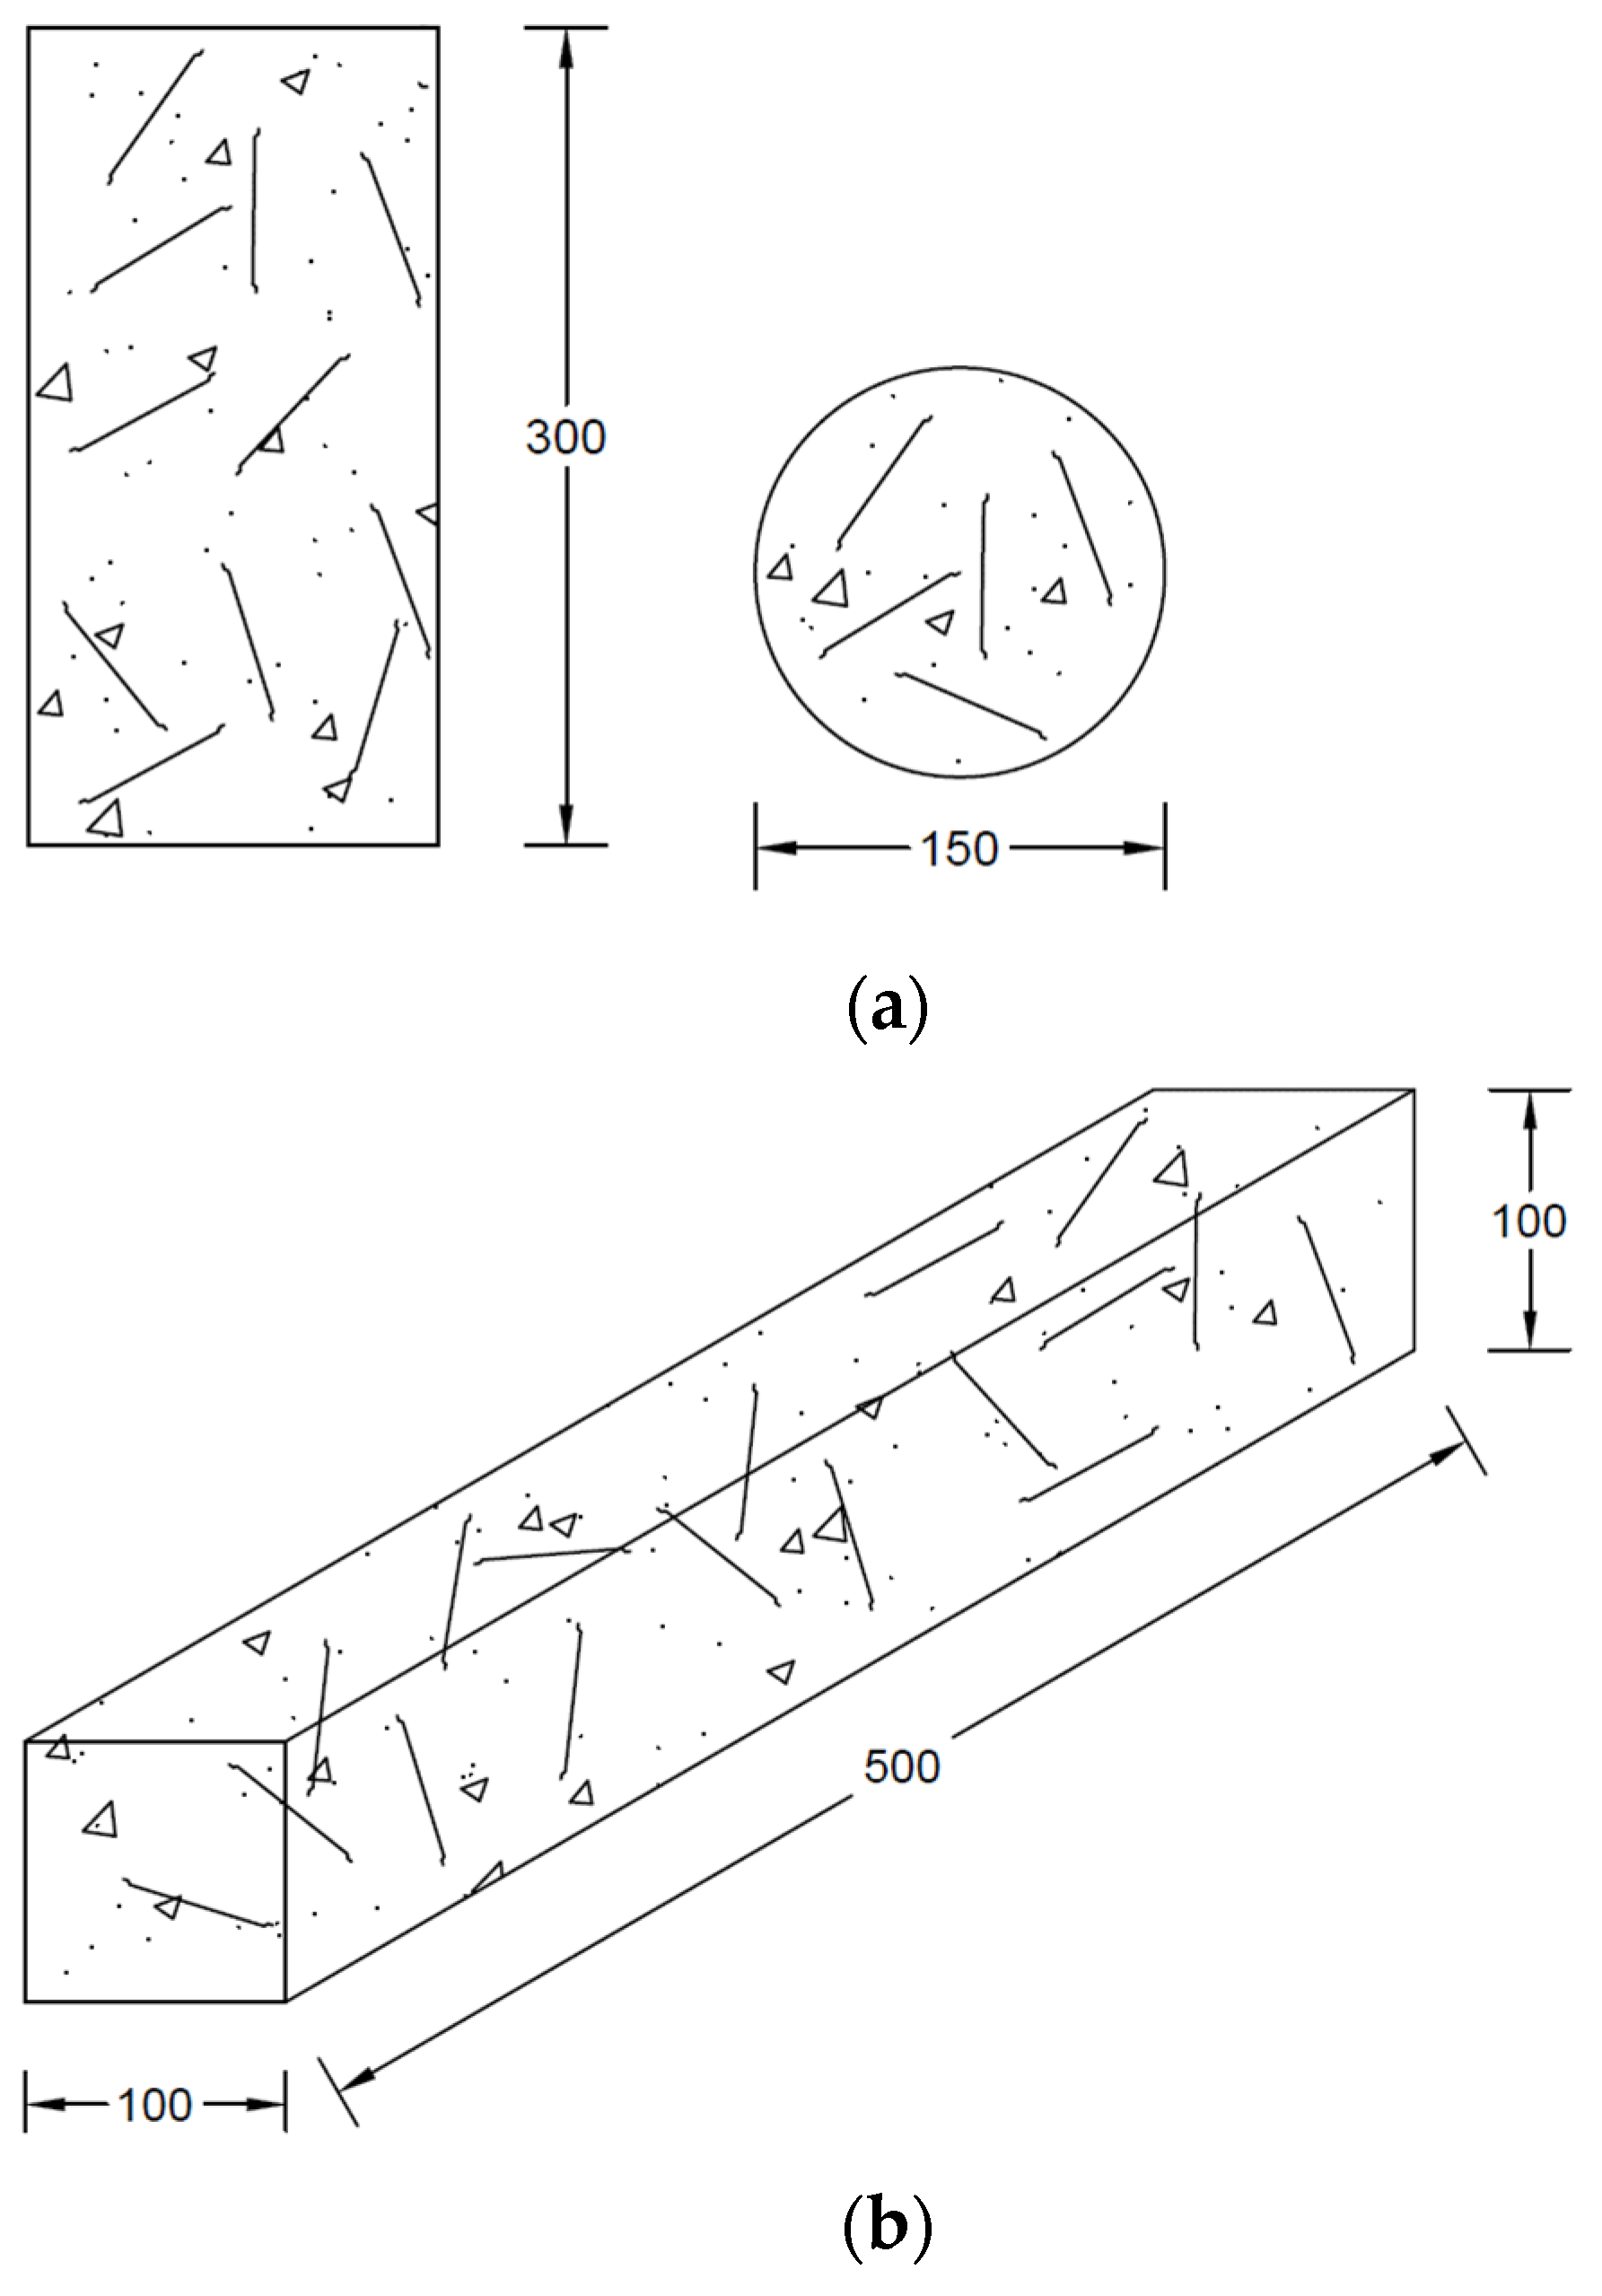
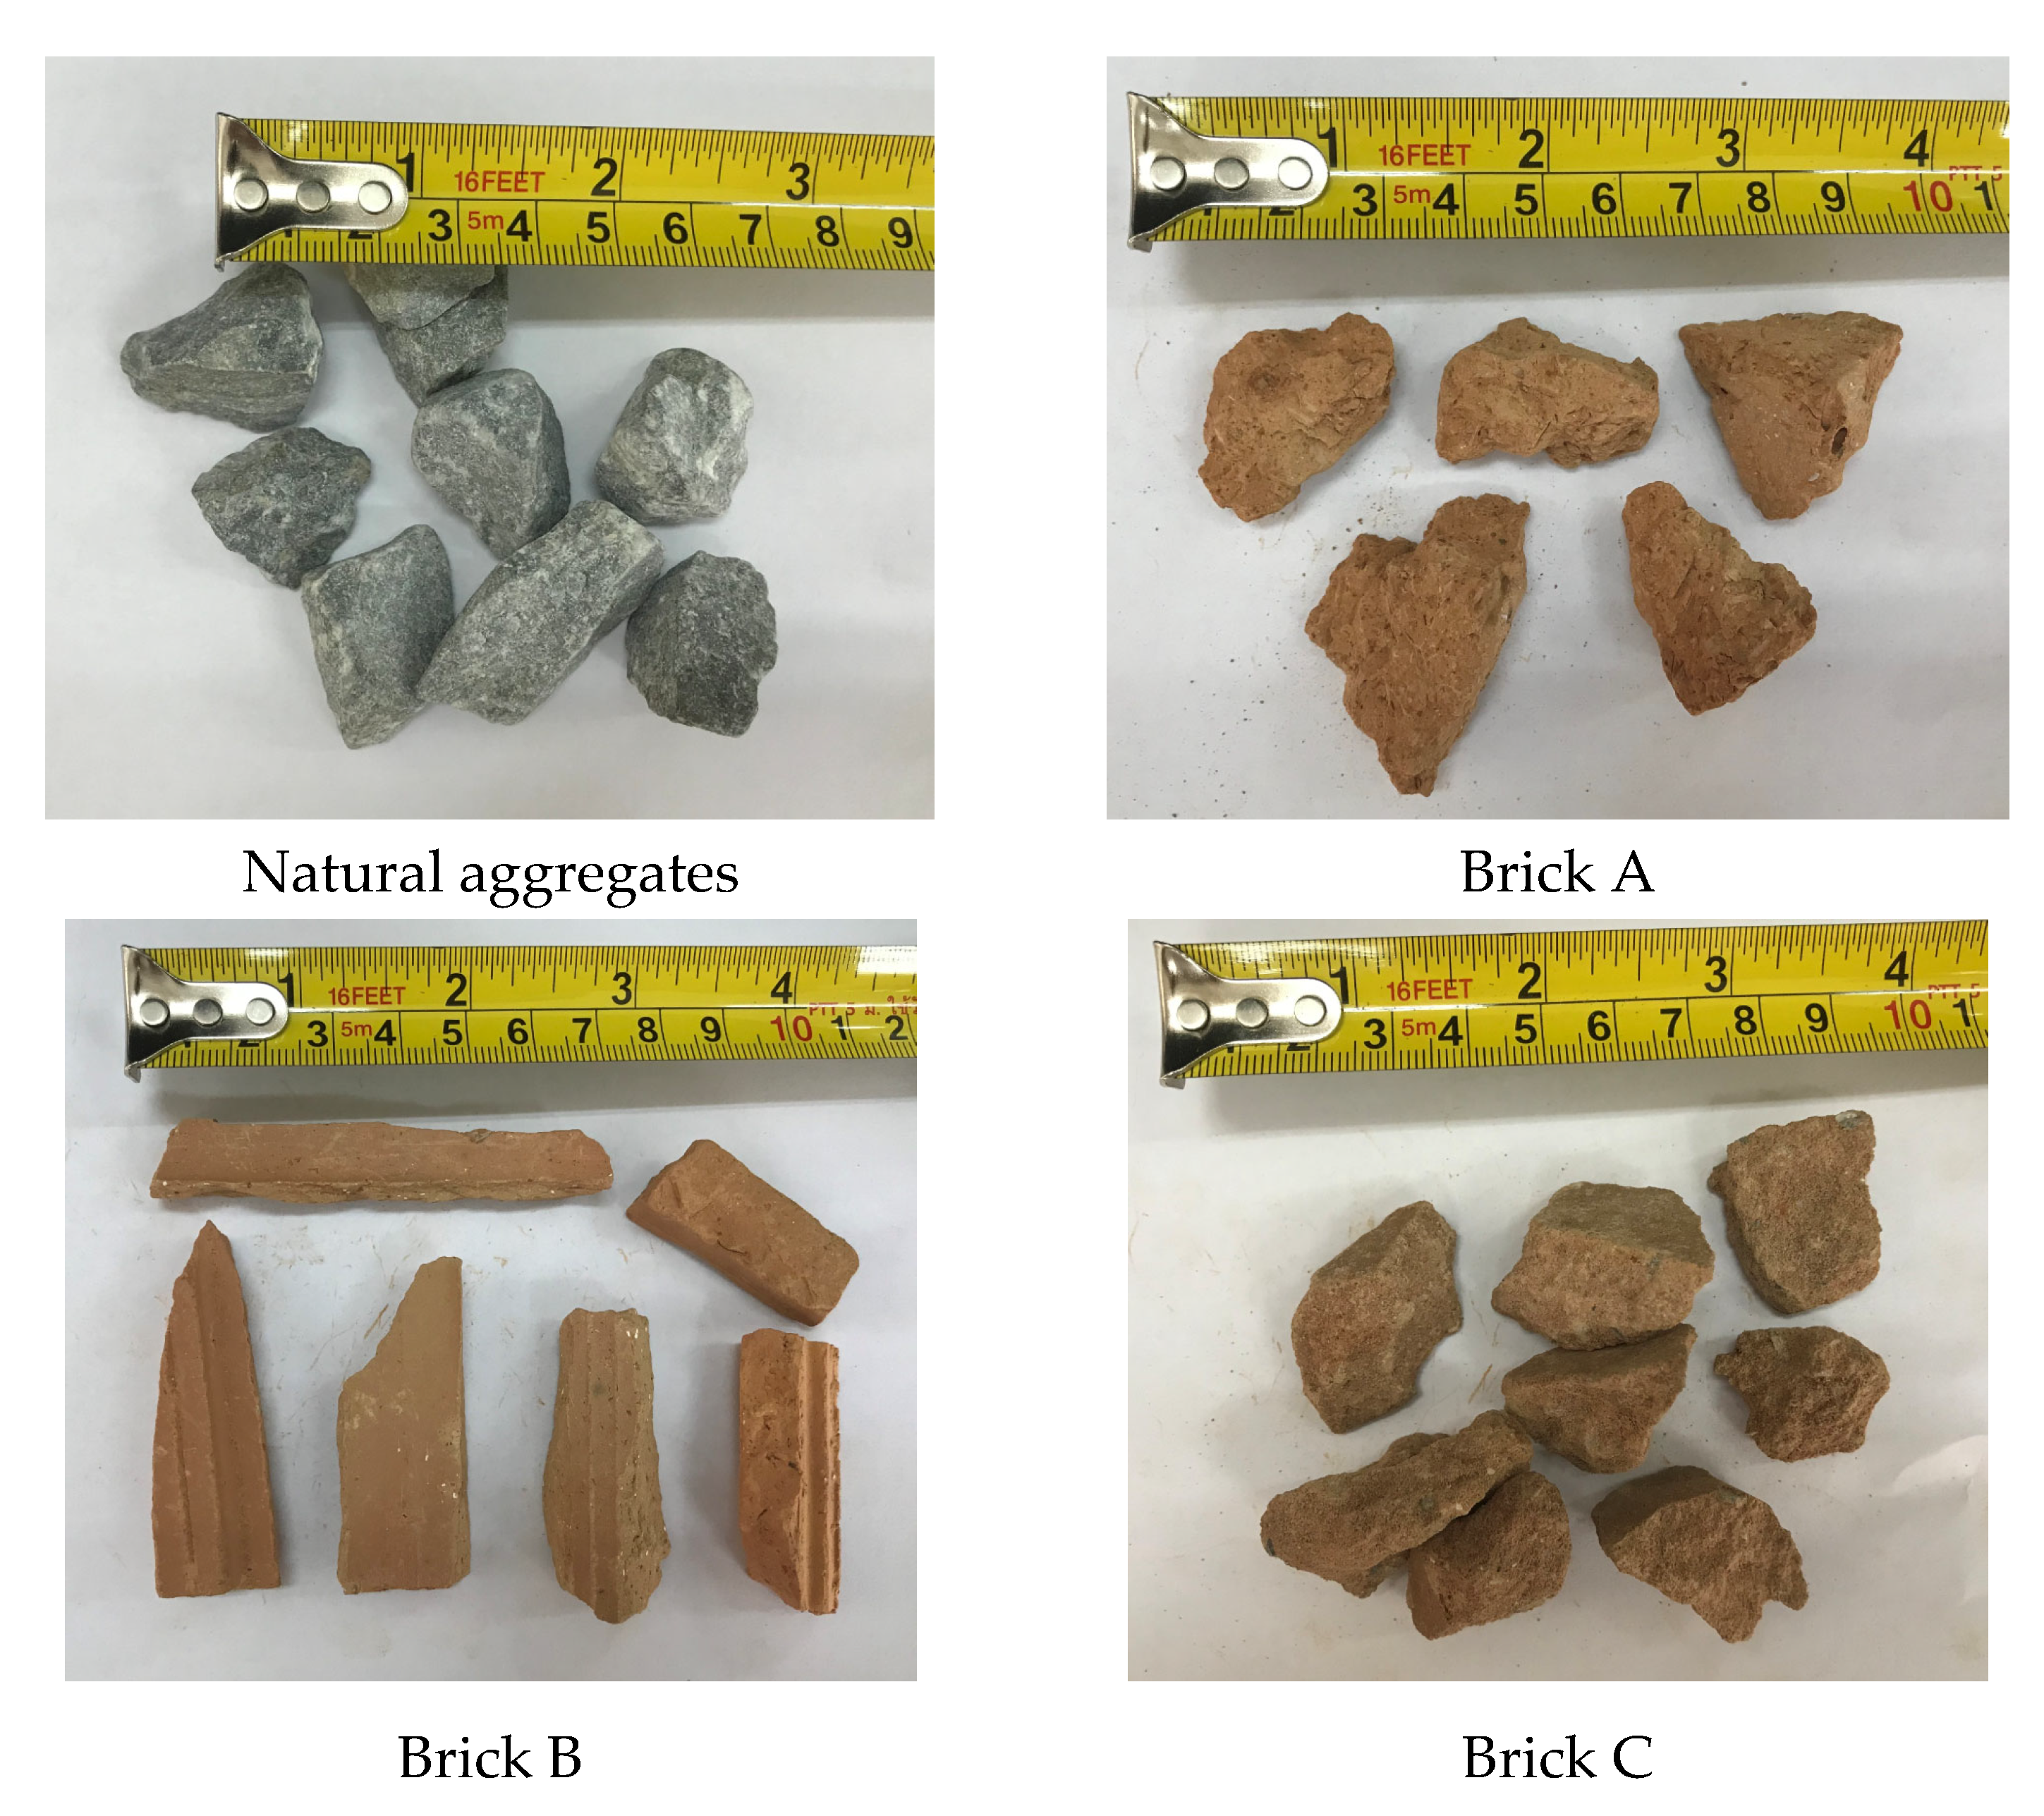
The experimental tests were conducted on cylindrical-shaped specimens with the height and diameter of 300 mm and 150 mm, respectively (Figure 1a), under the compressive and splitting tensile loadings, in accordance with ASTM C39/C39M-21 [41]. Moreover, three specimens corresponding to each type, with the dimensions as displayed in Figure 1b, were tested under the flexural loading. Bricks were crushed using a crushing machine, followed by the sieve analysis to yield coarse aggregates of the required size. The maximum size of coarse aggregates was limited to 25 mm. Different types of coarse aggregates used in this study are illustrated in Figure 2. Steel fibers utilized to strengthen the specimens comprised hooked ends to improve their bond performance with concrete. A typical steel fiber was 50–60 mm long, as depicted in Figure 3.
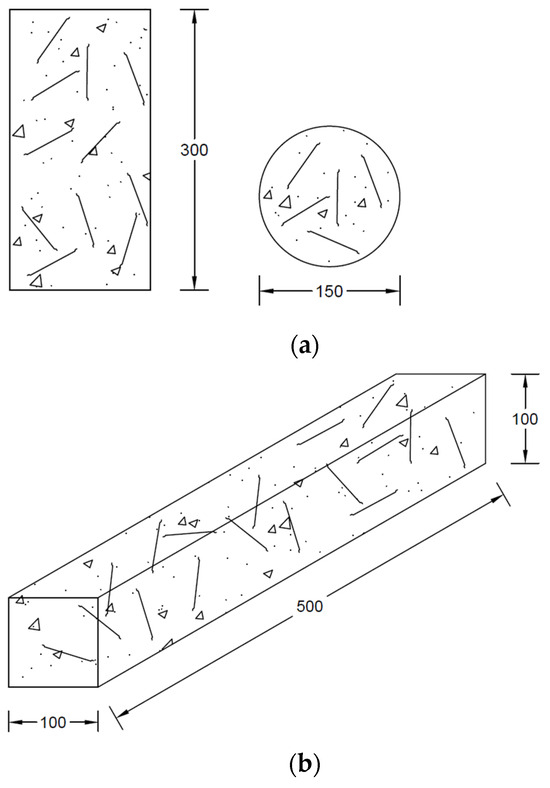
Figure 1.
Specimen details for: (a) splitting tensile and compressive loadings and (b) flexural loading, (units are mm).
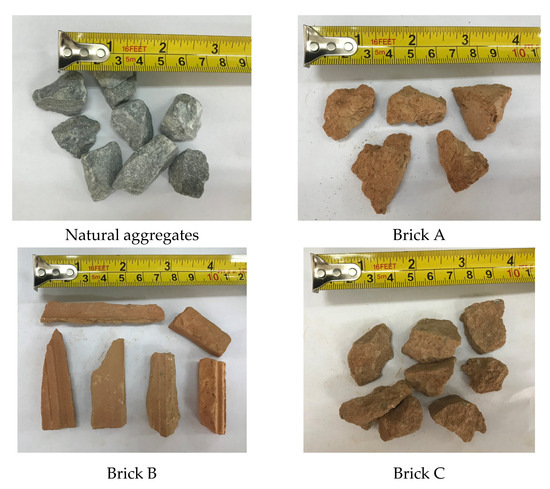
Figure 2.
Types of coarse aggregates (natural and recycled brick aggregates).
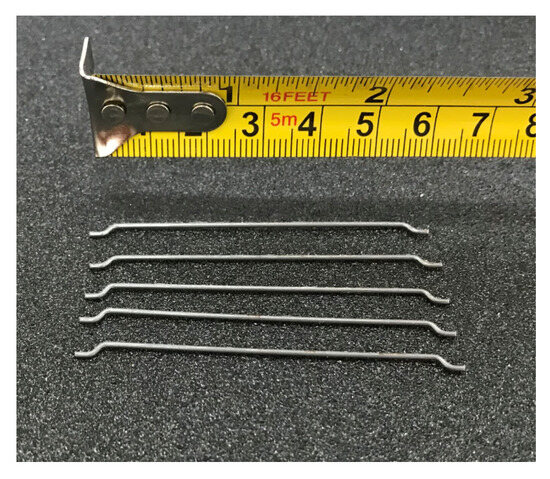
Figure 3.
Typical steel fibers used to strengthen RAC.
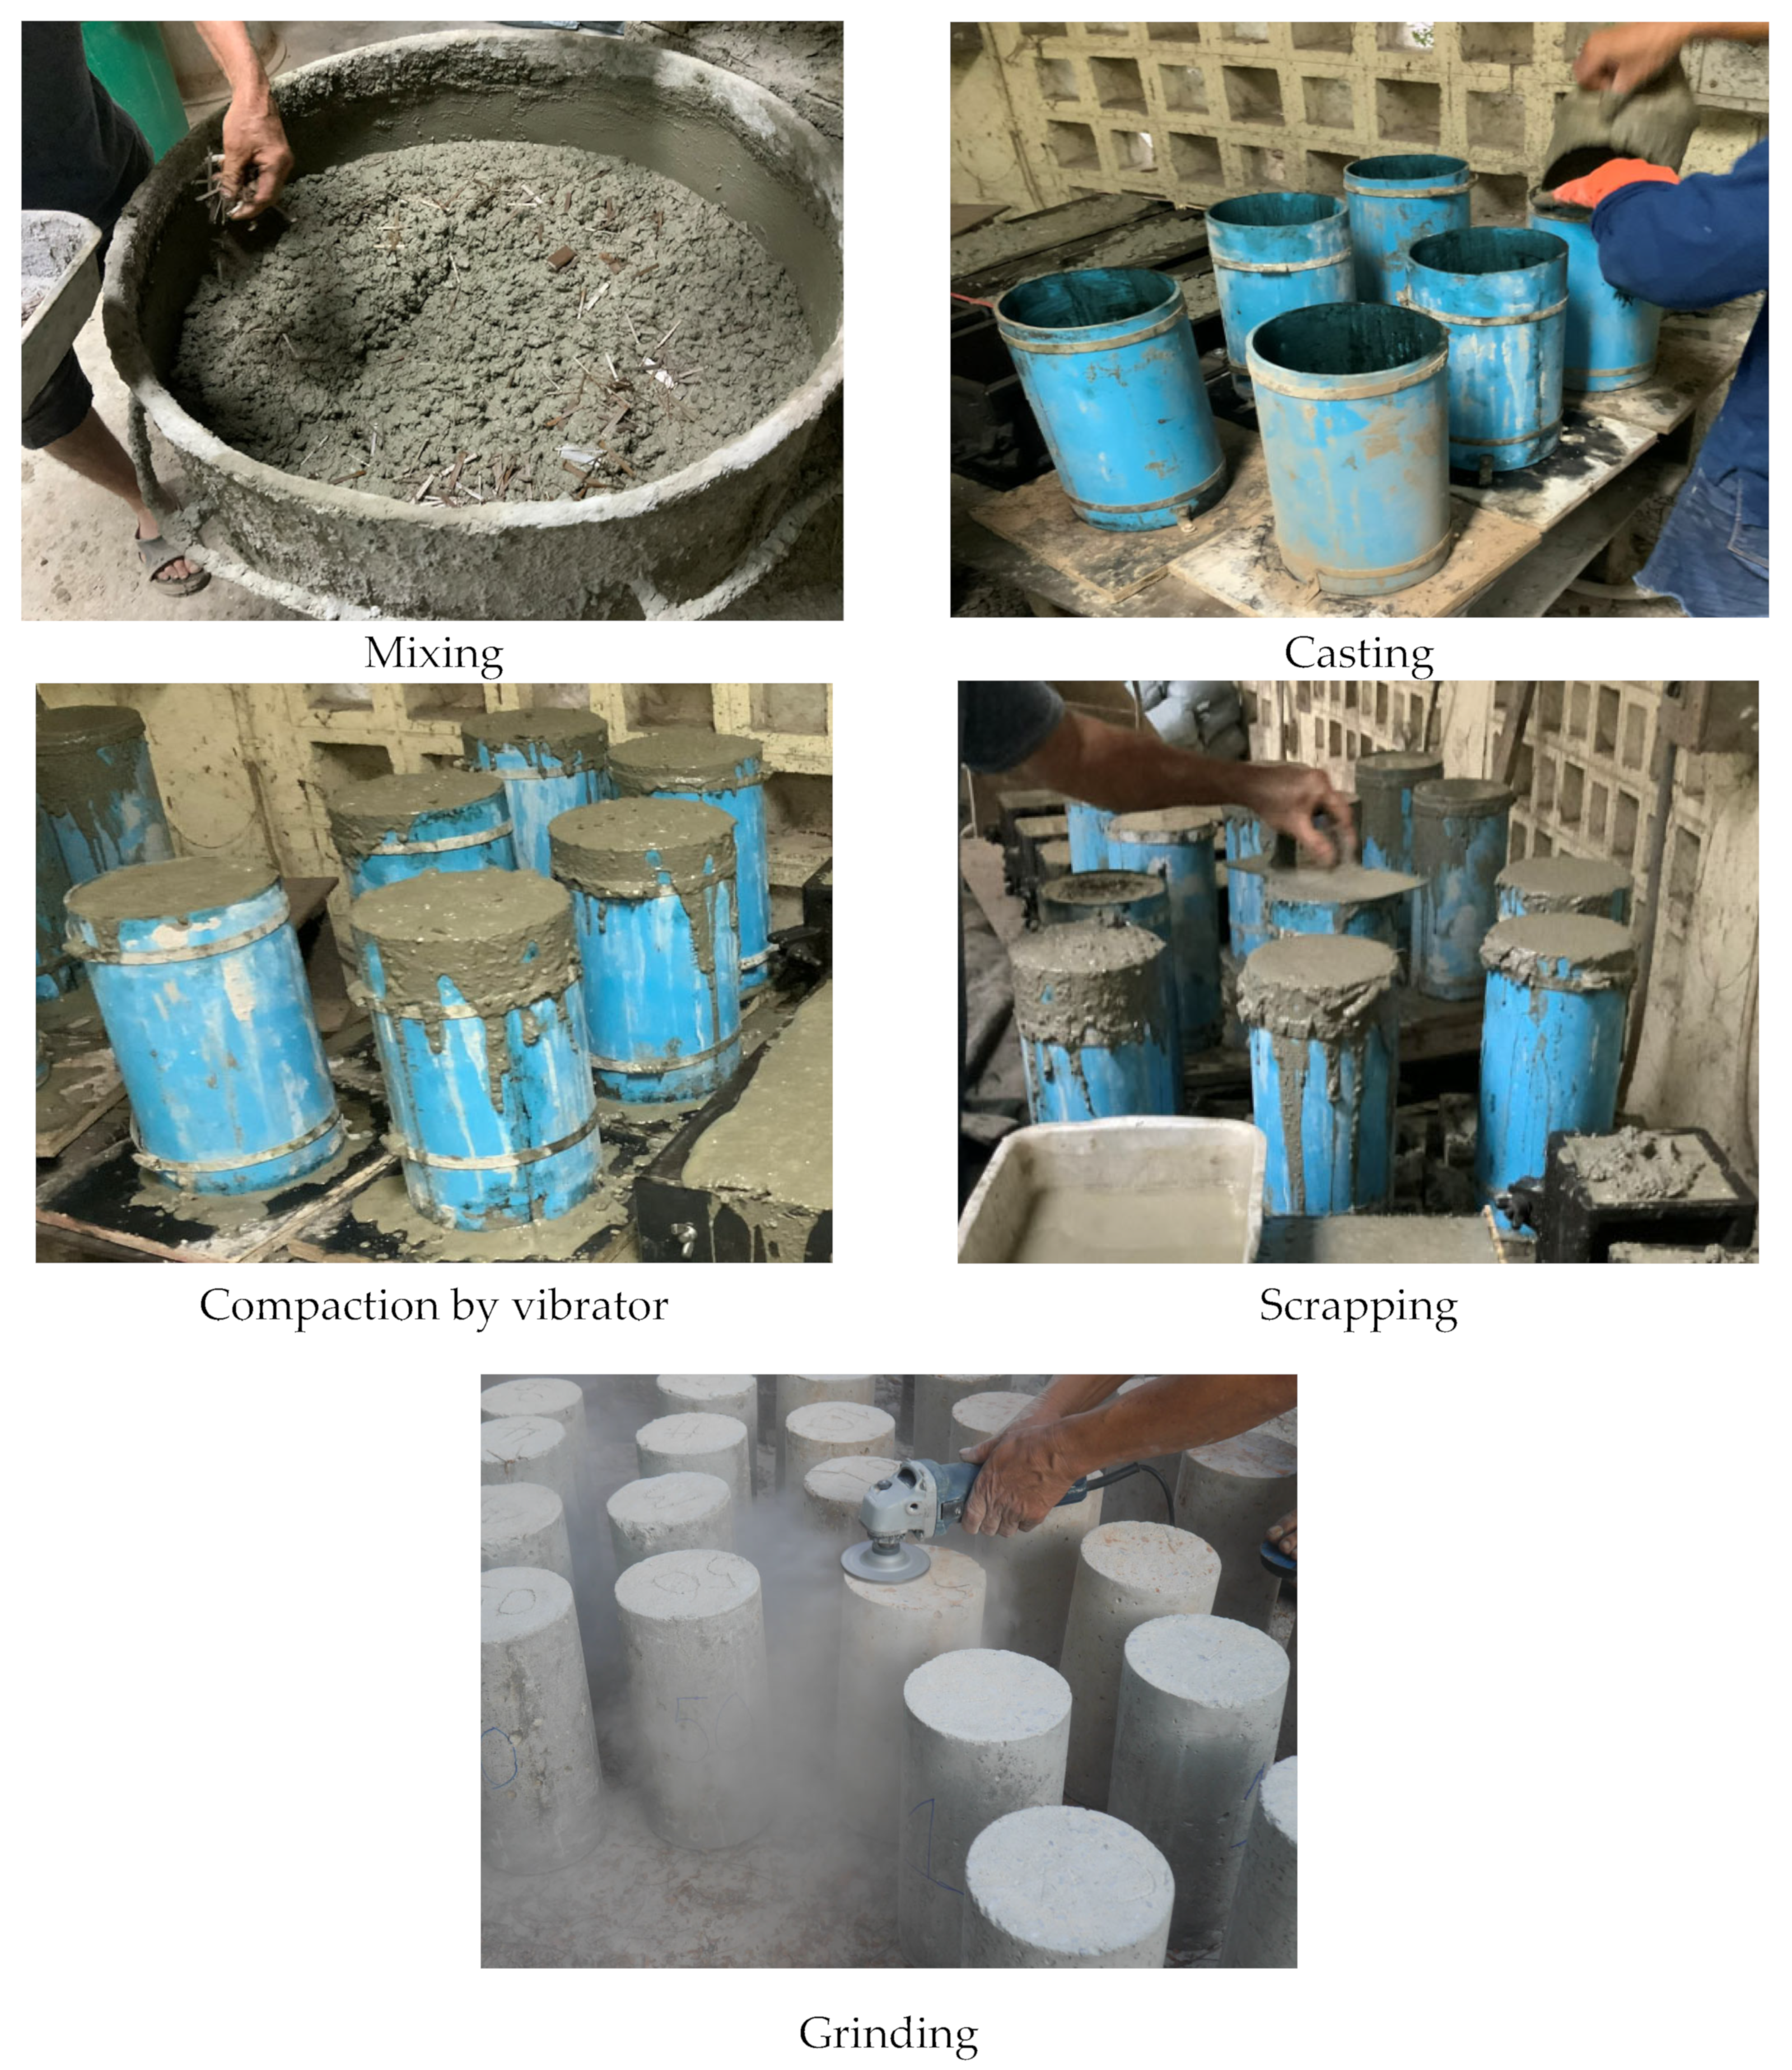
Steel fibers were mixed with concrete during the mixing stage. Steel molds were employed to cast the specimens after mixing, whereas demolding was performed after one day of casting. All the specimens were then subjected to curing for a period of 28 days in the laboratory environment. The top and bottom surfaces of each specimen were ground to yield smooth surfaces for load applications. The preparation process of the test specimens is shown in Figure 4.

Figure 4.
Preparation of test specimens.
2.3. Material Properties
The mechanical properties of three brick types were estimated by following ASTM C1314-21 and ASTM C140/C140M-22a standards [42,43]. Previous studies have indicated that a replacement ratio of recycled aggregates below 30% does not affect the mechanical properties of RAC [44,45,46]. Therefore, 50% of natural aggregates were replaced with recycled brick aggregates. The properties of bricks are summarized in Table 2. The mix ratio of concrete corresponding to the target compressive strength of 15 MPa is presented in Table 3.
Table 2.
Mechanical properties of bricks.
Table 3.
Mix ratio of concrete.
2.4. Test Setup and Instrumentation
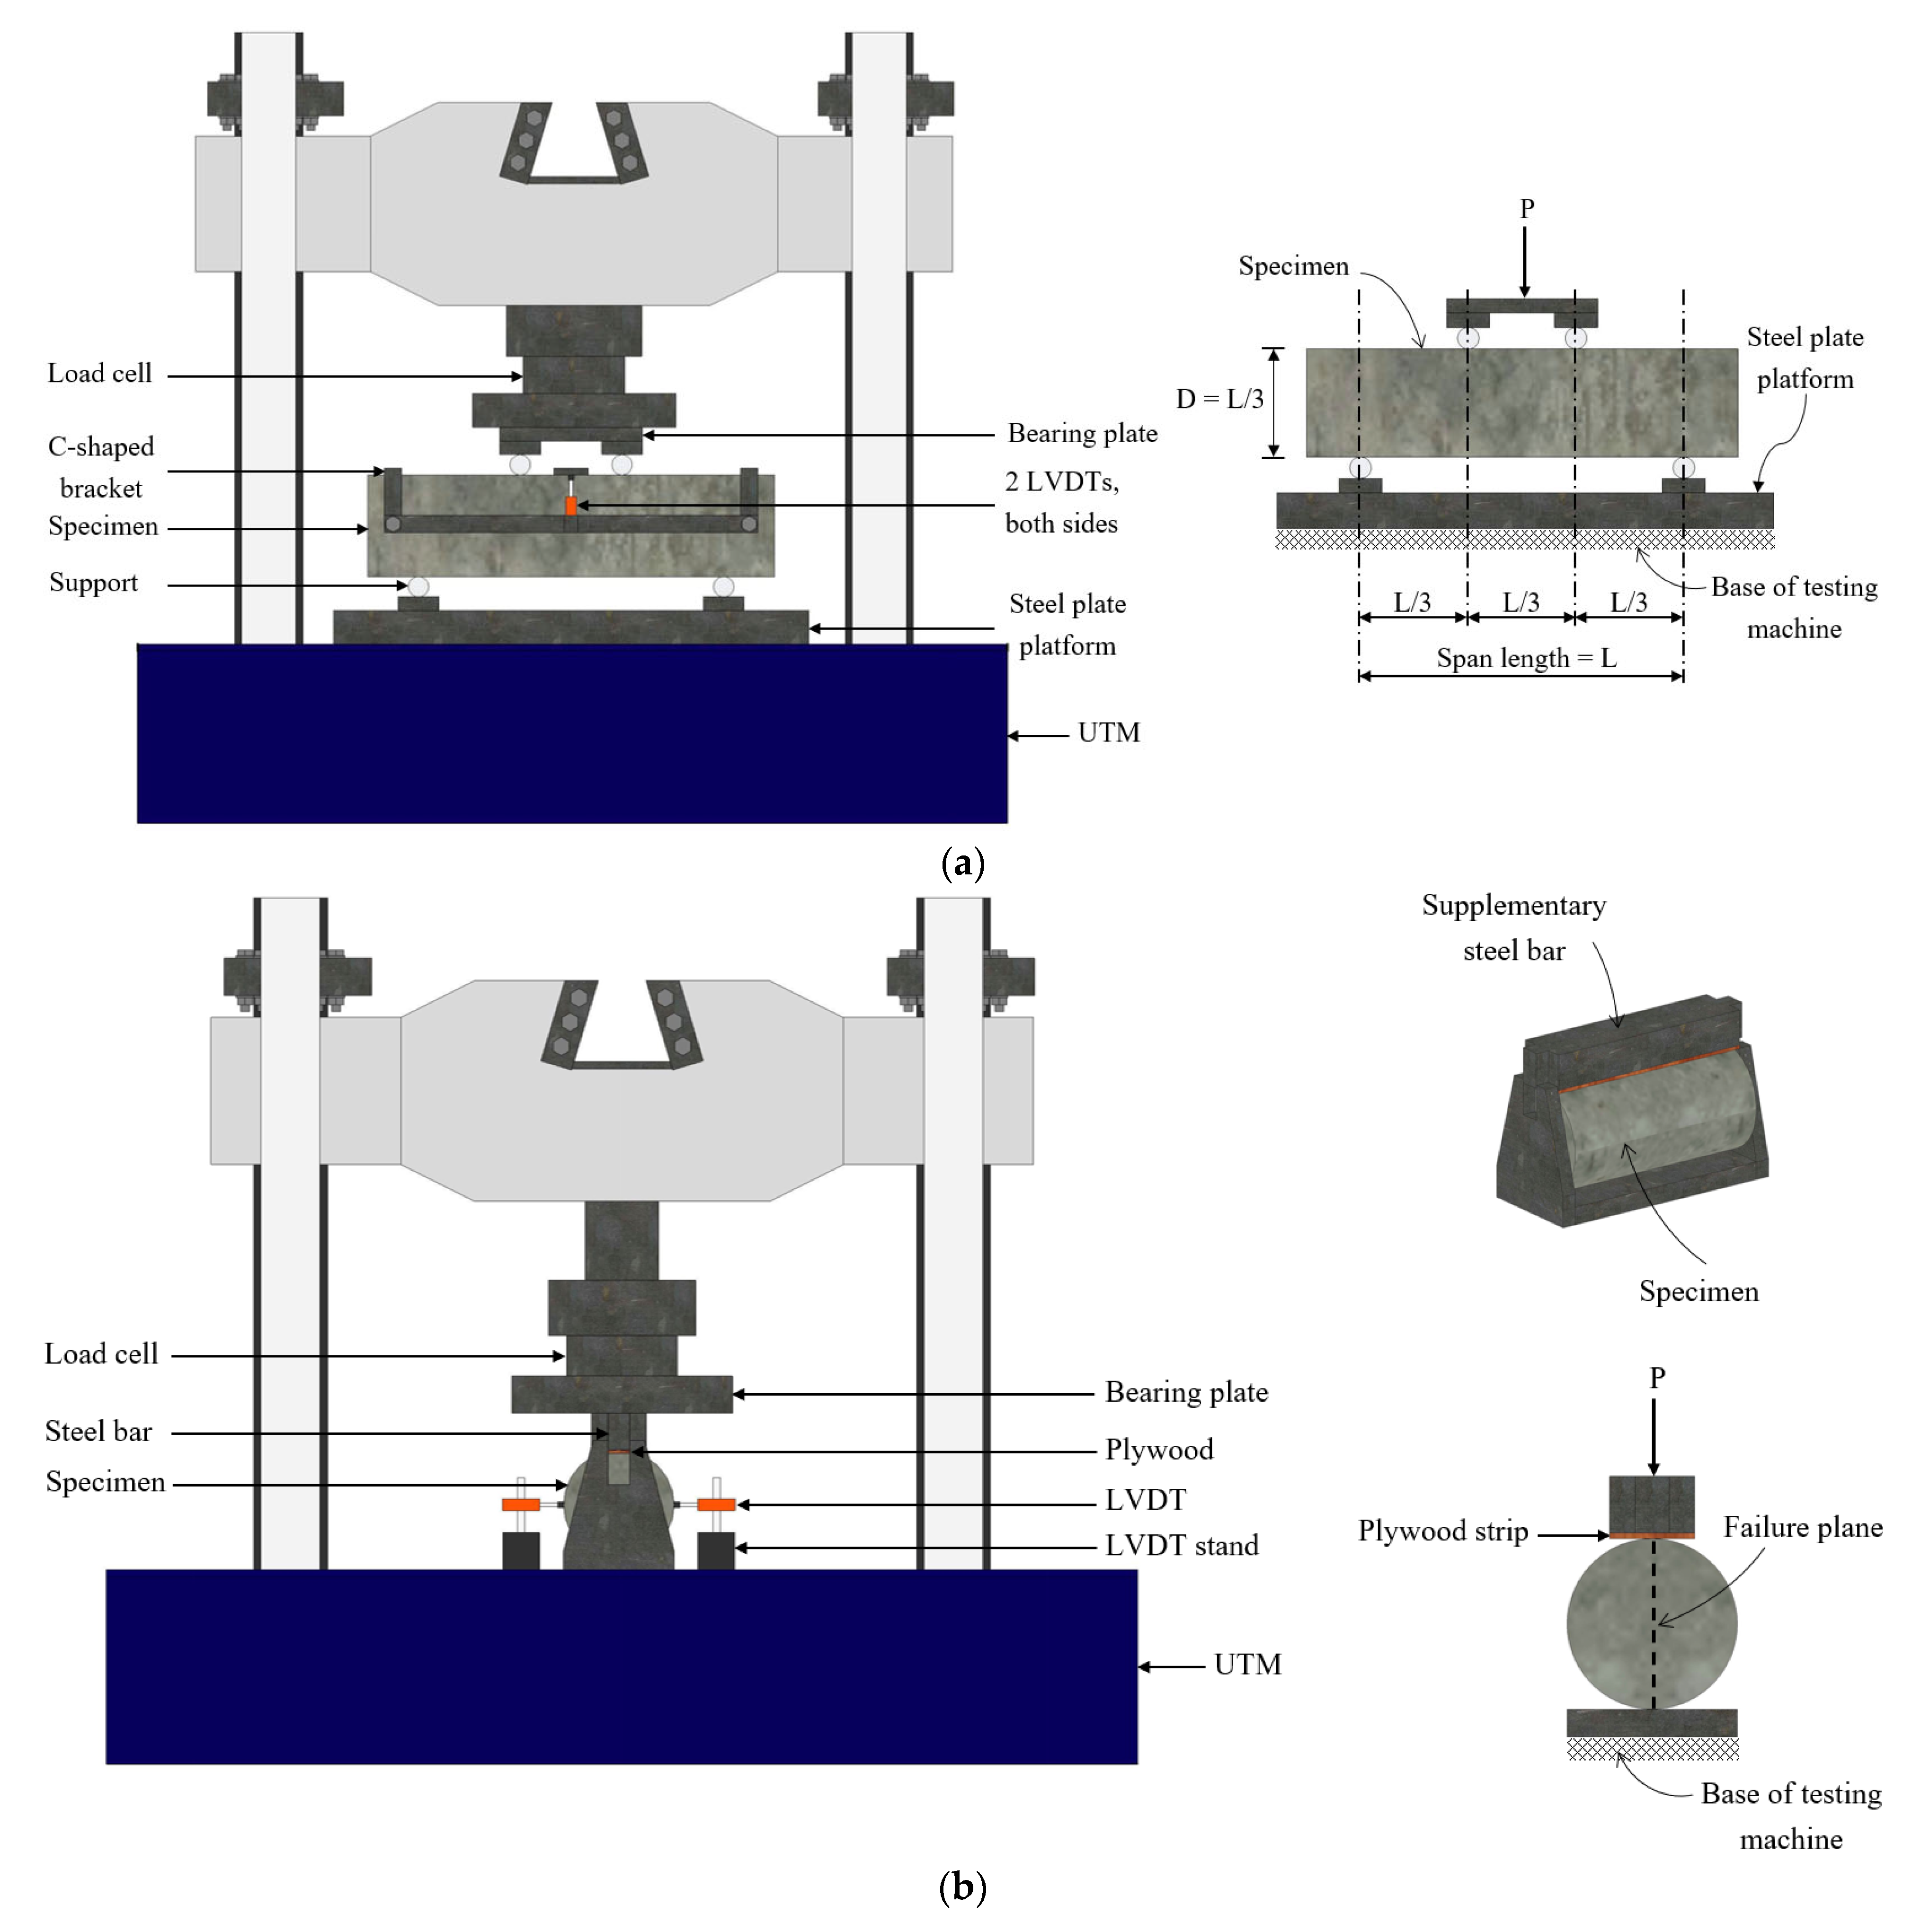
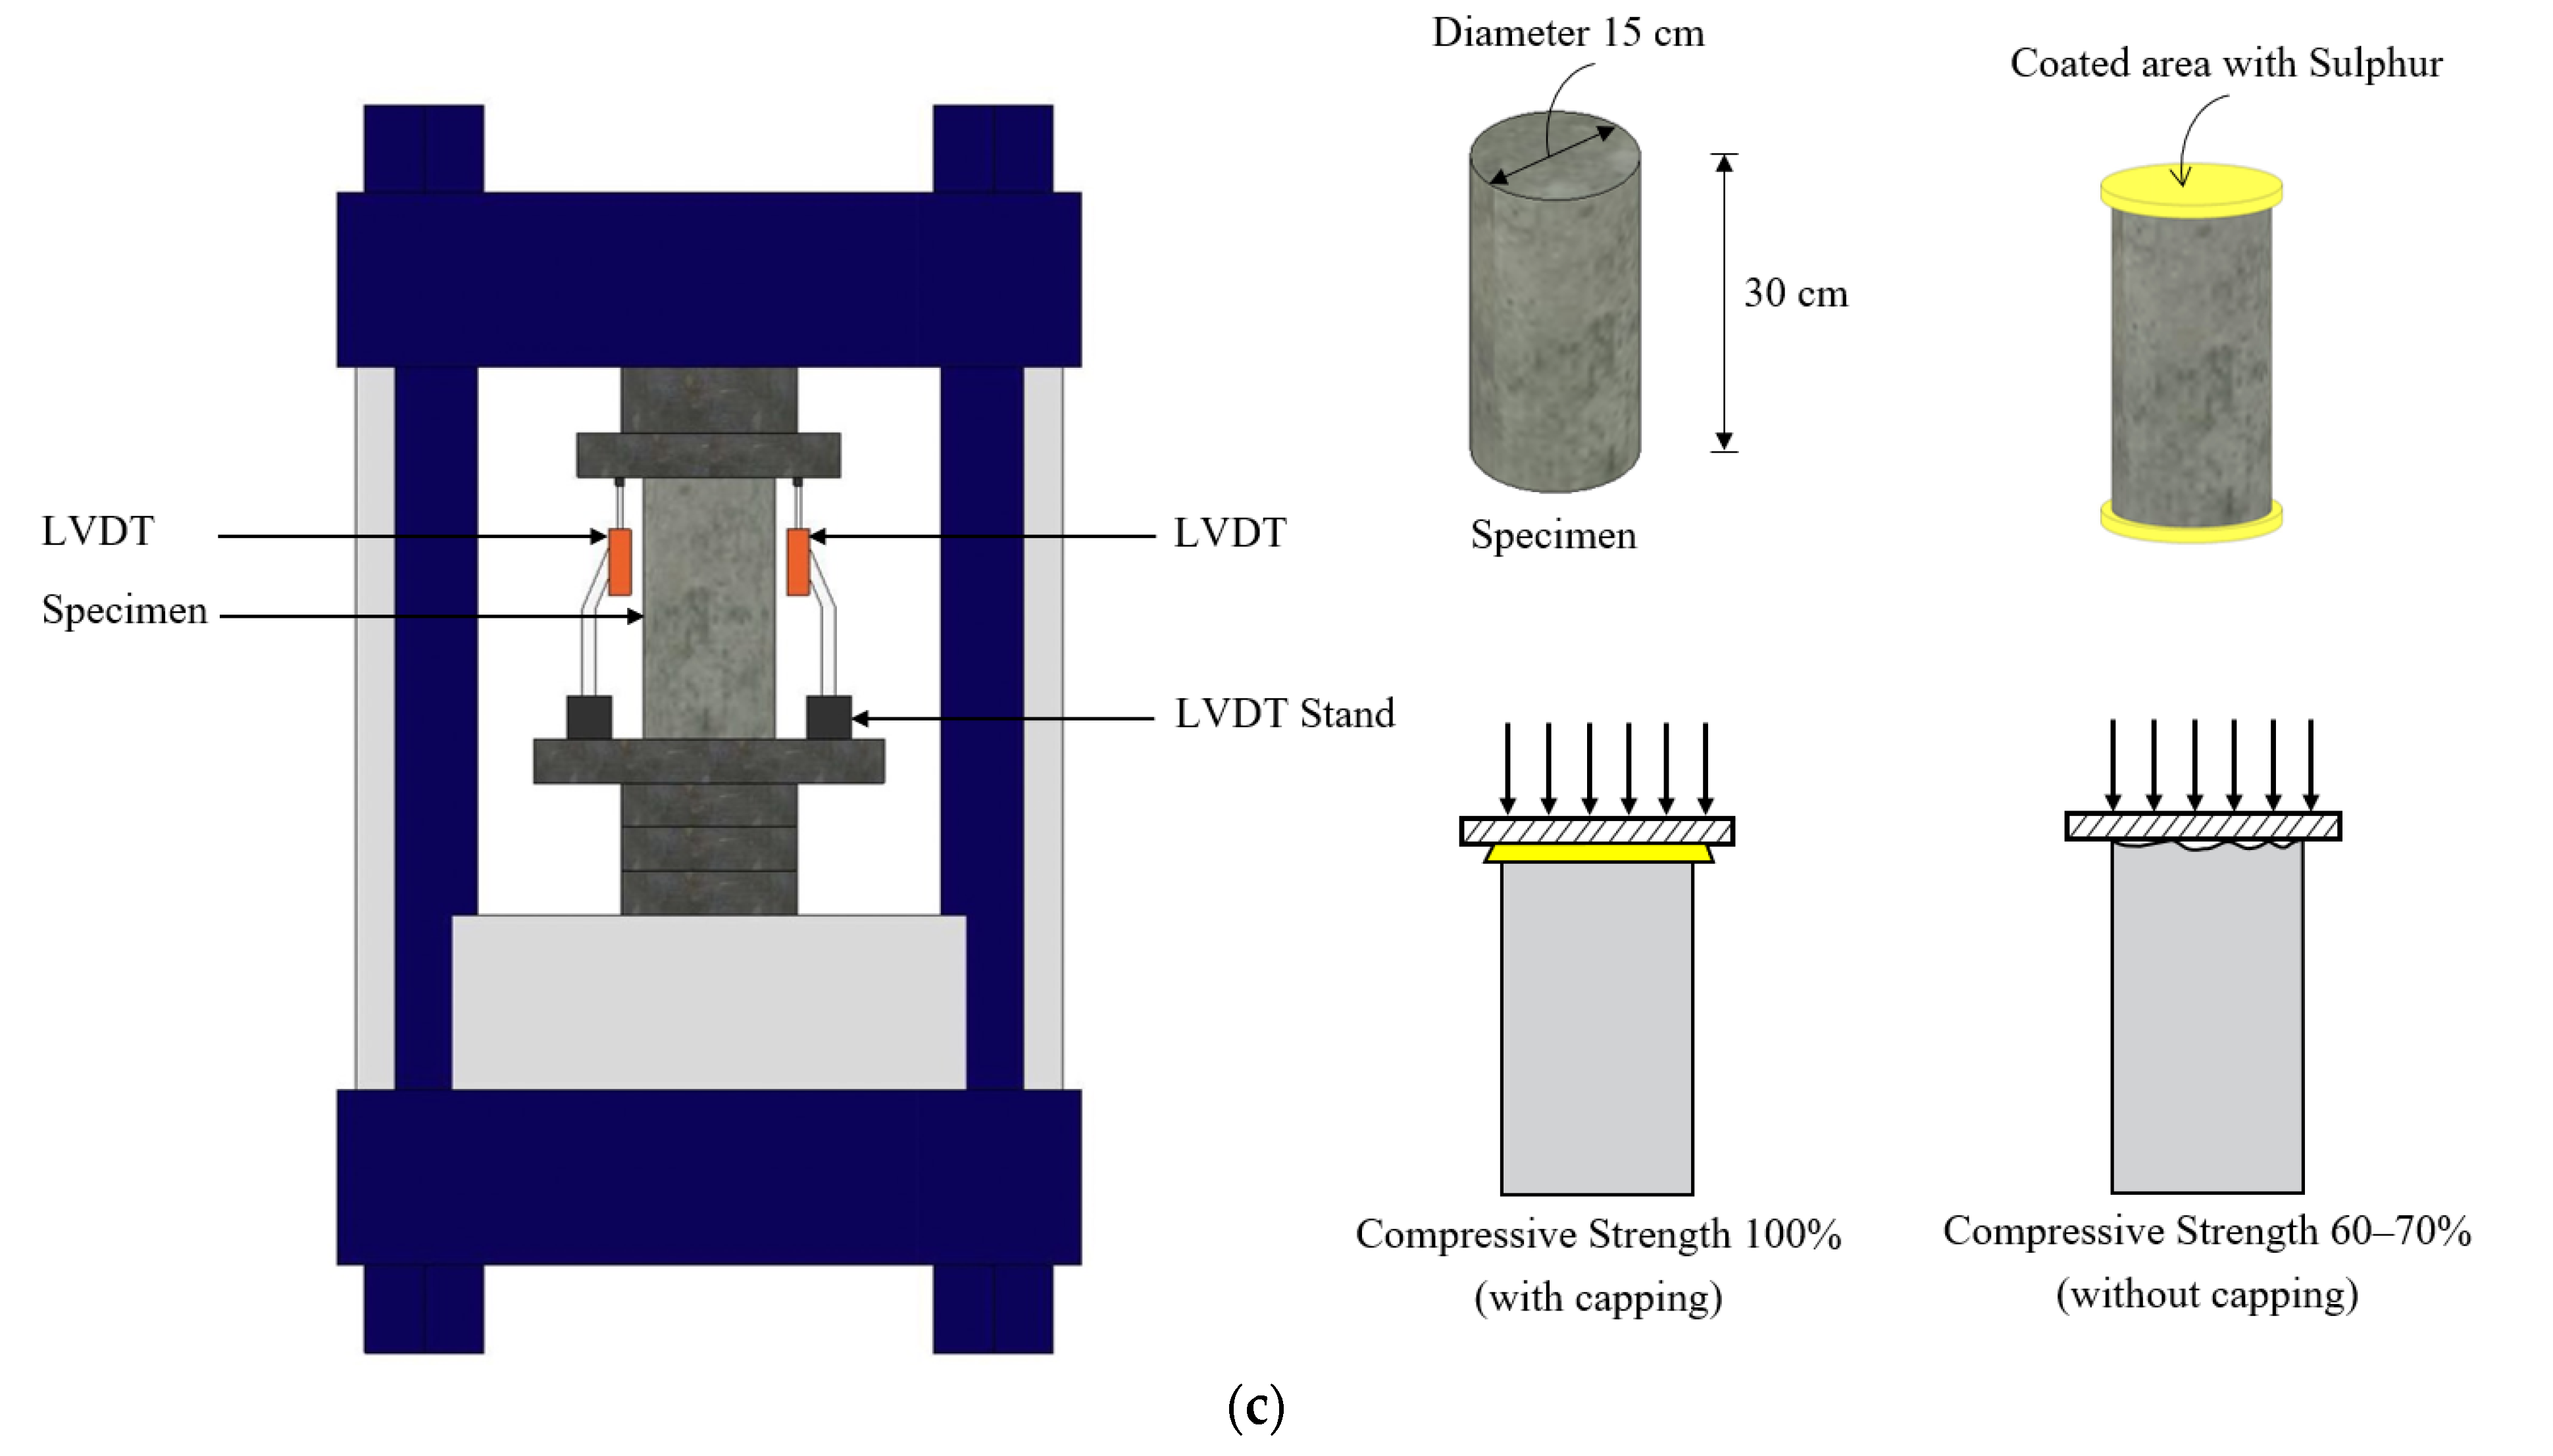
The test setup involved a universal testing machine (UTM) of 500 kN capacity and linear variable displacement transducers (LVDTs), as displayed in Figure 5. All the specimens were subjected to a monotonic compressive load. Steel plates were attached to the top and bottom surfaces of the specimens under compression to achieve a smooth and uniform loading application. The specimens under the splitting tensile loading were placed longitudinally within UTM.


Figure 5.
Test setups for: (a) flexural loading, (b) splitting tensile loading, and (c) compressive loading.
3. Experimental Results
3.1. Ultimate Failure Modes
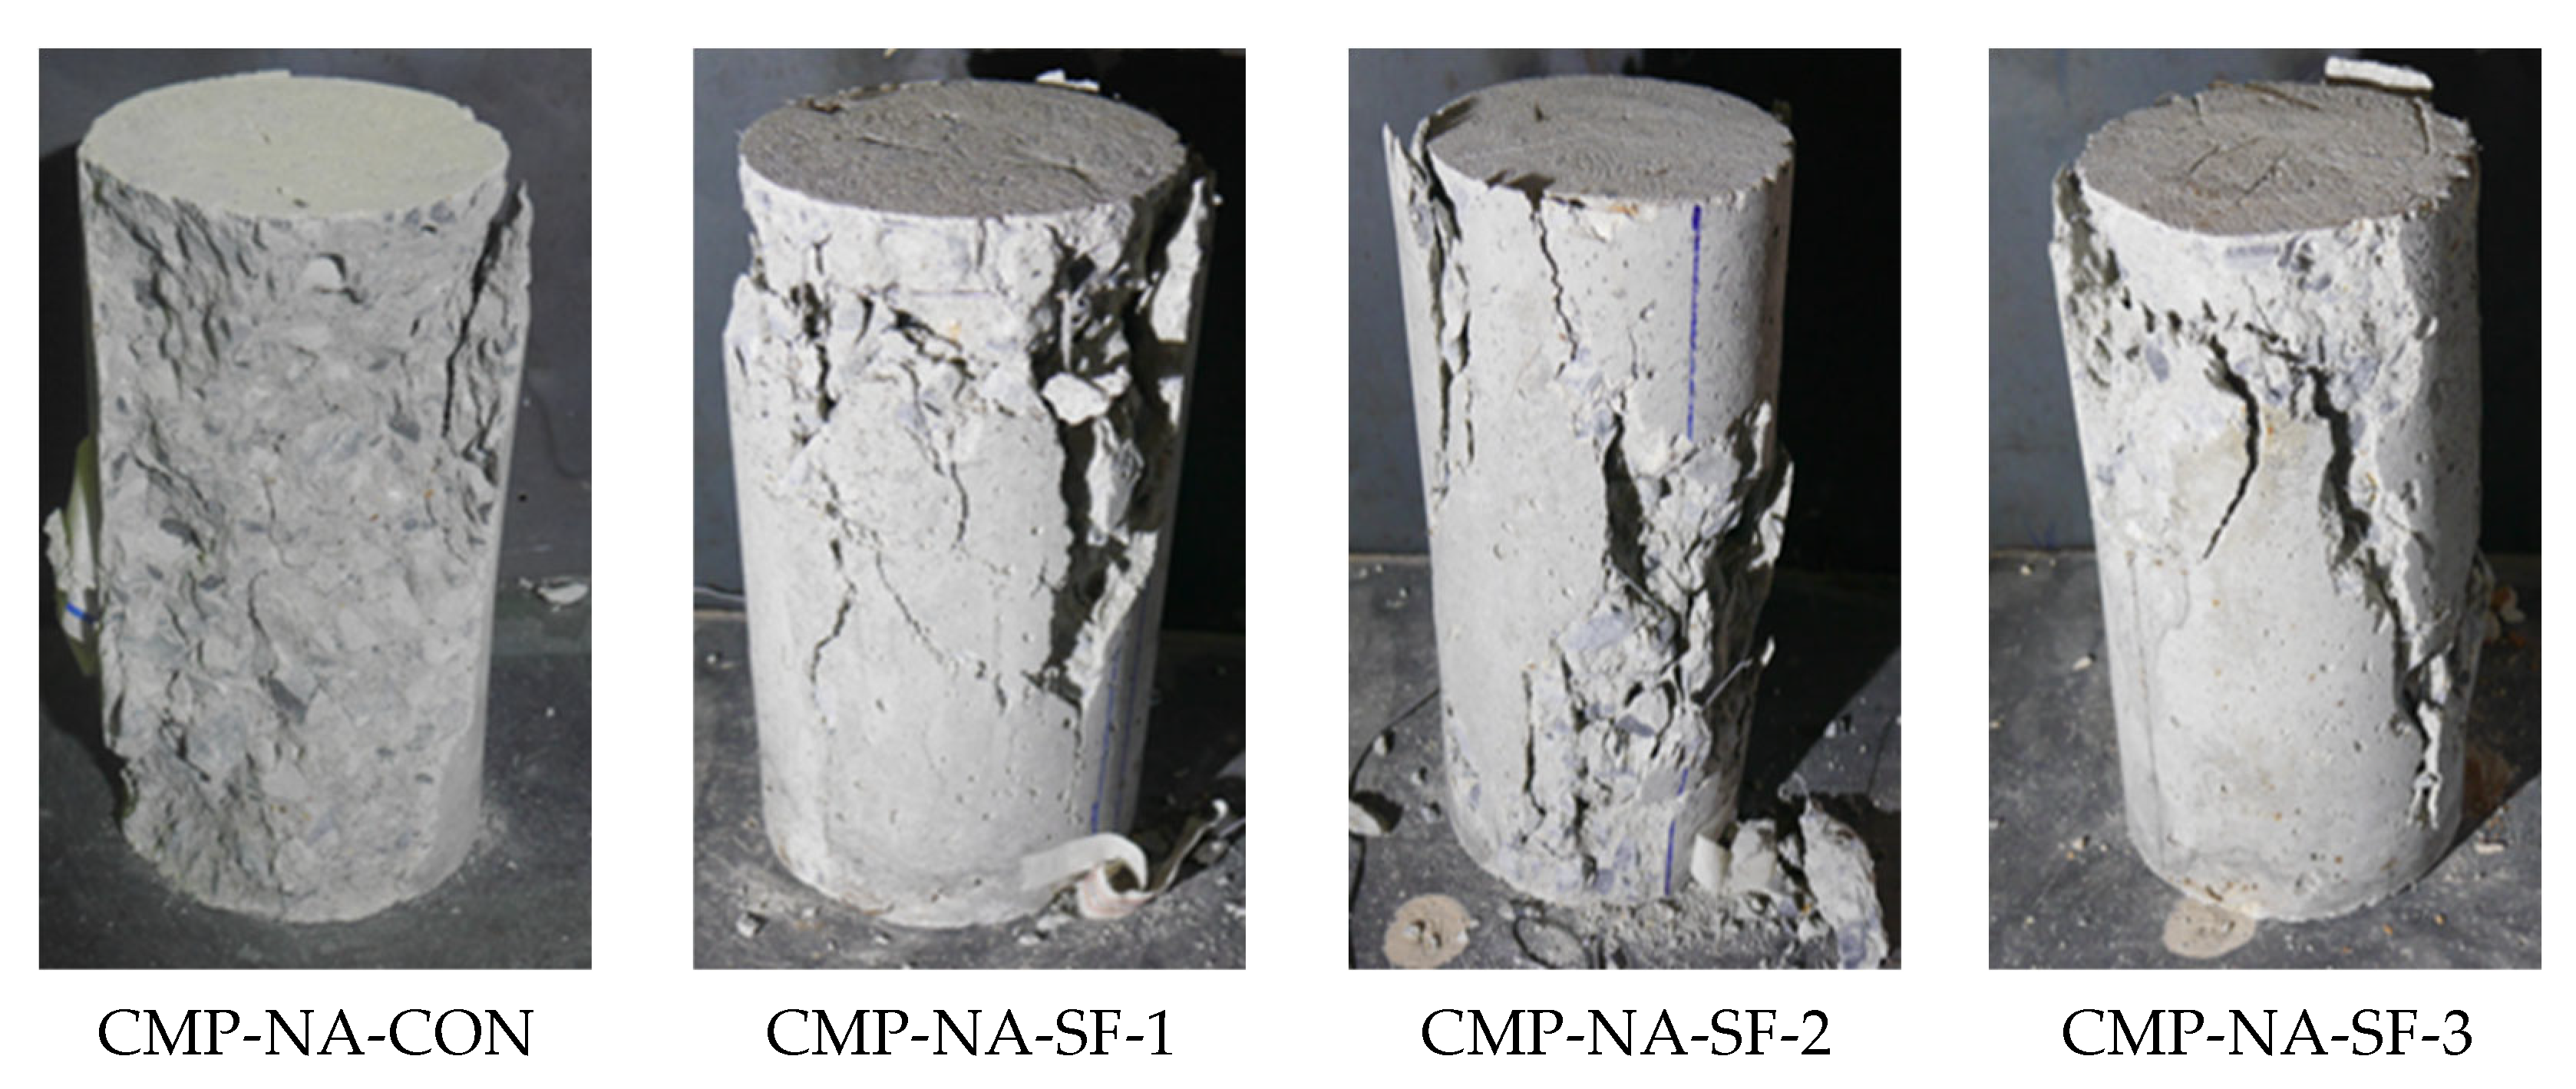
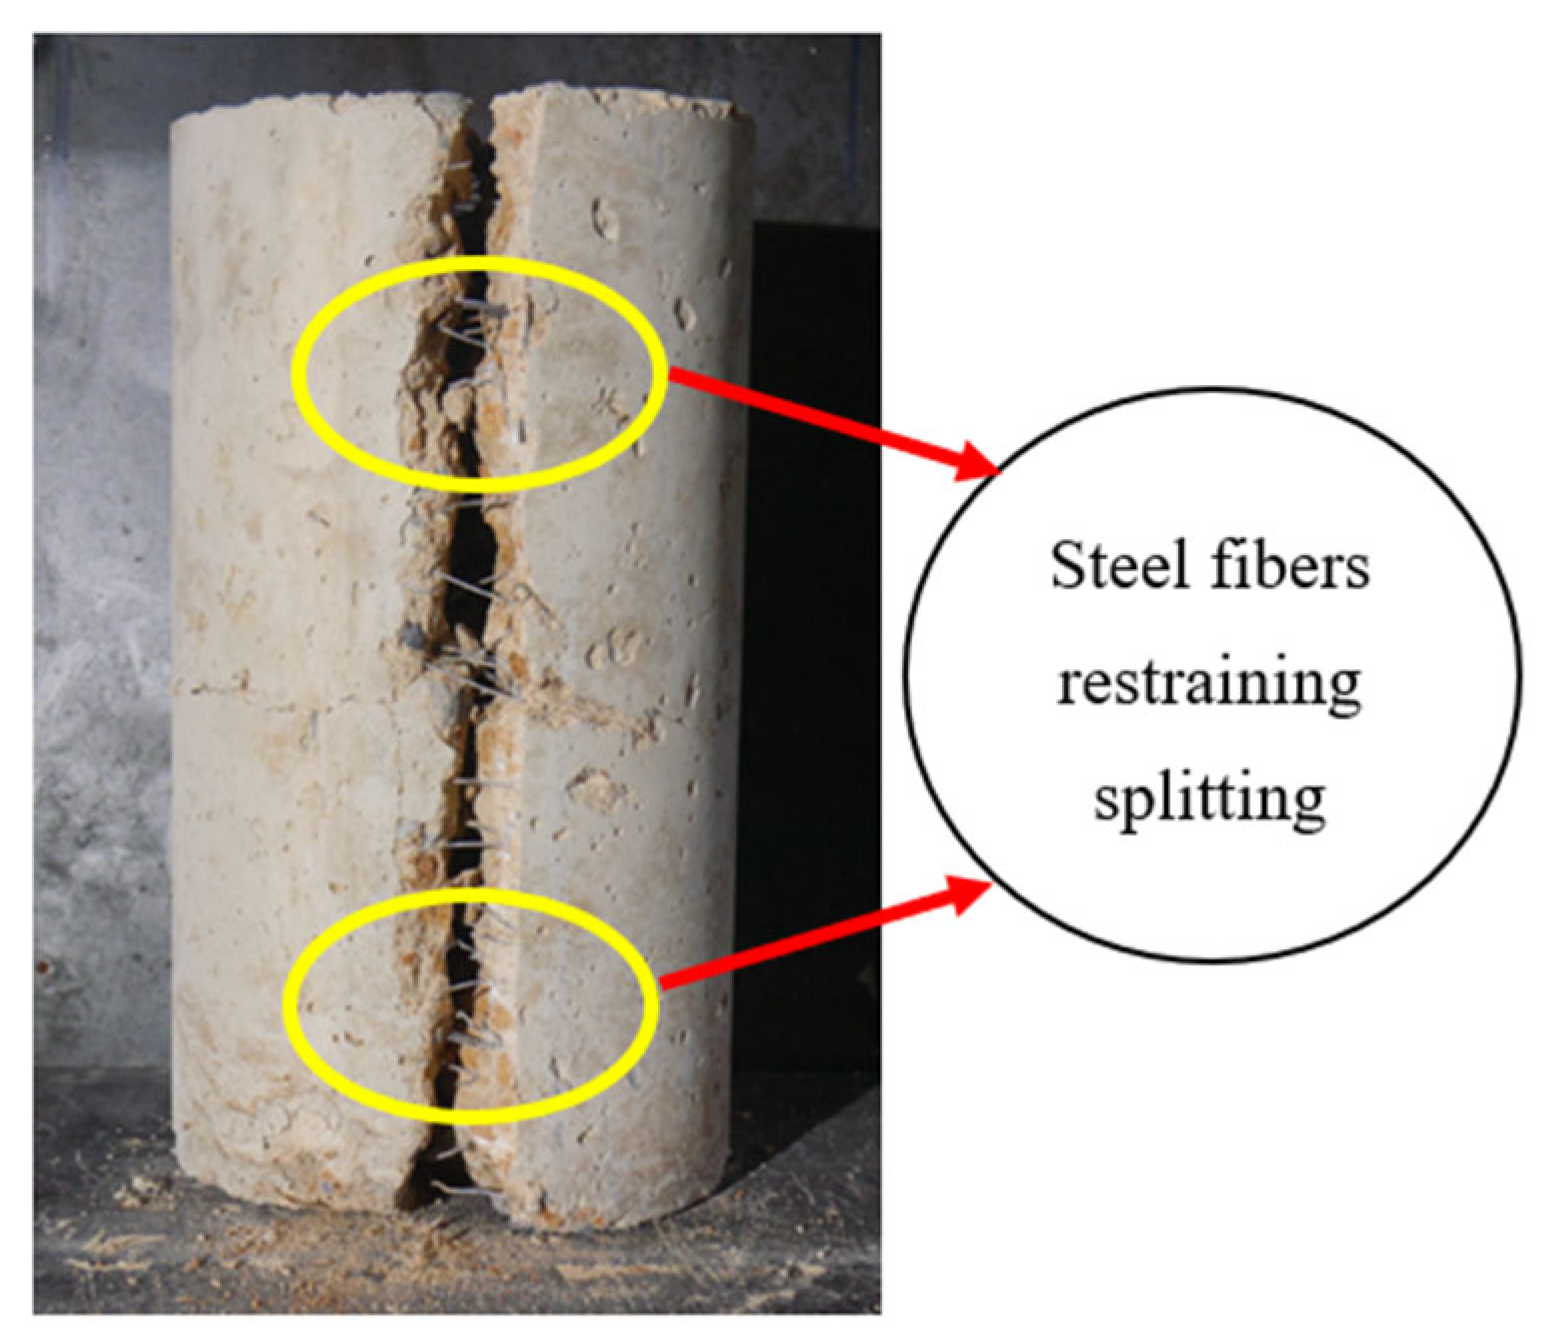
The observed failure modes of all the specimens are illustrated in Figure 6. The control specimens in all the groups exhibited typical crushing failure of the cylindrical specimens by forming failure cones, splitting cracks along their heights, and exhibiting extensive crushing. The specimens with a 1% volume fraction of steel fibers exhibited a delayed failure as compared to that of the control specimens. In addition, the magnitude of splitting and crushing was reduced. This issue can be attributed to the presence of steel fibers that restrained the splitting opening along the height, as depicted in Figure 7. The extent of brittleness in the failure mode decreased as the volume fraction of steel fibers increased in all the groups. The failure modes of the specimens with 2% or 3% steel fibers mainly demonstrated localized concrete crushing toward their top, whereas their bottom sides indicated slight cracking.
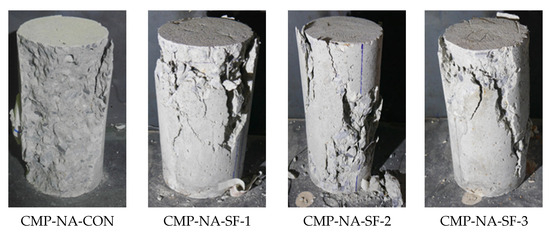
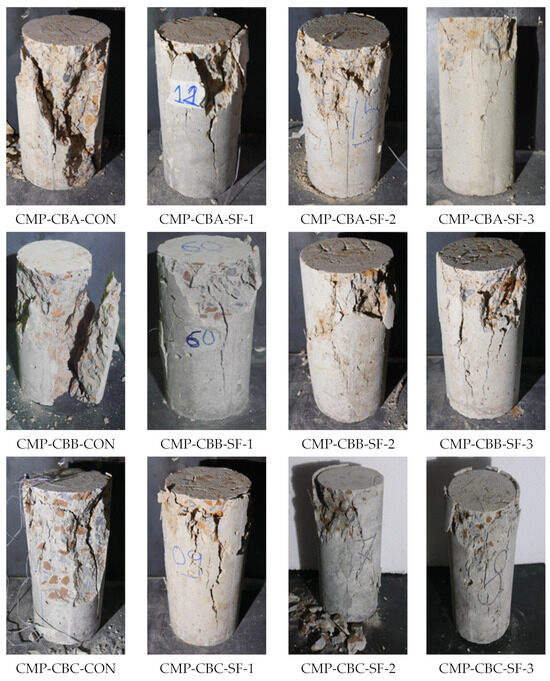
Figure 6.
Failure modes observed in all specimens.

Figure 7.
Steel fibers restraining splitting along height.
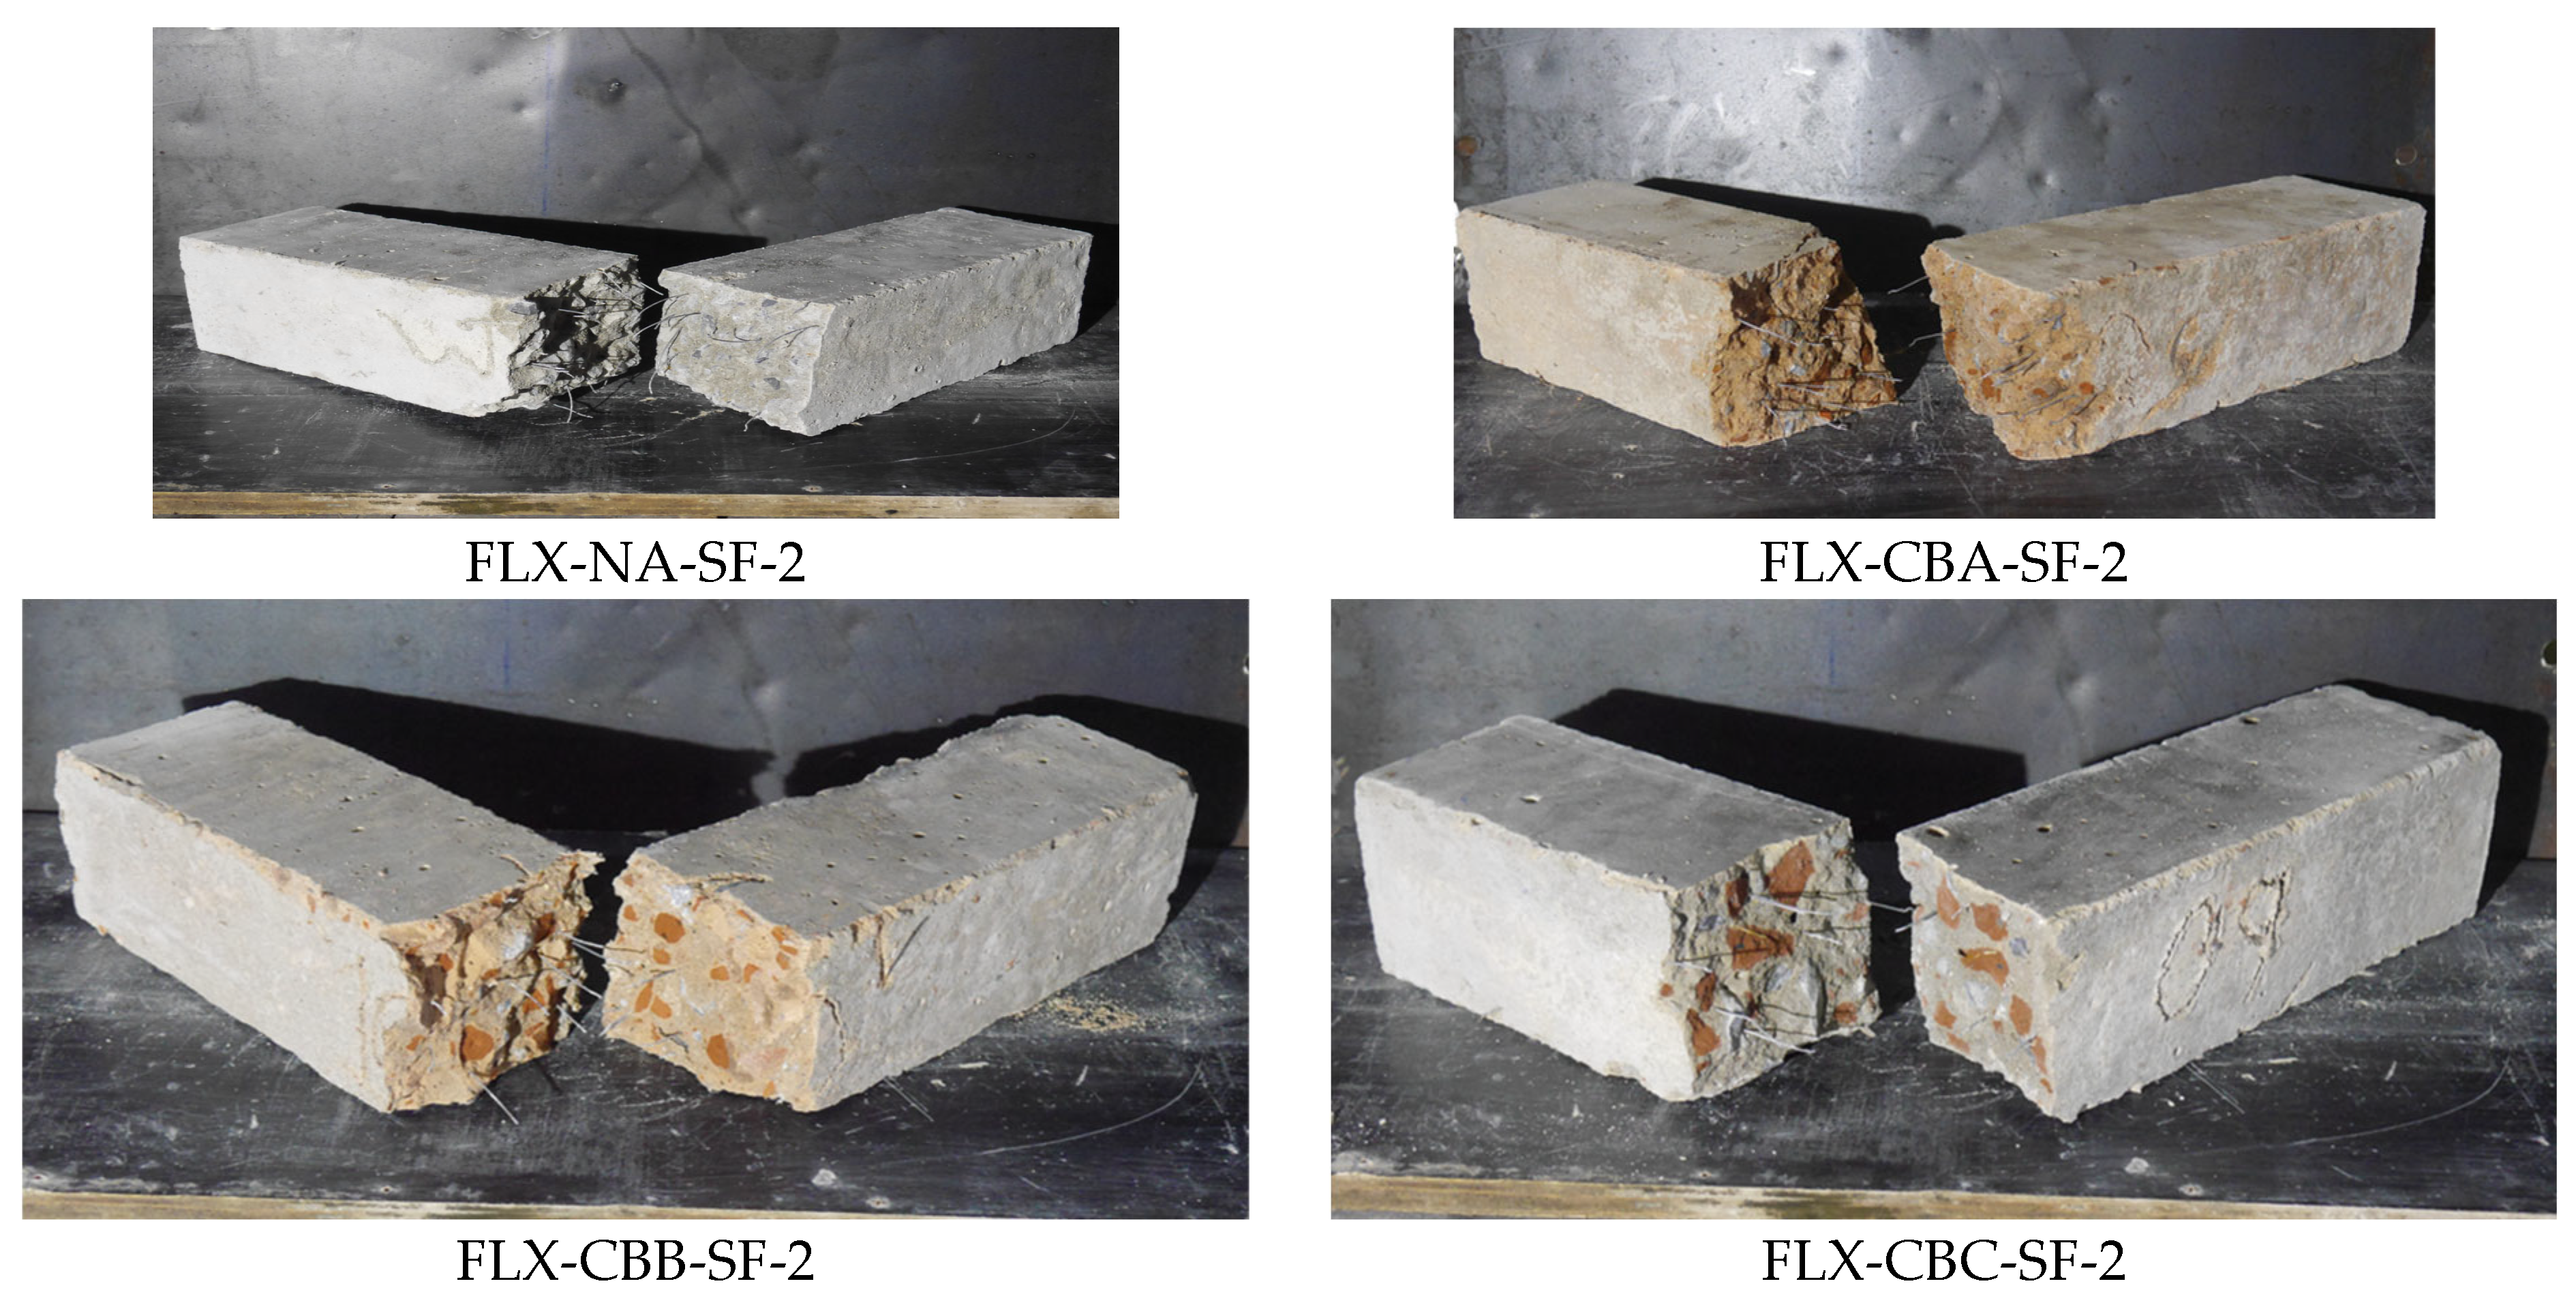
The specimens under the splitting tensile loading exhibited typical splitting along their longitudinal axes, as shown in Figure 8. It is important to note that the type of splitting failure was independent of the presence or type of recycled brick aggregates. A similar observation was made for the specimens under the flexural loading. All the flexural specimens experienced transverse cracking and failed in a sudden manner (Figure 9).
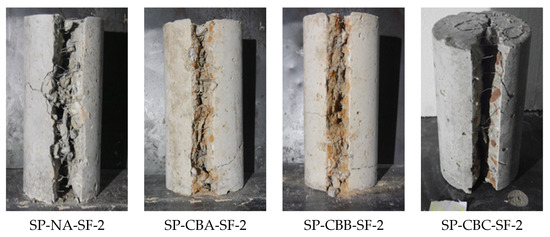
Figure 8.
Typical splitting failure modes.
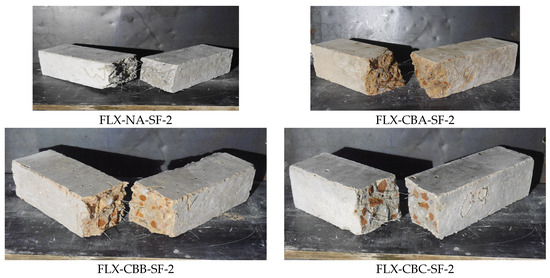
Figure 9.
Typical flexural failure modes.
3.2. Splitting Tensile and Flexural Strengths
A comparison of the splitting tensile strength of the specimens in different groups is displayed in Figure 10. In the figure, VF stands for the volume fraction of steel fibers. It is observed that the splitting tensile strength of the specimens in group 1 (i.e., 100% natural aggregates) was highest, irrespective of the presence and volume fraction of steel fibers. For instance, for 1% VF, the splitting tensile strength of natural aggregate concrete was 2.02 MPa, followed by 1.76 MPa, 1.70 MPa, and 1.54 MPa for CBC, CBB, and CBA aggregate type concrete, respectively. The lowest splitting tensile strength was demonstrated by group 2 specimens (i.e., recycled aggregates obtained from solid fired-clay bricks), followed by group 3 (i.e., recycled aggregates obtained from hollow fired-clay bricks) and group 4 (i.e., recycled aggregates obtained from cement–clay interlocking bricks) specimens, respectively. Nonetheless, the specimens in each group exhibited an improvement in the splitting tensile strength with the increase in the volume fraction of steel fibers.
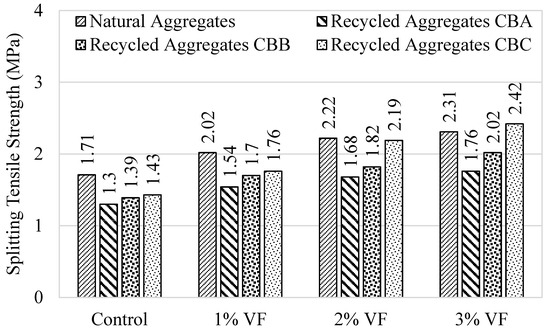
Figure 10.
Comparison of splitting tensile strength.
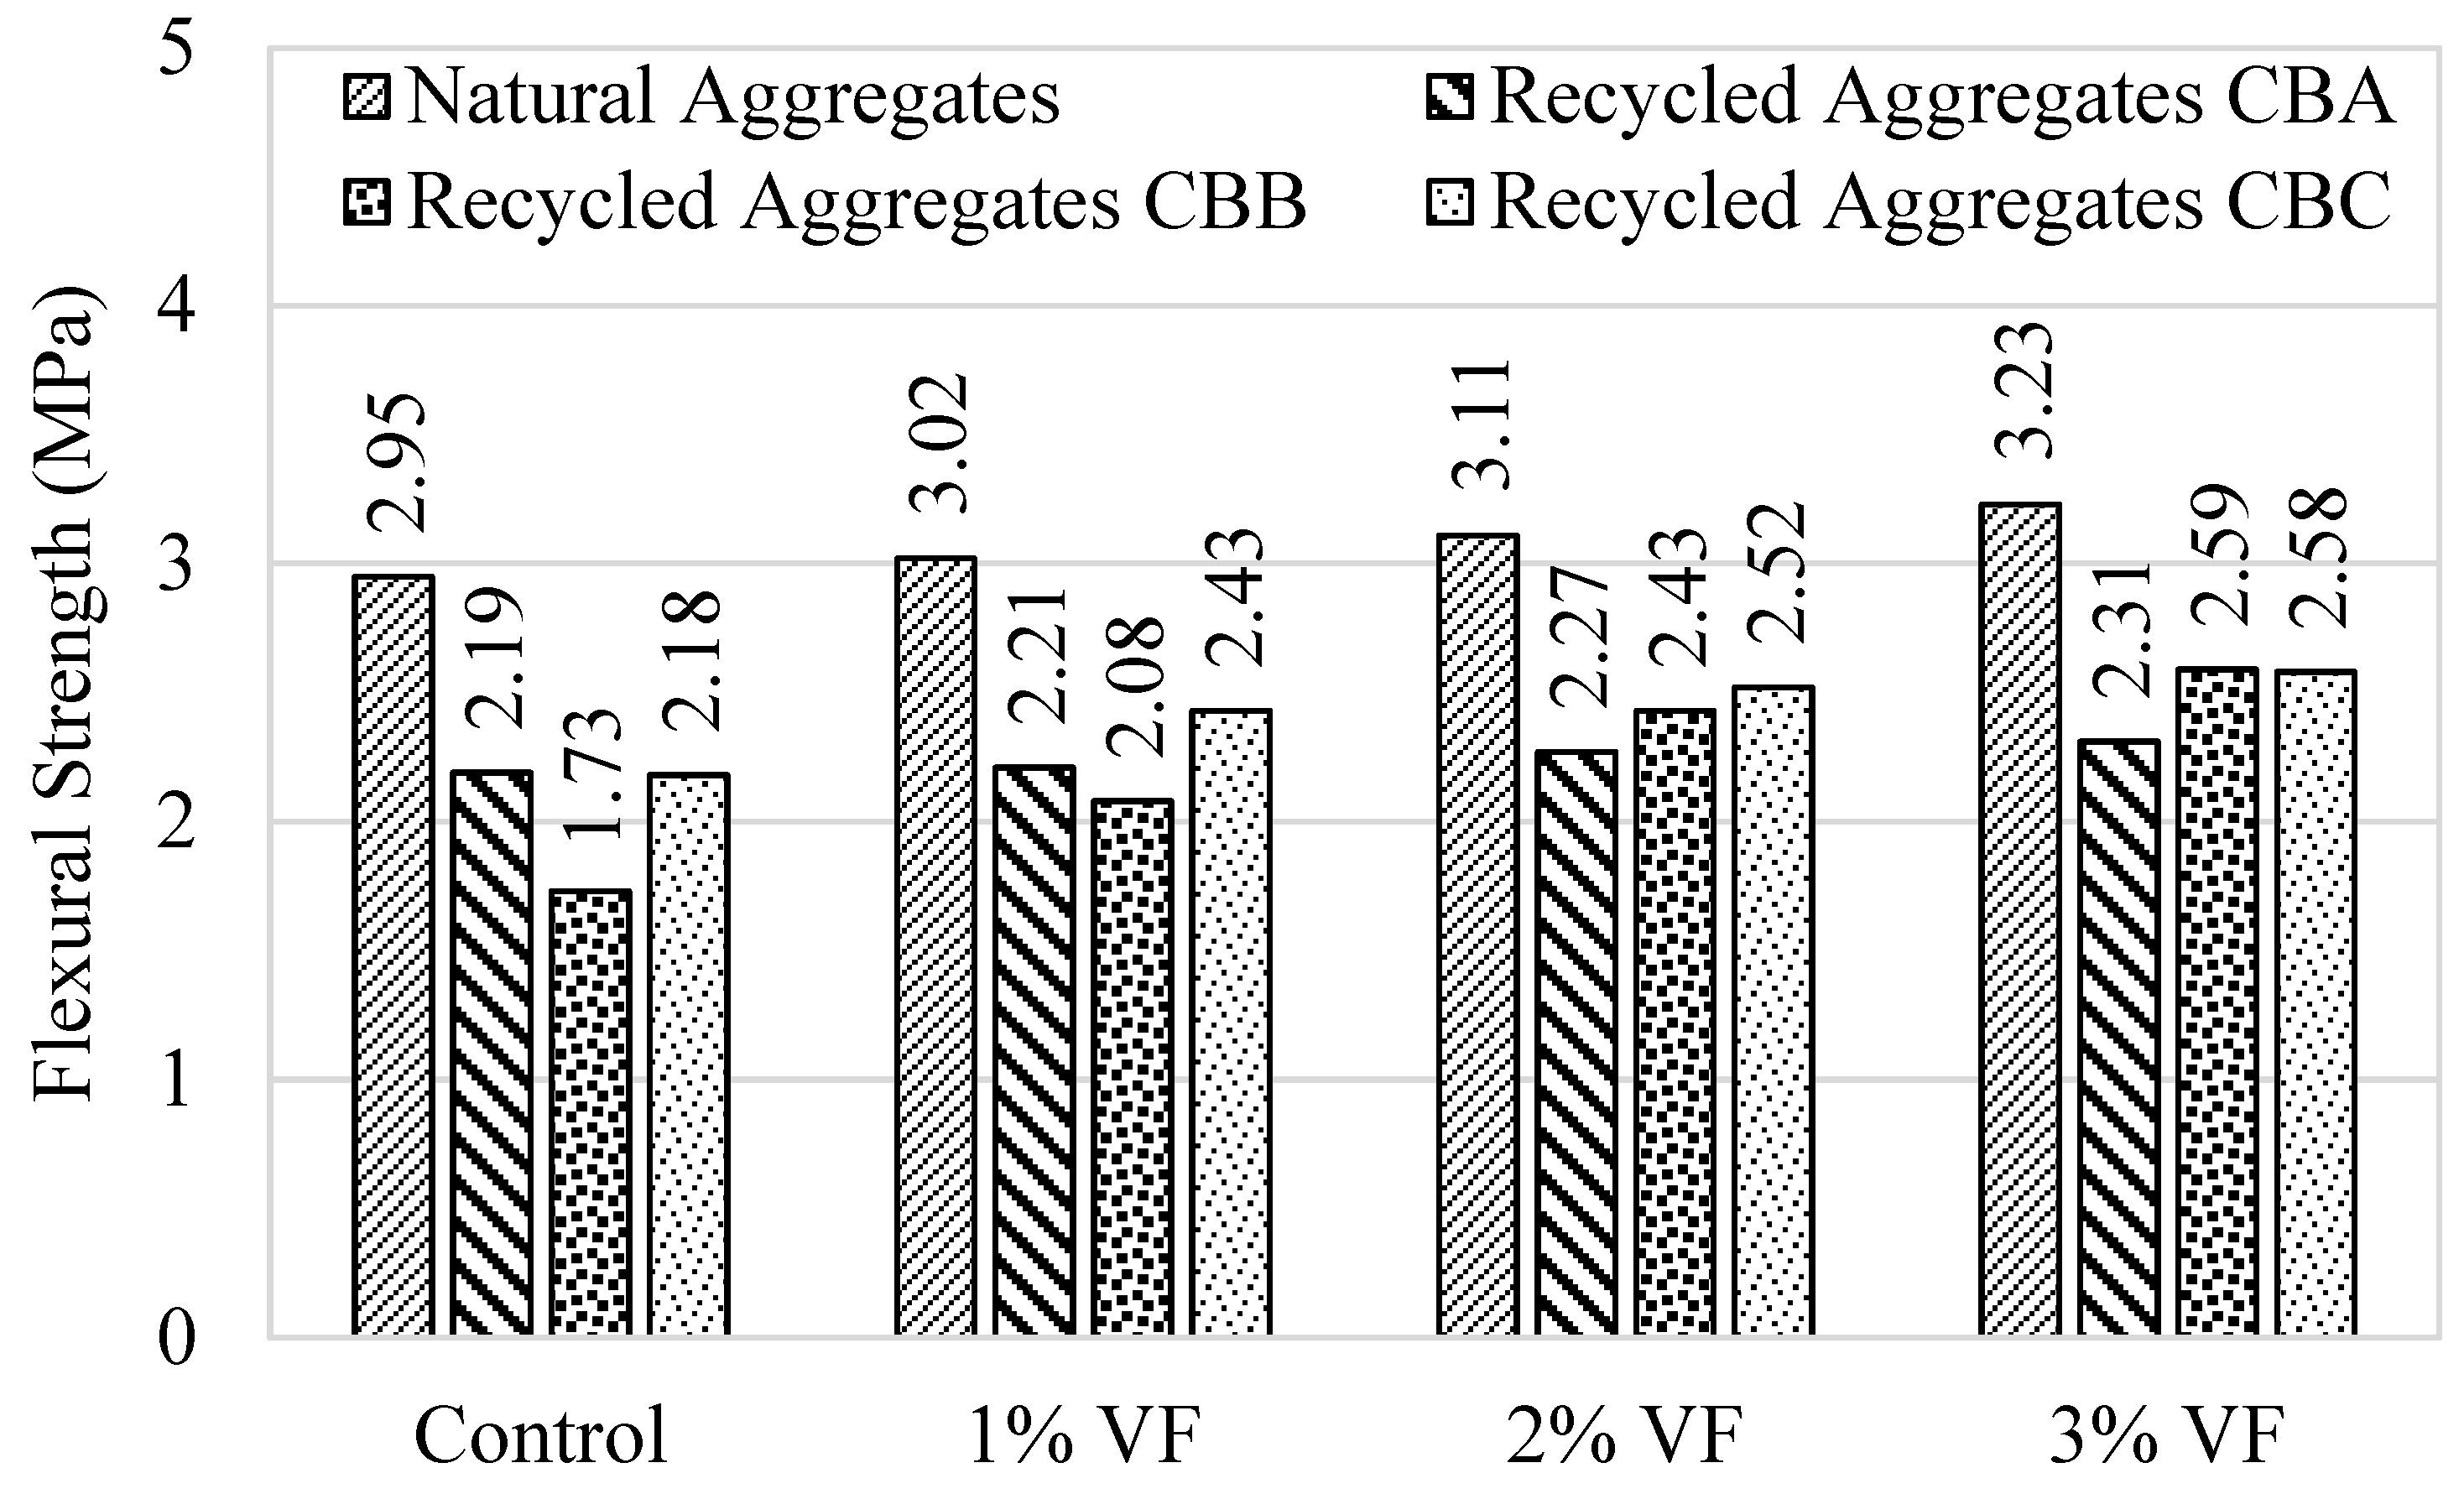
Figure 11 presents a comparison of the flexural strength of the specimens in all the groups. In the figure, VF represents the volume fraction of steel fibers. Like the splitting tensile strength, the highest flexural strength was witnessed in group 1 specimens, and the addition of recycled brick aggregates reduced the flexural strength. For example, for 2% VF, the flexural strength of natural aggregate concrete was 3.11 MPa, followed by 2.52 MPa, 2.43 MPa, and 2.27 MPa for CBC, CBB, and CBA aggregate type concrete, respectively. Unlike the splitting tensile strength, no clear trend in the flexural strength of the specimens with different recycled aggregates was seen. However, the specimens in all the groups still showed an enhancement in their flexural strengths as the volume fraction of steel fibers increased.
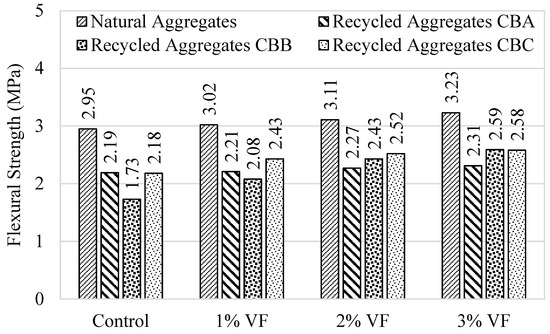
Figure 11.
Comparison of flexural strength.
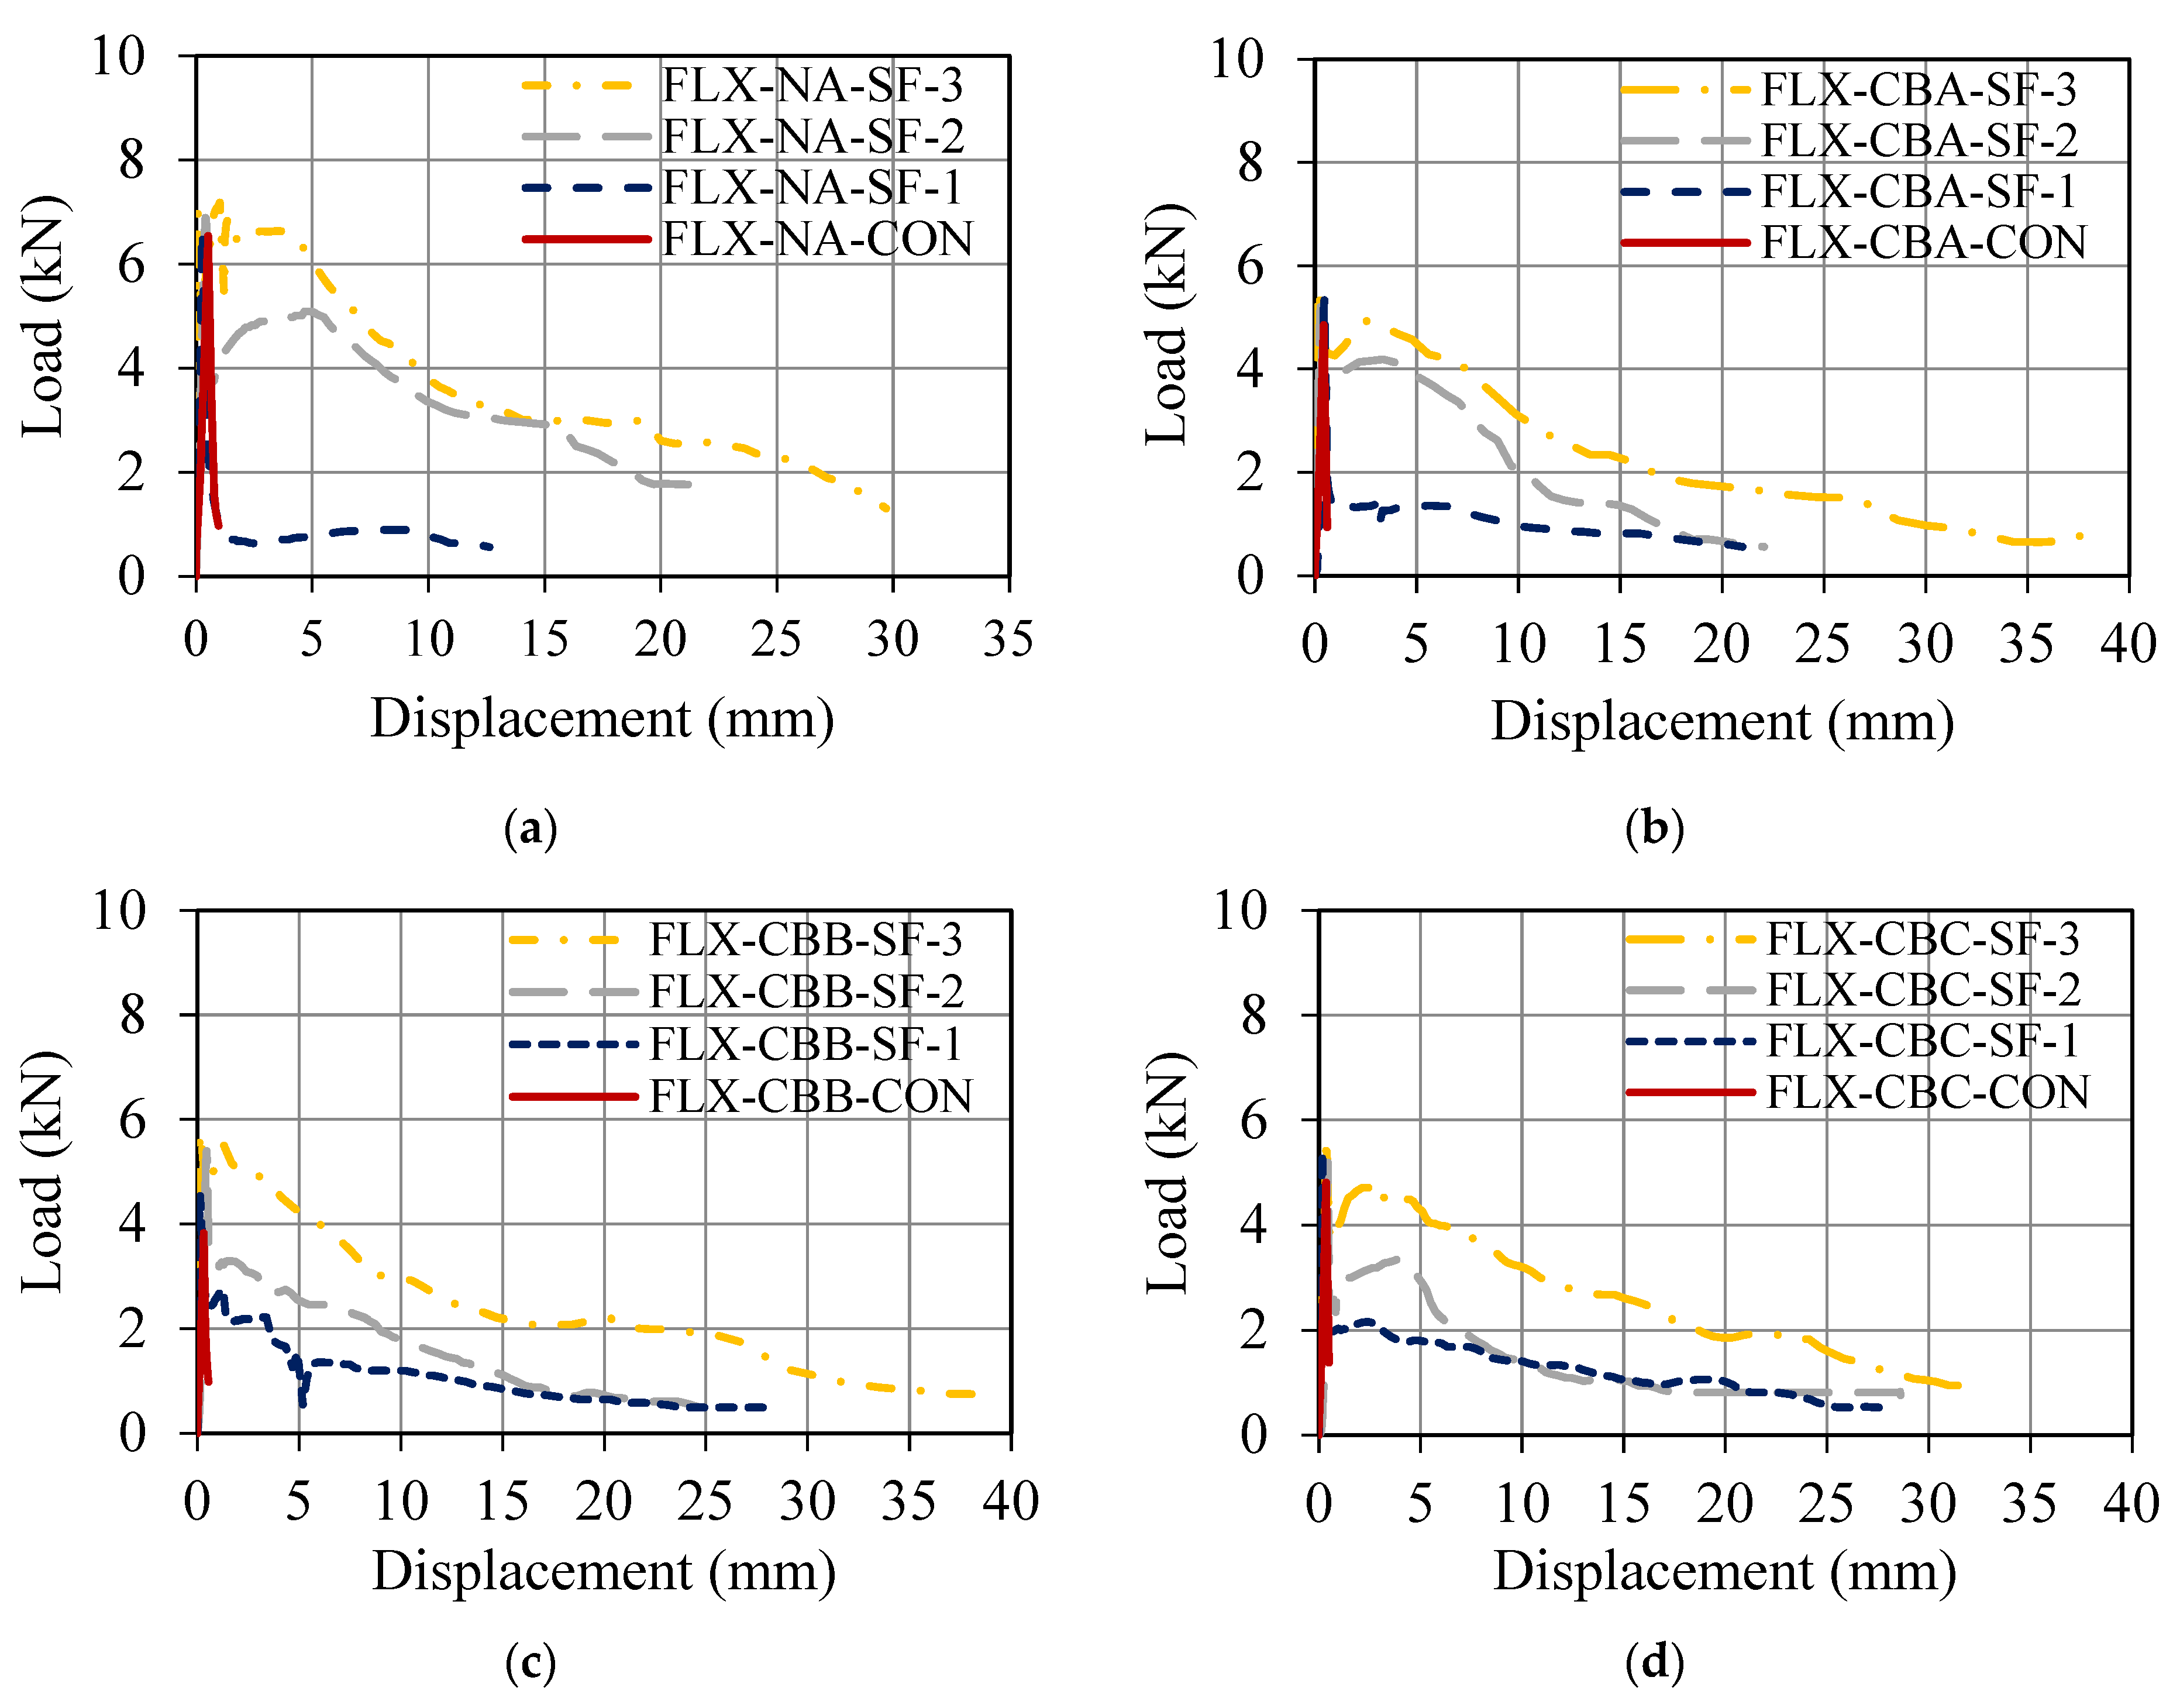
The load applied on the flexural specimens was continuously monitored by using a load cell in addition to the measured vertical displacement. The load–displacement curves for the flexural specimens are depicted in Figure 12. It is important to mention that the control flexural specimens in all the groups did not indicate any ductility and demonstrated an abrupt drop in the flexural strength after reaching the peak load. The addition of 1% volume fraction of steel fibers did not impart any noticeable ductility. However, a substantial improvement in the ductility was witnessed for 2% and 3% volume fractions of steel fibers. Further, the rate of the post-peak flexural strength degradation was reduced as the volume fraction of steel fibers increased. This observation was consistent irrespective of the presence or the type of recycled brick aggregates. Another important observation was that the specimens with 2% or 3% volume fraction of steel fibers displayed a slight drop in the peak flexural strength. Nevertheless, these specimens were able to regain the flexural strength after the initial drop. This can be attributed to steel fibers that effectively bridged the initial flexural cracks and helped RAC exhibit improved ductility.
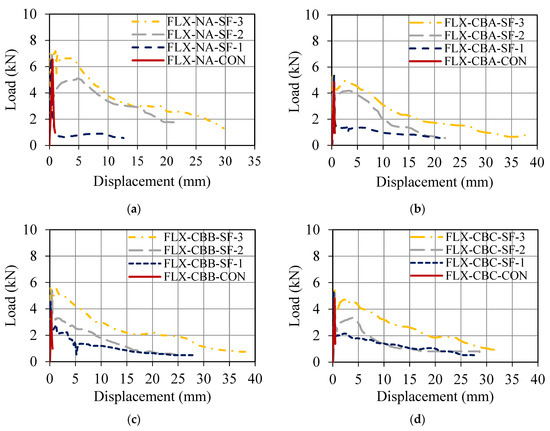
Figure 12.
Flexural load–displacement curves for: (a) group 1, (b) group 2, (c) group 3, and (d) group 4 specimens.
A summary of the flexural strength and energy dissipation results is presented in Table 4. Group 3 specimens provided the highest enhancement in the flexural strength, followed by group 4 and group 2 specimens, respectively. The energy dissipation values were achieved by calculating the area under the flexural load–displacement curves of the specimens. The increase in the energy dissipation was more pronounced than the increase in the flexural strength. It can be noted that up to 8765.69% increase in the energy dissipation was observed in group 3 specimens, whereas the increase in the energy dissipation of group 2 and group 4 specimens was 5823.61% and 6748.36%, respectively. Finally, the improvement in the flexural ductility was least prominent in the case of group 1 specimens.
Table 4.
Flexural strength and corresponding energy dissipation values.
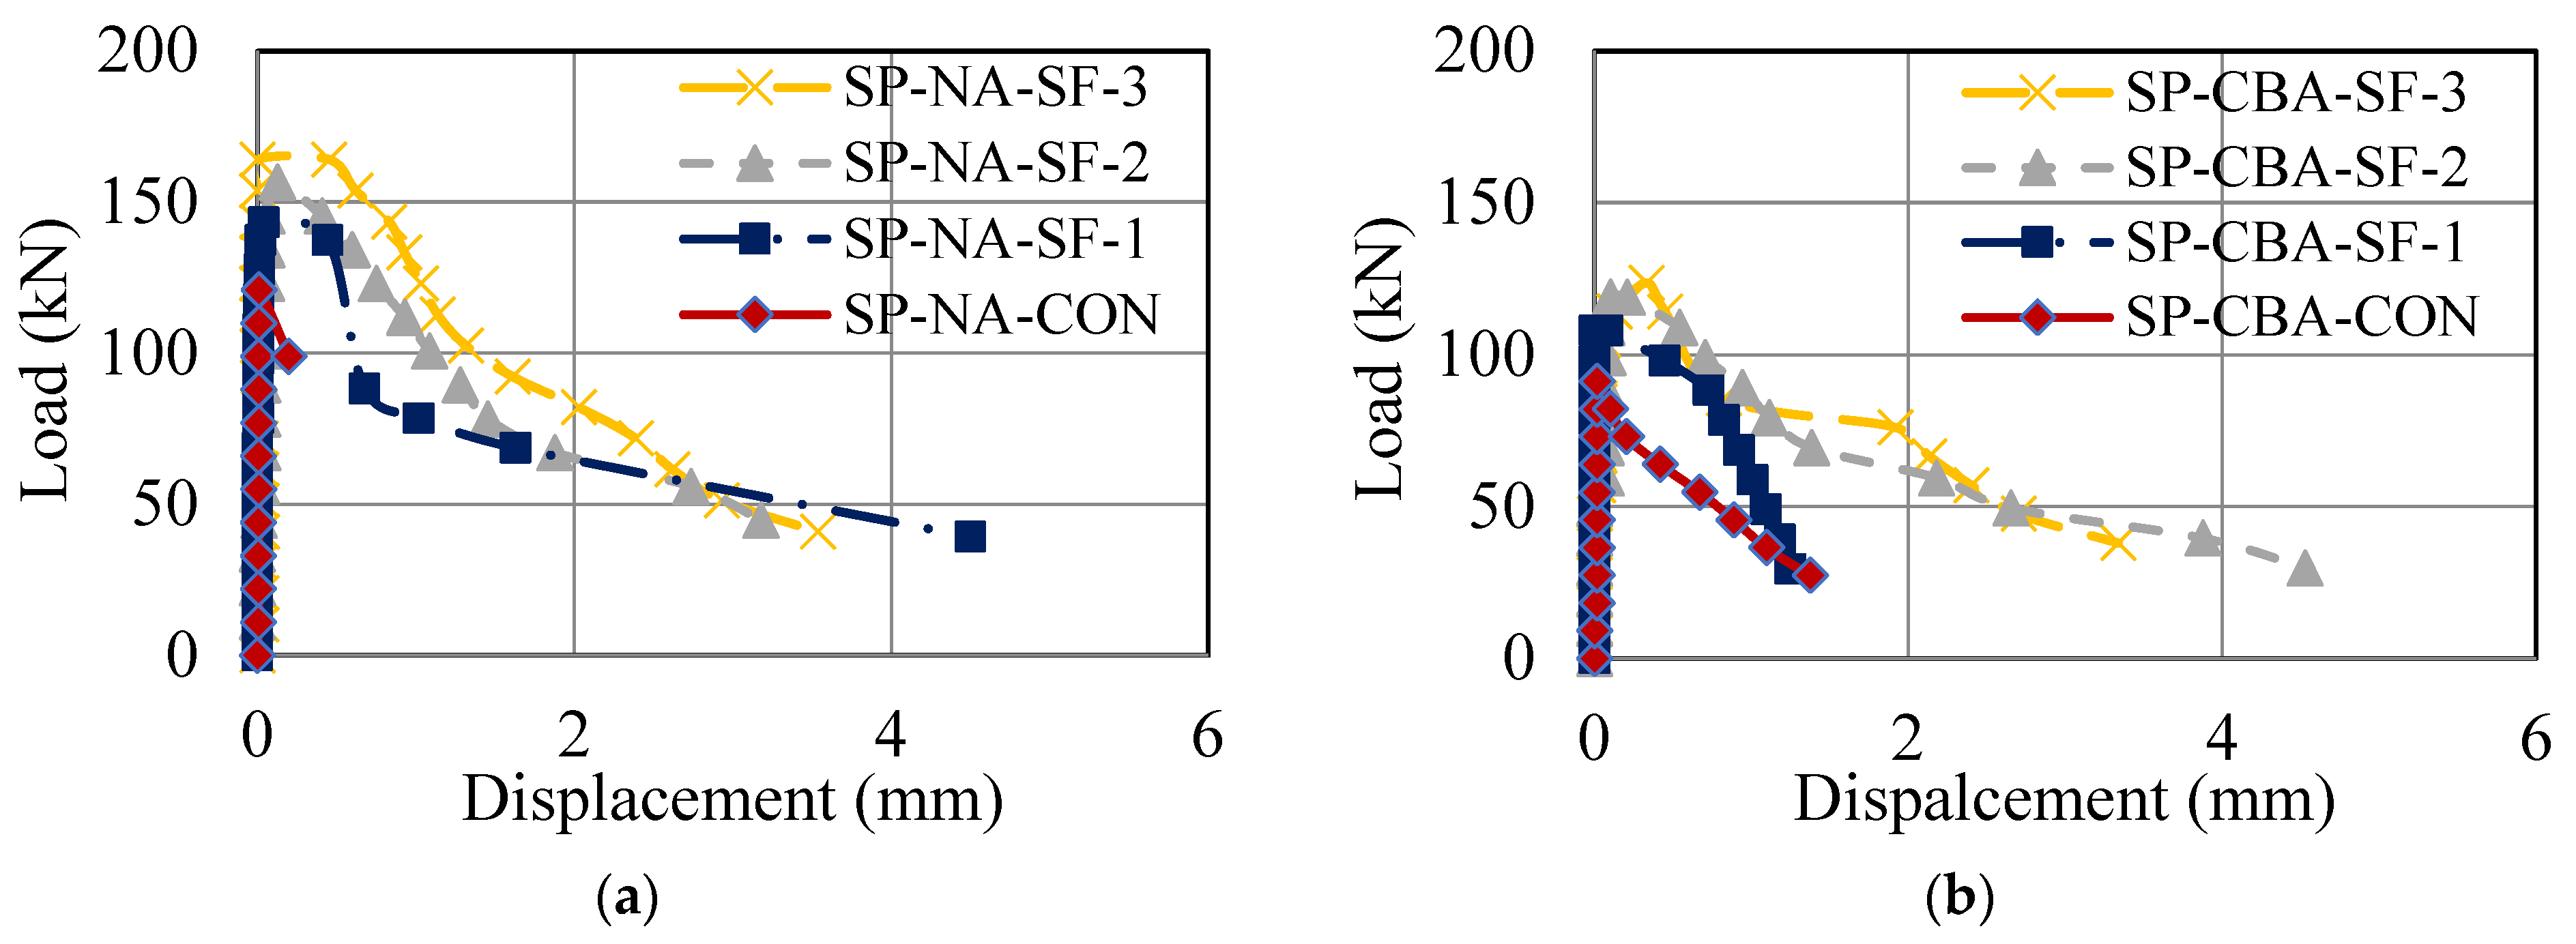
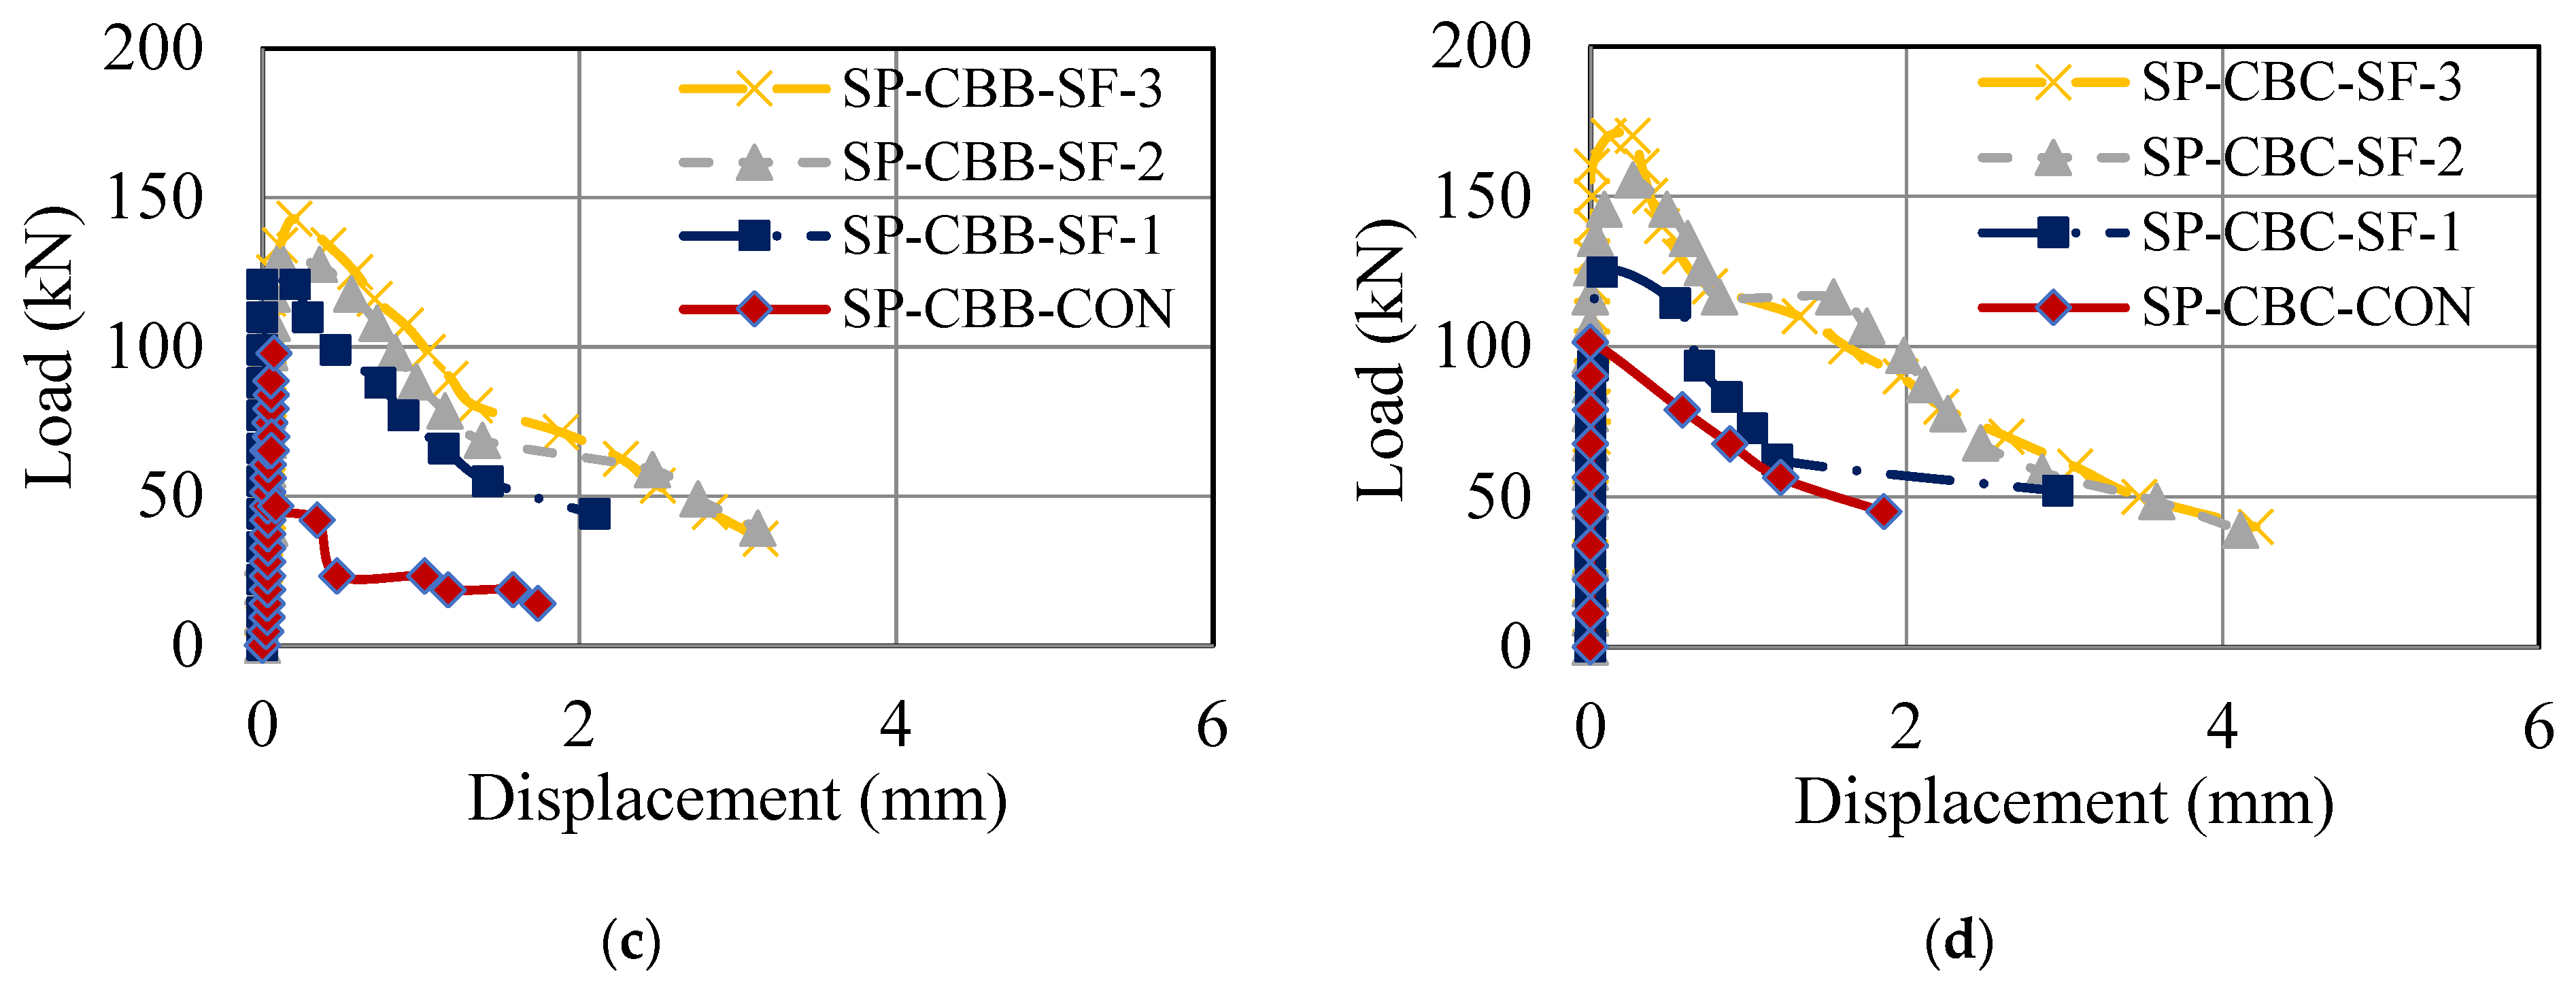
In a similar way, the load–displacement curves corresponding to the splitting tensile tests are illustrated in Figure 13. Like the flexural load–displacement curves, the splitting tensile load–displacement responses also indicated an increased ductility as the volume fraction of steel fibers increased. Generally, the maximum ductility was observed, corresponding to 3% volume fraction of steel fibers. The increase in the energy dissipation was more significant than the increase in the splitting tensile strength (Table 5). It can be mentioned that up to 477.85% enhancement in the energy dissipation was seen in group 3 specimens, while the enhancement in the energy dissipation of group 2 and group 4 specimens was 242.54% and 195.76%, respectively.

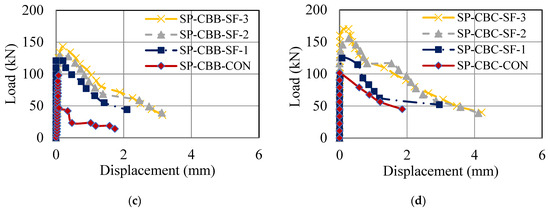
Figure 13.
Splitting tensile load–displacement curves for: (a) group 1, (b) group 2, (c) group 3, and (d) group 4 specimens.
Table 5.
Splitting tensile strength and corresponding energy dissipation values.
3.3. Peak Compressive Strength
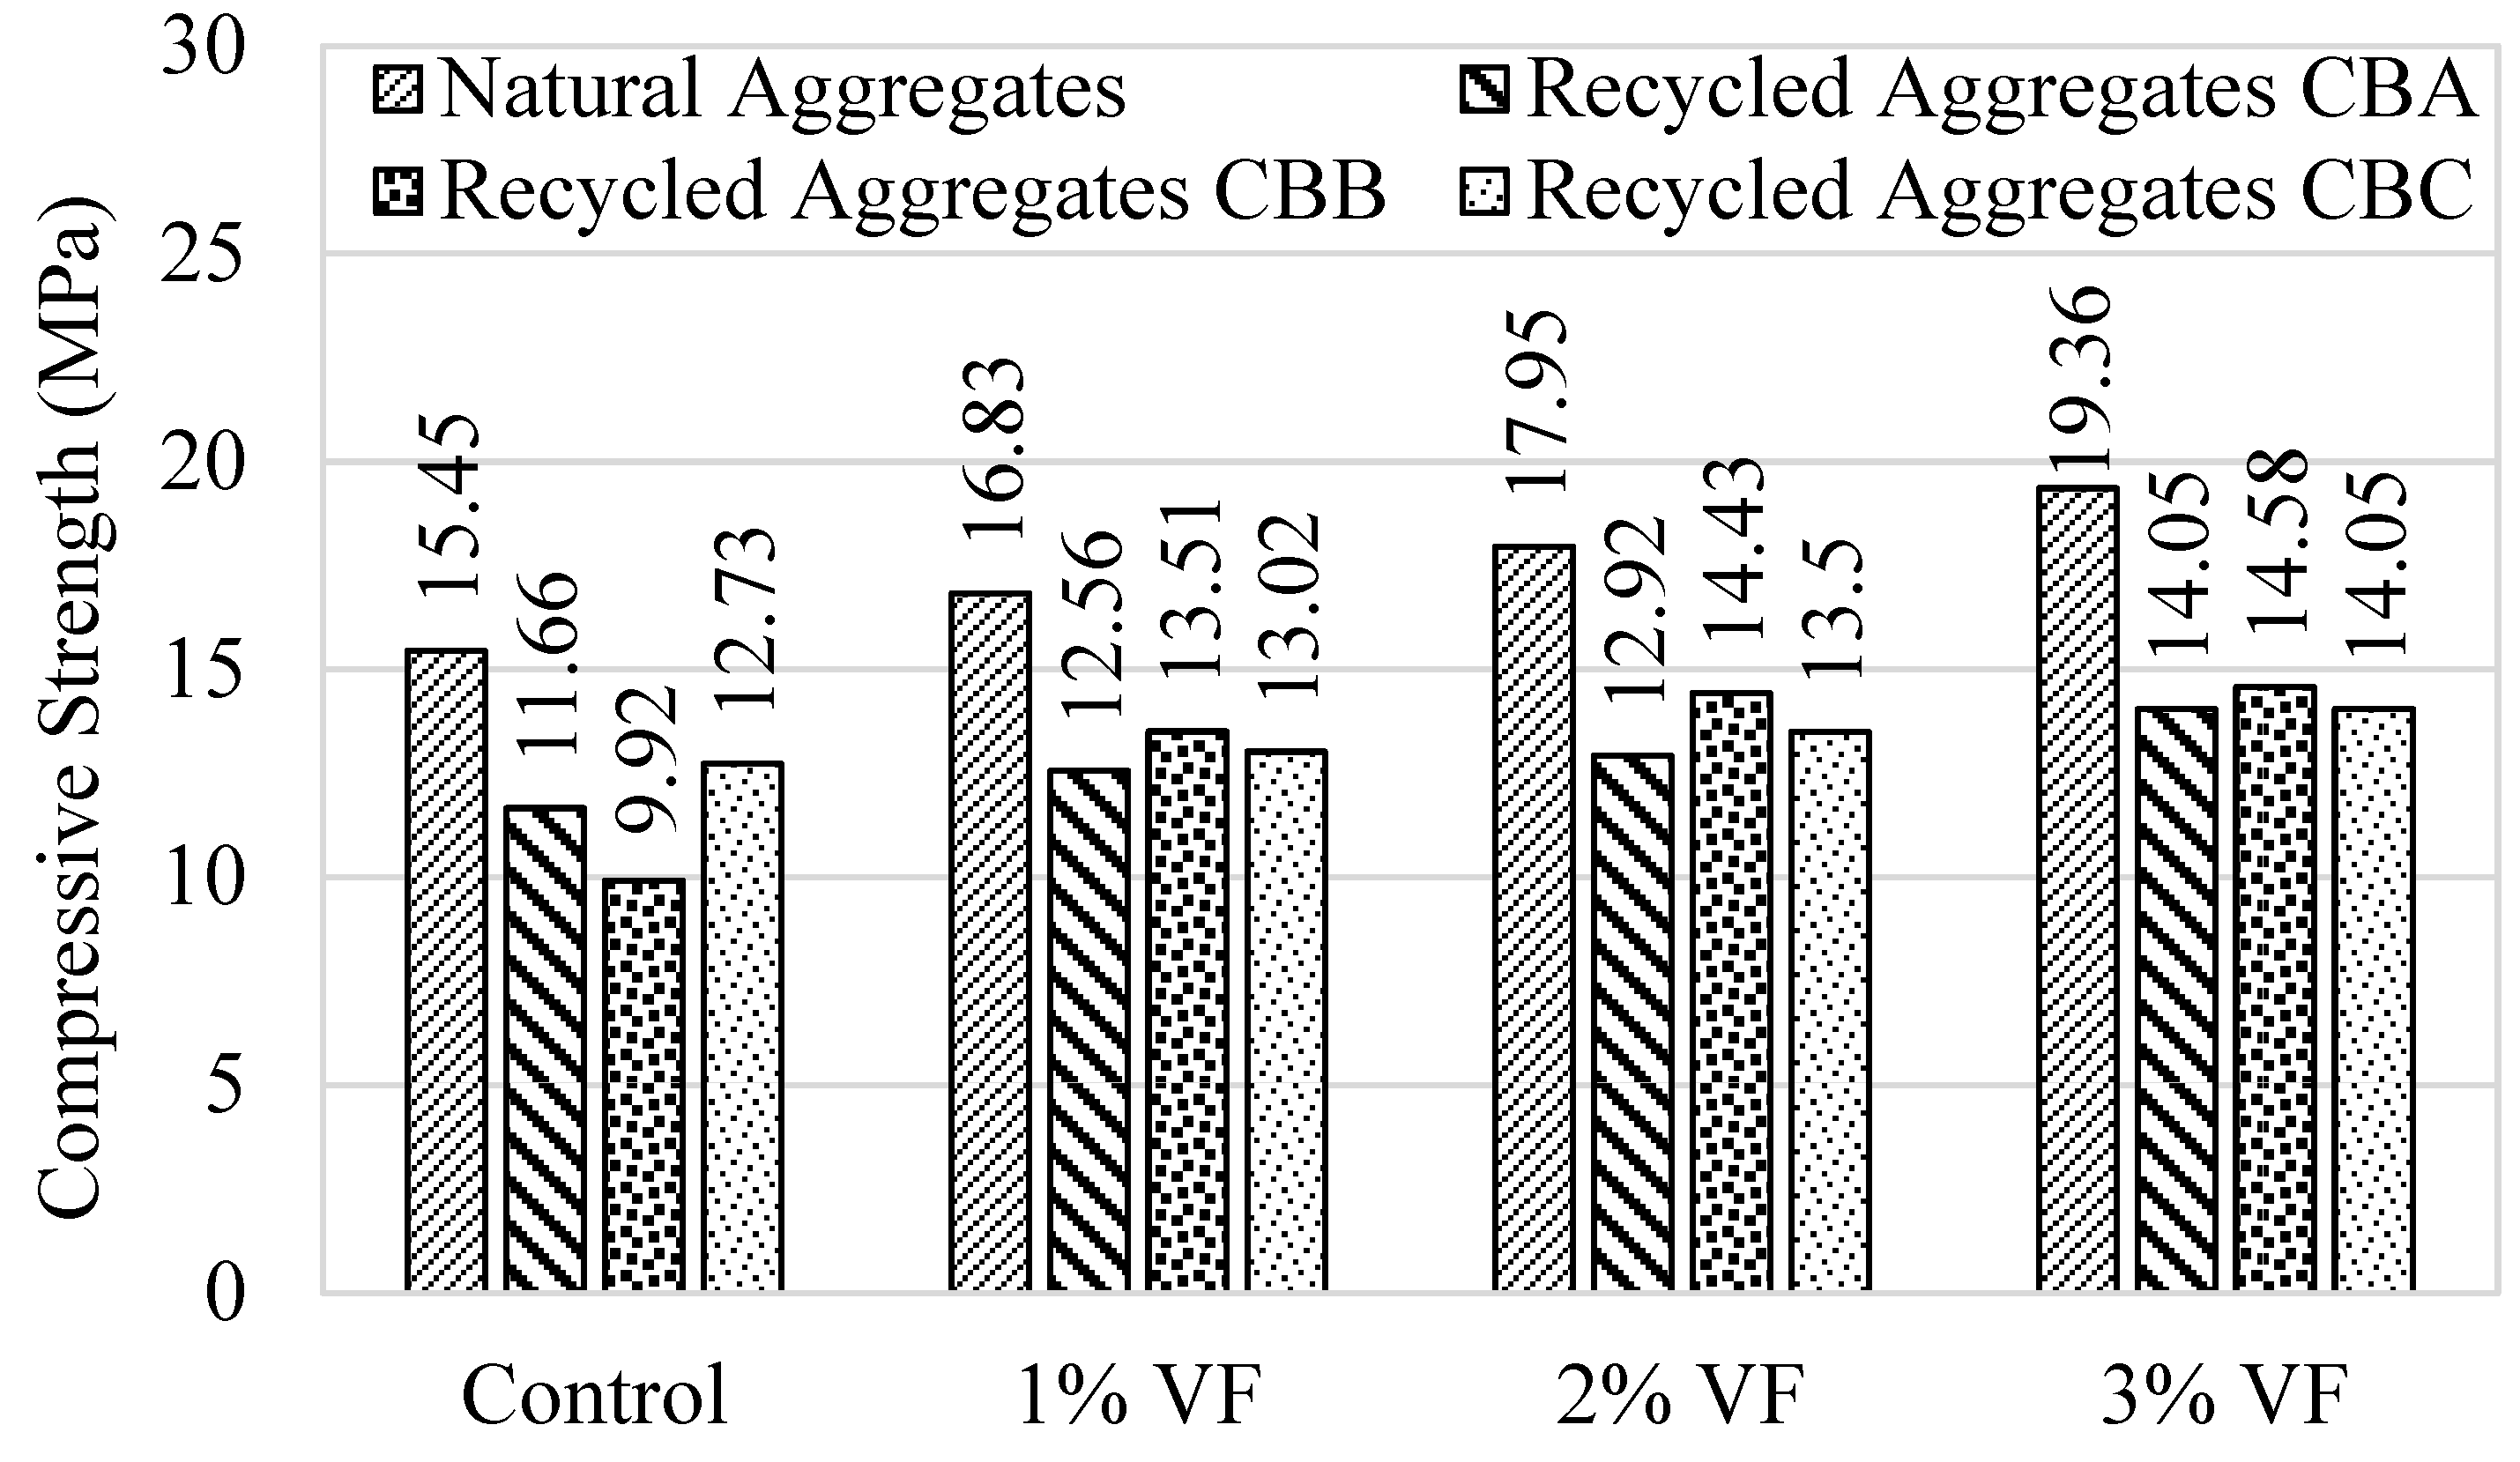
Figure 14 shows a comparison of the peak compressive strength of the specimens in all the groups. In the figure, VF designates the volume fraction of steel fibers. It is evident that the effect of recycled aggregates on the peak compressive strength was highest in the case of solid fired-clay bricks (i.e., group 2). The addition of steel fibers increased the peak compressive strength in all the groups. However, this increase was maximum in the case of group 2 specimens for all the volume fractions of steel fibers. However, steel fibers could not improve the peak compressive strength of RAC to the value that corresponded to natural aggregate concrete. For instance, for 1% VF, the compressive strength of natural aggregate concrete was 16.83 MPa, followed by 13.51 MPa, 13.02 MPa, and 12.56 MPa for CBB, CBC, and CBA aggregate type concrete, respectively.
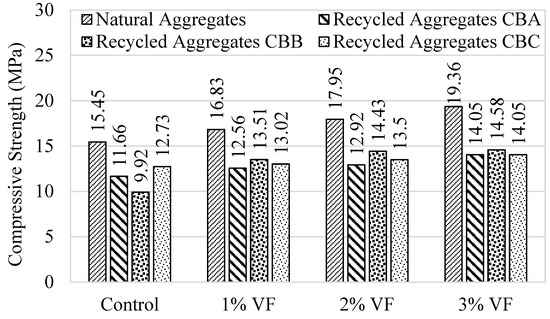
Figure 14.
Comparison of peak compressive strength.
3.4. Compressive Stress–Strain Curves
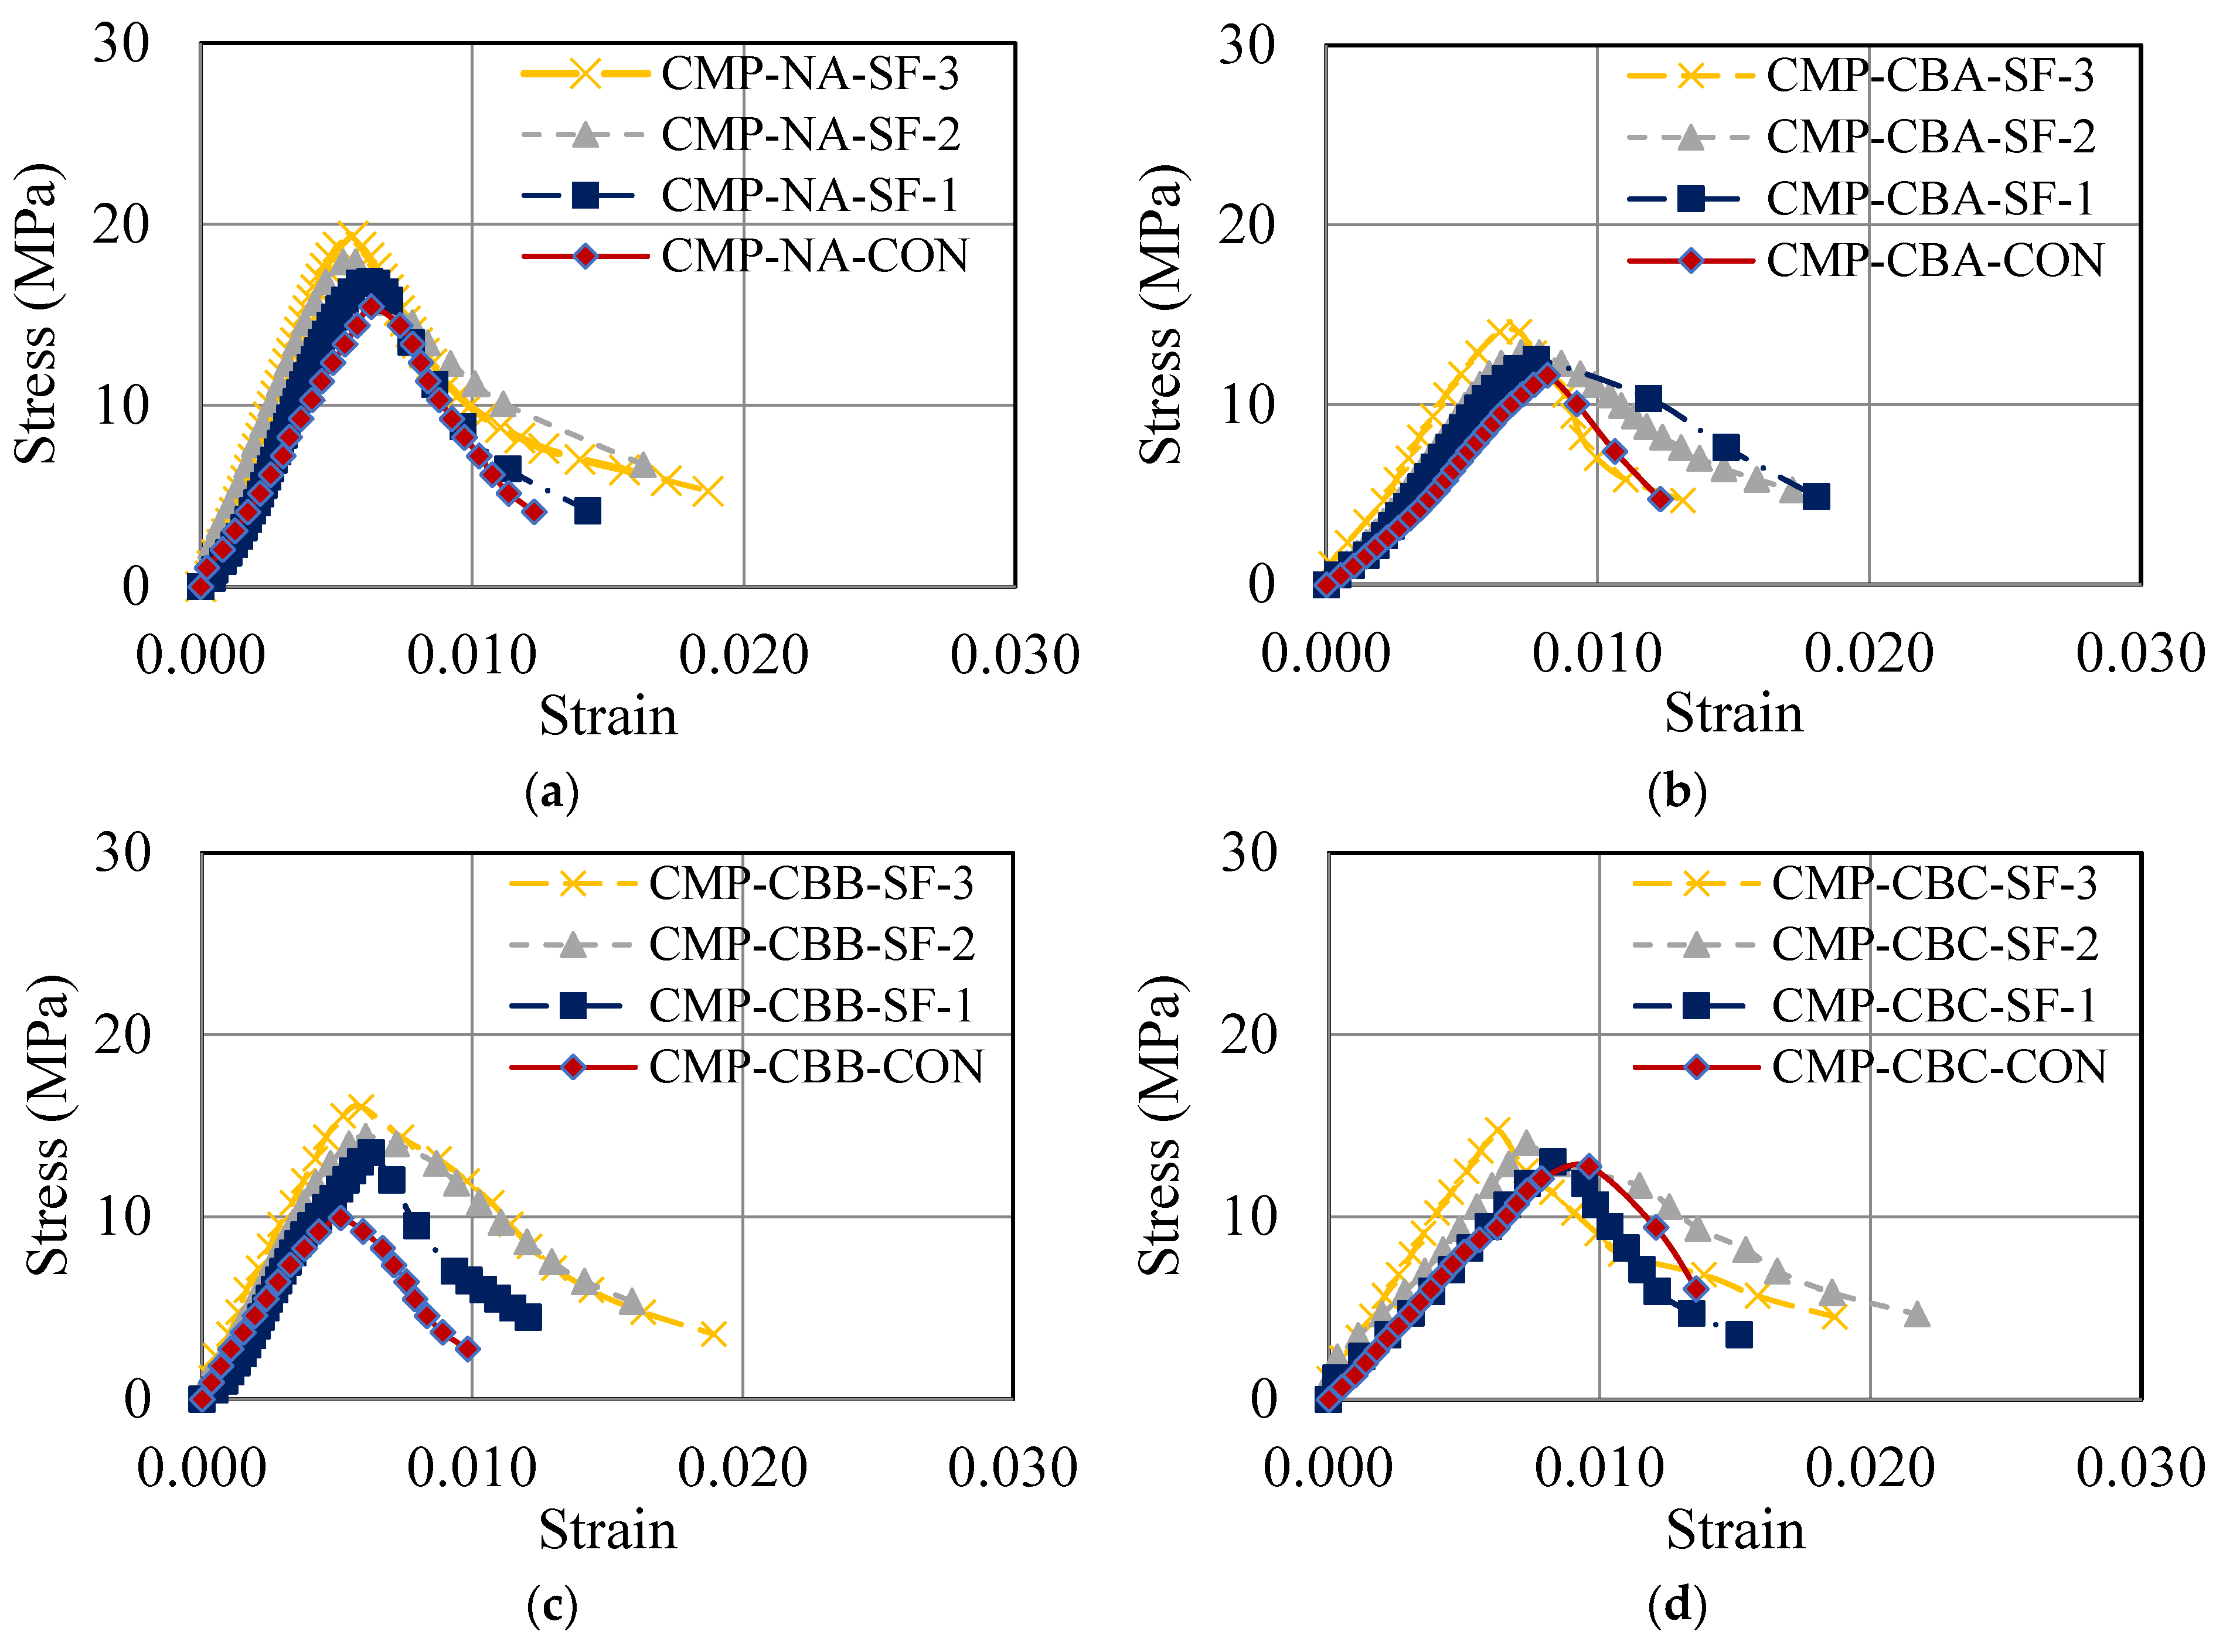
The measured compressive stress–strain curves are depicted in Figure 15. The effect of steel fibers on the compressive stress–strain curves can be observed in the form of the elastic modulus as well as the peak compressive strength. Clearly, a greater volume fraction of steel fibers resulted in an increased elastic modulus of concrete, irrespective of the presence and type of recycled brick aggregates. Similarly, an increased volume fraction of steel fibers led to higher peak compressive strength.
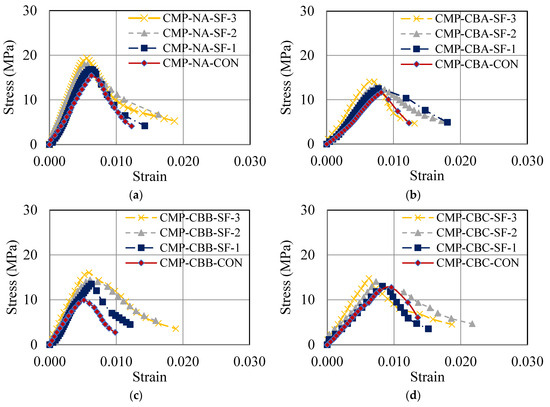
Figure 15.
Compressive stress–strain curves for: (a) group 1, (b) group 2, (c) group 3, and (d) group 4 specimens.
Table 6 summarizes the peak compressive strength, peak compressive strain, and elastic modulus values. An increase of 24.52%, 20.51%, 61.62%, and 15.62% in the peak compressive strength was obtained for 3% volume fraction of steel fibers in groups 1, 2, 3, and 4, respectively. The increase in the elastic modulus for 3% volume fraction of steel fibers in groups 1, 2, 3, and 4 was 52.71%, 85.21%, 58.65%, and 57.41%, respectively.
Table 6.
Peak compressive strength, peak compressive strain, and elastic modulus values.
4. Analytical Modeling
The knowledge of concrete parameters such as the compressive strength and strain is essential to perform structural modeling. It was observed that RBAC possessed substandard compressive strength, and its elastic modulus, as well as the post-peak modulus, were dependent on the volume fraction of steel fibers. The following subsections present individual regression models for each of these parameters by considering the volume fraction of steel fibers and the type of recycled brick aggregates.
4.1. Peak Compressive Strength
It was resulted in Section 3 that the peak compressive strength, , of RBAC improved as the volume fraction of steel fibers increased. However, the increase in the peak compressive strength was not consistent for different recycled brick aggregates. Therefore, it was found necessary to include both the volume fraction of steel fibers and the compressive strength of recycled bricks in the regression model as explanatory variables. Nonlinear regression was performed by solving nonlinear least squares with the Gauss–Newton algorithm. The initial values of all regression constants were taken as 1.0. The following equation led to a good coefficient of determination, , i.e., 0.96. In the past, the peak compressive strength was found to be closely related to the peak compressive strength of unconfined concrete and the amount of external confinement [47,48,49]. Consequently, by following the analogy, Equation (1) was proposed.
where is the peak compressive strength of strengthened RBAC, is the peak compressive strength of unstrengthened RBAC, is the compressive strength of recycled bricks, and is the volume fraction of steel fibers. The performance of Equation (1) in predicting the peak compressive strength, , is displayed in Figure 16. It is evident from the figure that the proposed equation resulted in a good agreement with the experimental results.
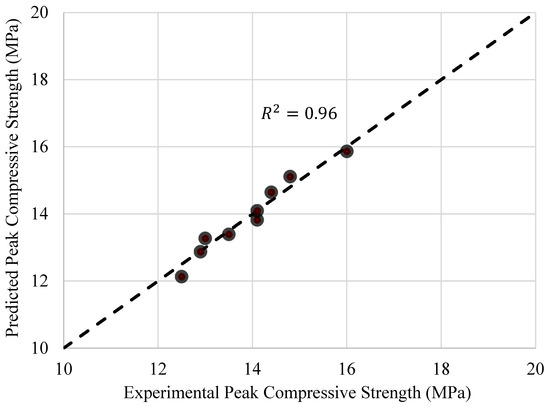
Figure 16.
Comparison of experimental and predicted peak compressive strength.
4.2. Elastic Modulus
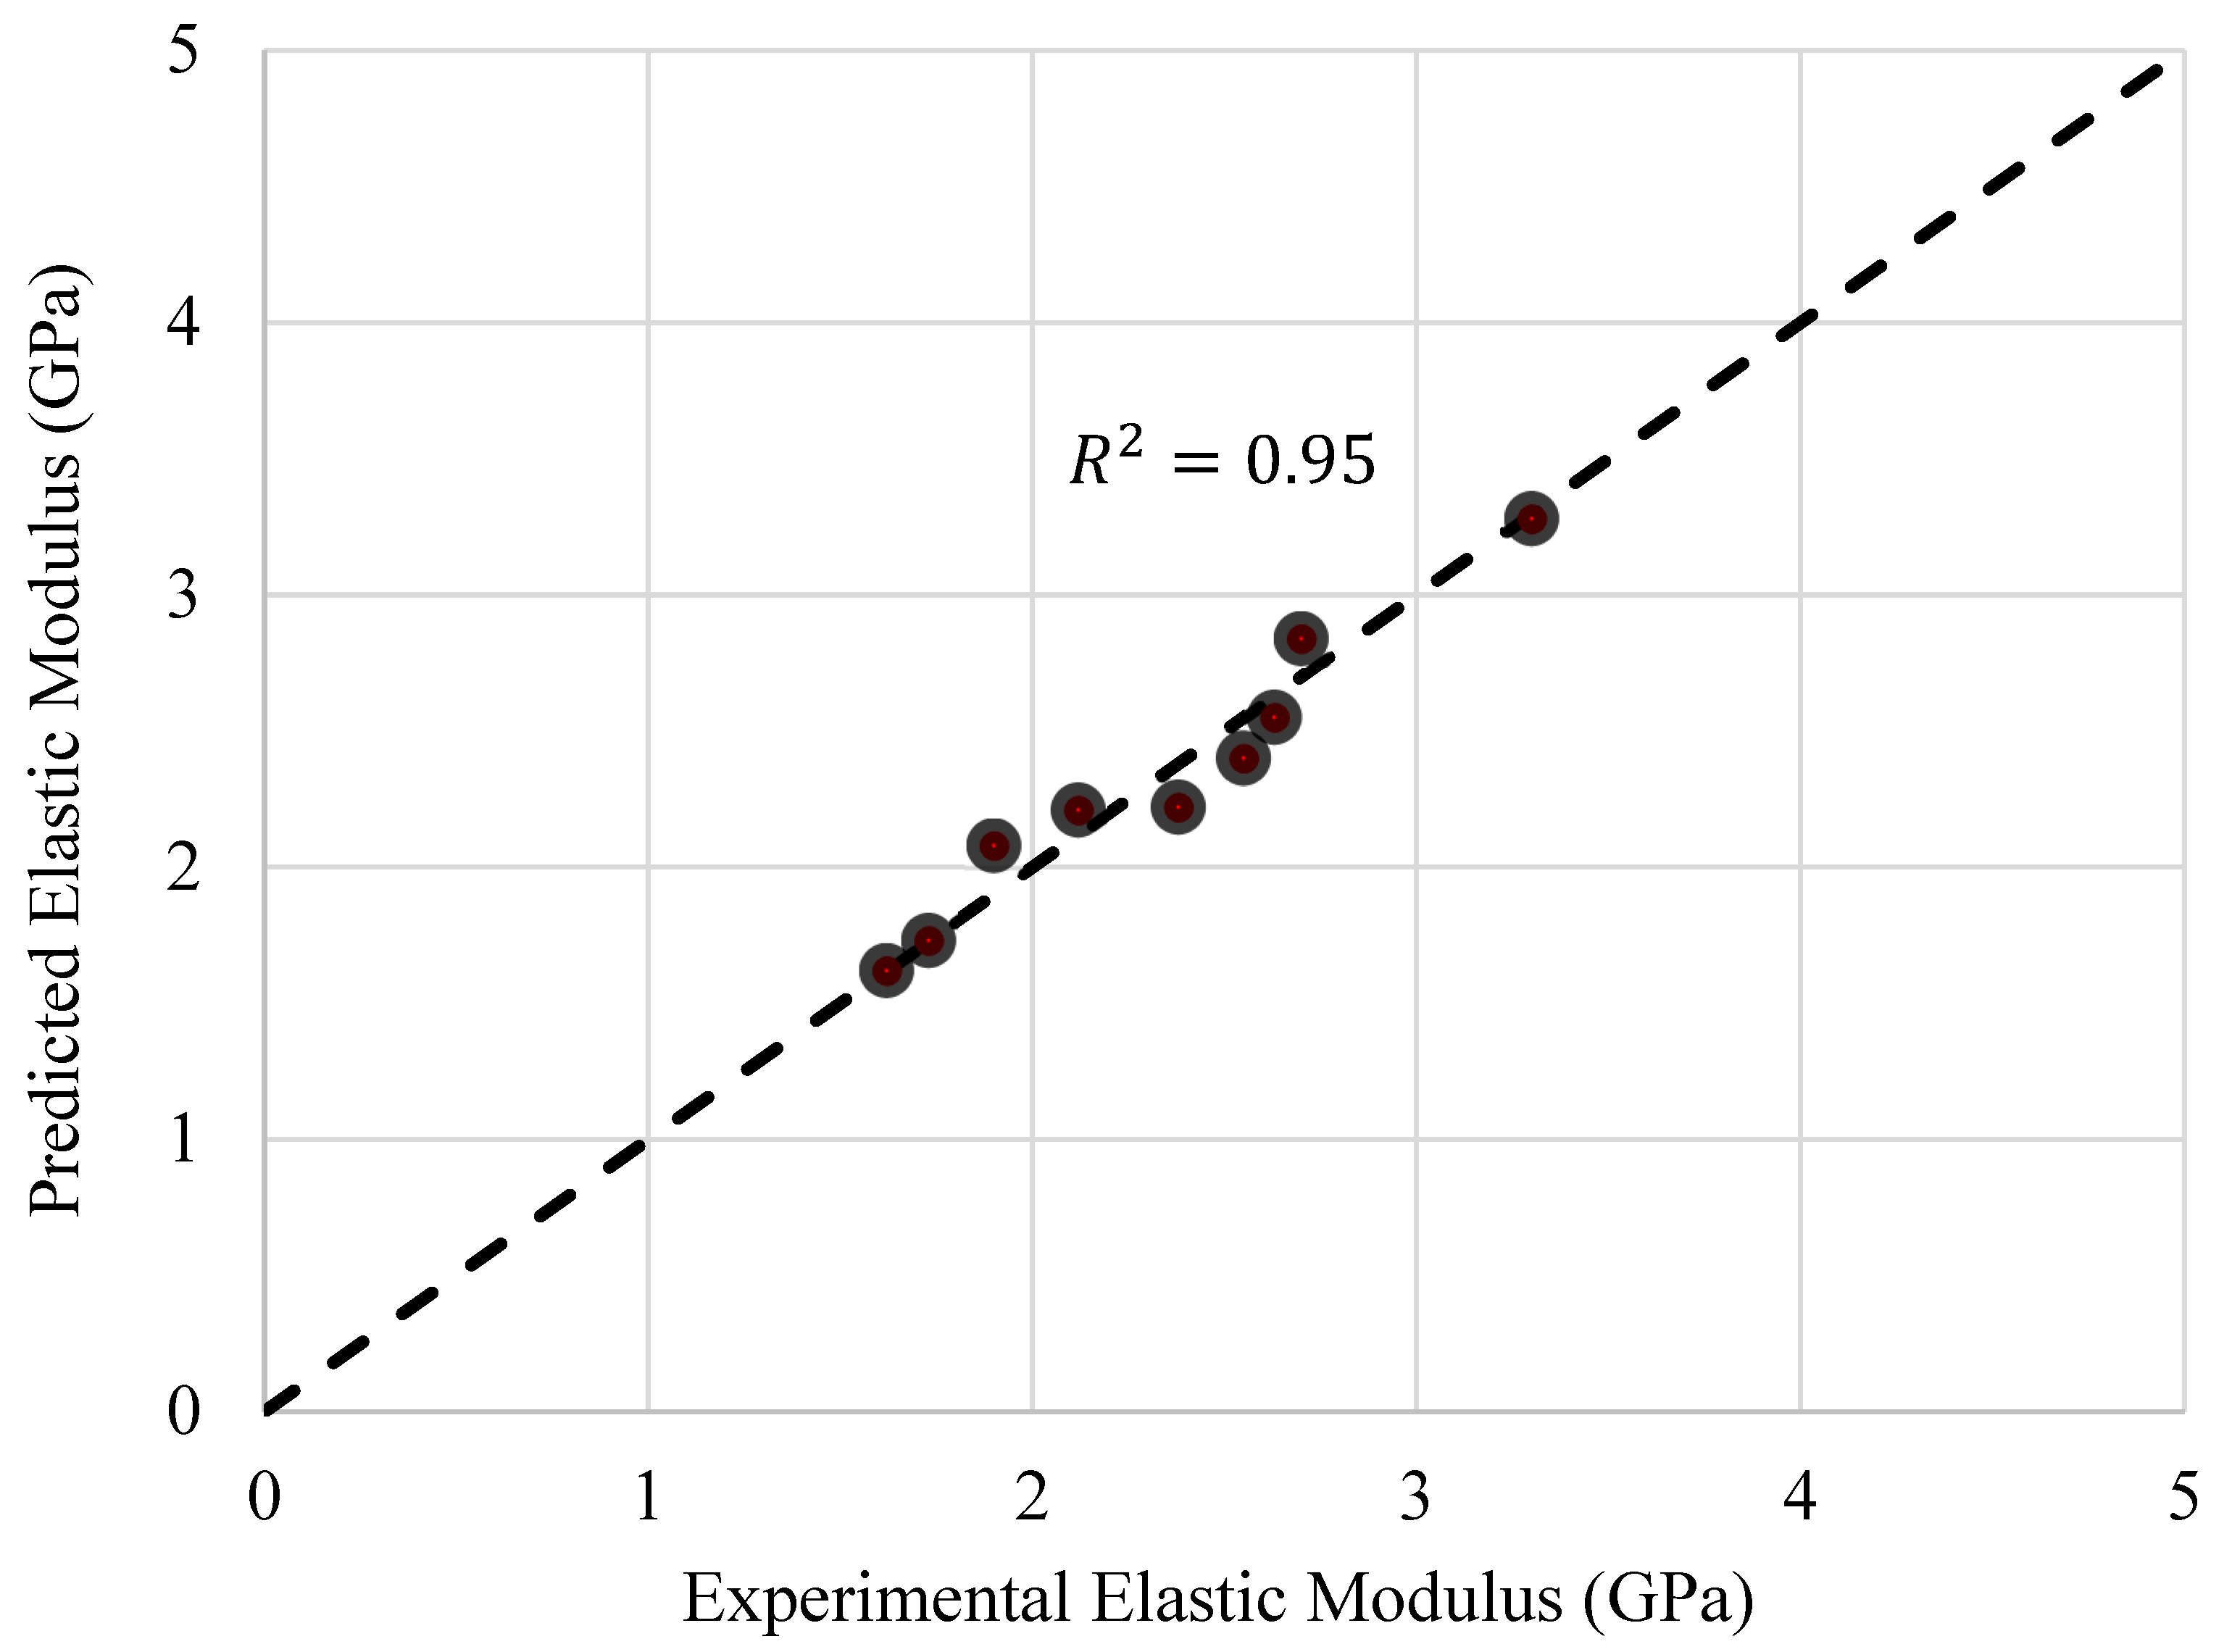
According to Table 6, the elastic modulus, , of RBAC enhanced as the volume fraction of steel fibers increased. Like the peak compressive strength, the increase in the elastic modulus was also inconsistent in different groups. Accordingly, the volume fraction of steel fibers and the compressive strength of recycled bricks were considered in the regression model. Equation (2) was found appropriate to predict the elastic modulus of RBAC strengthened with steel fibers.
where is the elastic modulus of RBAC. Figure 17 illustrates the performance of Equation (2) in predicting the elastic modulus of RBAC. An value of 0.95 suggested that Equation (2) achieved a good agreement with the experimental results.
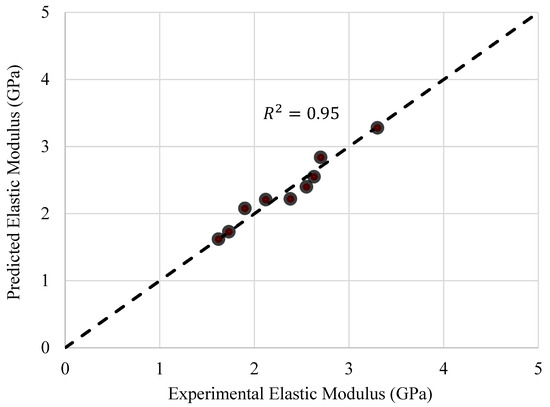
Figure 17.
Comparison of experimental and predicted elastic modulus of RBAC.
4.3. Rate of Post-Peak Modulus
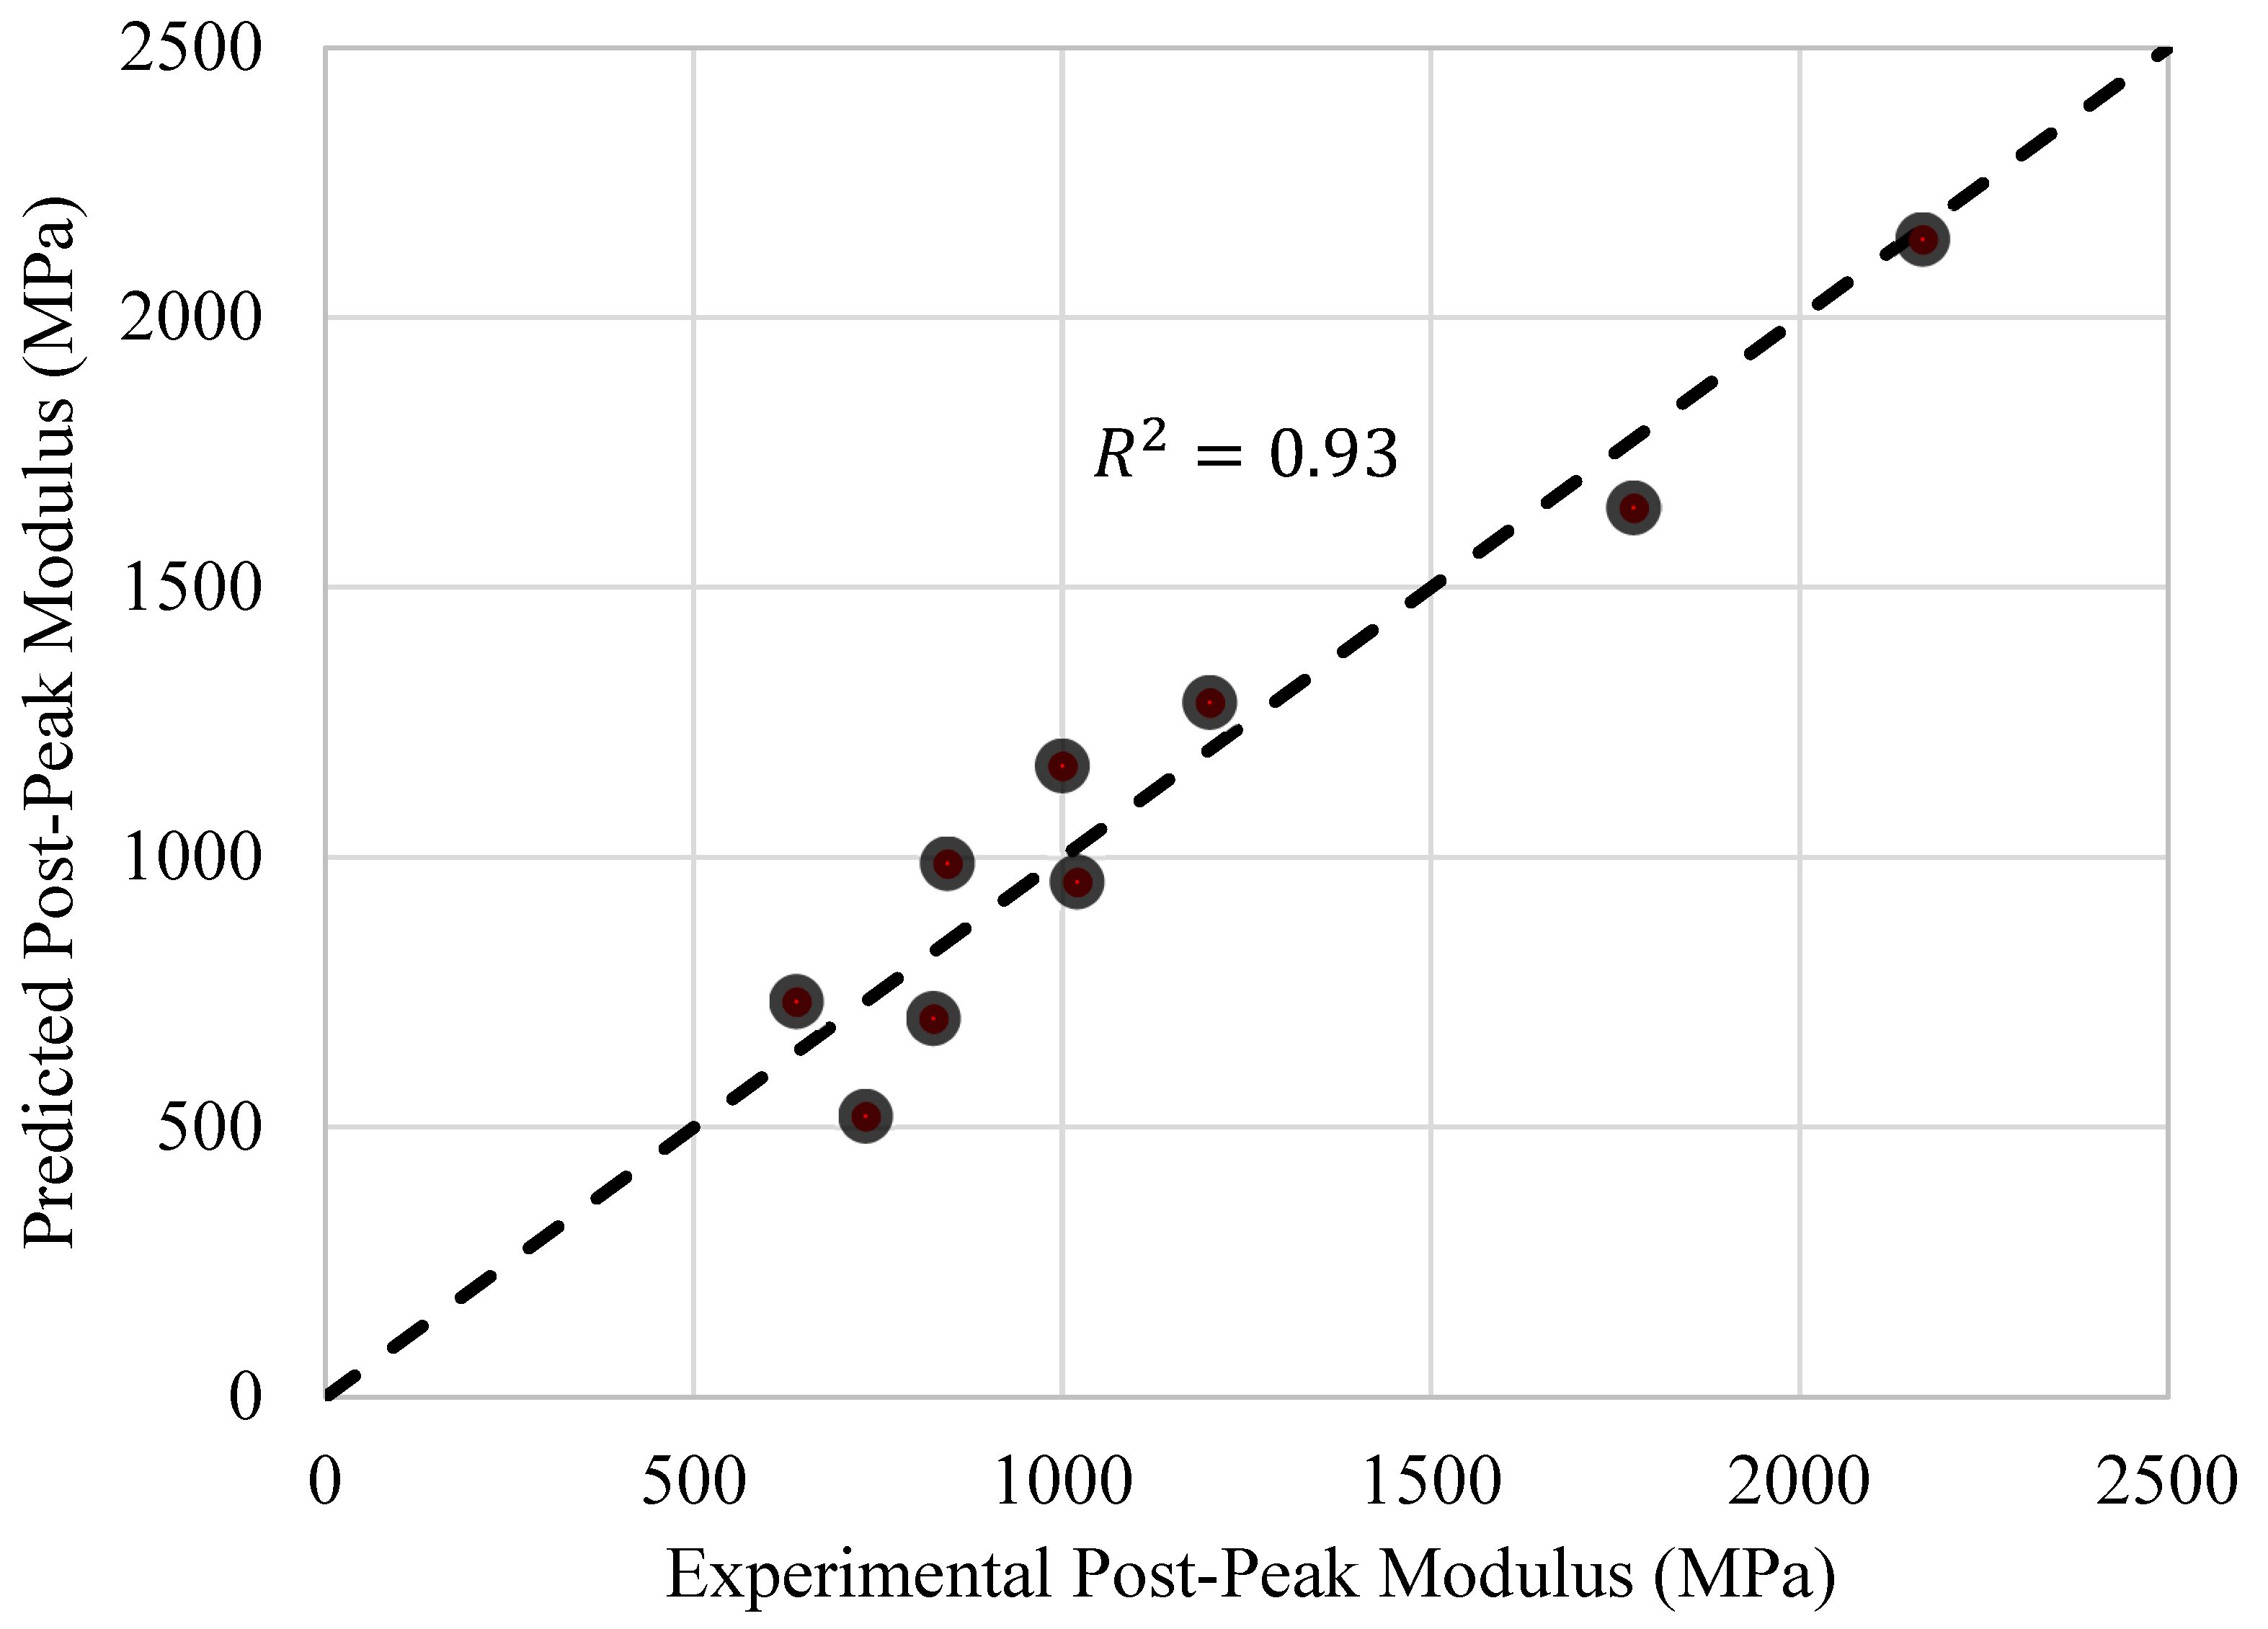
It was observed in Section 3 that the rate of the compressive strength degradation in the post-peak region was dependent on the volume fraction of steel fibers. Since this strength degradation was inconsistent in all the groups, the compressive strength of recycled bricks was also considered in the regression model. The modulus in the post-peak branch of the compressive stress–strain curve was denoted by , and the following equation was proposed.
where is the post-peak modulus. The obtained value of 0.93 in Figure 18 demonstrated a close agreement of the results from using Equation (3) with the experimental results.

Figure 18.
Comparison of experimental and predicted post-peak modulus.
4.4. Strain at Peak Compressive Strength
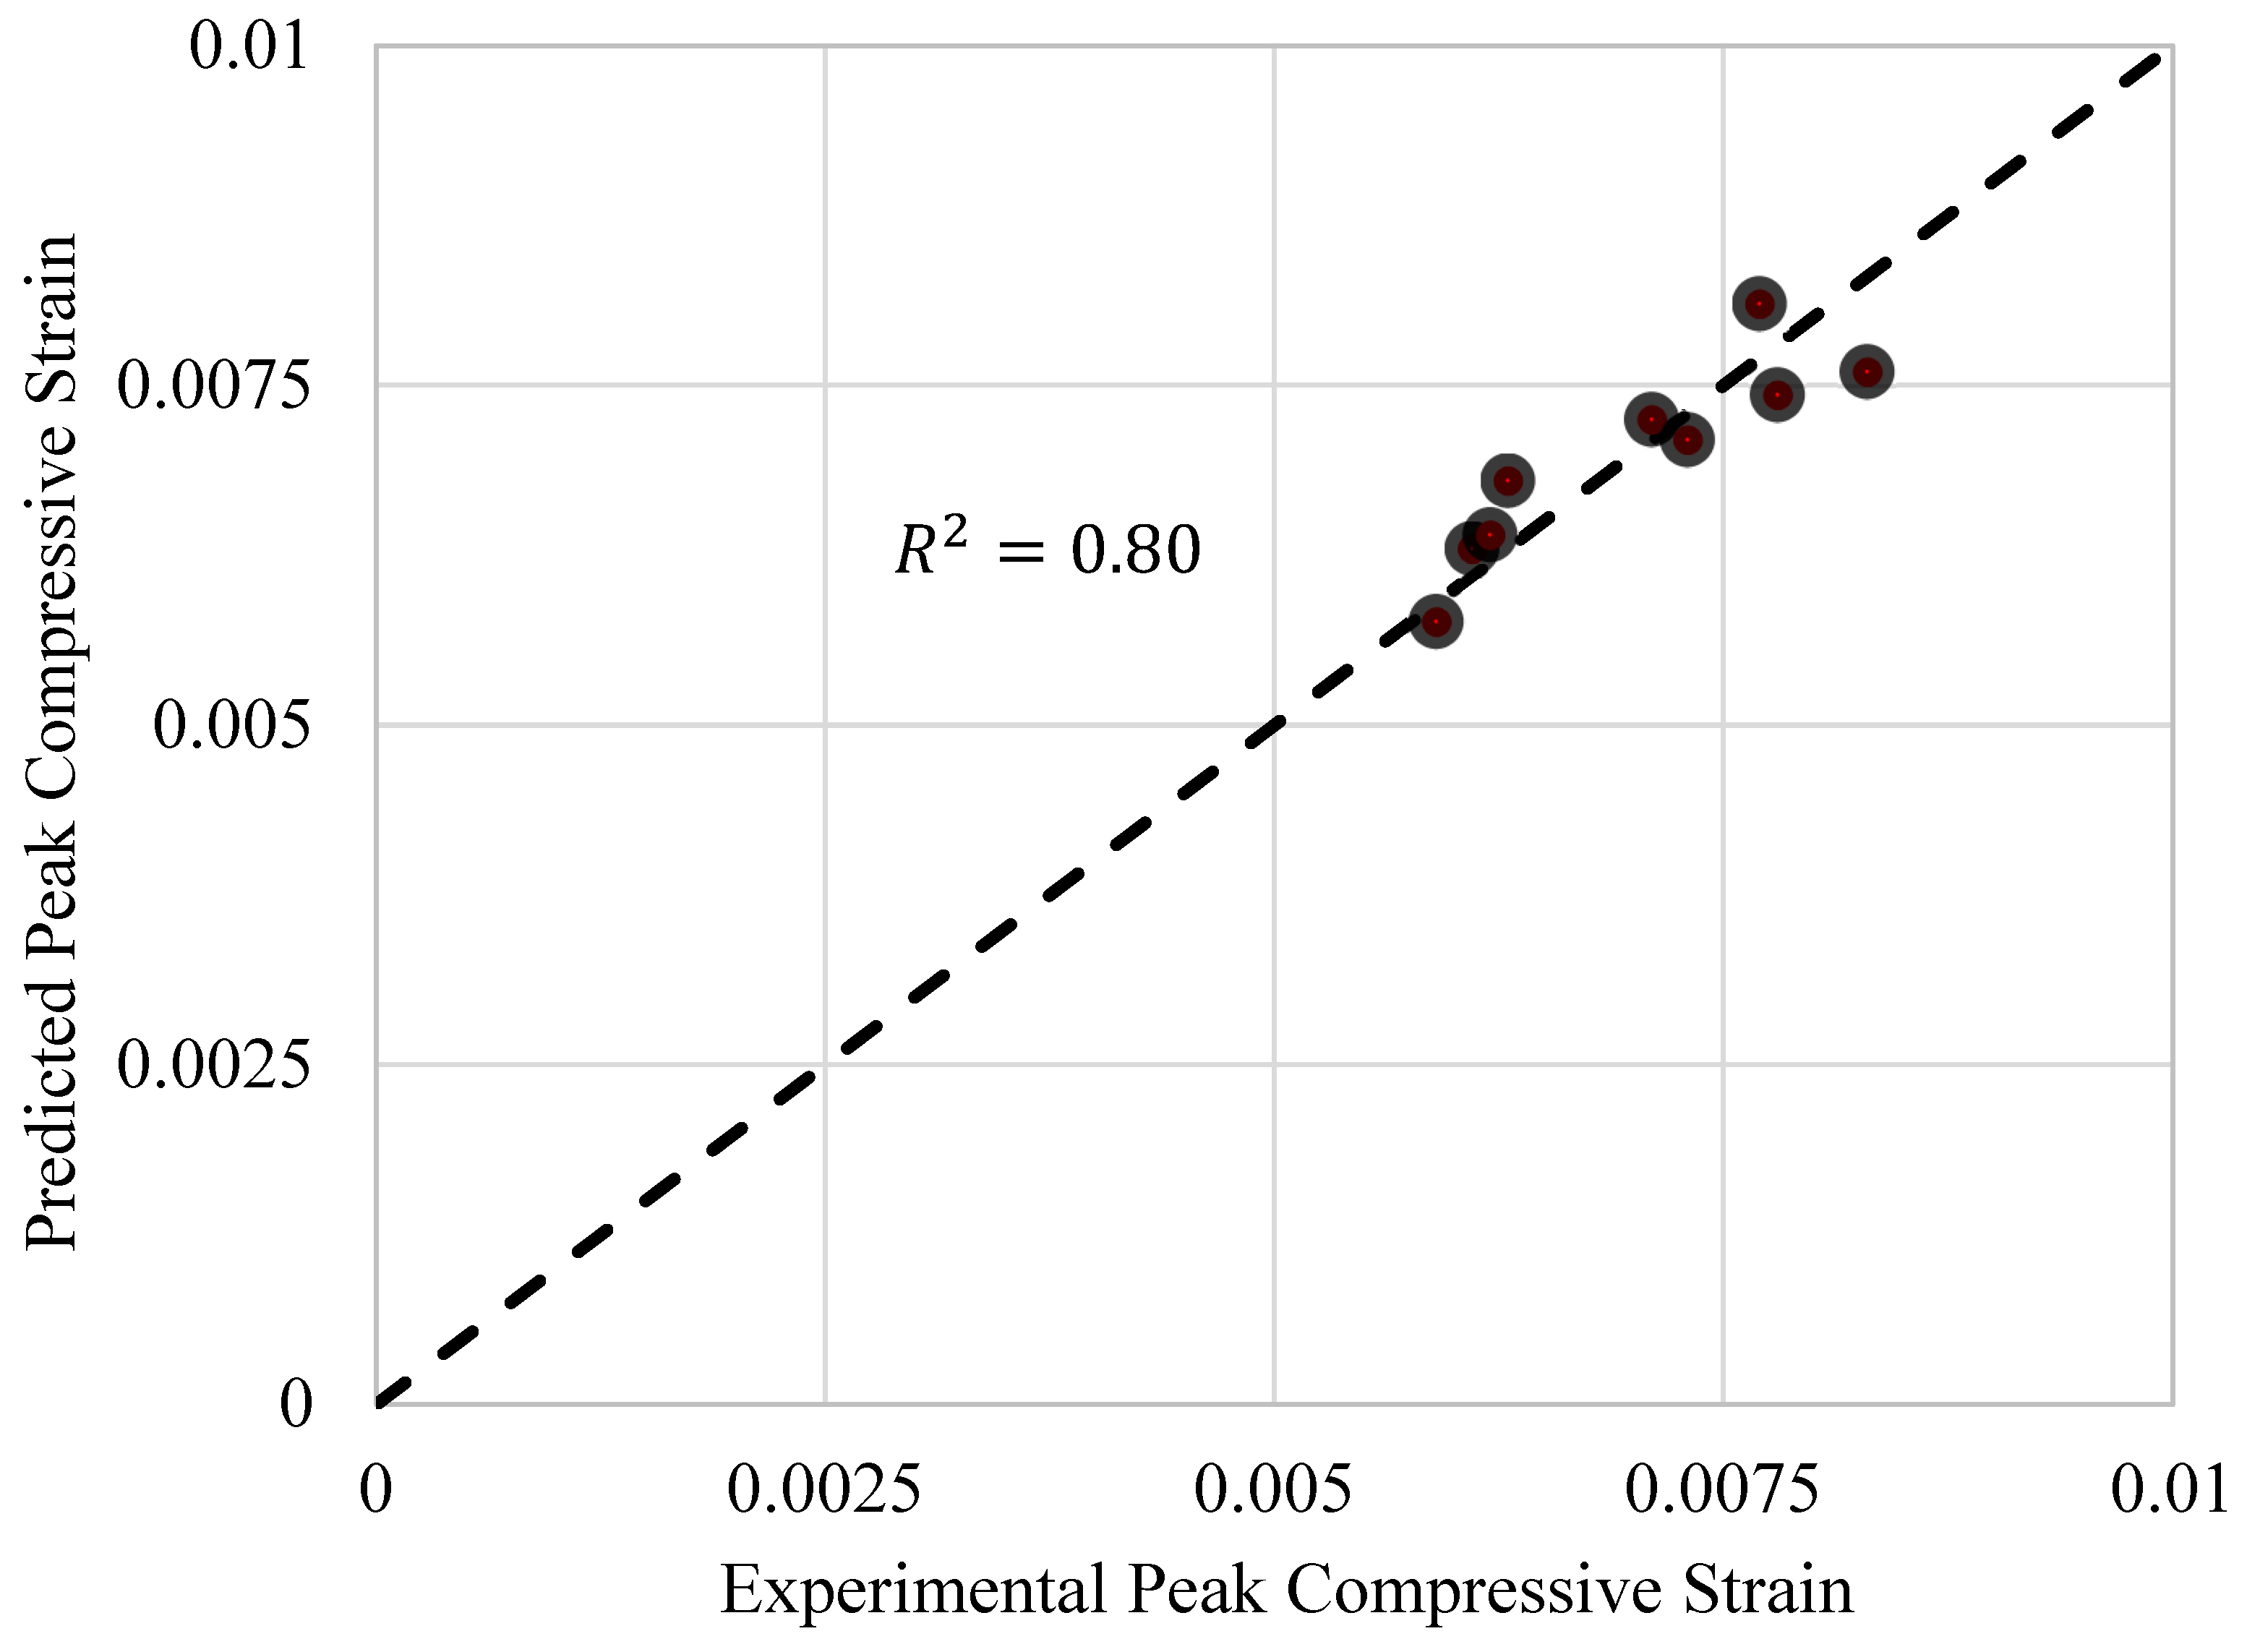
The strain at the peak compressive strength must be known to derive the compressive stress–strain curves. It was witnessed that the strain at the peak compressive strength decreased as the volume fraction of steel fibers increased. The following equation was proposed to predict the strain at the peak compressive strength.
where is the strain at the peak compressive strength in an unstrengthened state and can be taken as 0.007 for recycled brick aggregates, and is the strain at the peak compressive strength in a strengthened state. In accordance with Figure 19, Equation (4) led to a close agreement with the experimental peak compressive strains of RBAC.
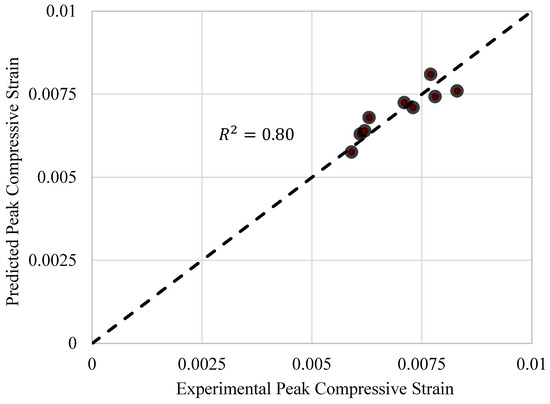
Figure 19.
Comparison of experimental and predicted peak compressive strain.
4.5. Predicted Compressive Stress–Strain Curves of RBAC
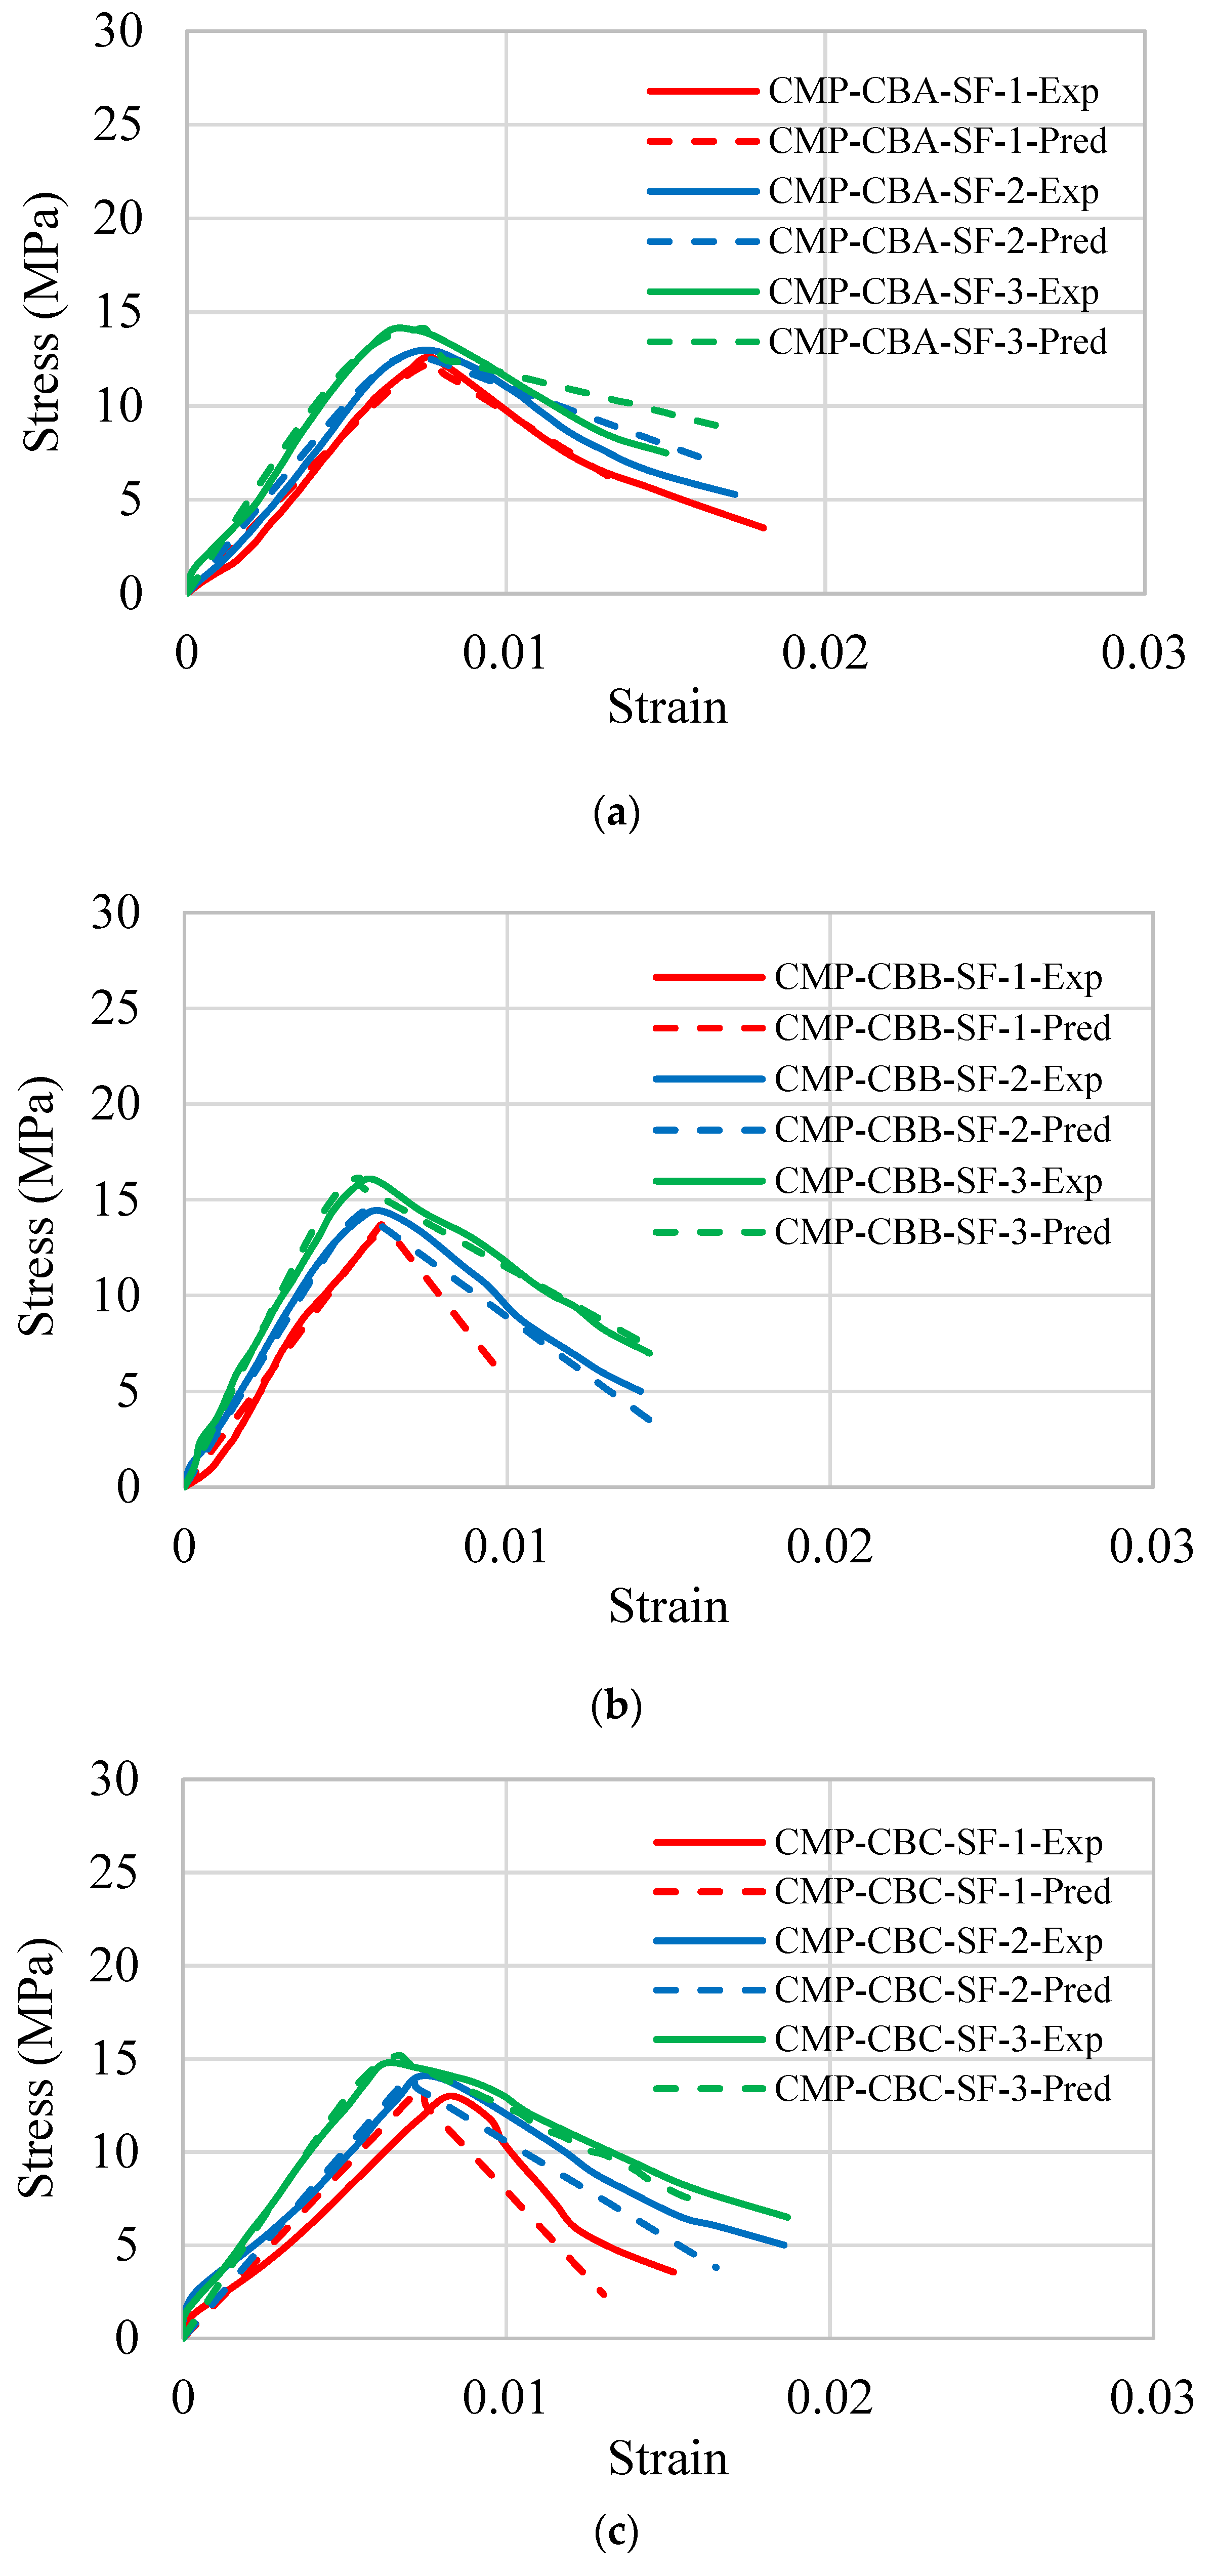
A parabolic shape for the initial stress–strain response of RBAC was assumed up to the peak compressive strength. For this purpose, the initial formulations of Popovics [50], later modified by Mander et al. [51], were adopted. The stress, , at any arbitrary strain, , is given as:
where separate equations for the initial slope, , , and have already been proposed. For the post-peak branch, the proposed equation for the post-peak modulus, , was utilized. The comparison of the predicted and experimental stress–strain curves is depicted in Figure 20. In the figure, Exp represents experimental and Pred designates predicted. In general, a good agreement was achieved for specimens in groups 1 and 2, whereas some discrepancies were experienced in the elastic and post-peak modulus of group 3 specimens.
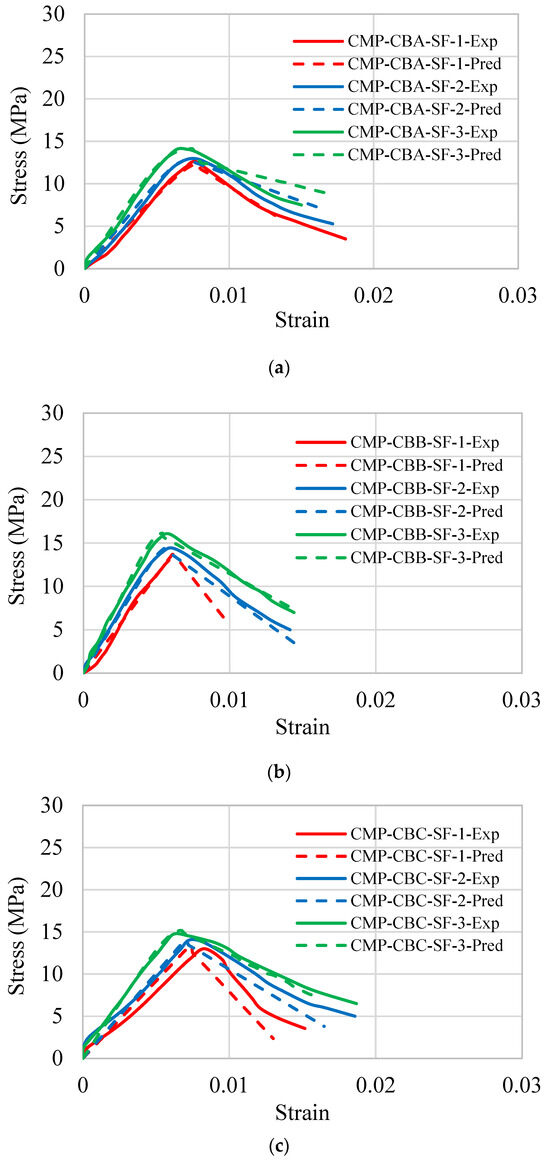
Figure 20.
Comparison of experimental and predicted stress–strain curves for: (a) group 2, (b) group 3, and (c) group 4 specimens.
5. Conclusions
This study was performed to assess the performance of steel fibers in improving the mechanical properties of concrete comprising recycled brick aggregates. The volume fractions of 1%, 2%, and 3% for steel fibers were mixed in concrete, whereas recycled brick aggregates were obtained from solid fired-clay bricks (group 2), hollow fired-clay bricks (group 3), and cement–clay interlocking bricks (group 3). However, group 1 specimens were cast with natural aggregates. The behavior of RBAC in terms of the splitting tensile strength, flexural strength, and compressive strength was investigated. The following important conclusions were drawn.
- The control specimens in all the groups exhibited typical crushing failure of cylindrical specimens by forming failure cones, splitting cracks along their heights, and exhibiting extensive crushing. The specimens strengthened with steel fibers indicated a delayed failure compared to that of the control specimens. In addition, the magnitude of splitting and crushing was reduced.
- The control flexural specimens in all the groups did not show any ductility and demonstrated an abrupt drop in the flexural strength after reaching the peak load. The addition of 1% volume fraction of steel fibers did not impart any noticeable ductility. However, a substantial improvement in the ductility was observed for 2% and 3% volume fractions of steel fibers. Further, the rate of the post-peak flexural strength degradation decreased as the volume fraction of steel fibers increased. The enhancement in the energy dissipation was more pronounced than the increase in the flexural strength. An 8765.69% increase in the energy dissipation by the flexural specimens was witnessed in group 3 specimens, while this increase in group 2 and group 4 specimens was 5823.61% and 6748.36%, respectively.
- Like the flexural specimens, the splitting tensile specimens also provided an increased ductility as the volume fraction of steel fibers increased. Generally, the maximum ductility was observed, corresponding to 3% volume fraction of steel fibers.
- The addition of steel fibers improved the peak compressive strength in all the groups. However, this increase was maximum in the case of group 2 specimens for all the volume fractions of steel fibers. Nonetheless, steel fibers could not enhance the peak compressive strength of RBAC to the value that corresponded to natural aggregates concrete.
- Separate equations were proposed to predict the peak compressive strength, strain at the peak compressive strength, elastic modulus, and post-peak modulus of RBAC. The proposed regression equations were utilized in combination with the existing compressive stress–strain model. In general, a close agreement was achieved between the experimental and predicted compressive stress–strain curves of RBAC.
Author Contributions
E.Y.: conceptualization, methodology, investigation, validation, and writing—original draft; A.B.: conceptualization, methodology, investigation, validation, formal analysis, resources, writing—original draft, and writing—review and editing; P.S.: conceptualization, investigation, and writing—original draft; Q.H.: methodology, investigation, and validation; A.E.: investigation, validation, and formal analysis; P.J.: conceptualization, methodology, validation, formal analysis, writing—original draft, and writing—review and editing. All authors have read and agreed to the published version of the manuscript.
Funding
Financial support for the experiments was provided by Department of Civil Engineering, King Mongkut’s University of Technology Thonburi, research grant number, No. CE-KMUTT 6602.
Data Availability Statement
Data are contained within the article.
Conflicts of Interest
The authors declare no conflict of interest.
References
- Li, H.; Dong, L.; Jiang, Z.; Yang, X.; Yang, Z. Study on Utilization of Red Brick Waste Powder in the Production of Cement-Based Red Decorative Plaster for Walls. J. Clean. Prod. 2016, 133, 1017–1026. [Google Scholar] [CrossRef]
- Meng, Q.; Qin, Q.; Yang, H.; Zhou, H.; Wu, K.; Wang, L. Fractal Characteristics of the Pore Structure of Coral Powder–Cement Slurry under Different Fractal Models. Fractal Fract. 2022, 6, 145. [Google Scholar] [CrossRef]
- Wimala, M. Environmental Impact of Waste Concrete Treatment in Precast Concrete Production. In Proceedings of the Annual Conference Japan Concrete Institute, Osaka, Japan, 12–14 July 2011; pp. 1902–1906. [Google Scholar]
- Joyklad, P.; Saingam, P.; Ali, N.; Ejaz, A.; Hussain, Q.; Khan, K.; Chaiyasarn, K. Low-Cost Fiber Chopped Strand Mat Composites for Compressive Stress and Strain Enhancement of Concrete Made with Brick Waste Aggregates. Polymers 2022, 14, 4714. [Google Scholar] [CrossRef]
- He, Z.; Shen, A.; Wu, H.; Wang, W.; Wang, L.; Yao, C.; Wu, J. Research Progress on Recycled Clay Brick Waste as an Alternative to Cement for Sustainable Construction Materials. Constr. Build. Mater. 2021, 274, 122113. [Google Scholar] [CrossRef]
- Meng, T.; Zhang, J.; Wei, H.; Shen, J. Effect of Nano-Strengthening on the Properties and Microstructure of Recycled Concrete. Nanotechnol. Rev. 2020, 9, 79–92. [Google Scholar] [CrossRef]
- Zheng, C.; Lou, C.; Du, G.; Li, X.; Liu, Z.; Li, L. Mechanical Properties of Recycled Concrete with Demolished Waste Concrete Aggregate and Clay Brick Aggregate. Results Phys. 2018, 9, 1317–1322. [Google Scholar] [CrossRef]
- Vilas, N.; Guilbert, B. Construction and Demolition Waste Management: Current Practices in Asia. In Proceedings of the International Conference on Sustainable Solid Waste Management, Chennai, India, 5–7 September 2007; pp. 97–104. [Google Scholar]
- Tabsh, S.W.; Abdelfatah, A.S. Influence of Recycled Concrete Aggregates on Strength Properties of Concrete. Constr. Build. Mater. 2009, 23, 1163–1167. [Google Scholar] [CrossRef]
- Kwan, W.H.; Ramli, M.; Kam, K.J.; Sulieman, M.Z. Influence of the Amount of Recycled Coarse Aggregate in Concrete Design and Durability Properties. Constr. Build. Mater. 2012, 26, 565–573. [Google Scholar] [CrossRef]
- Padmini, A.K.; Ramamurthy, K.; Mathews, M.S. Influence of Parent Concrete on the Properties of Recycled Aggregate Concrete. Constr. Build. Mater. 2009, 23, 829–836. [Google Scholar] [CrossRef]
- Saingam, P.; Ejaz, A.; Ali, N.; Nawaz, A.; Hussain, Q.; Joyklad, P. Prediction of Stress-Strain Curves for HFRP Composite Confined Brick Aggregate Concrete under Axial Load. Polymer 2023, 15, 844. [Google Scholar] [CrossRef]
- Vrijders, J.; Desmyter, J. Een Hoogwaardig Gebruik van Puingranulaten Stimuleren; OVAM: Mechelen, Belgium, 2008. [Google Scholar]
- Debieb, F.; Kenai, S. The Use of Coarse and Fine Crushed Bricks as Aggregate in Concrete. Constr. Build. Mater. 2008, 22, 886–893. [Google Scholar] [CrossRef]
- Bai, G.; Zhu, C.; Liu, C.; Liu, B. An Evaluation of the Recycled Aggregate Characteristics and the Recycled Aggregate Concrete Mechanical Properties. Constr. Build. Mater. 2020, 240, 117978. [Google Scholar] [CrossRef]
- Medina, C.; Zhu, W.; Howind, T.; Sánchez De Rojas, M.I.; Frías, M. Influence of Mixed Recycled Aggregate on the Physical—Mechanical Properties of Recycled Concrete. J. Clean. Prod. 2014, 68, 216–225. [Google Scholar] [CrossRef]
- Nováková, I.; Mikulica, K. Properties of Concrete with Partial Replacement of Natural Aggregate by Recycled Concrete Aggregates from Precast Production. Procedia Eng. 2016, 151, 360–367. [Google Scholar] [CrossRef]
- Jiang, T.; Wang, X.M.; Zhang, W.P.; Chen, G.M.; Lin, Z.H. Behavior of FRP-Confined Recycled Brick Aggregate Concrete under Monotonic Compression. J. Compos. Constr. 2020, 24, 04020067. [Google Scholar] [CrossRef]
- Nixon, P.J. Recycled Concrete as an Aggregate for Concrete—A Review. Matériaux Constr. 1978, 11, 371–378. [Google Scholar] [CrossRef]
- Thomas, C.; Setién, J.; Polanco, J.A.; Alaejos, P.; Sánchez De Juan, M. Durability of Recycled Aggregate Concrete. Constr. Build. Mater. 2013, 40, 1054–1065. [Google Scholar] [CrossRef]
- Rodsin, K. Confinement Effects of Glass FRP on Circular Concrete Columns Made with Crushed Fired Clay Bricks as Coarse Aggregates. Case Stud. Constr. Mater. 2021, 15, e00609. [Google Scholar] [CrossRef]
- Harajli, M.H. Axial Stress–Strain Relationship for FRP Confined Circular and Rectangular Concrete Columns. Cem. Concr. Compos. 2006, 28, 938–948. [Google Scholar] [CrossRef]
- Harajli, M.H. Seismic Behavior of RC Columns with Bond-Critical Regions: Criteria for Bond Strengthening Using External FRP Jackets. J. Compos. Constr. 2008, 12, 69–79. [Google Scholar] [CrossRef]
- Garcia, R.; Helal, Y.; Pilakoutas, K.; Guadagnini, M. Bond Behaviour of Substandard Splices in RC Beams Externally Confined with CFRP. Constr. Build. Mater. 2014, 50, 340–351. [Google Scholar] [CrossRef]
- Bournas, D.A.; Triantafillou, T.C. Bond Strength of Lap-Spliced Bars in Concrete Confined with Composite Jackets. J. Compos. Constr. 2011, 15, 156–167. [Google Scholar] [CrossRef]
- Saleem, S.; Hussain, Q.; Pimanmas, A. Compressive Behavior of PET FRP–Confined Circular, Square, and Rectangular Concrete Columns. J. Compos. Constr. 2016, 21, 04016097. [Google Scholar] [CrossRef]
- Suparp, S.; Ejaz, A.; Khan, K.; Hussain, Q.; Joyklad, P.; Saingam, P. Load-Bearing Performance of Non-Prismatic RC Beams Wrapped with Carbon FRP Composites. Sensors 2023, 23, 5409. [Google Scholar] [CrossRef] [PubMed]
- Gao, C.; Huang, L.; Yan, L.; Kasal, B.; Li, W. Behavior of Glass and Carbon FRP Tube Encased Recycled Aggregate Concrete with Recycled Clay Brick Aggregate. Compos. Struct. 2016, 155, 245–254. [Google Scholar] [CrossRef]
- Tang, Z.; Li, W.; Tam, V.W.Y.; Yan, L. Mechanical Behaviors of CFRP-Confined Sustainable Geopolymeric Recycled Aggregate Concrete under Both Static and Cyclic Compressions. Compos. Struct. 2020, 252, 112750. [Google Scholar] [CrossRef]
- Han, Q.; Yuan, W.Y.; Ozbakkaloglu, T.; Bai, Y.L.; Du, X.L. Compressive Behavior for Recycled Aggregate Concrete Confined with Recycled Polyethylene Naphthalate/Terephthalate Composites. Constr. Build. Mater. 2020, 261, 120498. [Google Scholar] [CrossRef]
- Chaiyasarn, K.; Hussain, Q.; Joyklad, P.; Rodsin, K. New Hybrid Basalt/E-Glass FRP Jacketing for Enhanced Confinement of Recycled Aggregate Concrete with Clay Brick Aggregate. Case Stud. Constr. Mater. 2021, 14, e00507. [Google Scholar] [CrossRef]
- Zhou, Y.; Li, W.; Peng, Y.; Tang, S.; Wang, L.; Shi, Y.; Li, Y.; Wang, Y.; Geng, Z.; Wu, K. Hydration and Fractal Analysis on Low-Heat Portland Cement Pastes Using Thermodynamics-Based Methods. Fractal Fract. 2023, 7, 606. [Google Scholar] [CrossRef]
- Peng, Y.; Tang, S.; Huang, J.; Tang, C.; Wang, L.; Liu, Y. Fractal Analysis on Pore Structure and Modeling of Hydration of Magnesium Phosphate Cement Paste. Fractal Fract. 2022, 6, 337. [Google Scholar] [CrossRef]
- Yooprasertchai, E.; Ejaz, A.; Saingam, P.; Ng, A.W.M.; Joyklad, P. Development of Stress-Strain Models for Concrete Columns Externally Strengthened with Steel Clamps. Constr. Build. Mater. 2023, 377, 131155. [Google Scholar] [CrossRef]
- Ejaz, A.; Ruangrassamee, A.; Kruavit, P.; Udomworarat, P.; Wijeyewickrema, A.C. Strengthening of Substandard Lap Splices Using Hollow Steel Section (HSS) Collars. Structures 2022, 46, 128–145. [Google Scholar] [CrossRef]
- Harajli, M.H. Effect of Confinement Using Steel, FRC, or FRP on the Bond Stress-Slip Response of Steel Bars under Cyclic Loading. Mater. Struct. 2006, 39, 621–634. [Google Scholar] [CrossRef]
- Song, P.S.; Hwang, S. Mechanical Properties of High-Strength Steel Fiber-Reinforced Concrete. Constr. Build. Mater. 2004, 18, 669–673. [Google Scholar] [CrossRef]
- Olivito, R.S.; Zuccarello, F.A. An Experimental Study on the Tensile Strength of Steel Fiber Reinforced Concrete. Compos. B Eng. 2010, 41, 246–255. [Google Scholar] [CrossRef]
- Kachouh, N.; El-Hassan, H.; El-Maaddawy, T. Effect of Steel Fibers on the Performance of Concrete Made with Recycled Concrete Aggregates and Dune Sand. Constr. Build. Mater. 2019, 213, 348–359. [Google Scholar] [CrossRef]
- Kaplan, G.; Bayraktar, O.Y.; Gholampour, A.; Gencel, O.; Koksal, F.; Ozbakkaloglu, T. Mechanical and Durability Properties of Steel Fiber-Reinforced Concrete Containing Coarse Recycled Concrete Aggregate. Struct. Concr. 2021, 22, 2791–2812. [Google Scholar] [CrossRef]
- ASTM C39/C39M-21; Standard Test Method for Compressive Strength of Cylindrical Concrete Specimens. ASTM: West Conshohocken, PA, USA, 2021.
- ASTM C1314-21; Standard Test Method for Compressive Strength of Masonry Prisms. ASTM: West Conshohocken, PA, USA, 2021.
- ASTM C140/C140M-22a; Standard Test Methods for Sampling and Testing Concrete Masonry Units and Related Units. ASTM: West Conshohocken, PA, USA, 2022.
- Kou, S.C.; Poon, C.S.; Chan, D. Influence of Fly Ash as Cement Replacement on the Properties of Recycled Aggregate Concrete. J. Mater. Civil. Eng. 2007, 19, 709–717. [Google Scholar] [CrossRef]
- Jin, C.; Wang, X.; Akinkurolere, O.O.; Jiang, C.R. Experimental Research on the Conversion Relationships between the Mechanical Performance Indexes of Recycled Concrete. Chin. Concr. J. 2008, 11. [Google Scholar]
- Li, J.; Xiao, J.; Jian, H. Influence of Recycled Coarse Aggregate Replacement Percentages on Compressive Strength of Concrete—KU Leuven. Jianzhu Cailiao Xuebao/J. Build. Mater. 2006, 9, 297–301. [Google Scholar]
- Richart, F.E.; Brandtzæg, A.; Brown, R.L. A Study of the Failure of Concrete under Combined Compressive Stresses; Bulletin No. 185 Engineering Experiment Station; University of Illinois: Champaign, IL, USA, 1928. [Google Scholar]
- Al-Salloum, Y.A. Compressive Strength Models of FRP-Confined Concrete. In Proceedings of the 1st Asia-Pacific Conference on FRP in Structures, APFIS 2007, Hong Kong, China, 12–14 December 2007; Volume 1, pp. 175–180. [Google Scholar]
- Eid, R.; Paultre, P. Compressive Behavior of FRP-Confined Reinforced Concrete Columns. Eng. Struct. 2017, 132, 518–530. [Google Scholar] [CrossRef]
- Popovics, S. A Numerical Approach to the Complete Stress-Strain Curve of Concrete. Cem. Concr. Res. 1973, 3, 583–599. [Google Scholar] [CrossRef]
- Mander, J.B.; Priestley, M.J.N.; Park, R. Theoretical Stress Strain Model for Confined Concrete. J. Struct. Eng. 1988, 114, 1804–1826. [Google Scholar] [CrossRef]


Disclaimer/Publisher’s Note: The statements, opinions and data contained in all publications are solely those of the individual author(s) and contributor(s) and not of MDPI and/or the editor(s). MDPI and/or the editor(s) disclaim responsibility for any injury to people or property resulting from any ideas, methods, instructions or products referred to in the content. |
© 2023 by the authors. Licensee MDPI, Basel, Switzerland. This article is an open access article distributed under the terms and conditions of the Creative Commons Attribution (CC BY) license (https://creativecommons.org/licenses/by/4.0/).