Article

Party Wall Behaviour and Impact in QUB and Coheating Tests

1
Leeds Sustainability Institute, Leeds Beckett University, City Campus, Leeds LS2 9EN, UK
2
Saint-Gobain Research Paris, 39 quai Lucien Lefranc, F-93303 Aubervilliers, France
*
Author to whom correspondence should be addressed.
Buildings 2023, 13(11), 2877; https://doi.org/10.3390/buildings13112877
Submission received: 25 April 2023 / Revised: 22 June 2023 / Accepted: 17 July 2023 / Published: 17 November 2023
(This article belongs to the Special Issue The Dynamic In Situ Characterisation of Buildings)

Abstract

:
In situ measurement can enable accurate evaluation of a building’s as-built performance. However, when measuring whole house performance, party walls introduce measurement uncertainty. Subsequently, it is common to “adjust” measurements to isolate heat transfer through party walls. This study explores the behaviour and impact of party walls in QUB and coheating measurements of a semi-detached house, presenting empirical evidence on the validity of these measurements where a party wall is present. Two different party wall heat transfer behaviours were observed through heat flux density measurements. Thermal charging is apparent in QUB tests and the initial stages of coheating. After 48 h of coheating, the party wall has become heat saturated and exhibits stable heat transfer. Consequently, using heat flux density measurements to isolate party wall heat transfer in QUB tests, where thermal saturation has not been achieved, can result in misleading inferences. The coheating and QUB measurements without party wall adjustment are in close agreement, irrespective of differing heating patterns in the neighbouring property. The generalisation of these findings is problematic since they describe the impact of the case study-specific built form and the test conditions. Future work to explore the impact of built form and test conditions is needed.

1. Introduction

1.1. Fabric Performance Gap

The performance of building fabric is essential for the decarbonisation of heat to reach international net-zero targets. For several decades improving the level of fabric performance in buildings (insulation and airtightness) has been the desired outcome of tighter regulations for new buildings and retrofit measures for existing properties [1,2]. In spite of this, there is evidence that shows the actual performance of buildings is often different from what is expected. This phenomenon is referred to as a “performance gap”. The causes of the performance gap can be associated with the physical performance characteristics being worse than expected, e.g., poor continuity of insulation/airtightness measures or substandard product substitutions [3]. Alternatively, the calculations used for determining fabric performance can contain assumptions or default performance values that do not match as-built performance [4]. The implications of the performance gap include higher heating costs and associated carbon emissions, as well as lower levels of thermal comfort for occupants.
Growing awareness of the performance gap has increased the popularity of using in situ measurement of fabric performance to give stakeholders confidence in the performance of their buildings [4]. Measuring whole house heat loss or the heat transfer coefficient has emerged as the accepted metric by which the fabric performance is characterised and the presence of any “performance gap” is evaluated [5].

1.2. Heat Transfer Coefficient

The whole house fabric performance of a home can be characterised by its HTC (heat transfer coefficient) [6]. The HTC quantifies the heat necessary to maintain a prescribed temperature difference with units of WK−1. The HTC quantifies heat loss from all relevant mechanisms. Equation (1) presents a simplified model of the HTC capturing the applicable heat transfer mechanisms in the context of a typical dwelling. This follows the calculation of the metric as per the UK’s regulatory standard assessment procedure (SAP) [7].
HTC = UA + ρ C p Q v + ψ j L j
The first expression of Equation (1) is the summation of transmittance heat loss through building fabric elements of U-value, U (Wm−2K−1) and area, A (m2). The second expression is the summation of infiltration losses (uncontrolled ventilation), where ρ is air density (kgm−3), Cp is the specific heat of air (Jkg−1K−1) and Qv is the infiltration rate (m3s−1). The final expression is the sum of heat lost through thermal bridges of length L (m) and transmission constant ψ (Wm−1K−1).
The accepted technique to measure the HTC of a building is the coheating test—a quasi-steady state technique where regression of daily heat input against internal-external temperature difference is used to determine fabric performance. An alternative to coheating is the QUB test—a more rapid and dynamic technique that determines the fabric performance of property by measuring the thermal response to a step heat input.
In both measurement techniques, the presence of party walls introduces uncertainty since party wall heat transfer patterns can differ substantially from external-facing elements.

1.3. Party Walls

The phrase party wall refers to the wall separating two terraced or semi-detached properties [8]. Recent data from the English Housing Survey shows for all dwellings (excluding flats) terraced and semi-detached properties account for 67% of housing [9].
Heat transfer methods for party walls will differ with their construction and were historically assumed to be negligible. This was reflected in SAP, where no heat loss was assumed. A heat loss mechanism referred to as a “party wall bypass,” in which air movement in party wall cavities forces heat loss from dwellings to the external environment, was identified in the 2000’s [10]. Following this discovery, SAP was amended to give “effective” U-values for party walls dependent on construction type to reflect heat transfer driven by the internal/external temperature difference (ΔText). These range from 0.0 Wm−2K−1 for solid walls and those with fully filled and sealed cavities to 0.5 Wm−2K−1 for unfilled and unsealed cavities [10].
For those party walls with an effective U-value of 0.0 Wm−2K−1, heat transfer will still occur, although not to the external environment. Moreover, the direction of the heat transfer is assumed to be coplanar with the neighbouring property driven by the temperature difference to the adjacent side of the party wall (ΔTPW). This could be negligible if ΔTPW ≈ 0. But changes in the heating patterns and setpoints between the two properties occurring through everyday use or through in situ measurement techniques such as coheating and QUB tests will induce a temperature difference, and, subsequently, heat exchange will occur.
The split of party wall construction types (solid or cavity) throughout the housing population is not explicitly known. The English Housing Survey does not detail the construction of party walls throughout the housing population. An indication of the popularity of these party wall types could be drawn by observing the split of the main external wall construction type and assuming the party wall construction follows. For all dwellings, the main wall construction is 71% cavity construction, 27% solid wall construction and 2% other [9]. A survey of local authority planning drawings from 1980 revealed that 85% of homes have cavities and 15% have solid party walls [11]. The extent of this survey was limited due to the party wall construction not being visible in around 50% of drawings and no houses older than 1980 being included. Additionally, it has been observed that there are micro or “finger” cavities within solid walls [12], which means some solid party walls could also experience a bypass, adding further complication.
However, it is likely that there is a substantial number of solid party walls in the UK, yet there is little research that explores the inter-dwelling heat exchange for solid party walls and how this is likely to vary with temperature differences across adjoining dwellings. Since heat exchange across the party wall is predominantly influenced by the neighbouring property rather than the external environment, it is common to take steps to quantify the heat loss through party walls when evaluating building performance and report performance with this accounted for [13]. This process is known as “adjustment”. Equally, if a party wall bypass is present, quantifying the additional heat loss from this mechanism is useful for quality assurance purposes. Whilst different nomenclature conventions have been used historically, in this study, HTCraw refers to measurements made with no party wall adjustment made and HTCadj refers to measurements where the party wall adjustment has been completed.

1.4. Measurement Methodologies

1.4.1. Coheating

The coheating test is a quasi-steady state measurement method in which an unoccupied dwelling is monitored and heated to an elevated temperature of ~25 °C using electric heaters for a period of two weeks or more. By averaging the power input (W) and the internal/external temperature difference (K) into daily periods, linear regression can be performed on the data points from which the gradient is equal to the HTC. As data is collected in daytime as well as night-time, multiple variable regression is performed to isolate the impact of solar radiation [13]. The coheating test has become well-established in academic and research environments and is considered a benchmark for measurement accuracy and precision. In a landmark study, seven testing teams from various organisations completed coheating tests on a detached property over a six-month period. All reported HTC measurements were within ± 10% of the mean, providing significant evidence of the reliability of the test procedure [14]. The coheating test is also useful as a research technique as the internal conditions are optimal for additional evaluations such as thermography, leakage detection and heat flux density measurement [15]. The most comprehensive description of the coheating test currently is the protocol produced by Leeds Beckett University [13]; this is currently in the process of being converted into a CEN standard [16]. Due to the long duration and intrusive nature of the coheating test, it has limited application outside of a research environment.
When completing coheating tests on semi-detached or terraced properties, the heat loss through party walls can be approximately accounted for using spot heat flux density measurements. Measuring the heat flux density through the party wall element (Wm−2) and multiplying it by the respective area (m2) will quantify the heat transfer across the party wall, which can be deducted from the heat input for the daily aggregated intervals [13].
When using heat flux density measurements for such purposes, it is assumed that the spot measurements made are representative of an entire fabric element. This is a limitation of the approach, as heterogonous construction characteristics and air movement across an element can lead to spatial variations in heat transfer across an element [17].
An alternative, or supplementary method that aims to reduce heat transfer across party walls to a point where it is negligible is “guarding”. Guarding refers to the practice of maintaining equal temperatures in the dwelling undergoing the coheating test and any adjacent properties, so ΔTPW ≈ 0 [18]. This practice requires access to any adjoining properties to maintain the elevated temperature, which will not always be possible. Additionally, guarding will not eliminate party wall heat transfer if there is a party wall bypass present, as this heat transfer will follow ΔText.

1.4.2. QUB

QUB is a rapid in situ technique used to measure the HTC of a property. The method consists of constant heat input and free cooling phases of equal length. The test takes place in an unoccupied dwelling at night so that no solar radiation is incident on the property, and the only heat source is through purpose-provided electric heaters. Across these phases, the thermal response of the building takes the form of a first-order differential equation, Equation (2), which can be solved to compute the HTC.
HTC = T 2 P 1 T 1 P 2 T 2 Δ T 1 T 1 Δ T 2  
where subscript 1/2 indicates the measurements taken at the end of the heating/cooling phase, respectively, T is the slope of the temperature profile (K h−1), P is power input (W) and ΔT is the internal/external temperature difference (K). References [19,20] thoroughly describe the theoretical justification of QUB. In reality, the thermal response of the building will be much more complex than this model, but over a long enough time period, a single time constant is shown to be valid [21].
QUB tests have a duration of between 6 and 14 h, with longer durations giving more precise results [22]. This duration is greatly advantageous compared to more established methods of measuring the HTC, such as the coheating test. This gives the QUB test potential to become a widely used measurement technique in mainstream applications such as house building or retrofit. A comparison of the key features of QUB and coheating is given in Table 1.
To date, the QUB method has been subject to practical validation through testing in the field and a climatically controlled environment [21,22,23,24]. Additionally, it has been used in UK government-funded building evaluation projects [25,26]. This work has validated the QUB method across property characteristics of age, insulation levels and air permeability.
QUB tests on semi-detached dwellings have been completed on a 1900’s test property situated within the climatic test chamber of the Salford Energy House testing facility. The main test house is constructed with an adjoining “conditioning chamber,” recreating the effect of a solid party wall. The HTC of the house was measured via multiple QUB and comparative coheating measurements at a baseline (uninsulated) stage and a whole house retrofit [22]. The average QUB measurements were −11% and +1% against the coheating HTC measurements for both the baseline and retrofit scenarios, respectively. Throughout the coheating tests, the temperature of the conditioning chamber was kept constant with the main test building to eliminate any inter-dwelling heat exchange. For the QUB tests, heat loss through the party wall was measured using heat flux plates and the losses were isolated by subtracting the party wall losses, Equation (3).
HTC adj = HTC raw U pw ,   eff A pw
where HTCadj is the HTC measurement minus any losses through the party wall (WK−1), HTCraw is the original measurement (WK−1), Upw,eff is the effective U-value of the party wall (Wm−2K−1) and Apw is the corresponding area of the party wall (m2).
Equation (3) assumes that the heat transfer through the party wall is proportional with ΔText. Given that the party wall is solid, as with the remainder of the property, it would be more appropriate to assume that no bypass mechanism is present and the heat transfer instead follows ΔTPW. The heat flux densities and temperatures of the test house and conditioning chamber are not reported in the work. Where there is no party wall bypass, and losses are not proportional to ΔText, the suitability of this method (Equation (3)) in quantifying party wall losses and isolating them from HTC measurements is to be determined. The difference between HTCraw and HTCadj was not reported.
In an additional study at the test facility, comparative QUB and coheating measurements were undertaken on the test property across an iterative six-stage retrofit programme from a mostly uninsulated baseline stage to a whole house retrofit [21]. Across the six stages, the average difference between the two measurements was ±13%. As was applied in the previous testing campaign, the conditioning chamber was kept at a temperature equal to the test house during the coheating test to eliminate inter-dwelling heat exchange. No mention of accounting for party wall heat transfer in the QUB tests was detailed.
Other deployments of QUB in buildings with party walls include the following:
  • QUB measurements undertaken on a multi-family housing unit (apartment) in Sweden. Equation (3) was used to compute HTCadj. The difference between HTCraw and HTCadj was not reported, and no comparative reference measurement was made [27];
  • QUB and comparative coheating measurements were performed on 30 homes with party walls as part of the UK government-funded building performance evaluation project SMETER. No adjustment for party wall heat transfer was included in the calculation; 30% of QUB measurements were shown to statistically agree with the coheating test [25].
This work shows there is potential for QUB tests to be applied to properties with party walls. However, the actual party wall heat transfer occurring during the measurement and its associated impact is an area that has not explicitly been explored. This area requires investigation to determine how the method can be reliably applied to housing stock with adjoining properties.

1.5. Paper Description and Justification

The work presented in this paper will provide empirical evidence on the behaviour and subsequent impact of party walls during both QUB and coheating tests through a field-based case study. As the measurement of building fabric performance increases in popularity, this will provide an understanding of how the uncertainty associated with party wall heat transfer patterns impacts measurements. In the application of QUB tests, this is the first study to be published explicitly investigating party wall heat transfer.
The paper is structured as follows. Section 2 describes the measurements undertaken, including the equipment used and analysis steps performed. Section 3 presents and analyses the results of the measurements taken, as well as the heat flux and temperature data recorded. Section 4 provides conclusions on the study.

2. Materials and Methods

2.1. Research Design

The aim of this study is to explore the behaviour and impact of party walls in both QUB and coheating tests. In doing so, the impact this has on the accuracy and precision of the QUB test is to be determined.
A field-based study was chosen, over a theoretical or computational approach to account for the unpredictable and complex nature of party wall heat transfer, which may not be accurately represented in these evaluation methods. Figure 1 presents a high-level overview of the method.

2.2. Testing Description

The study was conducted on a pair of 1930’s built, three-bedroom, semi-detached houses located in the East Midlands, UK, pictured in Figure 2. House A was allocated as a test house where measurements were completed, the adjoining house, House B, was assigned as a control house to create various conditions reflective of an adjoining property. The construction details of the test house are detailed in Table 2.
The internal floor area of the house (78 m2) is within the most popular size grouping (70–89 m2) of UK housing stock [9]. The ratio of the party wall to the total thermal envelope of House A is 20%. This is thought to be a representative of two-storey semi-detached houses, although no data on party wall size throughout the UK housing stock has been analysed. This ratio would be larger for mid-terraced houses (party walls on both sides) or those of three-storey construction where the size of the party walls is proportionally larger.
The air permeability of the house is slightly lower than the current maximum UK regulatory limit of 8 m3h−1m−2@50 Pa [2]. This indicates that the air permeability of the house is moderate, with any impact of infiltration losses reflective of what could be found in UK housing stock.
Previous work has shown agreement between coheating and QUB tests improves with the insulation of external walls as a result of reduced impact of circulation fans affecting surface resistances [22]. Consequently, the results of this study may not be directly transferable to homes with uninsulated external walls.

2.3. QUB and Coheating Tests

QUB and coheating tests were completed on the test house from March to April 2022. The equipment used for both tests is listed in Table 3, with all equipment with the exception of heaters being used for both measurements. As the HTC measurements include heat loss through infiltration (uncontrolled ventilation) purpose provided ventilation points were sealed during the test.
To monitor the heat transfer occurring across the party wall, heat flux plates were installed on the party wall. This was performed in both House A and B, with the plates’ position being mirrored from the test house to the control house. Figure 3 shows the layout of equipment within both houses. A thermographic survey of the party wall showed a homogeneous temperature across the party wall. This is preferable for extrapolating the heat flux density measurements taken by the plates across the entire area of the party wall.
The coheating test was performed following the Leeds Beckett protocol and completed on both houses in parallel [13]. Both houses were heated to the same set point of 25 °C, providing guarding across the party wall and theoretically limiting any party wall heat exchange. By multiplying the heat flux density measurements (Wm−2) by the representative area of the element they are fixed to (m2) the associated rate of heat loss (W) can be calculated. This value was subtracted from the average daily electrical power and HTCadj was calculated.
The QUB tests were set up to achieve a heat loss/heat input ratio (often referred to as α) in the range of 0.4–0.7. Previous research has shown that within this range, measurements are most accurate [28,29]. To achieve this, the internal temperature at the start of the QUB test was controlled. This was performed through use of heaters controlled thermostatically and by timer to maintain an optimal starting temperature. Equation (4) was used to determine the optimal starting temperature.
T int , 0 = T ext , 0 + P 1 ( 1 -   α ) HTC ref
where Tint,0 is the optimal internal temperature at the start of the test (K), Text,0 is the forecast external temperature at the start of the test (K), P1 is the power input (W), α is the optimal heat loss/input ratio (0.5) and HTCref is a reference HTC for the property in question. In this instance, a provisional result of the coheating test was used as HTCref.
The duration of the QUB tests was 7 h. Durations of 8+ h has been shown to be beneficial for precision of QUB tests. The reduced duration was required due to the tests being completed in spring when longer daylight hours are observed. Additionally, the external temperature dropped 2–3 h after sunset, which made obtaining a compliant α value more straightforward but subsequently reduced the QUB test duration. The target Tint,0 was 21.4 °C, P1 was sized at 3000 W, placing one 500 W heater in each room.
Traditionally for fabric performance measurement, winter is considered the optimal season. Low levels of solar radiation prevent stored solar contributions within the fabric from introducing uncertainty into measurements [30]. Solar radiation was monitored throughout the QUB tests to determine if this impacted the measurements.
For both the QUB and coheating tests the overall internal temperature was calculated using an average of all the internal temperature sensors weighted by room volume.
The first QUB test commenced at 23:00 with the coheating test finishing at 12:00 the same day. Internal temperatures and heat flux densities were monitored and analysed during this change-over period to detect any impact of the house being thermally saturated only 11 h prior to the 1st QUB measurement commenced.
HTCraw for each QUB test was computed using established QUB algebra, Equation (2). To compute HTCadj, the values of P1 and P2 in Equation (2) were expanded to account for heat gain or loss from the party wall. This mirrors the approach taken in coheating protocol where party wall heat loss is subtracted from the daily average power data. This approach is summarised in Equation (5).
P adj , 1 / 2 = P heaters ,   1 / 2 q - pw , 1 / 2 A pw
where Padj,1/2 (W) is substituted into Equation (2) in place of P1/2 to compute HTCadj, Pheaters,1/2 is the average power recorded from the electric heaters (W), q ¯ pw,1/2 is the average heat flux density (Wm−2) and Apw is the corresponding representative area (m). Subscript 1/2 indicates values applicable to the heating and cooling phases respectively.
The uncertainty associated with the QUB test was calculated following Taylors series of uncertainty propagation [28]. For HTCadj, Padj,1/2 was substituted for P1/2 in this process.
The wall area of the chimneys was not considered part of the party wall. Whilst the chimneys were sealed any residual heat transfer occurring would be driven by ΔText rather than ΔTPW.
The overall party wall heat flux for individual QUB tests, Qpw (W) can be determined through Equation (6). Qpw was analysed to investigate PW behaviour in both House A and B.
Q pw = q - pw A pw
where q ¯ pw is the average heat flux density over the whole test duration (Wm−2) and Apw is the representative area (m).

2.4. Accuracy and Precision Metrics

Metrics of root mean squared error (RMSE) and mean bias error (MBE) were used to evaluate the accuracy and precision of the QUB test. These measures are typically used to evaluate the error present in numerically modelled predictions against true observations. In this application the true observation was substituted with the result of the coheating test owing to the reputation of the test procedure as reliable. The result of the QUB measurement takes the place of the prediction. Both RMSE and MBE were expressed as a percentage of the coheating measurement.
Furthermore, through determining if the confidence intervals of the QUB measurements overlap with the coheating it can be said there is no statistical difference between the two measurements. This is an additional indication of accuracy.
These evaluations were applied to both HTCraw and HTCadj measurements to determine if the accuracy and precision was improved with the isolation of party wall heat transfer.

2.5. House B Heating Patterns

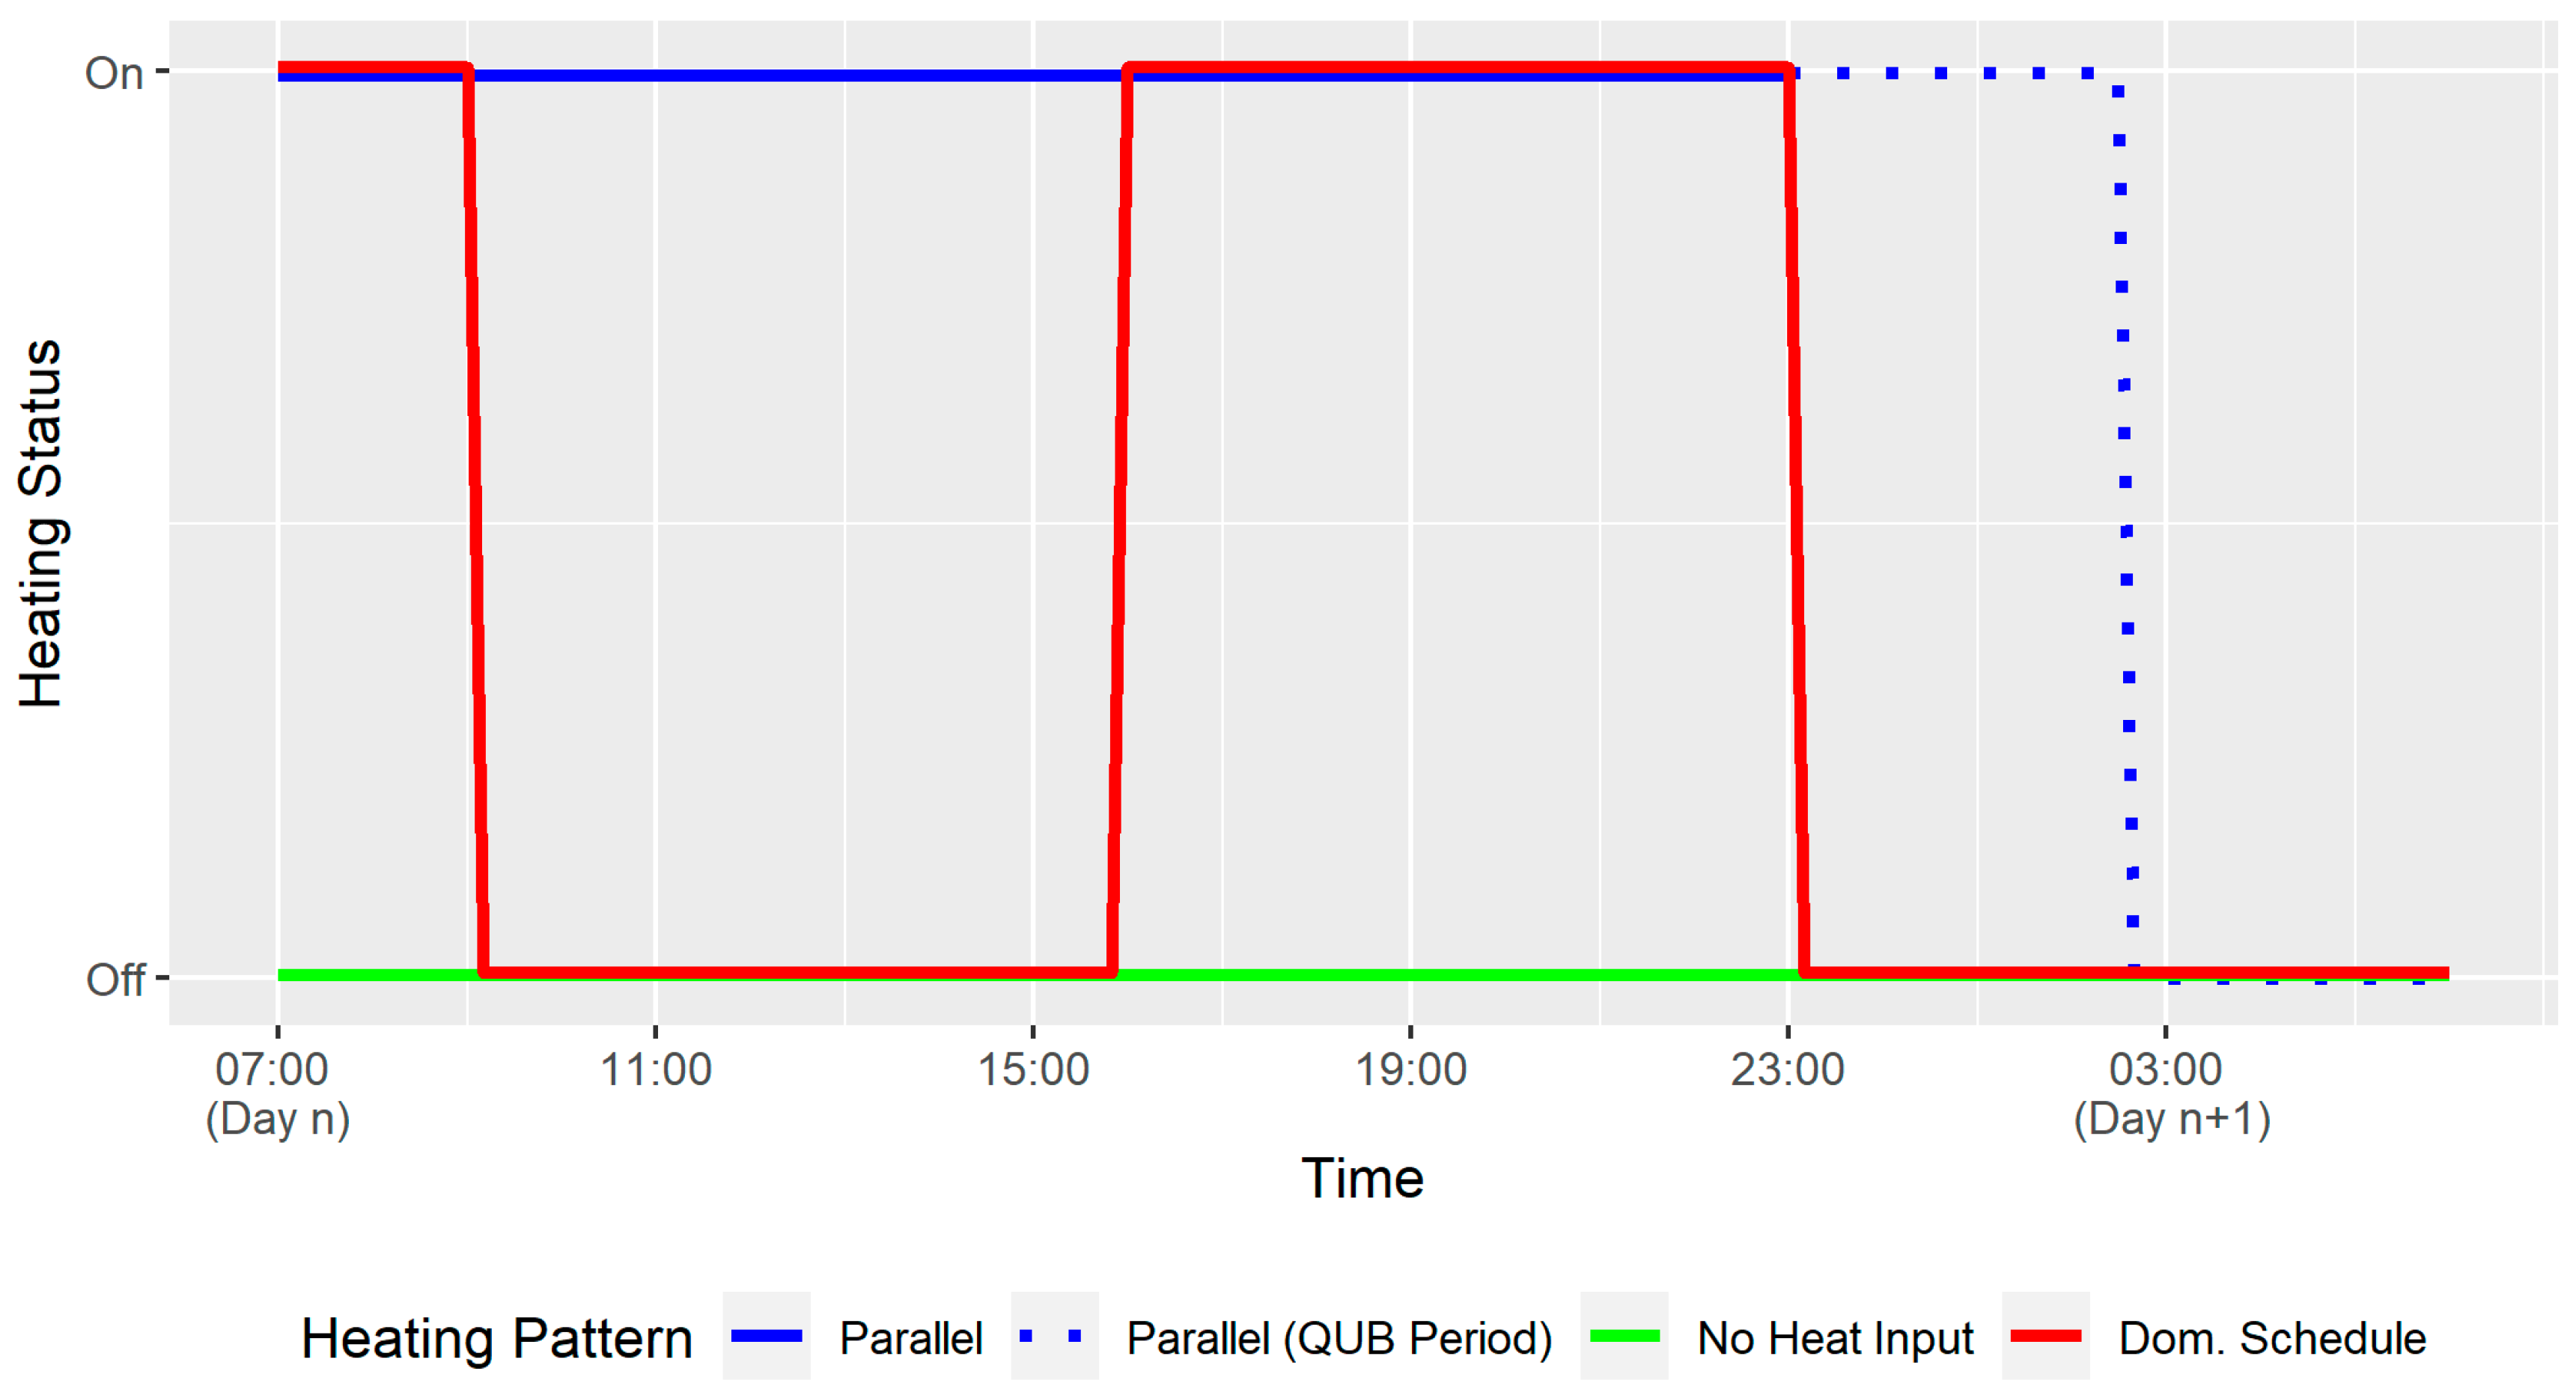
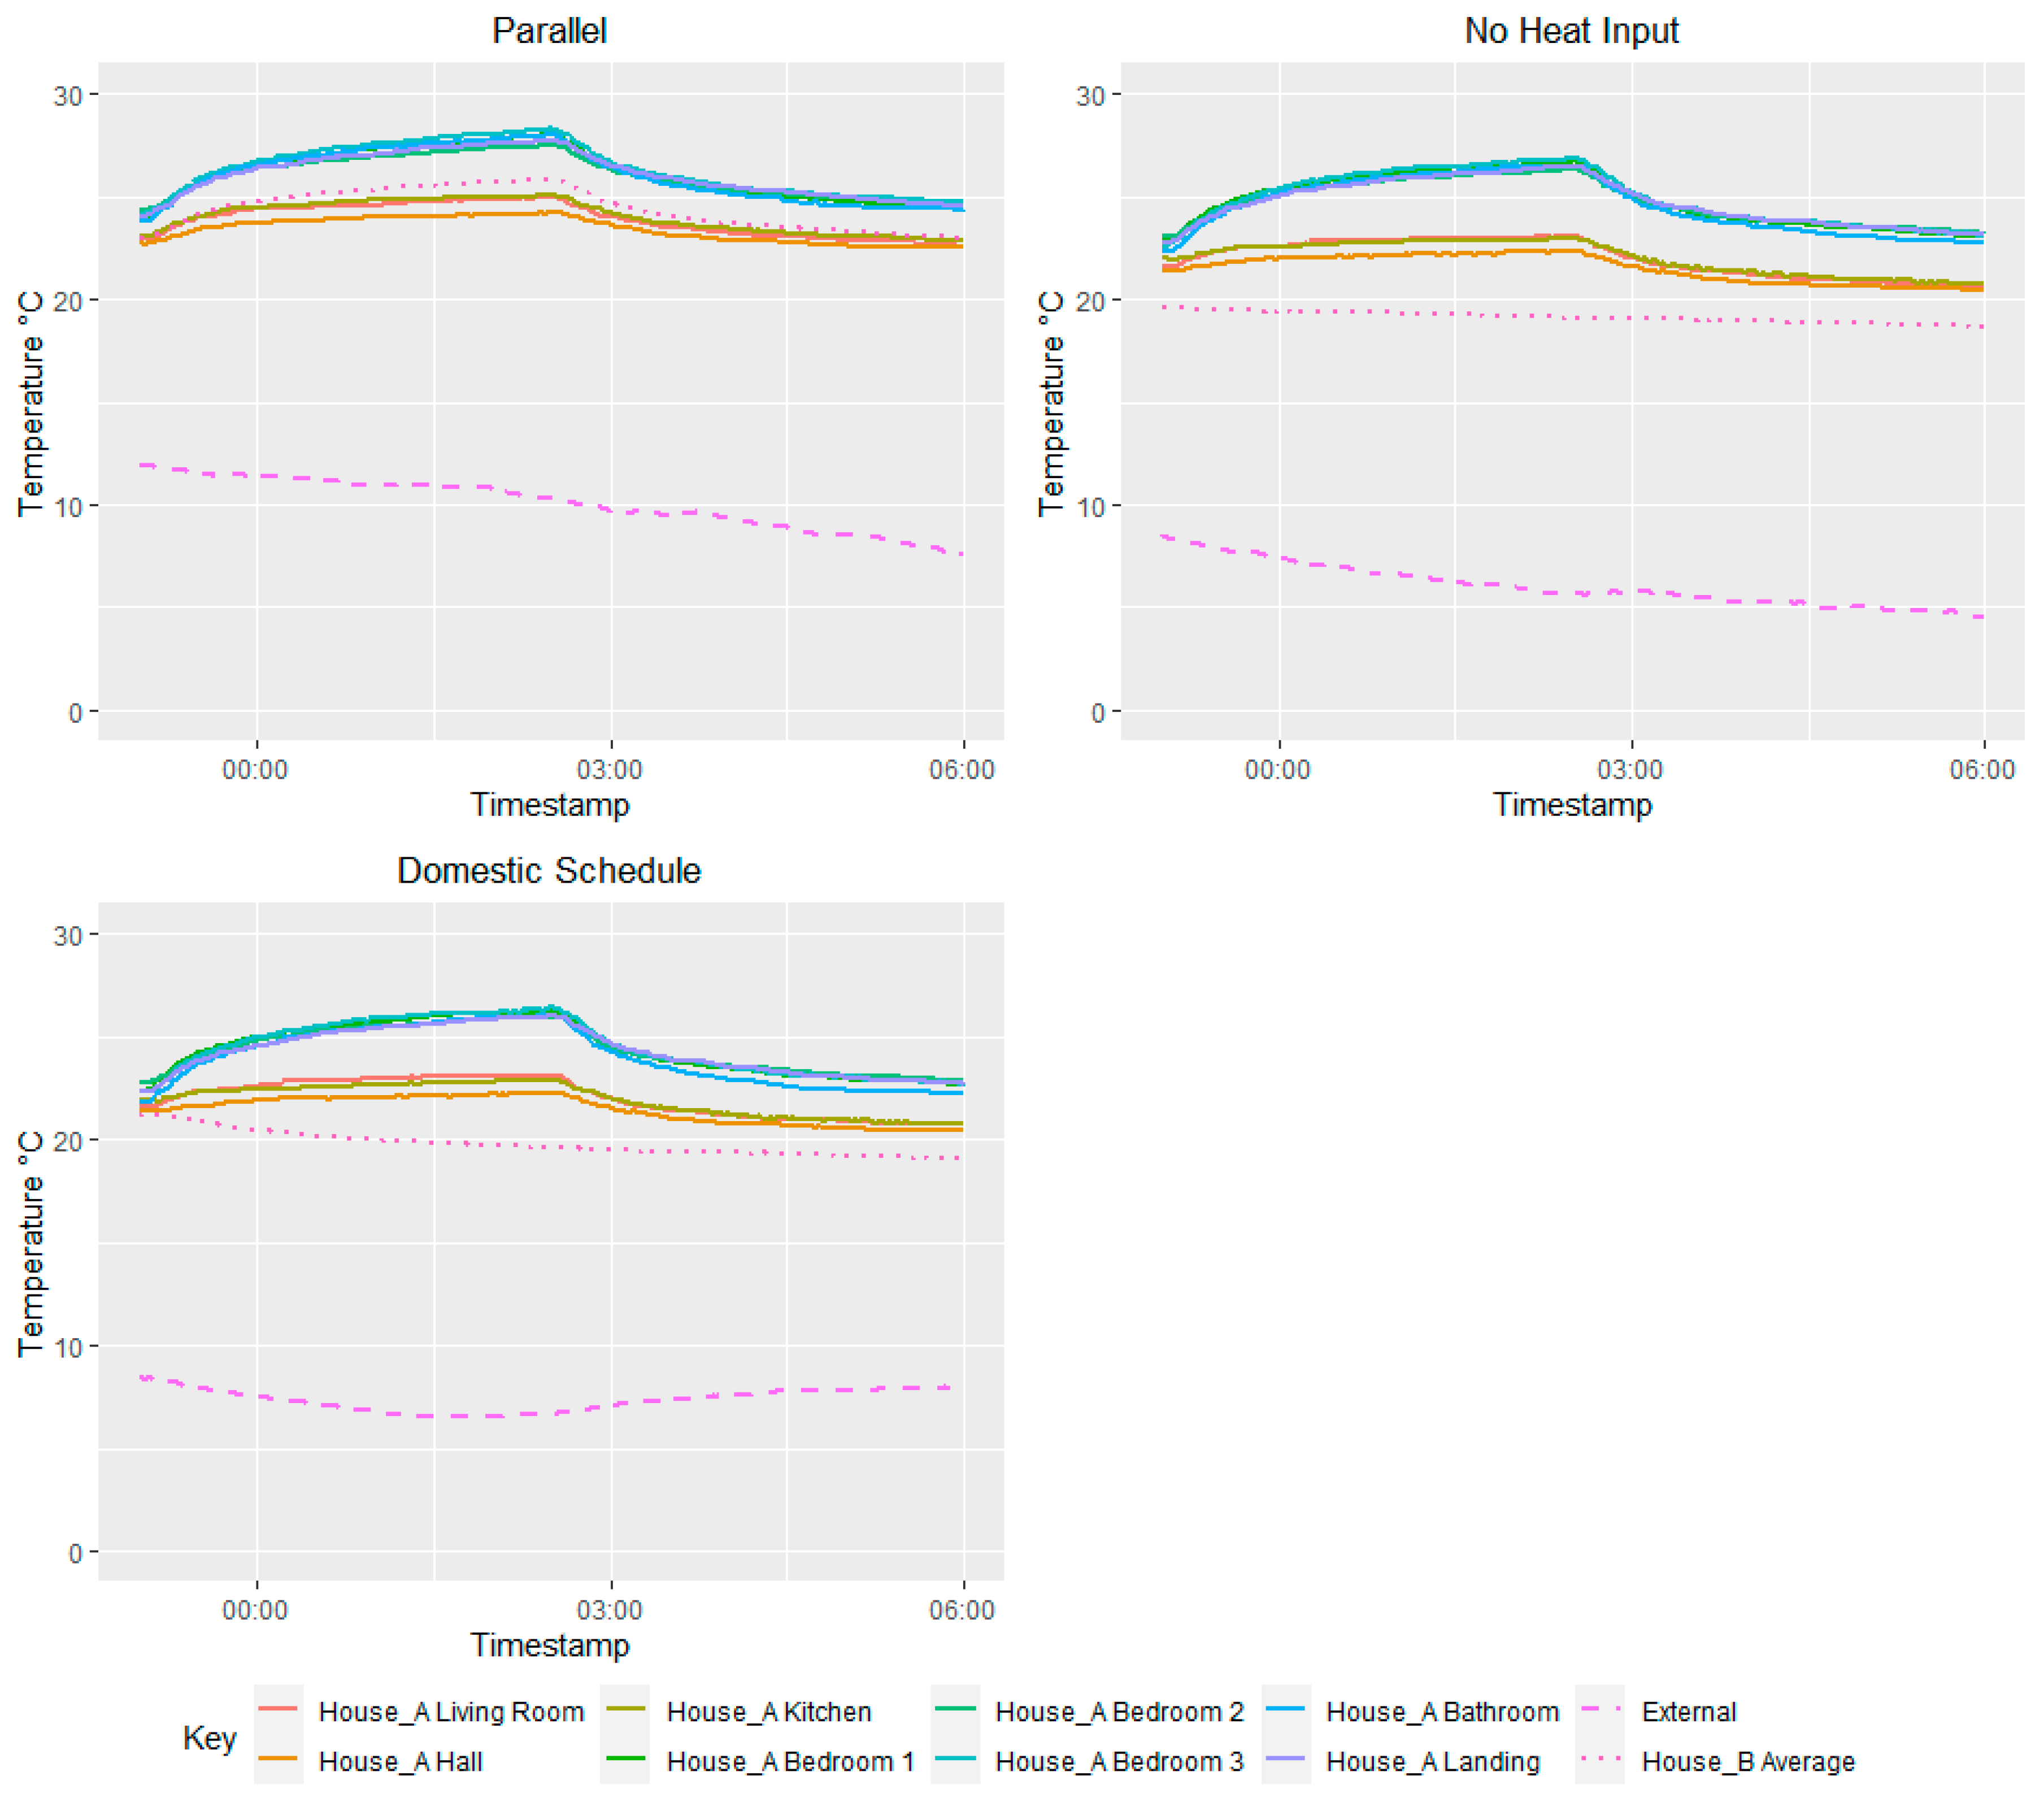
Multiple heating scenarios were applied to the control house to replicate neighbouring heating patterns that will influence party wall heat transfer. This is assuming that due to the solid party wall, heat transfer will be proportional to ΔTPW. The heating patterns are visualised in Figure 4 and described as follows:
  • Parallel. Both properties were subject to QUB tests of identical duration, starting temperature and power input;
  • Domestic Schedule. The control house was subject to a typical domestic heating schedule mimicking that described in the SAP methodology [7] with heating active between 07:00–09:00 and 16:00–23:00. The temperature setpoint was set to 21 °C downstairs and 18 °C upstairs;
  • No Heat Input. No heat input was made into the control house simulating the property being vacant.
It was expected that these patterns would provide various levels of “guarding” to the test house undergoing QUB tests. For pattern 1 ΔTPW will be close to 0 and should theoretically eliminate party wall heat transfer. It is acknowledged that in a retrofit scenario this heating pattern would be unlikely to happen unless access was available to all adjoining properties. This could occur in new build constructions if in situ measurement was undertaken as part of the commissioning process.
Patterns 2 and 3 were incorporated into the study to recreate conditions in the neighbouring property that might be present if neighbouring properties could not be accessed or monitored. Pattern 2 would be expected to introduce some temperature difference owing to the dynamic nature of the QUB test and the changing temperature in the control house outside of the heating periods. The most significant values of party wall heat transfer were expected in heating pattern 3.
Eleven consecutive QUB tests were completed on the test house. Three tests were completed with the control house in heating pattern 1 followed by four each in heating patterns 2 and 3.

3. Results and Discussion

3.1. Raw Measurements

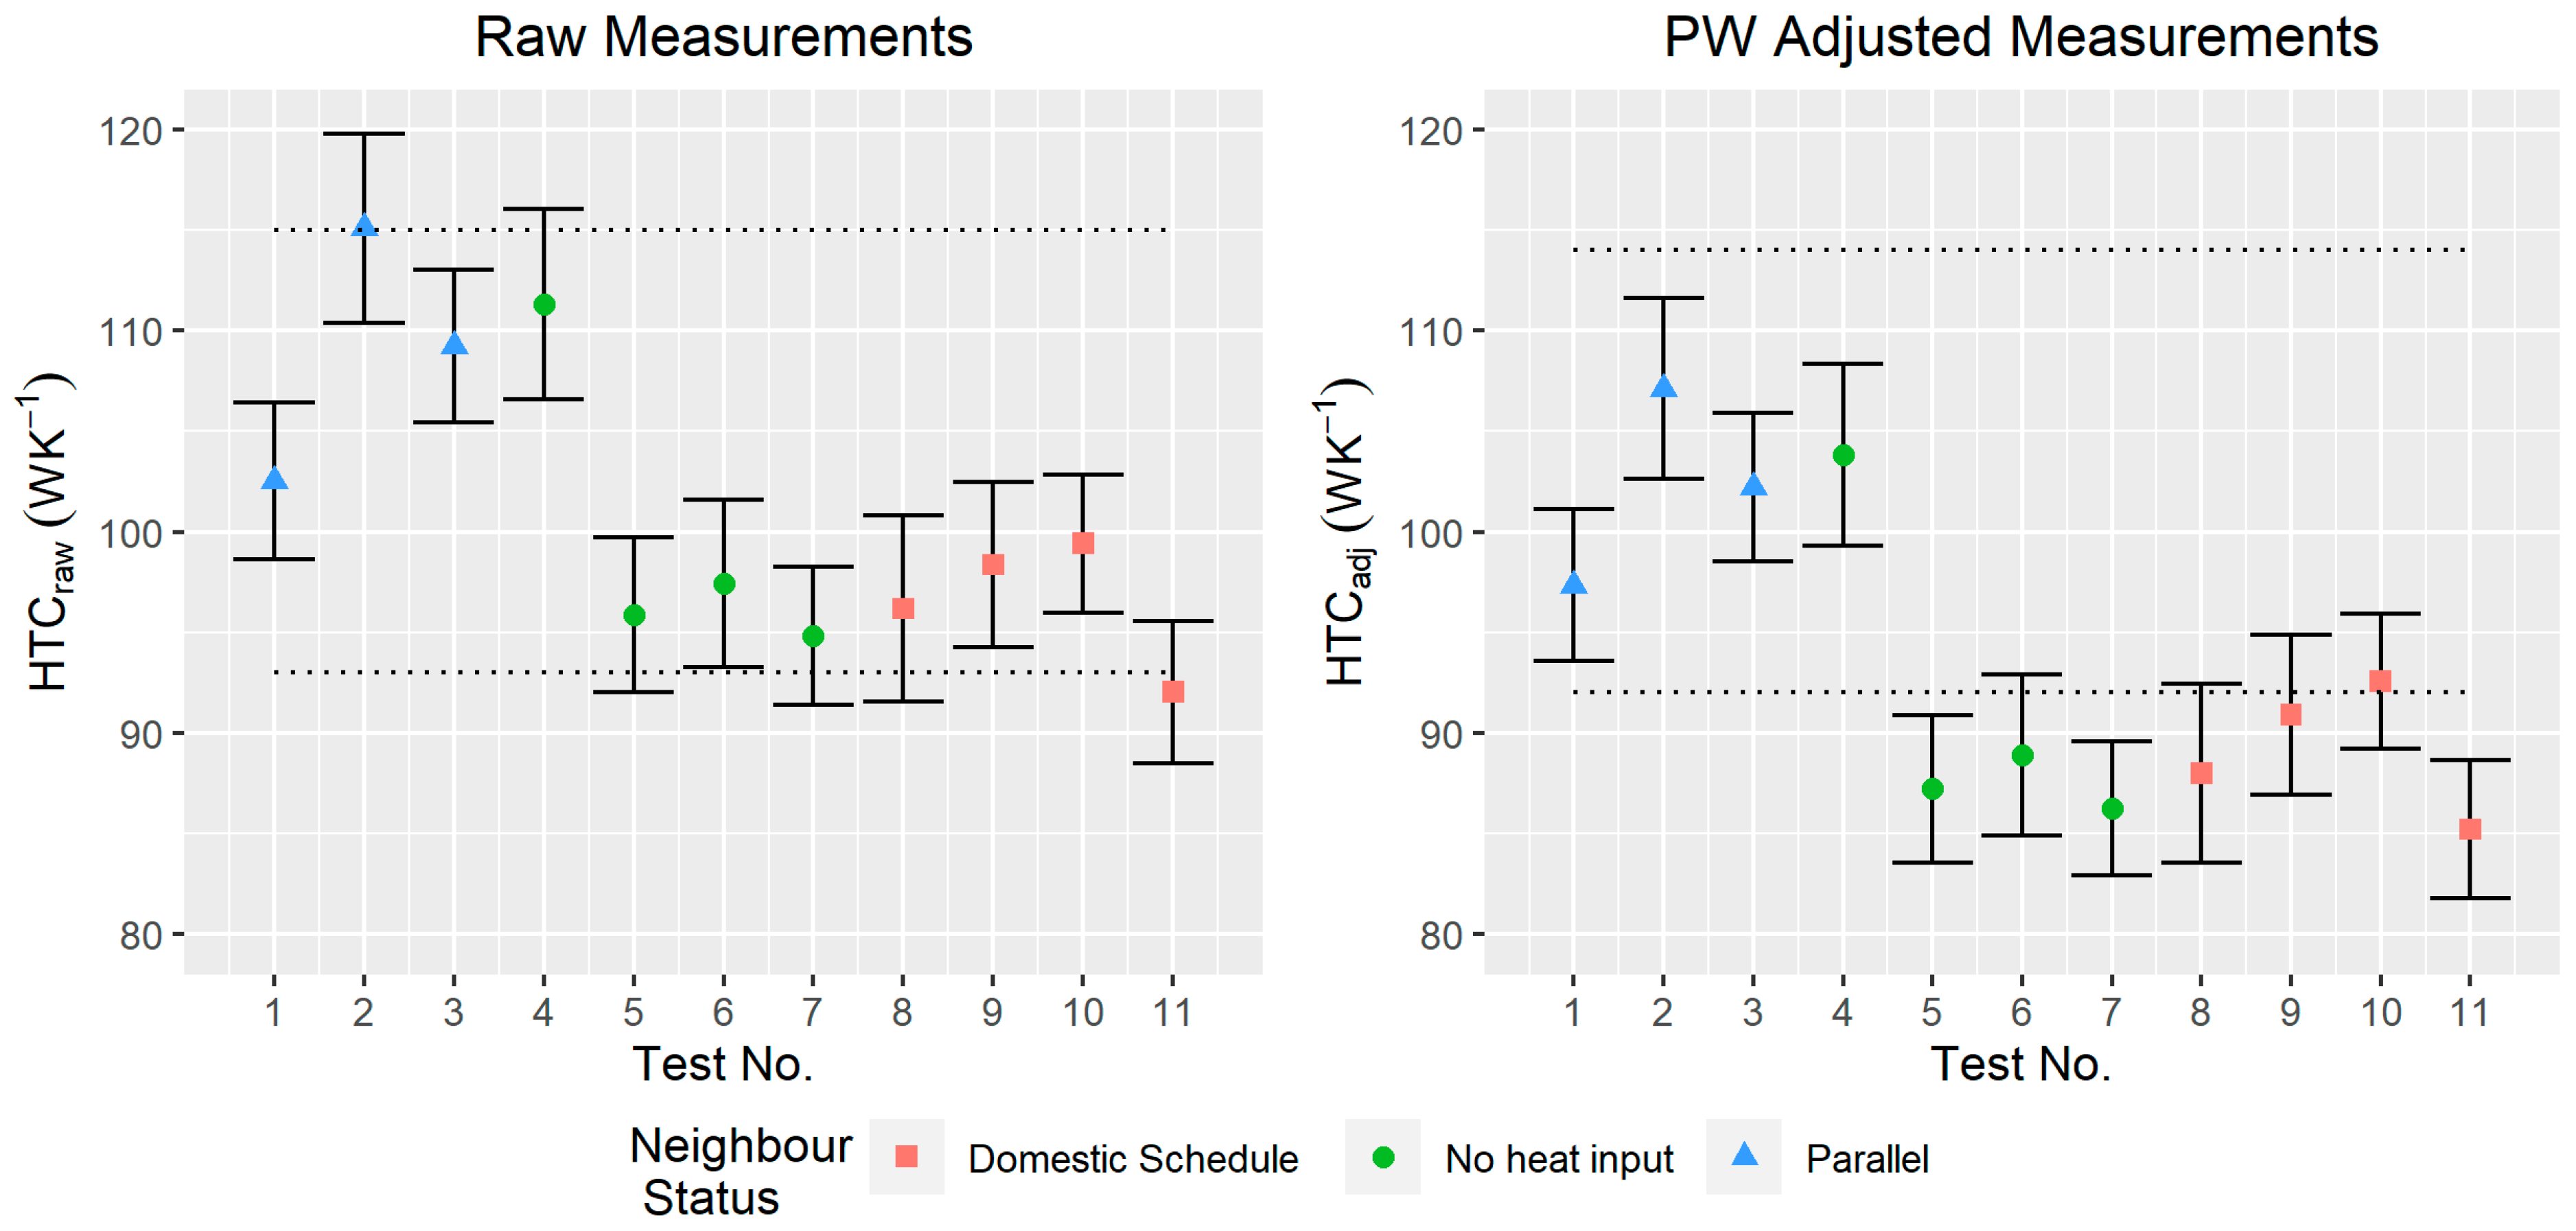
A comparison between the HTCraw QUB and coheating measurements can be viewed in Figure 5. The tests completed with the control house in the heating pattern “parallel” appear clustered higher than others. For the raw results, this is unexpected as the guarding across the party wall in this heating pattern is expected to reduce or eliminate party wall heat transfer. The range of HTCraw measurements, 23% relative to the mean, is comparable to studies of repeated QUB tests without a party wall present [24]. The QUB HTCraw measurements are also shown to be accurate against the coheating test. Each test shows overlapping uncertainty bounds with coheating independent of the control house heating pattern. This suggests that in the conditions of the study, the impact of party wall heat transfer could be negligible in contributing to the accuracy and precision of measurements.
This observation is promising as it suggests that when conducting QUB tests in the field, the ability to access, control or monitor conditions in neighbouring properties is not a requirement for accurate tests. It is important to place this observation in the context of the specific test conditions. When the control house was in the “No heat input” configuration, it had been heated relatively recently (at most four days prior) as a result of the other heating patterns applied. ΔTPW peaked at 6 K for tests completed in this configuration. This is a limitation of the study as temperature differences in the field could be much larger than this if an adjoining property had been unheated for several months. This could be even more prevalent in the winter season and in uninsulated properties resulting in greater party wall heat losses impacting HTCraw measurements.
The HTCraw results were compared against the solar radiation incident on the property during the day before the QUB test. No relationship was apparent, indicating that any stored solar heat contributions in the building fabric are negligible. This is reflective of QUB tests completed on other houses of masonry construction [23].

3.2. Party Wall Adjusted Measurements

Table 3 summarises both the raw and adjusted results of the two measurement techniques. The difference between the raw and adjusted coheating measurements is 1 WK−1. This is a difference of less than 1% of the raw measurement and falls comfortably within the uncertainty bounds of the raw measurement. This minute difference is expected as both houses were at the same internal set point during the coheating test. This also indicates that the party wall heat transfer is coplanar, driven by ΔTPW as opposed to ΔText.
Analysing the QUB measurements does not agree with this observation. Across the 11 tests, there is an average difference of 7.5 ± 3.2 WK−1 between the raw and adjusted measurements a difference equal to 8% of the average, raw QUB measurement. Four of the adjusted measurements can be considered statistically different from their respective raw result. Analysing these results in isolation could suggest heat transfer is not coplanar across the party wall and additional heat loss mechanisms are present.
Such a difference in apparent party wall heat losses would have a notable impact when assessing whole house performance and detecting any performance gap. Furthermore, the apparent party wall losses would notably impact the predicted heating demand of the property. Through modelling the energy performance of the house through the SAP calculation methodology, the additional party wall heat losses indicated through the QUB measurements equate to an additional 470 kWh annual heating demand, an increase of approximately 20% to total heat demand [7]. This would naturally be a concern to occupants or owners of the property.
This disparity in the application of party wall adjustment techniques is further demonstrated by the worsening agreement of individual measurements (larger RMSE and MBE) shown in Table 4. Additionally, the range of HTCadj measurements is 25% relative to the mean; this is a slightly larger dispersion in results than HTCraw. This observation is intriguing and is investigated further through analysing the heat flux data obtained throughout the measurements.
The individual measurement uncertainty of each QUB test is proportionally slightly lower for each HTCadj measurement than HTCraw. This is a result of lower P1/2 values being used in the uncertainty propagation calculations as the apparent party wall losses had been subtracted (Equation (5)).

3.3. Party Wall Heat Flux

In House B, a data acquisition error occurred on the ground floor and the measurements were not recoverable. As a result, the heat flux density measurements taken on the ground floor were not included in the comparisons of both sides of the party wall (Figure 6, Figure 7 and Figure 8). The party wall heat flux data presented would be expected to be approximately twice the magnitude if data from both floors were available. The available data is, however, expected to be sufficient for completing a comparative analysis between the houses, heating patterns and performance measurements undertaken.
The QPW values for each QUB test are shown for both houses in Figure 6; the error bars depict the standard deviation of QPW values recorded across the duration of the QUB test. For tests completed in the parallel heating pattern, there is notable heat flux occurring from both sides of the party wall. This is despite the mirrored conditions in each house resulting in ΔTPW < 1 K. Without the context of the coheating result demonstrating that the party wall heat transfer is coplanar, these results could indicate the presence of a party wall bypass. This observation can be explained by the party wall exhibiting charging effects throughout the QUB tests, whereby it is storing heat and becoming thermally “charged”. In this period, the heat flux density measurements reflect heat charging the fabric and contributing to the internal temperature increase. They do not record heat leaving the thermal boundary of the house. For the tests completed with House B in the “no heat input” and “domestic schedule” heating patterns, House B records a negative heat flux (heat gain into House B); however, the party wall still records a net heat rate input of 19 W on average. The lower dispersion in heat flux for House B (smaller error bars) for tests 4–11 is a consequence of no direct heat input into the property during these QUB tests.
The heat flux density measurements and subsequent party wall adjustment calculations have not been able to correctly identify party wall heat transfer as coplanar through QUB tests. This method requires further investigation and research to determine how party wall heat transfer can be evaluated as part of the QUB test.
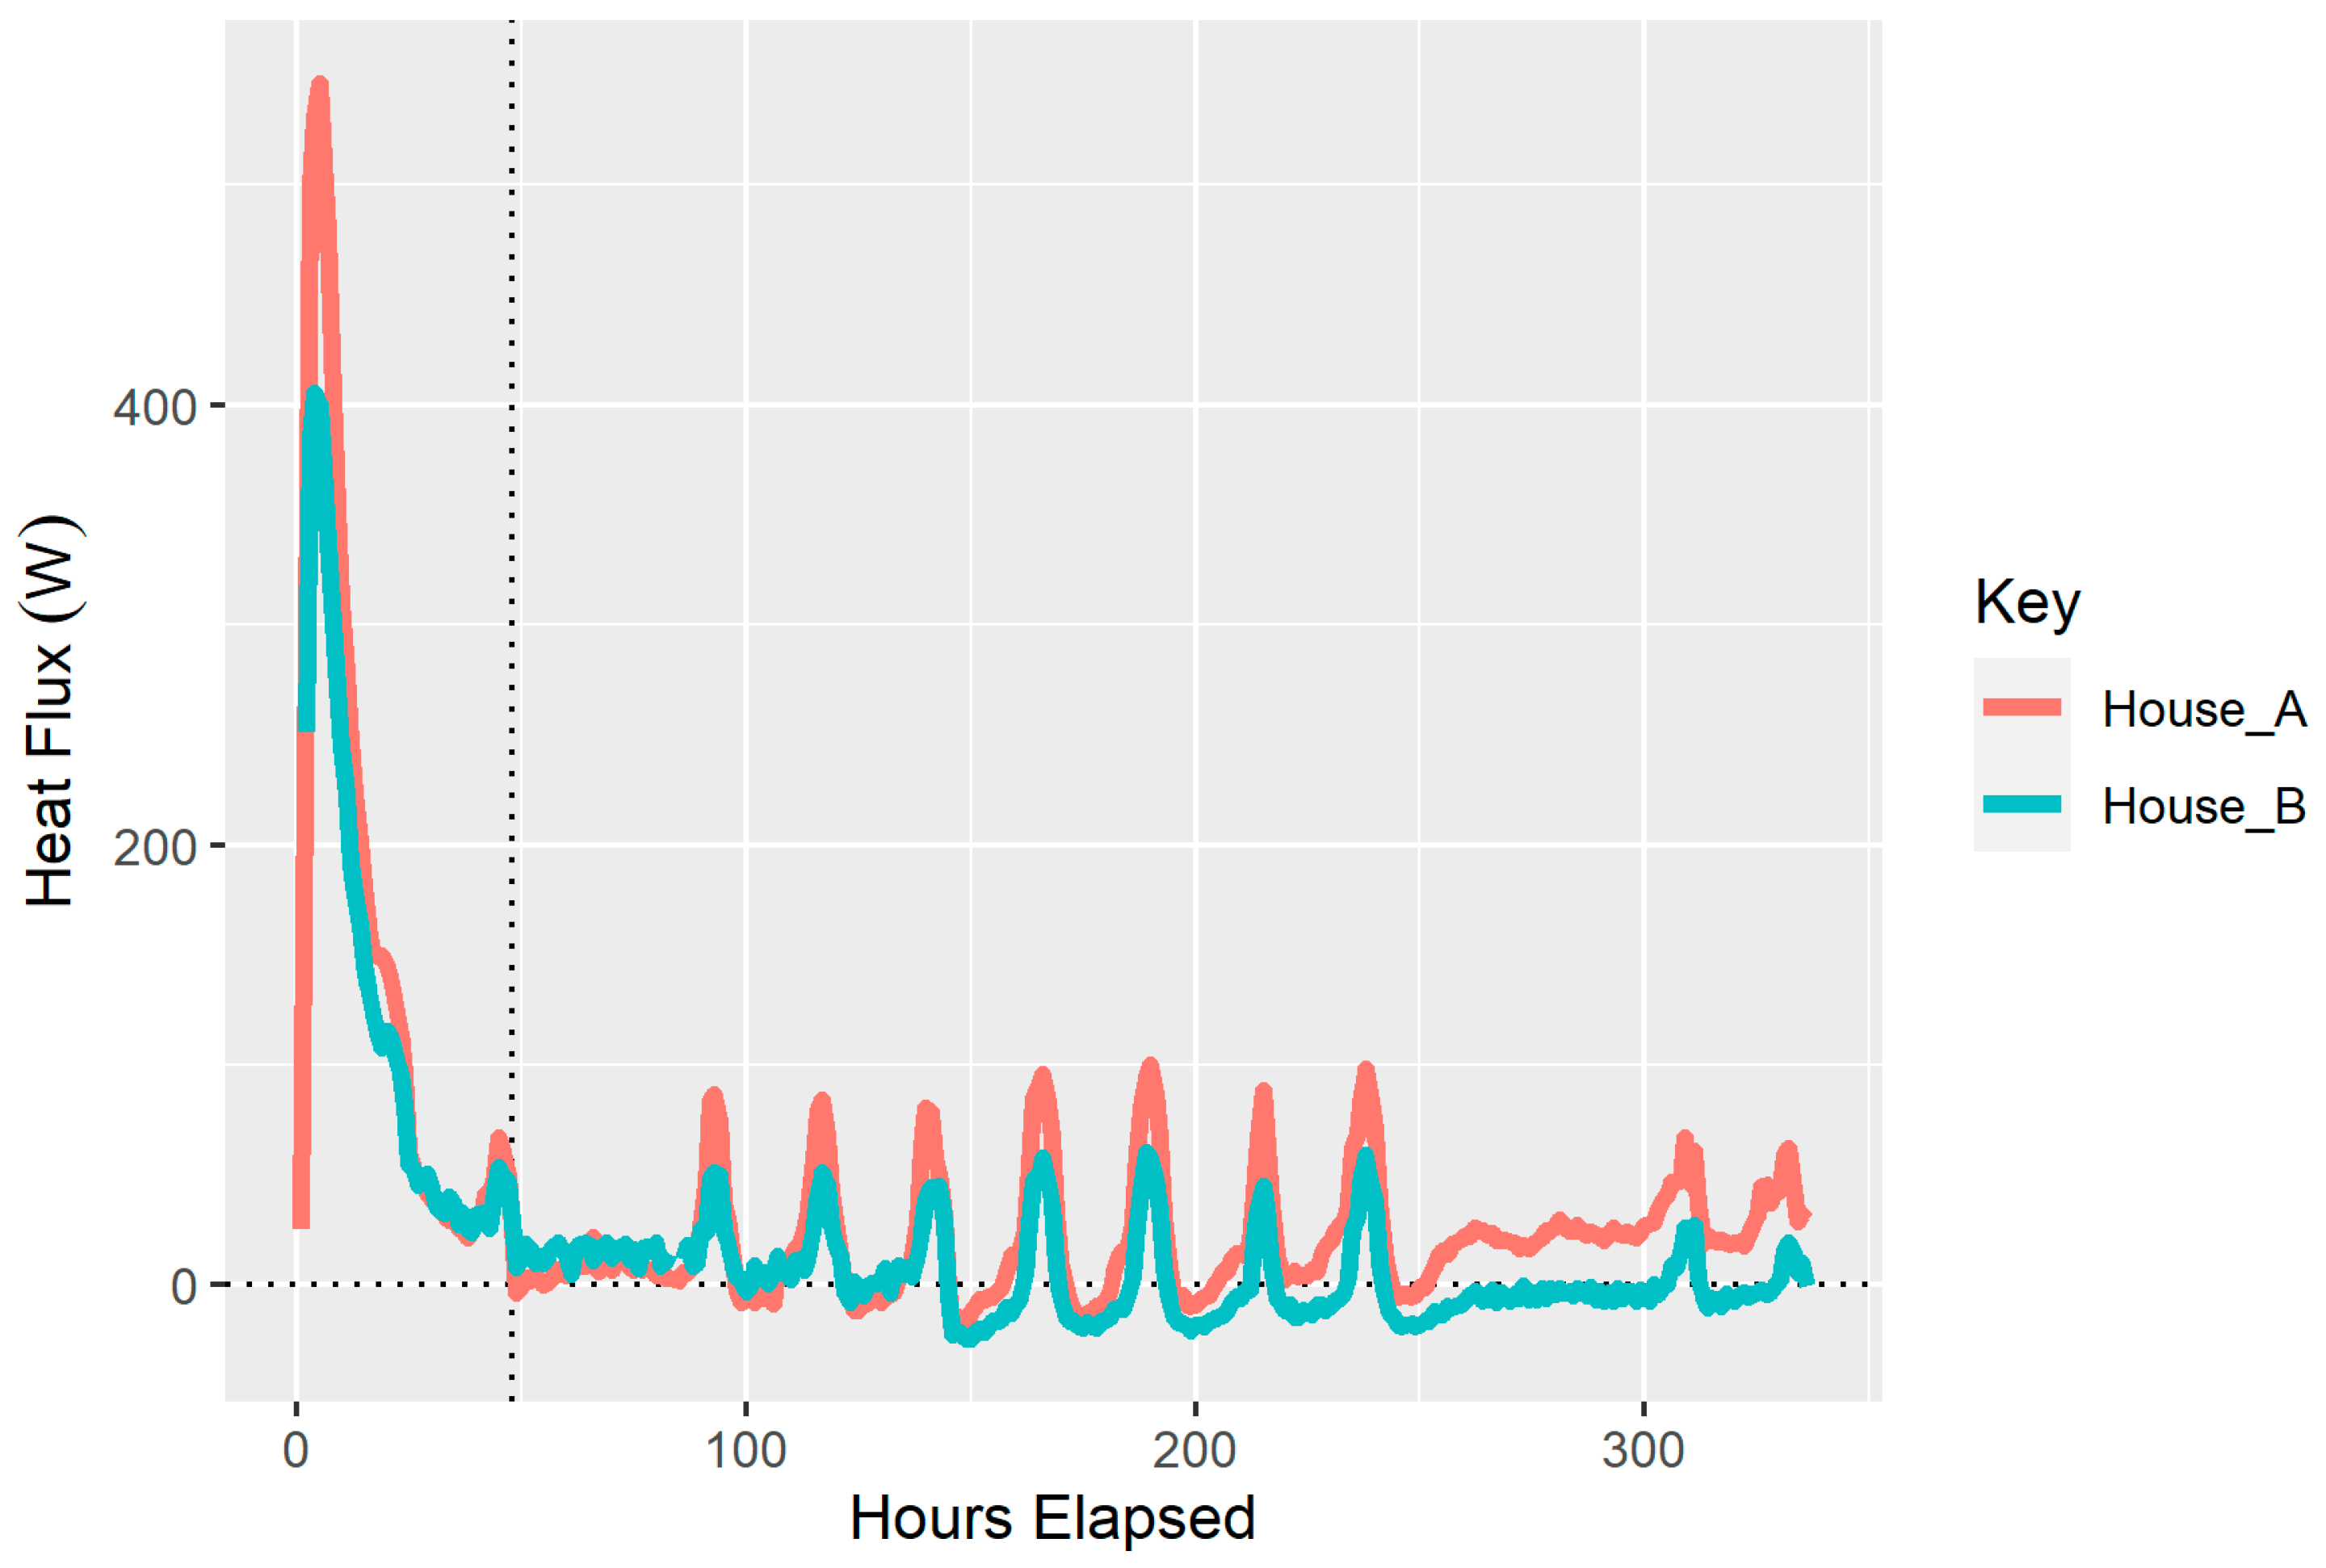
The party wall heat flux recorded during the coheating test for both houses is shown in Figure 7. This shows that the party wall also exhibits substantial charging at the commencement of the coheating test. After approximately 48 h, the profile of the heat flux becomes more stable, oscillating between positive and negative with spikes in each day presumably caused by diurnal solar patterns. When using heat flux density measurements, it is desirable to shield them from direct solar radiation by placing them on elevations out of the path of direct solar. As the instruments needed to be fixed to specific elements, it was not possible to eliminate this completely.
From 48 h onwards, the party wall can be seen as heat saturated, and the storage effects become negligible resulting in the minute difference between HTCraw and HTCadj displayed in Table 4. The data recorded in the initial 48 h coheating period was not used in the analysis to calculate the HTC of the test house. This is typical of the coheating procedure independent of whether a party wall is present in the property. At the start of the coheating test, an initial heat-up period is required to remove moisture loads in the property and allow the entire fabric to become heat saturated. This is particularly true after the application of wet trades, e.g., plaster or concrete.
Based on this observation, if a coheating test has a specific objective of analysing party wall heat transfer, it may be appropriate to allow additional scheduled time for the party wall to complete charging. The 48 h charging duration could be longer for buildings with higher thermal mass.
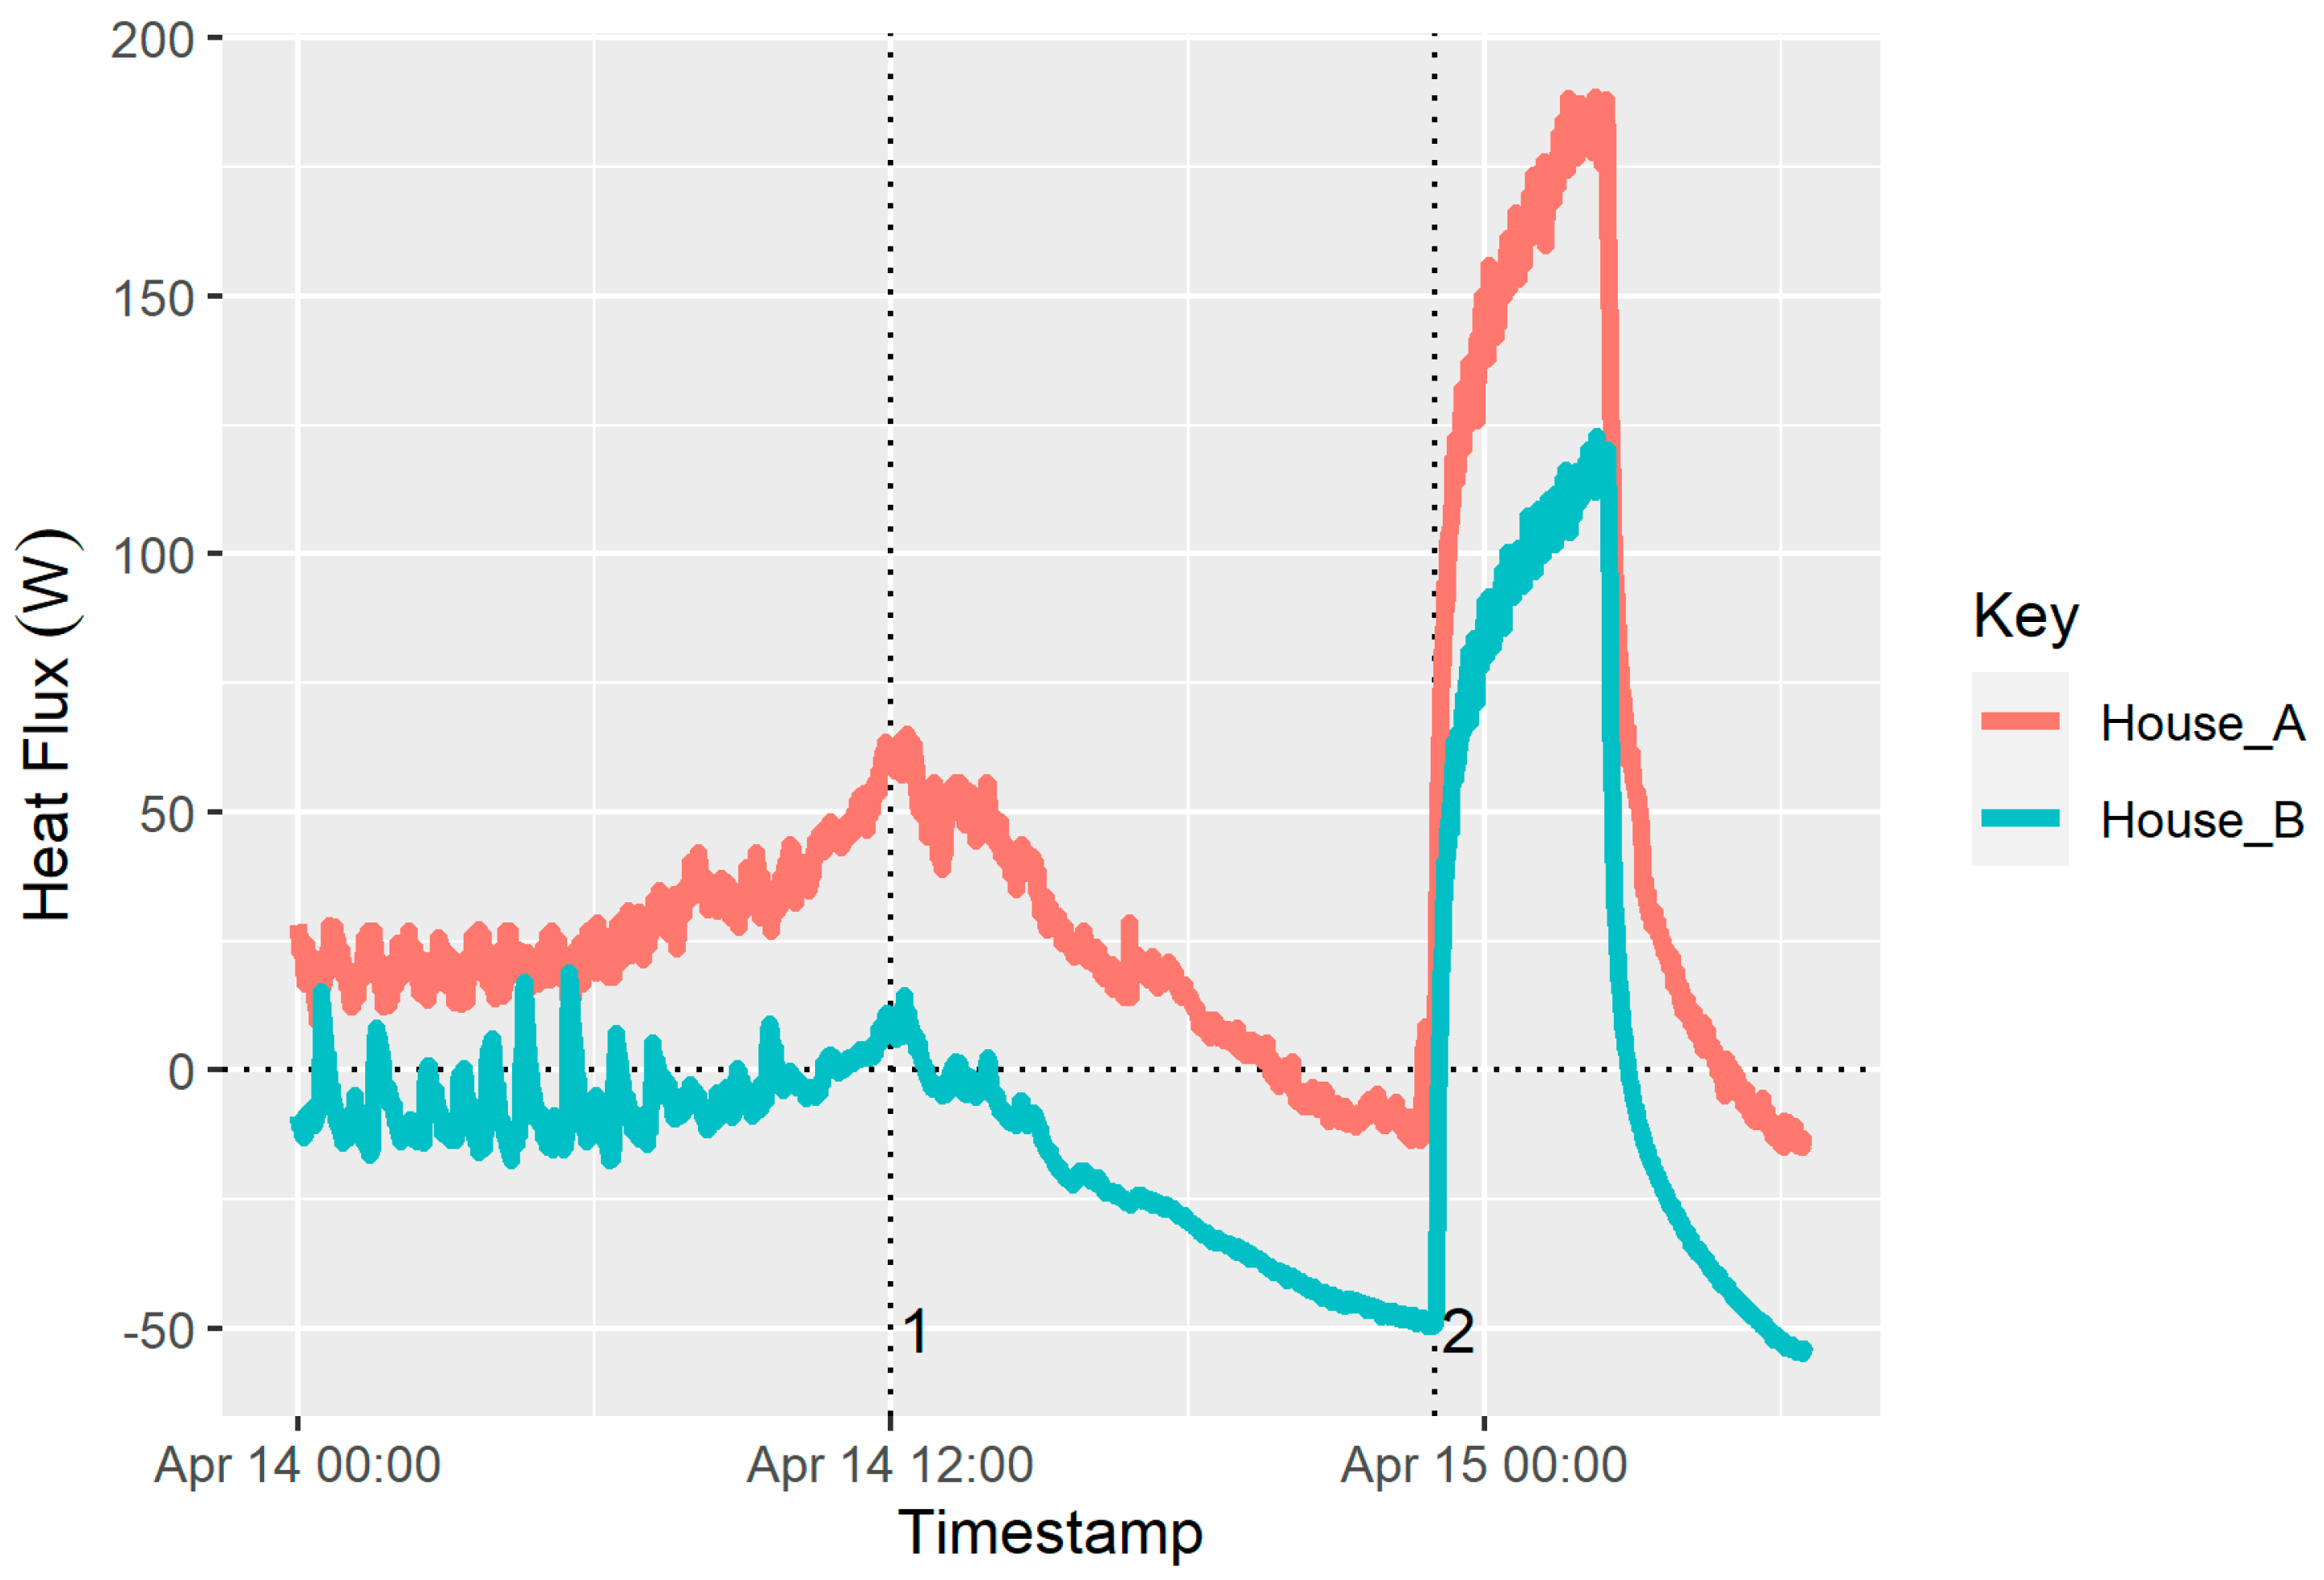
The party wall was charged and exhibiting stable heat transfer only 11 h before the first QUB test. Nevertheless, there is no evidence that this impacted either the HTCraw or party wall heat flux measurement. HTCraw and HTCadj measurements from the first test were in the midrange of measurements, and the QPW profile is comparable to the other nights in the same heating pattern. Figure 8 shows the party wall was thermally discharging after the coheating test is completed (point 1) and had started to exhibit negative heat flux by the commencement of the first QUB test (point 2). It is unlikely that such extremes of thermal saturation would be obtained outside of the specific circumstances identified in this study (coheating followed immediately by QUB). These would likely not be a concern for practitioners completing QUB tests in the field.
The heat flux profile of House A is generally greater than House B in the coheating test despite both houses having the same internal temperature. This replicates the pattern observed in QUB tests completed with House B in the parallel heating pattern (Figure 6). Differing thermal resistance at the location of the heat flux density measurements could have led to this observation. As with the limitations of spot heat flux density measurements, additional measurement points would improve the representation of heat flux through the entire fabric element. This would be advisable for any further work in this area. Additionally, House B had in-built wardrobes installed in front of the party wall, which may have impacted heat flow to the element.
Comparing the heat flux density measurements from each location in House A, the upstairs measurement points were similar. For each QUB test, the mean heat flux density measurement differed by ±7% on average between each room. This dispersion could have been caused by the same-size heaters being deployed in rooms of varying sizes leading to differing heat input/heat loss ratios for each room. This is demonstrated by the smaller upstairs bedroom recording higher heat flux density measurements than the larger. Furthermore, the upstairs measurements were consistently of a higher magnitude than the downstairs measurement. This could be a result of the stack effect moving warm air to the first floor of the house.

3.4. Temperature Evolution

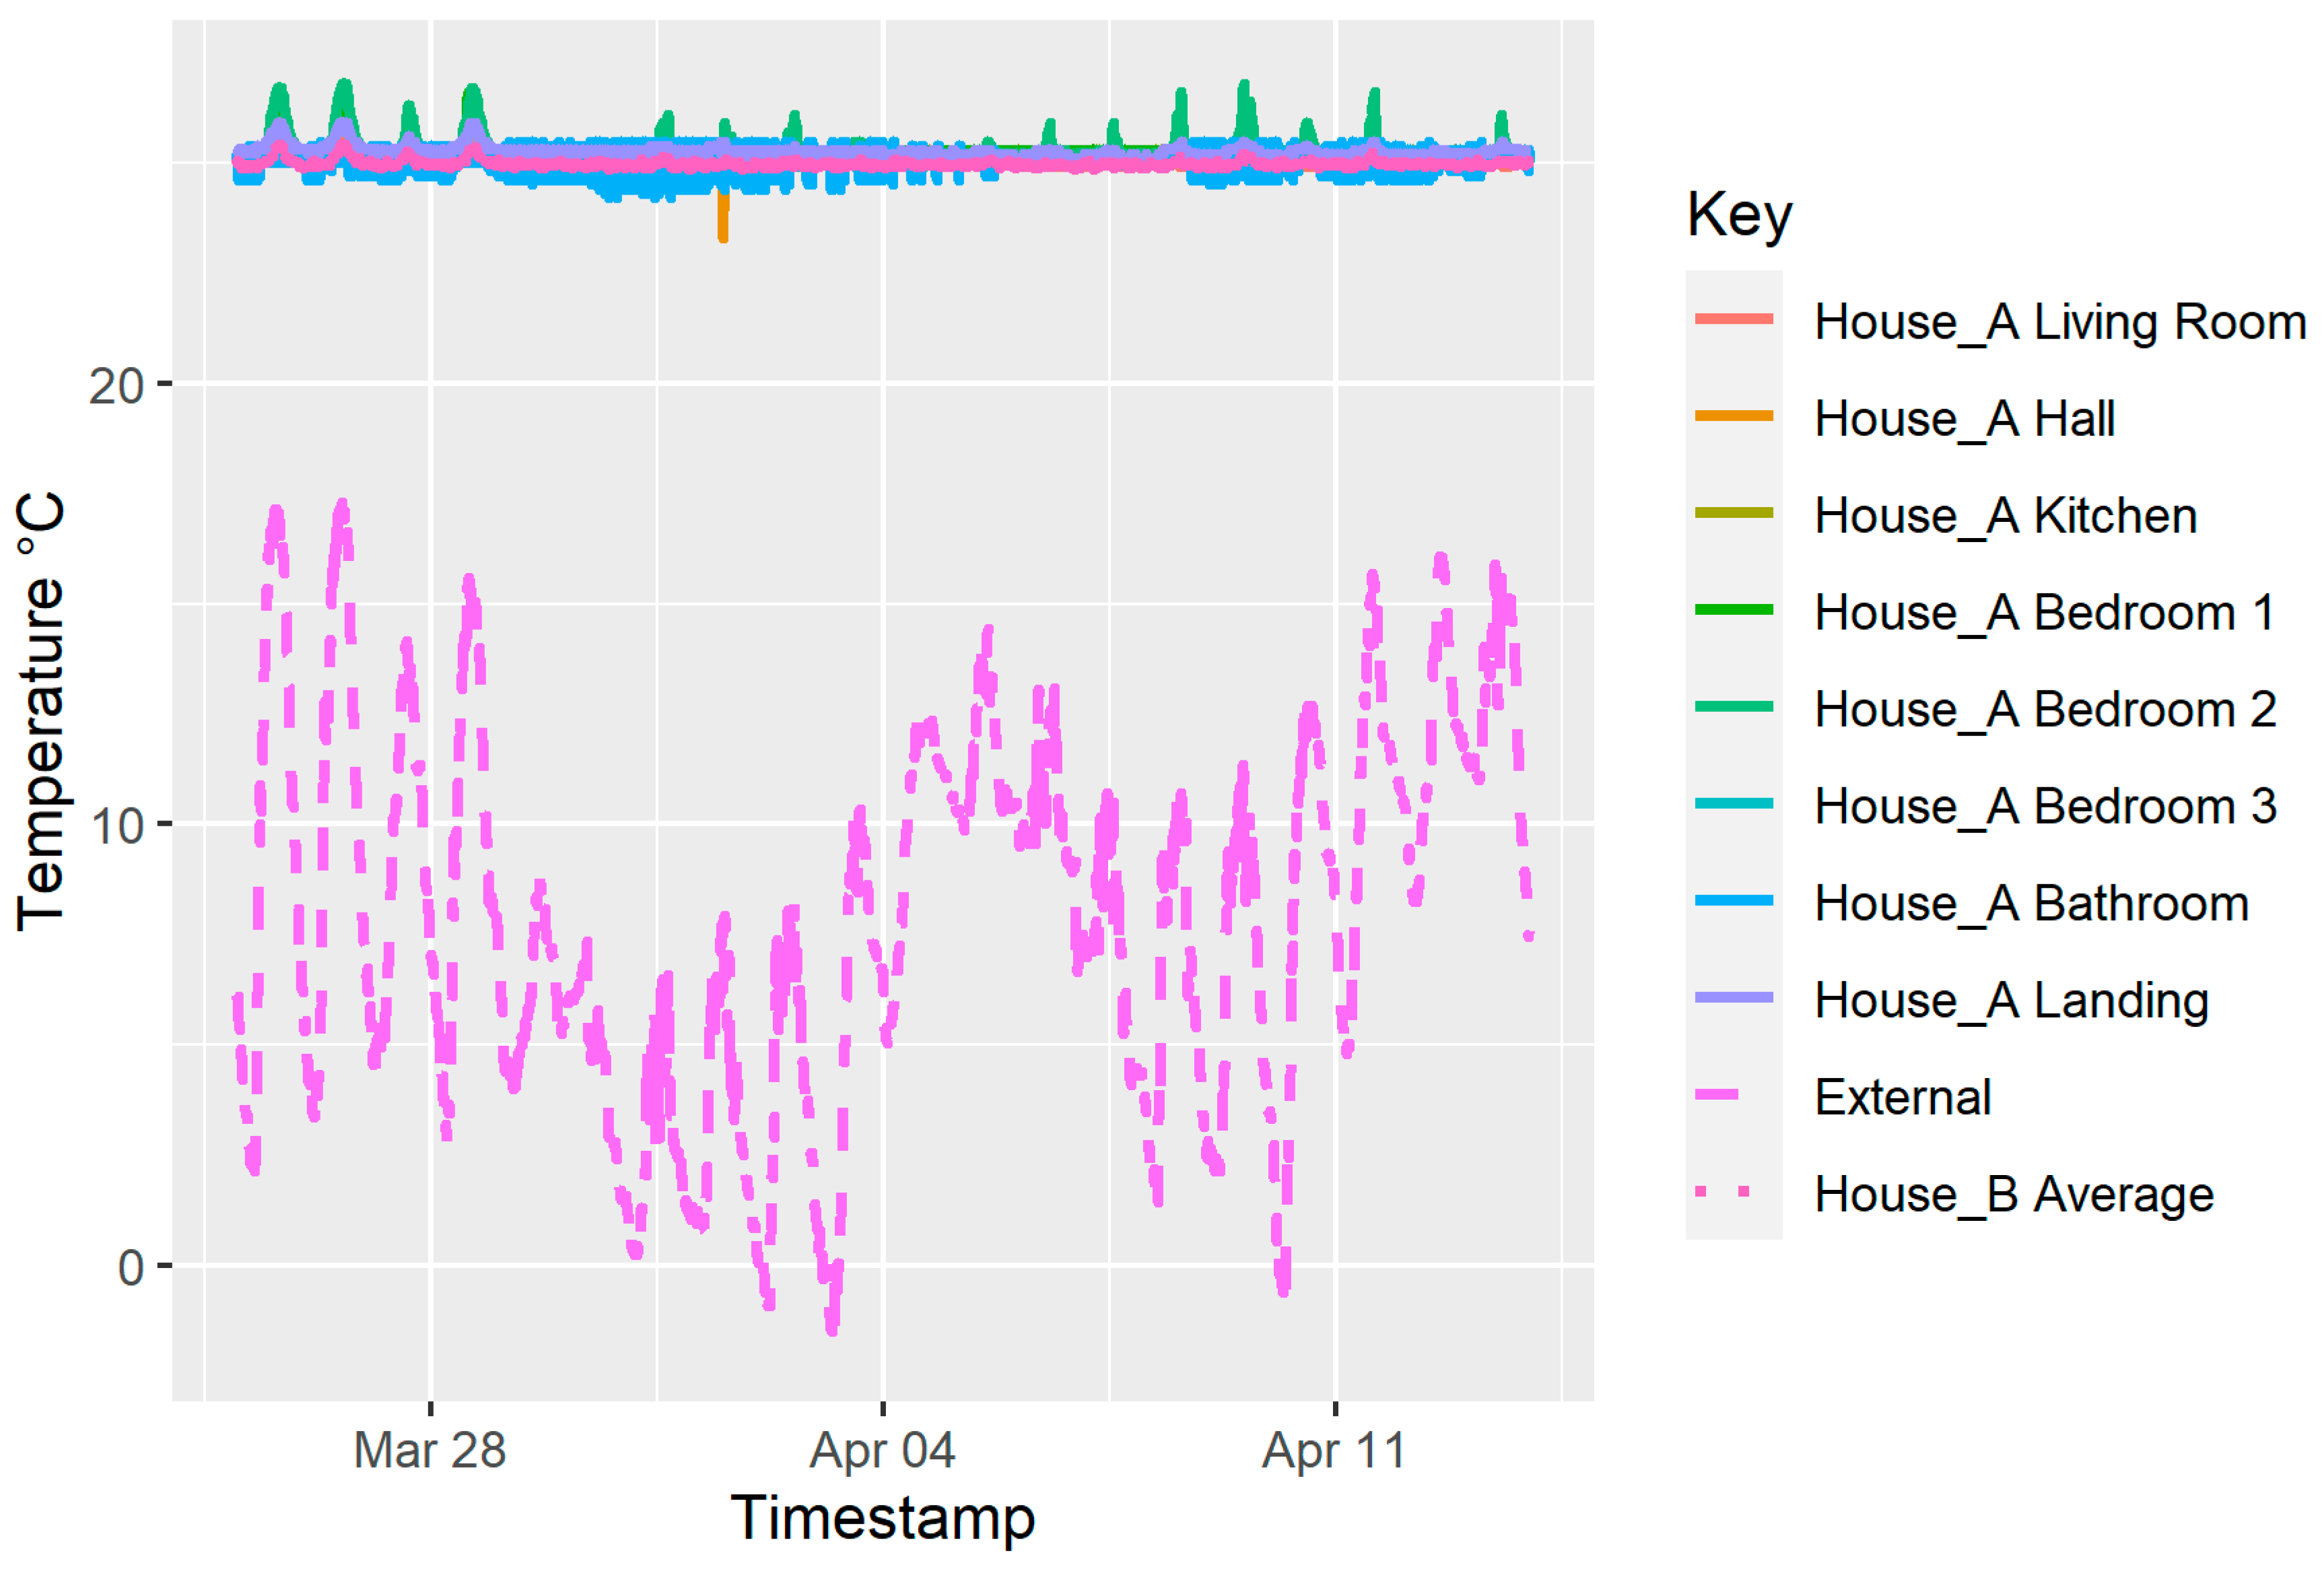
The coheating protocol requires a uniform internal temperature to be obtained throughout the measurement to obtain quasi-steady state conditions. Figure 9 shows a highly uniform internal setpoint of 25 °C in houses A and B was achieved through the use of circulation fans and thermostatically controlled heaters. Over the duration of the coheating test, ΔTPW was, on average, 0.2 K indicating a high degree of guarding across the party wall was achieved.
Throughout the coheating test, some slight variation in internal temperature is unavoidable due to phenomena such as the stack effect and solar heat gain. In House A, the range of internal temperatures was, on average, 0.4 K between the highest and lowest temperature at any point over the duration of the measurement.
For the daily aggregated intervals, the values of ΔText ranged from 12.6 to 22.5 K. This represents optimal conditions for coheating as the minimum ΔText of 10 K is exceeded, and the range of ΔText values ensures a strong linear regression is performed.
Such a uniform internal temperature is not realised in QUB tests. As a dynamic test, the temperature evolution in each room will be unique, largely dependent on the room’s ratio of heat input to heat loss occurring in the test. Figure 10 shows the temperatures in the first-floor rooms observing larger temperature increases than the larger rooms on the ground floor. This mirrors the pattern observed in party wall heat flux. The average range of internal temperatures across all the QUB tests was 3.3 K, considerably higher than that recorded in the coheating test. Despite the range in internal temperatures, the overall volume-weighted average used in the measurements (Equation (2)) was sufficient in giving a representative internal temperature. This is evidenced by the accuracy of the raw QUB tests against the reference coheating measurement (Figure 5).
It has been suggested that variability in internal temperature can impact the accuracy of QUB measurements, although this has not been explored in great detail [25]. Further work is needed to validate this suggestion and increase the understanding of how heterogonous internal temperatures can impact QUB measurements.
With house B in the parallel configuration, the average value of ΔTPW was 0.8 K, 4 times larger than coheating. For the no heat input and domestic schedule tests, the average ΔTPW values were 3.9 K and 3.3 K, respectively.

4. Conclusions

This paper presents the findings from a field-based case study exploring the behaviour and impact of party walls in the following two methods of whole house building performance measurement: QUB and coheating.
Two different party wall heat transfer behaviours were identified in the results. Throughout the QUB tests and the first 48 h of coheating, the party wall is thermally charging; for the remainder of the coheating test, the party wall is heat-saturated and exhibits stable but negligible heat exchange between the two properties. The heat flux density measurements taken during the charging periods are not reflective of heat leaving the thermal envelope and will contribute to the increase in internal temperature. As such, attempting to isolate party wall heat loss from whole house measurements (calculation of HTCadj) through QUB can give an overestimation of party wall heat losses, i.e., lower HTCs being reported. This is shown to lead to misleading comparisons between measurements from the two test procedures. In the case presented, the QUB tests indicated that party wall heat loss was over seven times larger than that recorded in the coheating test. Further work in this area is needed to determine if party wall heat transfer can successfully be isolated from QUB measurements.
The HTCraw QUB measurements were accurate with the reference coheating measurement, despite differing heating patterns being applied in the neighbouring property. All 11 HTCraw QUB measurements had overlapping confidence intervals with the coheating measurements and resulted in a root mean squared error of 7%. This was achieved without applying any party wall adjustment process. This is a useful finding as party walls are common within the housing population, and when practitioners complete QUB tests in semi-detached houses, access to the adjoining property or the ability to monitor temperature and/or heat flux density is not guaranteed.
Caution should be applied generalising these findings to other properties. Properties with a larger party wall ratio could result in a more detectable impact. Conversely, in modern properties where the party wall is insulated, the effects of party wall heat transfer could be lessened. Further studies on properties with different party wall characteristics (insulated, cavity party wall, terraced properties) should be completed to determine if the same negligible impact on measurements can be detected.

Author Contributions

M.C. conducted the field testing, QUB, temperature evolution and heat flux density data analysis, conceived the idea for the study and wrote the paper. A.H. conducted the field testing, coheating analysis and contributed to the writing of the paper. D.G. and J.M. contributed to the writing of the paper. All authors have read and agreed to the published version of the manuscript.

Funding

This research was completed as part of a PhD joint funded by Leeds Beckett University and Saint-Gobain.

Data Availability Statement

The data presented in this study are available on request from the corresponding author. The data are not publicly available due to privacy.

Acknowledgments

The work presented in this paper expands on measurements initially completed as part of the DEEP (Demonstration of Energy Efficiency Potential) project funded by The Department for Energy Security and Net Zero (DESNZ).

Conflicts of Interest

The authors declare no conflict of interest.

References

  1. Parker, J.; Fletcher, M.; Thomas, F.; Miles-Shenton, D.; Brooke-Peat, M.; Johnston, D.; Gorse, C.; Glew, D. Demonstration of Energy Efficiency Potential: Literature Review of Benefits and Risks in Domestic Retrofit Practice and Modelling; Department for Energy Security and Net Zero: London, UK, 2021.
  2. HM Government. Conservation of Fuel and Power (Approved Document L1A); 2021 Edition Incorporating 2023 Amendments; HM Government: London, UK, 2021.
  3. Johnston, D.; Miles-Shenton, D.; Farmer, D. Quantifying the domestic building fabric “performance gap”. Build. Serv. Eng. Res. Technol. 2015, 36, 614–627. [Google Scholar] [CrossRef]
  4. Fitton, R. Building Energy Performance Assessment Based on In-Situ Measurements: Challenges and General Framework (Report); Energy in Building and Communities Programme: Leuven, Belgium, 2021. [Google Scholar]
  5. Deb, C.; Gelder, L.V.; Spiekman, M.; Pandraud, G.; Jack, R.; Fitton, R. Measuring the heat transfer coefficient (HTC) in buildings: A stakeholder’s survey. Renew. Sustain. Energy Rev. 2021, 144, 111008. [Google Scholar] [CrossRef]
  6. BS ISO 13789:2017; Thermal Performance of Buildings—Transmission and Ventilation Heat Transfer Coefficients—Calculation Method. BSI: London, UK, 2017.
  7. BRE. SAP 2012 the Government’s Standard Assessment Procedure for Energy Rating of Dwellings; BRE: Garston, UK, 2014. [Google Scholar]
  8. Chynoweth, P. The Party Wall Casebook, 1st ed.; Blackwell: Oxford, UK, 2003; Volume 4. [Google Scholar]
  9. Department for Levelling Up Housing and Communities. English Housing Survey Headline Report 2020–21; Department for Levelling Up Housing and Communities: London, UK, 2021.
  10. Lowe, R.J.; Wingfield, J.; Bell, M.; Bell, J.M. Evidence for heat losses via party wall cavities in masonry construction. Build. Serv. Eng. Res. Technol. 2007, 28, 161–181. [Google Scholar] [CrossRef]
  11. Palmer, J.; Terry, N. Looking Critically at Heat Loss through Party Walls. Sustainability 2022, 14, 3072. [Google Scholar] [CrossRef]
  12. Gorse, C.; Glew, D.; Johnston, D.; Fylan, F.; Miles-Shenton, D.; Smith, M.; Brooke-Peat, M.; Farmer, D.; Stafford, A.; Parker, J.; et al. Core Cities Green Deal Monitoring Project; Department for Energy Security and Net Zero: London, UK, 2017.
  13. Johnston, D.; Miles-Shenton, D.; Farmer, D.; Wingfield, J. Whole House Heat Loss Test Method (Coheating); Leeds Beckett University: Leeds, UK, 2013. [Google Scholar]
  14. Jack, R.; Loveday, D.; Allinson, D.; Lomas, K. First evidence for the reliability of building co-heating tests. Build. Res. Inf. 2018, 46, 383–401. [Google Scholar] [CrossRef]
  15. Stafford, A.; Johnston, D.; Miles-Shenton, D.; Farmer, D.; Brooke-Peat, M.; Gorse, C. Adding value and meaning to coheating tests. Struct. Surv. 2014, 32, 331–342. [Google Scholar] [CrossRef]
  16. Leeds Sustainability Institute. Regulations and Standards. 2023. Available online: https://www.leedsbeckett.ac.uk/research/leeds-sustainability-institute/regulations-and-standards/ (accessed on 22 March 2023).
  17. Marshall, A.; Francou, J.; Fitton, R.; Swan, W.; Owen, J.; Benjaber, M. Variations in the U-value measurement of a whole dwelling using infrared thermography under controlled conditions. Buildings 2018, 8, 46. [Google Scholar] [CrossRef]
  18. Stamp, S.F. Assessing Uncertainty in Co-Heating Tests: Calibrating a Whole Building Steady State Heat Loss Measurement Method; University College London: London, UK, 2016. [Google Scholar]
  19. Ahmad, N.; Ghiaus, C.; Qureshi, M. Error analysis of QUB method in non-ideal conditions during the experiment. Energies 2020, 13, 3398. [Google Scholar] [CrossRef]
  20. Alzetto, F.; Pandraud, G.; Fitton, R.; Heusler, I.; Sinnesbichler, H. QUB: A fast dynamic method for in-situ measurement of the whole building heat loss. Energy Build. 2018, 174, 124–133. [Google Scholar] [CrossRef]
  21. Alzetto, F.; Farmer, D.; Fitton, R.; Hughes, T.; Swan, W. Comparison of whole house heat loss test methods under controlled conditions in six distinct retrofit scenarios. Energy Build. 2018, 168, 35–41. [Google Scholar] [CrossRef]
  22. Meulemans, J.; Alzetto, F.; Farmer, D.; Gorse, C. QUB/e: A novel transient experimental method for in situ measurements of the thermal performance of building fabrics. In Building Information Modelling, Building Performance, Design and Smart Construction; Springer: Cham, Switzerland, 2017; pp. 115–127. [Google Scholar] [CrossRef]
  23. Sougkakis, V.; Meulemans, J.; Wood, C.; Gillott, M.; Cox, T. Field testing of the QUB method for assessing the thermal performance of dwellings: In situ measurements of the heat transfer coefficient of a circa 1950s detached house in UK. Energy Build. 2021, 230, 110540. [Google Scholar] [CrossRef]
  24. Sougkakis, V.; Meulemans, J.; Wood, C.; Gillott, M.; Cox, T. Evaluation of the precision and accuracy of the QUB/e method for assessing the as-built thermal performance of a low-energy detached house in UK. Energy Build. 2022, 255, 111643. [Google Scholar] [CrossRef]
  25. HM Government. Technical Evaluation of SMETER Technologies (TEST) Project; Department for Energy Security and Net Zero: London, UK, 2022.
  26. Meulemans, J.; Farmer, D.; Gorse, C.; Cox, T.; Pühringer, T.; Meulemans, J. Validation of external wall retrofit measures based on rapid and accurate in situ measurements. In Proceedings of the Beyond 2020 World Sustainable Built Environment Conference, Gothenburg, Sweden, 9–15 June 2020. [Google Scholar]
  27. Meulemans, J. An Assessment of the QUB/e Method for Fast In Situ Measurements of the Thermal Performance of Building Fabrics in Cold Climates. In Proceedings of the Cold Climate HVAC 2018, Kiruna, Sweden, 12–15 March 2018. [Google Scholar] [CrossRef]
  28. Ghiaus, C.; Alzetto, F. Design of experiments for Quick U-building method for building energy performance measurement. J. Build. Perform. Simul. 2019, 12, 465–479. [Google Scholar] [CrossRef]
  29. Sougkakis, V.; Meulemans, J.; Alzetto, F.; Wood, C.; Cox, T. An assessment of the QUB method for predicting the whole building thermal performance under actual operating conditions. In Proceedings of the International SEEDS Conference 2017: Sustainable Ecological Engineering Design for Society, Leeds, UK, 13–14 September 2017; pp. 123–135. [Google Scholar]
  30. Stamp, S.; Lowe, R.; Altamirano-Defina, H. An Investigation Into The Role of Thermal Mass on The Accuracy of Co-Heating Tests Through Simulations & Field Results. In Proceedings of the 13th Conference of International Building Performance Simulation Association, Chambery, France, 26–28 August 2013; pp. 39–46. [Google Scholar]
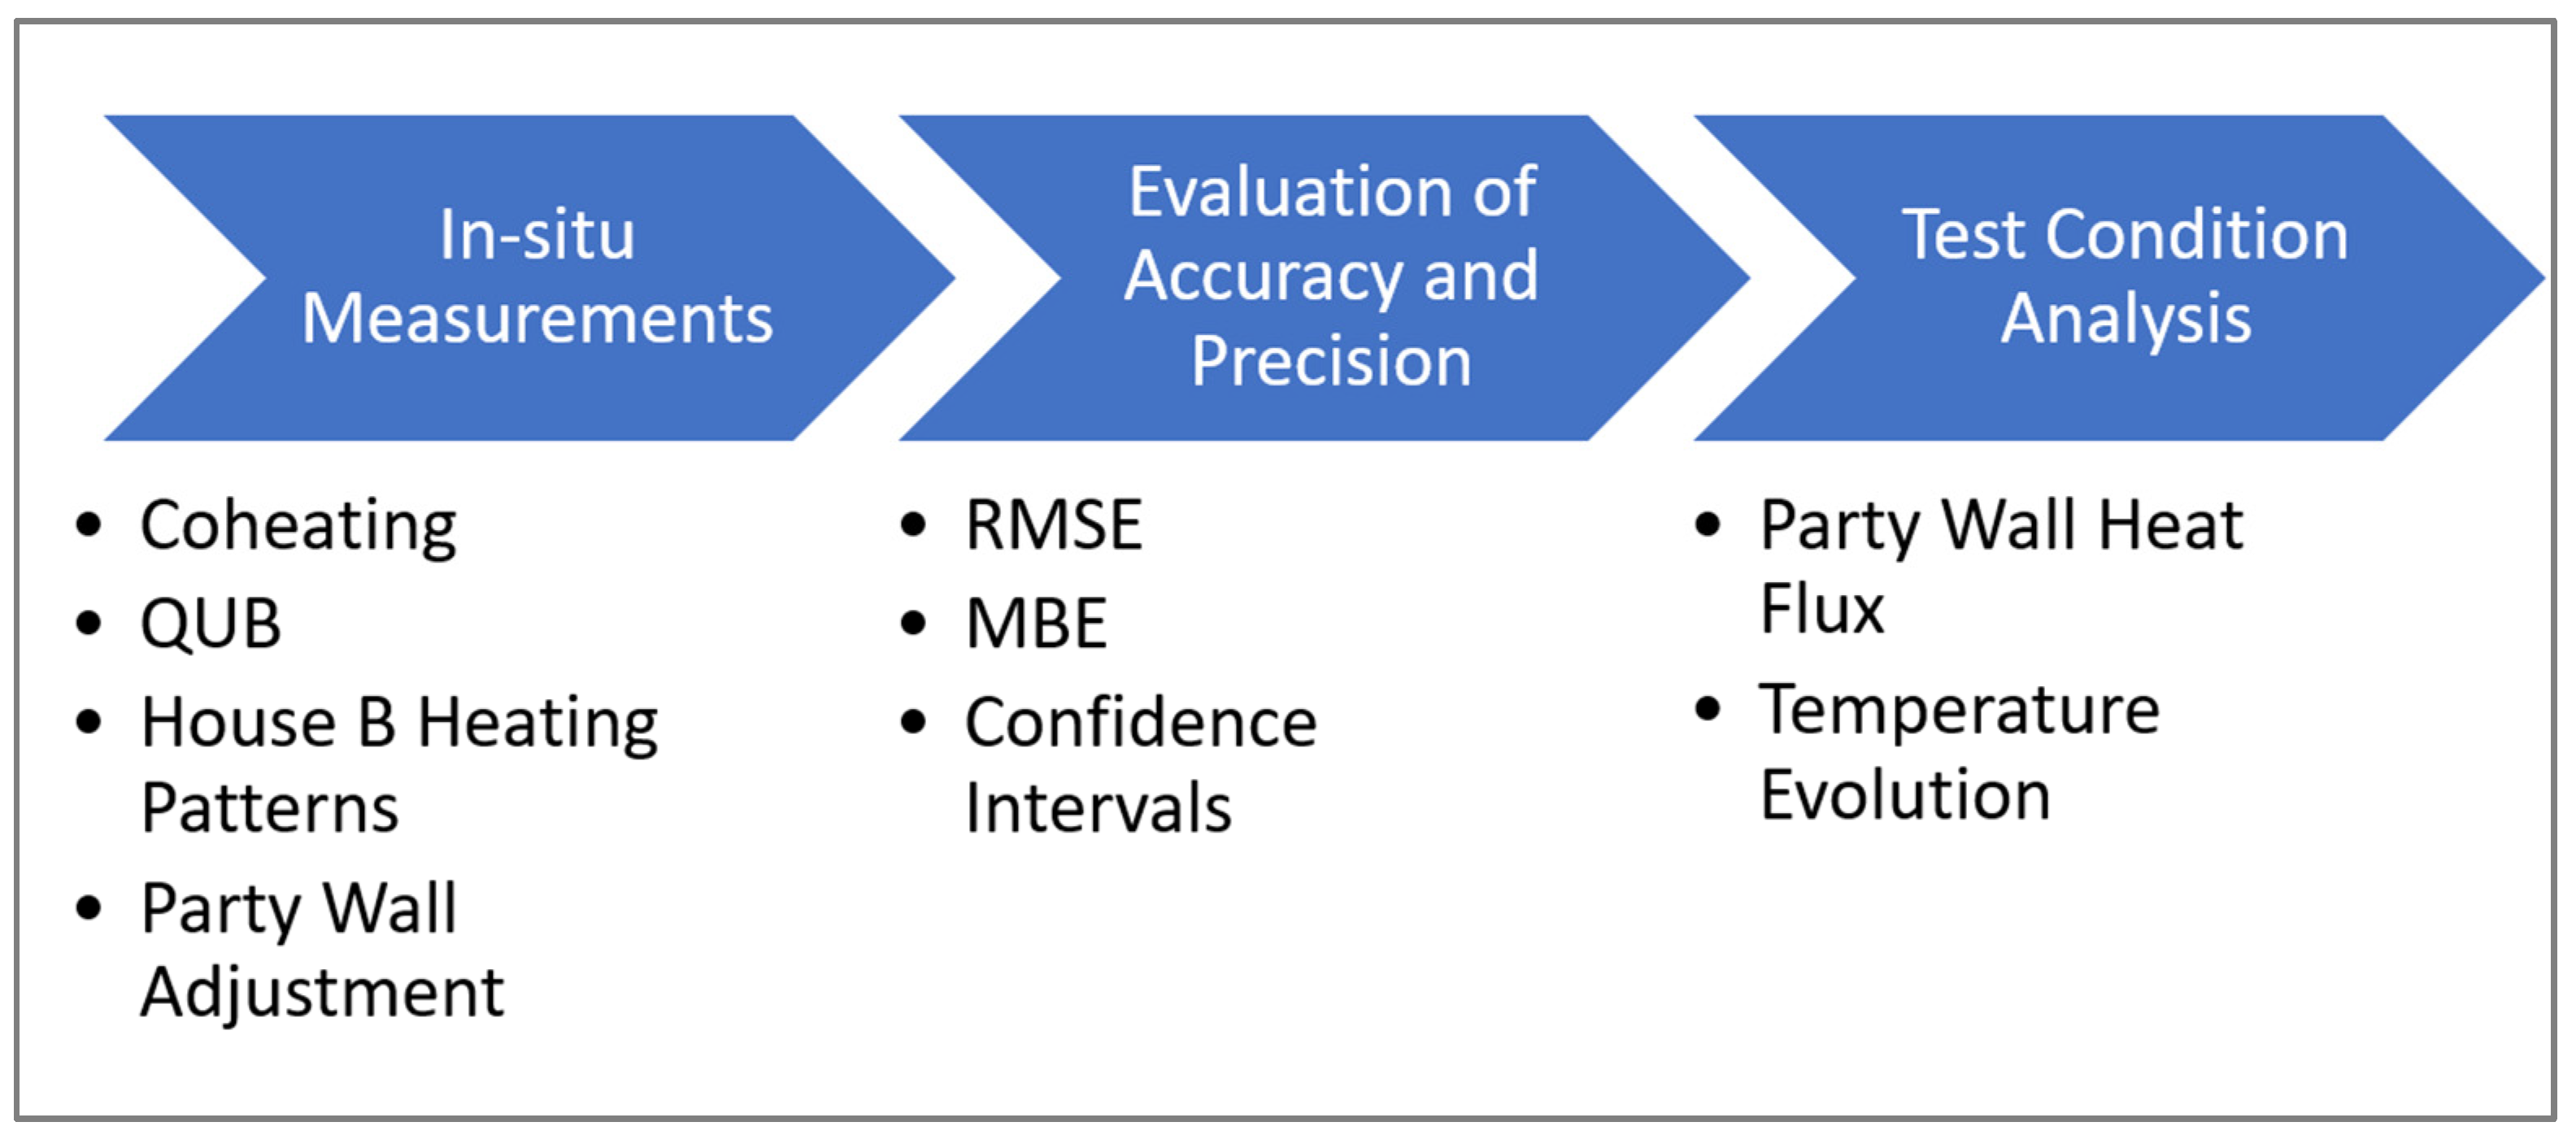
Figure 1. Overview of method.
Buildings 13 02877 g001
Figure 2. External view of test houses (House A right, House B left).
Buildings 13 02877 g002
Figure 3. Equipment layout on house floor plan.
Buildings 13 02877 g003
Figure 4. House B heating pattern profiles.
Buildings 13 02877 g004
Figure 5. Comparison of QUB and coheating measurements (dotted lines show upper and lower uncertainty bounds of the coheating test).
Buildings 13 02877 g005
Figure 6. Party wall heat flux for individual QUB tests.
Buildings 13 02877 g006
Figure 7. Hourly averaged party wall heat flux throughout coheating test (dotted lines x = 48 h and y = 0 W).
Buildings 13 02877 g007
Figure 8. Party wall heat flux during change over period from coheating and first QUB test (dotted lines y = 0 W, x = 14 April 2022 12:00, x = 14 April 2022 23:00).
Buildings 13 02877 g008
Figure 9. Coheating temperature evolution.
Buildings 13 02877 g009
Figure 10. Example QUB temperature evolution for each heating pattern (Tests 1, 4 and 8).
Buildings 13 02877 g010
Table 1. Overview of QUB and coheating methods.
QUBCoheating
Duration2 Days14+ days
Test DescriptionHTC is determined through measuring a building’s dynamic thermal response to consecutive heating and free cooling phases that take place overnight.Quasi-steady state internal conditions are obtained using electric heaters and circulation fans. Multiple linear regression of variables power, ΔText and solar radiation is performed to determine a building’s HTC.
AdvantagesRelatively short duration makes QUB a practical measurement procedure that could be applied in applications such as new build housing or retrofit.Since its inception in the 1980s, the procedure has been validated and refined. Consequently, it is reputed as the most reliable HTC measurement procedure.
Multiple validation studies have been completed in both field-based and in artificial climates.Test conditions are optimal for supplementary investigations such as heat flux density measurement and thermography.
DisadvantagesThe procedure is relatively modern (first published in 2012). As such, the impact of boundary conditions and building characteristics on the validity of measurements is still being understood.The procedure’s duration means that it is not practical for applications outside of research.
Table 2. Test house characteristics.
DetailDescriptionMeasurement
FloorSuspended timber floor with 150 mm mineral wool between joists.38.9 m2
External WallsSolid nine-inch brick with external wall insulation system comprised of 8 mm render + 120 mm mineral fibre insulation + 2 mm adhesive.75.8 m2
Party WallSolid nine-inch brick with 2× chimney breasts.
Chimney sealed at base with timber structure enclosing 150 mm mineral wool.
44.2 m2
CeilingCold pitched roof with 300 mm mineral wool between and above joists.39.1 m2
WindowsUPVC Double glazed units.
Bay window ceiling insulated with external wall system.
19.9 m2
DoorsComposite door with double glazed vision panel.3.0 m2
Air Permeability-7.8 m3h−1m−2@50 Pa
Internal Floor Area-78.0 m2
Internal Volume-207.3 m3
Table 3. Equipment used in measurements.
EquipmentSpecificationMeasurement Uncertainty
Internal temperaturePt100 RTD sensor ±0.3 K
External temperatureRHT10E temperature probe±0.4 K
Solar radiationPyranometerUnidentified
Temperature controllerPID Digital temperature controller±0.5 K
Heater2 kW fan heater (Coheating)
500 W fan heater (QUB)
NA
Electricity consumption measurementkWh pulse meter<±0.1%
Temperature and electricity Consumption loggingWireless data logger * and associated transmitters.NA
Circulation fans 18 inch diameter circulation fans (Coheating only)NA
Heat flux density measurementHeat flux plates and wired data logger *±0.5%
Timer plugsDigital timer switch (QUB only)NA
* Data acquisition rate, 1 min.
Table 4. Results summary including accuracy and precision measures.
MeasurandAverage QUB Measurement (WK−1)Coheating Measurement (WK−1)RMSE
(WK−1)
MBE
(WK−1)
Overlapping Measurements
HTCraw100 ± 7104 ± 118 (7%)−3 (3%)11/11 (100%)
HTCadj93 ± 7103 ± 1112 (12%)−9 (9%)8/11 (73%)
Disclaimer/Publisher’s Note: The statements, opinions and data contained in all publications are solely those of the individual author(s) and contributor(s) and not of MDPI and/or the editor(s). MDPI and/or the editor(s) disclaim responsibility for any injury to people or property resulting from any ideas, methods, instructions or products referred to in the content.