
The Impact of Indoor Environmental Quality (IEQ) in Design Studios on the Comfort and Academic Performance of Architecture Students


Abstract
:1. Introduction
IEQ in Higher Education Buildings
2. Materials and Methods
2.1. Instrumental (Objective) Measurements
2.2. Human (Subjective) Measurements
- The background information comprises the age, gender, years of using the current building, and classroom attendance hours per session of the students.
- Study conditions, with a focus on the degree of difficulty of the study, considering the workload and concentration demands, as well as the collaboration among peers. Furthermore, the extent to which the classroom environment is stimulating and fascinating, as well as how it enhances the students’ study conditions.
- Classroom IEQ, including air temperature, relative humidity, air quality, noise, lighting conditions, and overall comfort level.
- Health-related symptoms, encompassing both current and past symptoms such as headache, dry mouth, nausea/dizziness, difficulty concentrating, burning, irritation, stuffy nose, runny or stuffy nose, hoarseness, dry throat, cough, dry facial skin, scaling/itching of the ears, and dry, itchy hands.
- The impact of IEQ on the quality of learning, encompassing learning productivity and performance.
- Recommendations to improve the IEQ of classrooms regarding air quality, thermal conditions, acoustics, and lighting levels.
2.3. Academic Performance
3. Results
3.1. IEQ and Comfort
3.2. Students’ Satisfaction/Self-Assessment of IEQ
3.3. Health and Well-being Symptoms
3.4. Academic Performance
3.5. Improvements in IEQ Conditions in Classrooms
4. Discussion
5. Conclusions
- (a)
- Increase the lighting intensity;
- (b)
- Enhance ventilation rates, either naturally, which can be achieved by keeping windows open during the summer season, or artificially, which can be used during the winter months;
- (c)
- Allow students a 10-min break every hour while ensuring the doors and windows remain open during this interval.
Author Contributions
Funding
Institutional Review Board Statement
Informed Consent Statement
Data Availability Statement
Acknowledgments
Conflicts of Interest
References
- Alnusairat, S.; Ayyad, Y.; Al-Shatnawi, Z. Towards meaningful university space: Perceptions of the quality of open spaces for students. Buildings 2021, 11, 556. [Google Scholar] [CrossRef]
- Kim, J.; Kong, M.; Hong, T.; Jeong, K.; Lee, M. Physiological response of building occupants based on their activity and the indoor environmental quality condition changes. Build. Environ. 2018, 145, 96–103. [Google Scholar] [CrossRef]
- Bono, J.E.; Glomb, T.M.; Shen, W.; Kim, E.; Koch, A.J. Building positive resources: Effects of positive events and positive reflection on work stress and health. Acad. Manag. J. 2013, 56, 1601–1627. [Google Scholar] [CrossRef]
- Bluyssen, P.M. Towards new methods and ways to create healthy and comfortable buildings. Build. Environ. 2010, 45, 808–818. [Google Scholar] [CrossRef]
- Kelloway, E.K.; Day, A. Building healthy workplaces: Where we need to be. Can. J. Behav. Sci. 2005, 37, 309–316. [Google Scholar] [CrossRef]
- Liu, H.; Zhang, Z.; Ma, X.; Lu, W.; Li, D.; Kojima, S. Optimization analysis of the residential window-to-wall ratio based on numerical calculation of energy consumption in the hot-summer and cold-winter zone of China. Sustainability 2021, 13, 6138. [Google Scholar] [CrossRef]
- WHO. Ambient (Outdoor) Air Pollution; WHO (World Health Organization): Geneva, Switzerland, 2021; Available online: https://www.who.int/news-room/fact-sheets/detail/ambient-(outdoor)-air-quality-and-health (accessed on 15 July 2021).
- Chiou, Y.S.; Saputro, S.; Sari, D.P. Visual comfort in modern university classrooms. Sustainability 2020, 12, 3930. [Google Scholar] [CrossRef]
- Lucialli, P.; Marinello, S.; Pollini, E.; Scaringi, M.; Sajani, S.Z.; Marchesi, S.; Cori, L. Indoor and outdoor concentrations of benzene, toluene, ethylbenzene and xylene in some Italian schools evaluation of areas with different air pollution. Atmos. Pollut. Res. 2020, 11, 1998–2010. [Google Scholar] [CrossRef]
- Zomorodian, Z.S.; Tahsildoost, M.; Hafezi, M. Thermal comfort in educational buildings: A review article. Renew. Sustain. Energy Rev. 2016, 59, 895–906. [Google Scholar] [CrossRef]
- Puglisi, G.E.; Cutiva, L.C.C.; Pavese, L.; Castellana, A.; Bona, M.; Fasolis, S.; Lorenzatti, V.; Carullo, A.; Burdorf, A.; Bronuzzi, F.; et al. Acoustic comfort in high-school classrooms for students and teachers. Energy Procedia 2015, 78, 3096–3101. [Google Scholar] [CrossRef]
- Shield, B.M.; Dockrell, J.E. The effects of noise on children at school: A review. Build. Acoust. 2003, 10, 97–116. [Google Scholar] [CrossRef]
- Lolli, F.; Marinello, S.; Coruzzolo, A.M.; Butturi, M.A. Post-occupancy evaluation’s (POE) applications for improving indoor environment quality (IEQ). Toxics 2022, 10, 626. [Google Scholar] [CrossRef]
- Elnaklah, R.; Walker, I.; Natarajan, S. Moving to a green building: Indoor environment quality, thermal comfort and health. Build. Environ. 2021, 191, 107592. [Google Scholar] [CrossRef]
- Bluyssen, P.M.; Zhang, D.; Kurvers, S.; Overtoom, M.; Ortiz-Sanchez, M. Self-reported health and comfort of school children in 54 classrooms of 21 Dutch school buildings. Build. Environ. 2018, 138, 106–123. [Google Scholar] [CrossRef]
- Musa, A.R.; Abdullah, N.A.G.; Che-Ani, A.I.; Tawil, N.M.; Tahir, M.M. Indoor environmental quality for UKM architecture studio: An analysis on lighting performance. Procedia-Soc. Behav. Sci. 2012, 60, 318–324. [Google Scholar] [CrossRef]
- Nasir, A.R.M.; Musa, A.R.; Che-Ani, A.I.; Utaberta, N.; Abdullah, N.A.G.; Tawil, N.M. Identification of indoor environmental quality (IEQ) parameter in creating conducive learning environment for architecture studio. Procedia Eng. 2011, 20, 354–362. [Google Scholar] [CrossRef]
- Corgnati, S.P.; Filippi, M.; Viazzo, S. Perception of the thermal environment in high school and university classrooms: Subjective preferences and thermal comfort. Build. Environ. 2007, 42, 951–959. [Google Scholar] [CrossRef]
- ANSI/ASHRAE 55; Thermal Environmental Conditions for Human Occupancy. American Society for Heating, Refrigerating and Air Conditioning Engineers, Inc.: Atlanta, GA, USA, 2017; Volume 2017, p. 66.
- Pulimeno, M.; Piscitelli, P.; Colazzo, S.; Colao, A.; Miani, A. Indoor air quality at school and students’ performance: Recommendations of the UNESCO chair on health education and sustainable development & the Italian Society of Environmental Medicine (SIMA). Health Promot. Perspect. 2020, 10, 169–174. [Google Scholar] [CrossRef] [PubMed]
- Singh, M.K.; Ooka, R.; Rijal, H.B.; Kumar, S.; Kumar, A.; Mahapatra, S. Progress in thermal comfort studies in classrooms over last 50 years and way forward. Energy Build. 2019, 188–189, 149–174. [Google Scholar] [CrossRef]
- Abdallah, A.S.H. Analysis of thermal comfort and energy consumption in long time large educational halls (studios), Assiut University, Egypt. Procedia Eng. 2015, 121, 1674–1681. [Google Scholar] [CrossRef]
- Ali, H.; Al-Momani, H.; Hindiyeh, M. Evaluating indoor environmental quality of public-school buildings in Jordan. Indoor Built Environ. 2009, 18, 66–76. [Google Scholar] [CrossRef]
- Wang, M.; Li, L.; Hou, C.; Guo, X.; Fu, H. Building and health: Mapping the knowledge development of sick building syndrome. Buildings 2022, 12, 287. [Google Scholar] [CrossRef]
- Milton, D.K.; Glencross, P.M.; Walters, M.D. Risk of sick leave associated with outdoor air supply rate, humidification, and occupant complaints. Indoor Air 2000, 10, 212–221. [Google Scholar] [CrossRef]
- Knibbs, L.D.; Morawska, L.; Bell, S.C.; Grzybowski, P. Room ventilation and the risk of airborne infection transmission in 3 health care settings within a large teaching hospital. Am. J. Infect. Control 2011, 39, 866–872. [Google Scholar] [CrossRef]
- Shendell, D.G.; Prill, R.; Fisk, W.J.; Apte, M.G.; Blake, D.; Faulkner, D. Associations between classroom CO2 concentrations and student attendance in Washington and Idaho. Indoor Air 2004, 14, 333–341. [Google Scholar] [CrossRef]
- Palacios, J.; Eichholtz, P.; Kok, N. Moving to productivity: The benefits of healthy buildings. PLoS ONE 2020, 15, e0236029. [Google Scholar] [CrossRef]
- Takaoka, M.; Suzuki, K.; Norbäck, D. Current asthma, respiratory symptoms and airway infections among students in relation to the school and home environment in Japan. J. Asthma 2017, 54, 652–661. [Google Scholar] [CrossRef] [PubMed]
- Bluyssen, P.; Roda, C.; Mandin, C.; Fossati, S.; Carrer, P.; de Kluizenaar, Y.; Mihucz, V.G.; de Oliveira Fernandes, E.; Bartzis, J. Self-reported health and comfort in ‘modern’ office buildings: First results from the European OFFICAIR study. Indoor Air 2016, 26, 298–317. [Google Scholar] [CrossRef] [PubMed]
- Fisk, W.J. How IEQ affects health, productivity. ASHRAE J. 2002, 44, 56–60. [Google Scholar]
- Mendell, M.J.; Lei-Gomez, Q.; Mirer, A.G.; Sepp¨anen, O.; Brunner, G. Risk factors in heating, ventilating, and air-conditioning systems for occupant symptoms in US office buildings: The US EPA BASE study. Indoor Air 2008, 18, 301–316. [Google Scholar] [CrossRef]
- Sundell, J.; Levin, H.; Nazaroff, W.W.; Cain, W.S.; Fisk, W.J.; Grimsrud, D.T.; Gyntelberg, F.; Li, Y.; Persily, A.K.; Pickering, A.C.; et al. Ventilation rates and health: Multidisciplinary review of the scientific literature. Indoor Air 2011, 21, 191–204. [Google Scholar] [CrossRef] [PubMed]
- Lan, L.; Wargocki, P.; Lian, Z. Quantitative measurement of productivity loss due to thermal discomfort. Energy Build. 2011, 43, 1057–1062. [Google Scholar] [CrossRef]
- Lowen, A.; Mubareka, S.; Steel, J.; Palese, P. Influenza virus transmission is dependent on relative humidity and temperature. PLoS Pathog. 2007, 3, 1470–1476. [Google Scholar] [CrossRef]
- Dean, J.T. Noise, Cognitive Function, and Worker Productivity. 2017. Available online: https://api.semanticscholar.org/CorpusID:165161321 (accessed on 15 July 2021).
- Cedeño-Laurent, J.G.; Williams, A.; MacNaughton, P.; Cao, Z.; Eitland, E.; Spengler, J.; Allen, J. Building evidence for health: Green buildings, current science, and future challenges. Annu. Rev. Public Health 2018, 39, 291–308. [Google Scholar] [CrossRef] [PubMed]
- Boyce, P.R. Review: The impact of light in buildings on human health. Indoor Built Environ. 2010, 19, 8–20. [Google Scholar] [CrossRef]
- Kanchongkittiphon, W.; Mendell, M.J.; Gaffin, J.M.; Wang, G.; Phipatanakul, W. Indoor environmental exposures and exacerbation of asthma: An update to the 2000 review by the Institute of Medicine. Environ. Health Perspect. 2015, 123, 6–20. [Google Scholar] [CrossRef]
- Bornehag, C.; Sundell, J.; Sigsgaard, T. Dampness in buildings and health (DBH): Report from an ongoing epidemiological investigation on the association between indoor environmental factors and health effects among children in Sweden. Indoor Air 2004, 14, 59–66. [Google Scholar] [CrossRef] [PubMed]
- Ranjbar, A. Analysing the effects of thermal comfort and indoor air quality in design studios and classrooms on student performance. IOP Conf. Ser. Mater. Sci. Eng. 2019, 609, 042086. [Google Scholar] [CrossRef]
- Haverinen-Shaughnessy, U.; Shaughnessy, R.J. Effects of classroom ventilation rate and temperature on students’ test scores. PLoS ONE 2015, 10, e0136165. [Google Scholar] [CrossRef]
- MacNaughton, P.; Satish, U.; Laurent, J.G.C.; Flanigan, S.; Vallarino, J.; Coull, B. The impact of working in a green certified building on cognitive function and health. Build. Environ. 2016, 114, 178–186. [Google Scholar] [CrossRef]
- Fisk, W.J.; Mirer, A.G.; Mendell, M.J. Quantitative relationship of sick building syndrome symptoms with ventilation rates. Indoor Air 2009, 19, 159–165. [Google Scholar] [CrossRef]
- Lai, A.C.K.; Mui, K.W.; Wong, L.T.; Law, L.Y. An evaluation model for indoor environmental quality (IEQ) acceptance in residential buildings. Energy Build. 2009, 41, 930–936. [Google Scholar] [CrossRef]
- Angelon-Gaetz, K.A.; Richardson, D.B.; Marshall, S.W.; Hernandez, M.L. Exploration of the effects of classroom humidity levels on teachers’ respiratory symptoms. Int. Arch. Occup. Environ. Health 2016, 89, 729–737. [Google Scholar] [CrossRef] [PubMed]
- Mendell, M.J.; Eliseeva, E.A.; Davies, M.M.; Spears, M.; Lobscheid, A.; Fisk, W.J.; Apte, M.G. Association of classroom ventilation with reduced illness absence: A prospective study in California elementary schools. Indoor Air 2013, 23, 515–528. [Google Scholar] [CrossRef] [PubMed]
- Haverinen-Shaughnessy, U.; Moschandreas, D.J.; Shaughnessy, R.J. Association between substandard classroom ventilation rates and students’ academic achievement. Indoor Air 2011, 21, 121–131. [Google Scholar] [CrossRef]
- Ja’en, E.M.; Colombo, E.M.; Kirschbaum, C.F. A simple visual task to assess flicker effects on visual performance. Light. Res. Technol. 2011, 43, 457–471. [Google Scholar] [CrossRef]
- Alnusairat, S.; Al Maani, D.; Al-Jokhadar, A. Architecture students’ satisfaction with and perceptions of online design studios during COVID-19 lockdown: The case of Jordan universities. Archnet-IJAR 2021, 15, 219–236. [Google Scholar] [CrossRef]
- AboWardah, E.S. Bridging the gap between research and schematic design phases in teaching architectural graduation projects. Front. Archit. Res. 2020, 9, 82–105. [Google Scholar] [CrossRef]
- Soliman, A.M. Appropriate teaching and learning strategies for the architectural design process in pedagogic design studios. Front. Archit. Res. 2017, 6, 204–217. [Google Scholar] [CrossRef]
- Abdullah, N.A.G.; Beh, S.C.; Tahir, M.M.; Che Ani, A.I.; Tawil, N.M. Architecture design studio culture and learning spaces: A holistic approach to the design and planning of learning facilities. Procedia Soc. Behav. Sci. 2011, 15, 27–32. [Google Scholar] [CrossRef]
- Stevens, G. The Favored Circle: The Social Foundations of Architectural Distinction; MIT Press: Cambridge, MA, USA, 1998. [Google Scholar]
- Saighi, O.; Zerouala, M.S. The use of computer tools in the design process of students’ architectural projects: Case studies in Algeria. IOP Conf. Ser. Mater. Sci. Eng. 2017, 291, 012007. [Google Scholar] [CrossRef]
- ISO 7730; Ergonomics of the Thermal Environment-Analytical Determination and Interpretation of Thermal Comfort Using Calculation of the PMV and PPD Indices and Local Thermal Comfort Criteria. ISO: Geneva, Switzerland, 2005. Available online: https://www.iso.org/standard/39155.html (accessed on 17 September 2022).
- IEC 61672-1; Electroacoustics-Sound Level Meters-Part 1: Specifications. International Electrotechnical Commission: Geneva, Switzerland, 2013. Available online: https://standards.iteh.ai/catalog/standards/clc/7de04d56-6445-4410-a810-0e5216645fb6/en-61672-1-2013 (accessed on 17 September 2022).
- Brager, G.S.; de Dear, R.J. Thermal adaptation in the built environment: A literature review. Energy Build. 1998, 27, 83–96. [Google Scholar] [CrossRef]
- WHO. WHO Guidelines for Indoor Air Quality: Selected Pollutants; WHO (World Health Organization): Geneva, Switzerland, 2010; Available online: https://www.who.int/publications/i/item/9789289002134 (accessed on 15 July 2021).
- Elnaklah, R.; Ayyad, Y.; Alnusairat, S.; AlWaer, H.; AlShboul, A. A Comparison of students’ thermal comfort and perceived learning performance between two types of university halls: Architecture design studios and ordinary lecture rooms during the heating season. Sustainability 2023, 15, 1142. [Google Scholar] [CrossRef]
- Korsavi, S.S.; Montazami, A.; Mumovic, D. Perceived indoor air quality in naturally ventilated primary schools in the UK: Impact of environmental variables and thermal sensation. Indoor Air 2020, 31, 480–501. [Google Scholar] [CrossRef]
- Wålinder, R.; Gunnarsson, K.; Runeson, R.; Smedje, G. Physiological and psychological stress reactions in relation to classroom noise. Scand. J. Work Environ. Health 2007, 33, 260–266. [Google Scholar] [CrossRef]
- Daisey, J.M.; Angell, W.J.; Apte, M.G. Indoor air quality, ventilation and health symptoms in schools: An analysis of existing information. Indoor Air. 2003, 13, 53–64. [Google Scholar] [CrossRef] [PubMed]
- Hutter, H.P.; Haluza, D.; Piegler, K.; Hohenblum, P.; Frohlich, M.; Scharf, S.; Uhl, M.; Damberger, B.; Tappler, P.; Kundi, M.; et al. Semivolatile compounds in schools and their influence on cognitive performance of children. Int. J. Occup. Med. Environ. Health 2013, 26, 628–635. [Google Scholar] [CrossRef]
- Gaihre, S.; Semple, S.; Miller, J.; Fielding, S.; Turner, S. Classroom carbon dioxide concentration, school attendance, and educational attainment. J. Sch. Health 2014, 84, 569–574. [Google Scholar] [CrossRef]
- Twardella, D.; Matzen, W.; Lahrz, T.; Burghardt, R.; Spegel, H.; Hendrowarsito, L.; Frenzel, A.C.; Fromme, H. Effect of classroom air quality on students’ concentration: Results of a cluster-randomized cross-over experimental study. Indoor Air 2012, 22, 378–387. [Google Scholar] [CrossRef]
- Fouladi-Fard, R.; Hosseini, M.; Faraji, M.; Oskouei, A. Building characteristics and sick building syndrome among primary school students. Sri Lanka J. Child Health 2018, 47, 332–337. [Google Scholar] [CrossRef]
- Norbäck, D.; Nordström, K. Sick building syndrome in relation to air exchangerate, CO2, room temperature and relative air humidity in university computer classrooms: An experimental study. Int. Arch. Occup. Environ. Health 2008, 82, 21–30. [Google Scholar] [CrossRef] [PubMed]
- Wargocki, P.; Wyon, D.P. The effects of moderately raised classroom temperatures and classroom ventilation rate on the performance of schoolwork by children (RP-1257). HVAC&R Res. 2017, 13, 193–220. [Google Scholar] [CrossRef]


| Insufficient IEQ | Impact on the Health and Well-Being of Occupants | Studies |
|---|---|---|
| Higher levels of carbon dioxide (CO2) | Asthma and respiratory symptoms. | [29] |
| Insufficient ventilation | Asthma, excessive tearing, headaches, fatigue, difficulty breathing, sinus congestion, coughing, sneezing, dizziness, nausea, irritation of the eyes, nose, throat, and skin, and respiratory symptoms. | [29,30,31,32,33] |
| Insufficient room temperatures | Elevated heart rates, adverse mood, weariness, asthma, itchiness and excessive tearing, headaches, throat irritation, influenza virus, and respiratory symptoms. | [29,30,31,34,35] |
| Excessive decibel levels | Cardiovascular illness, heightened stress levels, and disturbances in sleep patterns. | [36] |
| Inadequate quality of light | Visual strain, eye irritation, blurred vision, and alterations in the circadian rhythm. | [37,38] |
| Insufficient relative air humidity levels | Asthma, elevated heart rates, adverse mood, weariness, dry cough, itchiness and excessive tearing, headaches, throat irritation, influenza virus, chest tightness, hoarseness, voice cord dysfunction, and respiratory symptoms. | [29,30,31,34,35,39,40] |
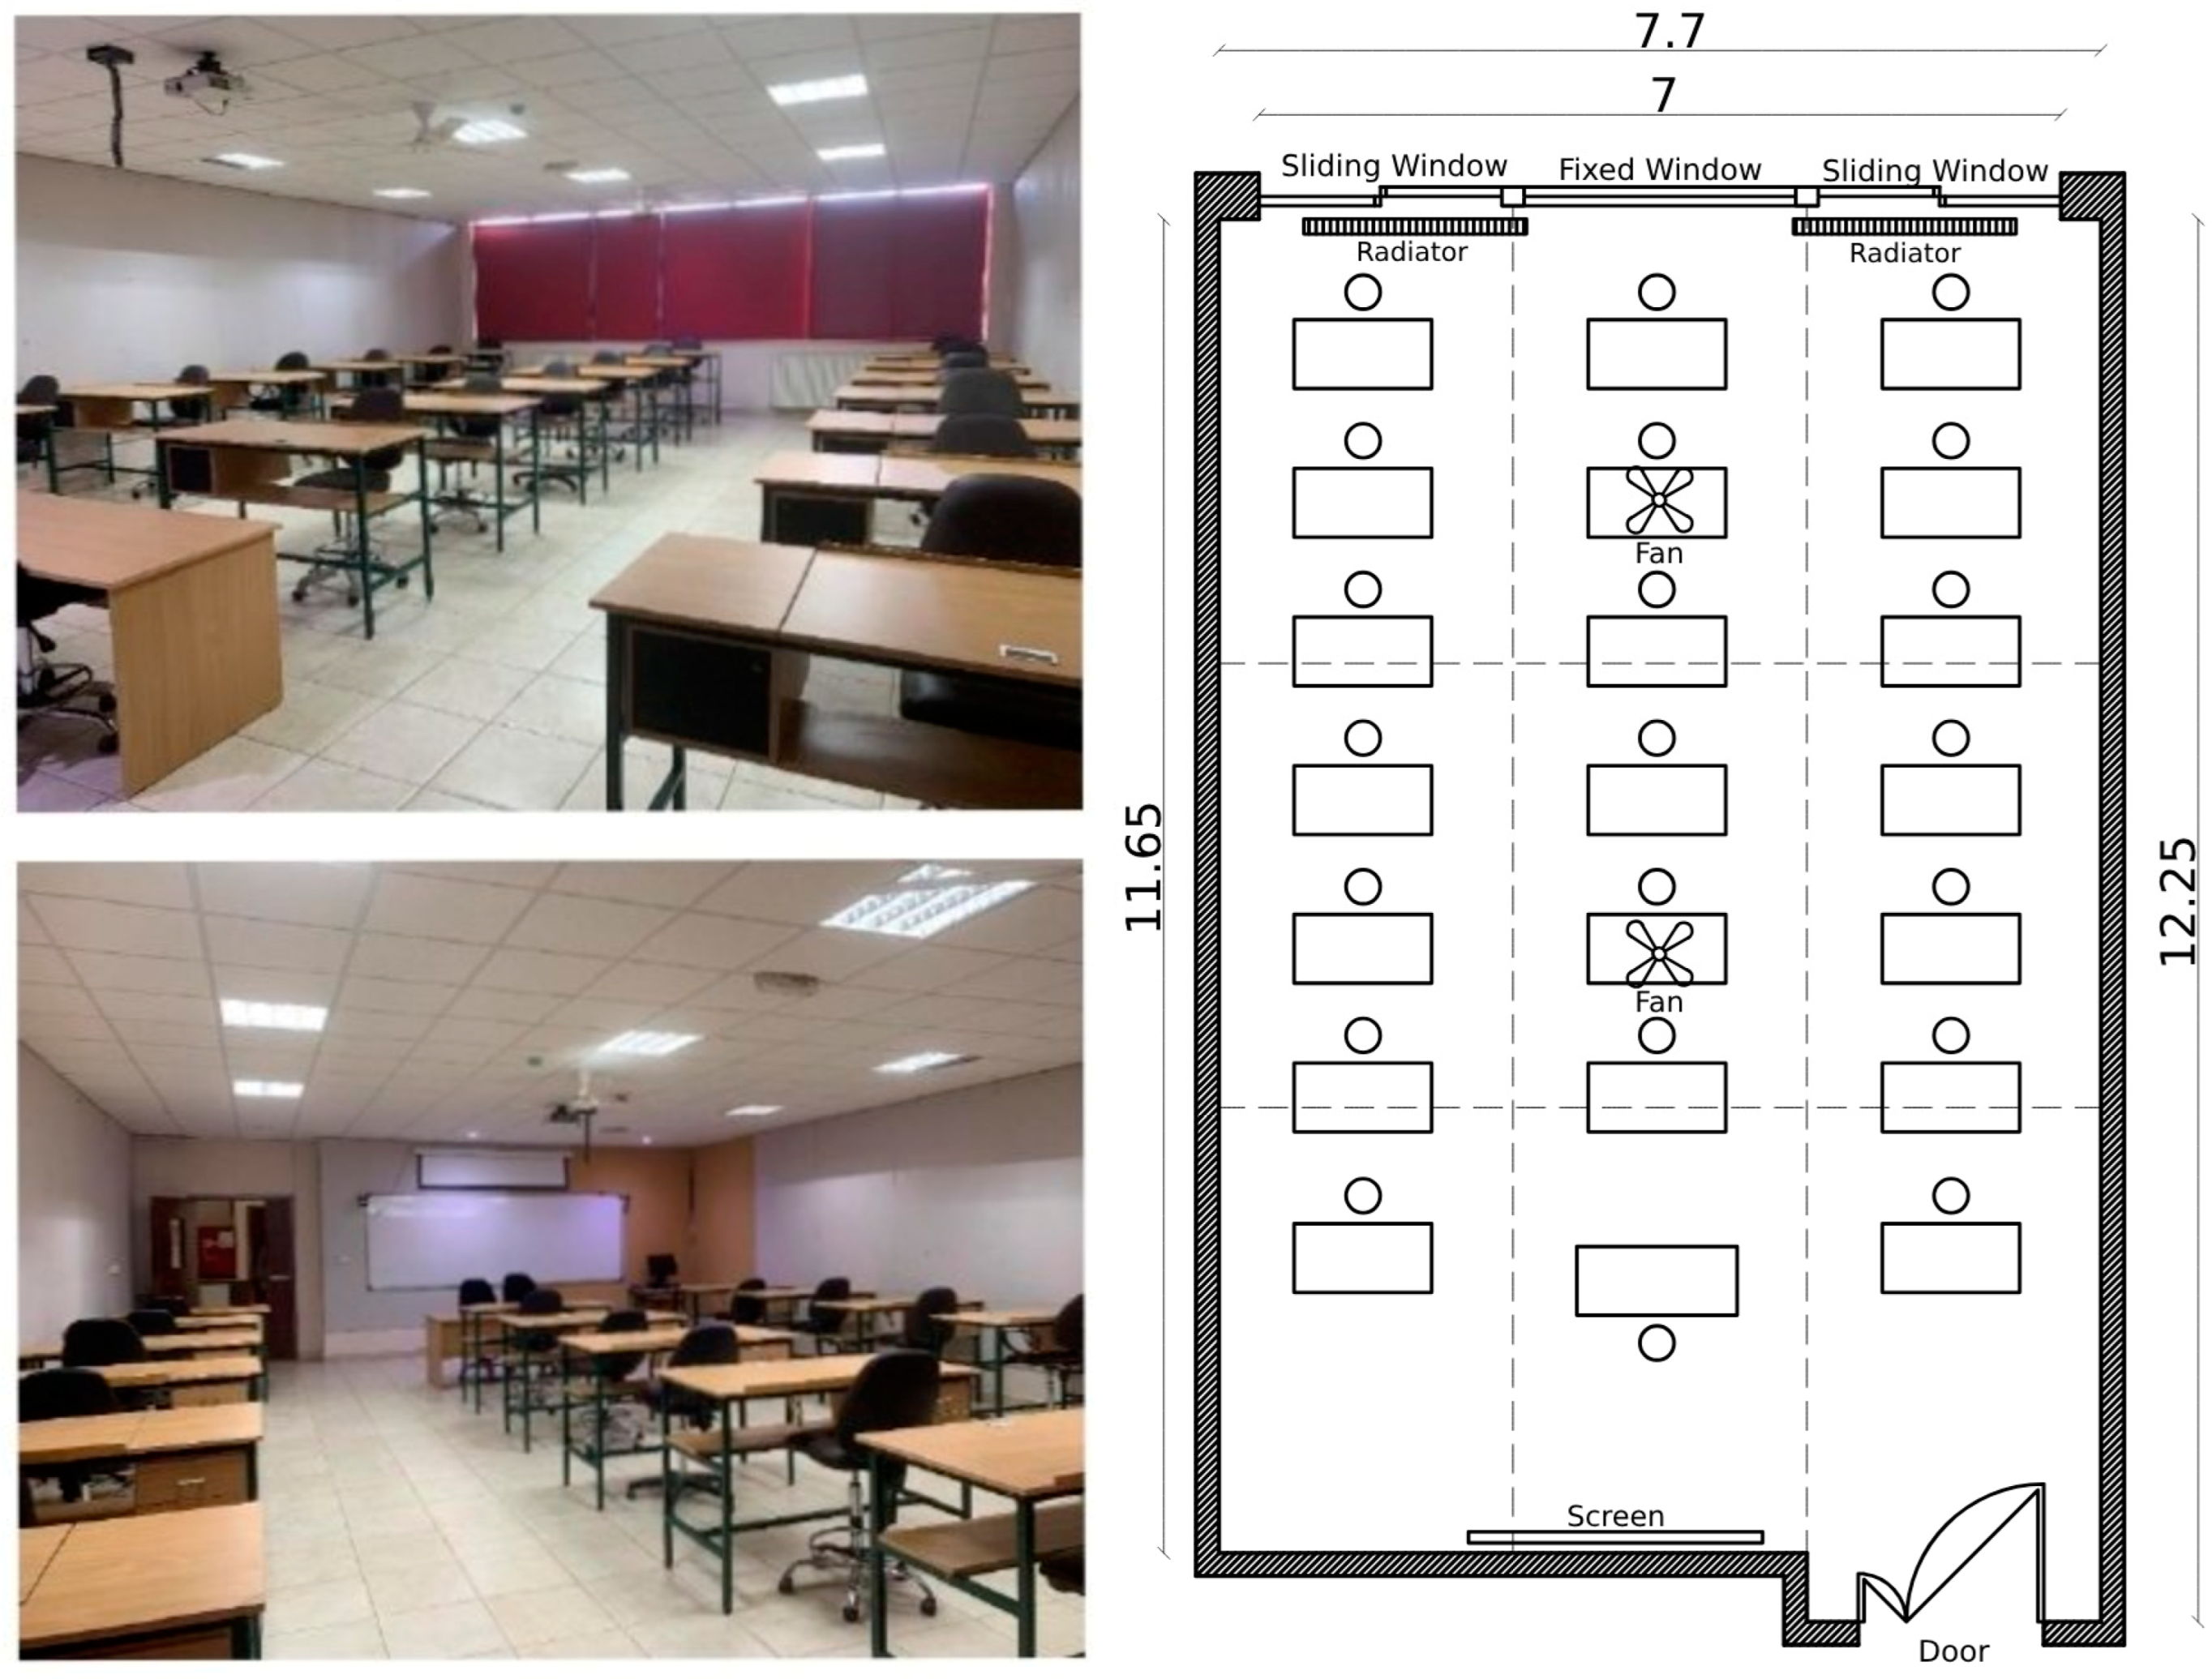
| Classroom | Area (m2) | Location, Orientation of Widows | Ventilation Type | Cooling System | Heating System | No. of Occupants per Session | Duration of the Session | Time of the Session |
|---|---|---|---|---|---|---|---|---|
| Design Studio 1 (DS1) | 89 | Ground floor, west | Natural | Ceiling-mounted fans | Heating radiators | 20 | 3.5 h | 8:30 a.m.–12:00 p.m. |
| Design Studio 2 (DS2) | 89 | Third floor, west | Natural | Ceiling-mounted fans | Heating radiators | 20 | 3.5 h | 8:30 a.m.–12:00 p.m. |
| Design Studio 3 (DS3) | 91 | Ground floor, west | Natural | Ceiling-mounted fans | Heating radiators | 20 | 3.5 h | 8:30 a.m.–12:00 p.m. |
| Design Studio 4 (DS4) | 91 | Third floor, west | Natural | Ceiling-mounted fans | Heating radiators | 20 | 3.5 h | 8:30 a.m.–12:00 p.m. |
| Classroom | Air Temperature (Ta) (°C) | Relative Humidity (Rh) (%) | CO2 Level (ppm) | Lighting Intensity Level (lux) | Background Noise Level (dBA) |
|---|---|---|---|---|---|
| Design Studio 1 (DS1) | 19 | 44.8 | 819 | 122 | 43.5 |
| Design Studio 2 (DS2) | 19.7 | 43.5 | 836 | 353 | 45 |
| Design Studio 3 (DS3) | 17.3 | 55.2 | 811 | 305.5 | 47.4 |
| Design Studio 4 (DS4) | 21.4 | 46.9 | 823 | 177.3 | 49.1 |
| Mean | 19.35 | 47.6 | 822.25 | 239.45 | 46.25 |
| Comfort range | 19.4–27.7 (ASHRAE) | 40–60 (ASHRAE) | 400–900 (ASHRAE) | 500–1000 (ASHRAE) | 45–50 (ASHRAE)/ 35–40 (NC curve) |
| No of Respondents = 77 | Frequency | Percentage (%) | |||
|---|---|---|---|---|---|
| Background information | Participant information | Age | 18–21 years | 46 | 59.74 |
| 22–25 years | 25 | 32.47 | |||
| 26–29 years | 4 | 5.19 | |||
| ≥30 years | 2 | 2.60 | |||
| Gender | Male | 29 | 37.66 | ||
| Female | 48 | 62.34 | |||
| Experience in place | Years in the current building | 1–2 years | 36 | 46.75 | |
| 2–4 years | 33 | 42.86 | |||
| ≥5 years | 8 | 10.39 | |||
| Hours in current classroom/session | ≤1 h | 0 | 0.00 | ||
| 1–2 h | 10 | 12.99 | |||
| 2–3 h | 59 | 76.62 | |||
| ≥3 h | 8 | 10.39 | |||
| Classroom | Overall Comfort Level | Evaluation of the Five Components of IEQ | |||||||||||
|---|---|---|---|---|---|---|---|---|---|---|---|---|---|
| Mean | SD | % of Satisfaction | 1. Thermal Conditions | 2. Level of Humidity | 3. Air Quality | 4. Lighting Quality | 5. Noise Level | ||||||
| Mean | SD | Mean | SD | Mean | SD | Mean | SD | Mean | SD | ||||
| DS1 | 2.54 | 0.19 | 61.68 | 2.48 | 0.55 | 2.36 | 0.80 | 2.61 | 0.50 | 2.73 | 0.47 | 2.73 | 0.65 |
| DS2 | 2.47 | 0.20 | 61.62 | 2.36 | 0.71 | 2.44 | 0.80 | 2.74 | 0.53 | 2.33 | 0.87 | 2.33 | 1.00 |
| DS3 | 2.54 | 0.09 | 56.36 | 2.53 | 0.55 | 2.65 | 0.50 | 2.57 | 0.51 | 2.70 | 0.48 | 2.10 | 0.74 |
| DS4 | 2.22 | 0.18 | 44.16 | 2.29 | 0.88 | 1.93 | 0.74 | 2.57 | 0.60 | 2.14 | 0.90 | 1.57 | 0.53 |
| Mean | 2.44 | 0.17 | 55.96 | 2.41 | 0.67 | 2.35 | 0.71 | 2.62 | 0.54 | 2.48 | 0.68 | 2.18 | 0.73 |
| Overall percentage of satisfaction | 55.96% | 53.85% | 50.52% | 65.00% | 60.28% | 44.62% | |||||||
| Percentage of dissatisfaction | 44.04% | 46.15% | 49.48% | 35.00% | 39.72% | 55.38% | |||||||
| Dependent Variable | Independent Variables | Significant Value (According to SPSS Chi-Square Tests) | Association between the Two Variables | |
|---|---|---|---|---|
| Yes | No | |||
| The overall level of comfort | Gender | 0.208 (≥0.05) | x | |
| Time spent in the classroom | 0.997 (≥0.05) | x | ||
| Classroom air temperature | 0.049 (<0.05) | √ | ||
| Air quality | 0.952 (≥0.05) | x | ||
| Odors inside the classroom | 0.008 (<0.05) | √ | ||
| Dust/dirt conditions | 0.048 (<0.05) | √ | ||
| Air movement | 0.001 (<0.05) | √ | ||
| Noise levels | 0.239 (≥0.05) | x | ||
| Quality of natural daylighting | 0.119 (≥0.05) | x | ||
| Quality of artificial lighting | 0.920 (≥0.05) | x | ||
| Dependent Variable | Independent Variables | Significant Value (According to SPSS Chi-Square Tests) | Association between the Two Variables | |
|---|---|---|---|---|
| Yes | No | |||
| Learning productivity | Gender | 0.033 (<0.05) | √ | |
| Time spent in the classroom | 0.255 (≥0.05) | x | ||
| Classroom air temperature | 0.308 (≥0.05) | x | ||
| Air quality | 0.261 (≥0.05) | x | ||
| Odors inside the classroom | 0.775 (≥0.05) | x | ||
| Dust/dirt conditions | 0.012 (<0.05) | √ | ||
| Air movement | 0.119 (≥0.05) | x | ||
| Noise levels | 0.743 (≥0.05) | x | ||
| Quality of natural daylighting | 0.599 (≥0.05) | x | ||
| Quality of artificial lighting | 0.094 (≥0.05) | x | ||
| Aspects of Improvements | Improvements to IEQ | Mean (Out of 5) | SD | % of Agreement | Overall Agreement | |
|---|---|---|---|---|---|---|
| Mean | % | |||||
| Ventilation system | Using air fans | 2.89 | 1.07 | 57.8 | 3.48 | 69.6 |
| Using air conditioning | 4.14 | 0.82 | 82.8 | |||
| Keeping the hall windows and door open to enhance air movement | 3.41 | 1.12 | 68.2 | |||
| Thermal conditions | Adding interior curtains for windows | 3.65 | 0.98 | 73.0 | 3.67 | 73.3 |
| Adding exterior sun breakers for windows | 3.68 | 1.03 | 73.6 | |||
| Sound comfort | Keeping the hall windows and doors closed to enhance sound insulation | 3.35 | 1.18 | 67.0 | 3.58 | 71.6 |
| Enhancing the quality of air fans | 3.81 | 0.88 | 76.2 | |||
| Visual comfort | Changing the paint color | 3.59 | 1.17 | 71.8 | 3.70 | 74.0 |
| Accurate illuminance level of artificial lighting | 3.88 | 0.99 | 77.6 | |||
| Adding exterior sun breakers for windows | 3.68 | 1.03 | 73.6 | |||
| Adding interior curtains for windows | 3.65 | 0.98 | 73.0 | |||
| Air quality | Adding filters for windows to prevent the entry of dust | 3.97 | 0.76 | 79.4 | 3.72 | 74.4 |
| Limitation on classroom capacity | 3.27 | 0.99 | 65.4 | |||
| Control the cleanliness | 3.92 | 0.83 | 78.4 | |||
Disclaimer/Publisher’s Note: The statements, opinions and data contained in all publications are solely those of the individual author(s) and contributor(s) and not of MDPI and/or the editor(s). MDPI and/or the editor(s) disclaim responsibility for any injury to people or property resulting from any ideas, methods, instructions or products referred to in the content. |
© 2023 by the authors. Licensee MDPI, Basel, Switzerland. This article is an open access article distributed under the terms and conditions of the Creative Commons Attribution (CC BY) license (https://creativecommons.org/licenses/by/4.0/).
Share and Cite
Al-Jokhadar, A.; Alnusairat, S.; Abuhashem, Y.; Soudi, Y. The Impact of Indoor Environmental Quality (IEQ) in Design Studios on the Comfort and Academic Performance of Architecture Students. Buildings 2023, 13, 2883. https://doi.org/10.3390/buildings13112883
Al-Jokhadar A, Alnusairat S, Abuhashem Y, Soudi Y. The Impact of Indoor Environmental Quality (IEQ) in Design Studios on the Comfort and Academic Performance of Architecture Students. Buildings. 2023; 13(11):2883. https://doi.org/10.3390/buildings13112883
Chicago/Turabian StyleAl-Jokhadar, Amer, Saba Alnusairat, Yasser Abuhashem, and Yasmine Soudi. 2023. "The Impact of Indoor Environmental Quality (IEQ) in Design Studios on the Comfort and Academic Performance of Architecture Students" Buildings 13, no. 11: 2883. https://doi.org/10.3390/buildings13112883
APA StyleAl-Jokhadar, A., Alnusairat, S., Abuhashem, Y., & Soudi, Y. (2023). The Impact of Indoor Environmental Quality (IEQ) in Design Studios on the Comfort and Academic Performance of Architecture Students. Buildings, 13(11), 2883. https://doi.org/10.3390/buildings13112883