
Residual Flexural Performance of Double-Layer Steel–RLHDC Composite Panels after Impact

Abstract
:1. Introduction
2. Experimental Program
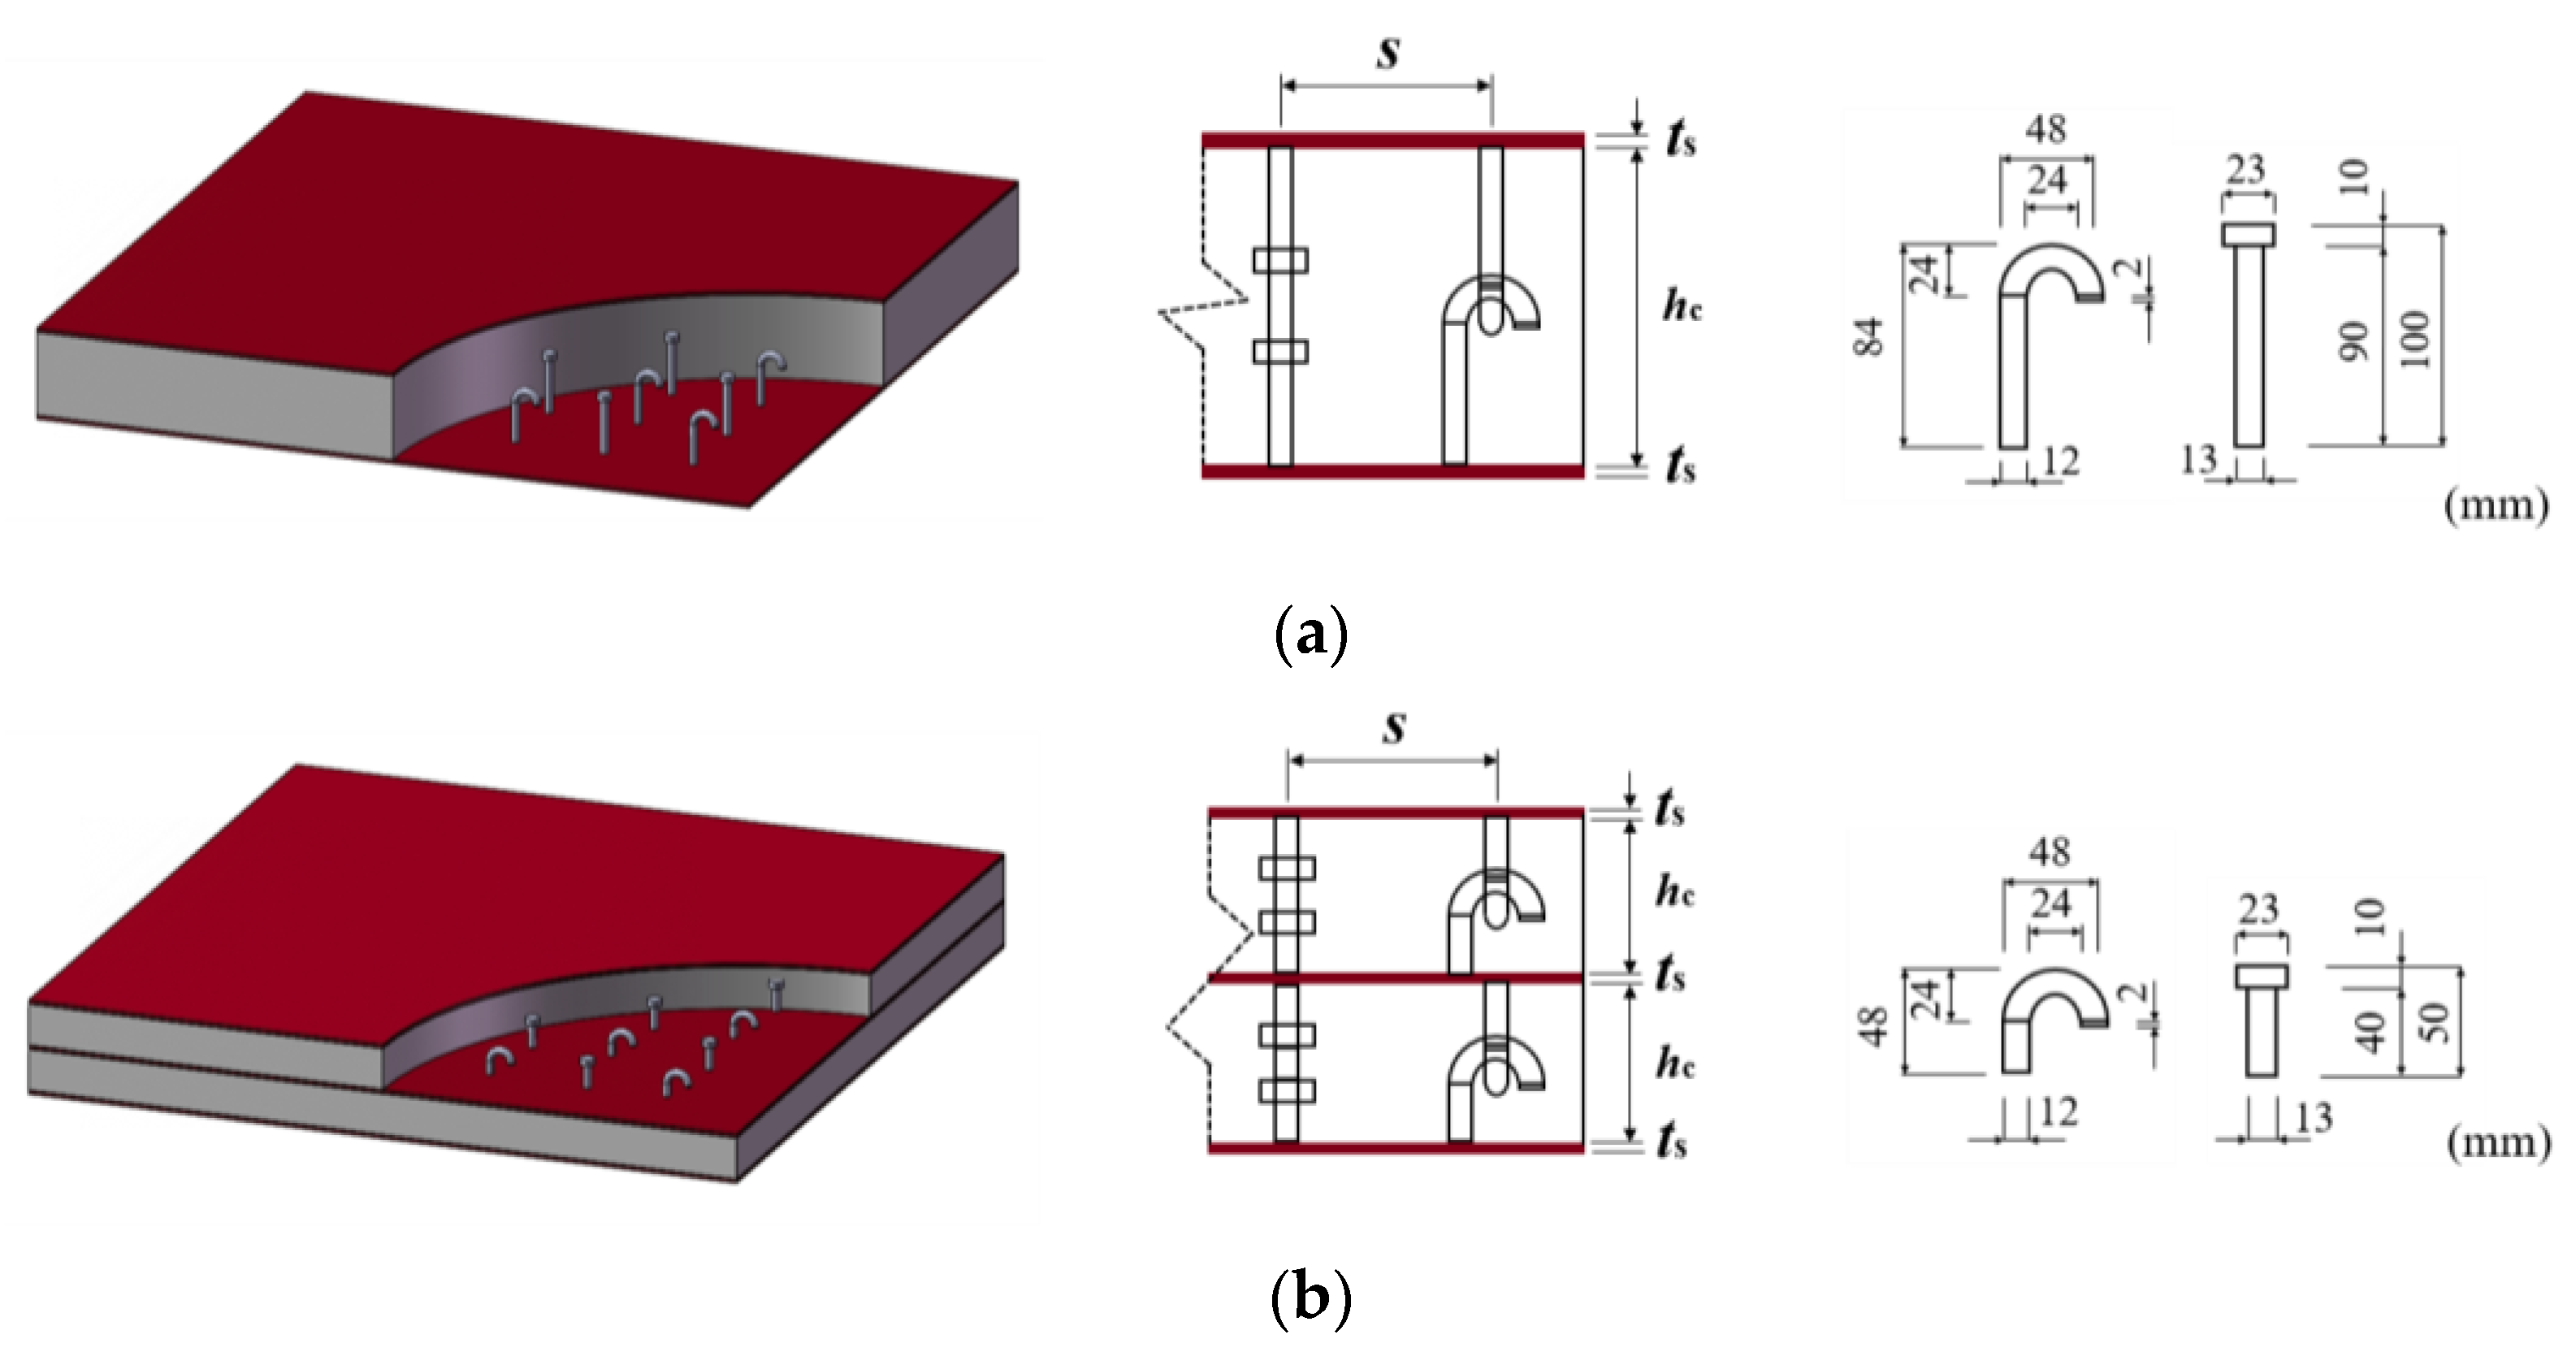
2.1. Specimen Design
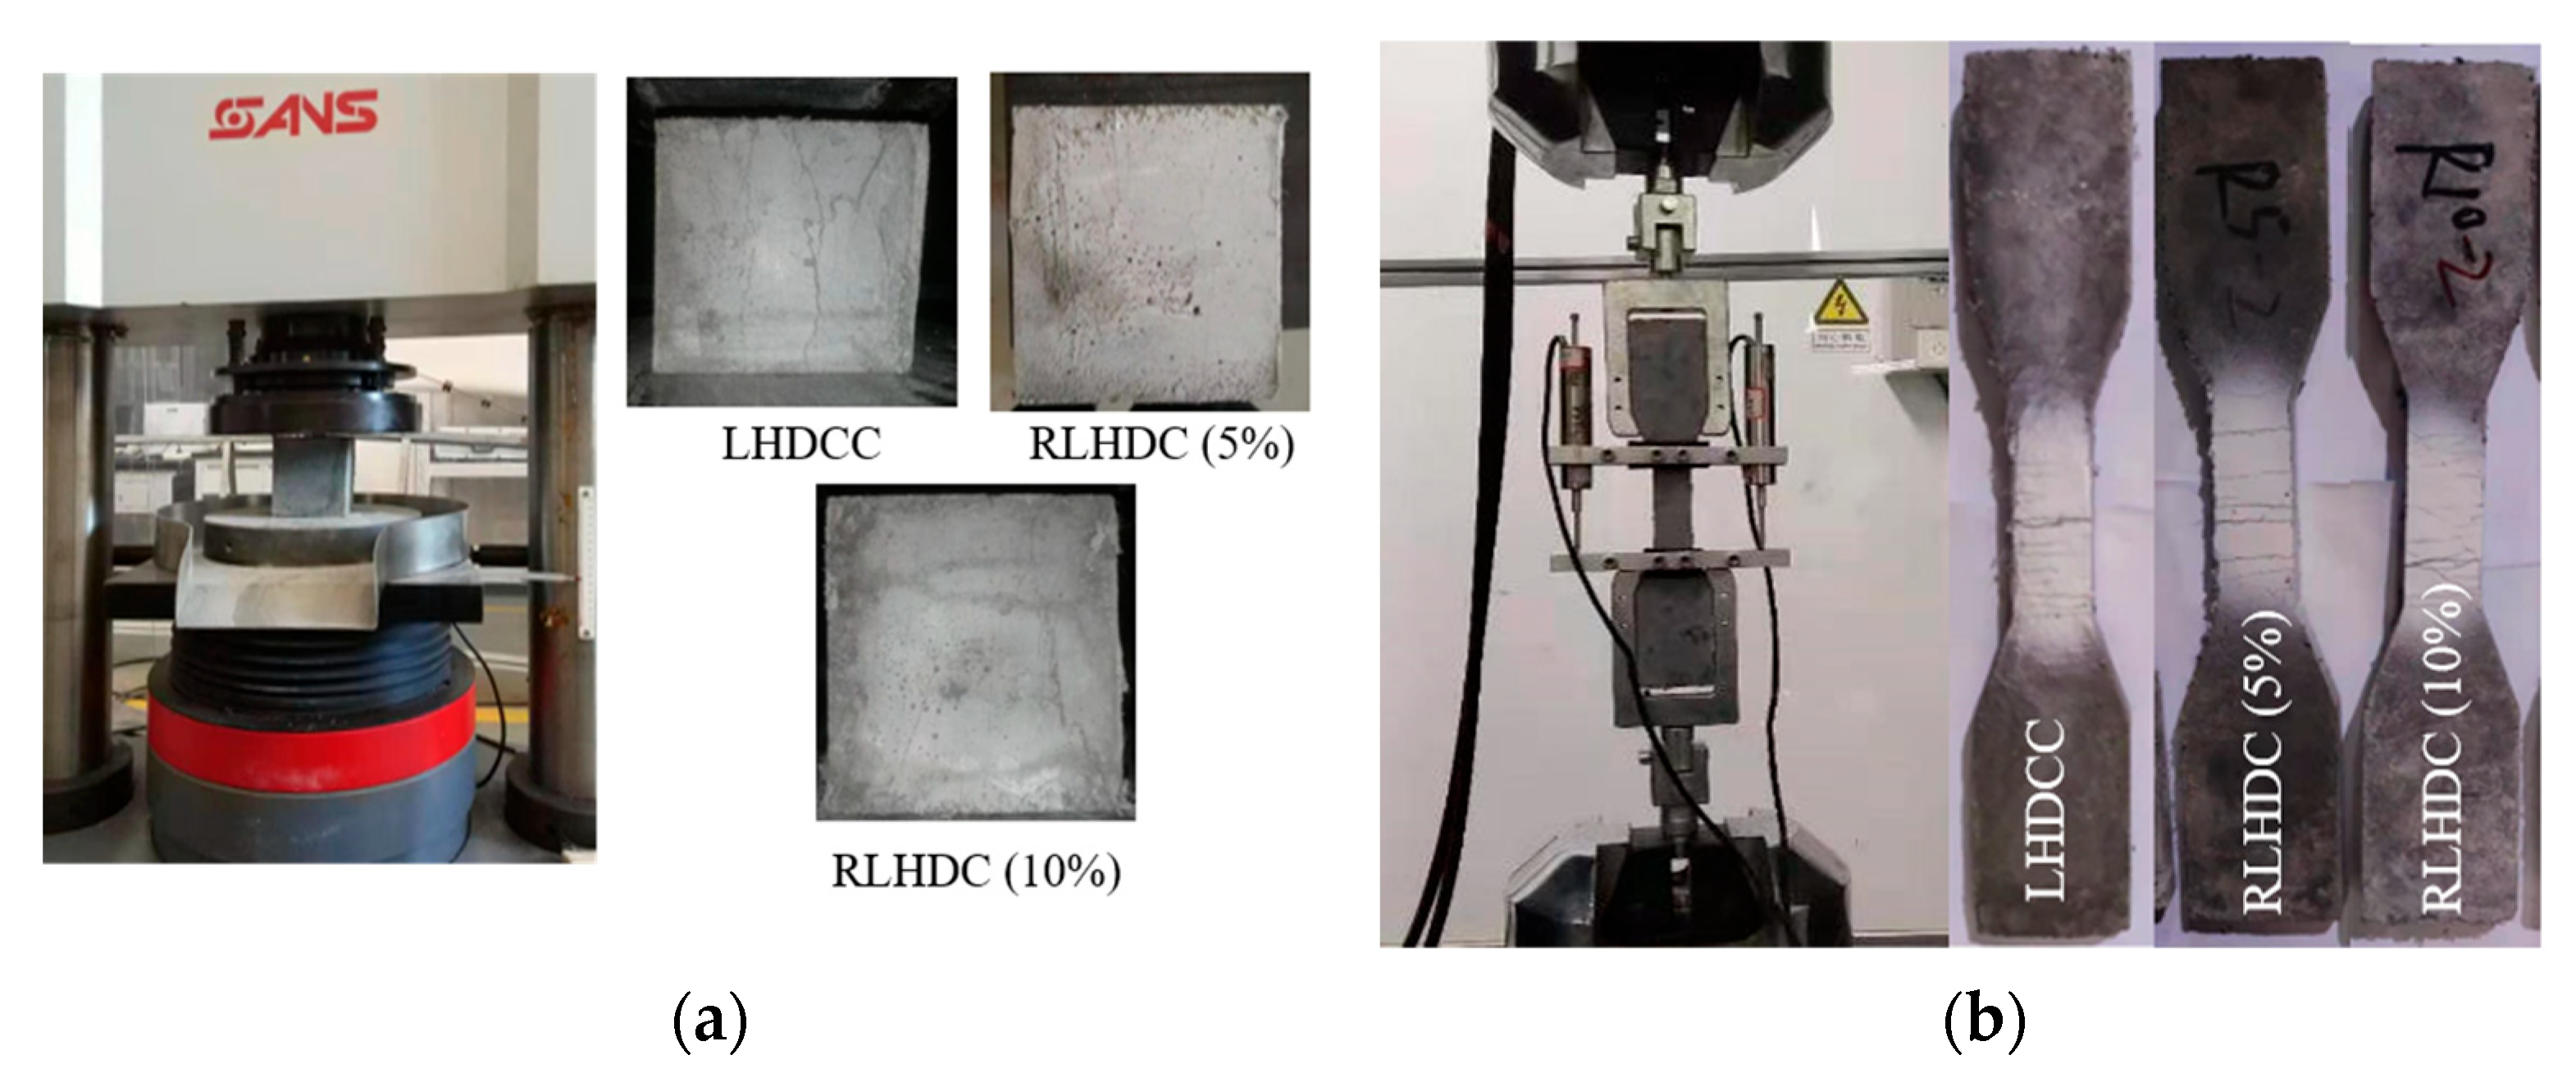
2.2. Material Tests
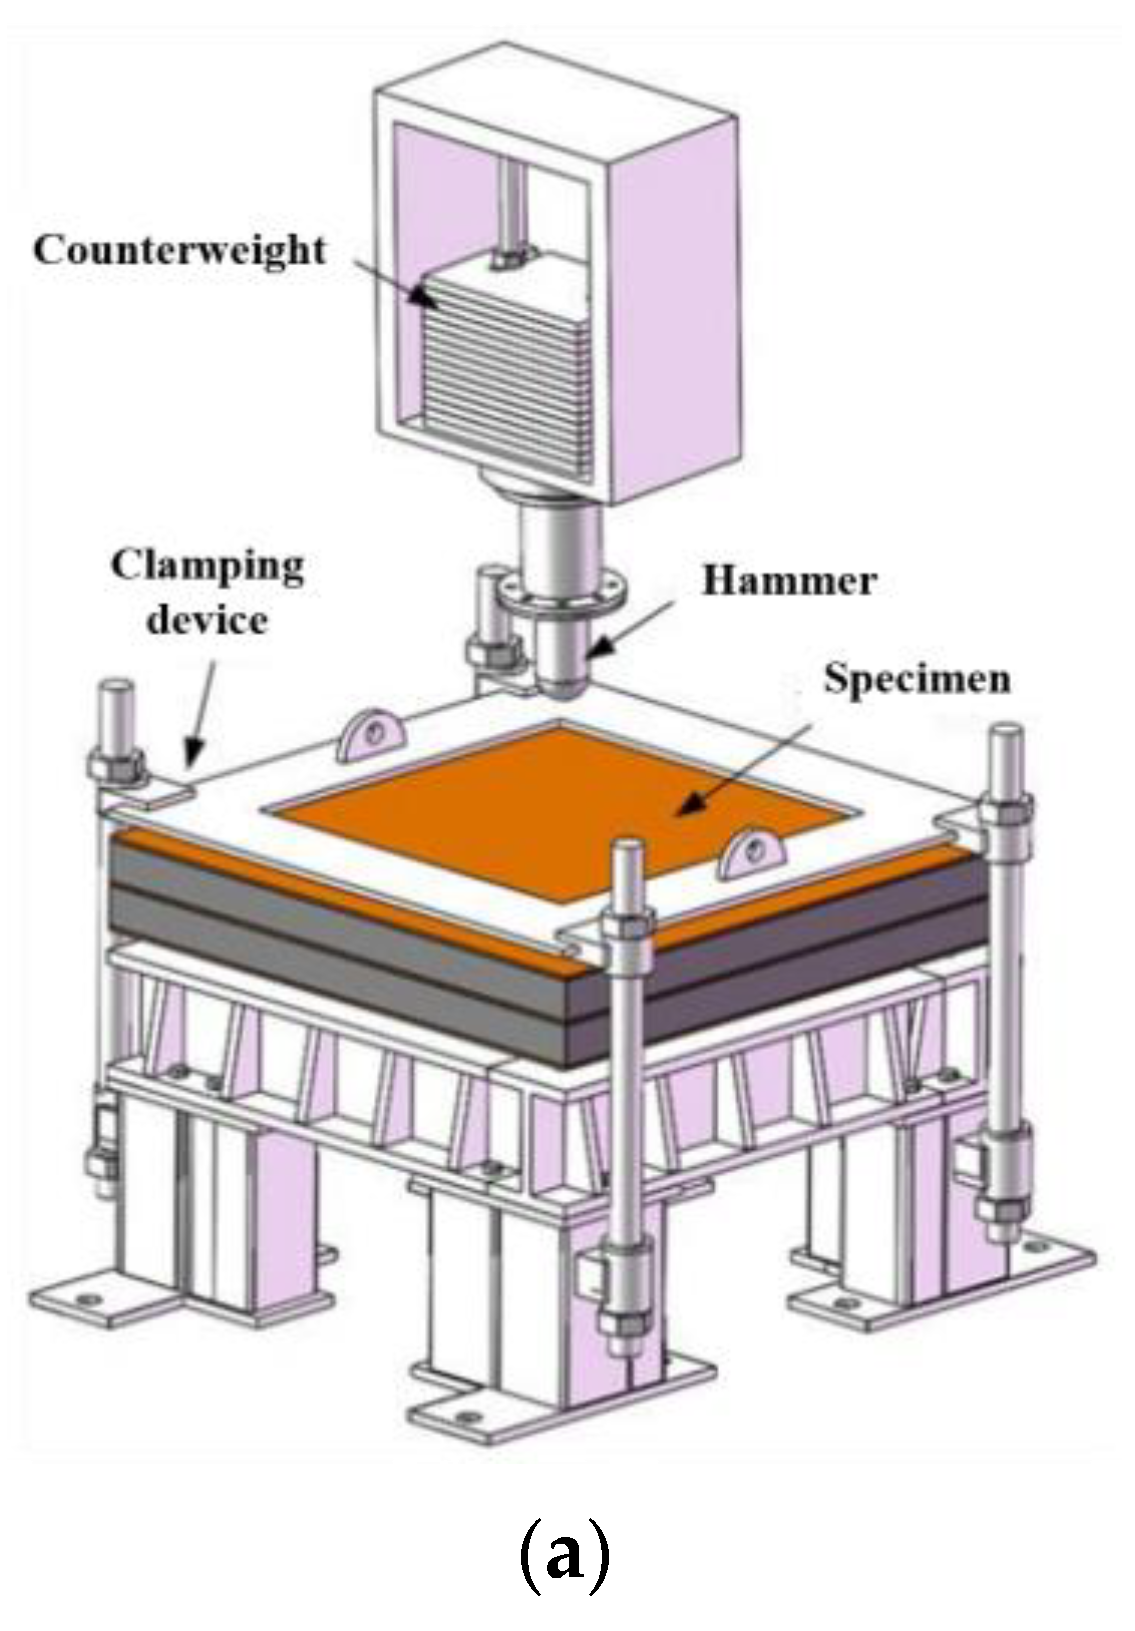
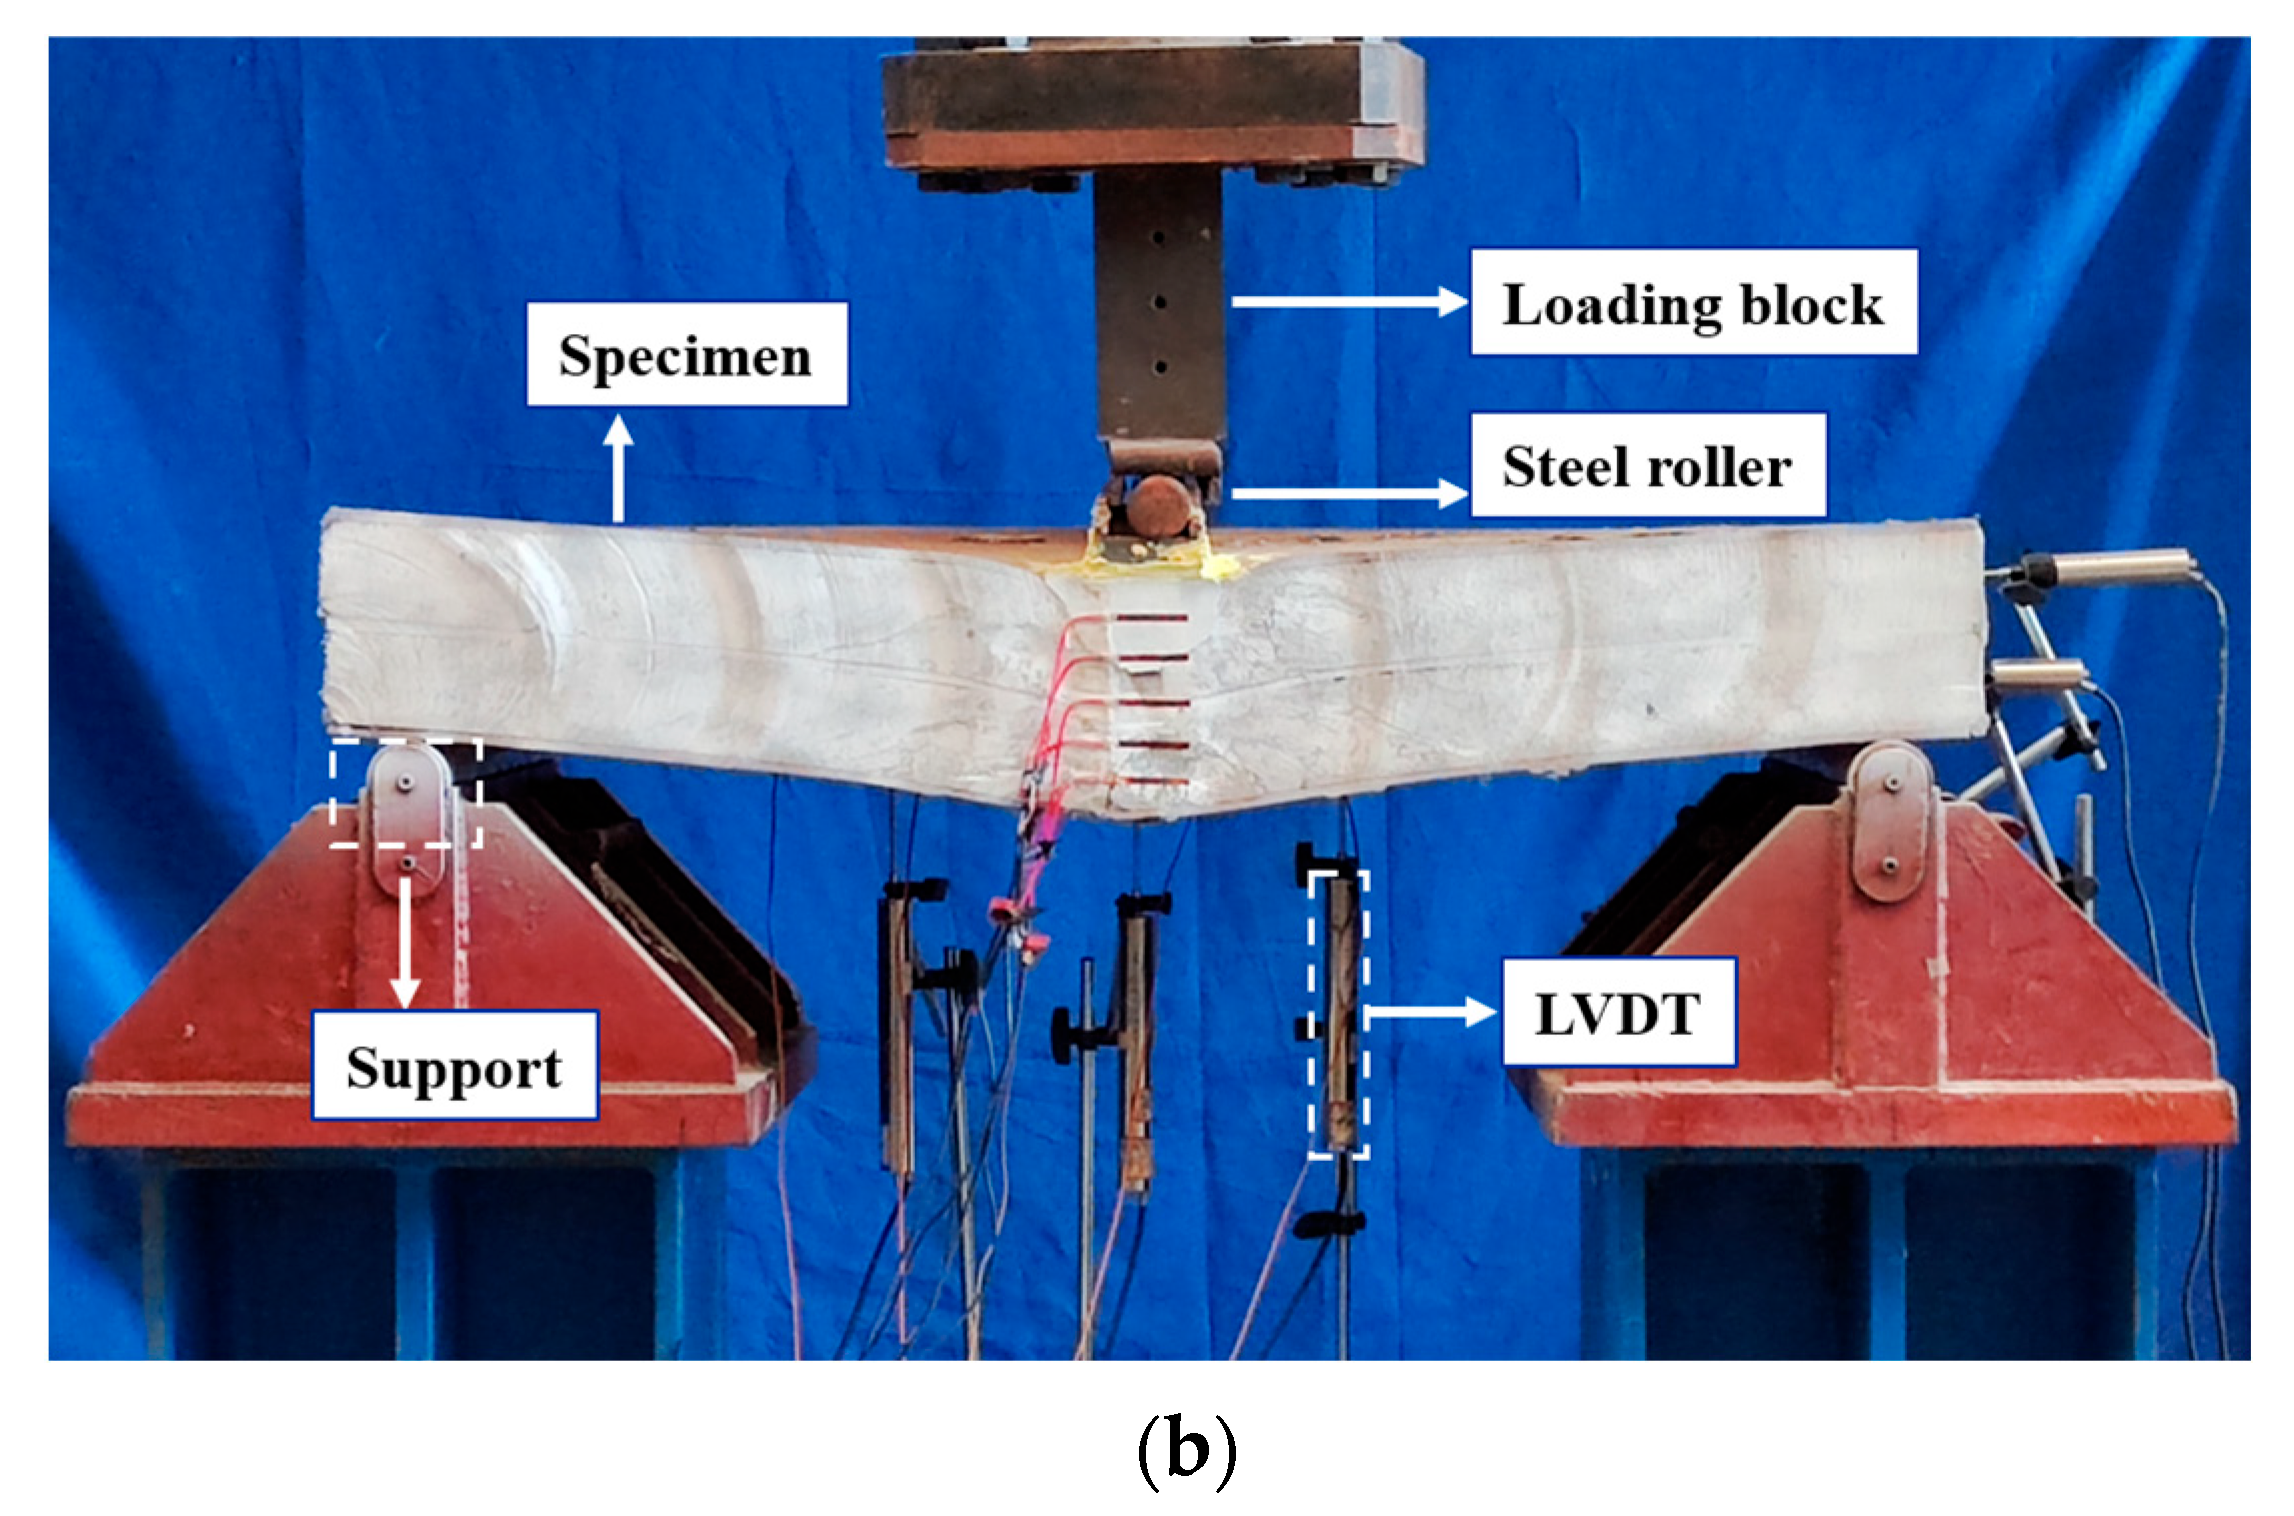
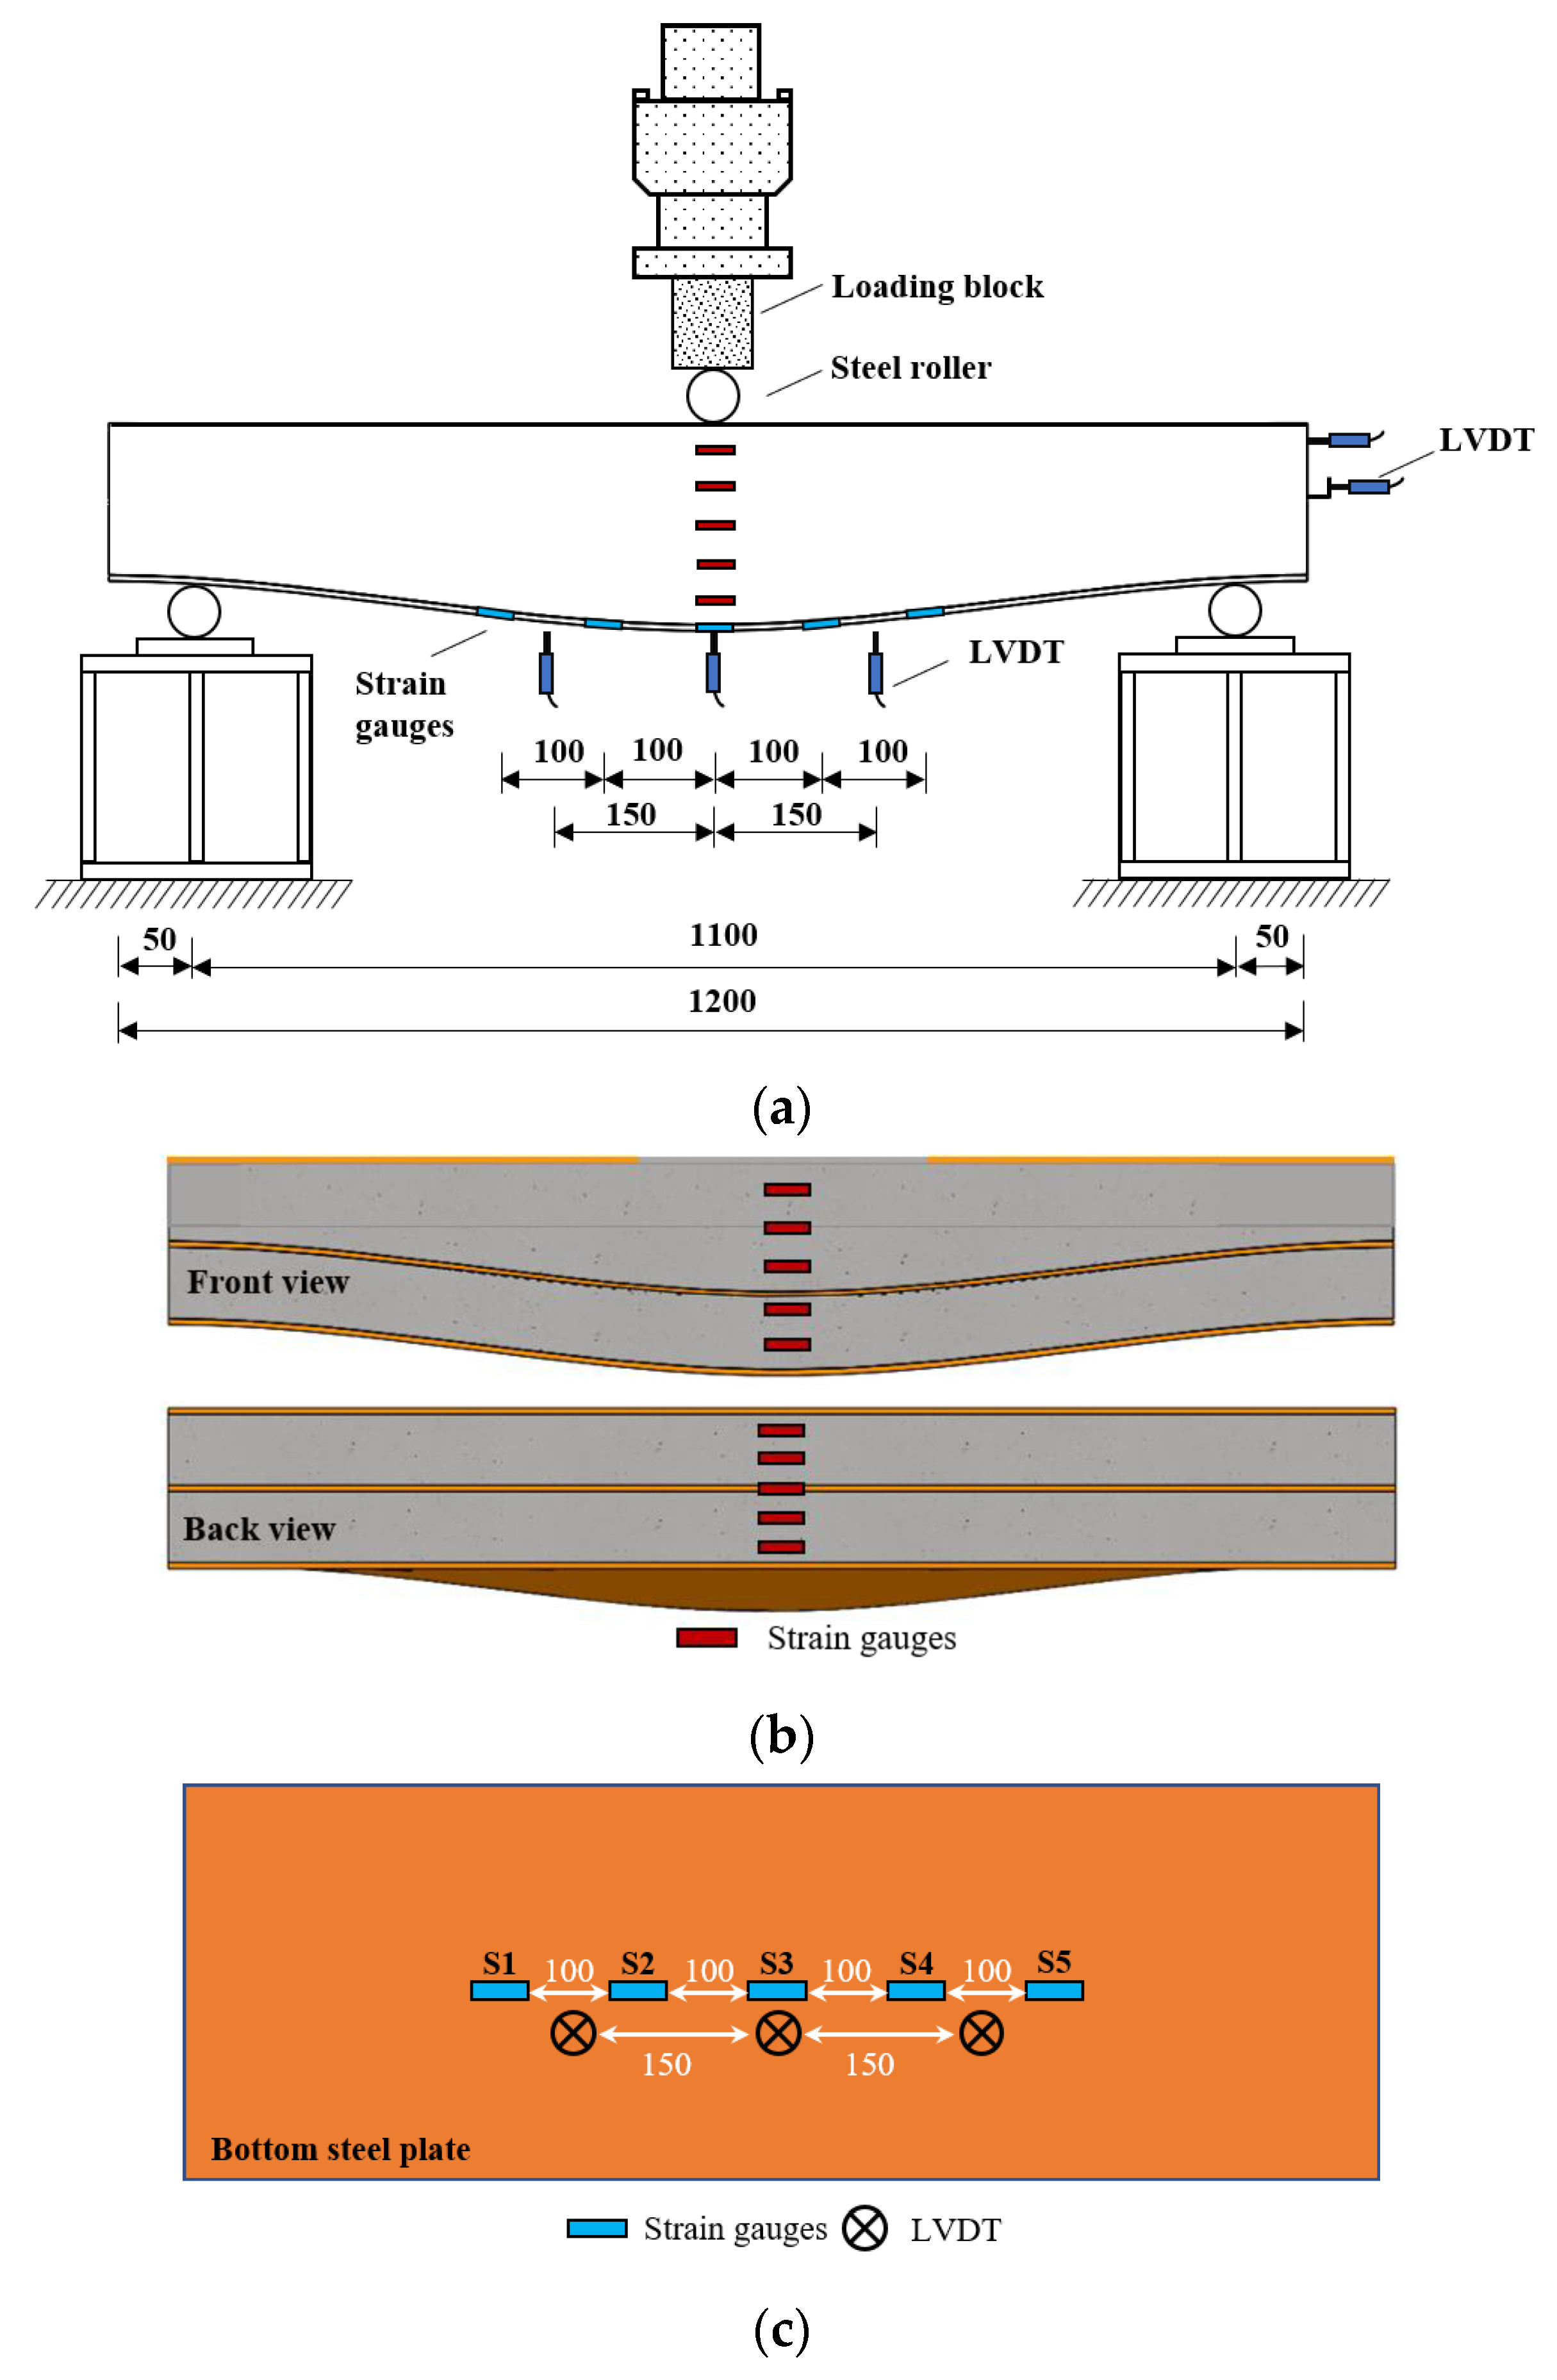
2.3. Test Procedure
3. Test Results and Discussions
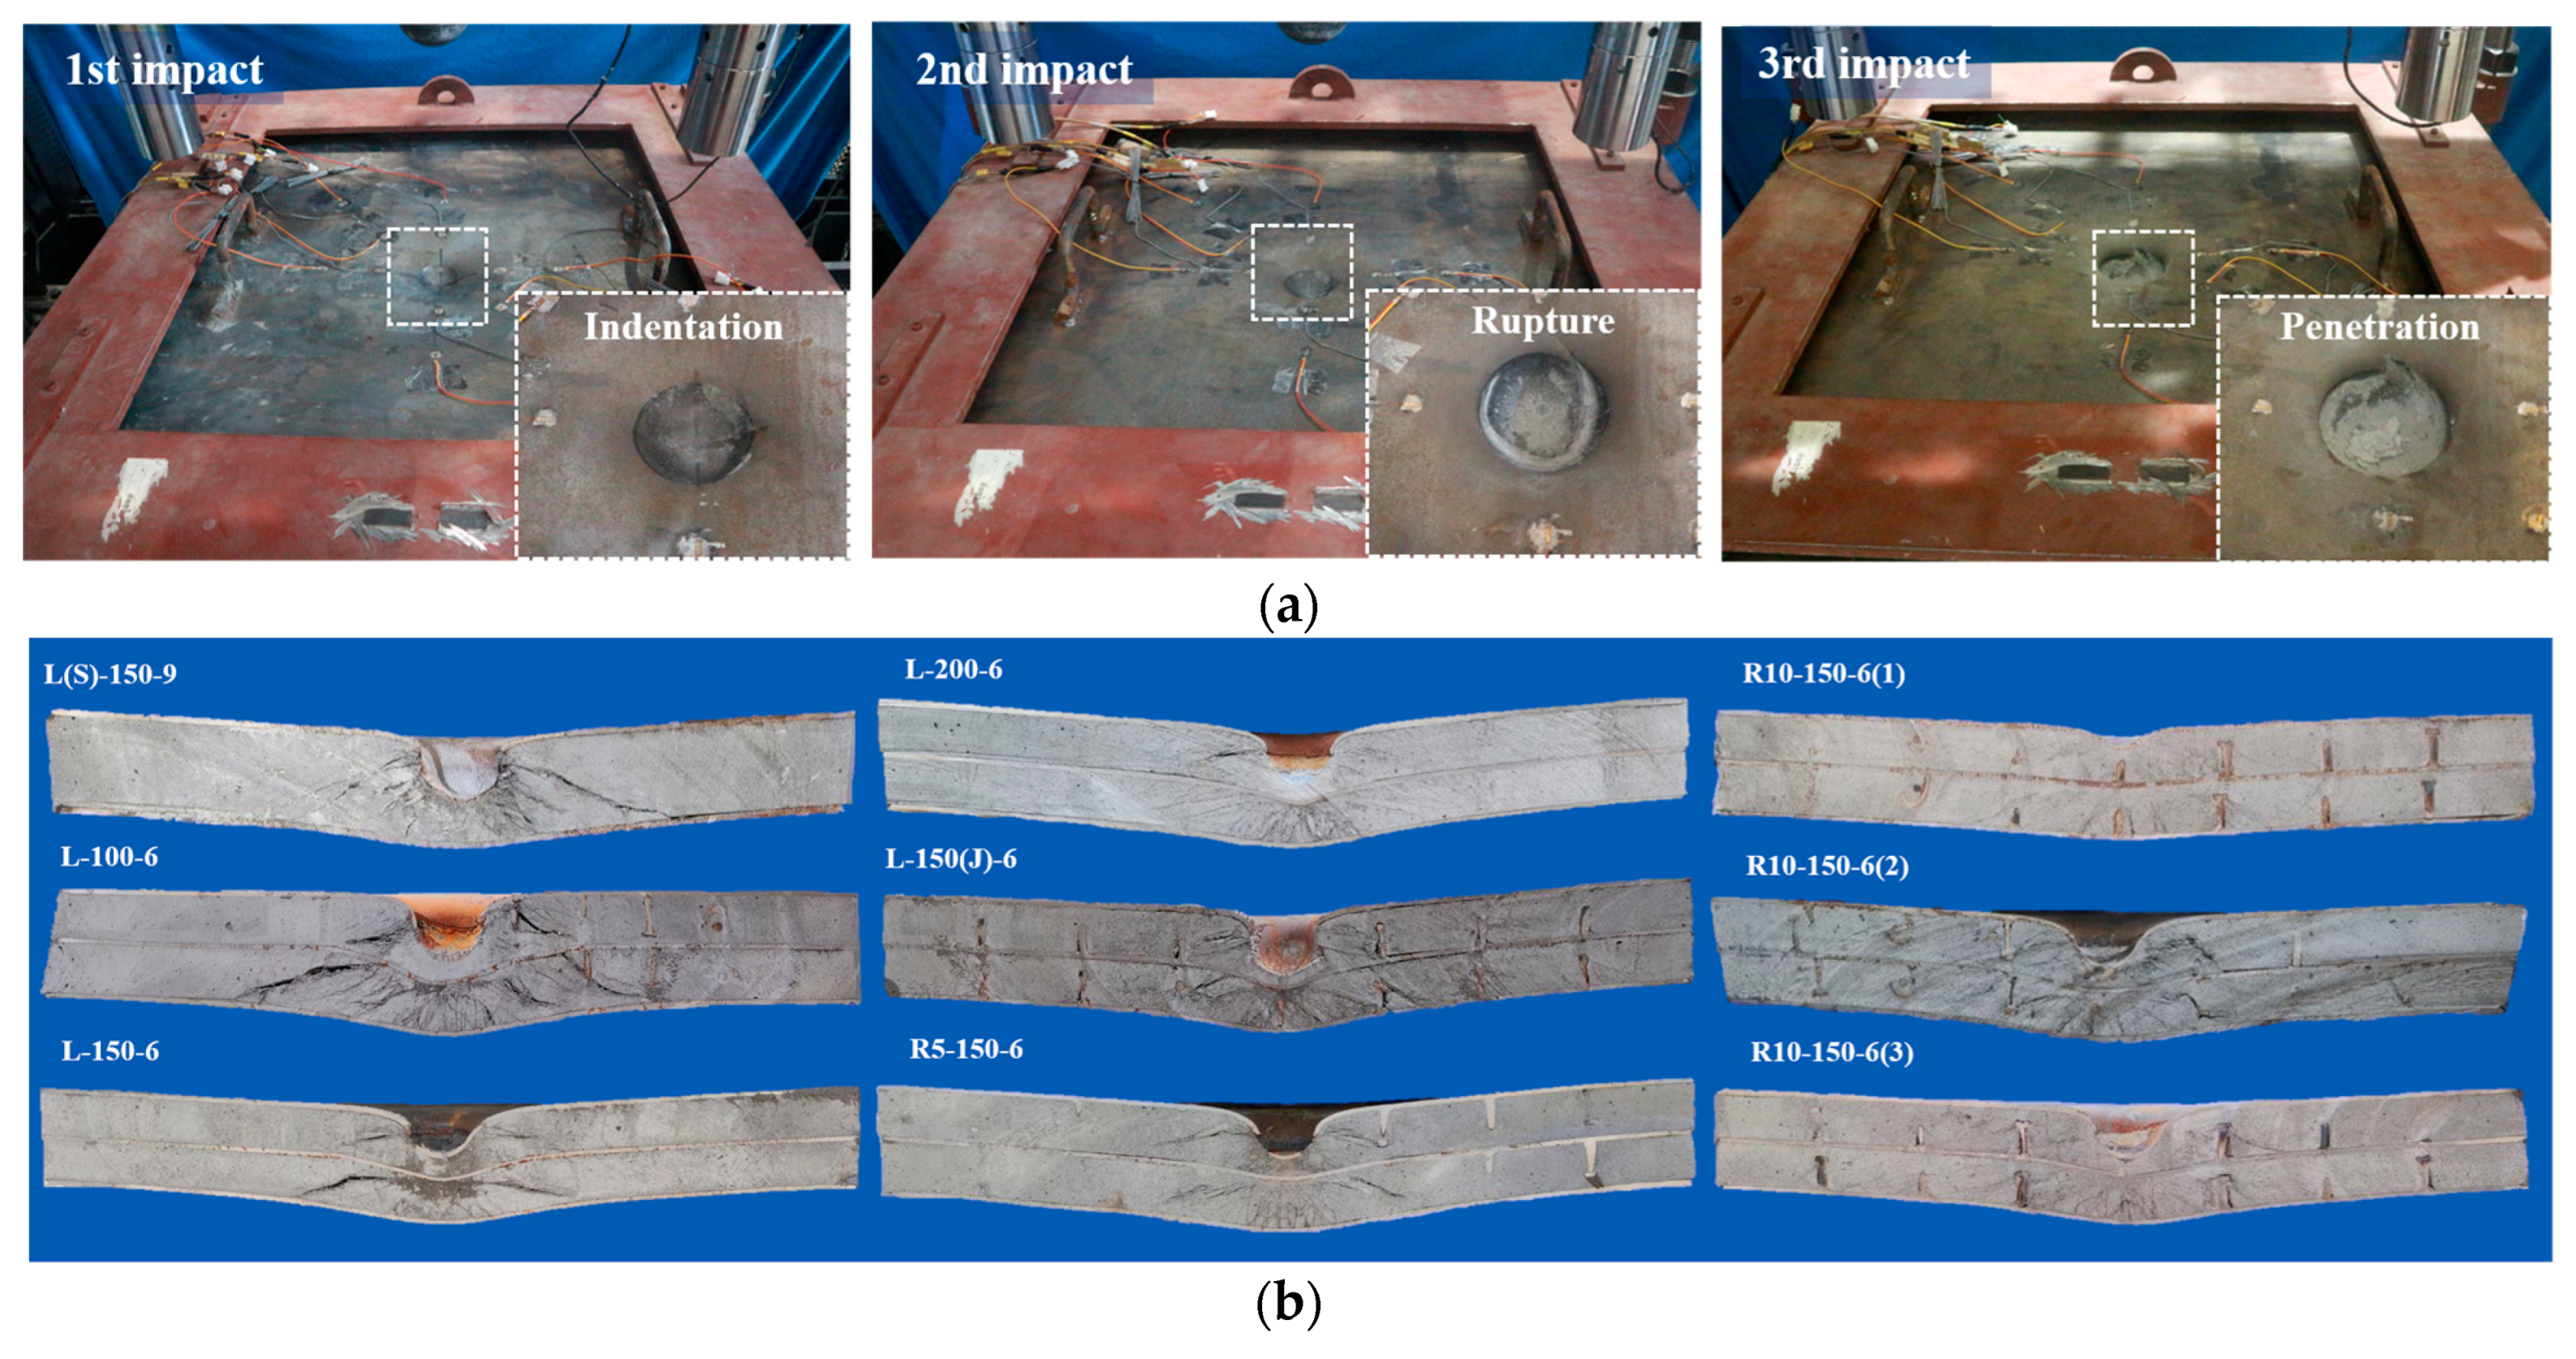
3.1. Impact Test Results
3.2. Residual Flexural Test Results
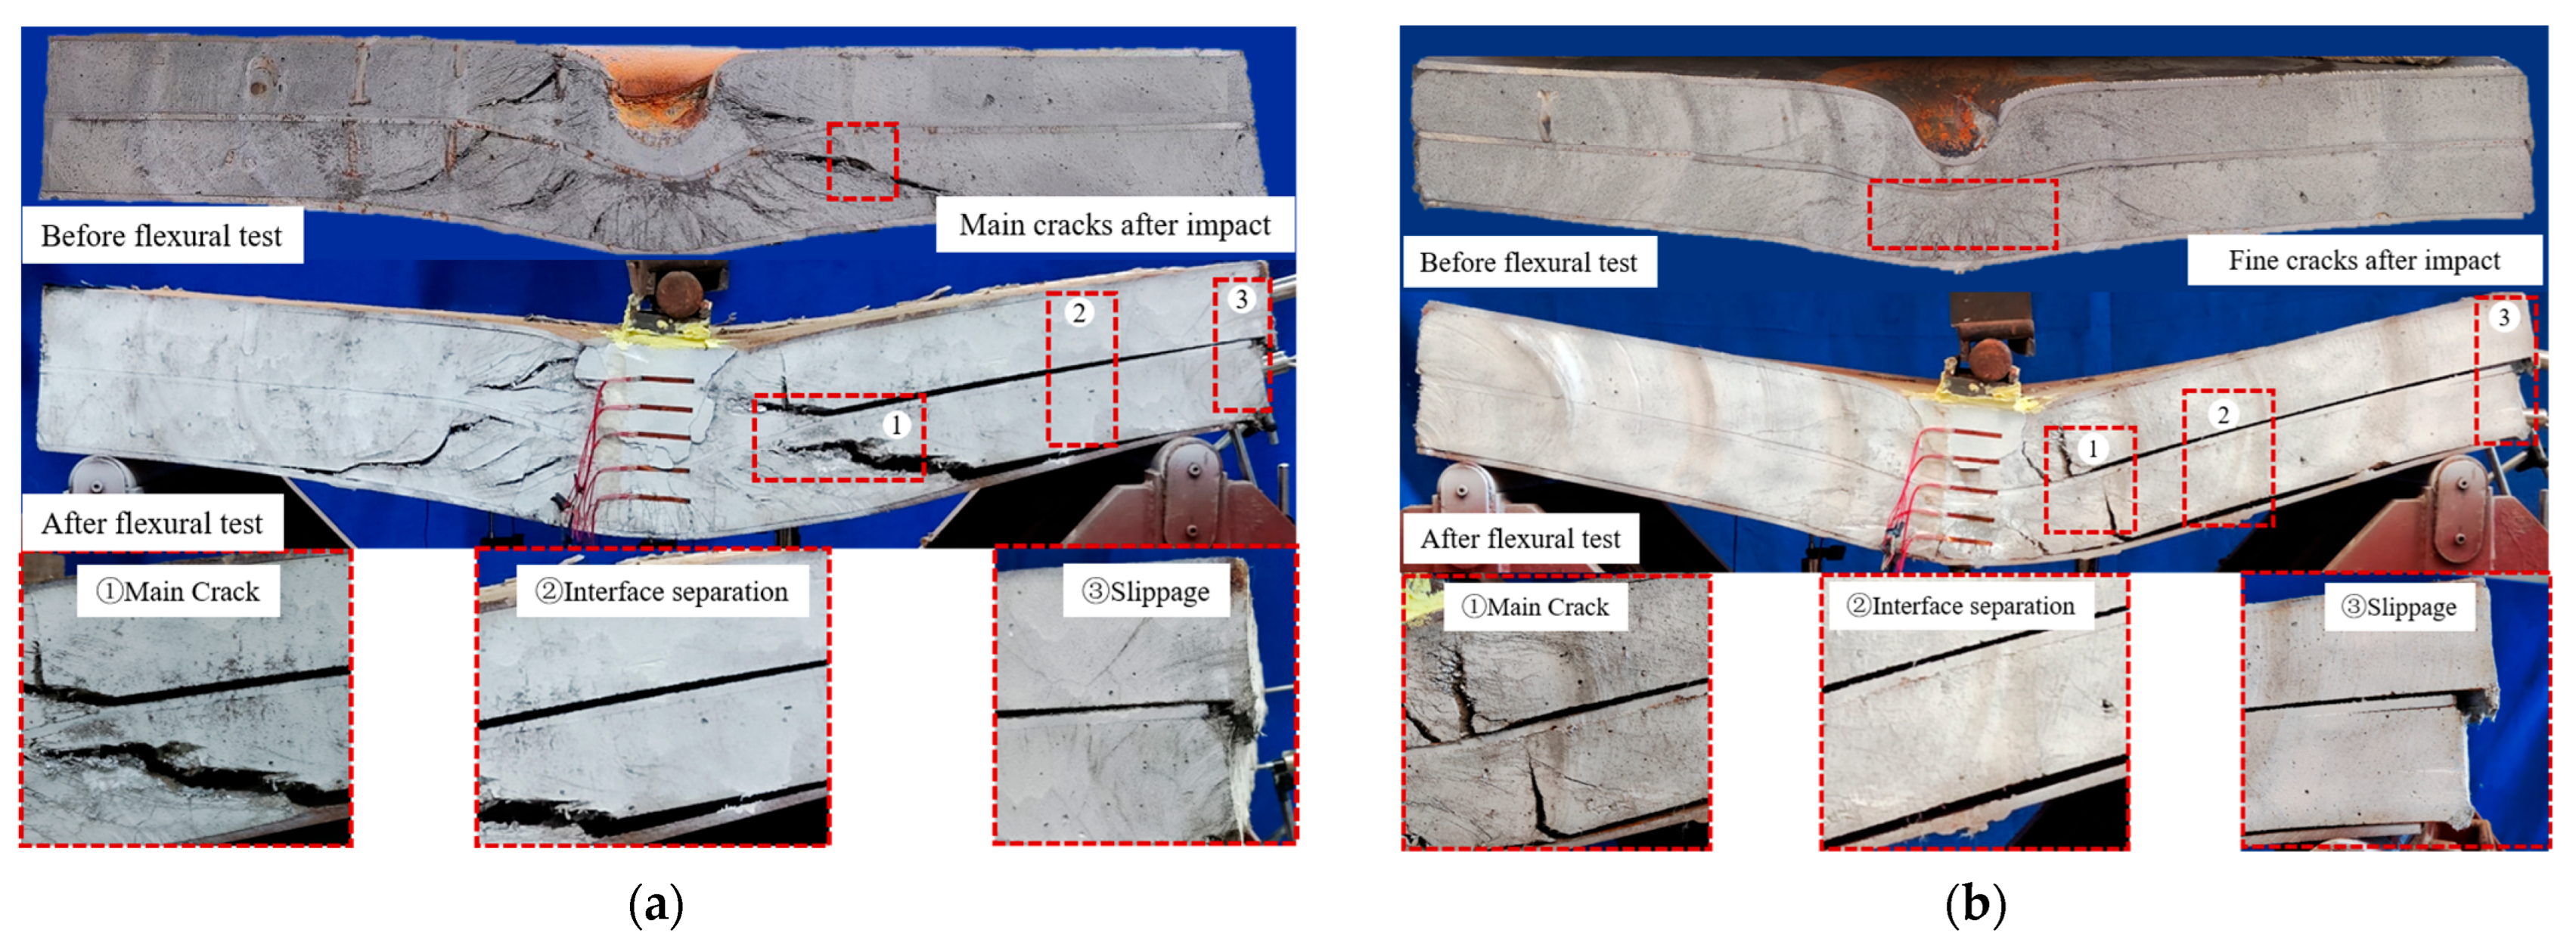
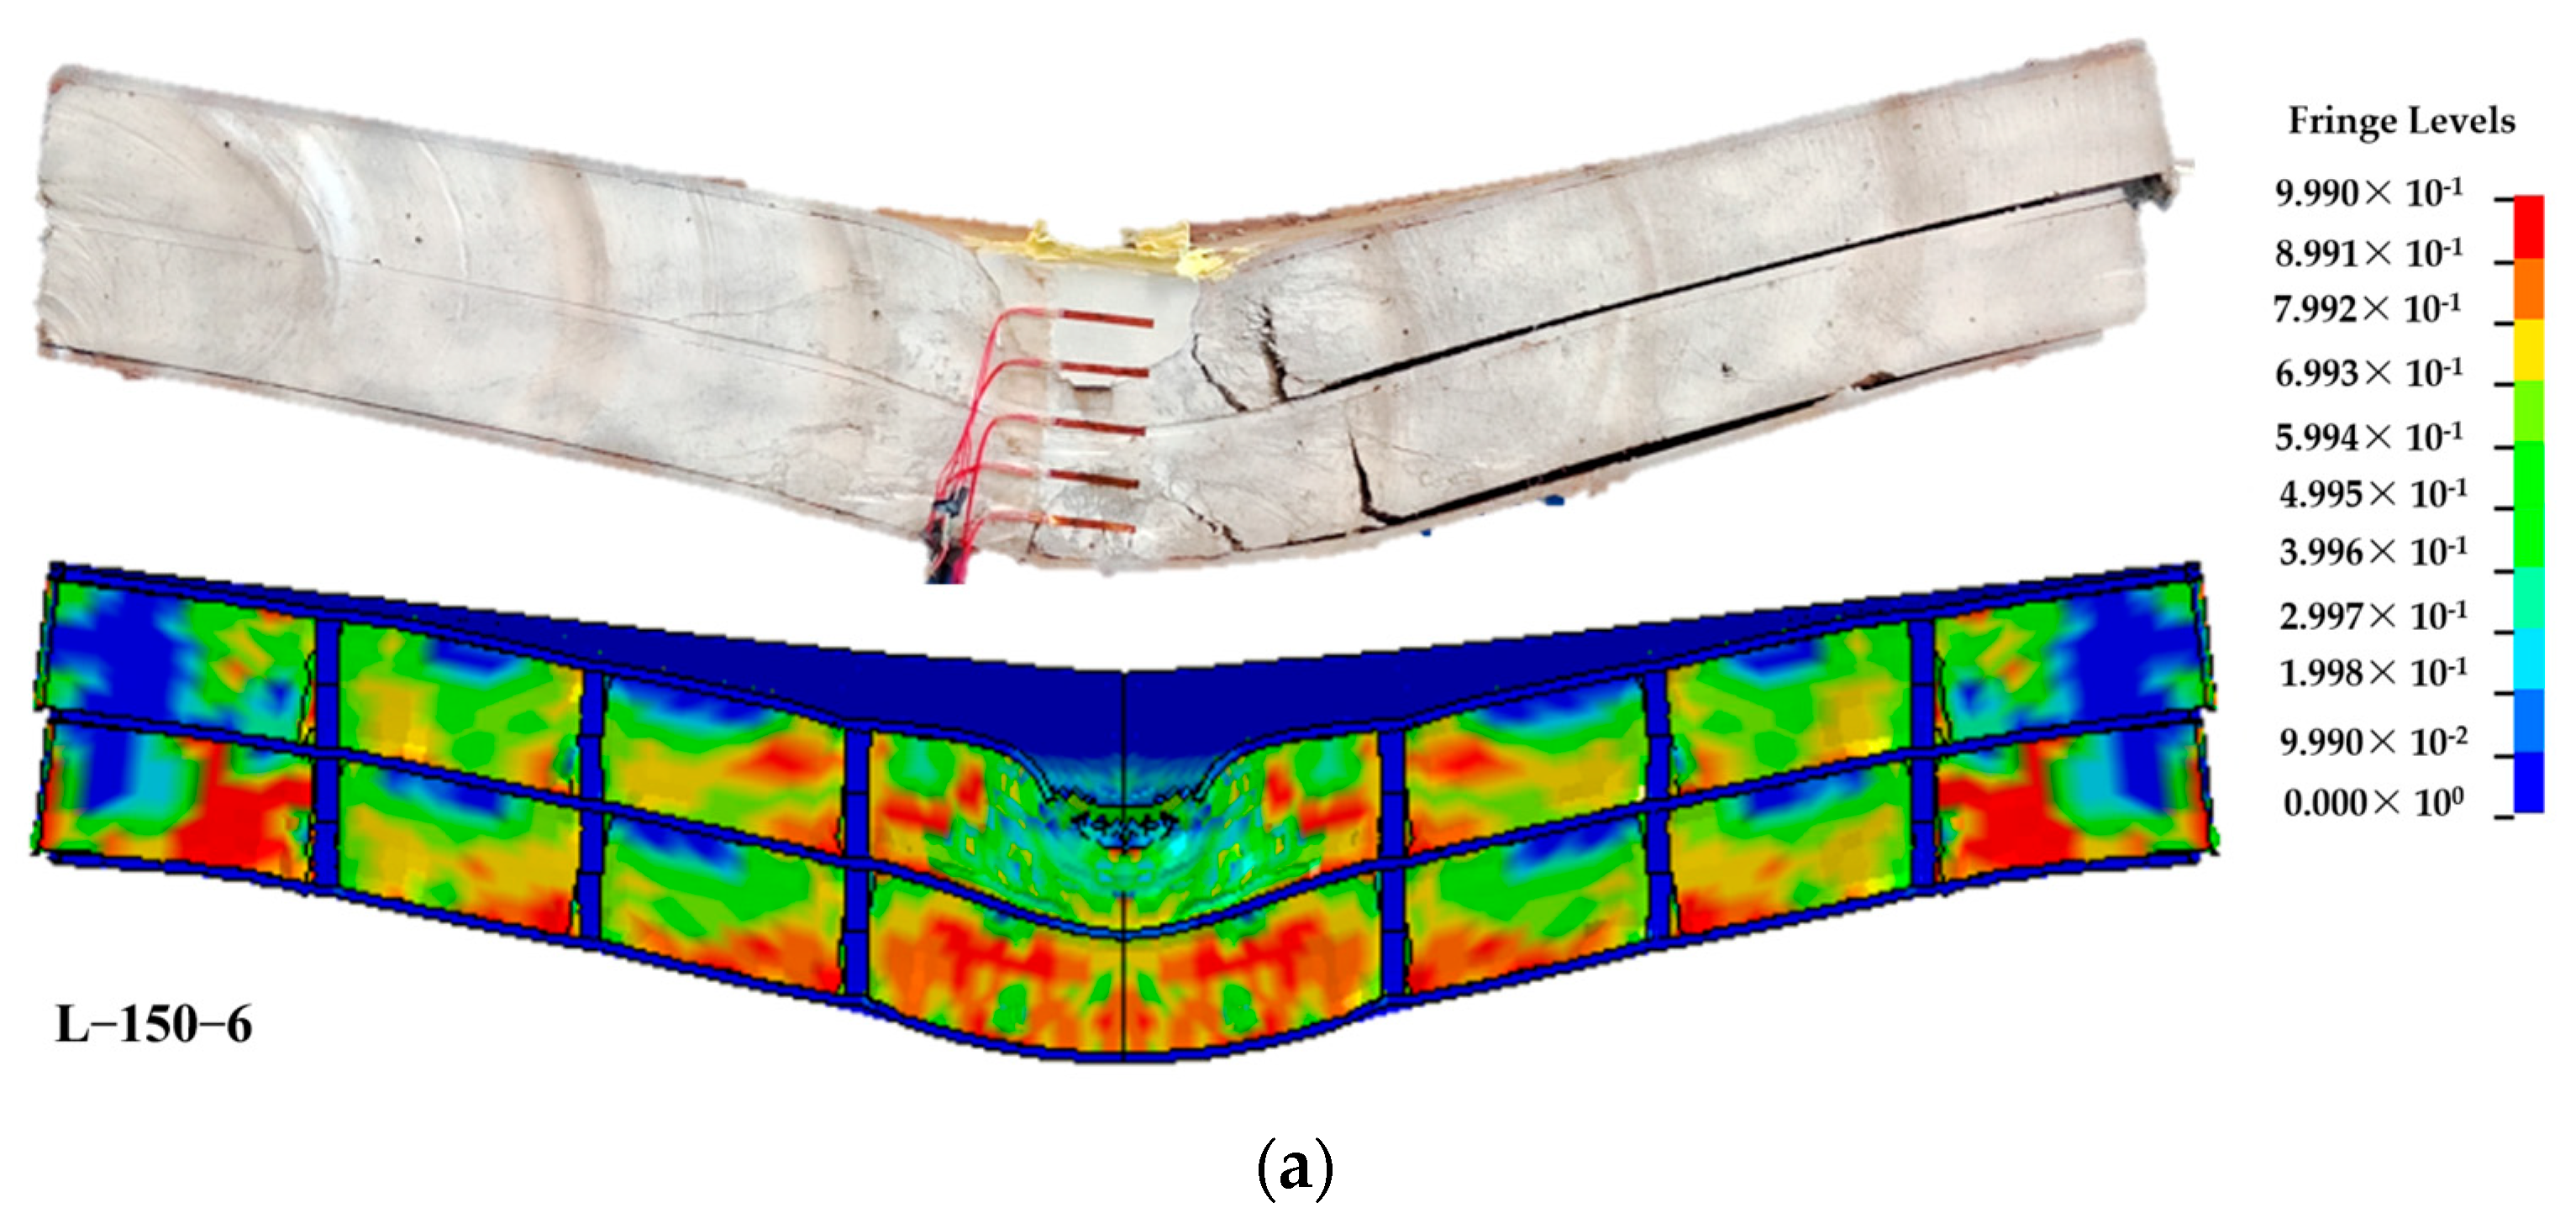
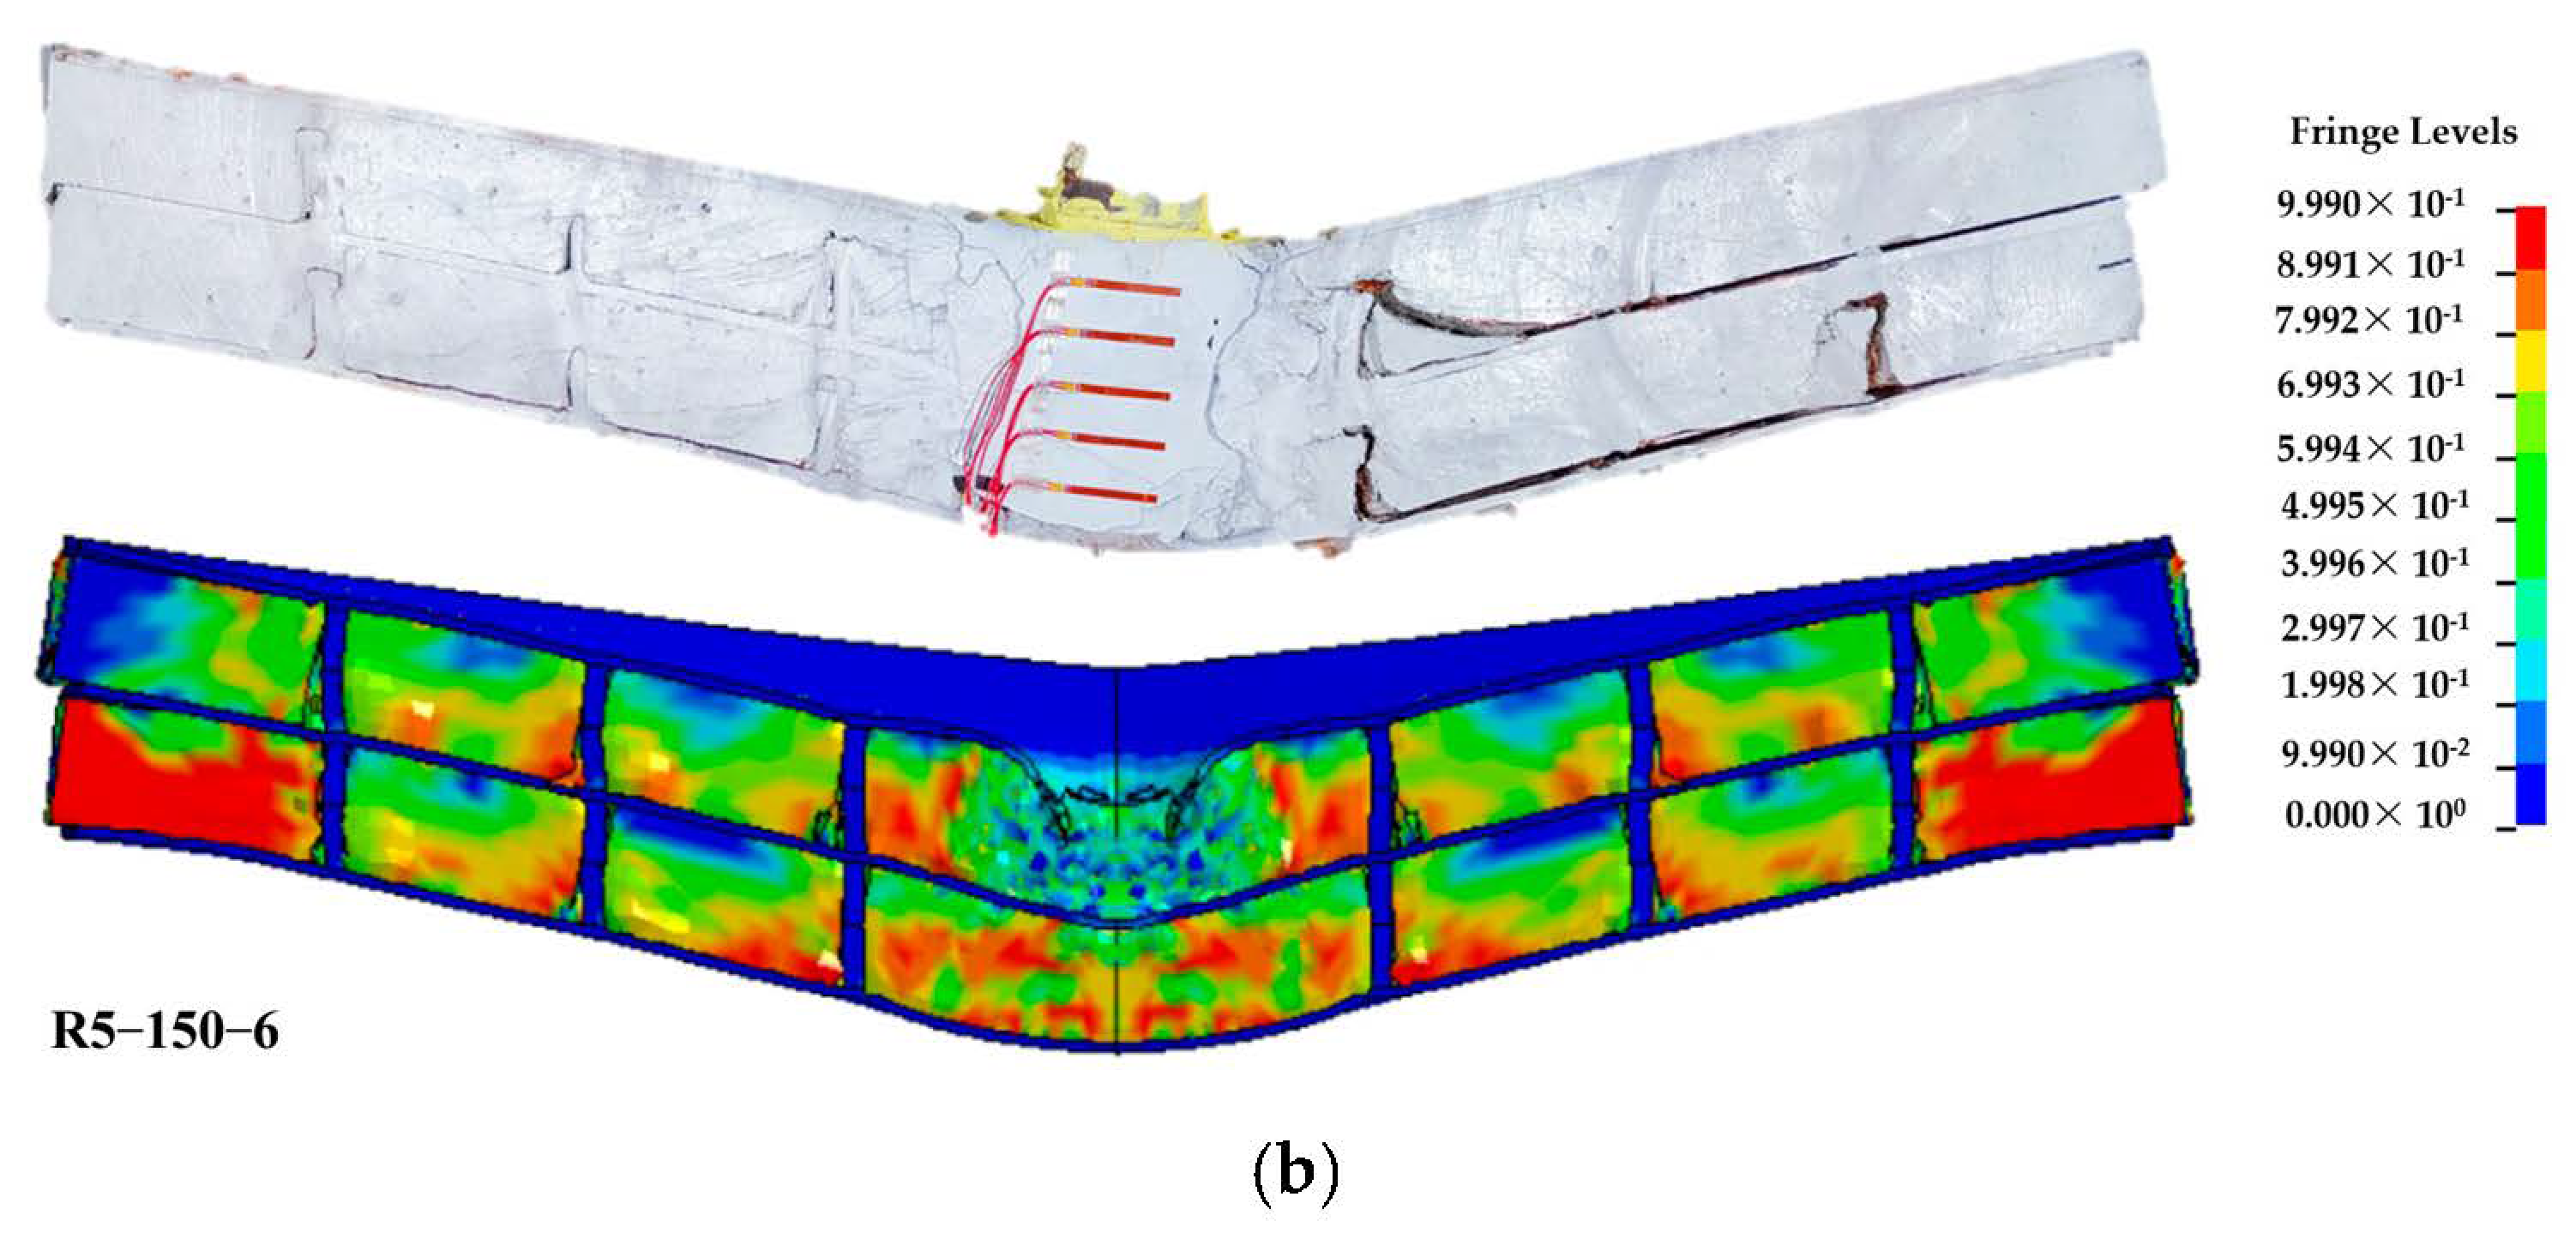
3.2.1. Failure Modes
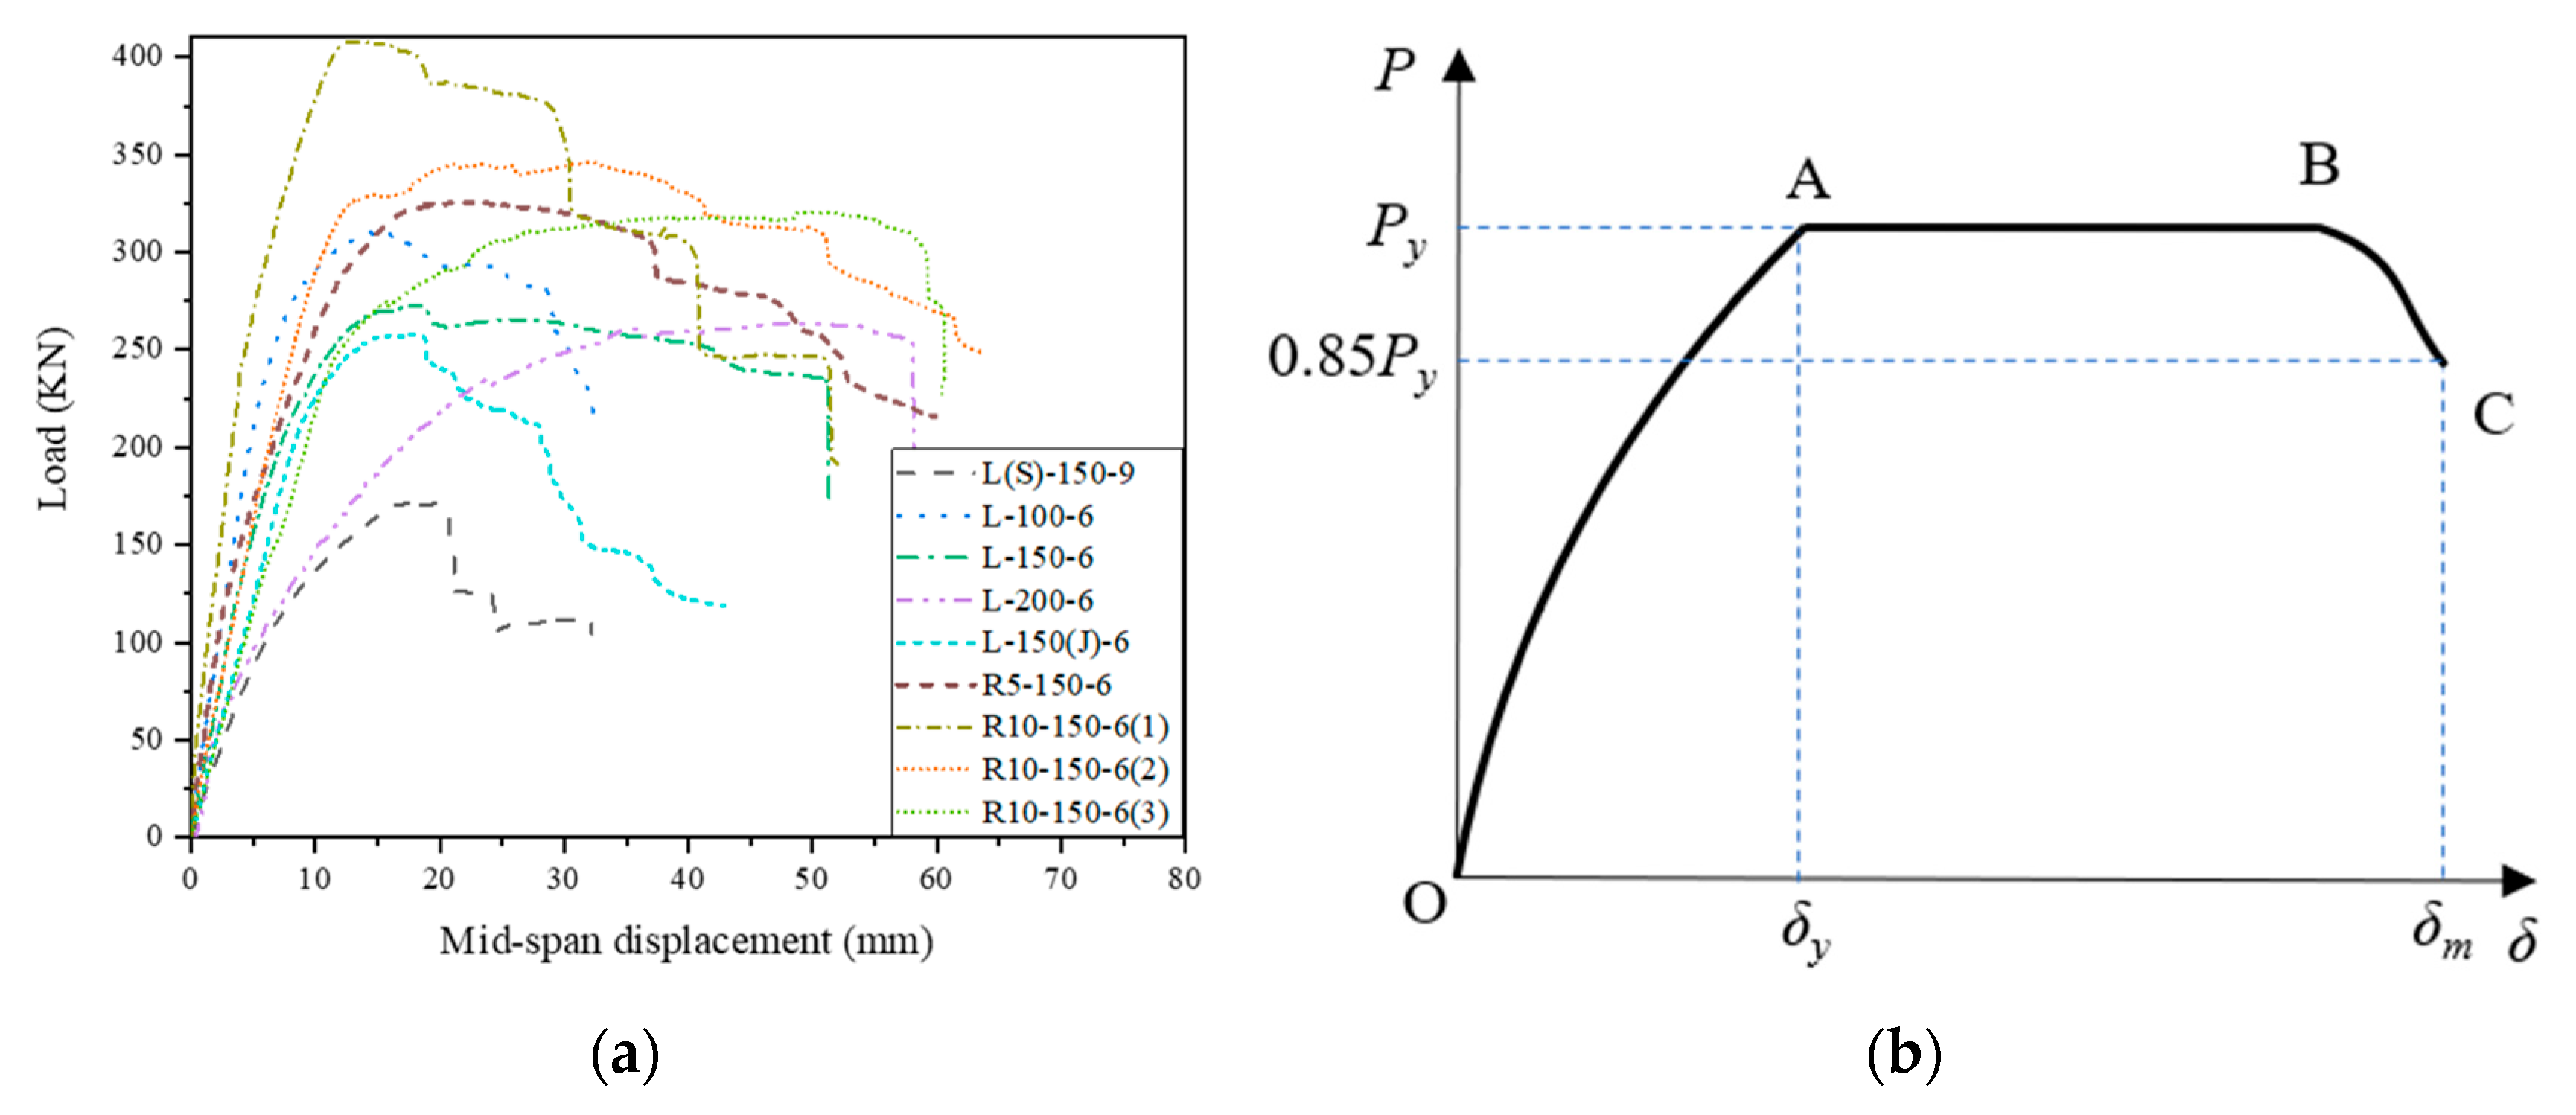
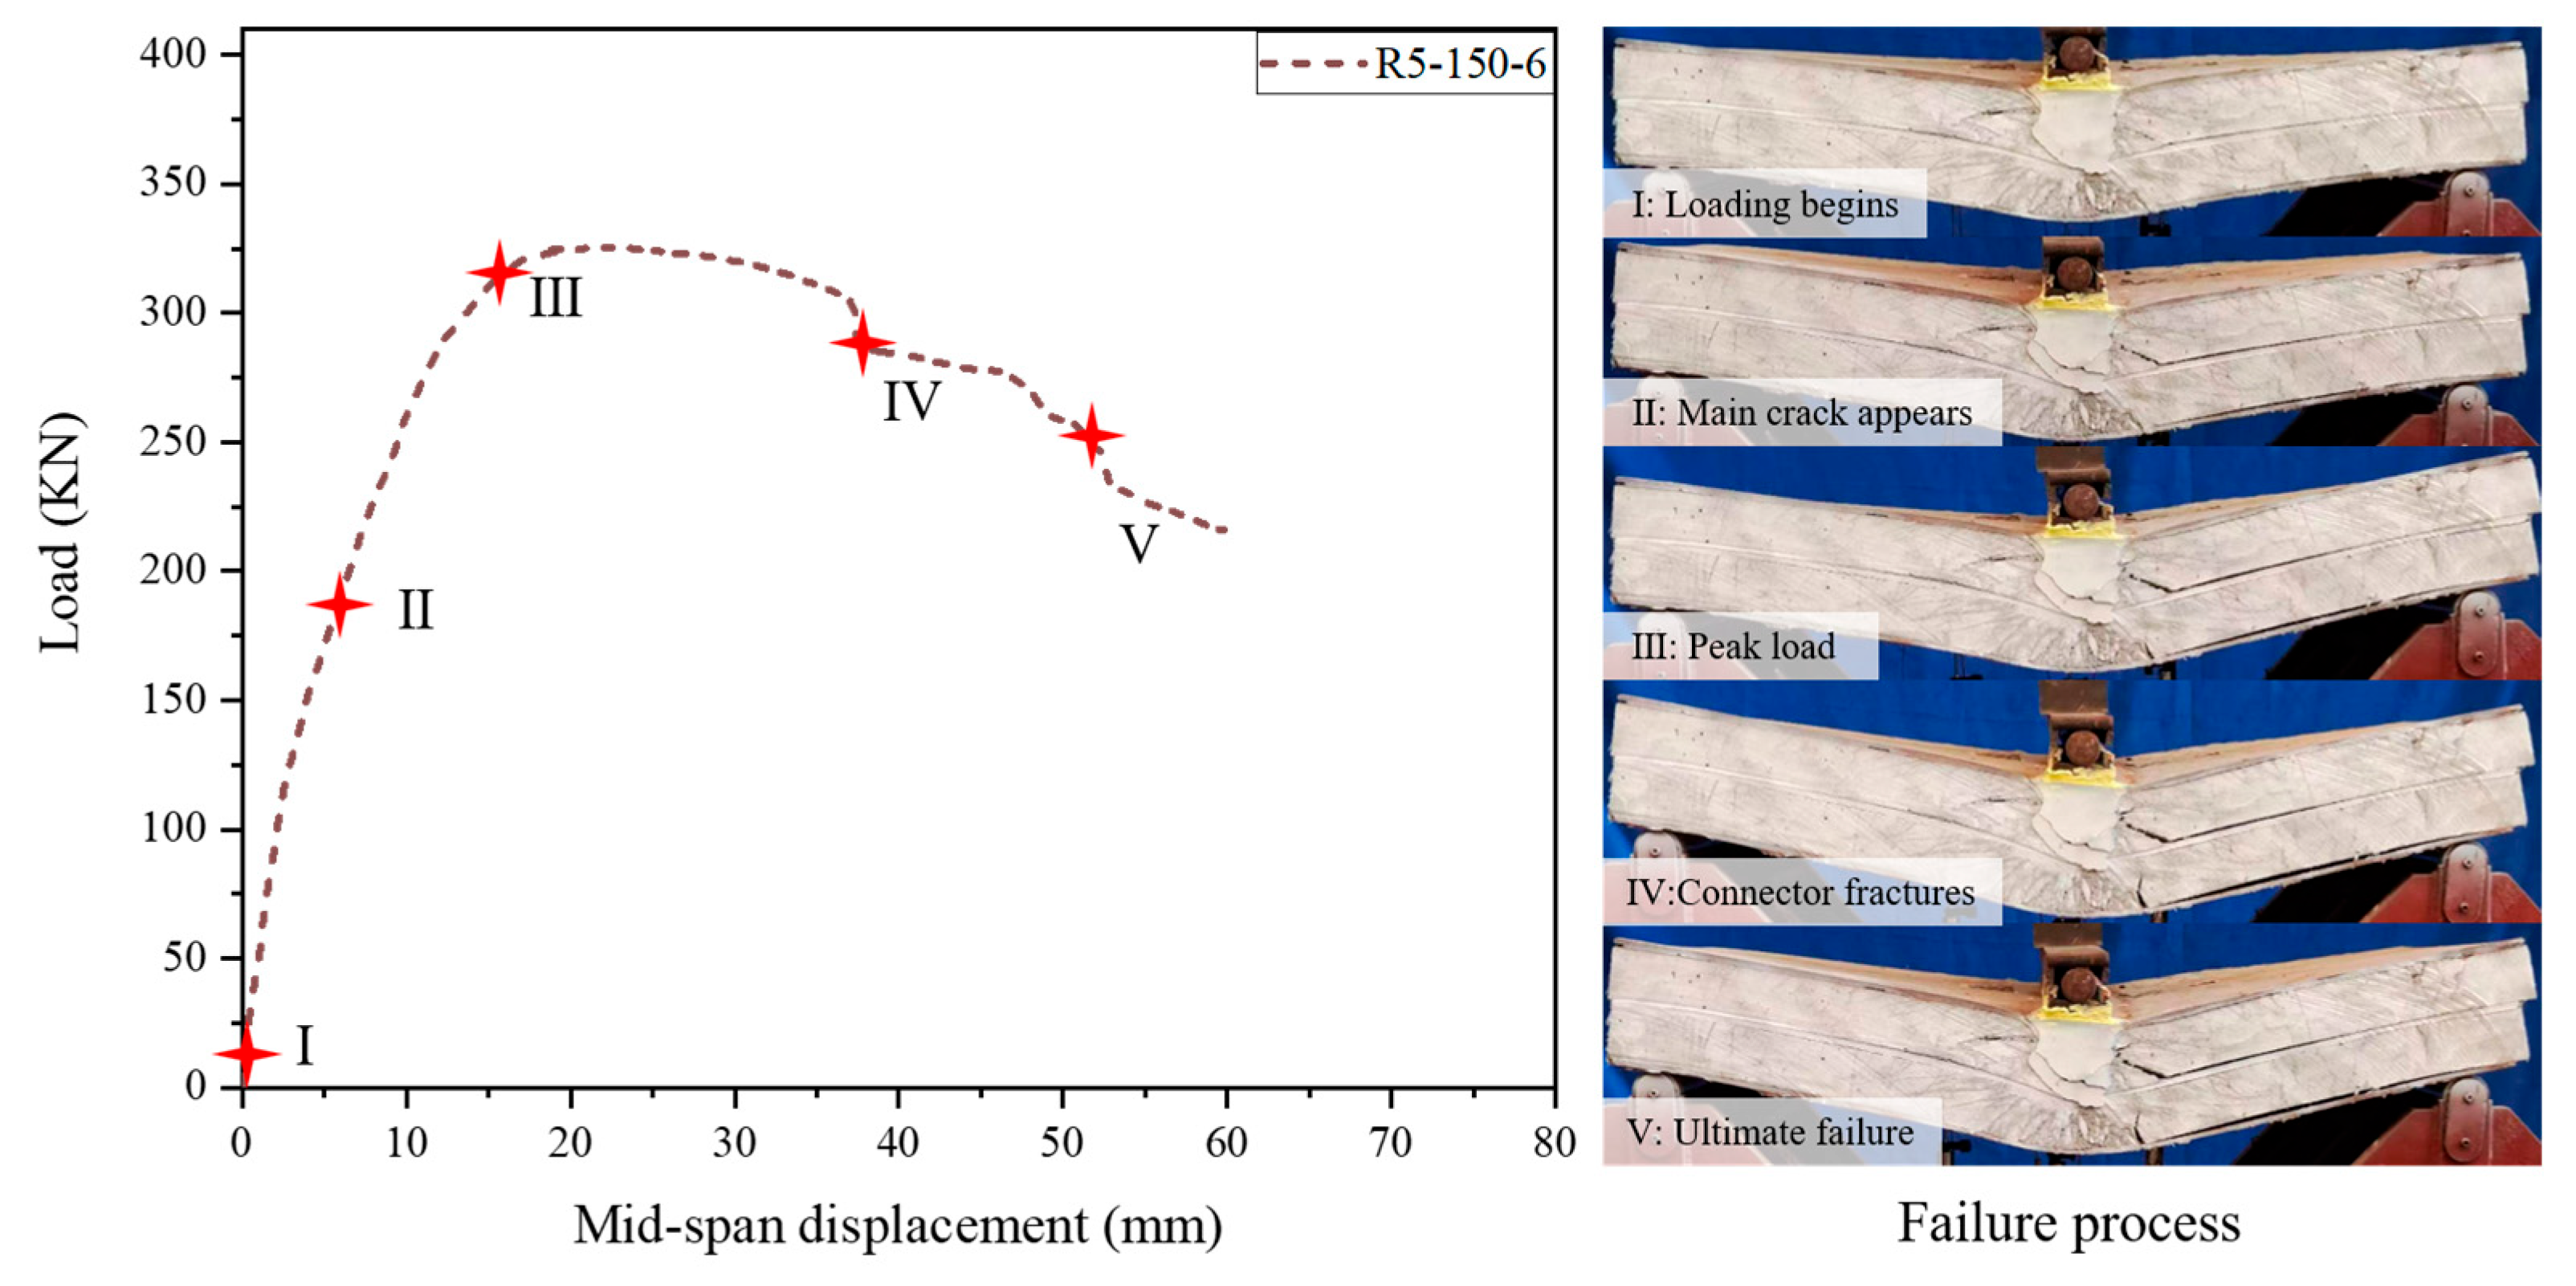
3.2.2. Load-Deflection Curves
- (1)
- Crack development stage (O~A): The composite panel experiences internal damage after impact, resulting in a non-linear rise of the load–displacement curve during the initial loading stage of flexural test. The stiffness of the composite panel’s load–displacement curve gradually diminishes. Fine cracks proliferate in the mid-span, and the primary cracks originating from the impact widen progressively. As the mid-span deflection increases, the composite panel reaches its maximum residual resistance, Py.
- (2)
- Slippage stage (A~B): As deflection increases further, the load–displacement curve of the specimen enters the platform stage, characterized by the dominance of steel–concrete interface slippage in the structural behavior. The magnitude of slippage leads to continuous breakage and audible sounds from the studs, while the width of the primary crack gradually expands. The load experiences a slight decrease during this stage and the displacement increases at a faster rate compared to the crack development stage.
- (3)
- Unloading stage (B~C): As the connector fractures and the concrete cracks, the load rapidly decreases. Failure of the specimen is determined when the load reaches 85% of the maximum load, which corresponds to the ultimate displacement δm. At the point of ultimate displacement, a distinct separation occurs between the steel plate and the concrete interface in the shear span area, resulting in the loss of integrity and load-bearing capacity of the composite panel.
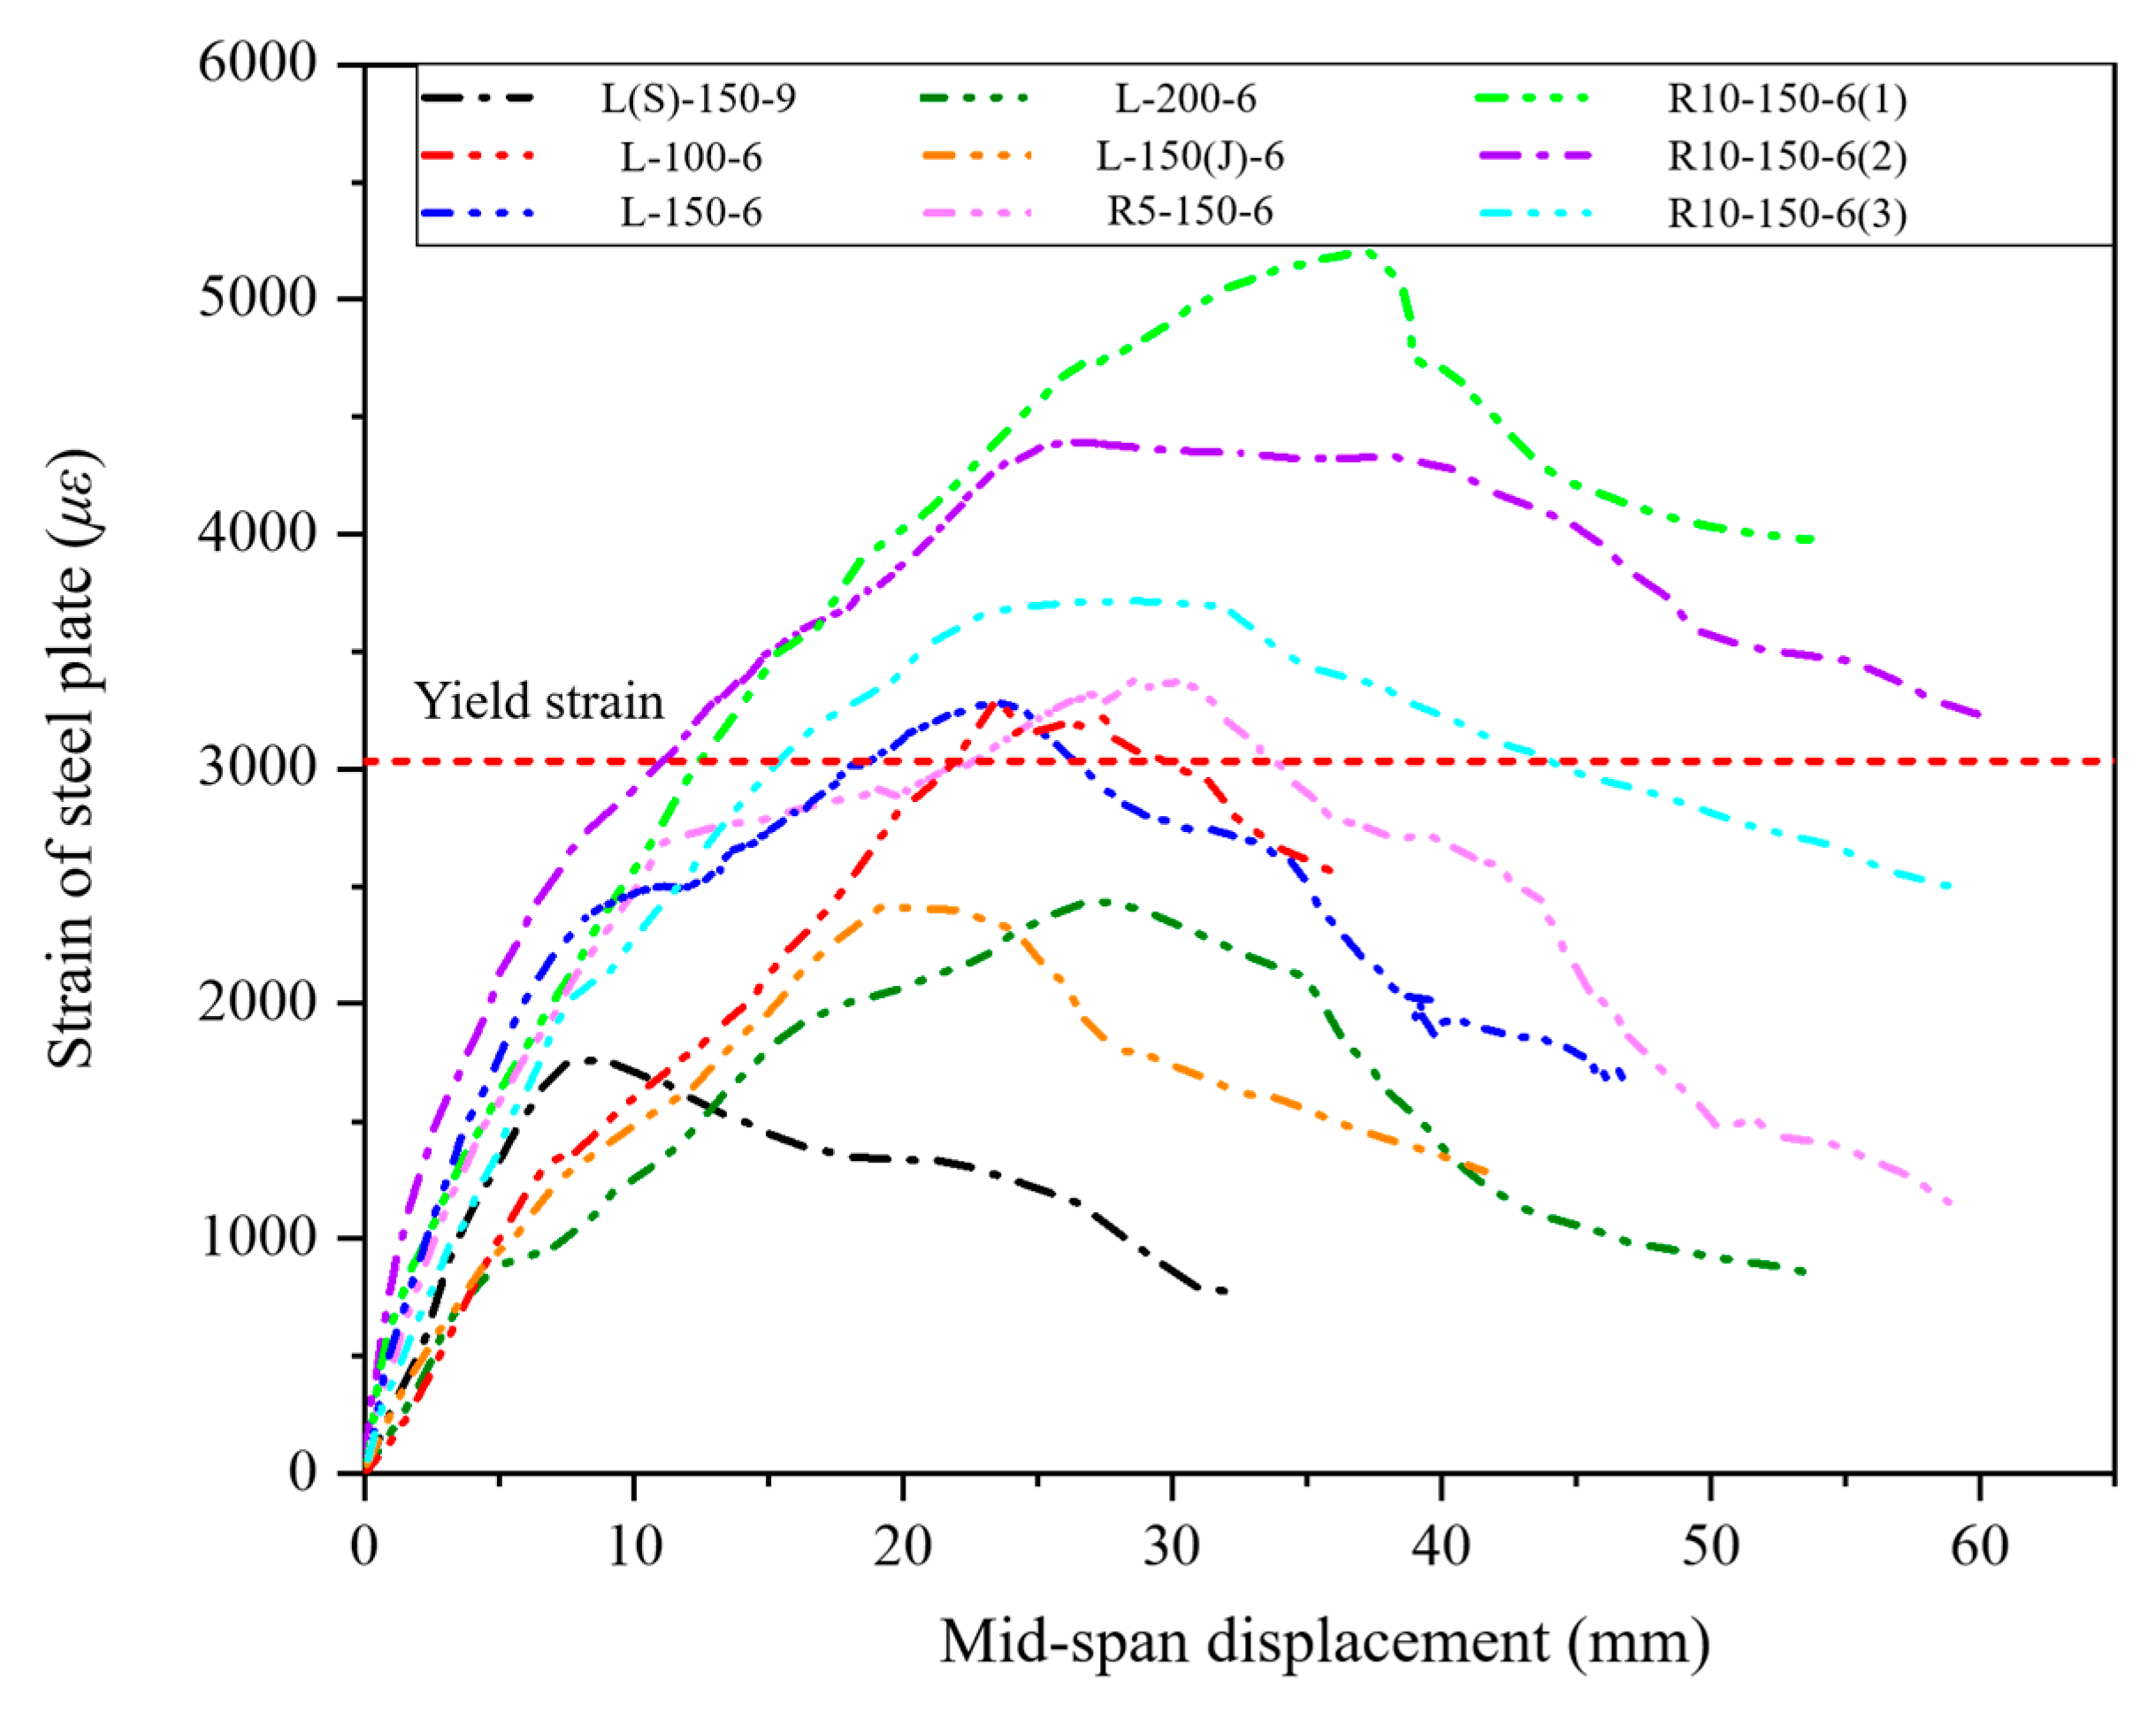
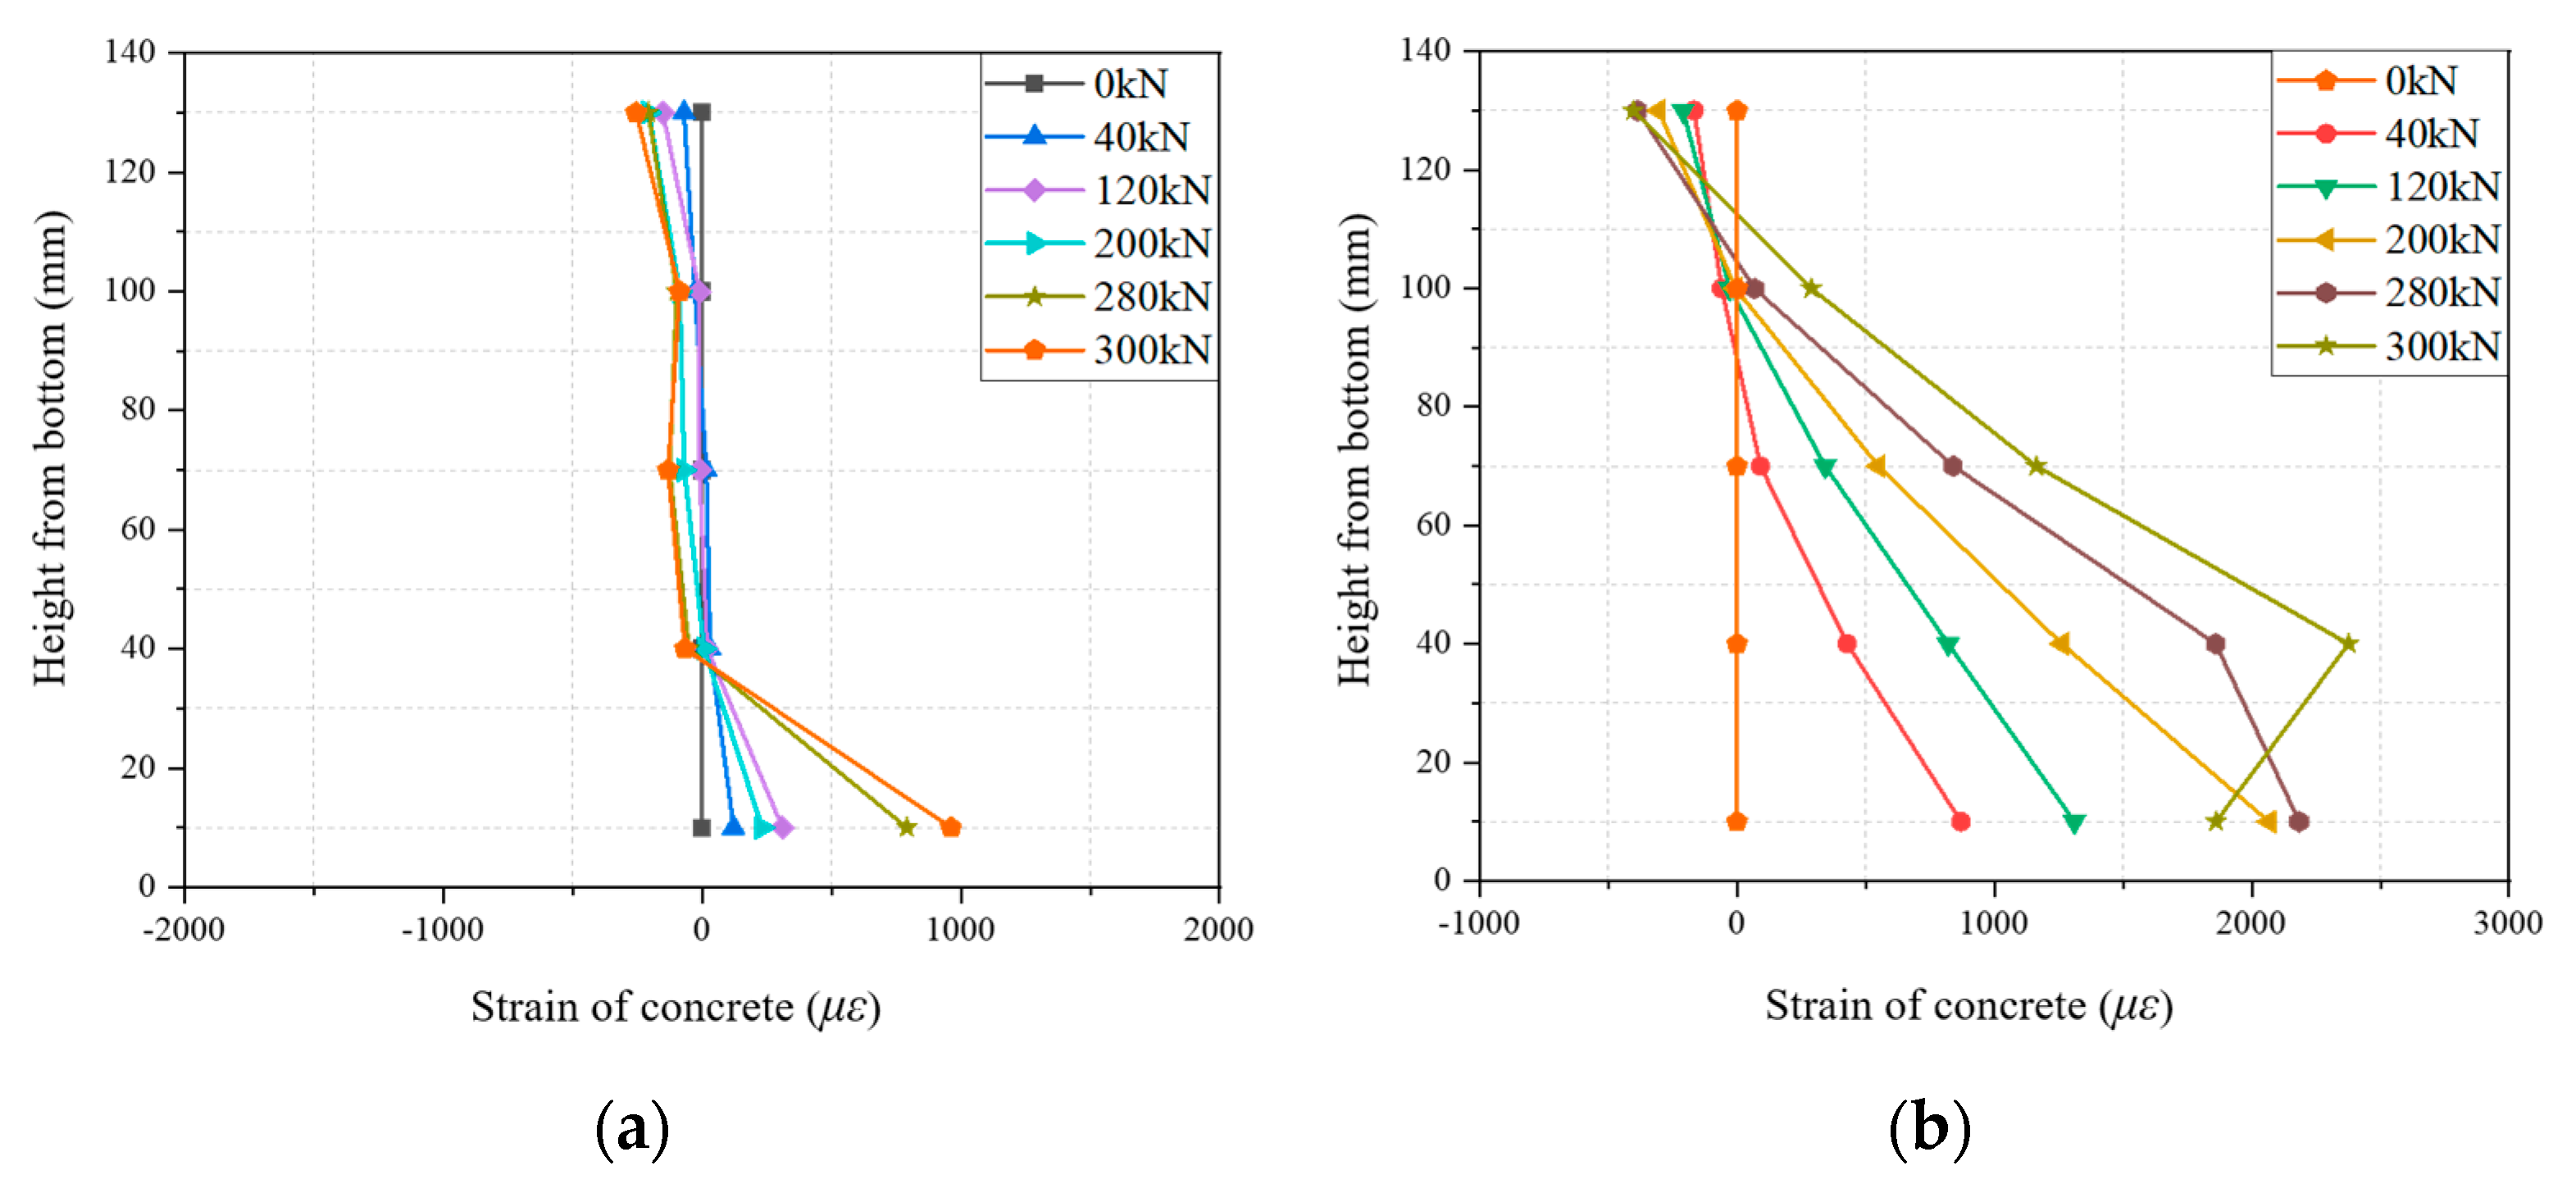
3.2.3. Strain Development
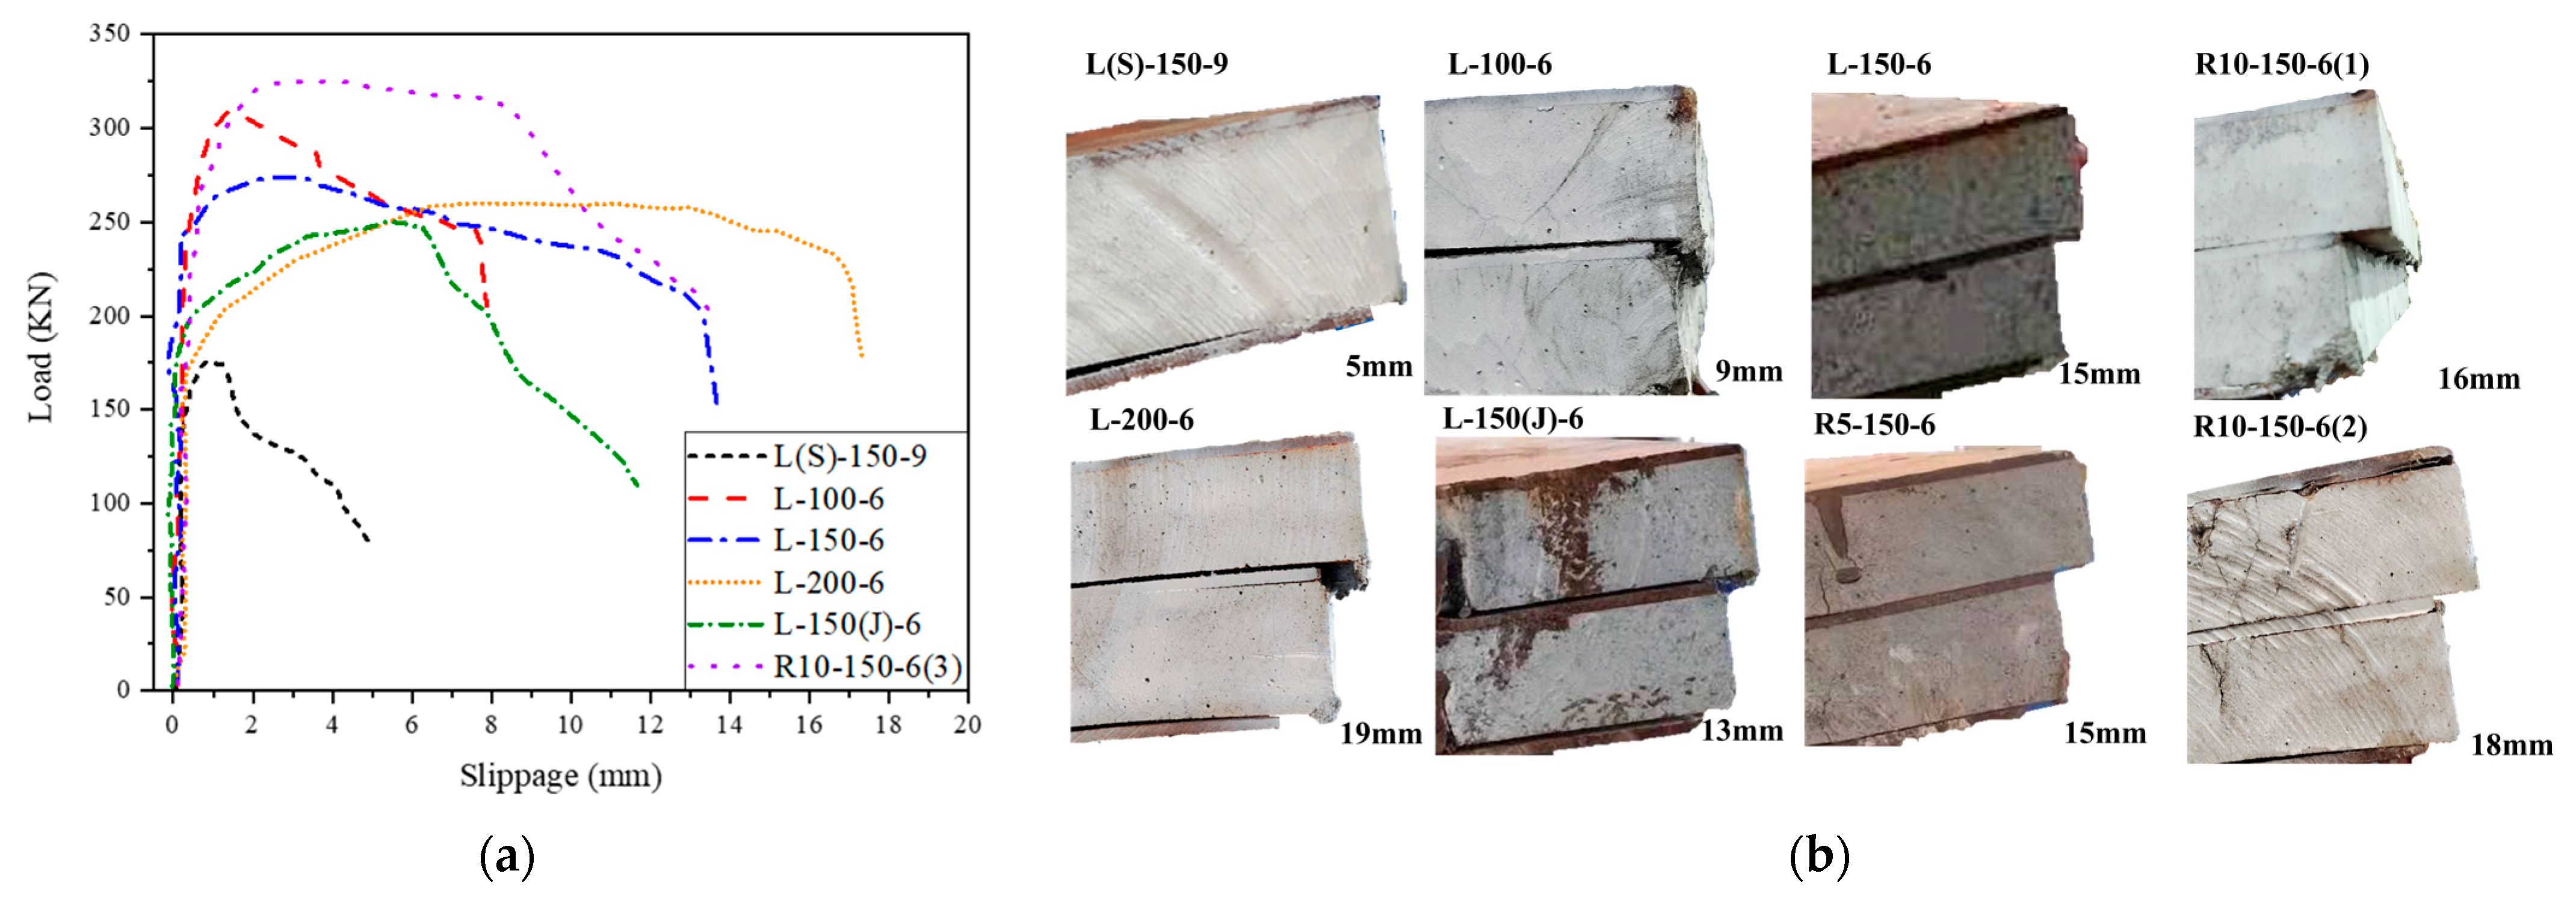
3.2.4. Load–Slip Curves
3.2.5. Parametric Analysis
- (1)
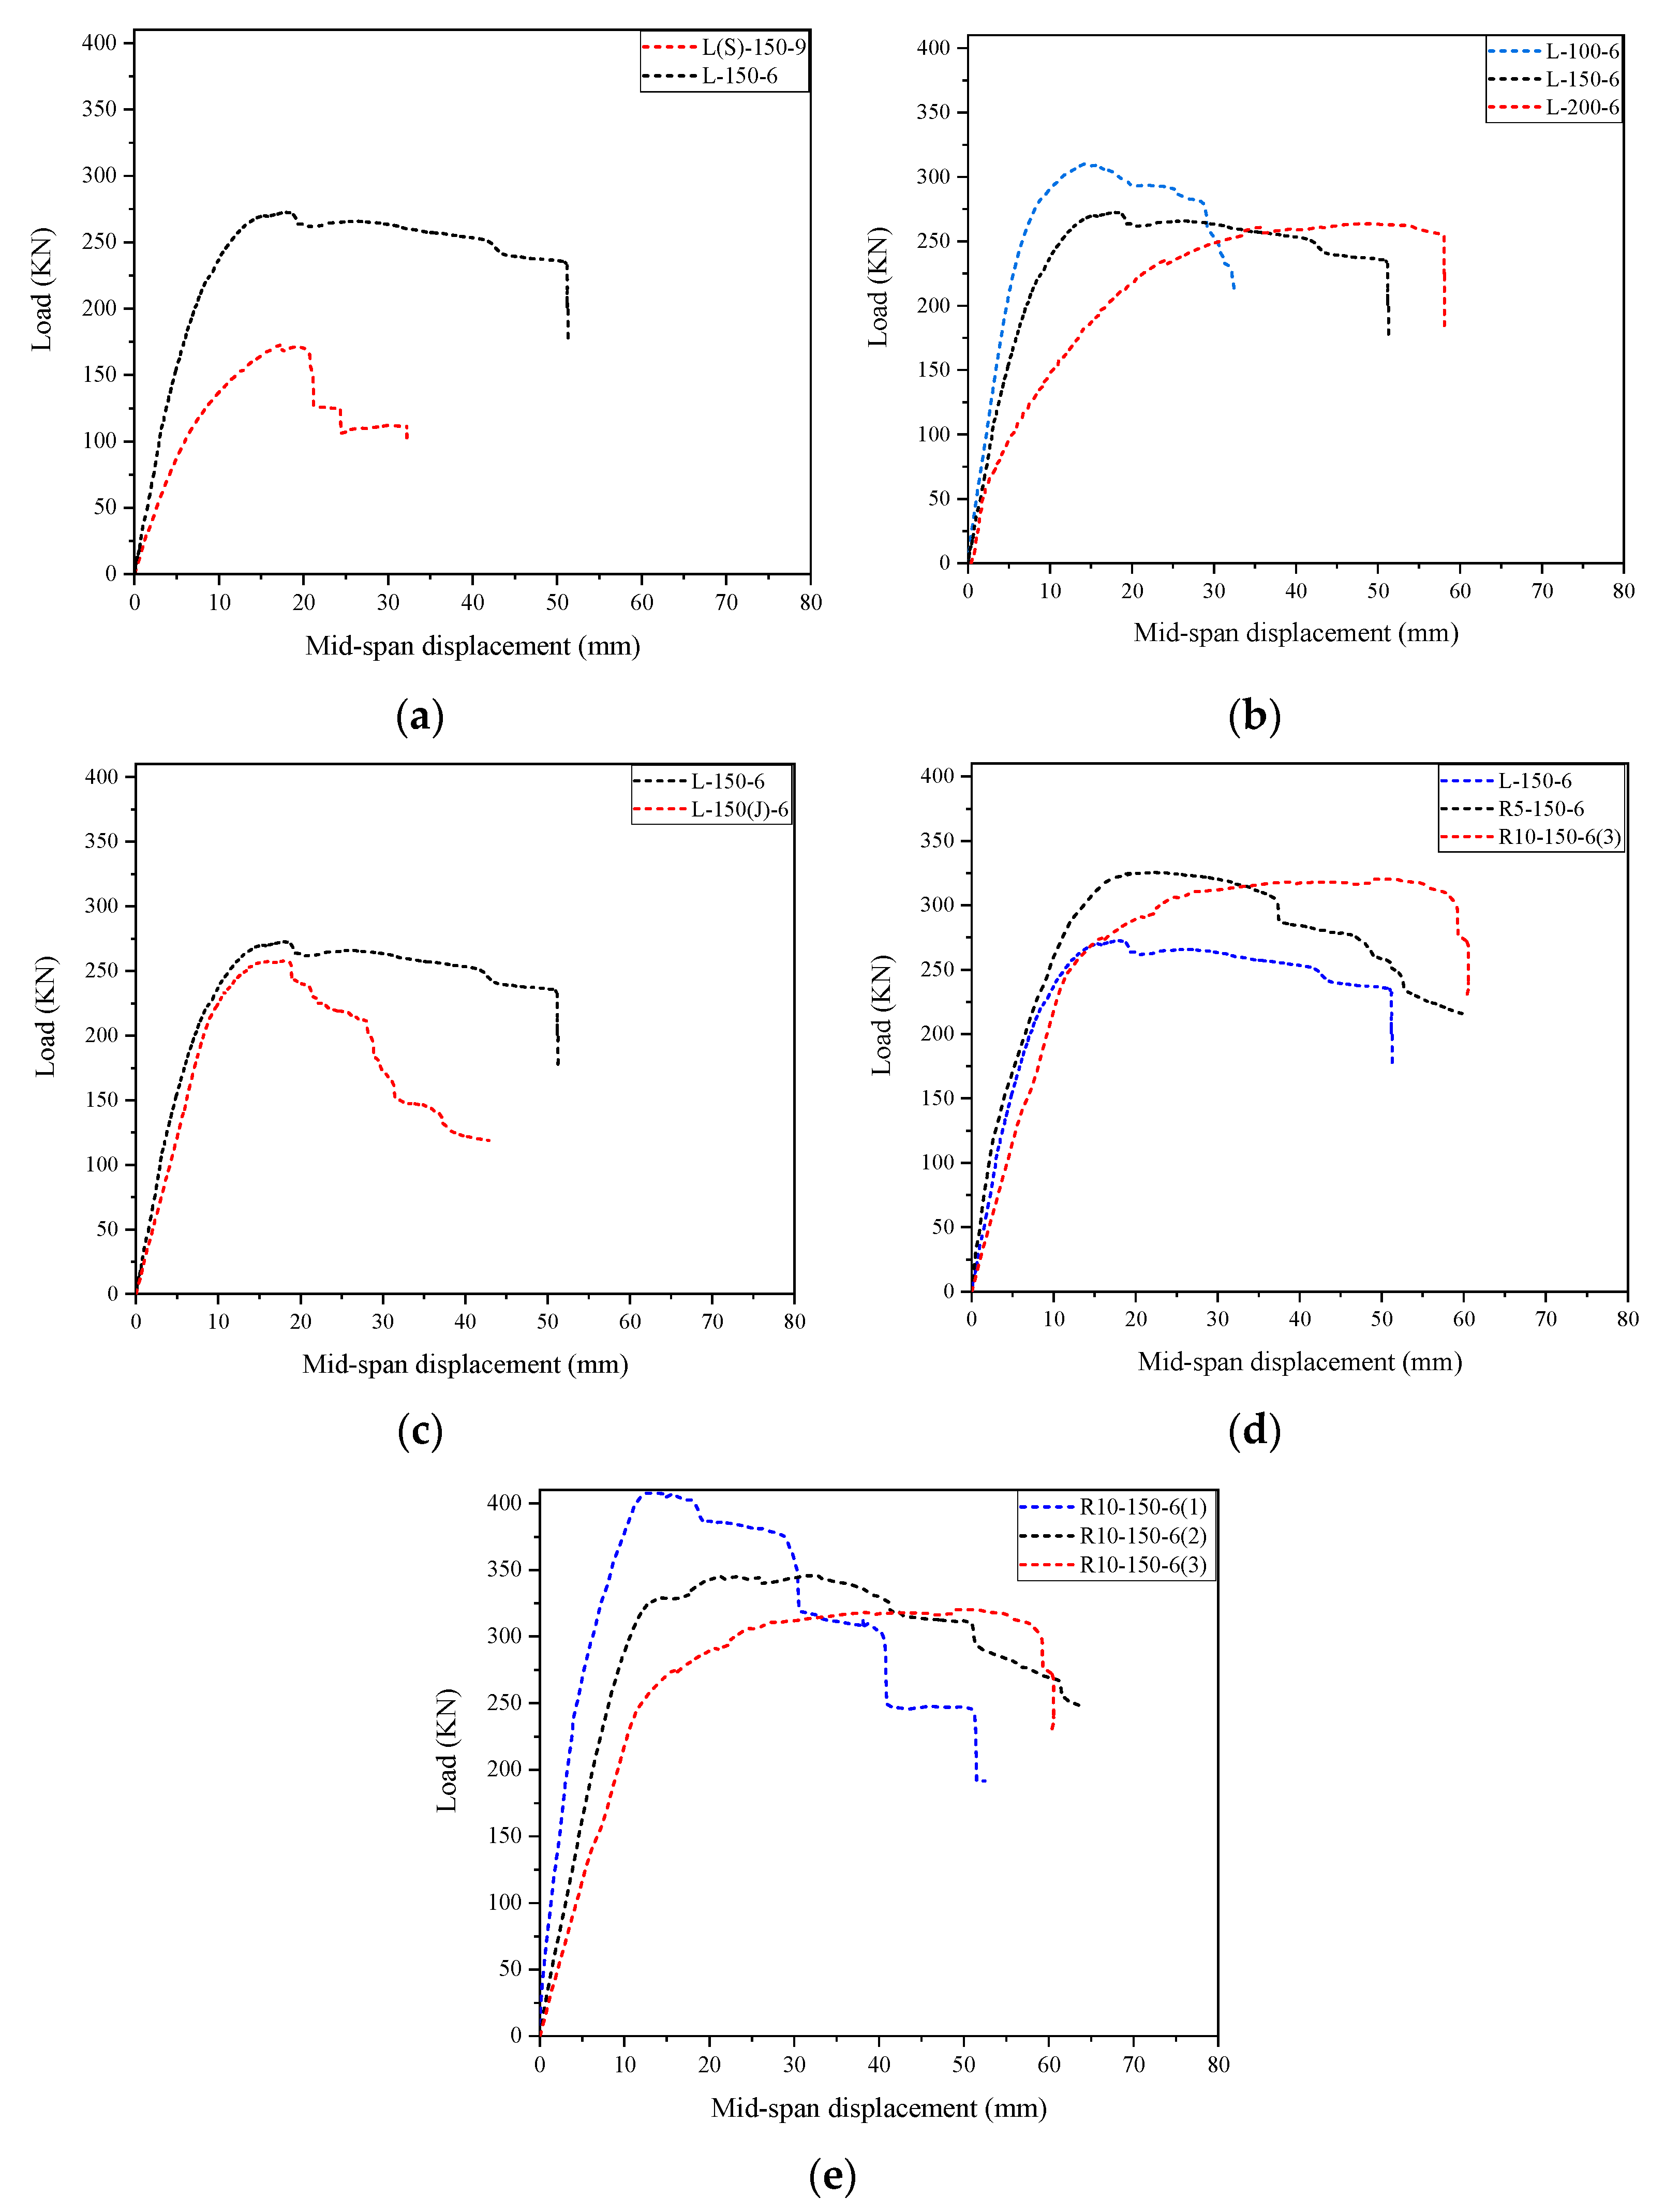
- Number of core layers: Figure 13a presents the load–displacement curves for specimens L(S)-150-9 and L-150-6. Despite having an equal steel ratio, the specimens utilize one and two layers of concrete cores, respectively. The load–displacement curves reveal that the residual resistance capacity and deformation capacity of the double-layer specimen surpass those of the single-layer specimen. In comparison to specimen L(S)-150-9, the residual resistance capacity and ultimate displacement of L-150-6 exhibit increases of 58% and 142%, respectively. The reason for this is that under the same impact load, the upper steel plate and the concrete in the impact area of the single-layer specimen are severely damaged, leading to a relatively lower residual resistance capacity. Conversely, the double-layer specimen benefits from the presence of a middle steel plate, which not only obstructs concrete crack penetration but also resists the impact load through deformation. Consequently, this configuration offers superior impact resistance and a higher residual load-carrying capacity.
- (2)
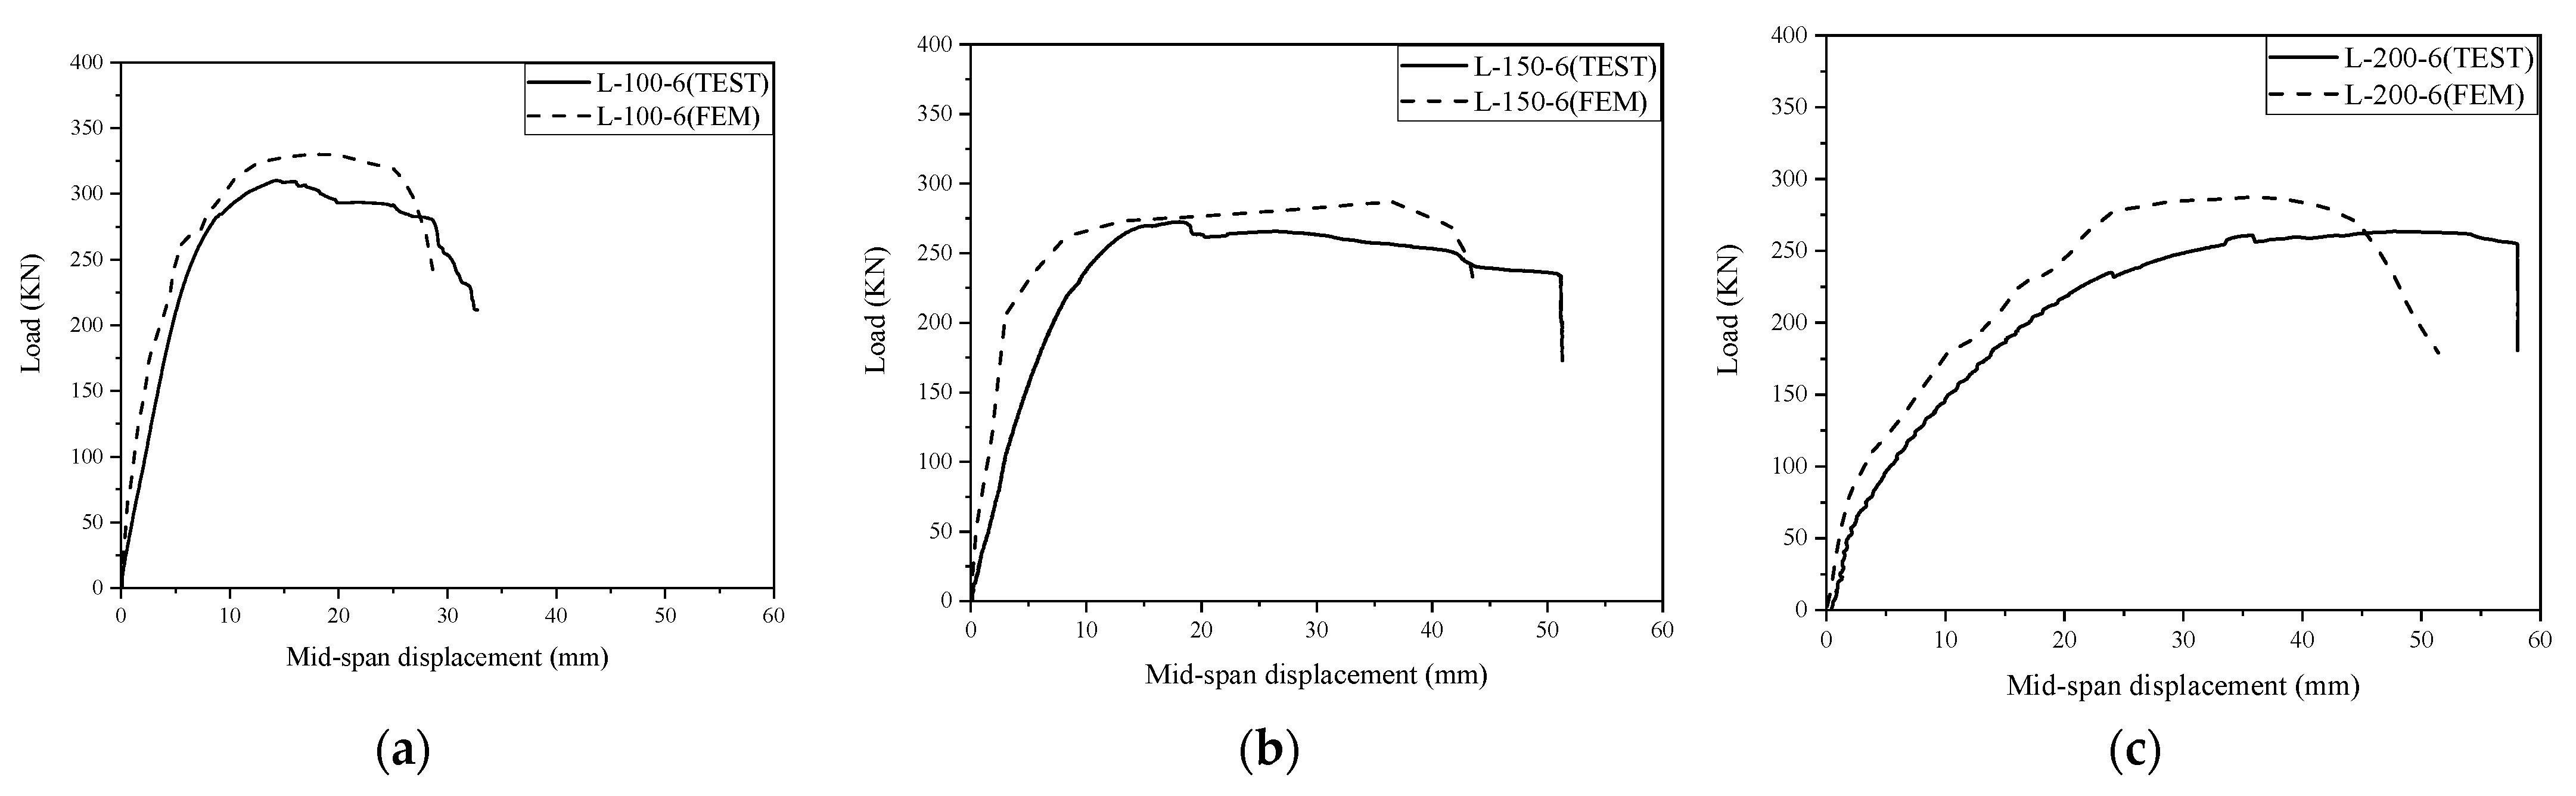
- Shear connector spacing: The load–displacement curves of the composite panels L-100-6, L-150-6, and L-200-6, featuring different connector spacing (100 mm, 150 mm, and 200 mm), are presented in Figure 13b. As the connector spacing increased, the residual load capacity of the specimens exhibited a decreasing trend. Specifically, compared to L-100-6, L-150-6 and L-200-6 experienced a reduction in residual load capacity by 13% and 16%, respectively. Moreover, the ultimate displacement of the composite panels showed an increasing pattern with the connector spacing. In comparison to L-100-6, the ultimate displacement of L-150-6 and L-200-6 increased by 80% and 107%, respectively. The increased connector spacing reduces the number of connectors per unit length, which diminishes the shear transfer capacity and weakens the bond between the concrete and steel layers in the composite panels. This leads to a decreased residual load capacity and a greater displacement.
- (3)
- Shear connector type: The SCS panel, utilizing J-hooks as shear connectors, demonstrates excellent load resistance, attributable to the interlocking of the J-hook pairs [18]. Despite these advantages, exclusive reliance on J-hooks might lead to complications during construction and installation. Consequently, the integration of J-hooks and headed studs into a hybrid connector was adopted. Figure 13c contrasts the load–displacement curves for L-150-6 with hybrid shear connectors and L-150(J)-6 with J-hooks. The residual capacities of these two panels, respectively, measure 269 kN and 257 kN. The residual load capacity of specimens utilizing J-hook shear connectors is lower than anticipated, even slightly less than that of specimens utilizing hybrid connectors. The interlocking effect of J-hook shear connectors is commonly believed to enhance the overall integrity of the composite structure and improve its impact resistance. However, experimental results reveal minimal disparity between the two cases. One potential explanation is that during conditions of low-speed impact and moderate structural deformation, J-hook shear connectors primarily provide shear resistance rather than tensile resistance, resulting in minimal discrepancy when compared to hybrid connectors. Therefore, under identical impact loads, both the SCS panel with hybrid connectors and the one with J-hooks demonstrate comparable residual performance. Hence, the SCS panel featuring hybrid shear connectors offers a viable alternative for practical engineering applications.
- (4)
- Rubber powder admixture: Figure 13d presents the load–displacement curves for specimens L-150-6, R5-150-6, and R10-150-6(3), incorporating varying rubber powder admixtures (0%, 5%, 10%) in the concrete cores. Compared to the specimen L-150-6 without rubber addition, the specimens with 5% and 10% rubber admixture exhibited an approximate 20% increase in residual load capacity. These results indicate that the incorporation of rubber powder enhances energy absorption and crack resistance in the structure, effectively mitigating damage under impact loading and resulting in improved residual load capacity. Despite the slight variation in residual load capacity between specimens containing 5% rubber content (R5-150-6) and 10% rubber content (R10-150-6(3)), there is a significant decrease in the residual stiffness of R10-150-6(3). Upon considering the comprehensive indicators of residual resistance and stiffness, it has been determined that a rubber content of 5% is the optimal proportion for engineering applications.
- (5)
- Impact times: Figure 13e illustrates the load–displacement curves of specimens R10-150-6(1), R10-150-6(2), and R10-150-6(3) subjected to different im-pact times (1, 2, 3). Multiple impacts lead to a reduction in both the residual load capacity and stiffness of the composite panels. Compared to the specimen R10-150-6(1), which was subjected to a single impact, the residual load capacity of specimens R10-150-6(2) and R10-150-6(3) experienced a decrease of 15% and 22%, respectively. It is evident that the degree of cumulative damage to the composite panel is directly proportional to the number of impacts, which correlates with a decrease in both stiffness and residual load bearing capacity.
4. Numerical Simulation
4.1. Material Constitutive Model
4.2. FE Simulation Framework
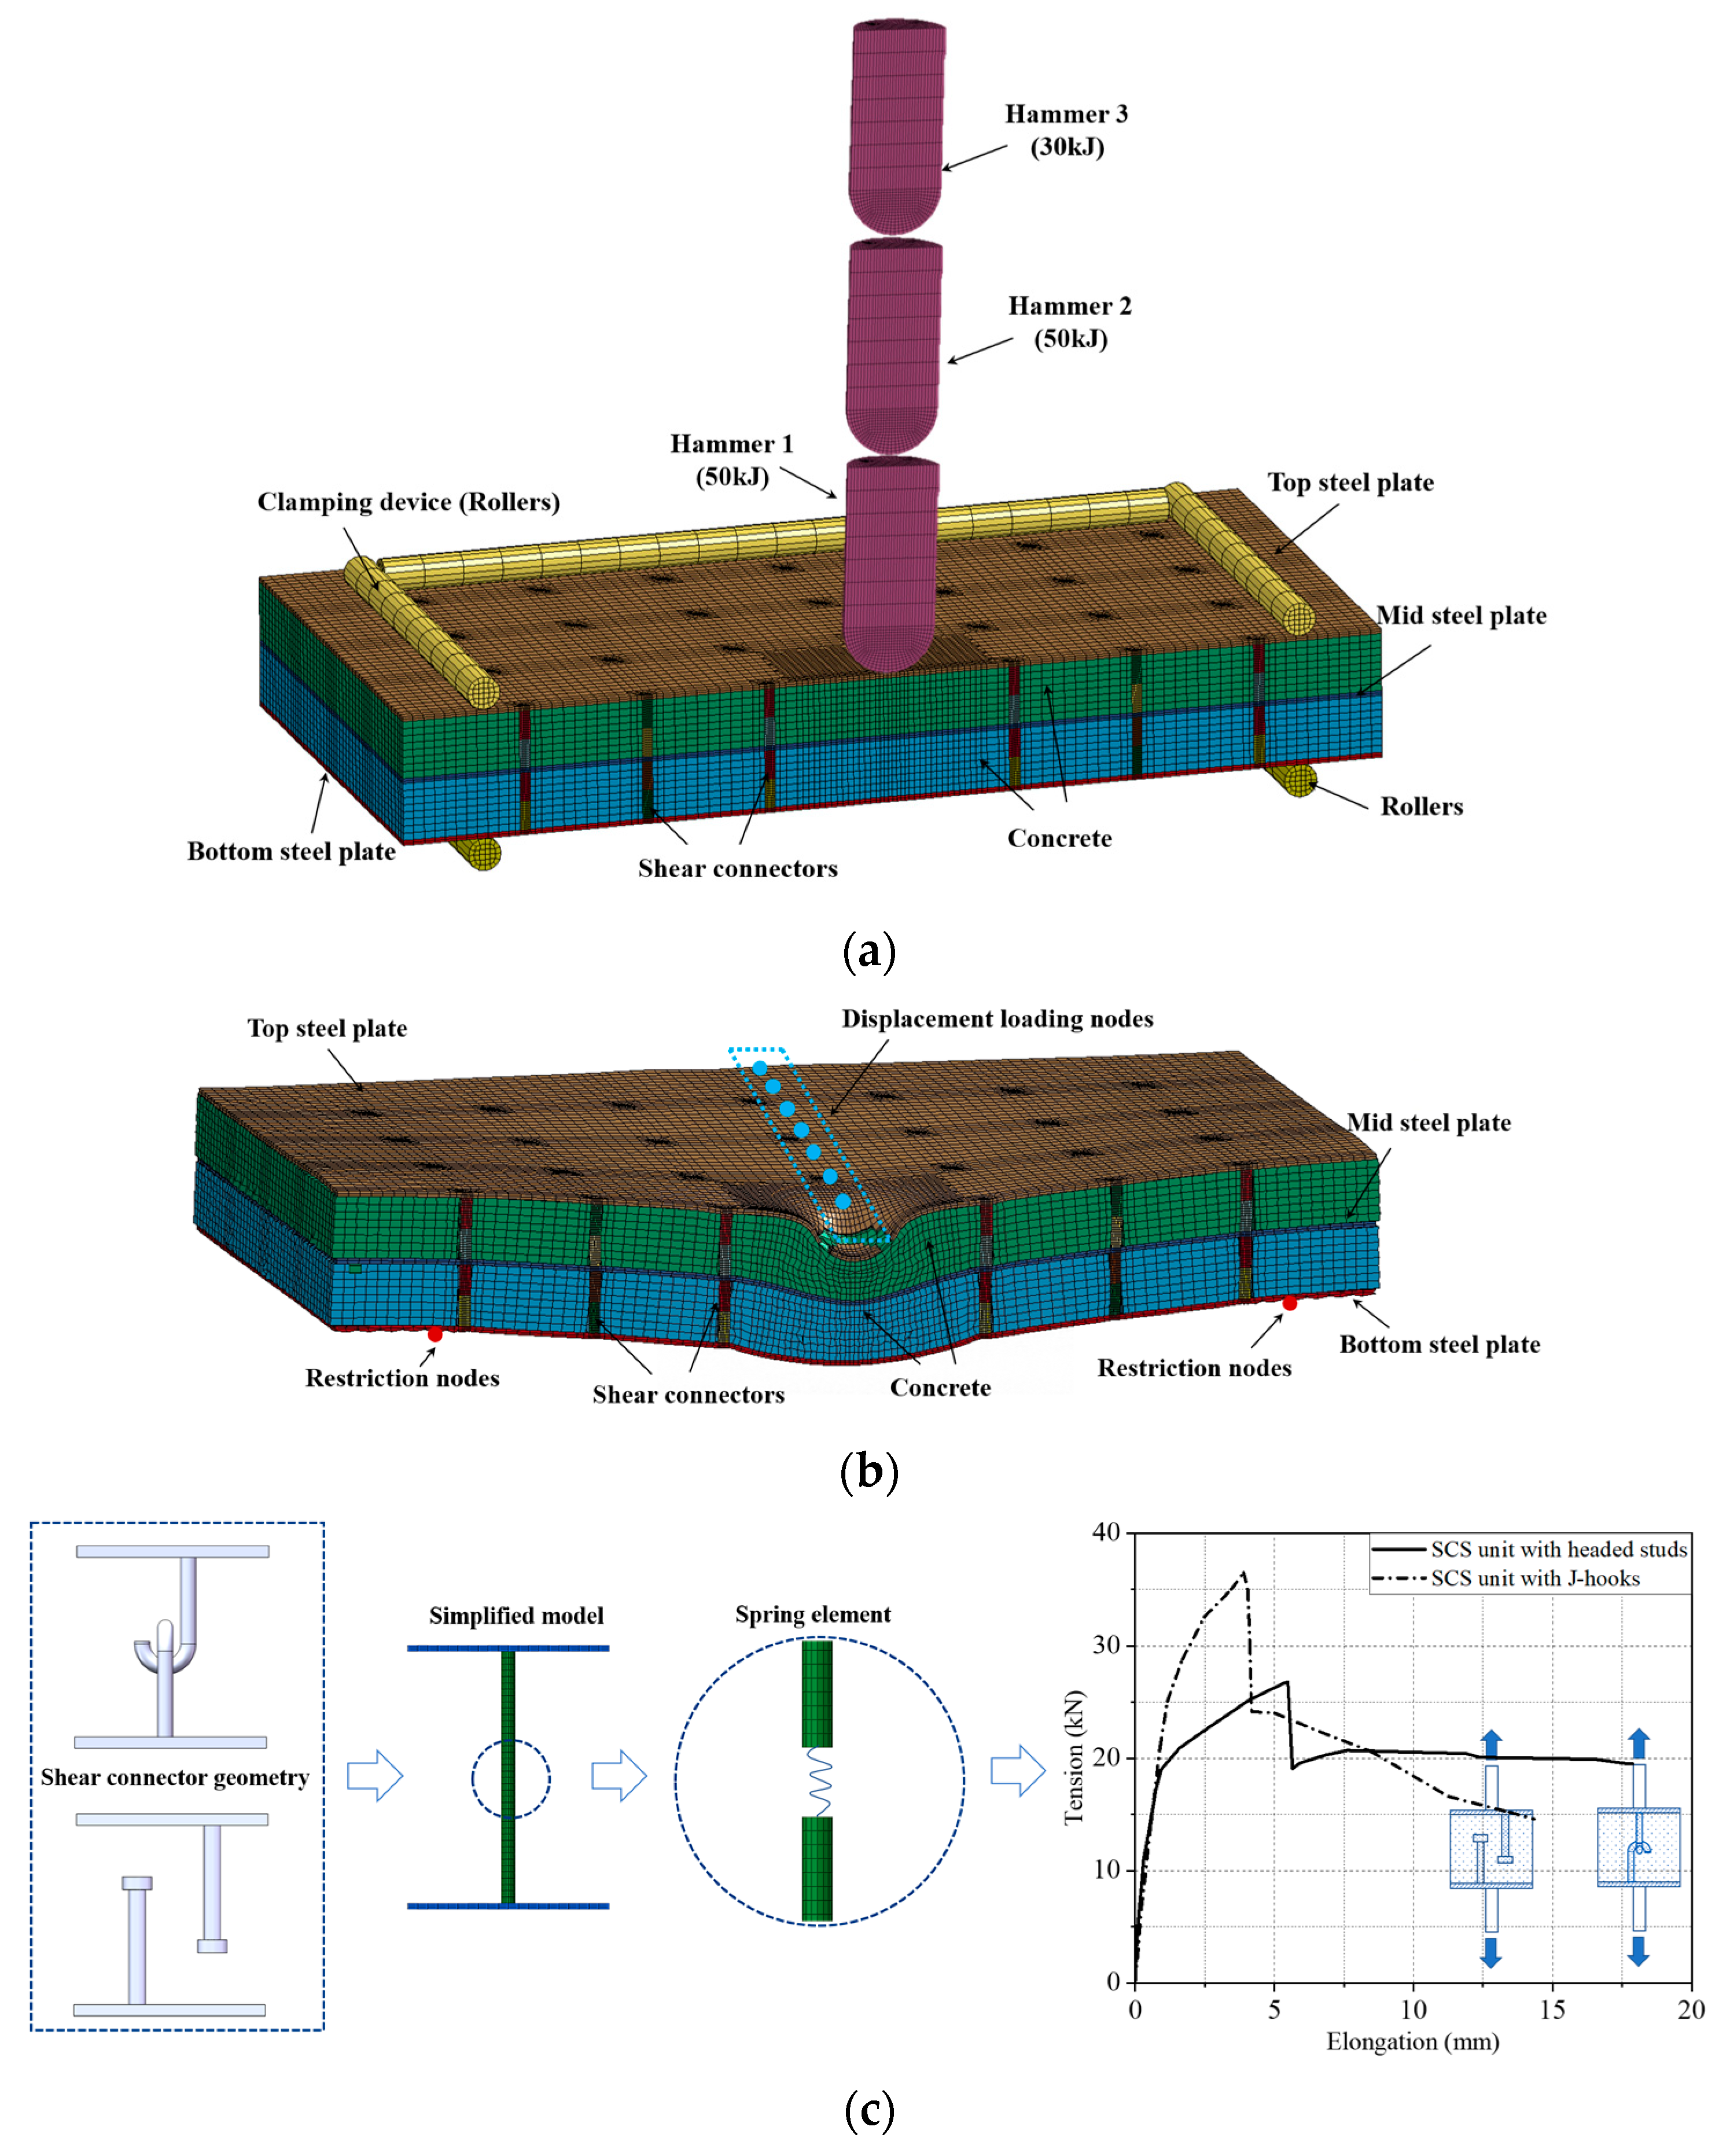
4.2.1. Multiple Impact Simulation
4.2.2. Post-Impact Static Simulation
- (1)
- Removal of redundant parts, constraints, and contacts, including the drop hammer, support rollers, and their related definitions;
- (2)
- Definition of a new static loading condition, where a downward displacement is applied to the midspan node on the upper surface using the *BOUNDARY_PRESCRIBED_MOTION_SET keyword;
- (3)
- Specification of new boundary conditions by constraining two rows of nodes at both ends of the specimen with the *BOUNDARY_SPC_SET keyword;
- (4)
- Addition of a new output variable to record the magnitude of the applied load using the *DATABASE_NODAL_FORCE_GROUP keyword;
- (5)
- Inheritance of the field output results from the impact simulation through the *STRESS_INITIALIZATION keyword;
- (6)
- Exclusion of the material strain rate effect by setting IRATE = 0 in the concrete constitutive model and SRC = CRP = 0 in the steel constitutive model. The modified model is illustrated in Figure 14b, and the revised K file and restart file (d3dump file) need to be resubmitted for calculation.
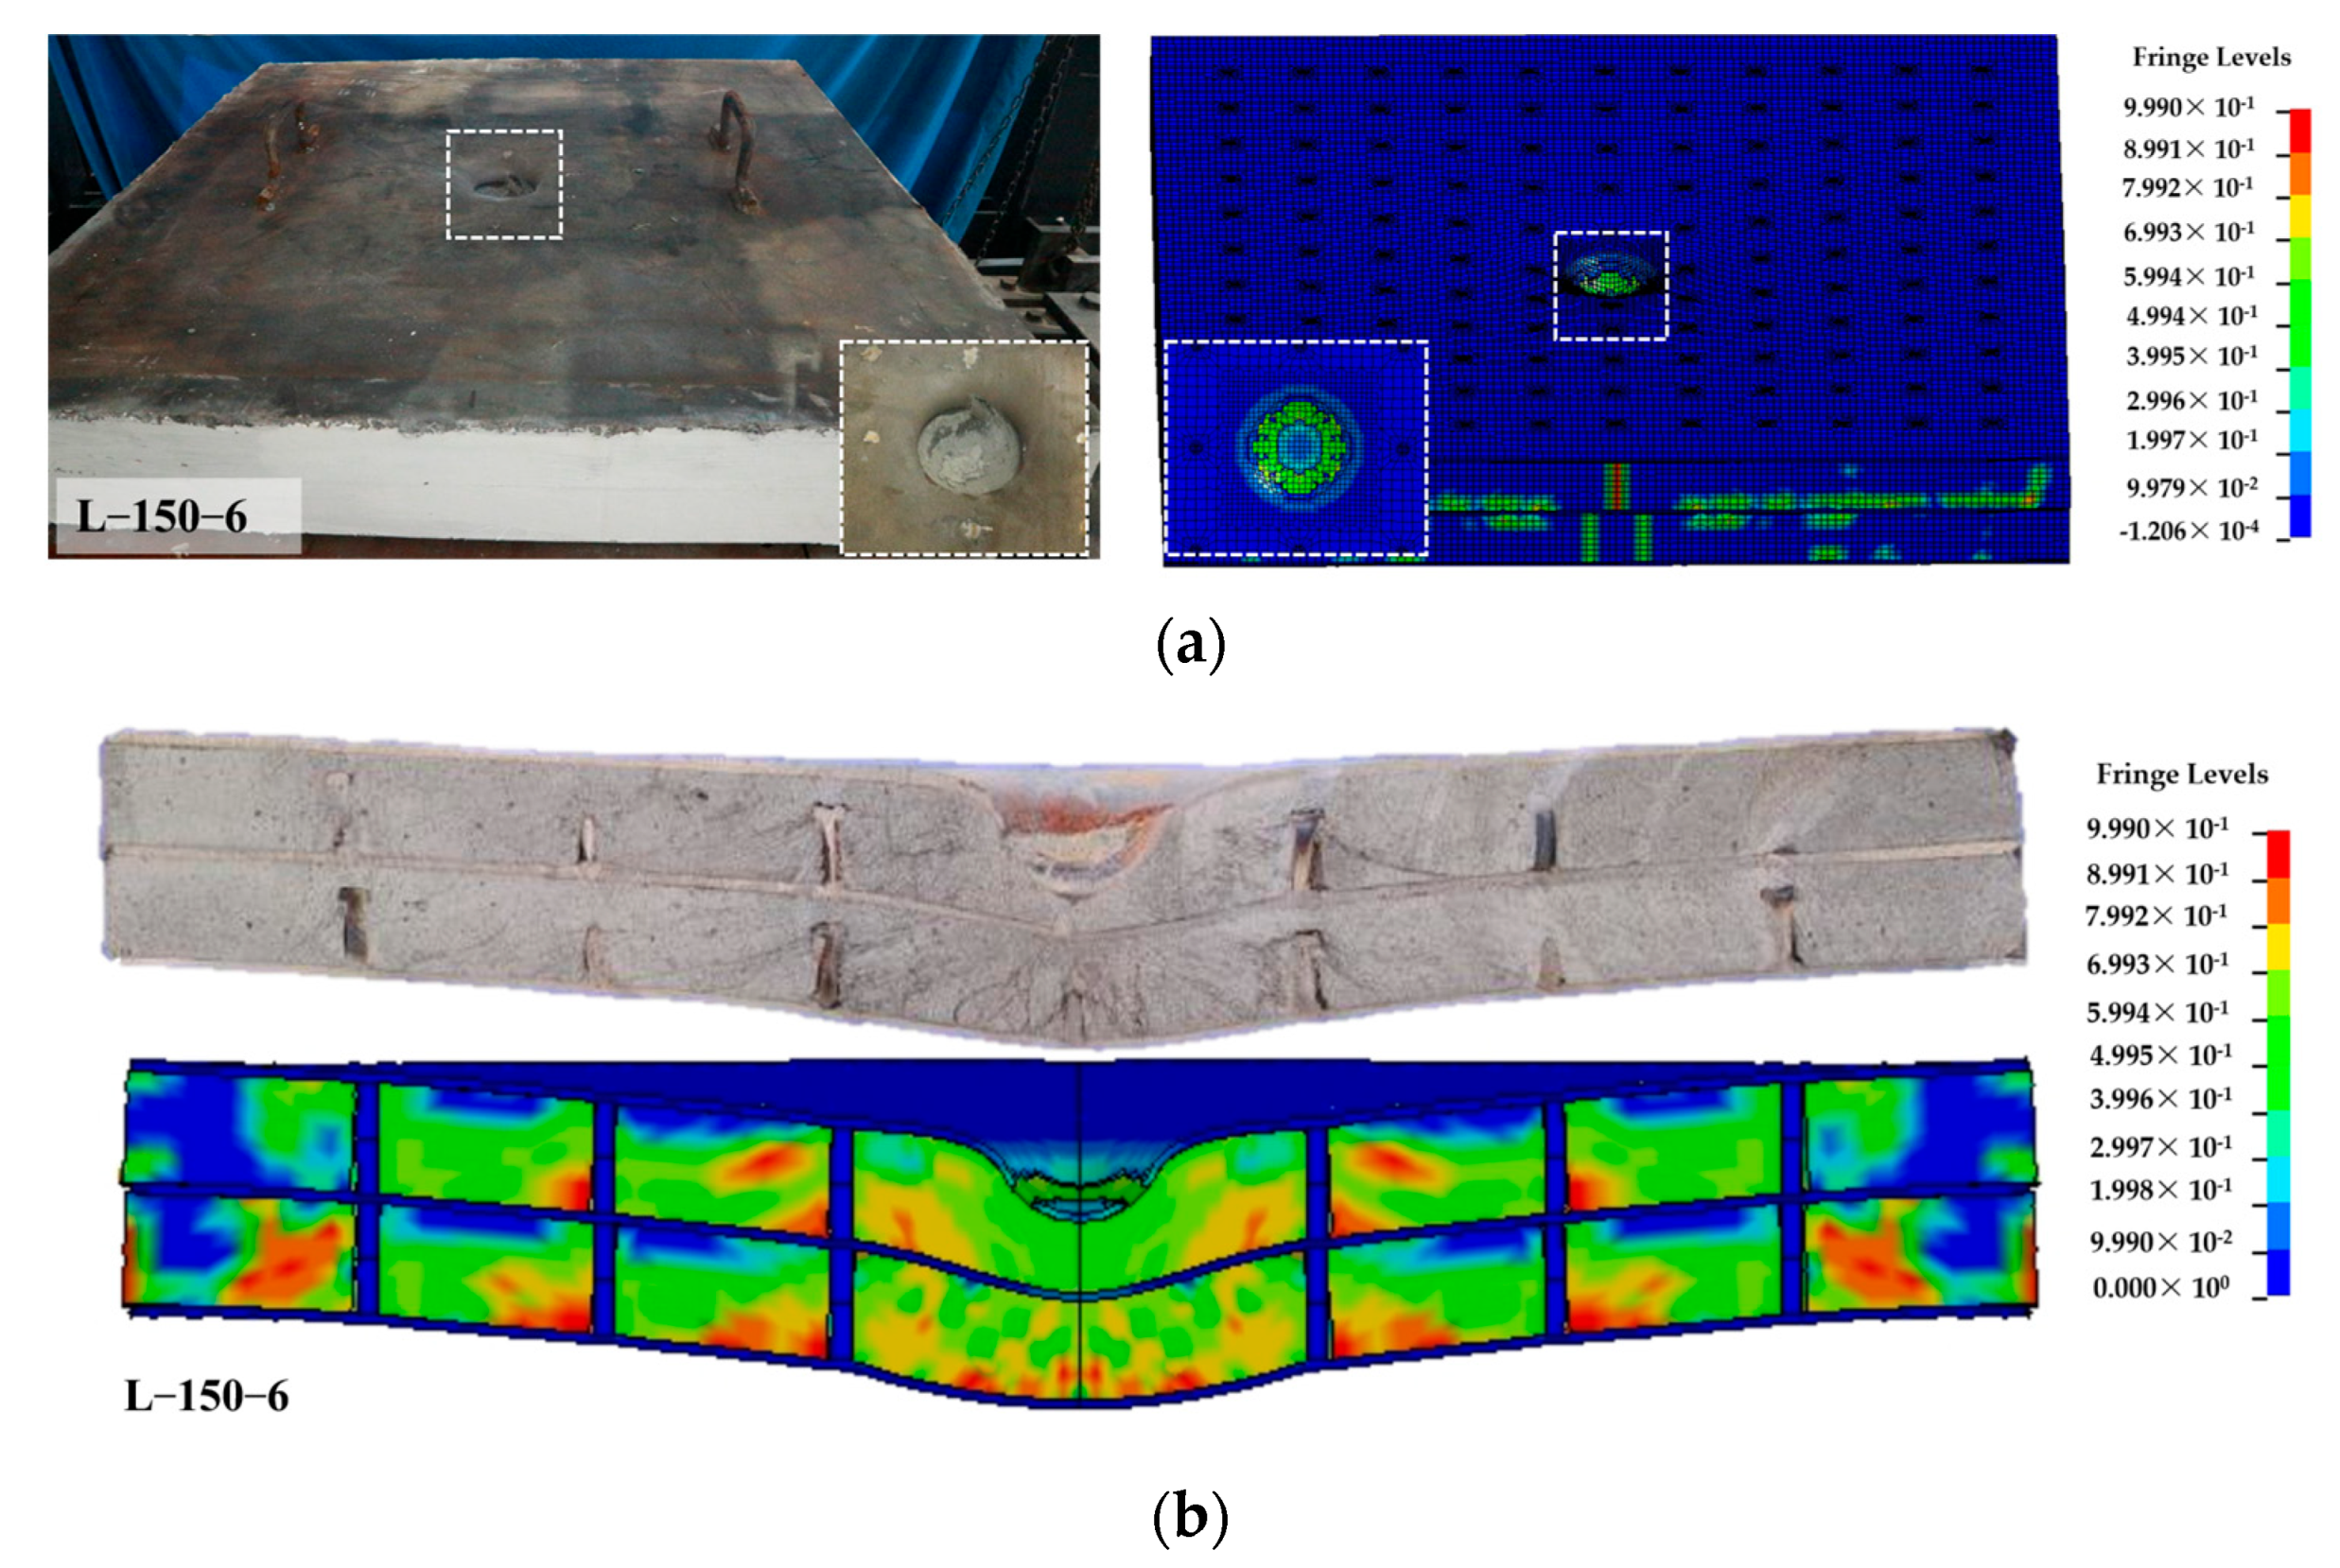
4.3. Numerical Result Discussion
5. Conclusions
- (1)
- The impacted composite panels exhibited flexural failure accompanied by bond- slip as the primary failure mode. The load–displacement curve of the composite panel can be divided into three stages: crack development, slip, and unloading stages. The strain development of the concrete and bottom steel plate was influenced after the composite panel suffered impact damage. The strain development of the concrete deviates increasingly from the plane section assumption as the section approaches the impact-damaged area.
- (2)
- Double-layer specimens demonstrate significantly superior residual performance compared to single-layer specimens under identical steel ratio. The incorporation of rubber powder in the concrete enhances the residual performance of the composite panel, with an optimal volume mixing ratio of 5%. The impact of connector type on residual performance is negligible. Increasing the connector spacing can enhance the residual resistance but decrease the ductility of the composite panel.
- (3)
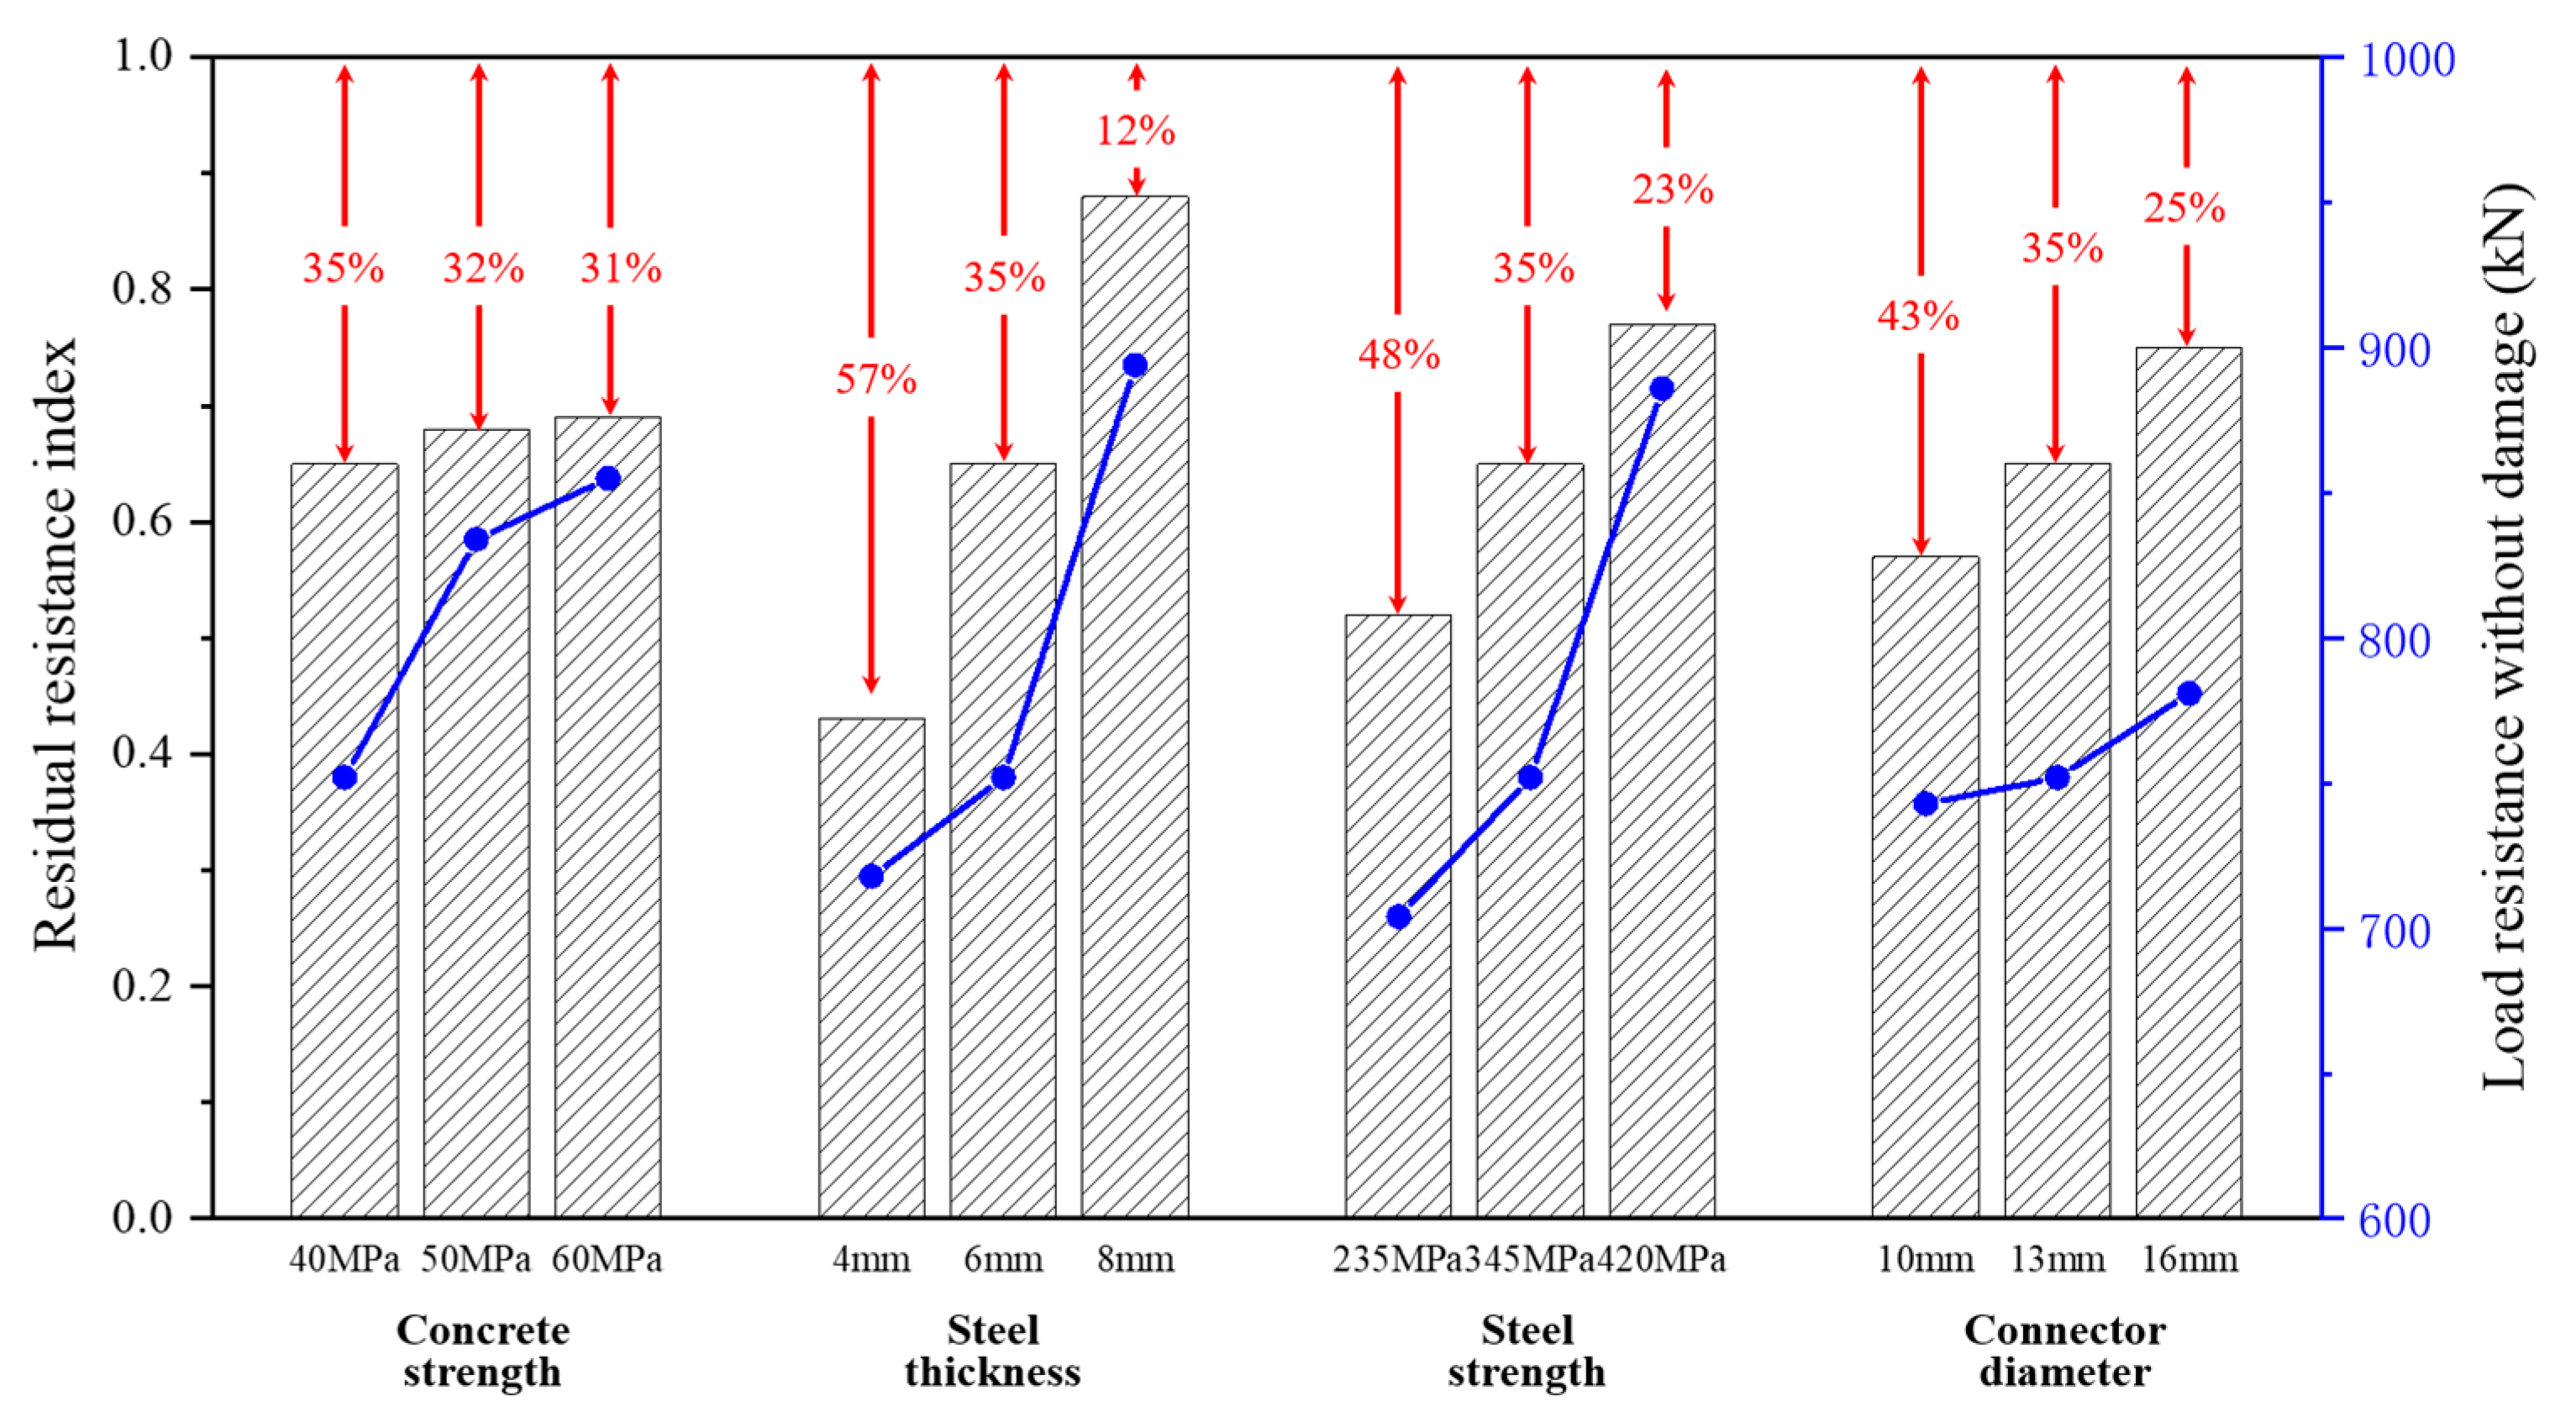
- The extended parameter analysis of the well-calibrated FE model revealed that the thickness and strength of the steel plate exert a substantial influence on the residual performance of the composite panel, whereas the strength of the concrete has a negligible effect. Furthermore, the diameter of the shear connector insignificantly affects the static resistance of the composite panel, but it significantly enhances the residual resistance following impact.
- (4)
- The current study mainly focused on the variations in the material and geometric parameters of composite panels. In fact, impact parameters, such as impact energy, impact velocity, and impact location, also play a crucial role in residual performance. Additionally, it is essential to propose theoretical models that can be used for damage assessment. Therefore, future research in this area is urgently needed.
Author Contributions
Funding
Data Availability Statement
Conflicts of Interest
References
- Nie, J.G.; Ma, X.W.; Tao, M.X.; Fan, J.S.; Bu, F.M. Effective stiffness of composite shear wall with double plates and filled concrete. J. Constr. Steel Res. 2014, 99, 140–148. [Google Scholar] [CrossRef]
- Varma, A.H.; Malushte, S.R.; Sener, K.C.; Lai, Z.C. Steel-plate composite (SC) walls for safety related nuclear facilities: Design for in-plane forces and out-of-plane moments. Nucl. Eng. Des. 2014, 269, 240–249. [Google Scholar] [CrossRef]
- Liew, J.Y.R.; Sohel, K.M.A.; Koh, C.G. Impact tests on steel–concrete–steel sandwich beams with lightweight concrete core. Eng. Struct. 2009, 31, 2045–2059. [Google Scholar] [CrossRef]
- Xu, K.Y.; Xu, D.; Wang, X.T.; Wang, T.; Yan, J.C.; Yan, J.B. Seismic behaviors of steel truss-embedded steel-concrete composite shear walls. J. Build. Eng. 2022, 49, 104112. [Google Scholar] [CrossRef]
- Wang, Y.; Sah, T.P.; Liu, S.; Zhai, X. Experimental and numerical studies on novel stiffener-enhanced steel-concrete-steel sandwich panels subjected to impact loading. J. Struct. Eng. 2022, 45, 103479. [Google Scholar] [CrossRef]
- Remennikov, A.M.; Kong, S.Y.; Uy, B. The response of axially restrained non-composite steel–concrete–steel sandwich panels due to large impact loading. Eng. Struct. 2013, 49, 806–818. [Google Scholar] [CrossRef]
- Yan, J.B.; Liu, Q.F. Behavior of novel steel-concrete-steel sandwich walls under low-velocity impact loading. Thin Wall Struct. 2023, 193, 111219. [Google Scholar] [CrossRef]
- Wang, Y.; Zhou, Z.; Zhai, X.; Zhou, H.; Zhao, P. Impact responses of steel–concrete–steel sandwich panels with interlocked angle connectors: Experimental and numerical studies. Thin Wall Struct. 2023, 188, 110832. [Google Scholar] [CrossRef]
- Wang, Z.F.; Yan, J.C.; Lin, Y.Z.; Fan, F.; Sun, M.H. Experimental and analytical study on the double steel plates-UHPC sandwich slabs under low-velocity impact. Thin Wall Struct. 2023, 184, 110548. [Google Scholar] [CrossRef]
- Zhang, W.; Huang, Z.Y.; Li, R.; Zhao, X.; Ye, J. Impact response of double-layer Steel-RULCC-Steel sandwich panels: Experimental, numerical and analytical approaches. J. Struct. Eng. 2022, 148, 04022165. [Google Scholar] [CrossRef]
- Adhikary, S.D.; Li, B.; Fujikake, K. Residual resistance of impact-damaged reinforced concrete beams. Mag. Concr. Res. 2015, 67, 364–378. [Google Scholar] [CrossRef]
- Fan, W.; Liu, B.; Consolazio, G.R. Residual capacity of axially loaded circular RC columns after lateral low-velocity impact. J. Struct. Eng. 2019, 145, 04019039. [Google Scholar] [CrossRef]
- Dok, G.; Caglar, N.; Ilki, A.; Yilmaz, C. Effect of impact loading on residual flexural capacity of high-strength reinforced concrete beams. Structures 2020, 27, 2466–2480. [Google Scholar] [CrossRef]
- Zhao, W.Y.; Guo, Q.Q. Experimental study on impact and post-impact behavior of steel-concrete composite panels. Thin Wall Struct. 2018, 130, 405–413. [Google Scholar] [CrossRef]
- Gao, S.; Xu, Y.C.; Zhang, S.M.; Derlatka, A. Performance of square concrete-filled steel tubular columns under repeated lateral impact. Eng. Struct. 2023, 280, 115719. [Google Scholar] [CrossRef]
- Li, M.H.; Xia, M.T.; Zong, Z.H.; Wu, G.; Zhang, X.H. Residual axial capacity of concrete-filled double-skin steel tube columns under close-in blast loading. J. Constr. Steel Res. 2023, 201, 107697. [Google Scholar] [CrossRef]
- Huang, Z.Y.; Sui, L.; Wang, F.; Du, S.L.; Zhou, Y.W.; Ye, J.Q. Dynamic compressive behavior of a novel ultra-lightweight cement composite incorporated with rubber powder. Compos. Struct. 2020, 244, 112300. [Google Scholar] [CrossRef]
- Huang, Z.Y.; Zhao, X.L.; Zhang, W.; Fu, Z.X.; Zhou, Y.W.; Sui, L.L. Load transfer mechanism of novel double-layer steel-LHDCC-steel sandwich panels under punching loads. Eng. Struct. 2021, 226, 111427. [Google Scholar] [CrossRef]
- GB/T 50081; Standard for Test Methods of Concrete Physical and Mechanical Properties. China Architecture & Building Press: Beijing, China, 2019.
- Japan Society of Civil Engineers. Recommendations for Design and Construction of High-Performance Fiber Reinforced Cement Composites with Multiple Fine Cracks; Japan Society of Civil Engineers: Tokyo, Japan, 2008. [Google Scholar]
- GB/T 228.1-2010; Metallic Materials-Tensile Testing-Part 1: Method of Test at Room Temperature. China Standard Press: Beijing, China, 2010.
- Huang, Z.Y.; Zhang, W.; Li, R. Impact resistance of double-layer Steel-RULHDCC sandwich panels subjected to repeated impact loads. J. Build. Eng. 2023, 8, 80–92. (In Chinese) [Google Scholar]
- US Deptartmant of the Army. Technical Manual 5-1300: Structures to Resist the Effects of Accidental Explosions; US Deptartmant of the Army: Washington, DC, USA, 1990. [Google Scholar]
- Yin, X.; Li, Q.; Xu, X.; Chen, B.; Guo, K.; Xu, S. Investigation of continuous surface cap model (CSCM) for numerical simulation of strain-hardening fibre-reinforced cementitious composites against low-velocity impacts. Compos. Struct. 2023, 304, 116424. [Google Scholar] [CrossRef]
- Zhao, W.Y.; Guo, Q.Q.; Dou, X.; Zhou, Y.; Ye, Y. Impact response of steel concrete composite panels: Experiments and FE analyses. Steel Compos Struct. 2018, 26, 255–263. [Google Scholar]
- Murray, Y.D.; Abu-Odeh, A.; Bligh, R. Evaluation of LS-DYNA Concrete Material Model 159; Federal Highway Administration: McLean, VA, USA, 2007.
- Jiang, H.; Zhao, J. Calibration of the continuous surface cap model for concrete. Finite Elem. Anal. Des. 2015, 97, 1–19. [Google Scholar] [CrossRef]
- Xu, S.C.; Wu, P.T.; Liu, Z.X.; Wu, C.Q. Calibration of CSCM model for numerical modeling of UHPCFTWST columns against monotonic lateral loading. Eng. Struct. 2021, 240, 112396. [Google Scholar] [CrossRef]
- Simo, J.C.; Kennedy, J.G.; Govindjee, S. Non-smooth multisurface plasticity and viscoplasticity. Loading/unloading conditions and numerical algorithms. Int. J. Numer. Methods Eng. 1988, 26, 2161–2185. [Google Scholar] [CrossRef]
- Guo, W.; Fan, W.; Shao, X.; Shen, D.; Chen, B. Constitutive model of ultra-high-performance fiber-reinforced concrete for low-velocity impact simulations. Compos. Struct. 2018, 185, 307–326. [Google Scholar] [CrossRef]
- Othman, H.; Marzouk, H. Finite-element analysis of reinforced concrete plates subjected to repeated impact loads. J. Struct. Eng. 2017, 143, 04017120. [Google Scholar] [CrossRef]
- GB 55004; General Code for Composite Structures. China Architecture & Building Press: Beijing, China, 2021.

| Specimen | Core Material | Core Layer | hc (mm) | ts (mm) | S (mm) | J-Hook | Headed Stud | ρ (%) | η | Impact Times |
|---|---|---|---|---|---|---|---|---|---|---|
| L(S)-150-9 | LHDCC | 1 | 141 | 9.2 | 150 | ϕ12@300 | ϕ13@300 | 11.5 | 0.43 | 3 |
| L-100-6 | LHDCC | 2 | 70 × 2 | 5.8 | 100 | ϕ12@200 | ϕ13@200 | 11.1 | 1.00 | 3 |
| L-150-6 | LHDCC | 2 | 70 × 2 | 5.8 | 150 | ϕ12@300 | ϕ13@300 | 11.1 | 0.64 | 3 |
| L-200-6 | LHDCC | 2 | 70 × 2 | 5.8 | 200 | ϕ12@400 | ϕ13@400 | 11.1 | 0.37 | 3 |
| L-150(J)-6 | LHDCC | 2 | 70 × 2 | 5.8 | 150 | ϕ12@150 | - | 11.1 | 0.64 | 3 |
| R5-150-6 | RLHDC (5%) | 2 | 70 × 2 | 5.8 | 150 | ϕ12@300 | ϕ13@300 | 11.1 | 0.64 | 3 |
| R10-150-6(1) | RLHDC (10%) | 2 | 70 × 2 | 5.8 | 150 | ϕ12@300 | ϕ13@300 | 11.1 | 0.64 | 1 |
| R10-150-6(2) | RLHDC (10%) | 2 | 70 × 2 | 5.8 | 150 | ϕ12@300 | ϕ13@300 | 11.1 | 0.64 | 2 |
| R10-150-6(3) | RLHDC (10%) | 2 | 70 × 2 | 5.8 | 150 | ϕ12@300 | ϕ13@300 | 11.1 | 0.64 | 3 |
| Materials | Cement | Fly Ash Cenospheres | Silica Fume | Water | Rubber Powder | PE Fiber | SRA | SP |
|---|---|---|---|---|---|---|---|---|
| LHDCC | 702.0 | 339.9 | 78.0 | 259.0 | - | 5.8 | 12.0 | 9.0 |
| RLHDC (5%) | 702.0 | 322.9 | 78.0 | 259.0 | 18.8 | 5.8 | 12.4 | 9.0 |
| RLHDC (10%) | 702.0 | 305.9 | 78.0 | 259.0 | 37.7 | 5.8 | 12.8 | 9.0 |
| Materials | Ec (GPa) | ρ (kg/m3) | ft (MPa) | fc (MPa) |
|---|---|---|---|---|
| LHDCC | 11.8 | 1388 | 2.9 | 49.2 |
| RLHDC (5%) | 9.9 | 1296 | 3.3 | 44.3 |
| RLHDC (10%) | 8.5 | 1203 | 3.6 | 40.2 |
| Coupons | Es (GPa) | fy (MPa) | fu (MPa) |
|---|---|---|---|
| 6 mm steel | 202 | 288 | 440 |
| 9 mm steel | 208 | 292 | 460 |
| Studs | 205 | 772 | 916 |
| J-hooks | 202 | 463 | 640 |
| Specimen | 1st Impact | 2nd Impact | 3rd Impact | |||||||||
|---|---|---|---|---|---|---|---|---|---|---|---|---|
| H (m) | V (m/s) | Pif (kN) | Dmd (mm) | H (m) | V (m/s) | Pif (kN) | Dmd (mm) | H (m) | V (m/s) | Pif (kN) | Dmd (mm) | |
| L(S)-150-9 | 5 | 9.830 | 941.9 | 43.6 | 5 | 9.846 | 887.5 | 26.1 | 3 | 7.605 | 645.6 | 14.5 |
| L-100-6 | 5 | 9.803 | 1063.4 | 32.8 | 5 | 9.880 | 1147.2 | 25.6 | 3 | 7.605 | 910.7 | 16.7 |
| L-150-6 | 5 | 9.883 | 960.2 | 43.3 | 5 | 9.867 | 1022.0 | 28.3 | 3 | 7.618 | 1013.0 | 15.5 |
| L-200-6 | 5 | 9.880 | 907.7 | 47.4 | 5 | 9.832 | 1070.1 | 31.4 | 3 | 7.620 | 961.1 | 18.5 |
| L-150(J)-6 | 5 | 9.860 | 874.3 | 45.5 | 5 | 9.856 | 893.0 | 26.7 | 3 | 7.600 | 795.2 | 21.4 |
| R5-150-6 | 5 | 9.890 | 884.4 | 46.5 | 5 | 9.883 | 1016.6 | 23.5 | 3 | 7.610 | 928.7 | 18.2 |
| R10-150-6(1) | 5 | 9.890 | 935.4 | 42.1 | - | - | - | - | - | - | - | - |
| R10-150-6(2) | 5 | 9.890 | 948.2 | 41.5 | 5 | 9.890 | 1040.6 | 26.5 | - | - | - | - |
| R10-150-6(3) | 5 | 9.890 | 938.3 | 41.1 | 5 | 9.885 | 1045.6 | 26.3 | 3 | 7.610 | 919.1 | 17.7 |
| Specimen | δm (mm) | Py (kN) | Ky (kN/mm) | Pn (kN) | Kn (kN/mm) | RRI | RSI |
|---|---|---|---|---|---|---|---|
| L(S)-150-9 | 21 | 170 | 11.6 | 632 | 40.6 | 0.27 | 0.29 |
| L-100-6 | 28 | 308 | 29.1 | 738 | 55.3 | 0.42 | 0.53 |
| L-150-6 | 51 | 269 | 22.0 | 682 | 44.8 | 0.39 | 0.49 |
| L-200-6 | 58 | 259 | 8.4 | 625 | 32.4 | 0.41 | 0.26 |
| L-150(J)-6 | 26 | 257 | 20.6 | 654 | 43.5 | 0.39 | 0.47 |
| R5-150-6 | 46 | 324 | 22.1 | 667 | 48.3 | 0.49 | 0.46 |
| R10-150-6(1) | 50 | 407 | 42.6 | 645 | 45.5 | 0.63 | 0.94 |
| R10-150-6(2) | 61 | 344 | 29.1 | 645 | 45.5 | 0.53 | 0.64 |
| R10-150-6(3) | 58 | 317 | 13.5 | 645 | 45.5 | 0.49 | 0.30 |
| Parameter | Value | Parameter | Value | Parameter | Value | ||||||
|---|---|---|---|---|---|---|---|---|---|---|---|
| LHDC | RLHDC (5%) | RLHDC (10%) | LHDC | RLHDC (5%) | RLHDC (10%) | LHDC | RLHDC (5%) | RLHDC (10%) | |||
| RO (kg/m3) | 1.388 × 10³ | 1.296 × 10³ | 1.203 × 10³ | β1 (MPa−1) | 3.733 × 10⁻³ | 4.426 × 10⁻³ | 5.115 × 10⁻³ | B | 5.000 × 10⁻¹ | 5.000 × 10⁻¹ | 5.000 × 10⁻¹ |
| G (MPa) | 4.538 × 10³ | 3.808 × 10³ | 3.269 × 10³ | α2 | 1.000 | 1.000 | 1.000 | GFC (N/m) | 9.188 × 10³ | 8.250 × 10³ | 7.500 × 10³ |
| K (MPa) | 9.833 × 10³ | 8.250 × 10³ | 7.083 × 10³ | θ2 (MPa−1) | 0.000 | 0.000 | 0.000 | D | 1.000 × 10³ | 1.000 × 10³ | 1.000 × 10³ |
| α (MPa) | 1.964 × 101 | 1.696 × 101 | 1.482 × 101 | λ2 | 5.000 × 10⁻¹ | 5.000 × 10⁻¹ | 5.000 × 10⁻¹ | GFT (N/m) | 1.952 × 10³ | 1.858 × 10³ | 1.775 × 10³ |
| θ | 2.425 × 10⁻¹ | 2.474 × 10⁻¹ | 2.527 × 10⁻¹ | β2 (MPa−1) | 2.905 × 10⁻³ | 3.448 × 10⁻³ | 3.988 × 10⁻³ | GFS (N/m) | 7.809 × 10² | 7.433 × 10² | 7.099 × 10² |
| λ (MPa) | 1.104 × 101 | 8.725 | 6.906 | R | 2.149 | 2.218 | 2.285 | 9.092 × 10⁻⁵ | 9.541 × 10⁻⁵ | 9.957 × 10⁻⁵ | |
| β (MPa−1) | 2.457 × 10⁻² | 2.853 × 10⁻² | 3.323 × 10⁻² | X0 (MPa) | 1.098 × 10² | 1.003 × 10² | 9.277 × 101 | Nt | 5.696 × 10⁻¹ | 5.696 × 10⁻¹ | 5.696 × 10⁻¹ |
| α1 | 1.000 | 1.000 | 1.000 | W | 3.428 × 10⁻¹ | 3.428 × 10⁻¹ | 3.428 × 10⁻¹ | 1.797 × 10⁻⁴ | 1.728 × 10⁻⁴ | 1.670 × 10⁻⁴ | |
| θ1 (MPa−1) | 0.000 | 0.000 | 0.000 | D1 (MPa−1) | 7.859 × 10⁻⁴ | 7.859 × 10⁻⁴ | 7.859 × 10⁻⁴ | Nc | 8.898 × 10⁻¹ | 8.898 × 10⁻¹ | 8.898 × 10⁻¹ |
| λ1 | 4.226 × 10⁻¹ | 4.226 × 10⁻¹ | 4.226 × 10⁻¹ | D2 (MPa−1) | 0.000 | 0.000 | 0.000 | - | - | - | - |
| Parts | Keywords | Input Parameters |
|---|---|---|
| Hammer, Support | MAT_ELASTIC | E = 200 GPa, = 0.27 |
| Steel plate | MAT-PLASTIC-KINEMATIC | ρ = 7850 kg/m3, E = 200 GPa, ν = 0.27, fy = 285 MPa, Et = 1090 GPa, Fs = 0.45 |
| Studs | MAT-PLASTIC-KINEMATIC | ρ = 7850 kg/m3, E = 200 GPa, ν = 0.27, fy = 772 MPa, Et = 1990 GPa, Fs = 0.1 |
| J-hooks | MAT-PLASTIC-KINEMATIC | ρ = 7850 kg/m3, E = 200 GPa, ν = 0.27, fy = 463 MPa, Et = 1720 GPa, Fs = 0.3 |
| Specimens | Maximum Residual Resistance Py (KN) | Ultimate Displacement δm (mm) | ||||
|---|---|---|---|---|---|---|
| Test | FE | T/F | Test | FE | T/F | |
| L(S)-150-9 | 170 | 192 | 0.89 | 21 | 23 | 0.91 |
| L-100-6 | 308 | 330 | 0.93 | 28 | 26 | 1.08 |
| L-150-6 | 269 | 308 | 0.87 | 51 | 43 | 1.19 |
| L-200-6 | 259 | 285 | 0.91 | 58 | 51 | 1.14 |
| L-150(J)-6 | 257 | 282 | 0.91 | 26 | 29 | 0.90 |
| R5-150-6 | 324 | 310 | 1.05 | 46 | 41 | 1.12 |
| R10-150-6(1) | 407 | 381 | 1.07 | 50 | 45 | 1.11 |
| R10-150-6(2) | 344 | 366 | 0.94 | 61 | 48 | 1.27 |
| R10-150-6(3) | 317 | 354 | 0.90 | 58 | 43 | 1.35 |
| Mean | — | — | 0.94 | — | — | 1.12 |
| Standard deviation | — | — | 0.07 | — | — | 0.14 |
| Specimen | Concrete Strength | Steel Strength | Steel Thickness | Connector Diameter | Residual Resistance | Undamaged Resistance | Residual Resistance Index |
|---|---|---|---|---|---|---|---|
| C40-345-6-10 | 40MPa | 345 MPa | 6mm | 10 mm | 489 kN | 752 kN | 0.65 |
| C50-345-6-10 | 50 MPa | 345 MPa | 6 mm | 10 mm | 567 kN | 834 kN | 0.68 |
| C60-345-6-10 | 60 MPa | 345 MPa | 6 mm | 10 mm | 590 kN | 855 kN | 0.69 |
| C40-235-6-10 | 40 MPa | 235 MPa | 6 mm | 10 mm | 366 kN | 704 kN | 0.52 |
| C40-420-6-10 | 40 MPa | 420 MPa | 6 mm | 10 mm | 682 kN | 886 kN | 0.77 |
| C40-345-4-10 | 40 MPa | 345 MPa | 4 mm | 10 mm | 309 kN | 718 kN | 0.43 |
| C40-345-8-10 | 40 MPa | 345 MPa | 8 mm | 10 mm | 787 kN | 894 kN | 0.88 |
| C40-345-6-13 | 40 MPa | 345 MPa | 6 mm | 13 mm | 489 kN | 752 kN | 0.65 |
| C40-345-6-16 | 40 MPa | 345 MPa | 6 mm | 16 mm | 586 kN | 781 kN | 0.75 |
Disclaimer/Publisher’s Note: The statements, opinions and data contained in all publications are solely those of the individual author(s) and contributor(s) and not of MDPI and/or the editor(s). MDPI and/or the editor(s) disclaim responsibility for any injury to people or property resulting from any ideas, methods, instructions or products referred to in the content. |
© 2023 by the authors. Licensee MDPI, Basel, Switzerland. This article is an open access article distributed under the terms and conditions of the Creative Commons Attribution (CC BY) license (https://creativecommons.org/licenses/by/4.0/).
Share and Cite
Huang, Z.; Zhao, X.; Guo, Y.; Liu, X. Residual Flexural Performance of Double-Layer Steel–RLHDC Composite Panels after Impact. Buildings 2023, 13, 2916. https://doi.org/10.3390/buildings13122916
Huang Z, Zhao X, Guo Y, Liu X. Residual Flexural Performance of Double-Layer Steel–RLHDC Composite Panels after Impact. Buildings. 2023; 13(12):2916. https://doi.org/10.3390/buildings13122916
Chicago/Turabian StyleHuang, Zhenyu, Xiaolong Zhao, Yutao Guo, and Xiangqian Liu. 2023. "Residual Flexural Performance of Double-Layer Steel–RLHDC Composite Panels after Impact" Buildings 13, no. 12: 2916. https://doi.org/10.3390/buildings13122916
APA StyleHuang, Z., Zhao, X., Guo, Y., & Liu, X. (2023). Residual Flexural Performance of Double-Layer Steel–RLHDC Composite Panels after Impact. Buildings, 13(12), 2916. https://doi.org/10.3390/buildings13122916