Article

Measurement of Water Retention Ratio in Rust Layer by Electrical Resistance †

1
Department of Construction and Environmental Engineering, Graduate School of Science and Technology for Innovation, Tokiwa Campus, Yamaguchi University, Ube 755-8611, Japan
2
IHI Infrastructure Systems Co., Ltd., Sakai 590-0977, Japan
*
Author to whom correspondence should be addressed.
This article is a revised and expanded version of a paper entitled ‘Evaluation of Water Retention of Rust Layer Based on Electrical Resistance Measurement’, which was presented at The Sixth Australasia and South-East Asia Structural Engineering and Construction Conference, Sydney, Australia, 29 November 2022.
Buildings 2023, 13(12), 2921; https://doi.org/10.3390/buildings13122921
Submission received: 4 October 2023 / Revised: 17 November 2023 / Accepted: 21 November 2023 / Published: 23 November 2023
(This article belongs to the Special Issue Construction Automation: Current and Future)

Abstract

:
One significant form of deterioration in weathering steel bridges is corrosion, and steel requires water and oxygen to corrode. As a measurement method for the wetness time of the rust layer on weathering steel, measuring electrical resistance has been proposed. In this research, the fundamental data have been collected as preliminary considerations to develop this method of measuring water retention in the rust layer. Based on the measurement of specimens, it is revealed that measuring the exact amount of water retention is difficult because electrical resistance depends on the thickness of the rust layer and the supplied amount of NaCl. Thus, the water retention ratio is calculated by dividing the mass of the water-retained specimen by the mass of the full water-retained specimen. These measurement results suggest a potential method for predicting water retention ratio by measuring electrical resistance and rust thickness. The approximate water retention ratio is predicted by plotting electrical resistance and rust thickness in the proposed diagram.

1. Introduction

Weathering steel is commonly used as a material for steel bridges around the world. It is a low-carbon steel to which small amounts of copper, chromium, nickel, and other alloying elements are added. Japan has about 720,000 bridges, and 40% of them are made of steel. Out of these steel bridges, weathering steel is used for 9% of them. Weathering steel does not require painting because it produces a protective rust layer by itself [1,2,3]. The production of the protective rust layer, however, can be impeded under severe environmental conditions, such as high humidity, water leakage, and salt (NaCl) supply from the sea or bridge surface, etc. Under these conditions, corrosion on weathering steel bridges will be accelerated by the production of an abnormal rust layer, which leads to the deterioration of bridges. To ensure weathering steel bridges are safe to use, attention is being given to their maintenance.
Corrosion cannot occur or progress unless water and oxygen are supplied; therefore, in the case of weathering steel, detecting or measuring water or oxygen on the surface of the rust layer leads to the detection of the corrosive area. So far, a detection or measurement method for water on the steel surface has been proposed. As the measuring method for the wetness of the steel surface, time of wetness (TOW) has been used. ISO-9223 [4] defined TOW as the time period during which relative humidity is in excess of 80% and the temperature is above 0 °C. In addition, the Atmospheric Corrosion Monitor (ACM) corrosion sensor is commonly used to evaluate the corrosivity of atmospheric environments by calculating TOW based on the measured galvanic current [5,6,7]. The ACM sensors are attached to the surface of the target; thus, this method cannot directly measure the water inside the rust layer. Regarding weathering steel that is unpainted, the protective or abnormal rust layer is expected to retain water and maintain the wetness of the steel surface. For the measurement of wetness on the rust layer, the electrical resistance measurement layer has been considered [8]. This method presents a possibility for detecting the wetness time of the rust layer, but this method is not widely spread. When water retention can be measured by non-destructive methods, this helps to maintain weathering steel bridges by detecting the wetness area, i.e., the corrosive area. It is also useful to check or predict the corrosion environment by measuring the behavior of the water retention ratio over the course of a day. When focusing on electrical, non-destructive testing for steel corrosion, there are electrical methods for assessing the corrosion rate of steel in concrete [9], monitoring corrosion processes in high-strength steel in automotive applications with an electrical resistance sensor [10], and evaluating the rust layer itself with electric resistance probes [11], etc. Only a few attempts, however, have been made to investigate the detection of water in the rust layer utilizing electrical resistance.
The authors have previously conducted research to evaluate water retention in the rust layer based on the electrical resistance measurement [12]. In this previous study, we measured the electrical resistance of specimens by supplying them with different water quantities. Supplying the same water quantity to specimens of different rust thicknesses, it was found that specimens with larger rust thickness exhibited lower electrical resistance. Thus, we concluded that it is, potentially, possible to evaluate the water retention of the rust layer, based on the water quantity in the rust, by measuring electrical resistance. There were, however, two challenges: the relationship between electrical resistance and water retention is still unclear, and the effect of rust thickness and the amount of supplied chloride was not sufficiently investigated.
Therefore, by developing this previous method, we aim to suggest a measurement method for water retention in the rust layer of weathering steel by measuring electrical resistance. To achieve this goal, in this research, the fundamental data have been collected as preliminary considerations. First, the corroded weathering steel specimens are prepared by corrosion acceleration test. Second, the relationship between electrical resistance and water retention, which is measured by the mass of the specimens, is illustrated with differences in rust layer thickness and the amount of supplied chloride. In addition, a water retention ratio prediction diagram is proposed.

2. Materials and Measuring Methods

In order to measure the relationship between water in the rust layer and electric resistance, weathering steel specimens of different rust thicknesses are provided by a corrosion acceleration test. The specimen is 70 mm × 70 mm in size, and Figure 1 shows the corrosion acceleration test cycle, which involved repeatedly supplying NaCl solution to each specimen and exposing it to wet and dry environments. An inverted white triangle in Figure 1 indicates the water-supplying phase, in which tap water, 0.1 wt%, and 3 wt% NaCl solution is supplied to each specimen for the first 8 days. The amount of supplied water is set as 40 μL/mm2 [13]. From 9–24 days, only the exposure phase is repeated. This 24-day period is defined as one cycle, and this cycle is then repeated. Rust thickness is measured by a coating thickness gauge (Elcometer 456). Ten points are measured, then the average is calculated after the maximum and minimum are removed. A list of the prepared specimens is shown in Table 1. In this study, the specimens prepared by supplying them with tap water were not measured because their rust thickness was less than 100 μm. This cyclic test for the tap water specimens has been continued, and measurement will be conducted after they have sufficient rust thickness.
Figure 2 shows the electrical resistance measuring procedure. First, the specimen is dried to an acceptable state by exposing it to a 50 °C temperature and 0% humidity environment. When the mass of the specimen becomes constant, it is judged as being in a dry state. Second, the mass of the specimen in a dry state is measured as the initial (Minitial); then, pure water is evenly supplied to the surface. After supplying pure water, the mass of the specimen (Mwet) is measured. Then, the specimen is exposed to a room environment of about 25 °C temperature and 60% humidity. During this exposure phase, the mass of the specimen, including water (Mwet) and electrical resistance, are repeatedly measured until the Mwet becomes constant, which means drying the specimen. The mass of retained water in the rust (Mretain) is calculated by subtracting Minitial from each Mwet. The distance between the measuring sensor is set to 50 mm, and the electrical resistance is measured as the average of a total of five times at one-second intervals. This method aims to be non-destructive and it avoids affecting the existing rust layer measurement because the sensor is set directly on the rust layer.
Electrical resistance is expected to be affected by the electrical conductivity of retaining water. In this research, electrical resistance is measured by supplying pure water to the specimens; therefore, the retaining water may contain NaCl, which is melted from the specimens, so that measuring the exact conductivity or Cl concentration of the retaining water is difficult. As noted, the electrical conductivity of tap water, 0.1 wt%, 1 wt%, and 3 wt% NaCl solution is measured. The results are shown in Table 2. In our previous study, we also considered differences in the electrical resistance by changing the supplying tap water or 0.1 wt% NaCl solution when measuring specimens of 100 μm and 110 μm rust thickness [12]. No significant differences in electrical resistance were registered in that study; thus, it is not discussed in this one. The previous measurement, however, was only conducted for specimens of a small rust thickness, so it needs further consideration.

3. Electrical Resistance and Retained Water

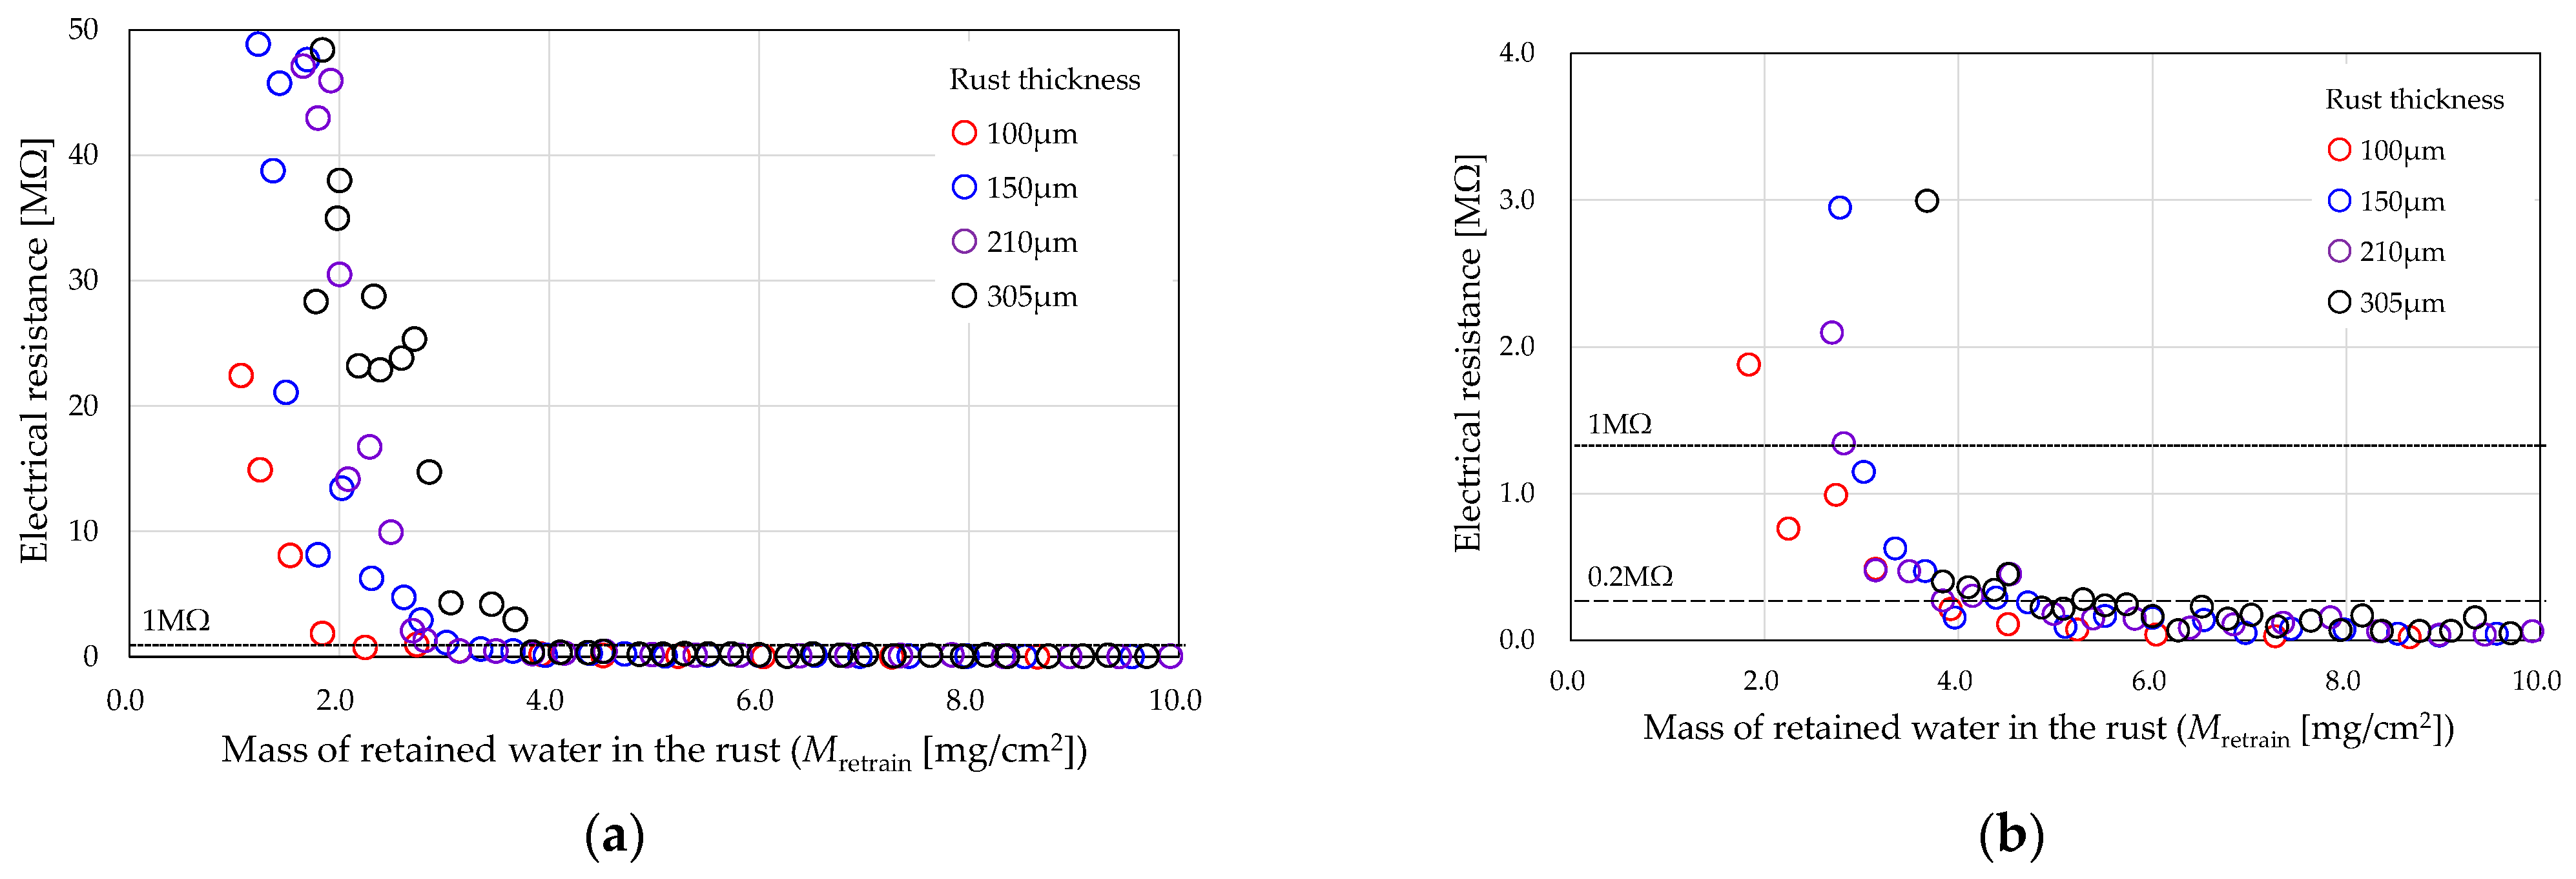
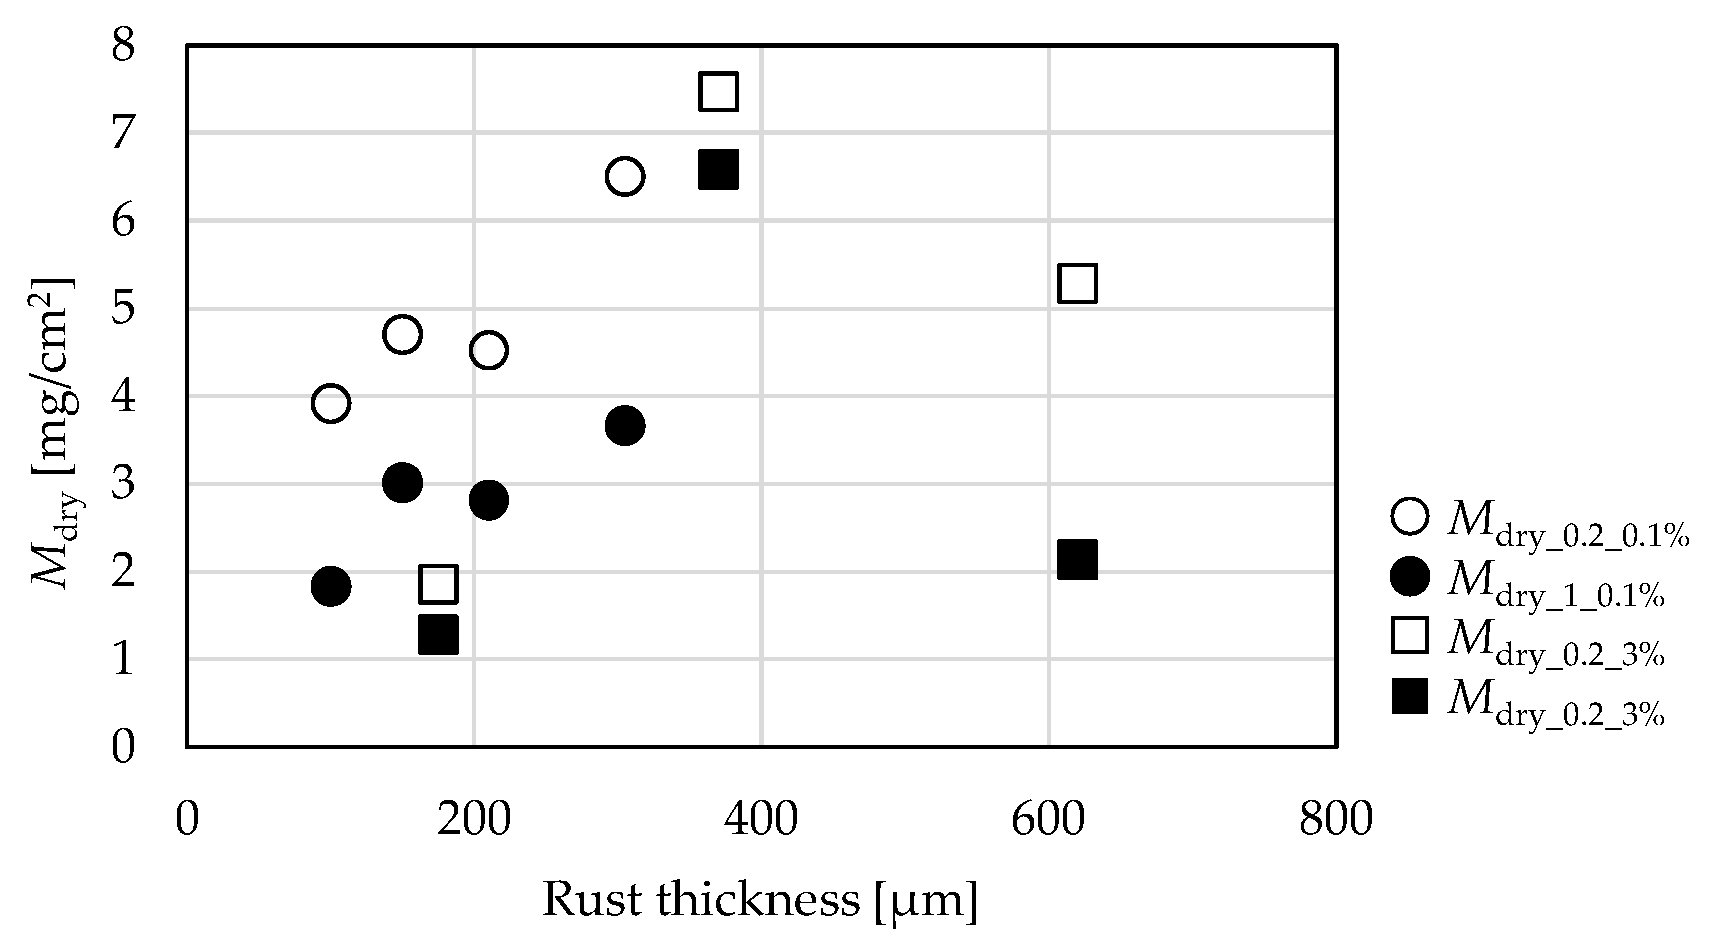
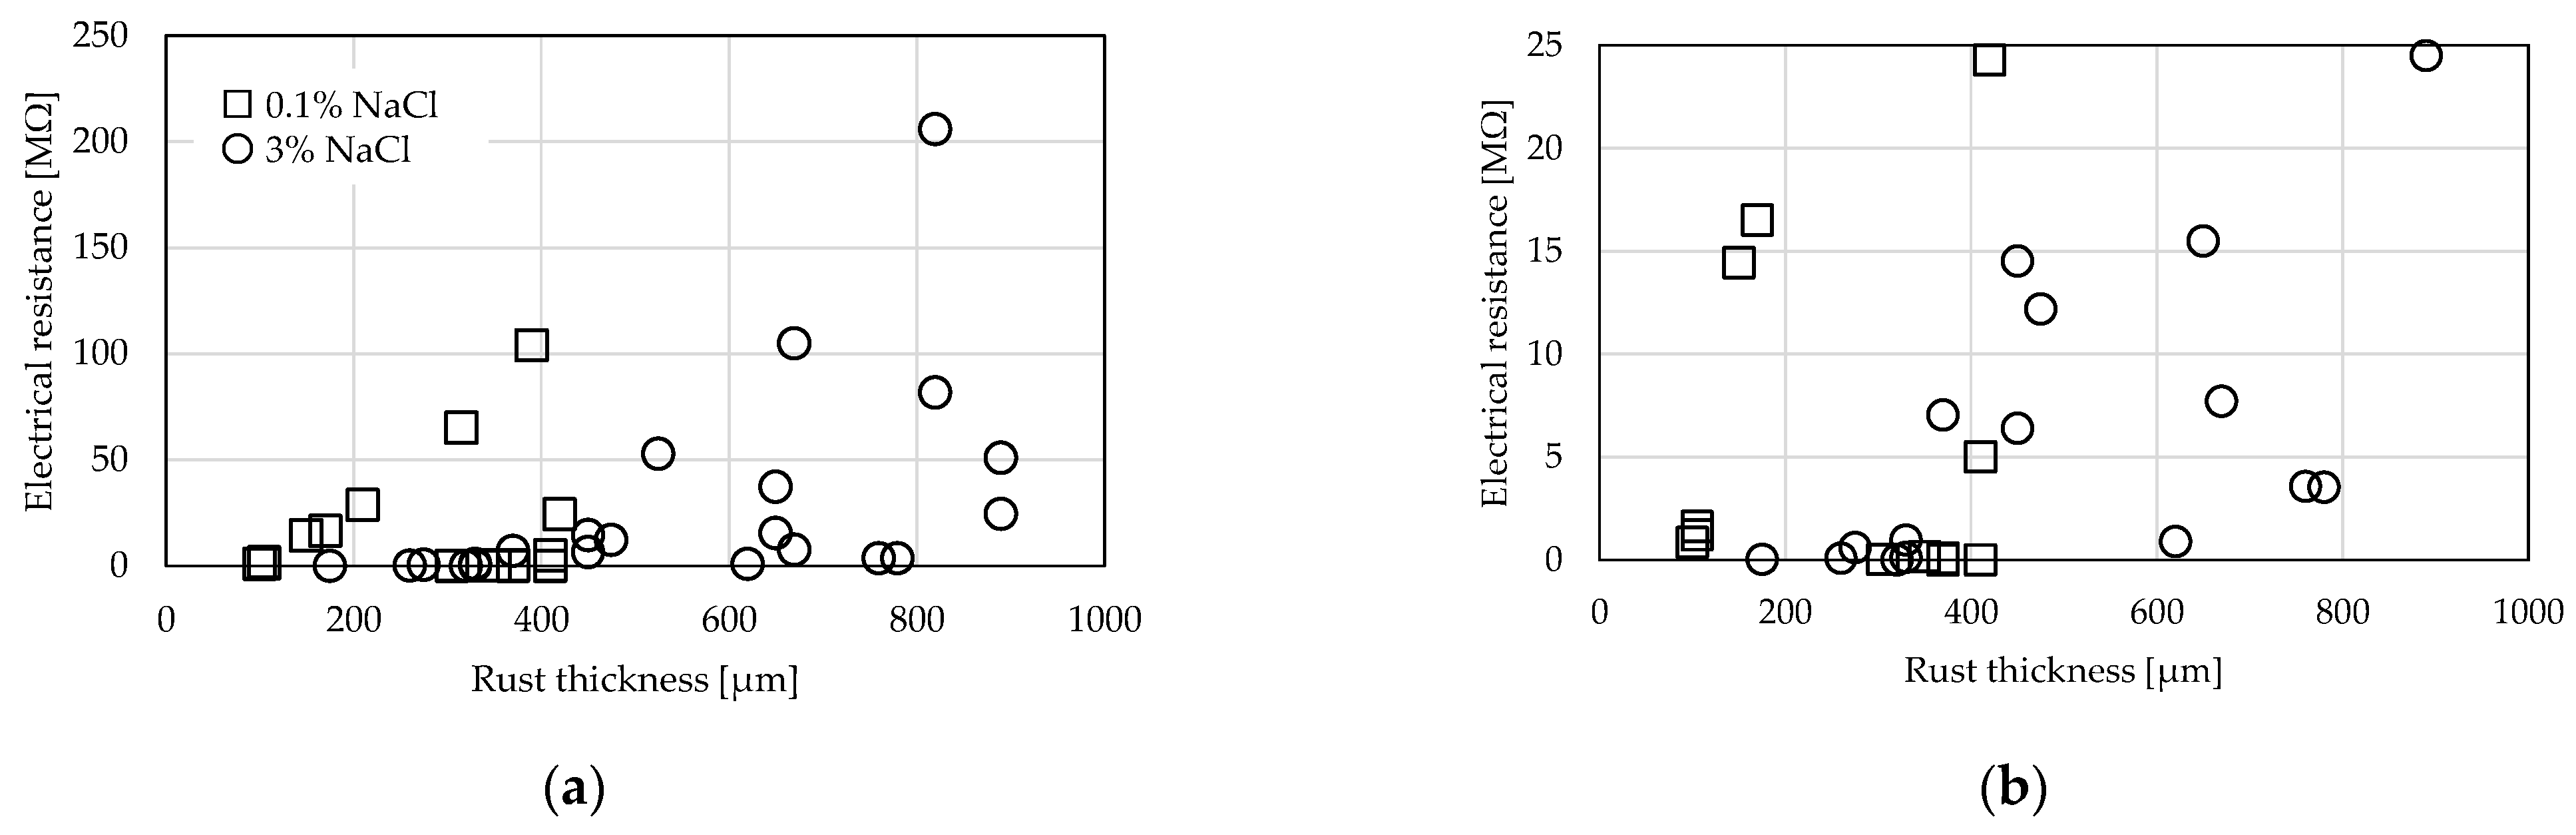
3.1. Comparison by Rust Thickness

The relationship between the mass of retained water in the rust (Mretain) and the electrical resistance is shown in Figure 3 and Figure 4. In each figure, specimens of four different rust thicknesses are measured, and the results are plotted. As shown in Figure 3, in the 0.1 wt% NaCl solution-supplied specimen, the electrical resistance that remains is smaller than 0.2 MΩ and is flat when the Mretain is 4.0 mg/cm2 or higher. When the Mretain decreases to less than 4.0 mg/cm2, the electrical resistance increases. This trend does not depend on rust thickness in 100, 150, 210, and 305 μm specimens. As shown in Figure 4, in the 3 wt% NaCl solution-supplied specimen, the Mretain decreases by less than 7.0 mg/cm2; the electrical resistance increases in the specimens with more than 370 μm rust thickness.
Figure 5 compares 0.1 wt% and 3 wt% NaCl solution-supplied specimens of similar rust thicknesses. As shown in Figure 5a, at the point at which the electrical resistance increases, the Mretain of the 0.1 wt% specimen is larger than that of the 3 wt% specimen at 150 and 175 μm rust thickness. Conversely, for 305 and 370 μm rust thickness, the Mretain at the point of electrical resistance increase is larger in the 3 wt% specimen than in the 0.1 wt% specimen. When comparing Figure 5a with 5b, for comparable Mretain values, the electrical resistance is larger in specimens with a large rust thickness.
To estimate the water retention capacity of the rust layer, 0.2 MΩ and 1 MΩ electrical resistances are employed as the threshold of the drying point. These thresholds are shown in Figure 3, Figure 4 and Figure 5 with dotted and dashed lines.
Figure 6 summarizes the Mretain of the drying point with each threshold, defined as Mdry_0.2 and Mdry_1. The concentration of the supplied NaCl solution is also added to the end of the suffix. The outlined and filled circle plots show a similar relationship between rust thickness and Mdry. This means that, regardless of the applied threshold for 0.1 wt% NaCl-supplied specimens, the rust thickness increases as Mdry increases. On the other hand, for 3 wt% NaCl-supplied specimens, the Mdry peaks at 370 μm rust thickness, which is in the middle range of measured specimens. This trend is indicated in each threshold.

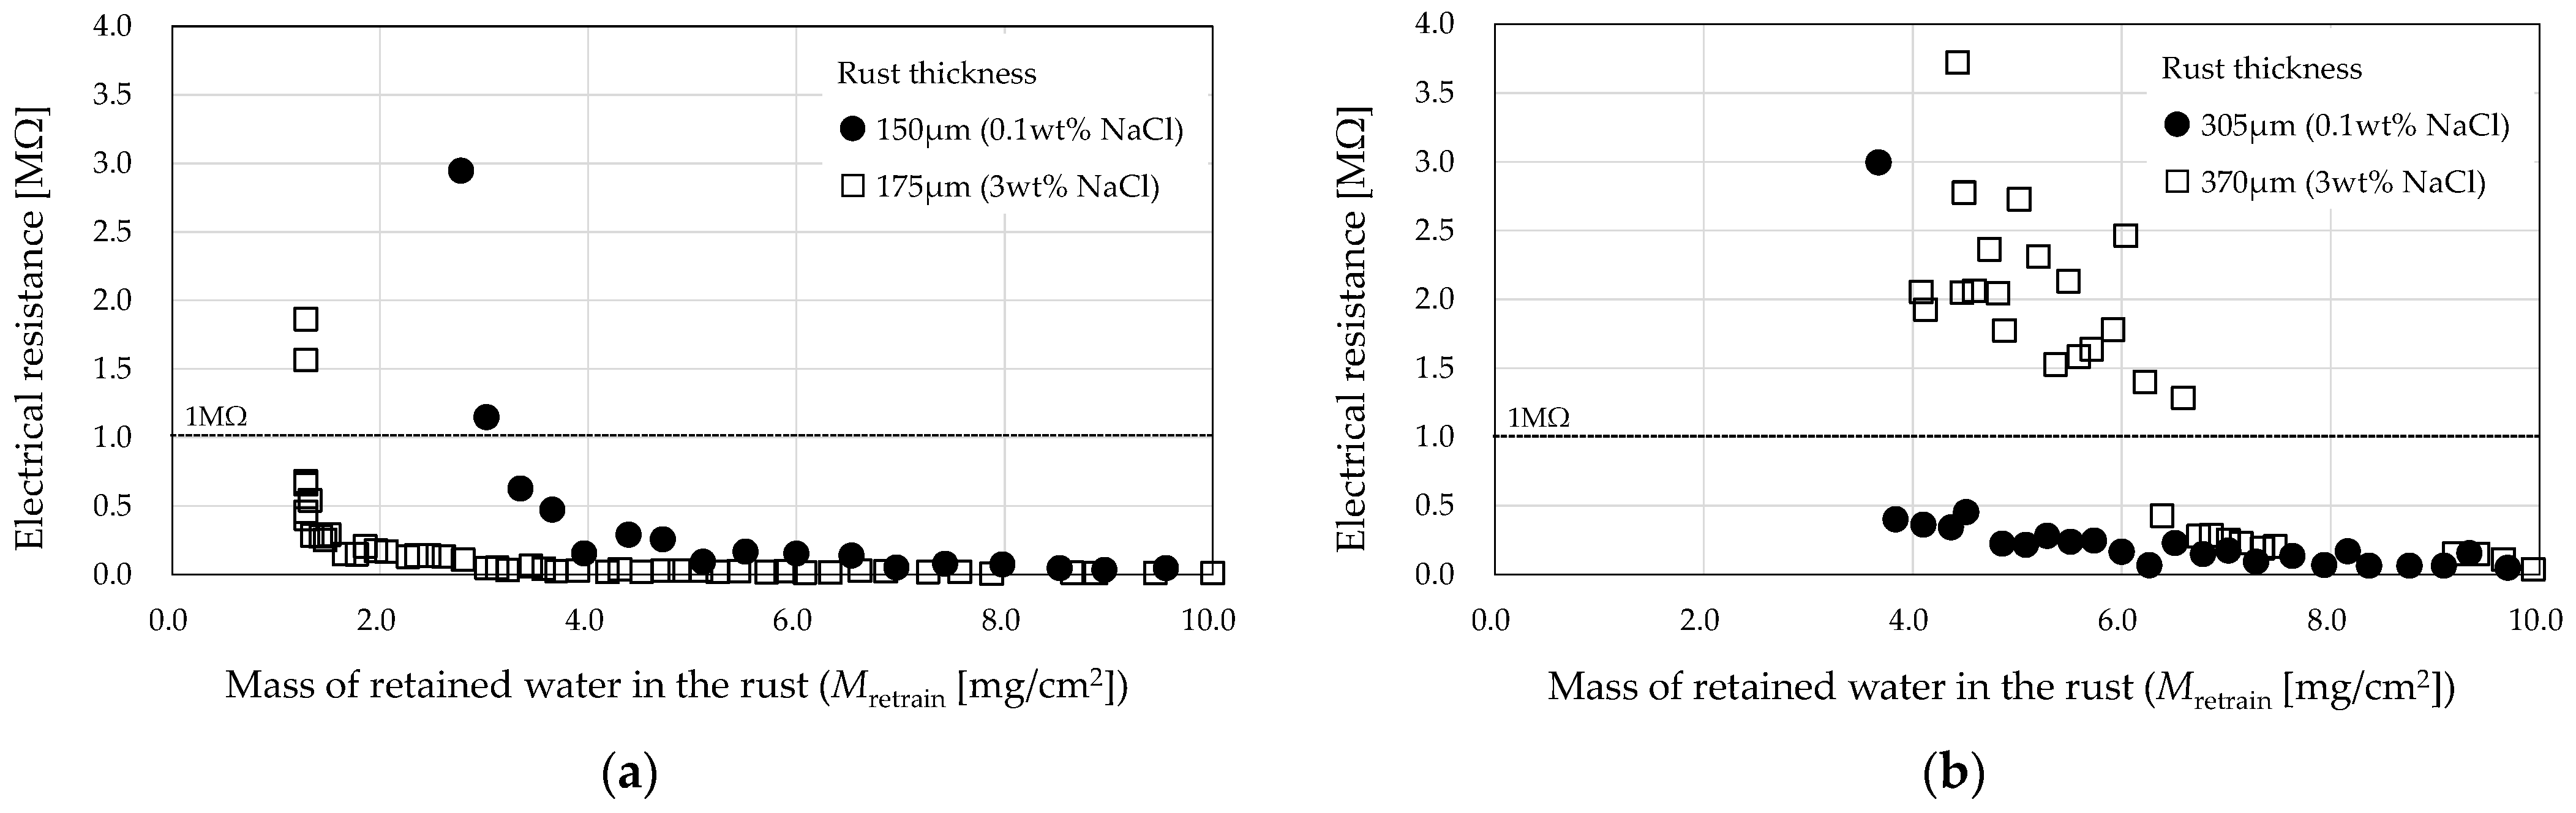
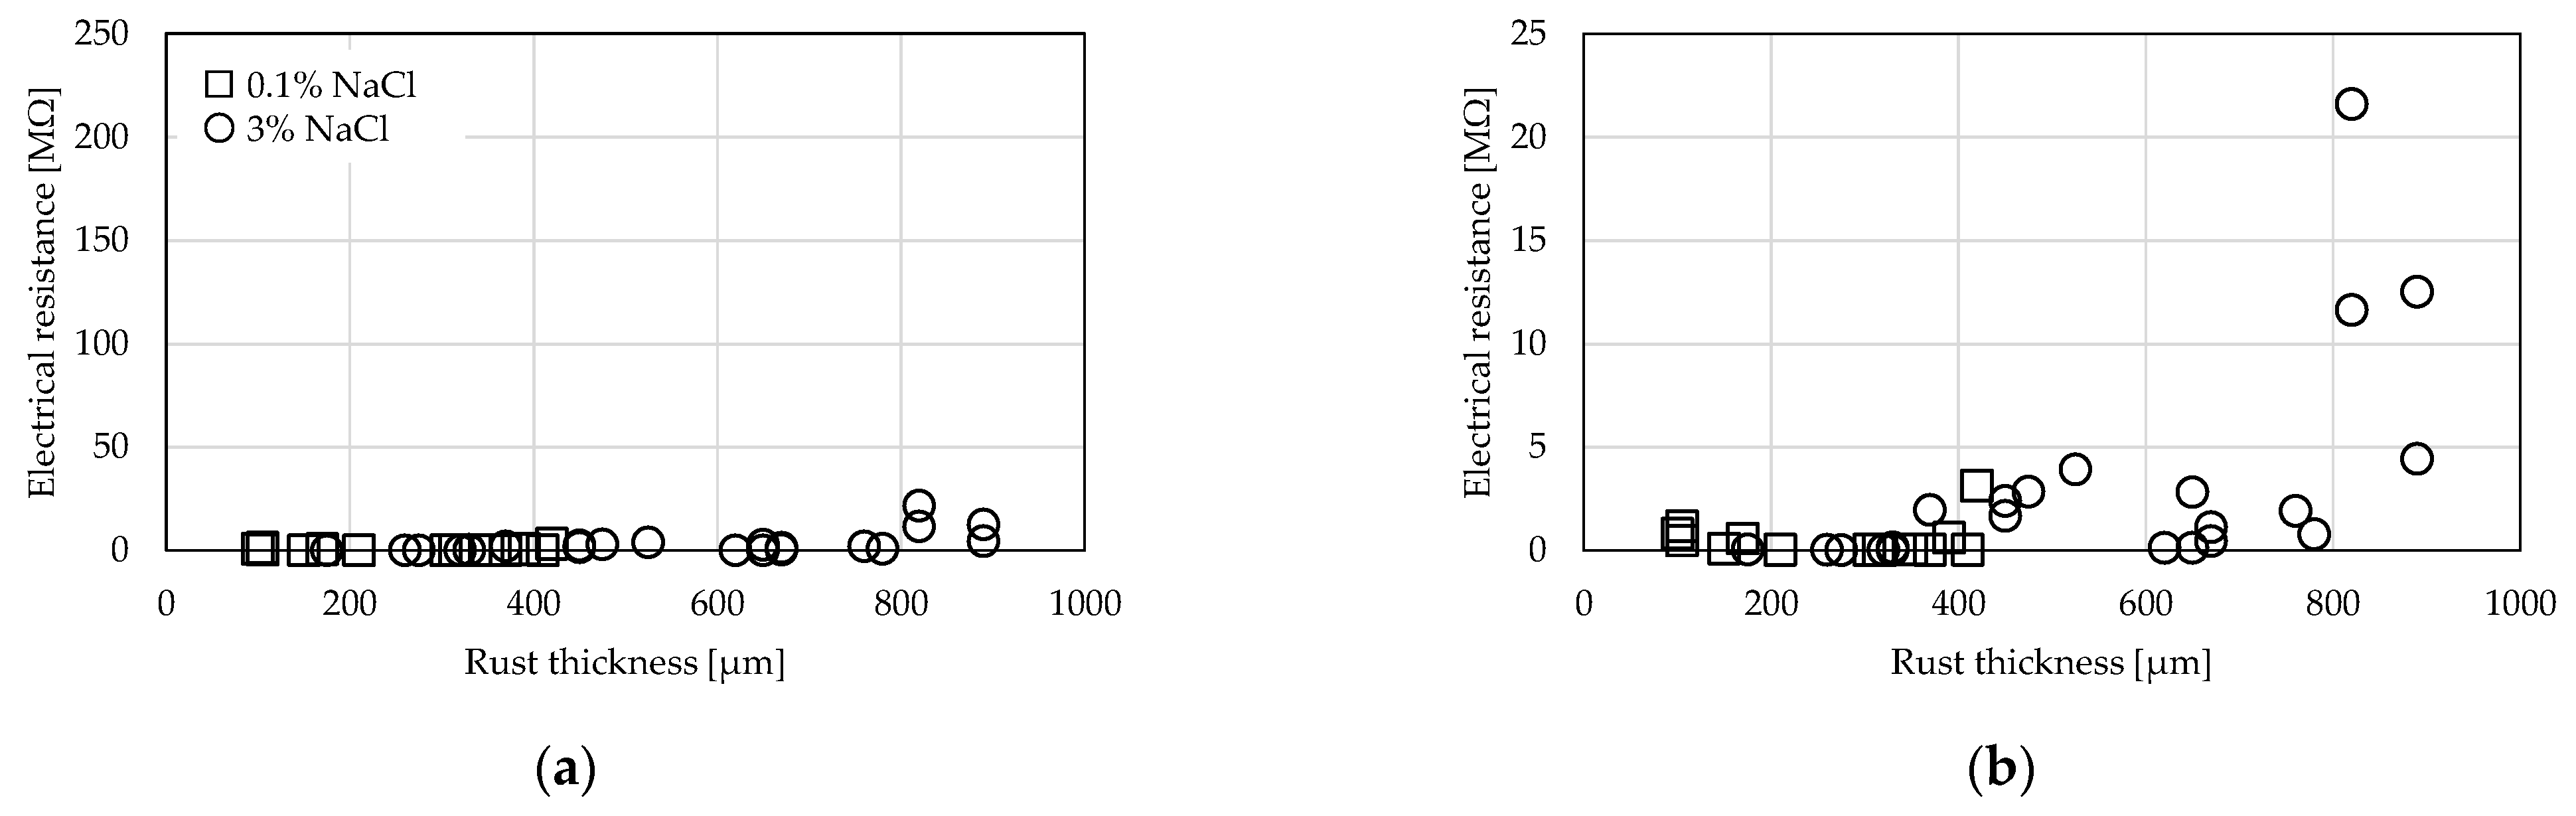
3.2. Comparison by Amount of Supplied NaCl

In order to compare electrical resistance when the Mretain and rust thickness are the same, but the concentrations of supplied NaCl solutions are different, these relationships are summarized in Figure 7, Figure 8 and Figure 9. As shown in Figure 8 and Figure 9, there is no significant difference when Mretain values are 5 mg/cm2 or 10 mg/cm2. On the contrary, when the Mretain is 2 mg/cm2, as shown in Figure 7, the electrical resistance is different, even if the Mretain and rust thickness are the same. This indicates that, although there is the same amount of water retention in the rust layer, the electrical resistance differs when the concentrations of the supplied NaCl solution are different.

4. Prediction of Water Retention Ratio by Electrical Resistance and Rust Thickness

In view of Section 3, it is difficult to determine the exact amount of water retention by measuring electrical resistance. The differences in electrical resistance in the same amount of retained water are assumed to be due to how porous it is or how much NaCl solution is contained in the rust layer, etc. In order to determine the corrosion acceleration or progress level, it would be helpful to ascertain not only the exact amount of water retention, but also the water retention ratio within the rust layer. Thus, a prediction method for the water retention ratio within the rust layer, by measuring the electrical resistance and rust thickness, is considered in this section.

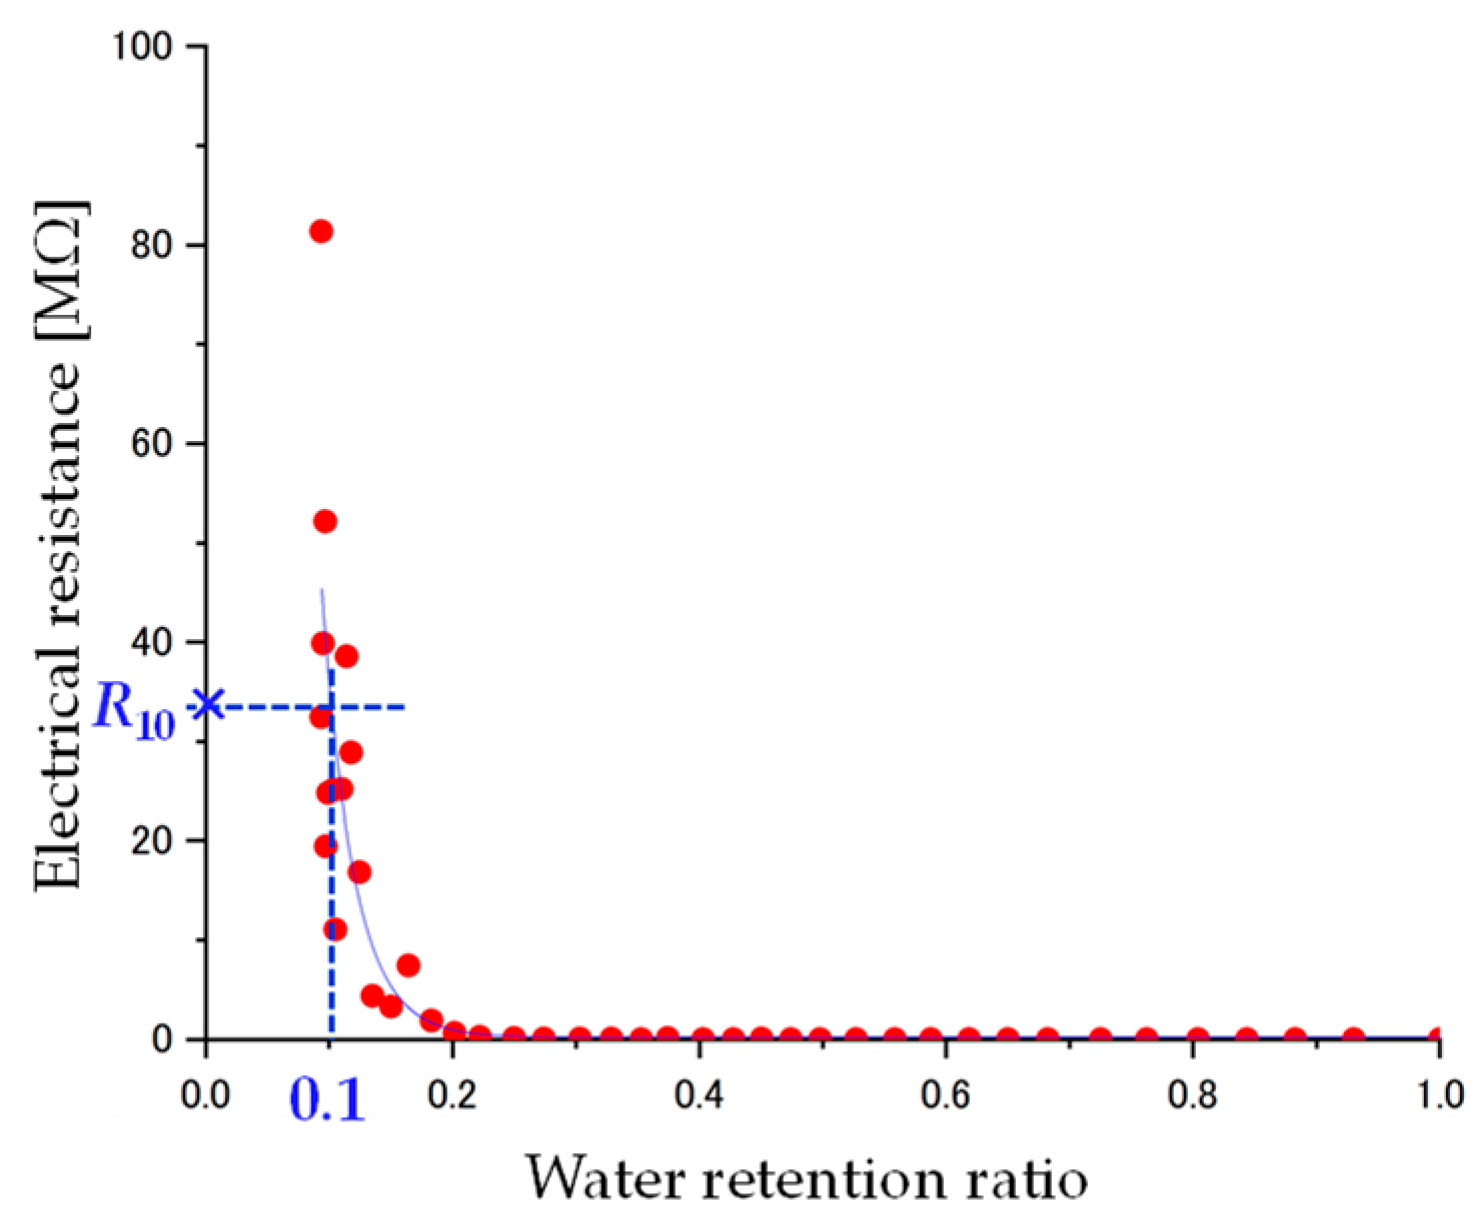
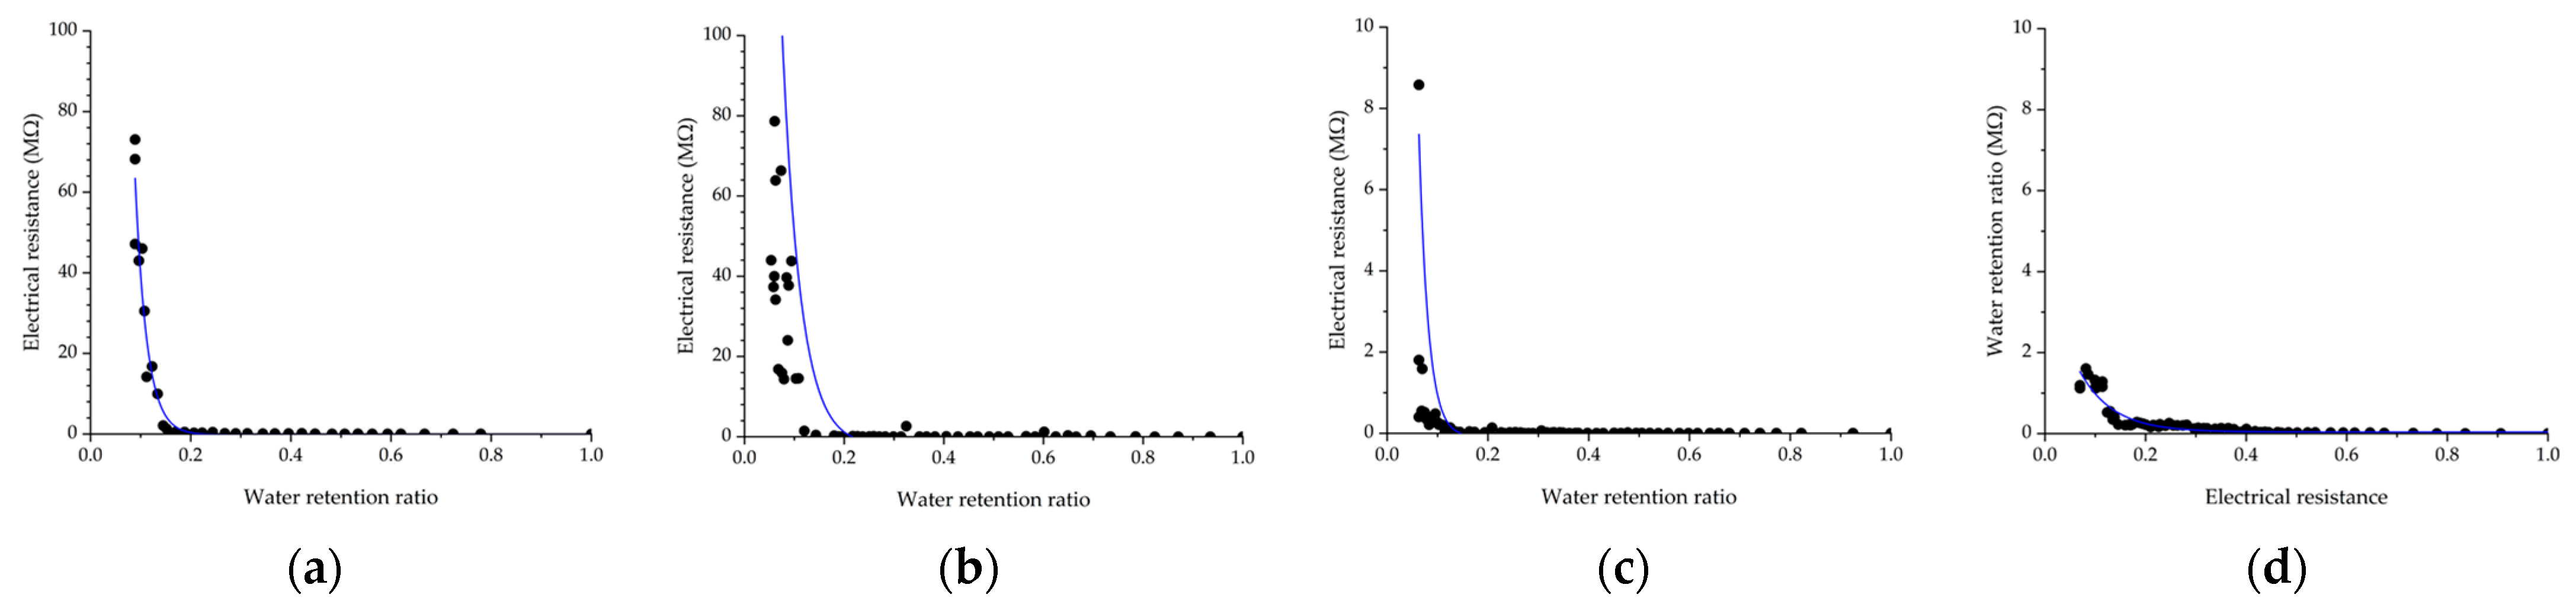
4.1. Water Retention Ratio and Electrical Resistance

For calculating the water retention ratio of the rust layer, first, the mass of the specimen filled with pure water is measured and defined as Mmax. Then, the water retention ratio is calculated by dividing Mretain by Mmax.
Figure 10 shows the relationship between the water retention ratio and the electrical resistance of 0.1 wt% NaCl solution-supplied specimens with 410 μm rust thickness. In order to obtain the electrical resistance in each water retention ratio, in 10% increments, from R10 to R100, an exponential trendline of the electrical resistance is calculated by graphing software (Origin Pro 2022b). The equation is shown below:
y = α exp ( x / β )
Figure 11 shows the exponential trendlines of the electrical resistance in 0.1 wt% NaCl solution-supplied specimens with 210 and 315 μm rust thickness, and 3 wt% NaCl solution-supplied specimens with 275 and 620 μm rust thickness. Table 3 and Table 4 show the coefficient of determination (COD) for all measured specimens. As shown in Figure 11a,d, the equation fits well with the measured electrical resistance. Conversely, as shown in Figure 11b,c, the equation does not fit the measured values. Thus, the fit curve equation leaves room for a variety of interpretations.
The relationship between electrical resistance and rust thickness, in the 10% water retention ratio (R10), is shown in Figure 12. When focusing on a rust thickness of less than 500 μm, the R10 of the 0.1 wt% NaCl solution-supplied specimens increases as the rust thickness increases. On the other hand, the R10 of the 3 wt% NaCl solution-supplied specimens does not exhibit significant change in this area. At a rust thickness of more than 500 μm, the R10 of the 3 wt% NaCl solution-supplied specimens increases as the rust thickness increases. When comparing the R10 of the 0.1 wt% with that of the 3 wt% NaCl solution-supplied specimens, with comparable rust thickness, the R10 of the 3 wt% specimens is smaller than that of the 0.1 wt% specimens.

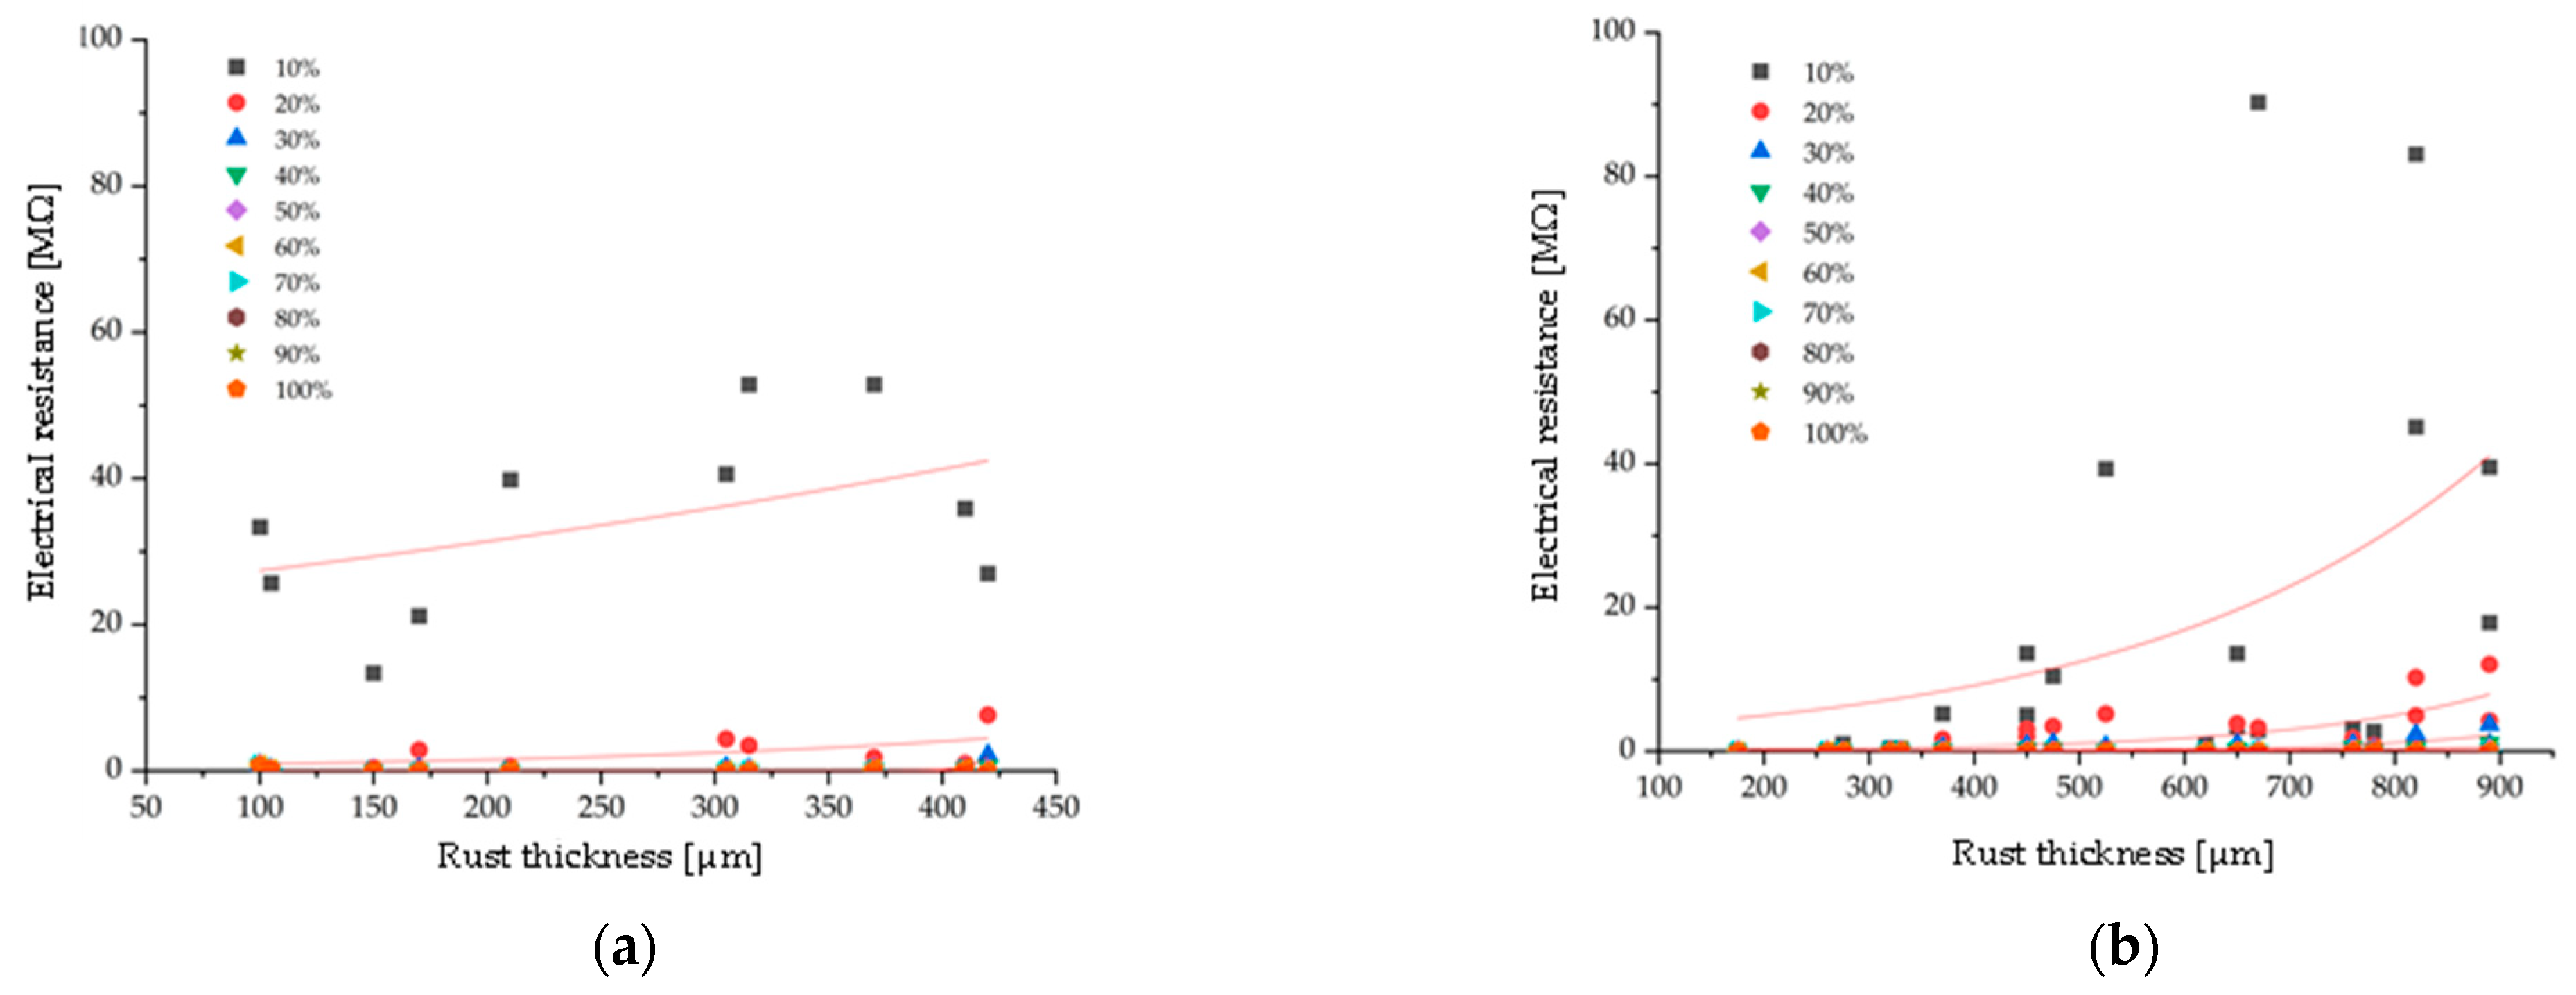
4.2. Electrical Resistance in Each Water Retention Ratio

As evidenced in Section 4.1, the electrical resistance in the 10% water retention ratio depends on the thickness of the rust layer and the concentration of the supplied NaCl solution. In order to predict the water retention ratio by electrical resistance, the electrical resistance in each water retention ratio, from R10 to R100, is summarized with the rust thickness.
Figure 13 shows the relationship between rust thickness and electrical resistance for each 10% water retention ratio of the 0.1 wt% and 3 wt% NaCl solution-supplied specimens, and it shows the respective approximate curves. These curves are calculated by Equation (1), shown in Section 4.1.
From Figure 13a, it is evident that electrical resistance increases as the water retention ratio decreases. In addition, the electrical resistance, when the water content ratio is 30% or more, is as small as 0–5 MΩ, regardless of rust thickness, and remains almost flat. Thus, the symbols of 30–100% are overlapped and they are not shown in the figures. Conversely, when the water content ratio is 20% or 10%, the electrical resistance tends to increase as the rust thickness increases. Furthermore, as the water content ratio decreases, variability in the electrical resistance increases. These characteristics are shown in Figure 13b. In comparison with Figure 13a, Figure 13b shows that the electrical resistance in specimens of less than 400 μm rust thickness is smaller than 10 MΩ, regardless of the water retention ratio. Thus, the electrical resistance in each water retention ratio is affected by the concentration of the NaCl solution supplied to the specimens, and it is more greatly affected in specimens with small rust thickness.

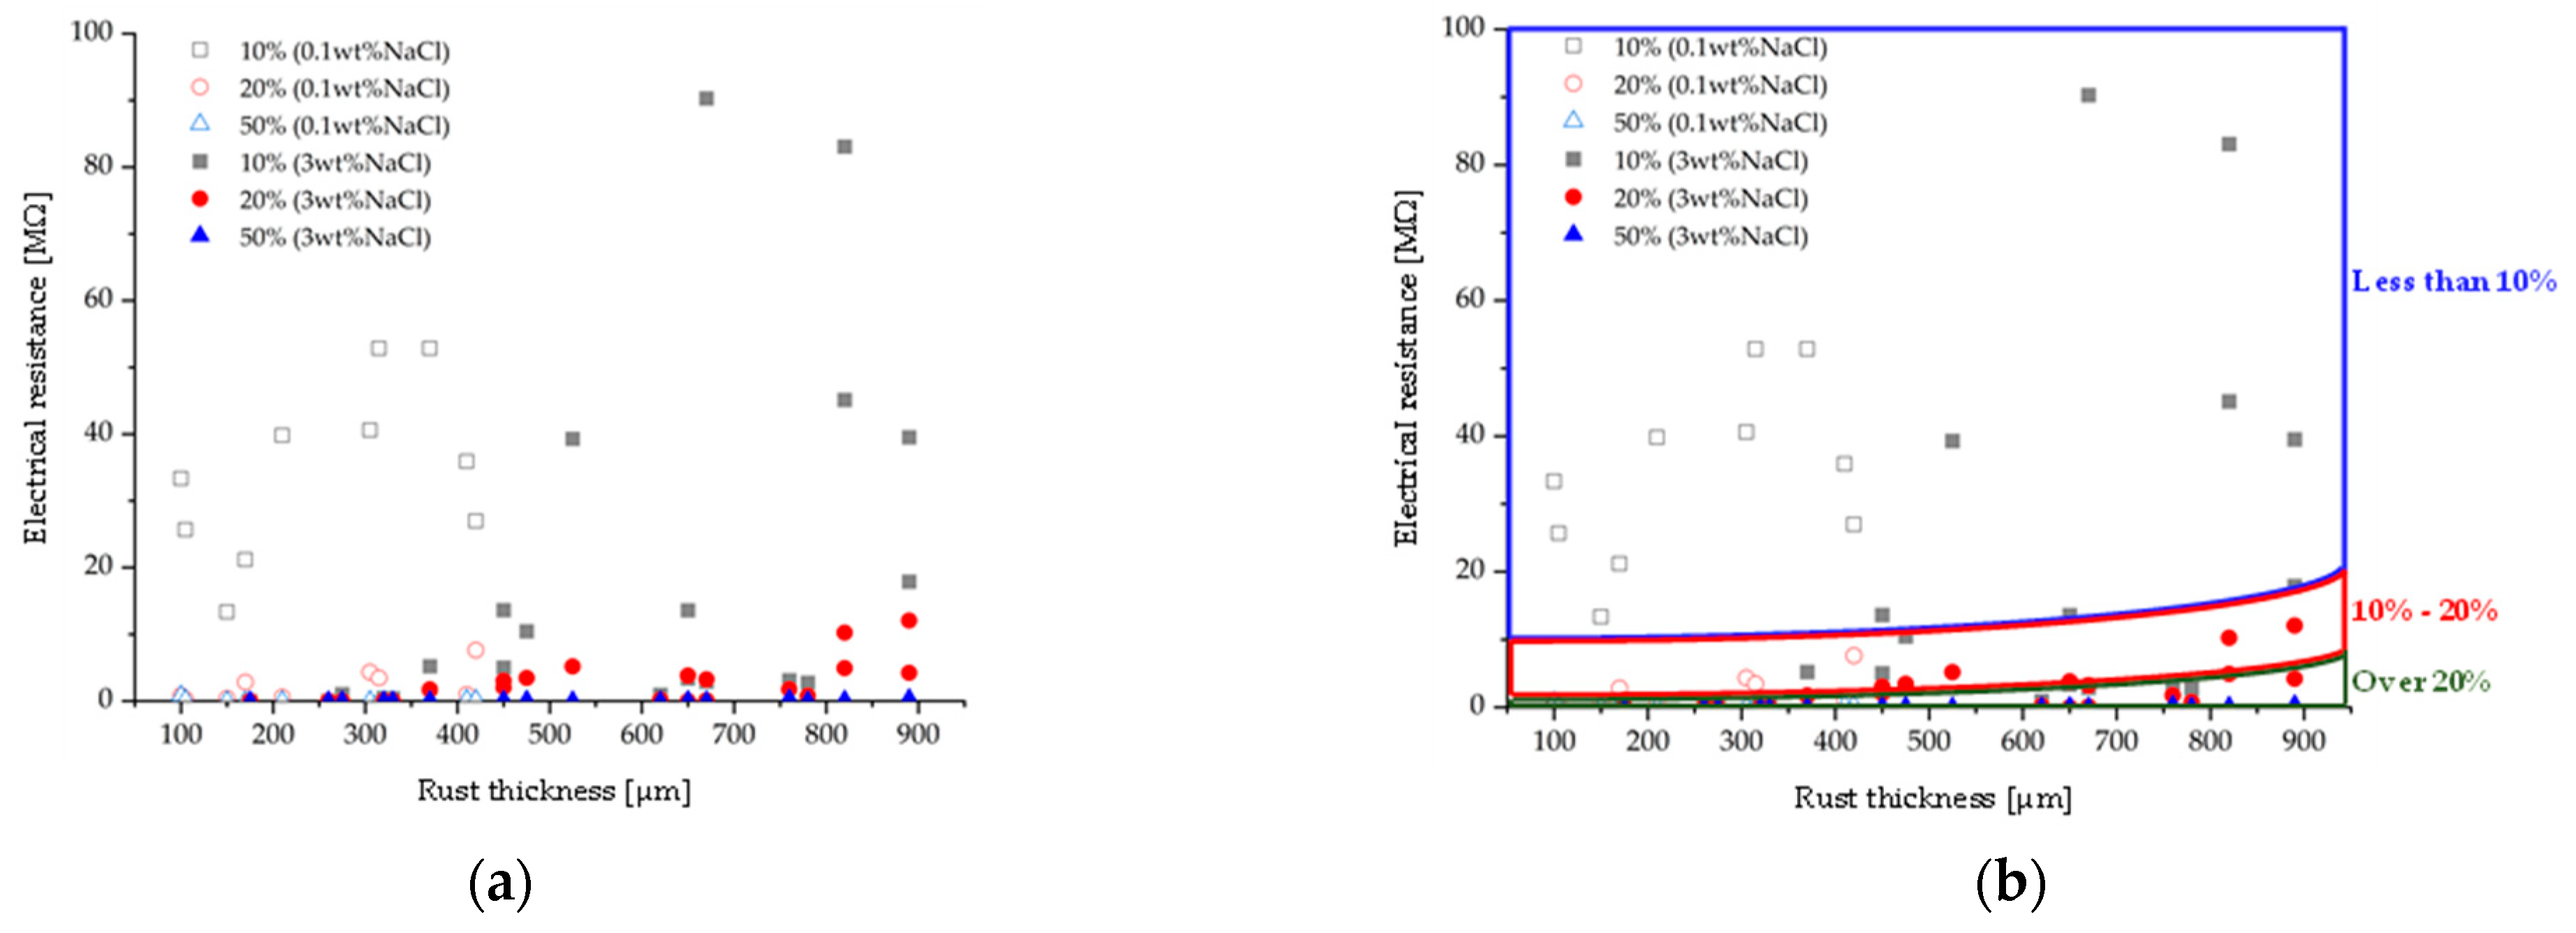
4.3. Prediction of Water Retention Ratio

Figure 13a,b are summarized in Figure 14, which shows the relationship between the R10, R20, and R50 of 0.1 wt% and 3 wt% NaCl solution-supplied specimens and rust thickness. The areas of electrical resistance in water retention ratios of less than 10%, 10–20%, and more than 20% are drawn in Figure 14b. When the rust thickness and the electrical resistance are measured and then plotted on this figure, the water retention ratio can be projected to be less than 10%, 10–20%, or more than 20%. This diagram is, however, based only on the above test results and the number of specimens is small; therefore, its prediction accuracy is only indicative of a general trend.

5. Discussion

In this research, a method for predicting water retention ratio, by measuring electrical resistance and rust thickness, is suggested. This method helps to maintain weathering steel bridges by detecting wetness areas, i.e., corrosive areas, with non-destructive testing. It is also useful in checking or predicting corrosion environments by measuring the behavior of the water retention ratio over the course of a day.
As a trial, the electrical resistance and rust thickness of an actual weathering steel bridge in Yamaguchi Prefecture, Japan, are measured. Figure 15a shows the entirety of the bridge; Figure 15b shows the setup of the measurement equipment utilized on the bridge. In this measurement method, temperature and humidity are also measured. The measurements targeted a 70 mm × 70 mm area, and the distance between the measuring sensor is set to 50 mm, replicating the measurements of the specimens. The electrical resistance is measured once every five minutes for 12 h.
Figure 16 shows the measurement results. The average rust thickness in the measurement area is 137 μm. As shown in Figure 16, the electrical resistance started at around 30 MΩ and gradually increased to around 130 MΩ. Then, there is a sharp increase point at 8:00 a.m. From that point, the electrical resistance increased slightly to 350 MΩ and, again, it sharply increased to 500 MΩ at 1:30 p.m. After 3:00 p.m., it rapidly dropped to about 120 MΩ over two hours. The humidity rapidly dropped at 8:00 a.m. and gradually increased from 3:00 p.m. The temperature rose to a peak with a sharp increase at 8:00 a.m. but, from 9:00 a.m. to 6:00 p.m., it registered a flat temperature around 10 °C. It is evident that the electrical resistance becomes low when the humidity is high and the temperature is low.
When plotting the minimum and maximum electrical resistance results from the actual bridge to the diagram, as shown in Figure 14b, both are plotted in the “water retention ratio is less than 10%” area. From this result, it is clear that the measured area’s rust layer has a small amount water, and this area can be assumed to be a low-corrosive environment.
With regard to the actual bridge, there is no known method for gauging the exact water retention ratio. Thus, into the future, we will continue to provide specimens that can measure the mass exposed at the actual bridge and measure it to confirm the accuracy of this measurement method. It is worth noting that the electrical resistance measured at the actual bridge is higher than that of the specimens. This variance may be caused by differences in the amount of Cl in the rust layer, the cross-sectional structure of the rust layer (i.e., how porous it is), or rust composition. In this study, analysis involving the destruction of the specimens was avoided when repeatedly measuring electrical resistance; however, the detailed information the study produced on rust layers should be analyzed. To further understand the underlying causes, we will prepare specimens according to more varied parameters, varying the concentration of the supplied NaCl solution as well as rust thickness to measure electrical resistance. The cross-sectional observations and rust composition analyses will also be investigated for these specimens. In addition, as shown above, the temperature and humidity of the measurement environment caused differences in electrical resistance. The effect of temperature and humidity will be further investigated for the specimens and actual bridges as well.
Regarding the electrical resistance measuring results of the prepared specimens, it dispersed, and the amount of data is still small. To reduce this dispersion, applying the fixing method for the sensor, and measuring intervals, will be considered. In addition, more data will be collected to improve the accuracy of the water retention ratio prediction diagram.

6. Conclusions

In this research, the fundamental data were collected as preliminary considerations to develop a method for measuring water retention in the rust layer. Additionally, a prediction method for water retention ratio in the rust layer was suggested, that of measuring electrical resistance and rust thickness. The conclusions are as follows:
(1)
Based on the relationship between electrical resistance and the mass of retained water in the rust layer, it was found that electrical resistance increases as the retained water decreases.
(2)
It was also shown that, for a comparable amount of water retention, the electrical resistance decreases as the amount of NaCl supplied to the specimen increases.
(3)
The water retention ratio defined in this research was calculated by dividing the mass of the water-retained specimen by the mass of the full water-retained specimen. It was found that the electrical resistance decreases as the amount of NaCl supplied to the specimen increases, for the same water retention ratio. This trend aligns with conclusion (2).
(4)
Based on these measurement results, a water retention ratio prediction method for measuring electrical resistance and rust thickness is suggested. By plotting the electrical resistance and rust thickness to the suggested diagram, the approximate water retention ratio is predictable.
(5)
This diagram, however, still has a small number of specimen results, so its prediction accuracy is only indicative of a general trend. To improve its accuracy, more data will be collected.

Author Contributions

Conceptualization, R.H. and T.A.; methodology, R.H., R.Y. and T.A.; software, R.Y.; validation, R.H., R.Y. and T.A.; formal analysis, R.Y.; investigation, R.H. and R.Y.; resources, R.H. and T.A.; data curation, R.H.; writing—original draft preparation, R.H.; writing—review and editing, R.H. and T.A.; visualization, R.H. and R.Y.; supervision, T.A.; project administration, R.H.; funding acquisition, R.H. All authors have read and agreed to the published version of the manuscript.

Funding

This research received no external funding.

Data Availability Statement

The data presented in this study are available on request from the corresponding author. The data are not publicly available due to their containing information that could compromise the privacy of the bridge administrator.

Acknowledgments

This research was supported by the HIRAKU-Global Program, which is funded by MEXT’s “Strategic Professional Development Program for Young Researchers”.

Conflicts of Interest

Author Ryotaro Yoneyama was employed by the company IHI Infrastructure Systems Co., Ltd. The remaining authors declare that the research was conducted in the absence of any commercial or financial relationships that could be construed as a potential conflict of interest.

References

  1. Vit, K.; Viktor, U.; Katerina, K. Development and failures of corrosion layers on typical surfaces of weathering steel bridges. Eng. Fail. Anal. 2016, 69, 147–160. [Google Scholar] [CrossRef]
  2. Agnieszka, K.; Leszek, K.; Izabela, K.; Damian, W.; Katarzyna, Z.; Urszula, P.; Tomasz, W.; Katarzyna, B. Corrosion assessment of a weathering steel bridge structure after 30 years of service. Materials 2021, 14, 3788. [Google Scholar] [CrossRef]
  3. Shuichi, H.; Takayuki, K.; Hideaki, M.; Masato, Y. Taxonomy for protective ability of rust layer using its composition formed on weathering steel bridge. Corros. Sci. 2007, 49, 1131–1142. [Google Scholar] [CrossRef]
  4. ISO-9223; Corrosion of Metals and Alloys—Corrosivity of Atmospheres—Classification, Determination and Estimation. ISO: Geneva, Switzerland, 2012.
  5. Shinohara, T.; Motoda, S.; Oshikawa, W. Evaluation of Corrosivity of Atmosphere by ACM Type Corrosion Sensor. Zairyo-to-Kankyo 2005, 54, 375–382. (In Japanese) [Google Scholar] [CrossRef]
  6. Pei, Z.; Xiao, K.; Chen, L.; Li, Q.; Wu, J.; Ma, L.; Li, X. Investigation of Corrosion Behaviors on an Fe/Cu-Type ACM Sensor under Various Environments. Metals 2020, 10, 905. [Google Scholar] [CrossRef]
  7. Ahn, J.-H.; Jeong, Y.-S.; Kim, I.-T.; Jeon, S.-H.; Park, C.-H. A Method for Estimating Time-Dependent Corrosion Depth of Carbon and Weathering Steel Using an Atmospheric Corrosion Monitor Sensor. Sensors 2019, 19, 1416. [Google Scholar] [CrossRef] [PubMed]
  8. Onda, T.; Nozoe, Y.; Nakajima, R.; Iwasaki, E.; Miura, M. Investigation of time of wetness determination of corroded steel using change in DC current resistance. In Proceedings of the Conference of Kanto Branch of Japan Society of Civil Engineers, Niigata, Japan, 13 March 2014; p. I-68. (In Japanese). [Google Scholar]
  9. Romain, R.; Stéphane, G.; Julien, G.; Ioannis, I.; Stéphanie, B. Reinforced concrete structures: A review of corrosion mechanisms and advances in electrical methods for corrosion monitoring. Constr. Build. Mater. 2021, 269, 121240. [Google Scholar]
  10. Tadeja, K.; Viljem, K.; Andrej, K.; Vili, M.; Branko, B.; Andraž, L. Development of an Electrical Resistance Sensor from High Strength Steel for Automotive Applications. Sensors 2019, 19, 1956. [Google Scholar]
  11. Wang, P.; Wang, p.; Li, Q.; Cheng, X.; Cai, J.; Zhang, D.; Li, X. Study of rust layer evolution in Q345 weathering steel utilizing electric resistance probes. Corros. Sci. 2023, 225, 111595. [Google Scholar] [CrossRef]
  12. Rina, H.; Ryotaro, Y.; Toshihiko, A. Evaluation of water retention of rust layer based on electrical resistance measurement. In Proceedings of the Sixth Australasia and South-East Asia Structural Engineering and Construction Conference (ASEA SEC 6), Sydney, Australia, 29 November 2022; Volume 9, p. STR09. [Google Scholar]
  13. Miki, C.; Ichikawa, A.; Ukai, M.; Takemura, M.; Nakayama, T.; Kihira, H. Proposal for Weathering Alloy Index and Accelerated Corrosion Test Method to Select Weathering Steels. J. Jpn. Soc. Civ. Eng. 2003, 2003, 271–281. (In Japanese) [Google Scholar] [CrossRef] [PubMed]
Figure 1. Corrosion acceleration test cycle.
Buildings 13 02921 g001
Figure 2. Electrical resistance measuring procedure.
Buildings 13 02921 g002
Figure 3. The relationship between the mass of retained water and the electrical resistance of 0.1 wt% NaCl solution-supplied specimens with the vertical axis of: (a) 0 to 50 MΩ; (b) 0 to 4.0 MΩ.
Buildings 13 02921 g003
Figure 4. The relationship between the mass of retained water and the electrical resistance of 3 wt% NaCl solution-supplied specimens with the vertical axis of: (a) 0 to 50 MΩ; (b) 0 to 4.0 MΩ.
Buildings 13 02921 g004
Figure 5. The electrical resistance comparison between 0.1 wt% and 3 wt% of: (a) 150 and 175 μm rust thickness; (b) 305 and 370 μm rust thickness.
Buildings 13 02921 g005
Figure 6. The relationship between rust thickness and the mass of the drying point with each threshold (0.2 MΩ and 1 MΩ).
Buildings 13 02921 g006
Figure 7. The relationship between the rust thickness and the electrical resistance when the water retain mass is 2.0 mg/cm3 with the vertical axis of: (a) 0 to 250 MΩ; (b) 0 to 25 MΩ.
Buildings 13 02921 g007
Figure 8. The relationship between the rust thickness and the electrical resistance when the water retain mass is 5.0 mg/cm3 with the vertical axis of: (a) 0 to 250 MΩ; (b) 0 to 25 MΩ.
Buildings 13 02921 g008
Figure 9. The relationship between the rust thickness and the electrical resistance when the water retain mass is 10 mg/cm3 with the vertical axis of: (a) 0 to 250 MΩ; (b) 0 to 25 MΩ.
Buildings 13 02921 g009
Figure 10. The relationship between the water retention ratio and the electrical resistance of 0.1 wt% NaCl solution-supplied specimens.
Buildings 13 02921 g010
Figure 11. The relationship between the water retention ratio and the electrical resistance of: (a) 0.1 wt% specimens with 210 μm; (b) 0.1 wt% specimens with 315 μm; (c) 3 wt% specimens with 275 μm; (d) 3 wt% specimens with 620 μm rust thickness.
Buildings 13 02921 g011
Figure 12. The electrical resistance in the 10% water retention ratio (R10) with the rust thickness.
Buildings 13 02921 g012
Figure 13. The relationship between rust thickness and electrical resistance for each 10% water retention ratio of: (a) 0.1 wt% NaCl solution-supplied specimen; (b) 3 wt% NaCl solution-supplied specimen.
Buildings 13 02921 g013
Figure 14. The relationship between the R10, R20, and R50 of 0.1 wt% and 3 wt% NaCl solution-supplied specimens and rust thickness: (a) all data; (b) divided area of electrical resistance in water retention ratios of less than 10%, 10–20%, and more than 20%.
Buildings 13 02921 g014
Figure 15. Pictures of the measured actual bridge: (a) entirety of the bridge; (b) setup of the measurement equipment.
Buildings 13 02921 g015
Figure 16. Actual bridge measurement results for electrical resistance, temperature, and humidity.
Buildings 13 02921 g016
Table 1. List of the prepared specimens. These specimens are prepared for each rust thickness range with two concentrations of NaCl solution supplied.
Rust Thickness (μm)100–200200–300300–400400–500500–600600–700700–800800–900Total Number of Specimens
0.1 wt% NaCl5163----15
3 wt% NaCl1243153423
Table 2. Electrical conductivity of tap water, 0.1 wt%, 1 wt%, and 3 wt% NaCl solution.
Tap Water0.1 wt% NaCl1 wt% NaCl3 wt% NaCl
Conductivity [μS/m]2020017004600
Temperature [°C]24.124.124.123.8
Table 3. Coefficient of determination (COD) for 0.1 wt% NaCl-supplied specimens.
Rust Thickness (μm)100105150170210305315350370390410420
COD0.950.930.900.880.950.820.310.830.760.820.600.83
Table 4. Coefficient of determination (COD) for 3 wt% NaCl-supplied specimens.
Rust Thickness (μm)175260275320330370450475525620650670760780820890
COD0.660.840.190.570.540.850.590.530.350.870.830.840.620.410.830.54
Disclaimer/Publisher’s Note: The statements, opinions and data contained in all publications are solely those of the individual author(s) and contributor(s) and not of MDPI and/or the editor(s). MDPI and/or the editor(s) disclaim responsibility for any injury to people or property resulting from any ideas, methods, instructions or products referred to in the content.

