

Simulation-Driven and Optimization-Based Design of an Architectural Building: A Case Study of a Space Tourism Building in the UAE

 ,
,  ,
,
Abstract
:1. Introduction
- Achieving optimized environmental forms by demonstrating the effectiveness of optimization analysis in improving the design process.
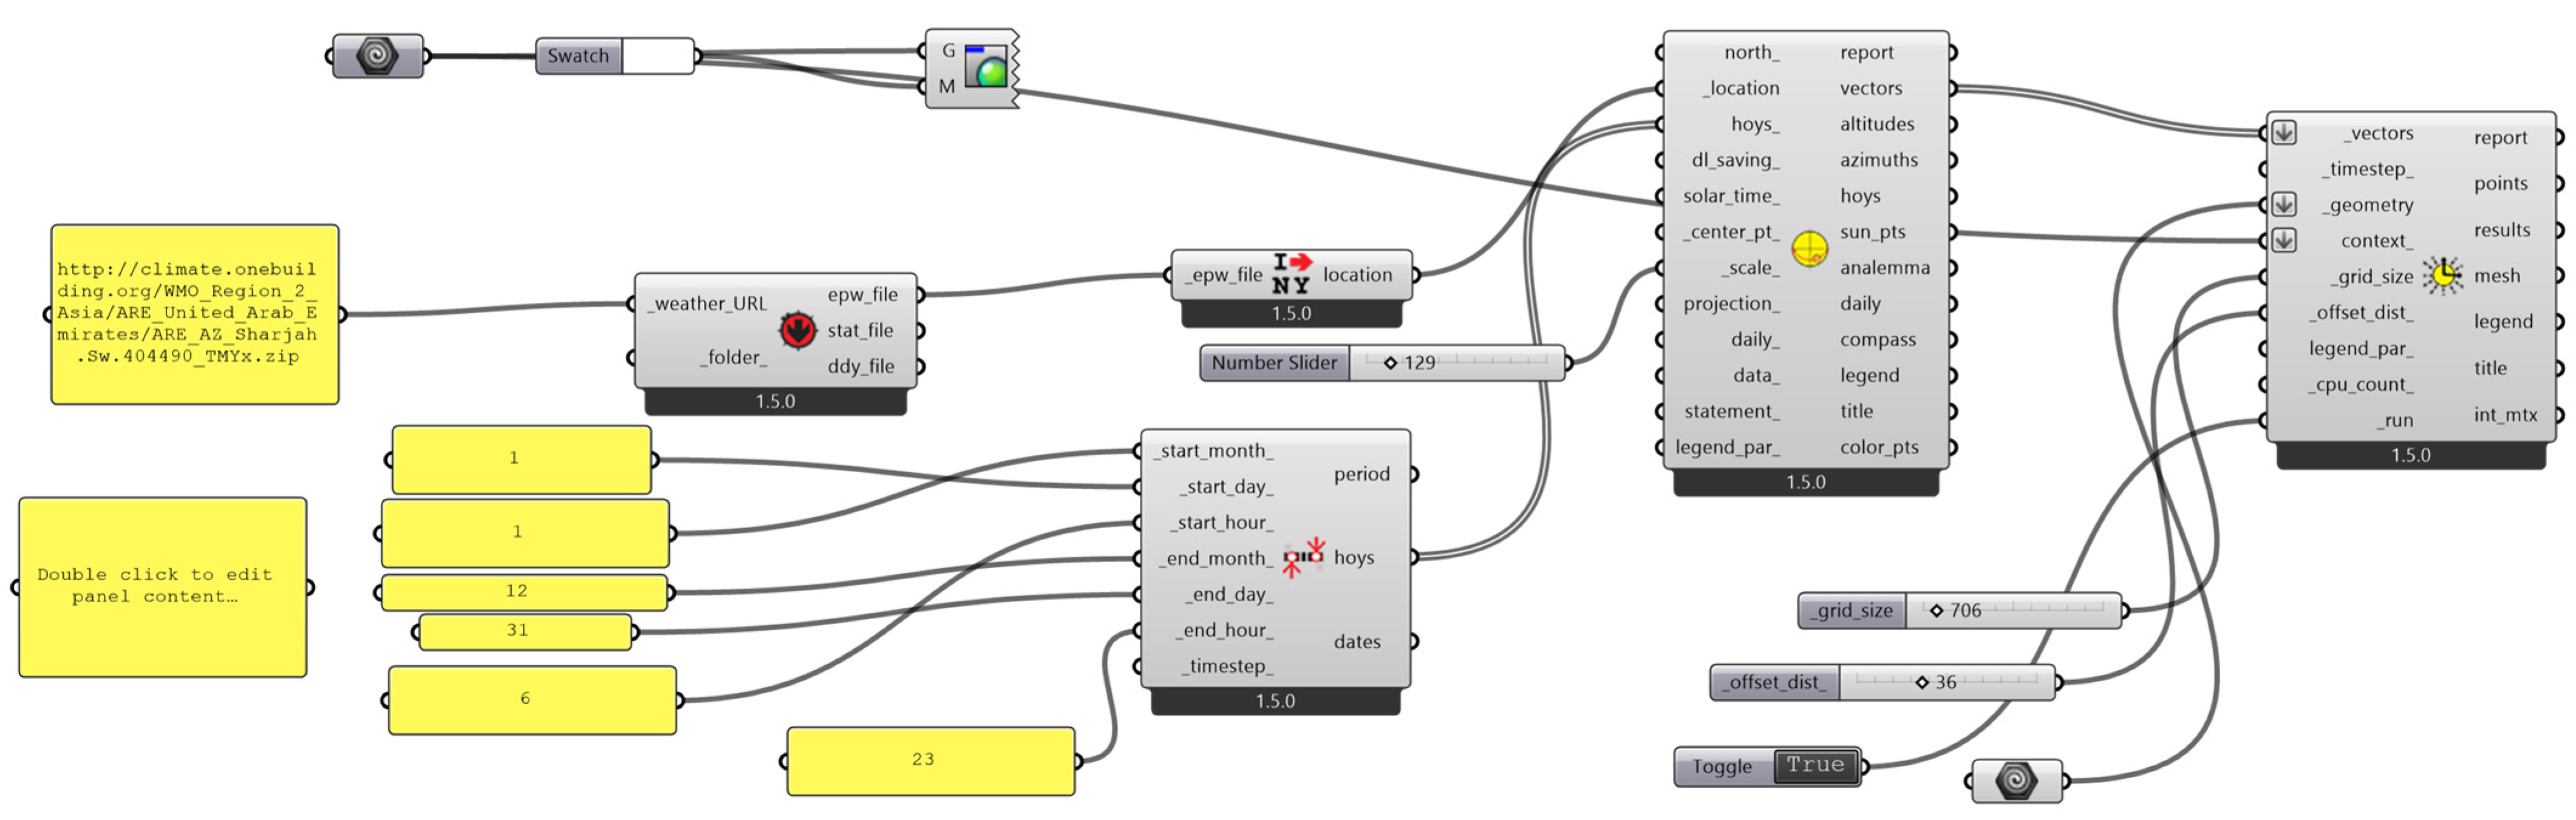
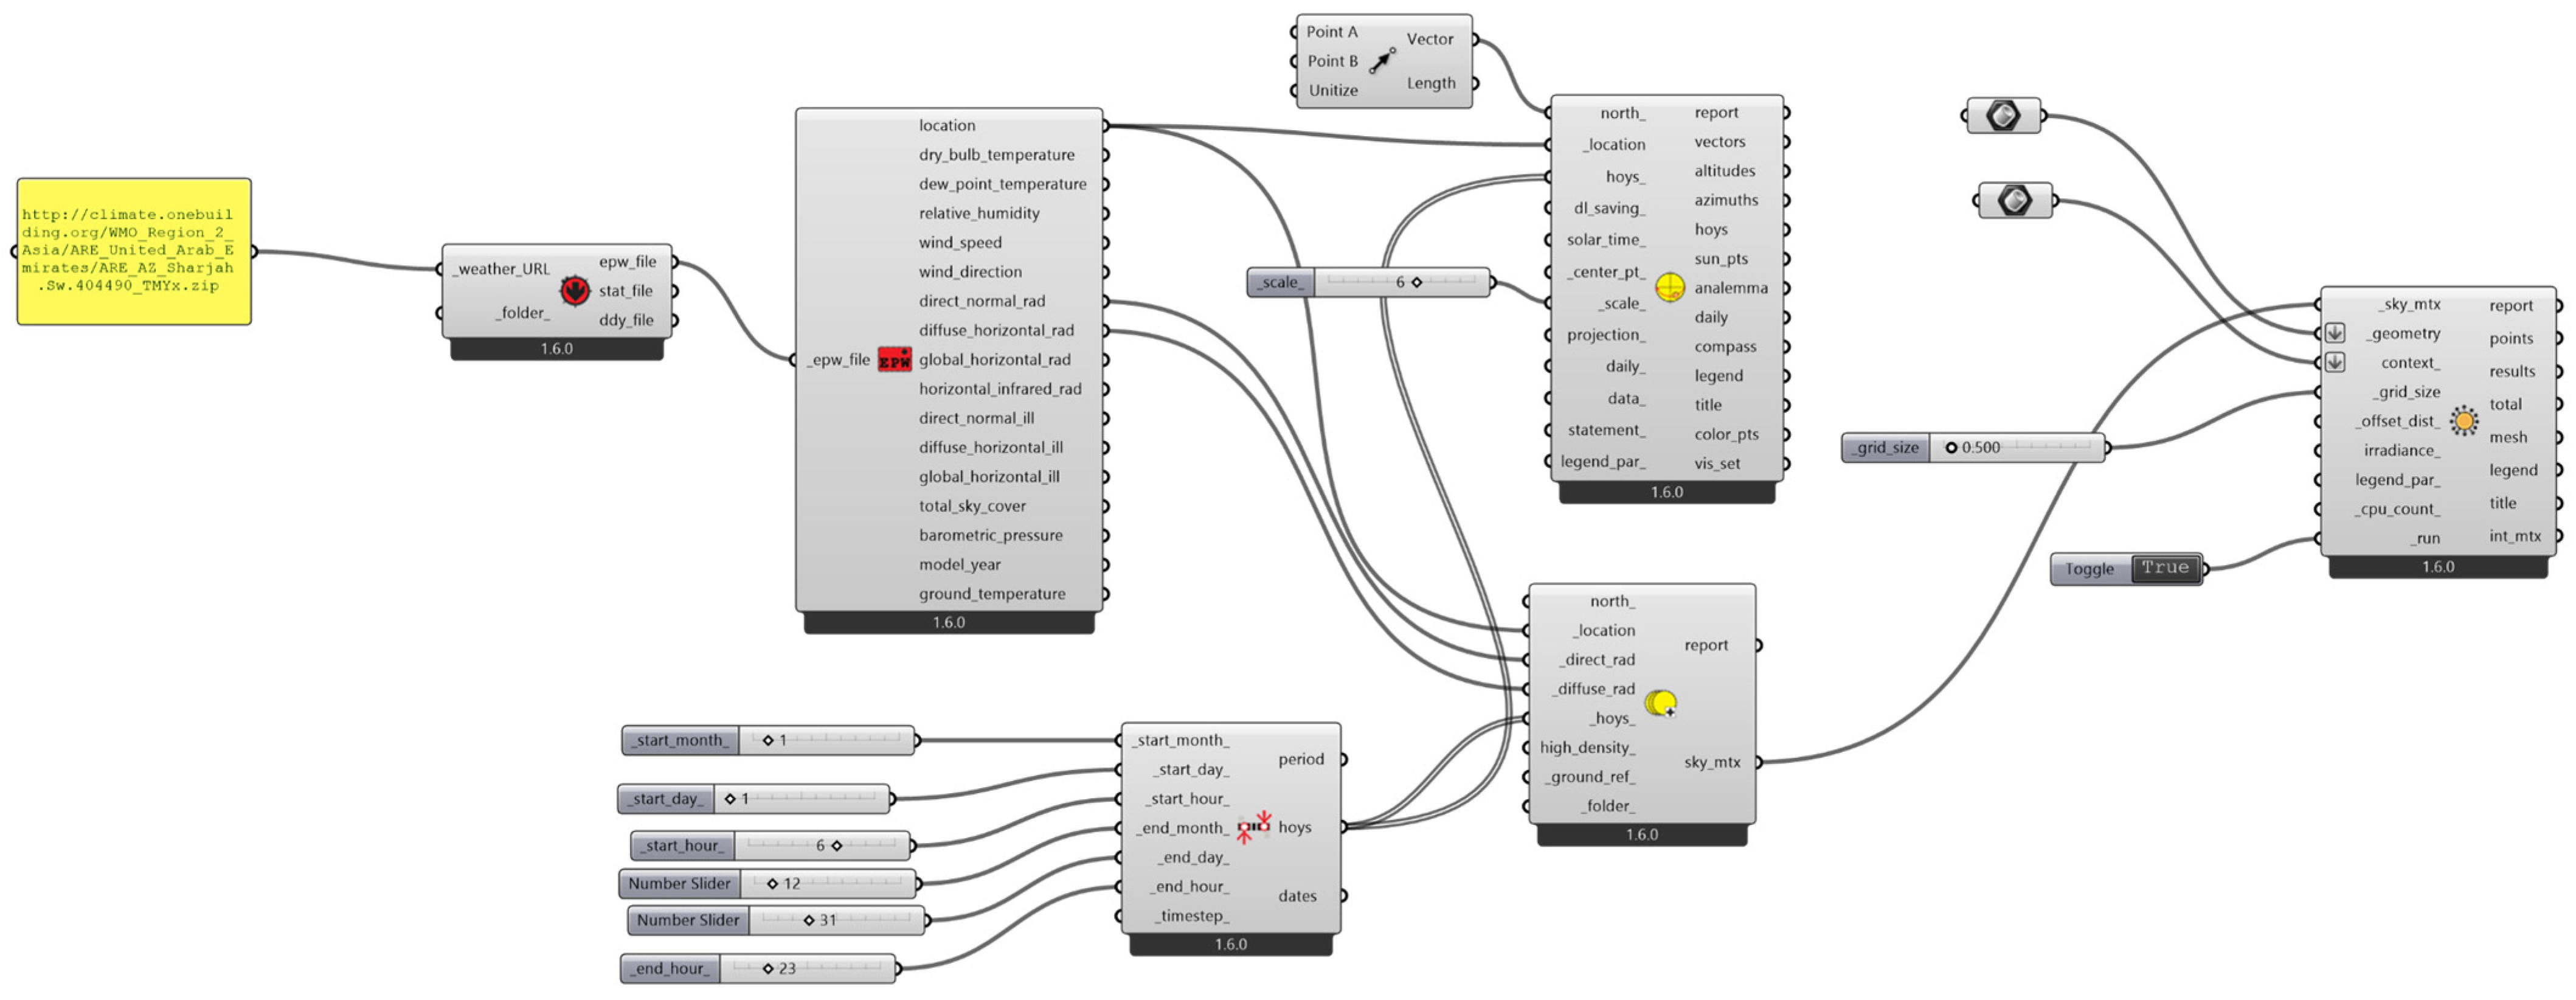
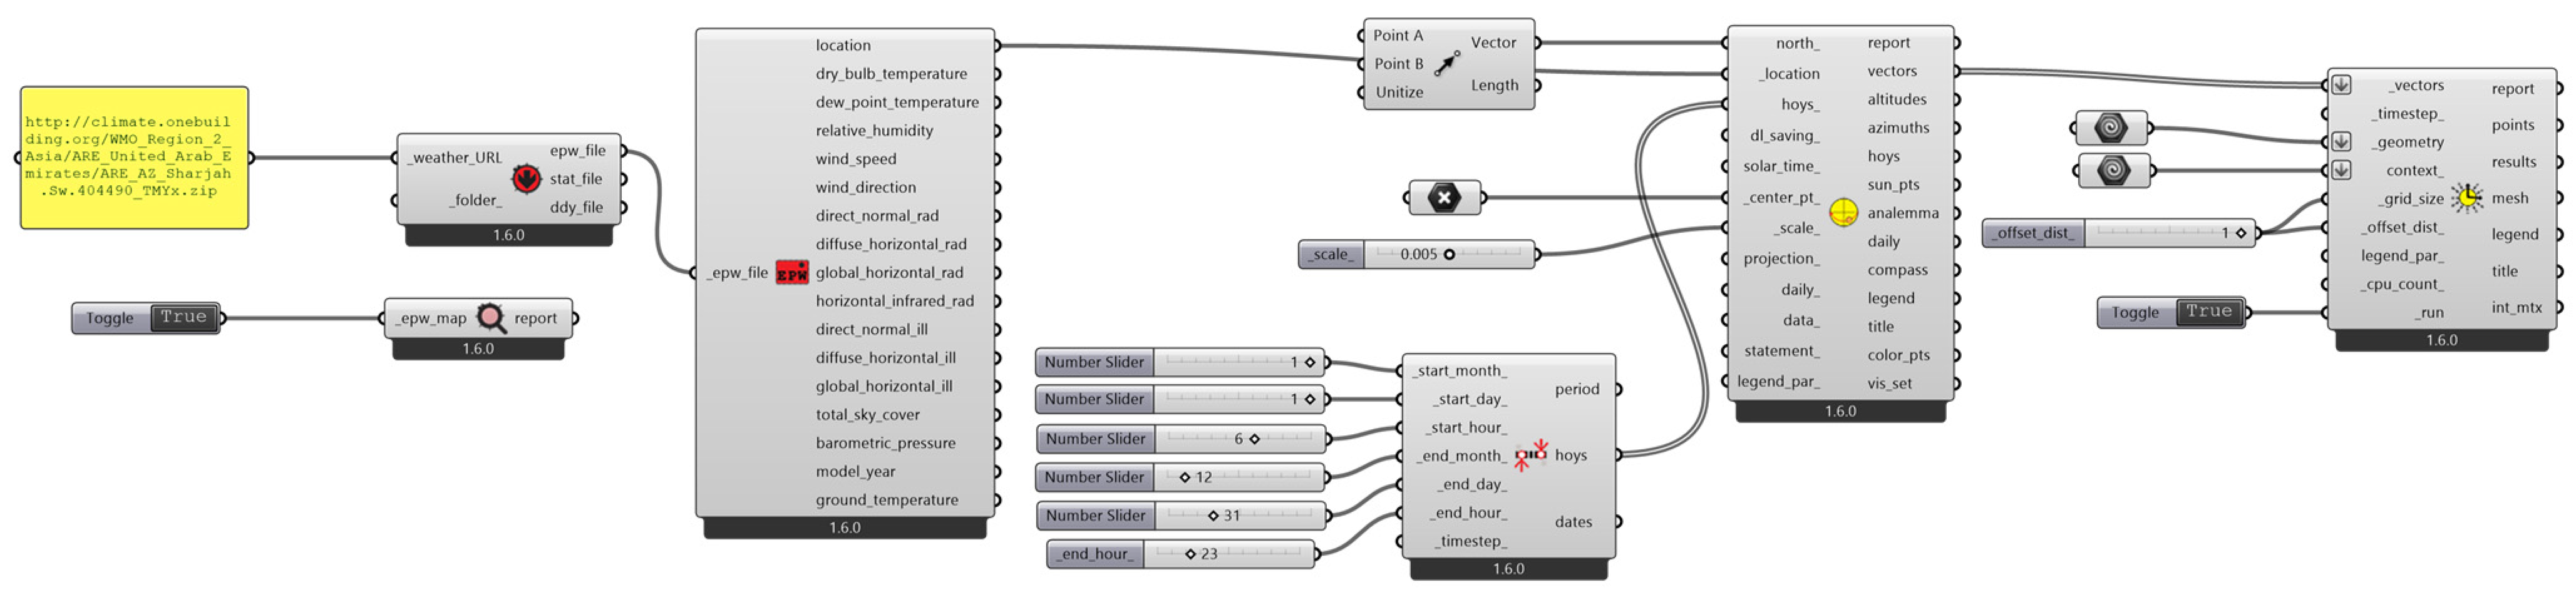
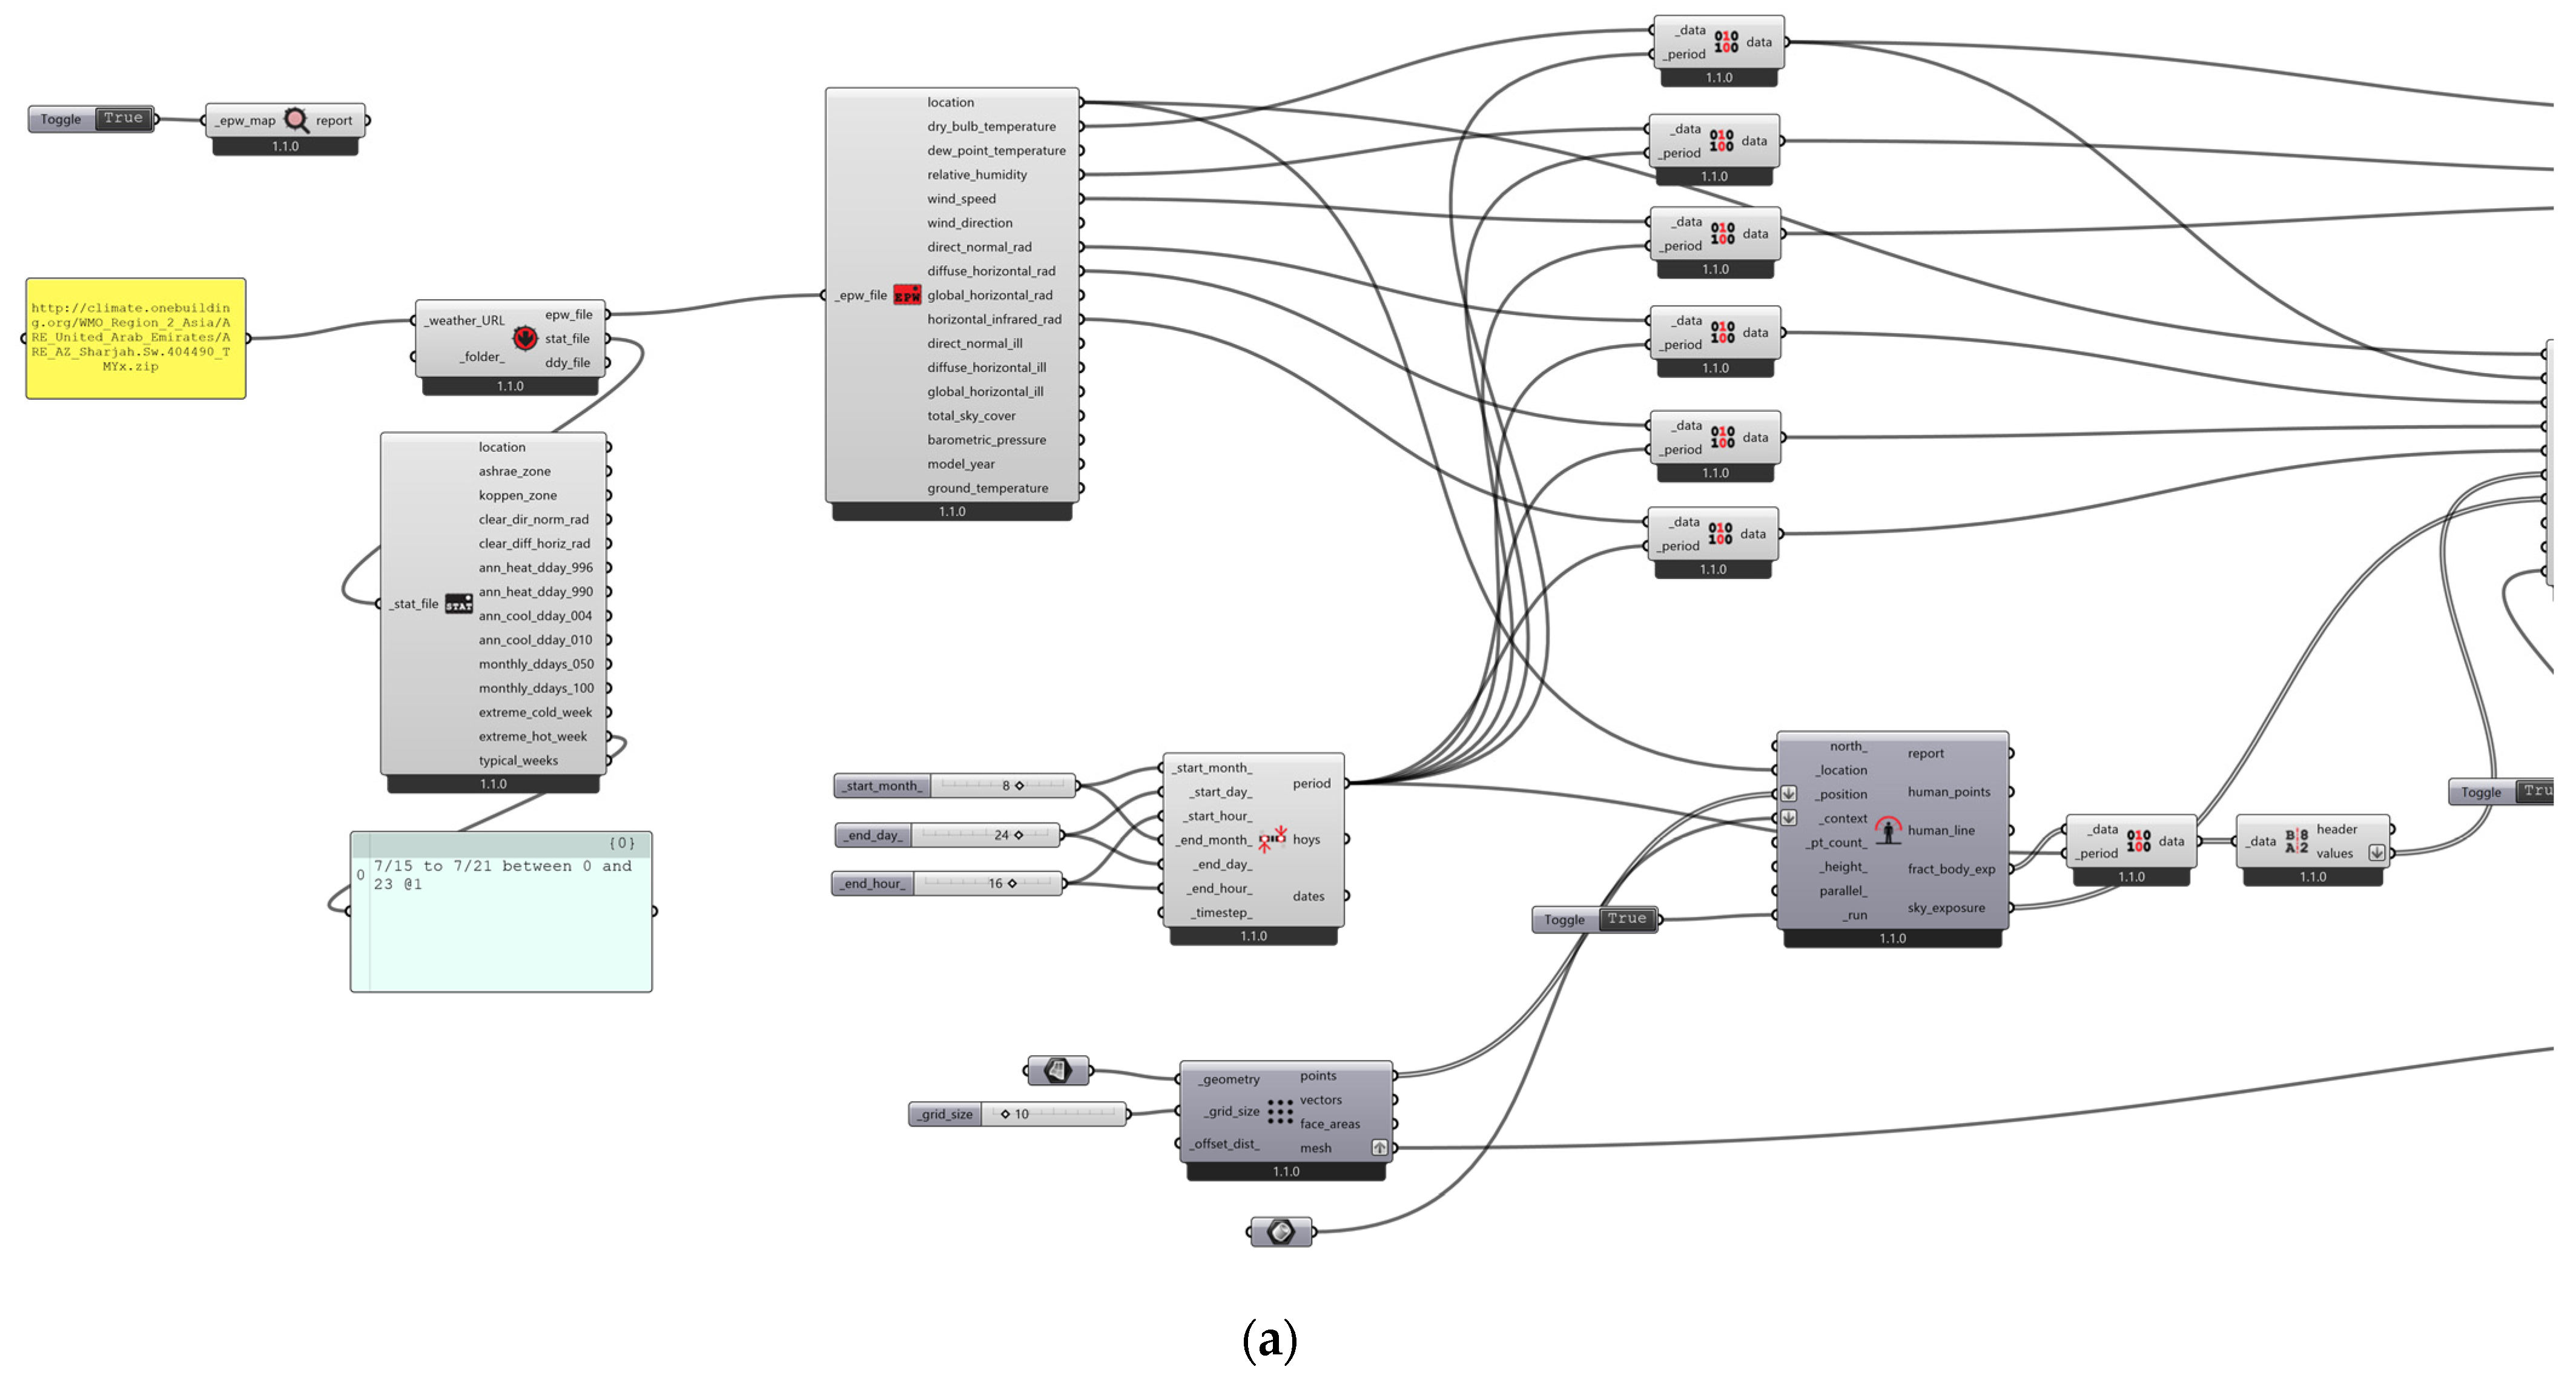
- Employing different computational tools to optimize various design parameters like sun path, radiation, shadow, outdoor comfort, and wind simulations.
- Using parametric tools to perform rapid and accurate finite element analysis (FEA) through Karamba3D to understand how our design might behave under various physical conditions.
- Providing architects and designers with advanced tools for designing more optimal and functional buildings while reducing design time and expenses. This contribution will result in more innovative and impactful designs in the future.
1.1. Space Companies
1.2. Comparison between Spaceports and Airports
1.3. Case Studies
1.3.1. Spaceport America
1.3.2. Abu Dhabi Conceptual Design
1.3.3. Outcomes
- Diverse launch options: Spaceport America offers both horizontal and vertical launch areas, providing flexibility for different types of space missions.
- Varied main zones: the facility includes various zones for different purposes, including hangars for spacecraft storage and maintenance, terminals for passenger and cargo processing, administrative offices, and a training center.
- Remote location: its remote location in the desert ensures safety by being isolated from high-population areas and reduces the risk of accidents affecting populated regions.
- Limited geographical coverage: having only a horizontal launch area might limit the types of missions and vehicles that can be accommodated.
- Infrastructure costs: managing and maintaining a large facility like this in a remote desert location can be costly.
- Environmental impact: developing desert sites may have environmental consequences that need to be managed.
- Design of launch areas:
- Horizontal launch area.
- Main zones:
- Hotel;
- Educational and training center.
- Site:
- Located on an artificial island along the coast of Dubai and Abu Dhabi.
- Isolated from high-population areas.
- Unique coastal location: the spaceport’s location on an artificial island provides a picturesque and unique setting for space activities, potentially attracting tourists and enthusiasts.
- Educational focus: the presence of an educational and training center emphasizes the importance of space education and training.
- Safety: like Spaceport America, it benefits from isolation from high-population areas.
- Disadvantages of Abu Dhabi Spaceport include the following:
- Limited launch options: having only a horizontal launch area may limit the types of missions that can be conducted from this spaceport.
- Limited facilities: the spaceport offers fewer diverse main zones compared to Spaceport America, potentially limiting its functionality.
- Potentially higher costs: building and maintaining infrastructure on an artificial island could be more expensive and challenging than building in a desert location.
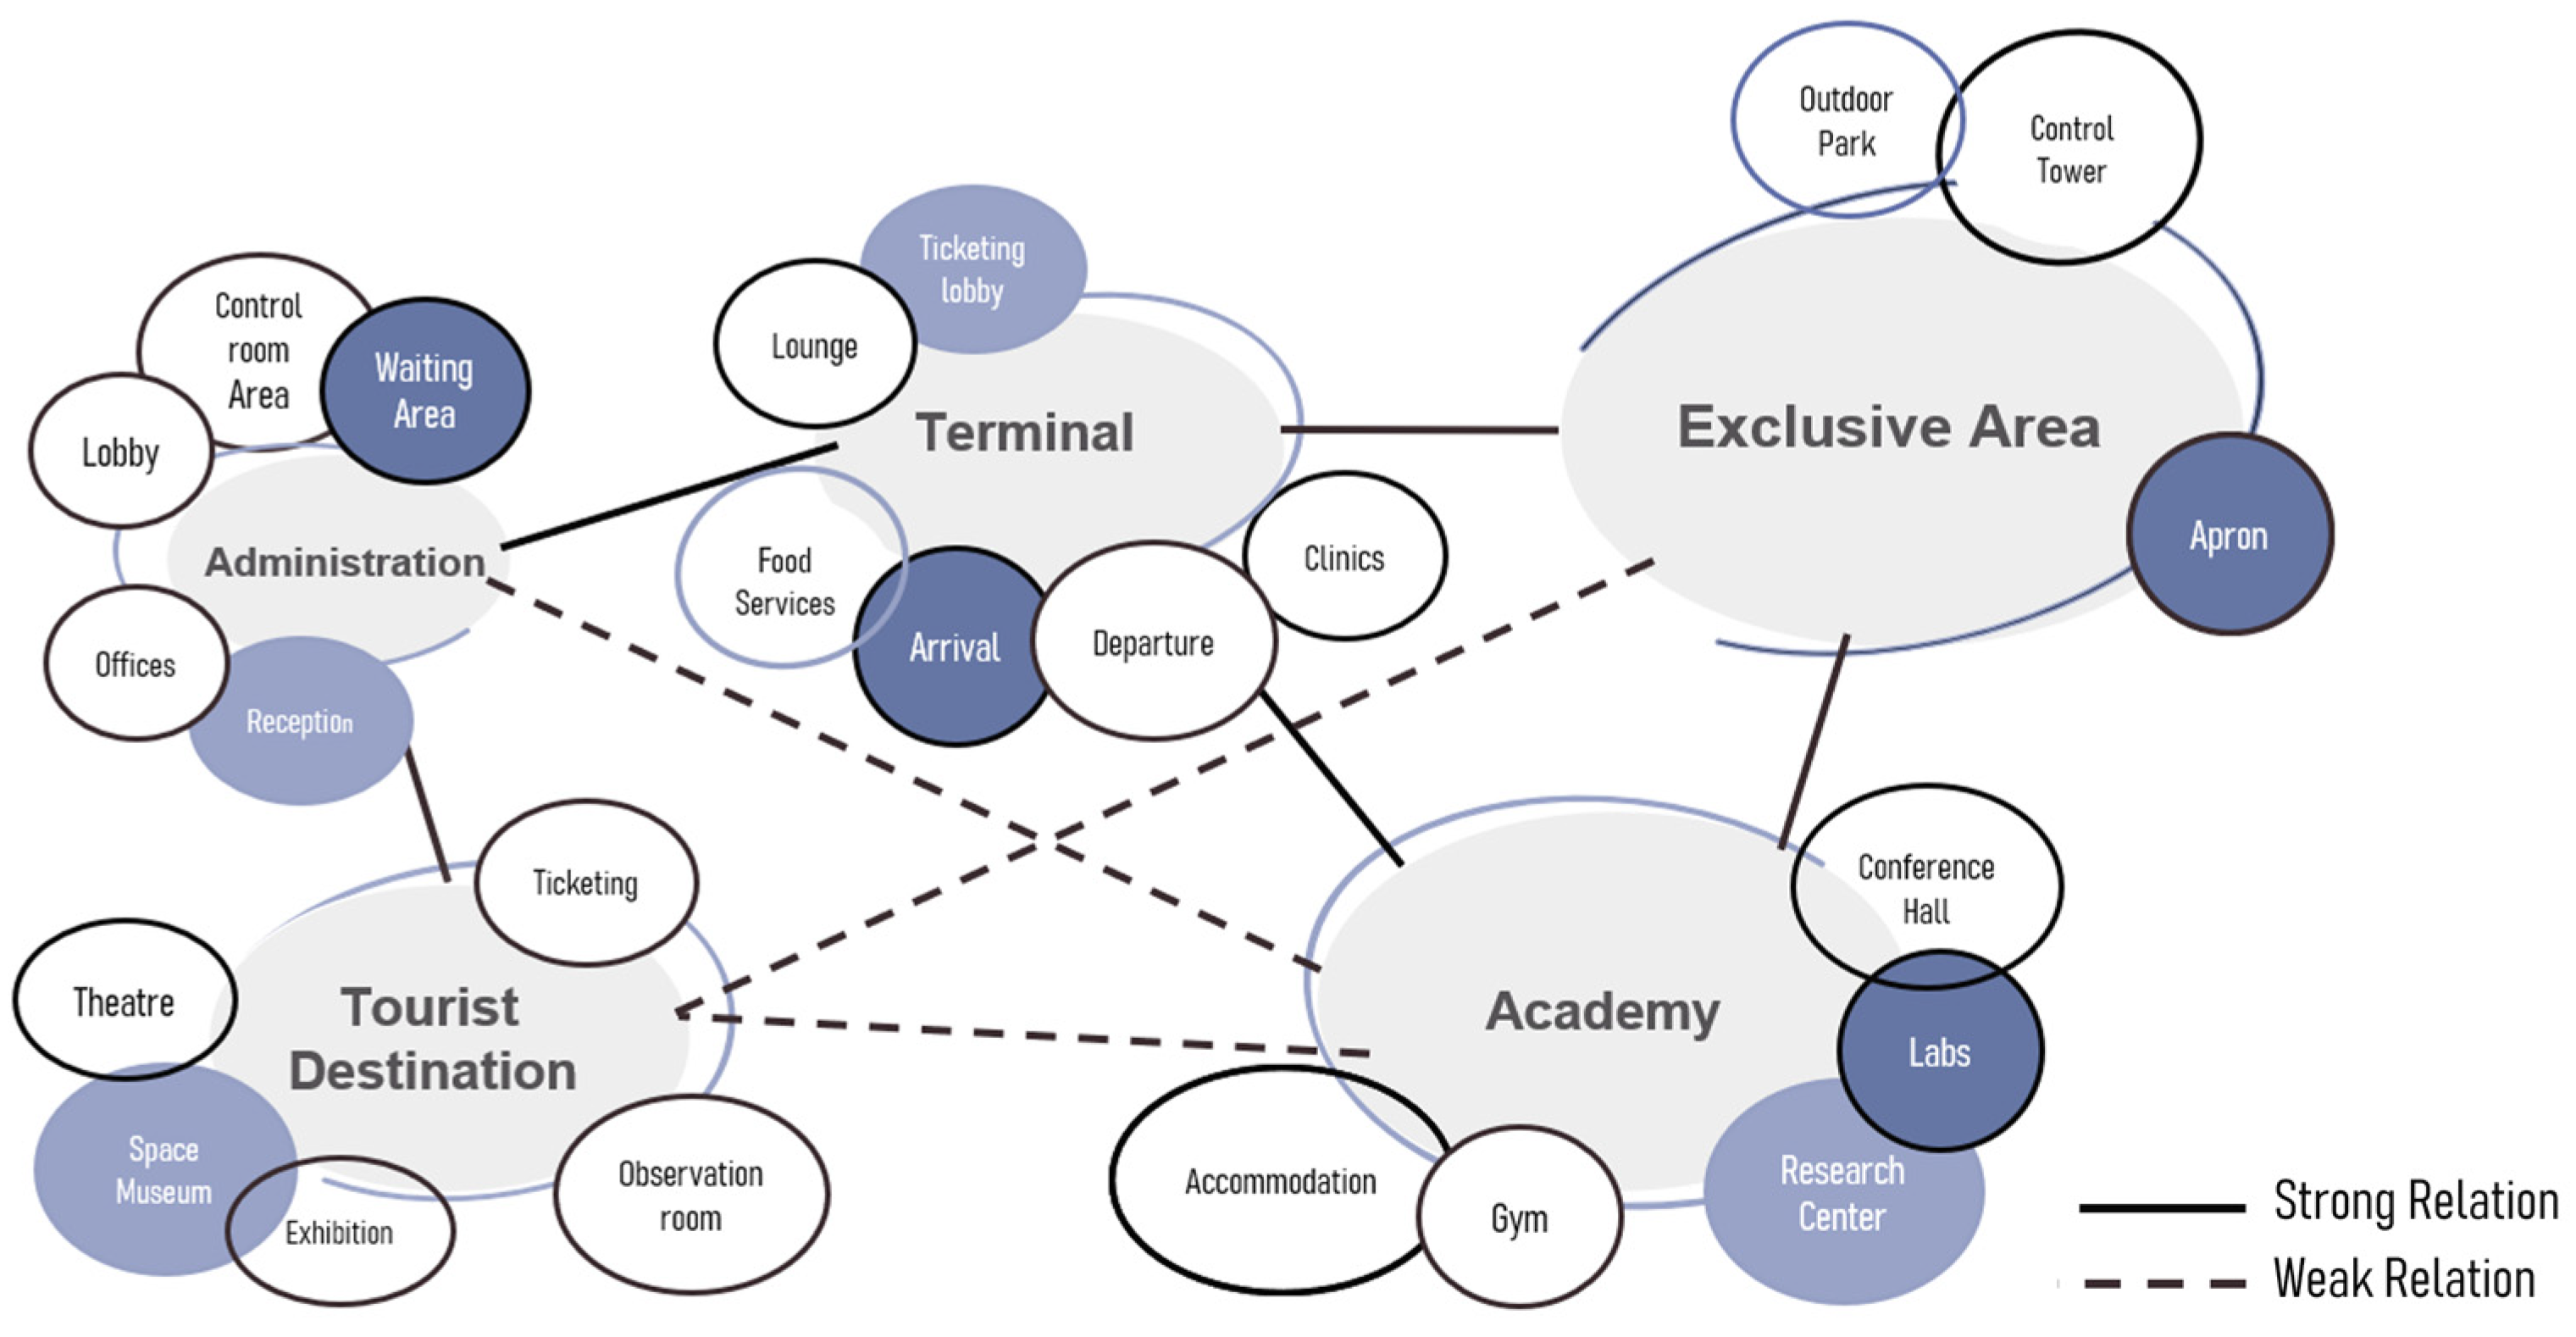
2. Project Program Components and Site
2.1. Project Program
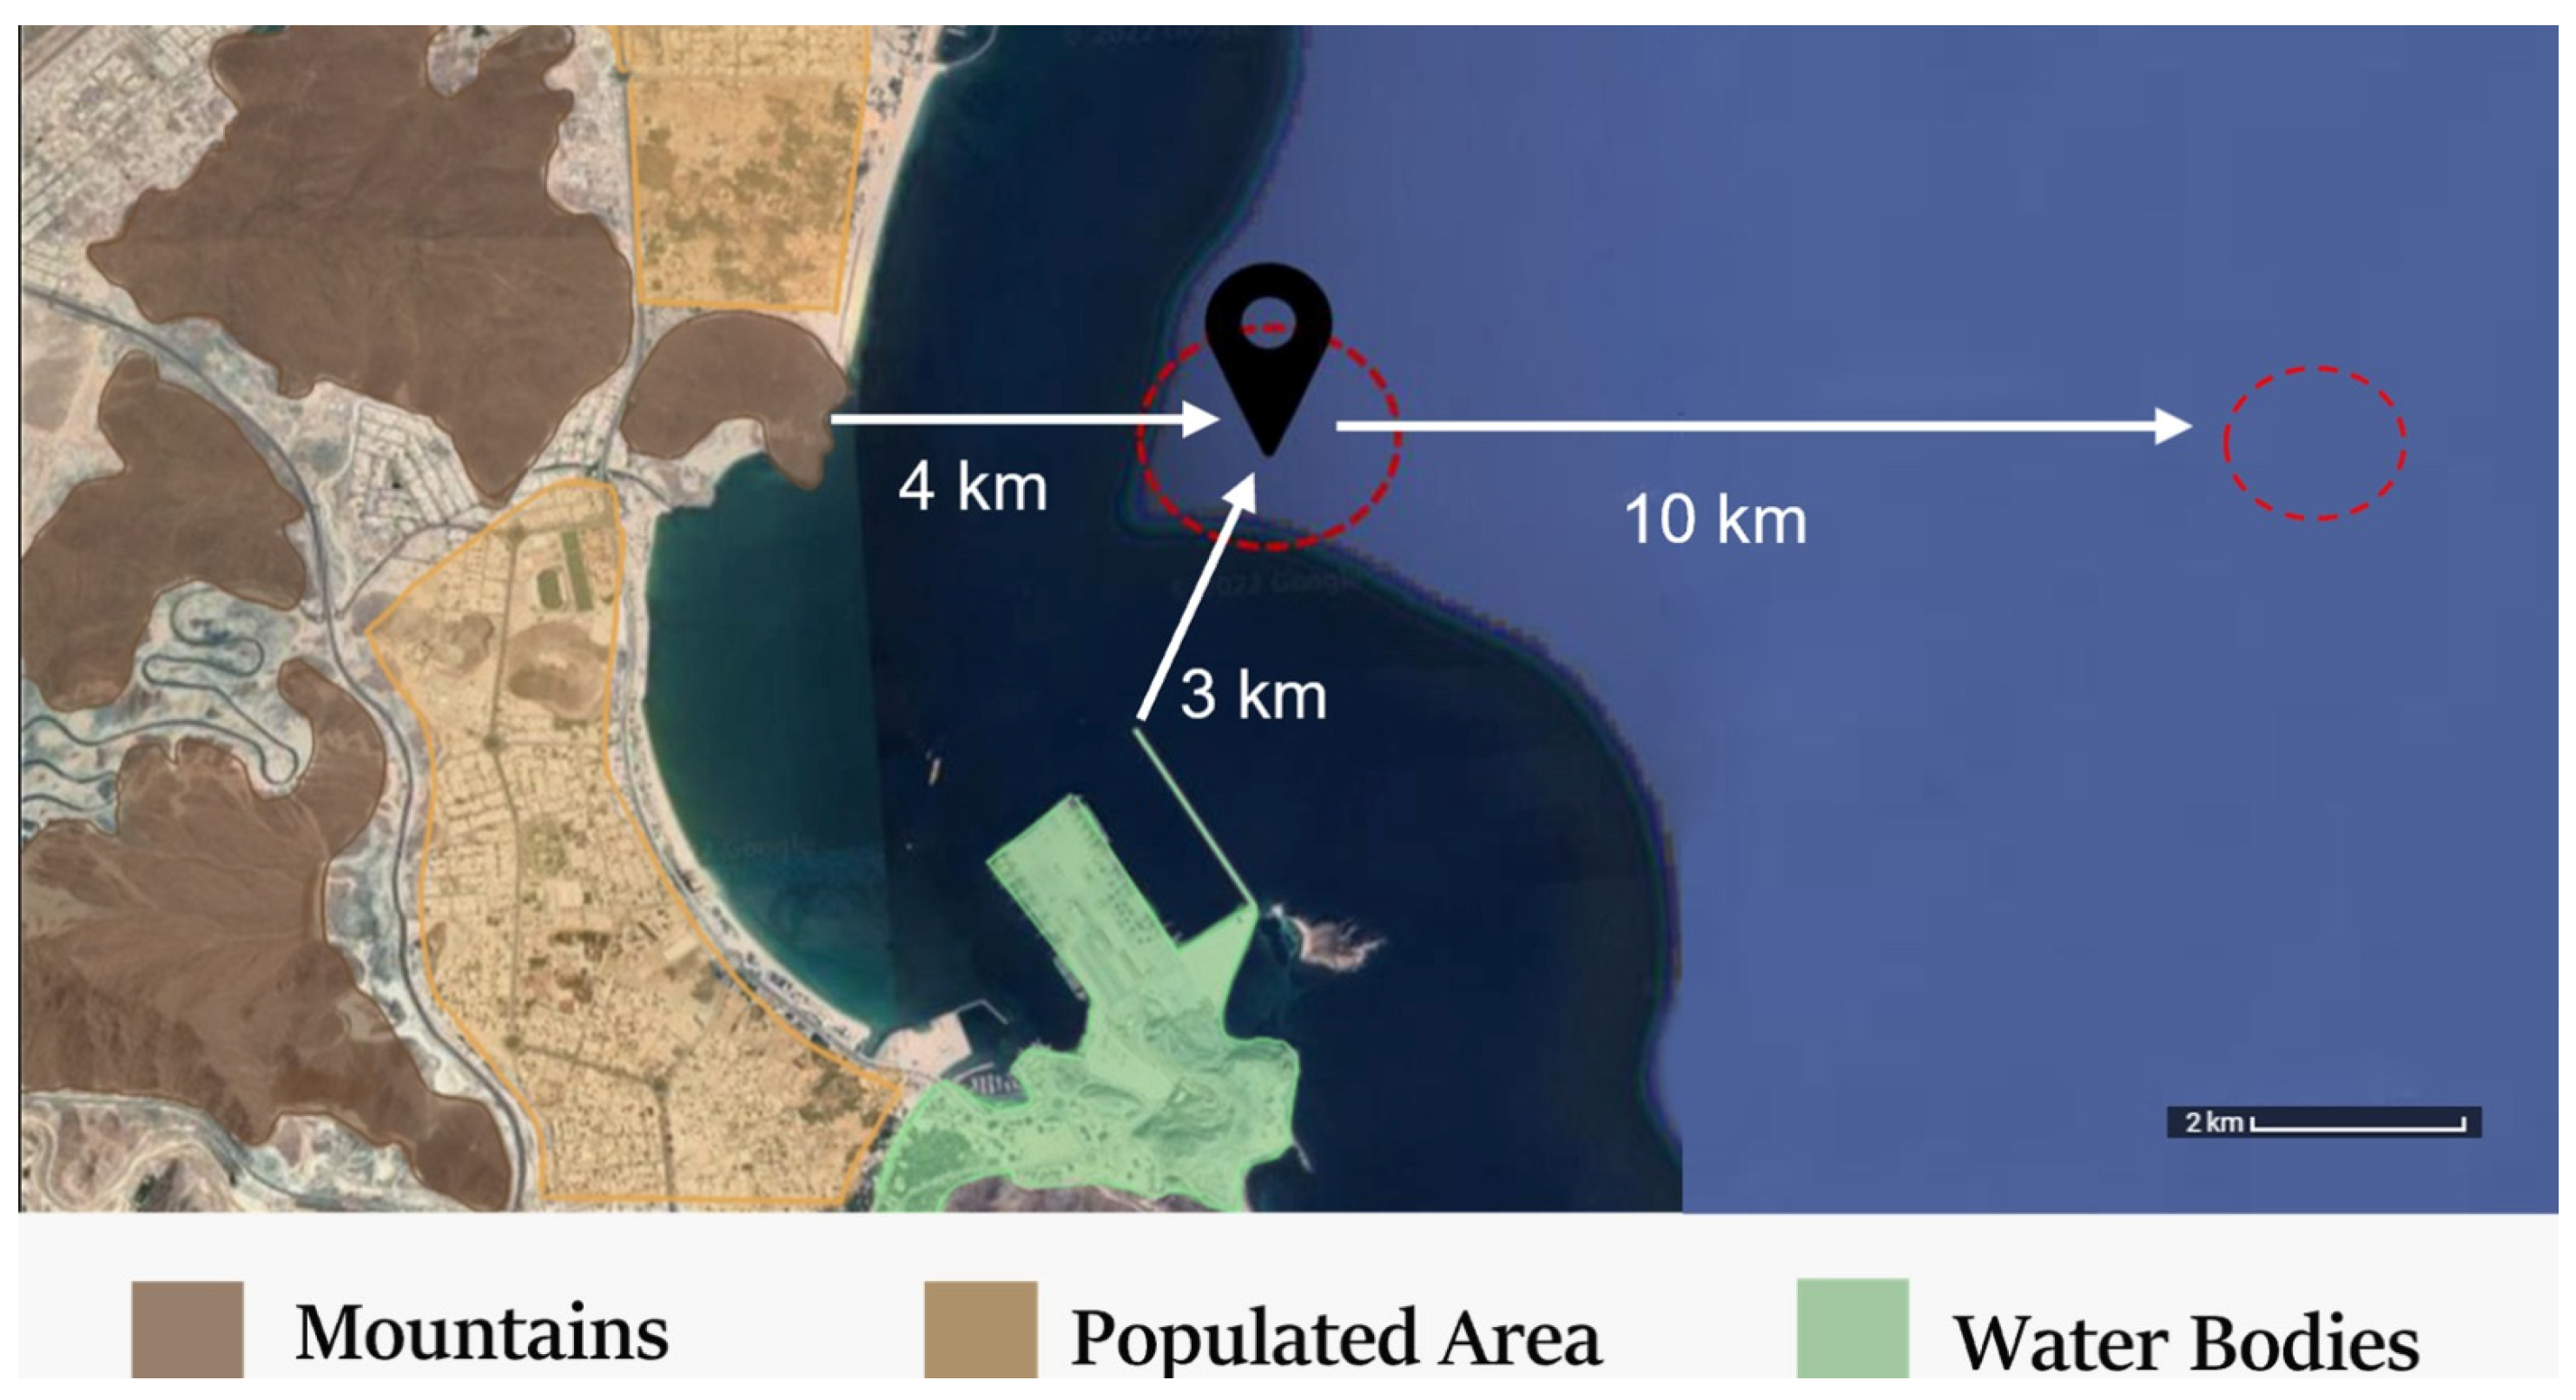
2.2. Project Site Selection Criteria
2.3. Proposed Sites
Site Selection
3. Design Methodology
3.1. Performance-Based Building Massing and Facade Design Optimization
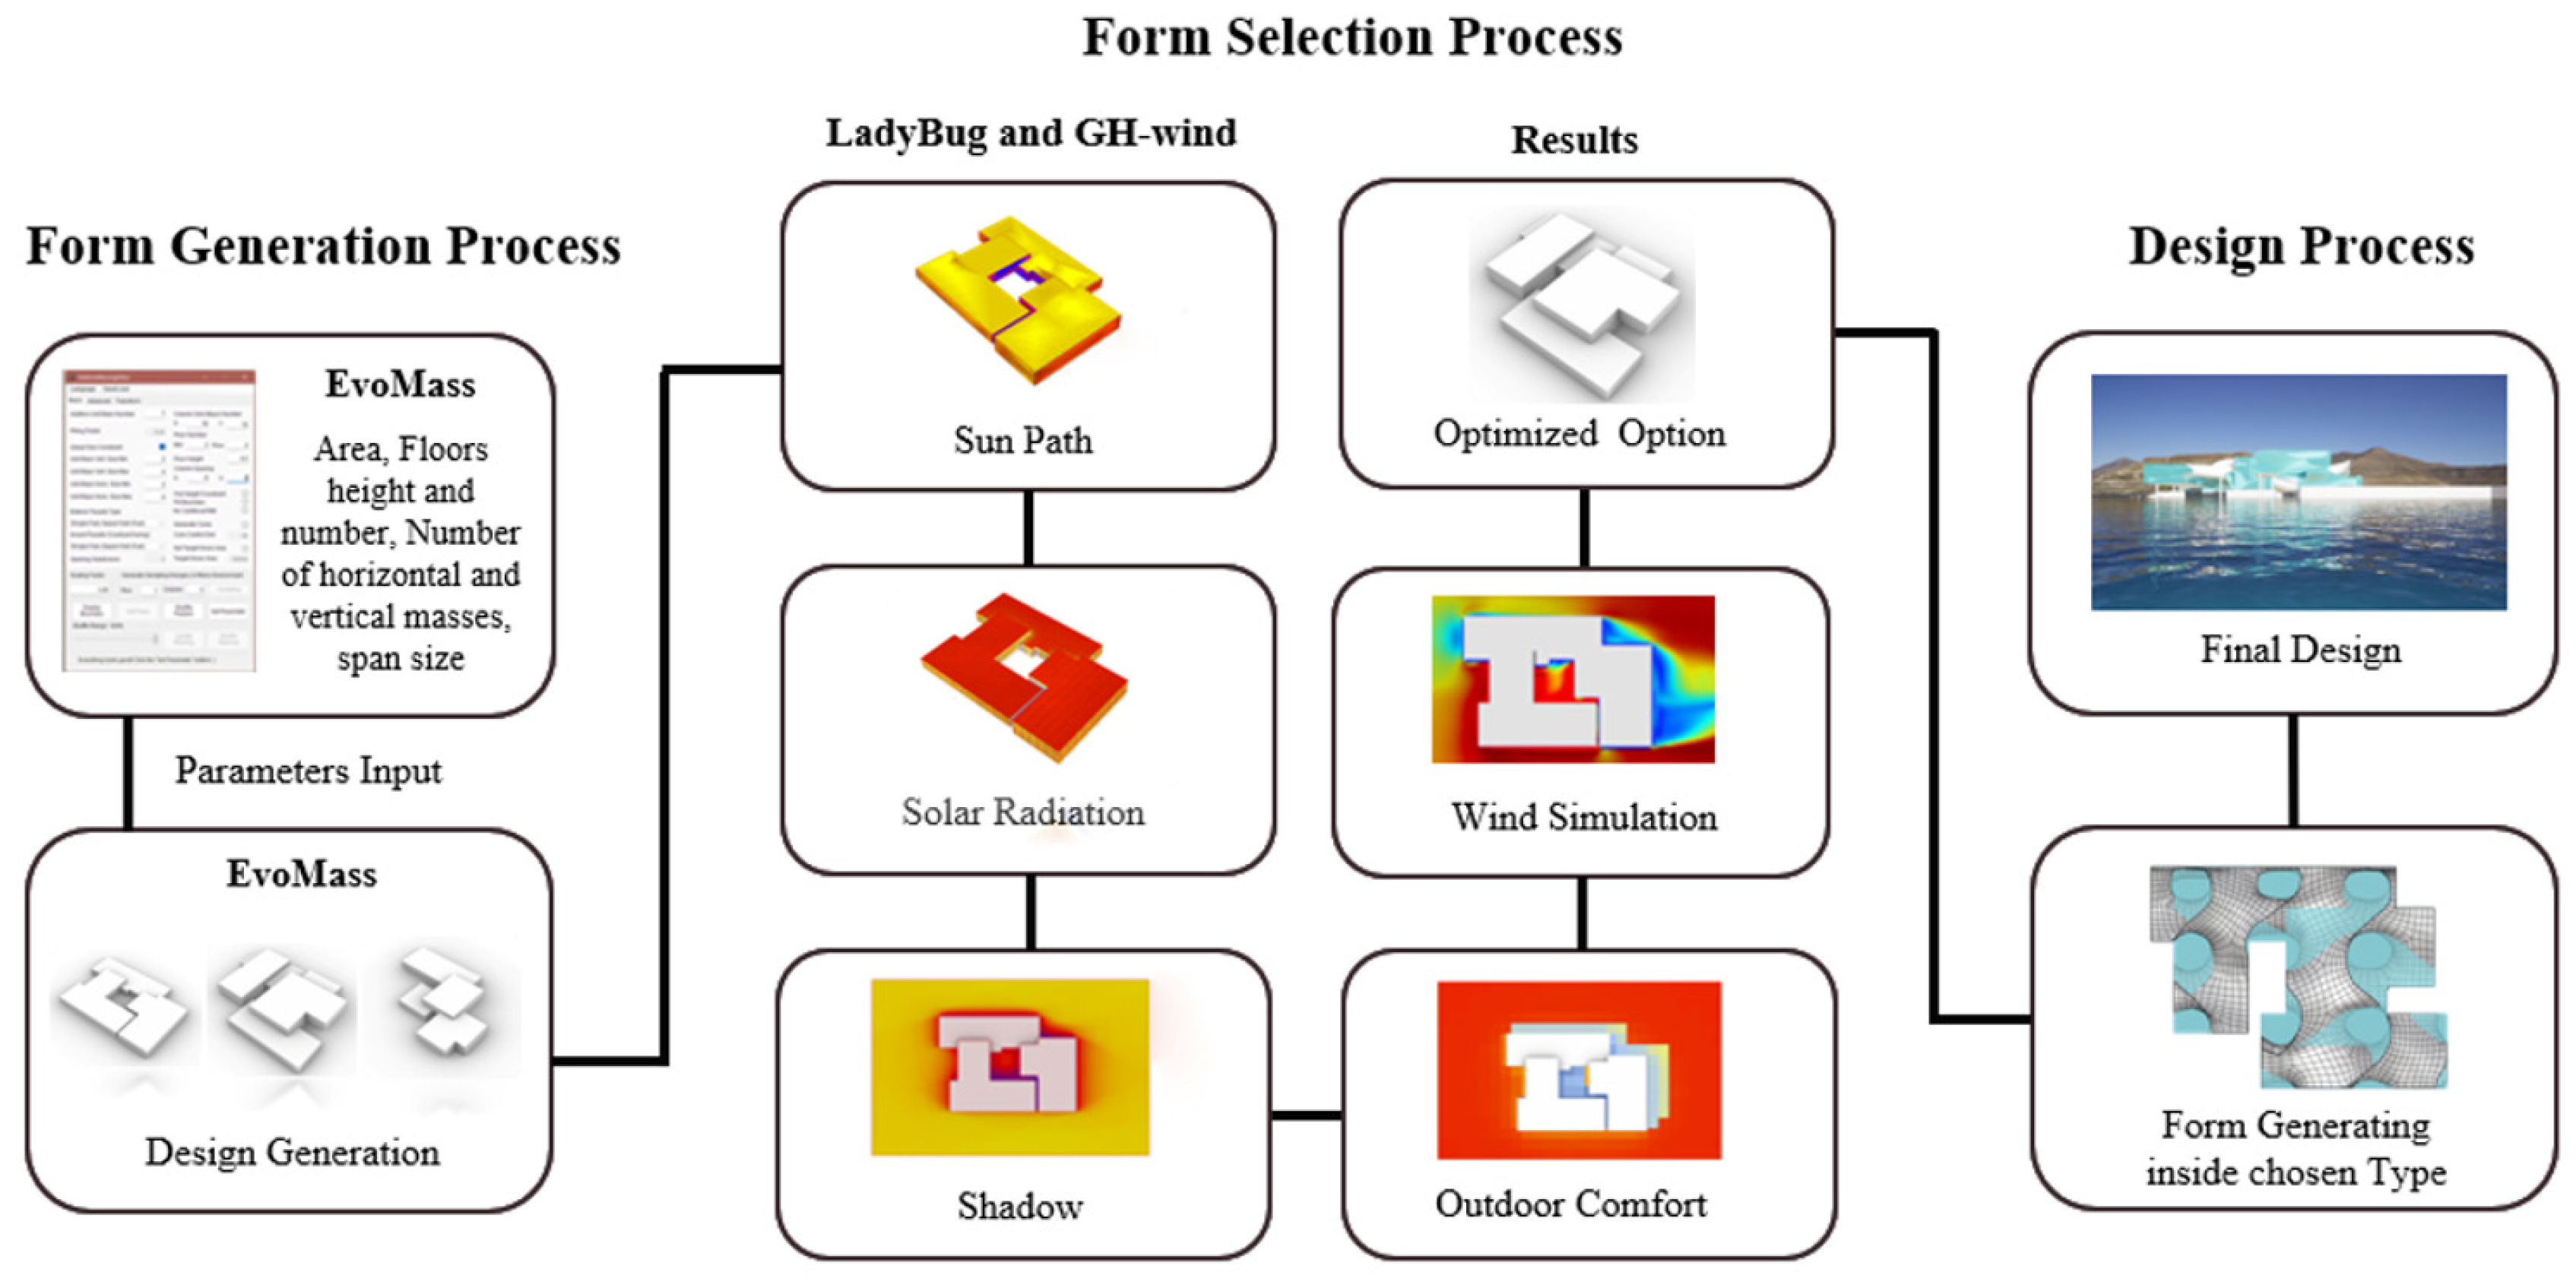
3.2. Performance-Based form and Design Optimization Framework
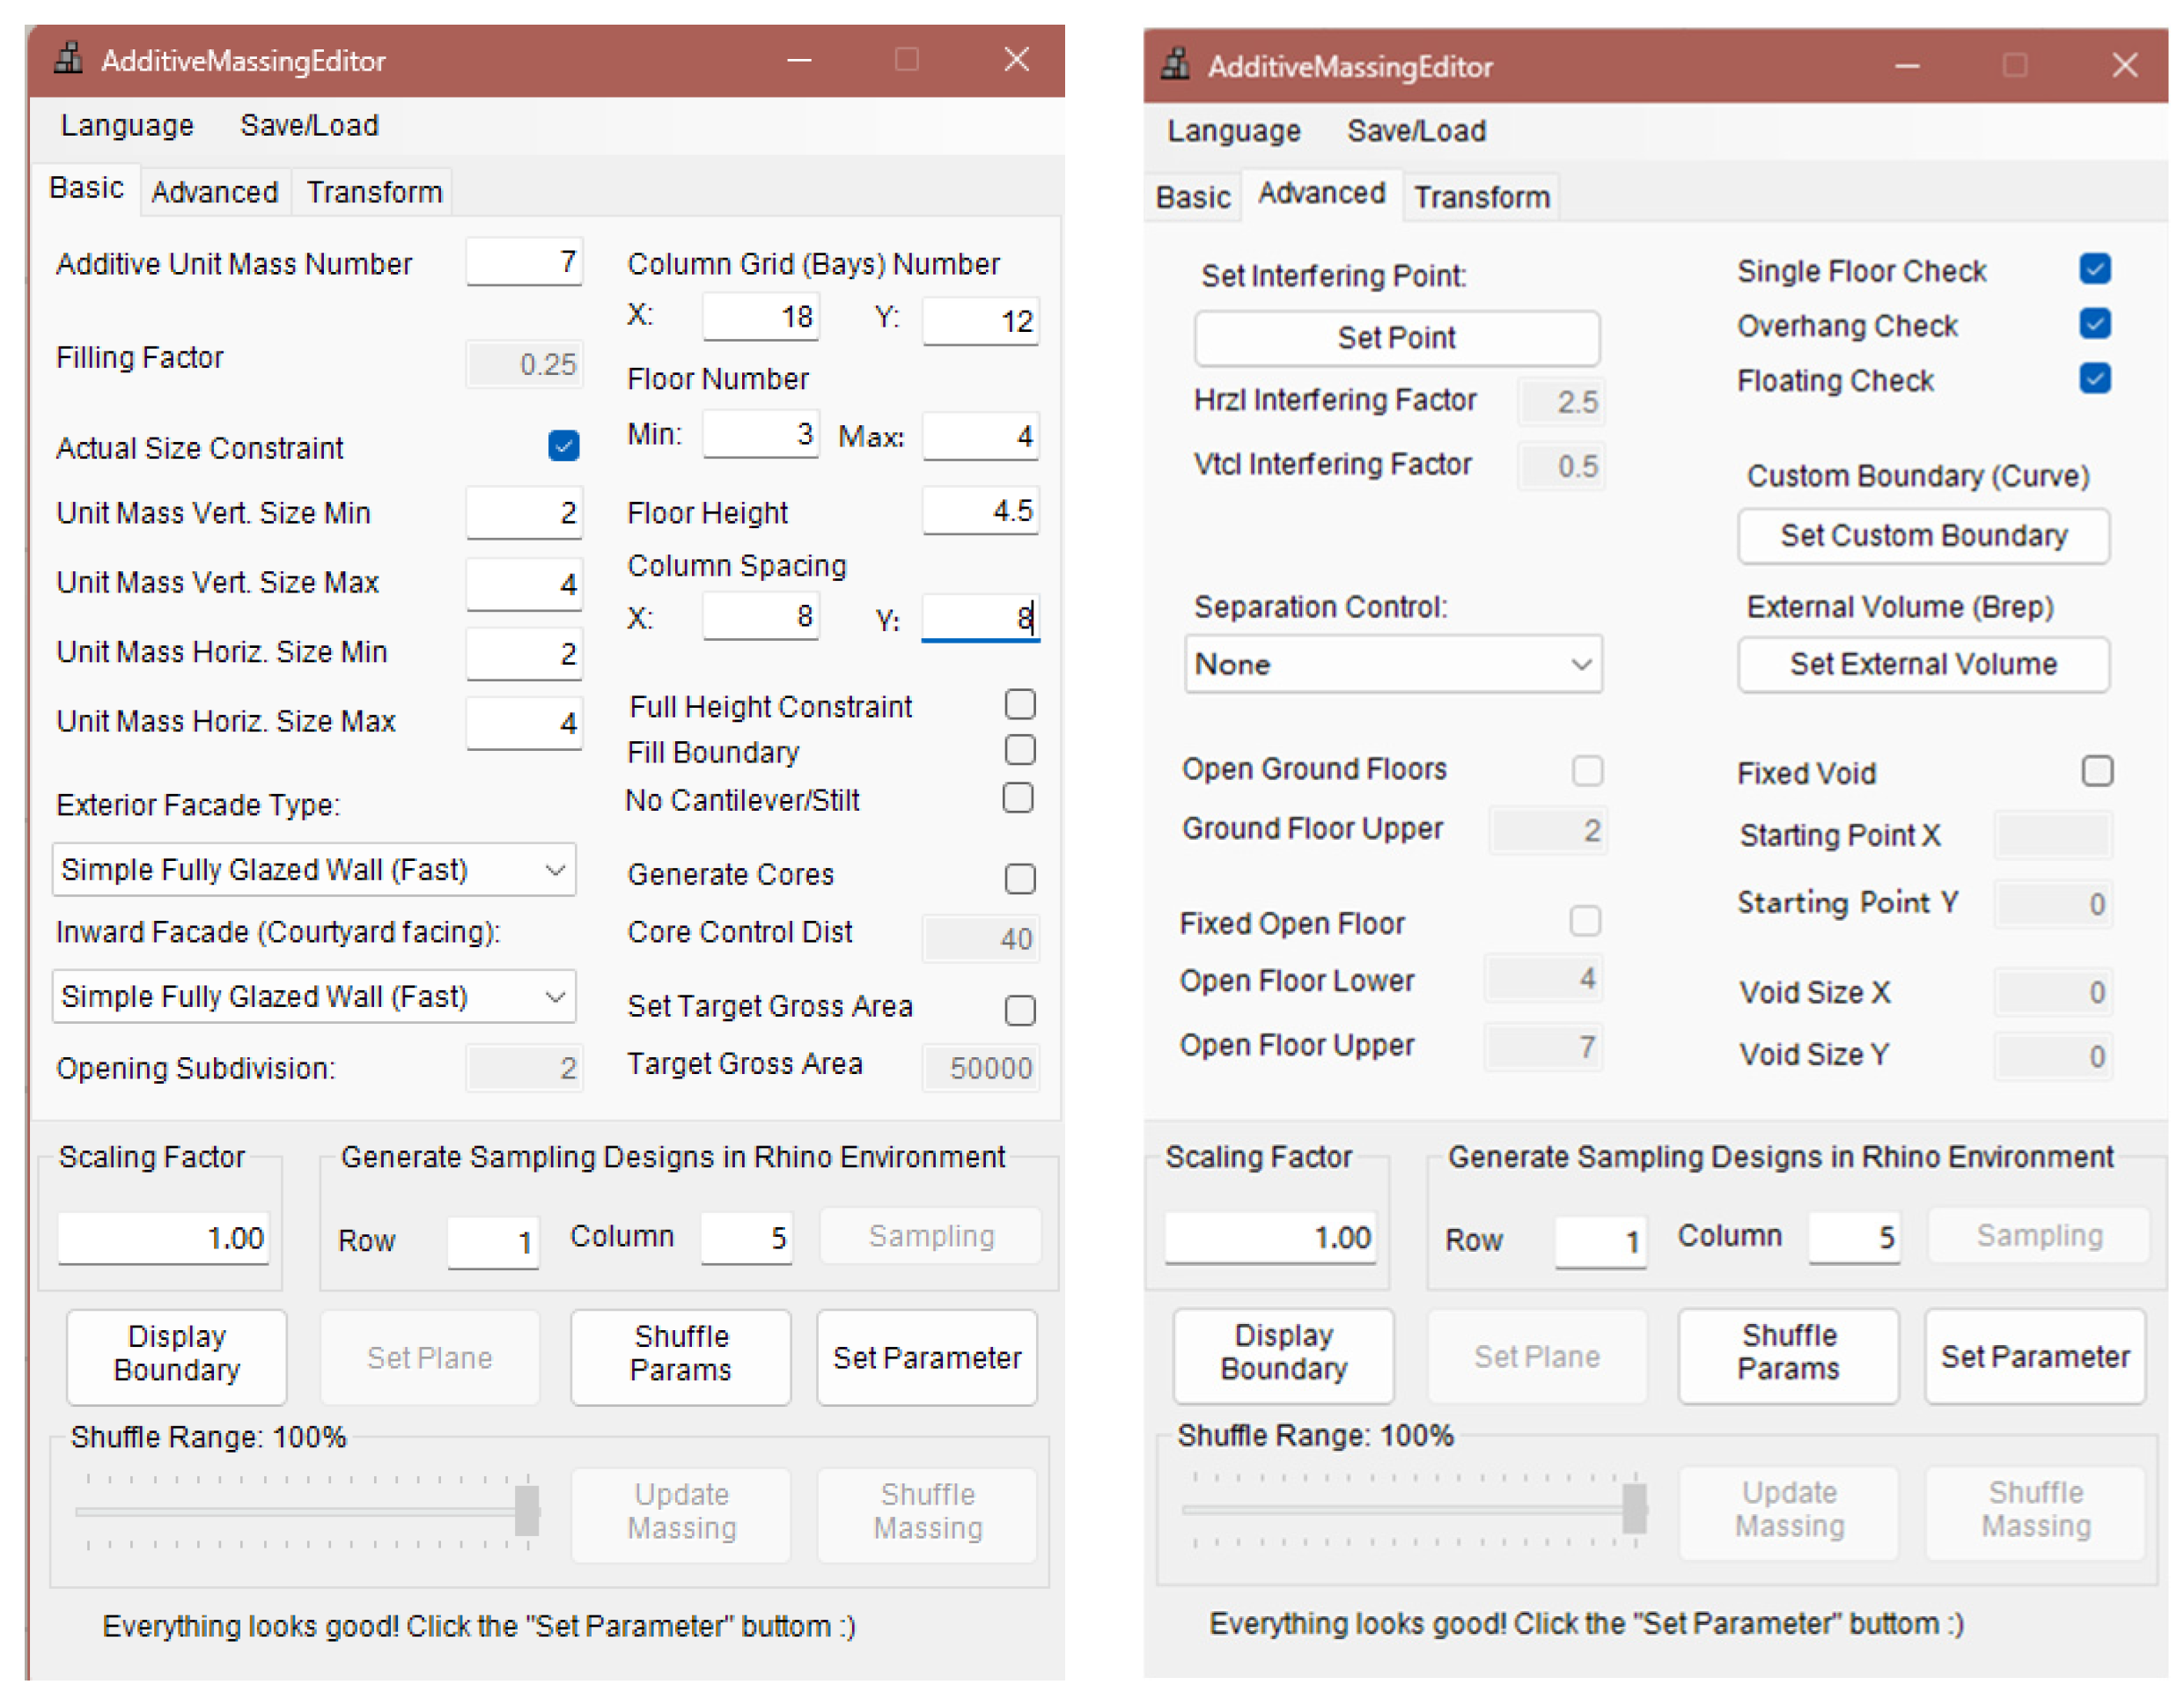
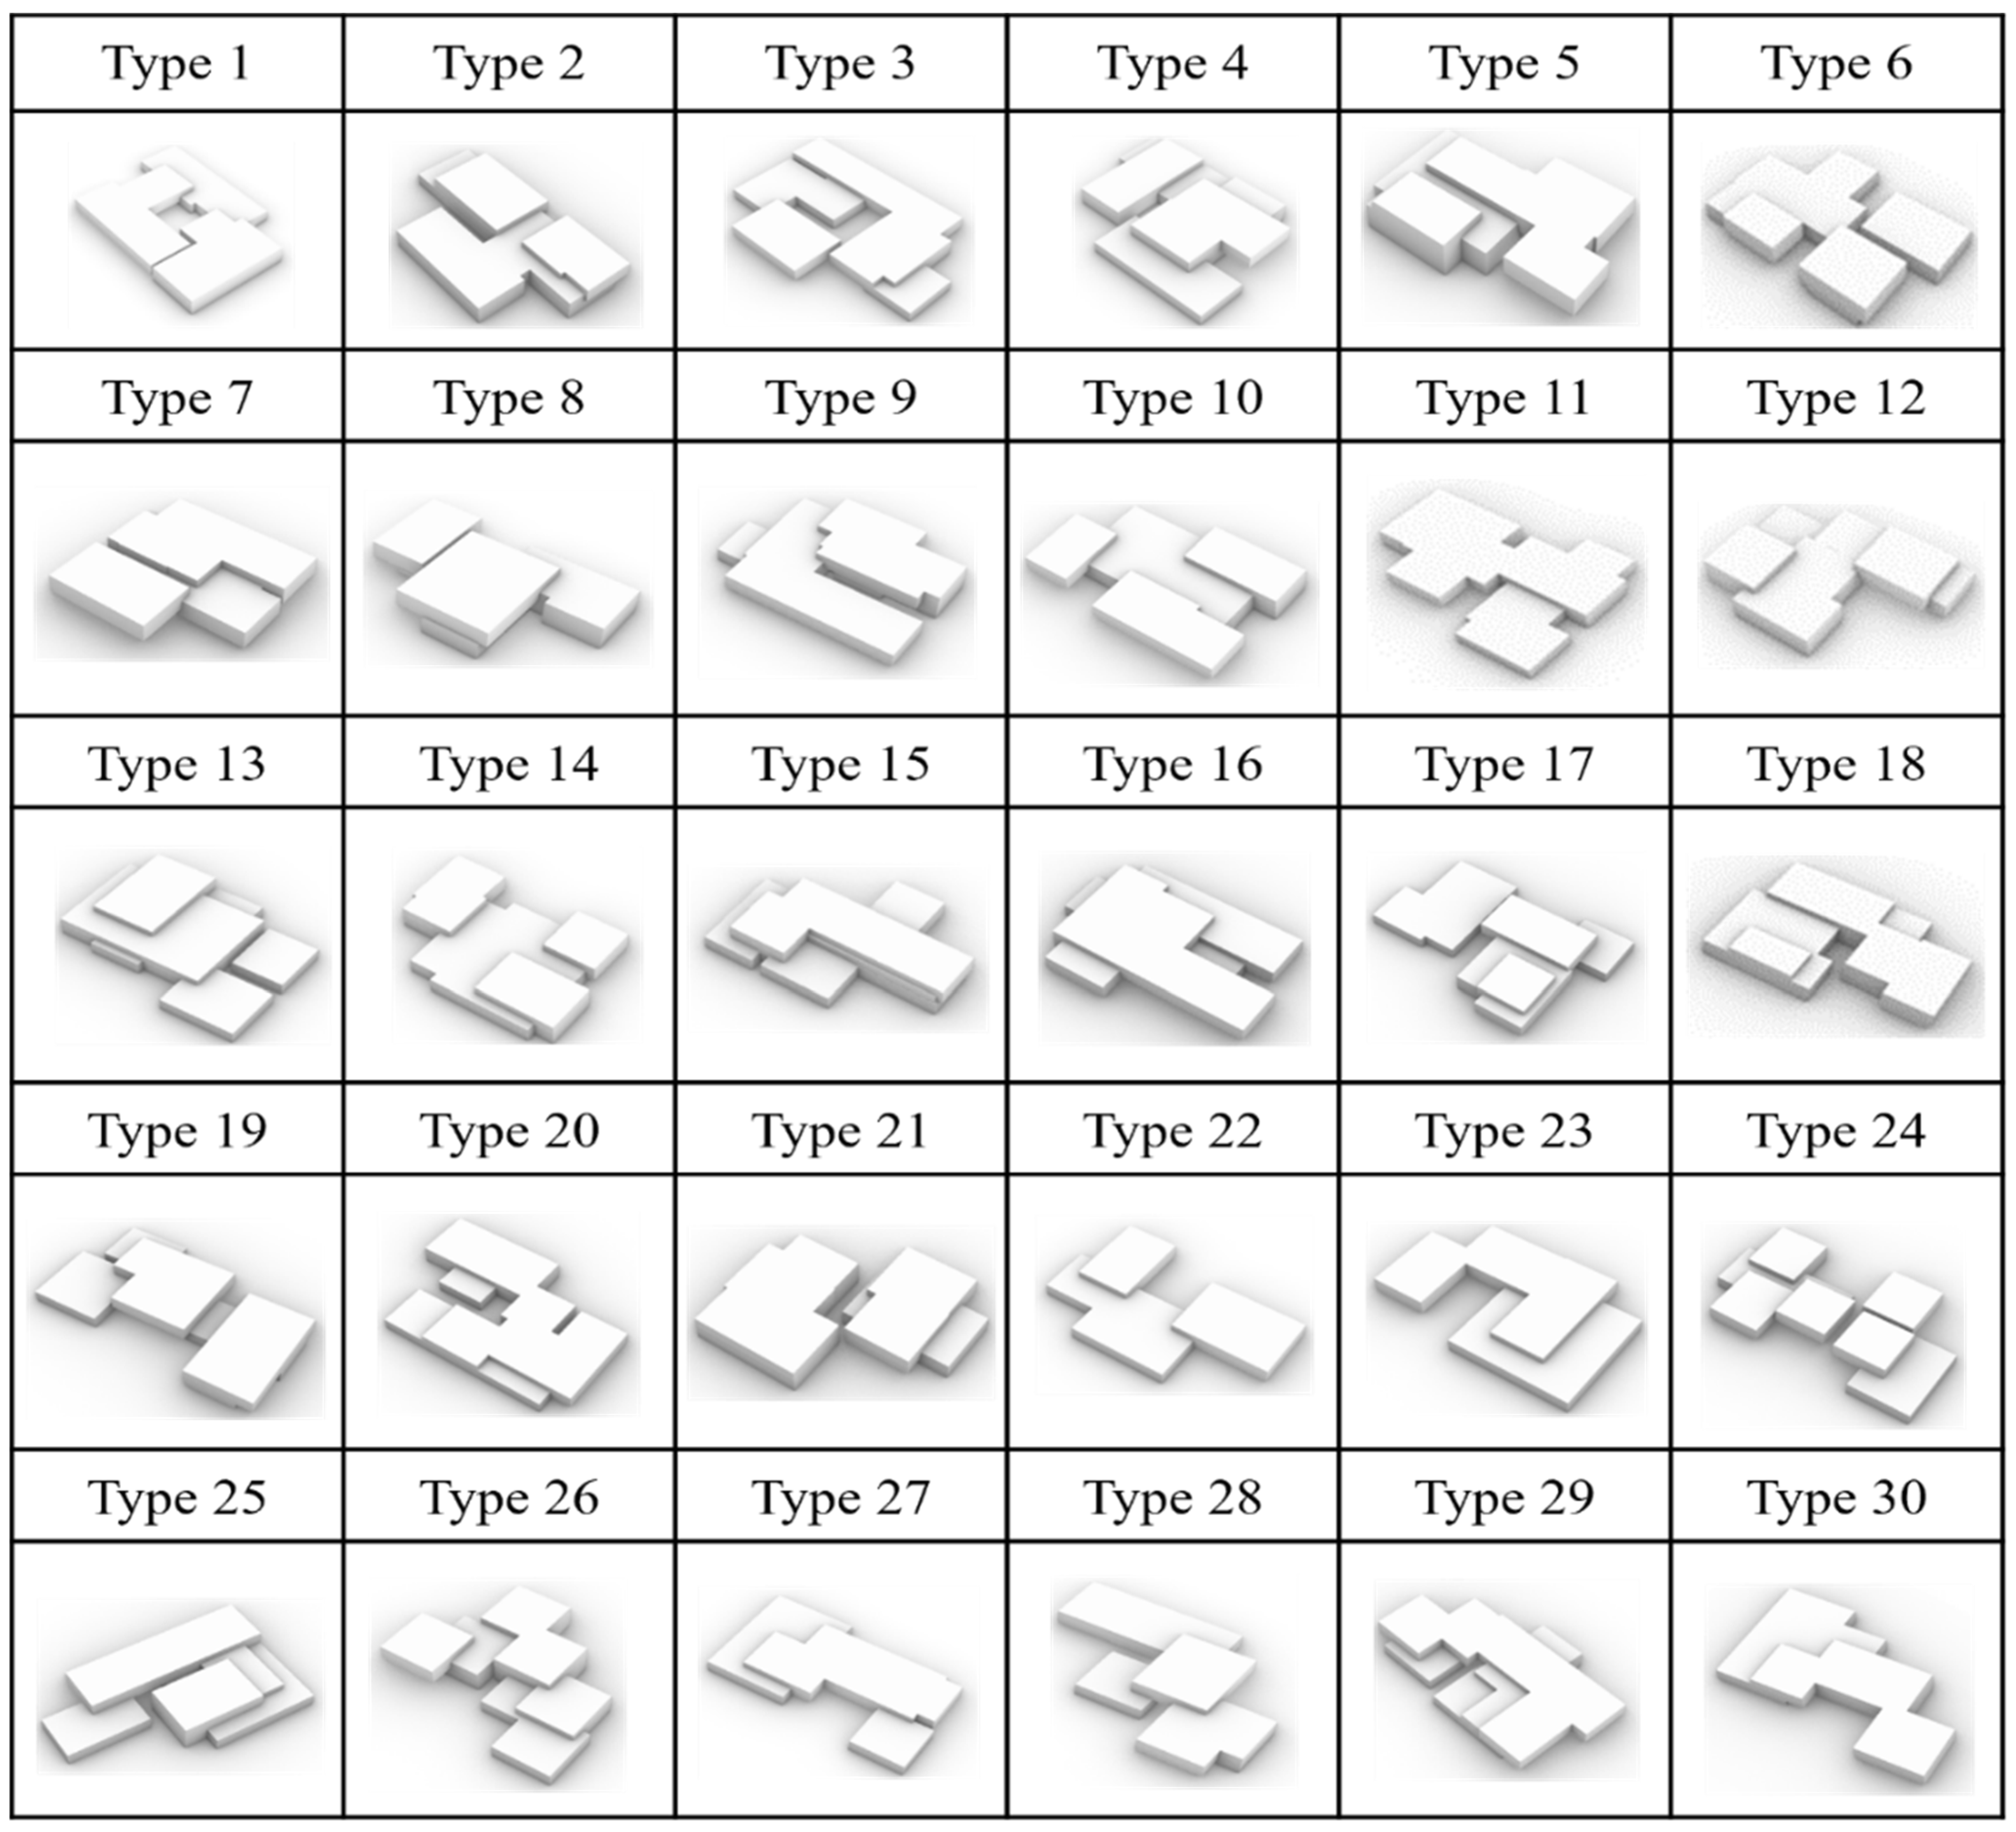
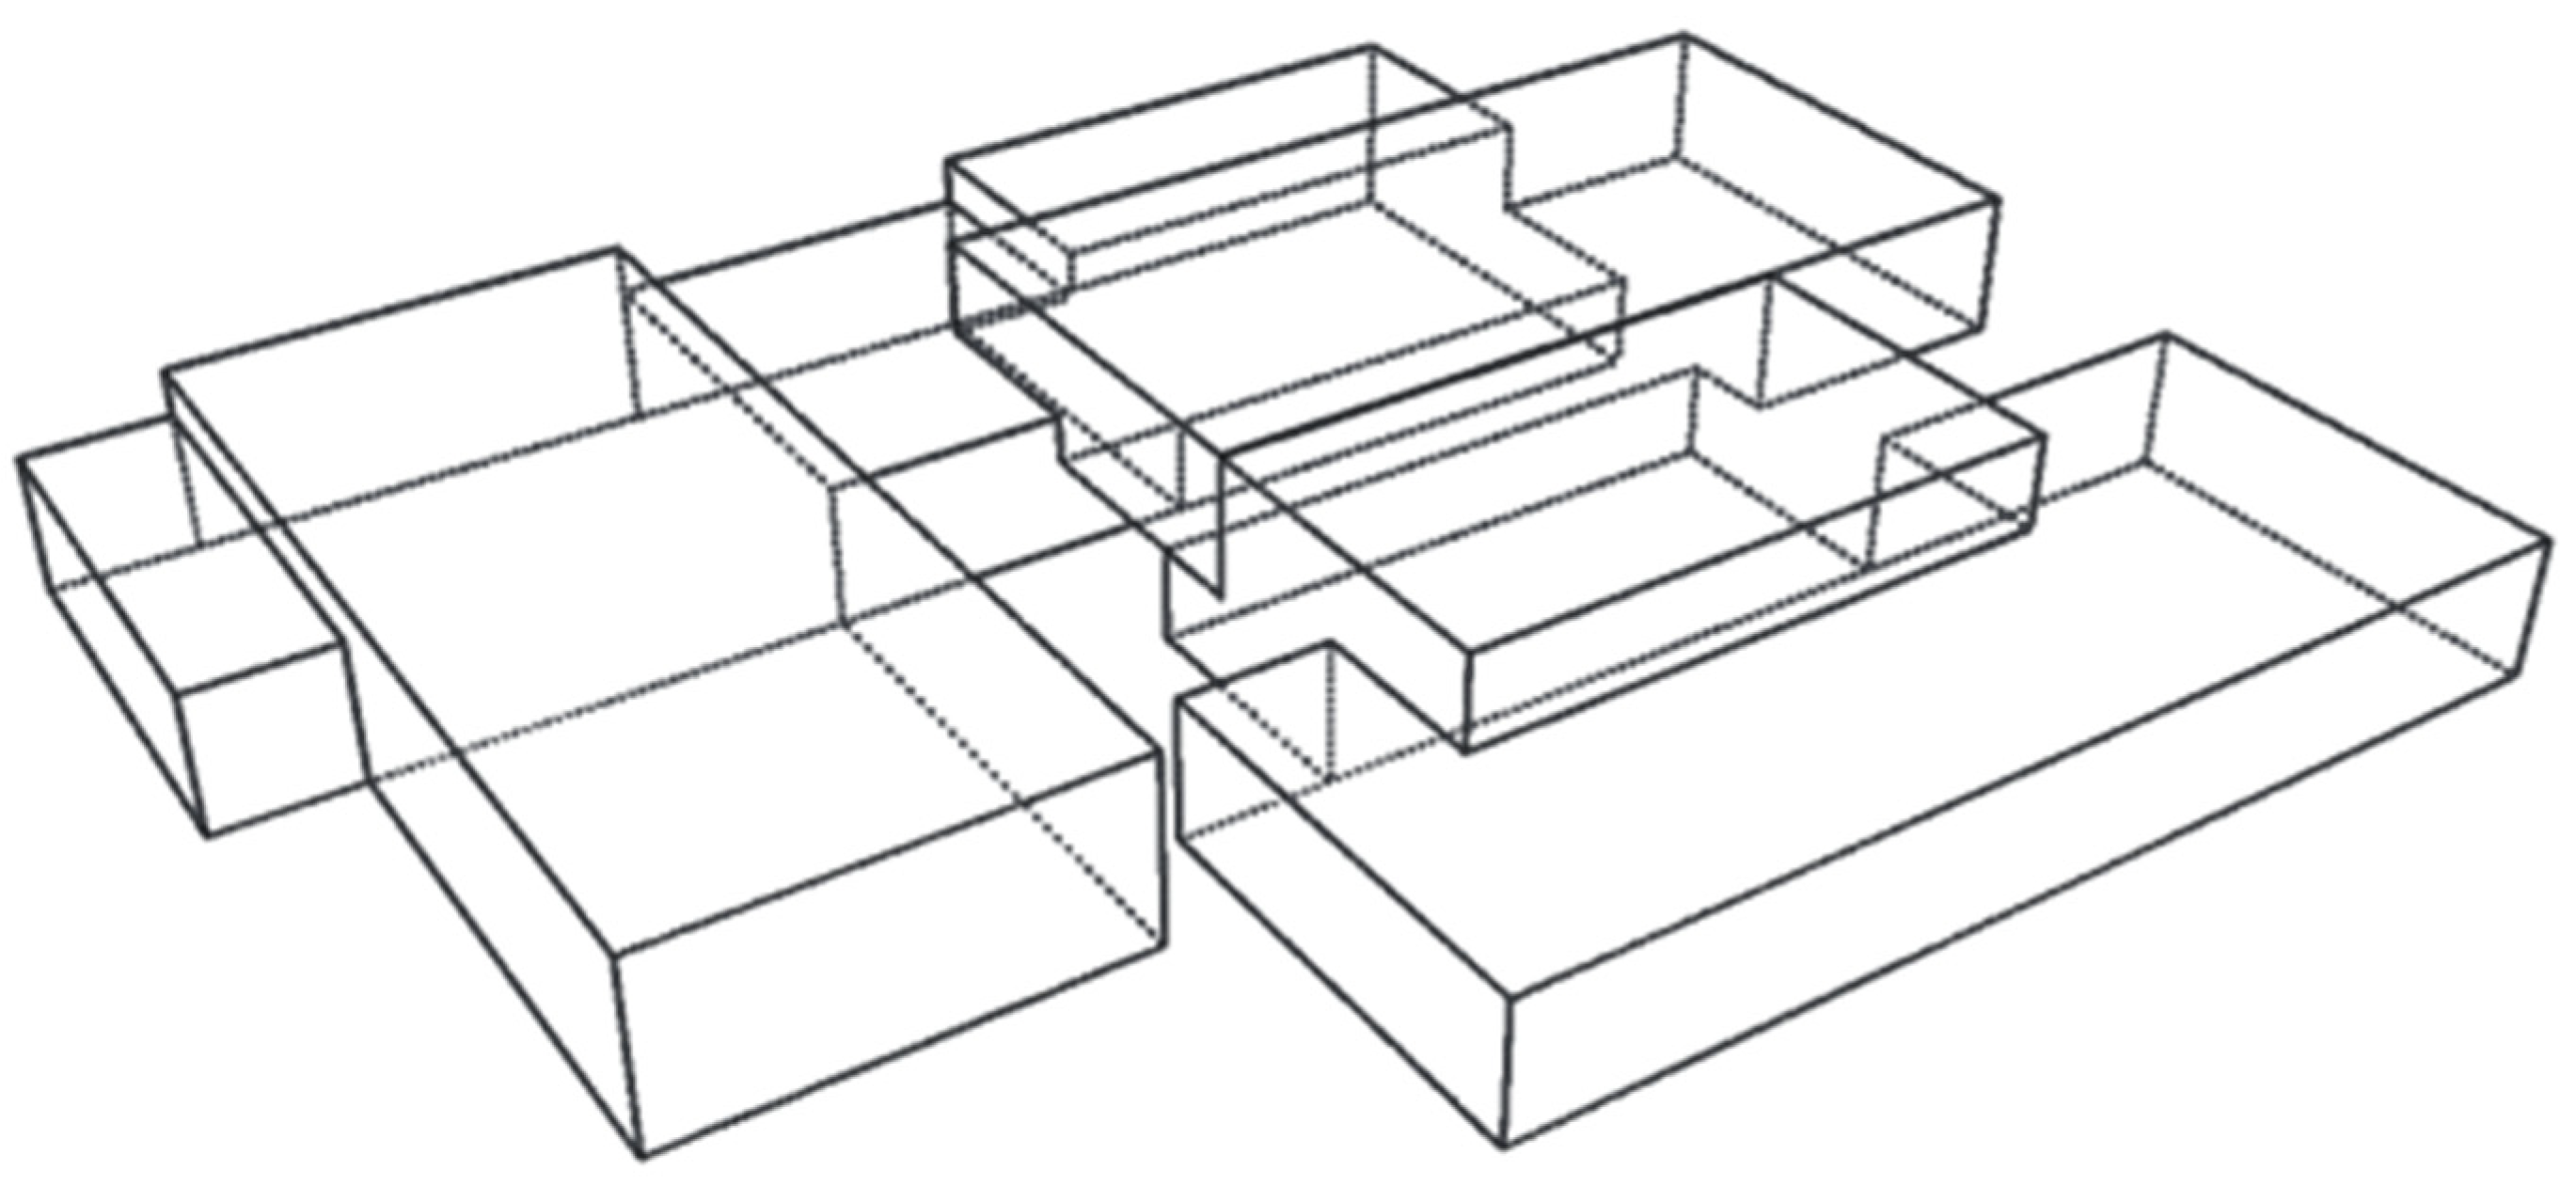
3.2.1. Form Generation Process
3.2.2. Form Selection Process
3.2.3. Design Process
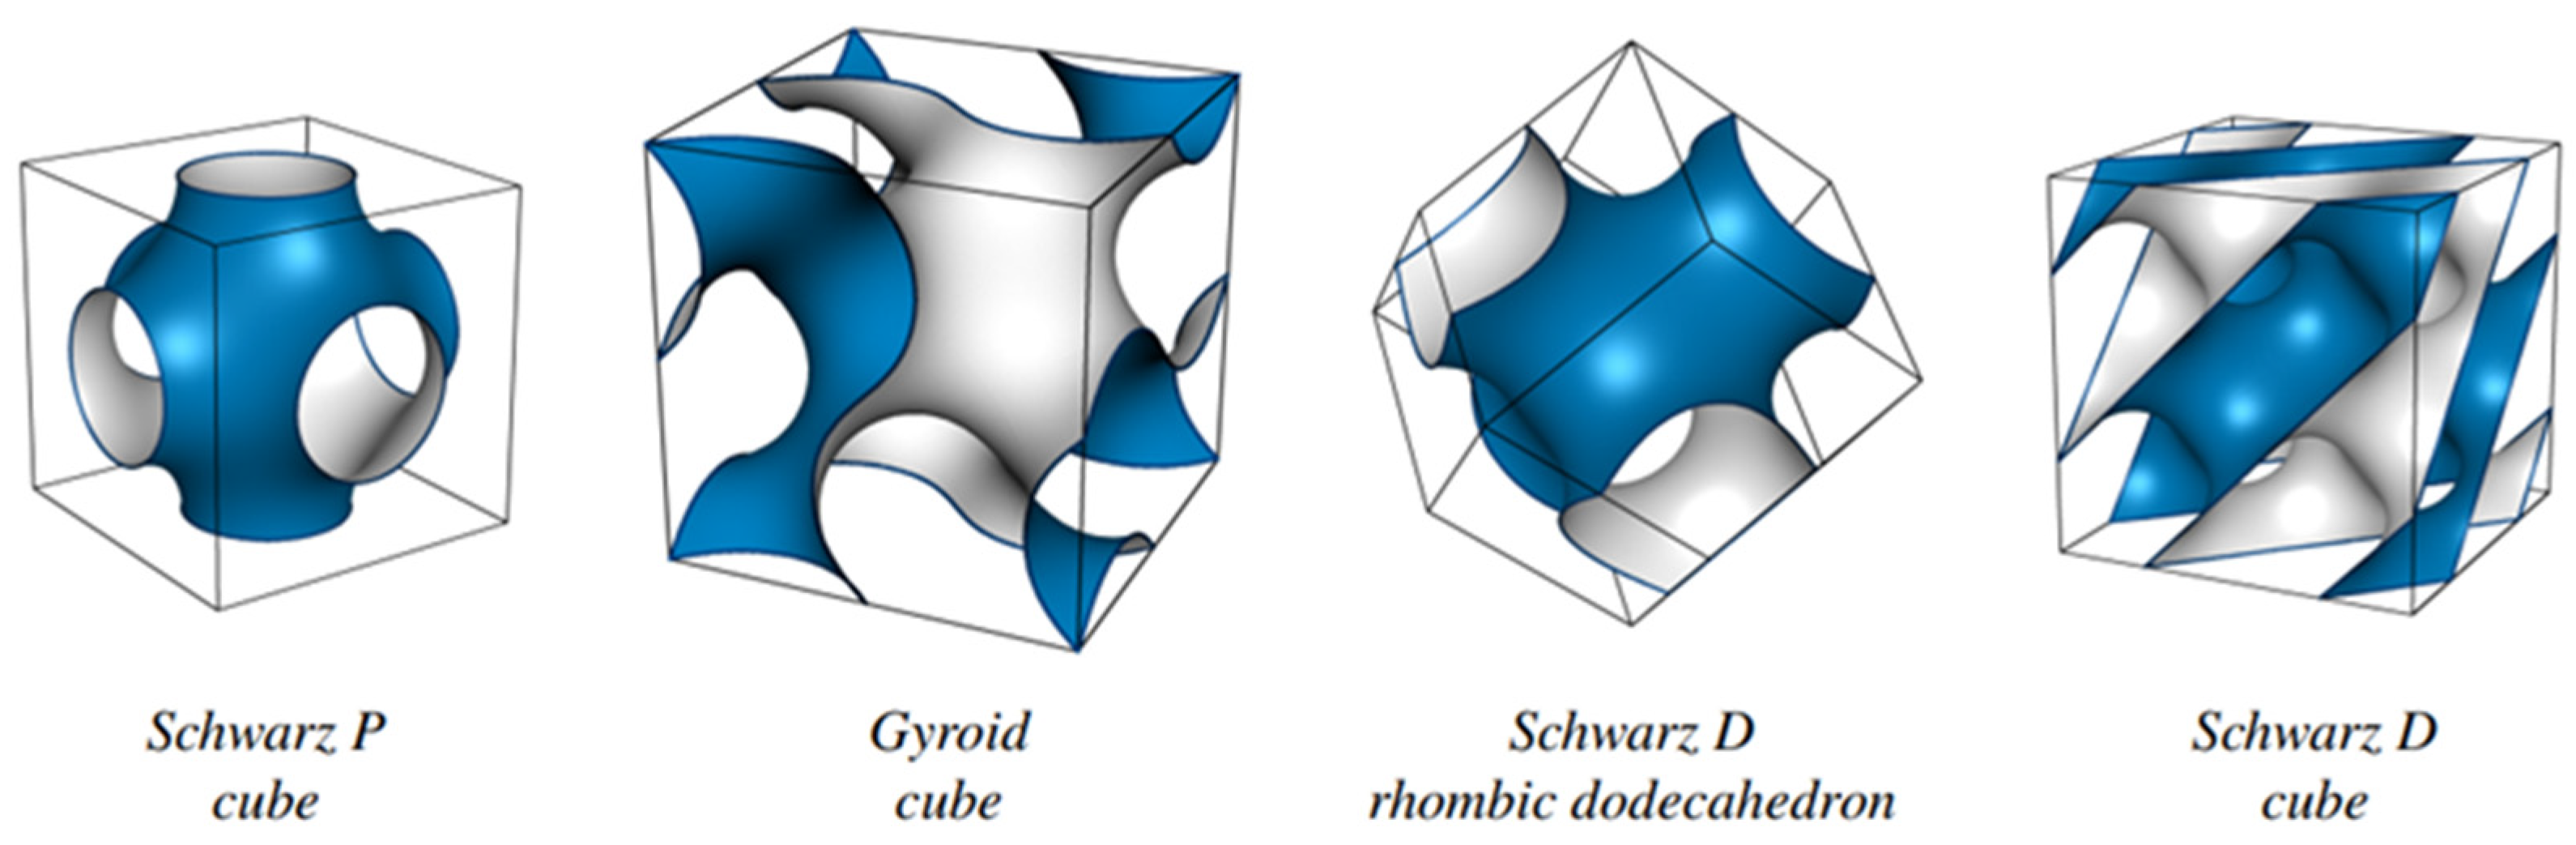
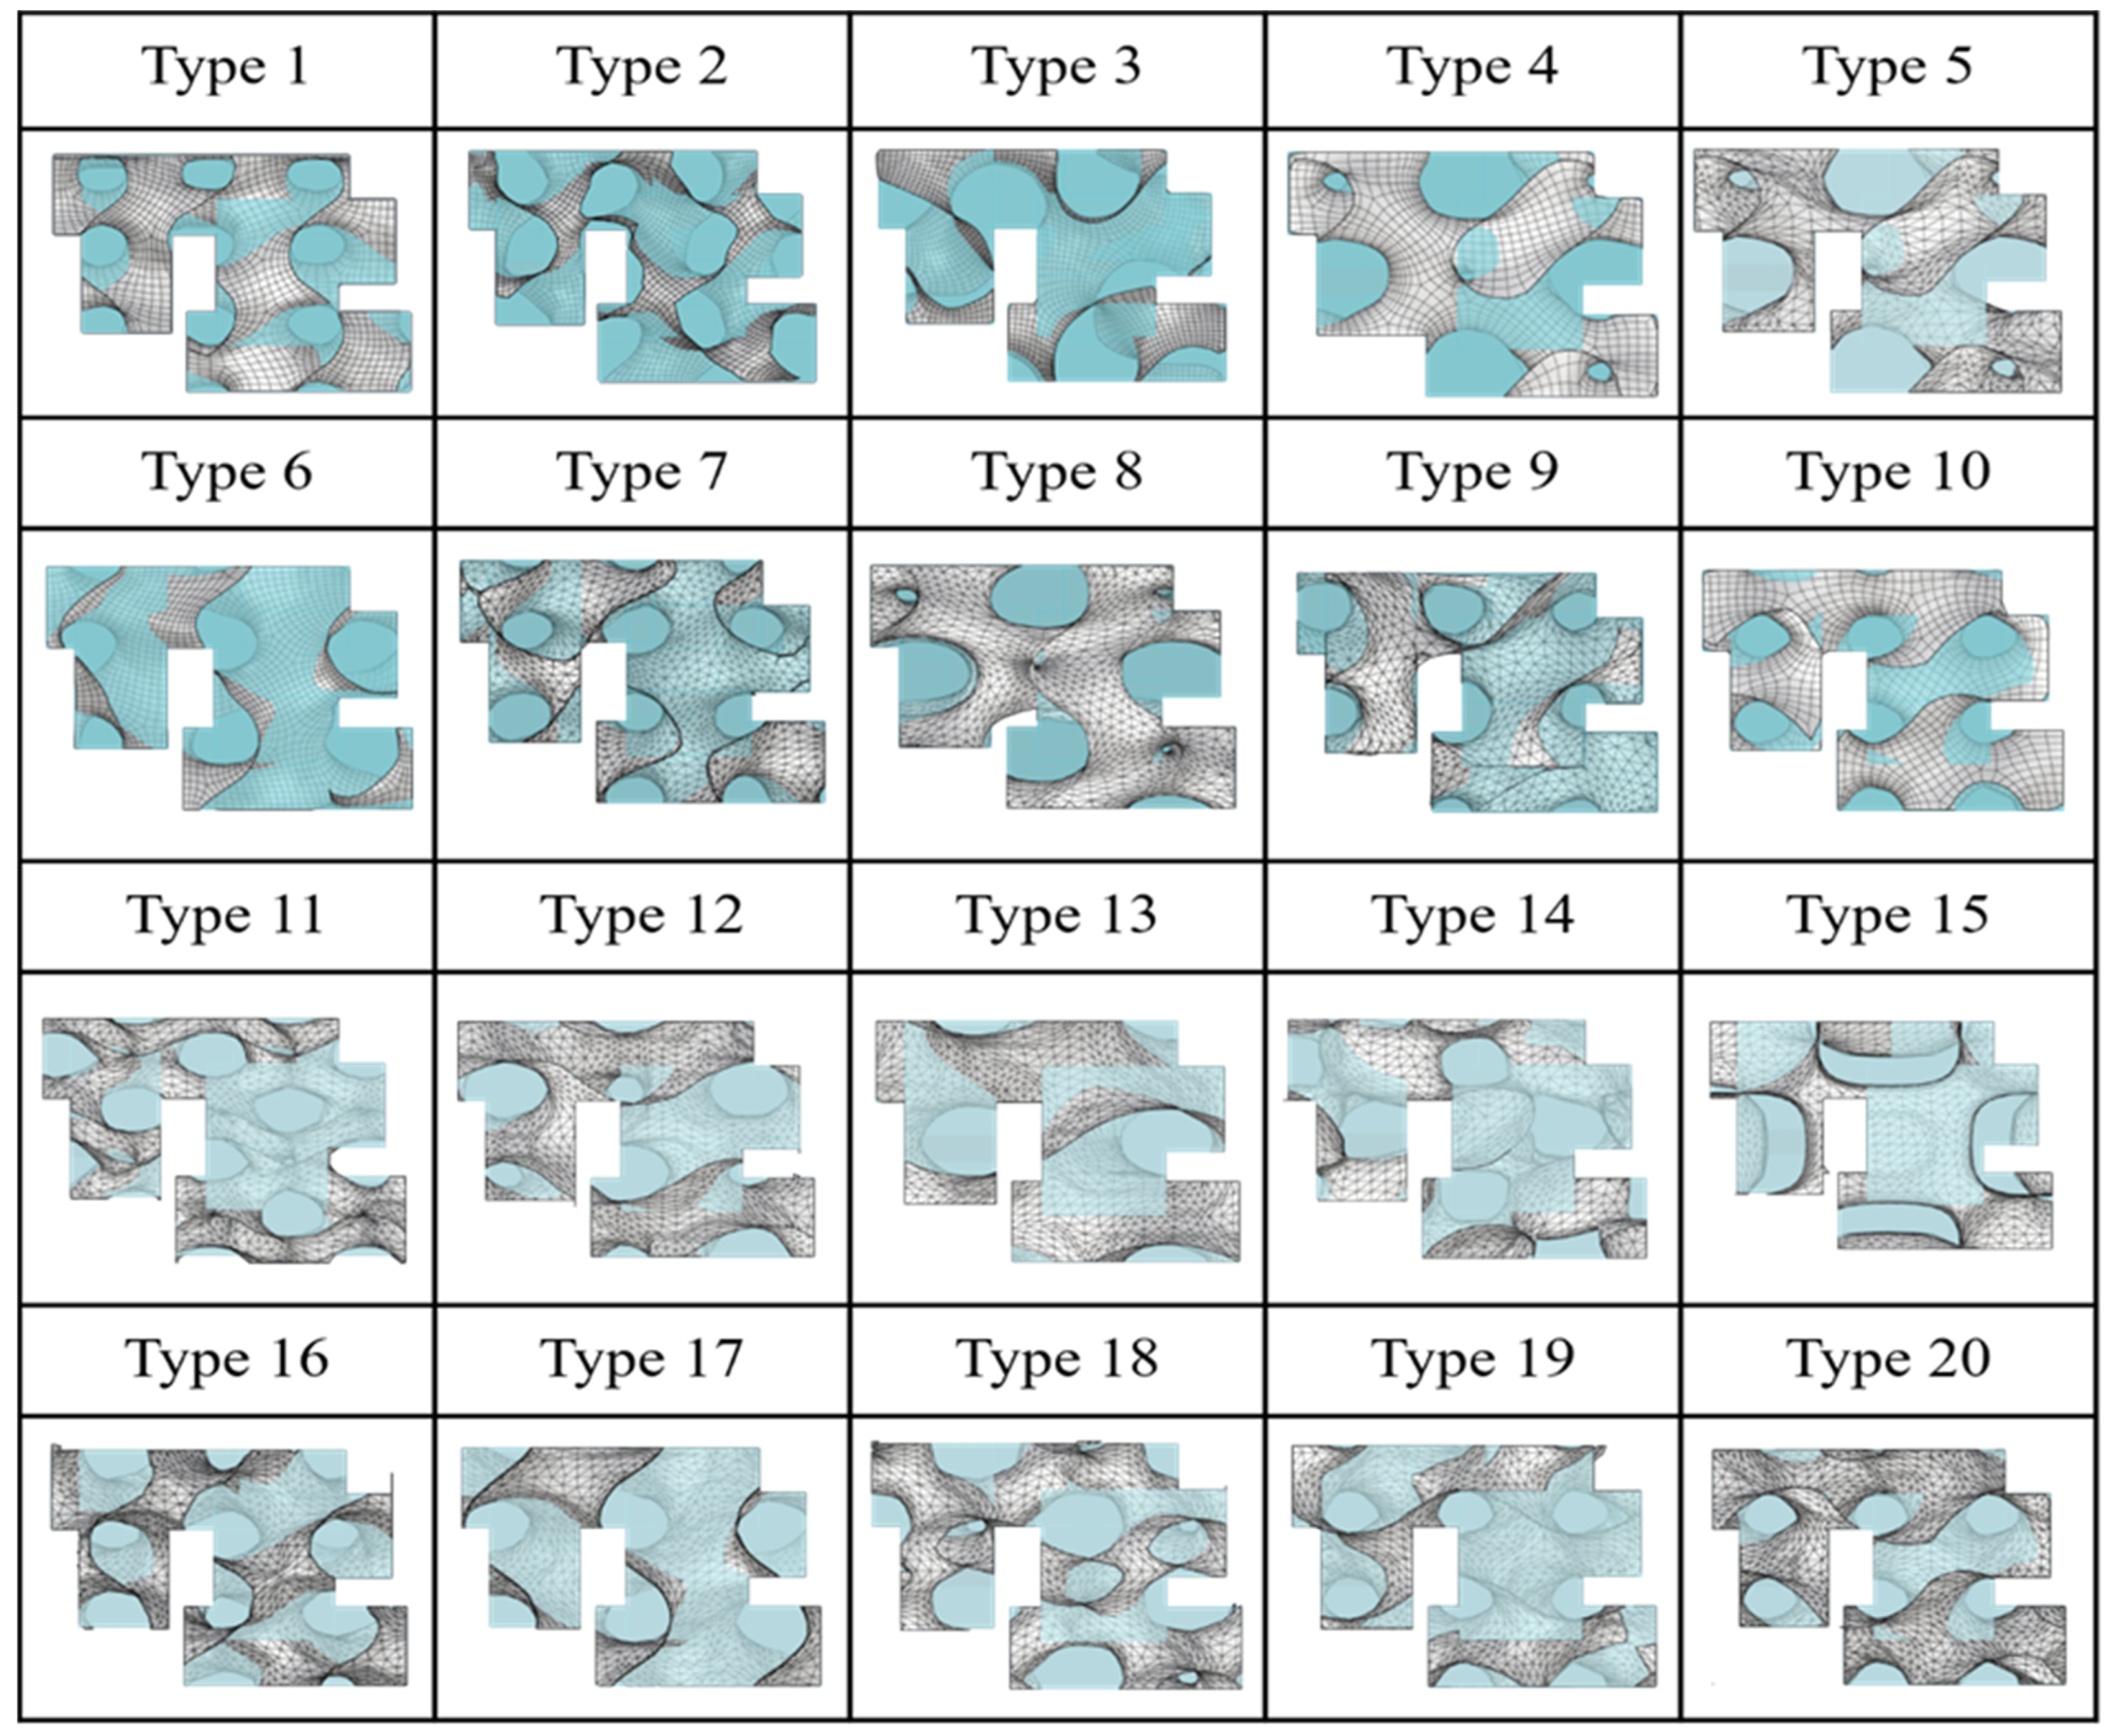
4. Gyroid Structure Analysis
5. Results and Discussion
- The proposed workflow can be used to quickly find high-performing solutions within the design space and form.
- The optimization-based design exploration methodology effectively revealed the critical design parameters that had the biggest effects on the system’s performance. It was possible to analyze the design’s sensitivity to various parameters in order to better understand the behavior of the system and create guidelines for future design advances.
6. Conclusions
- The optimization process could effectively discover high-performing designs within the design space, offering insights into the system’s behavior and identifying the main design factors that had the greatest influence on its performance.
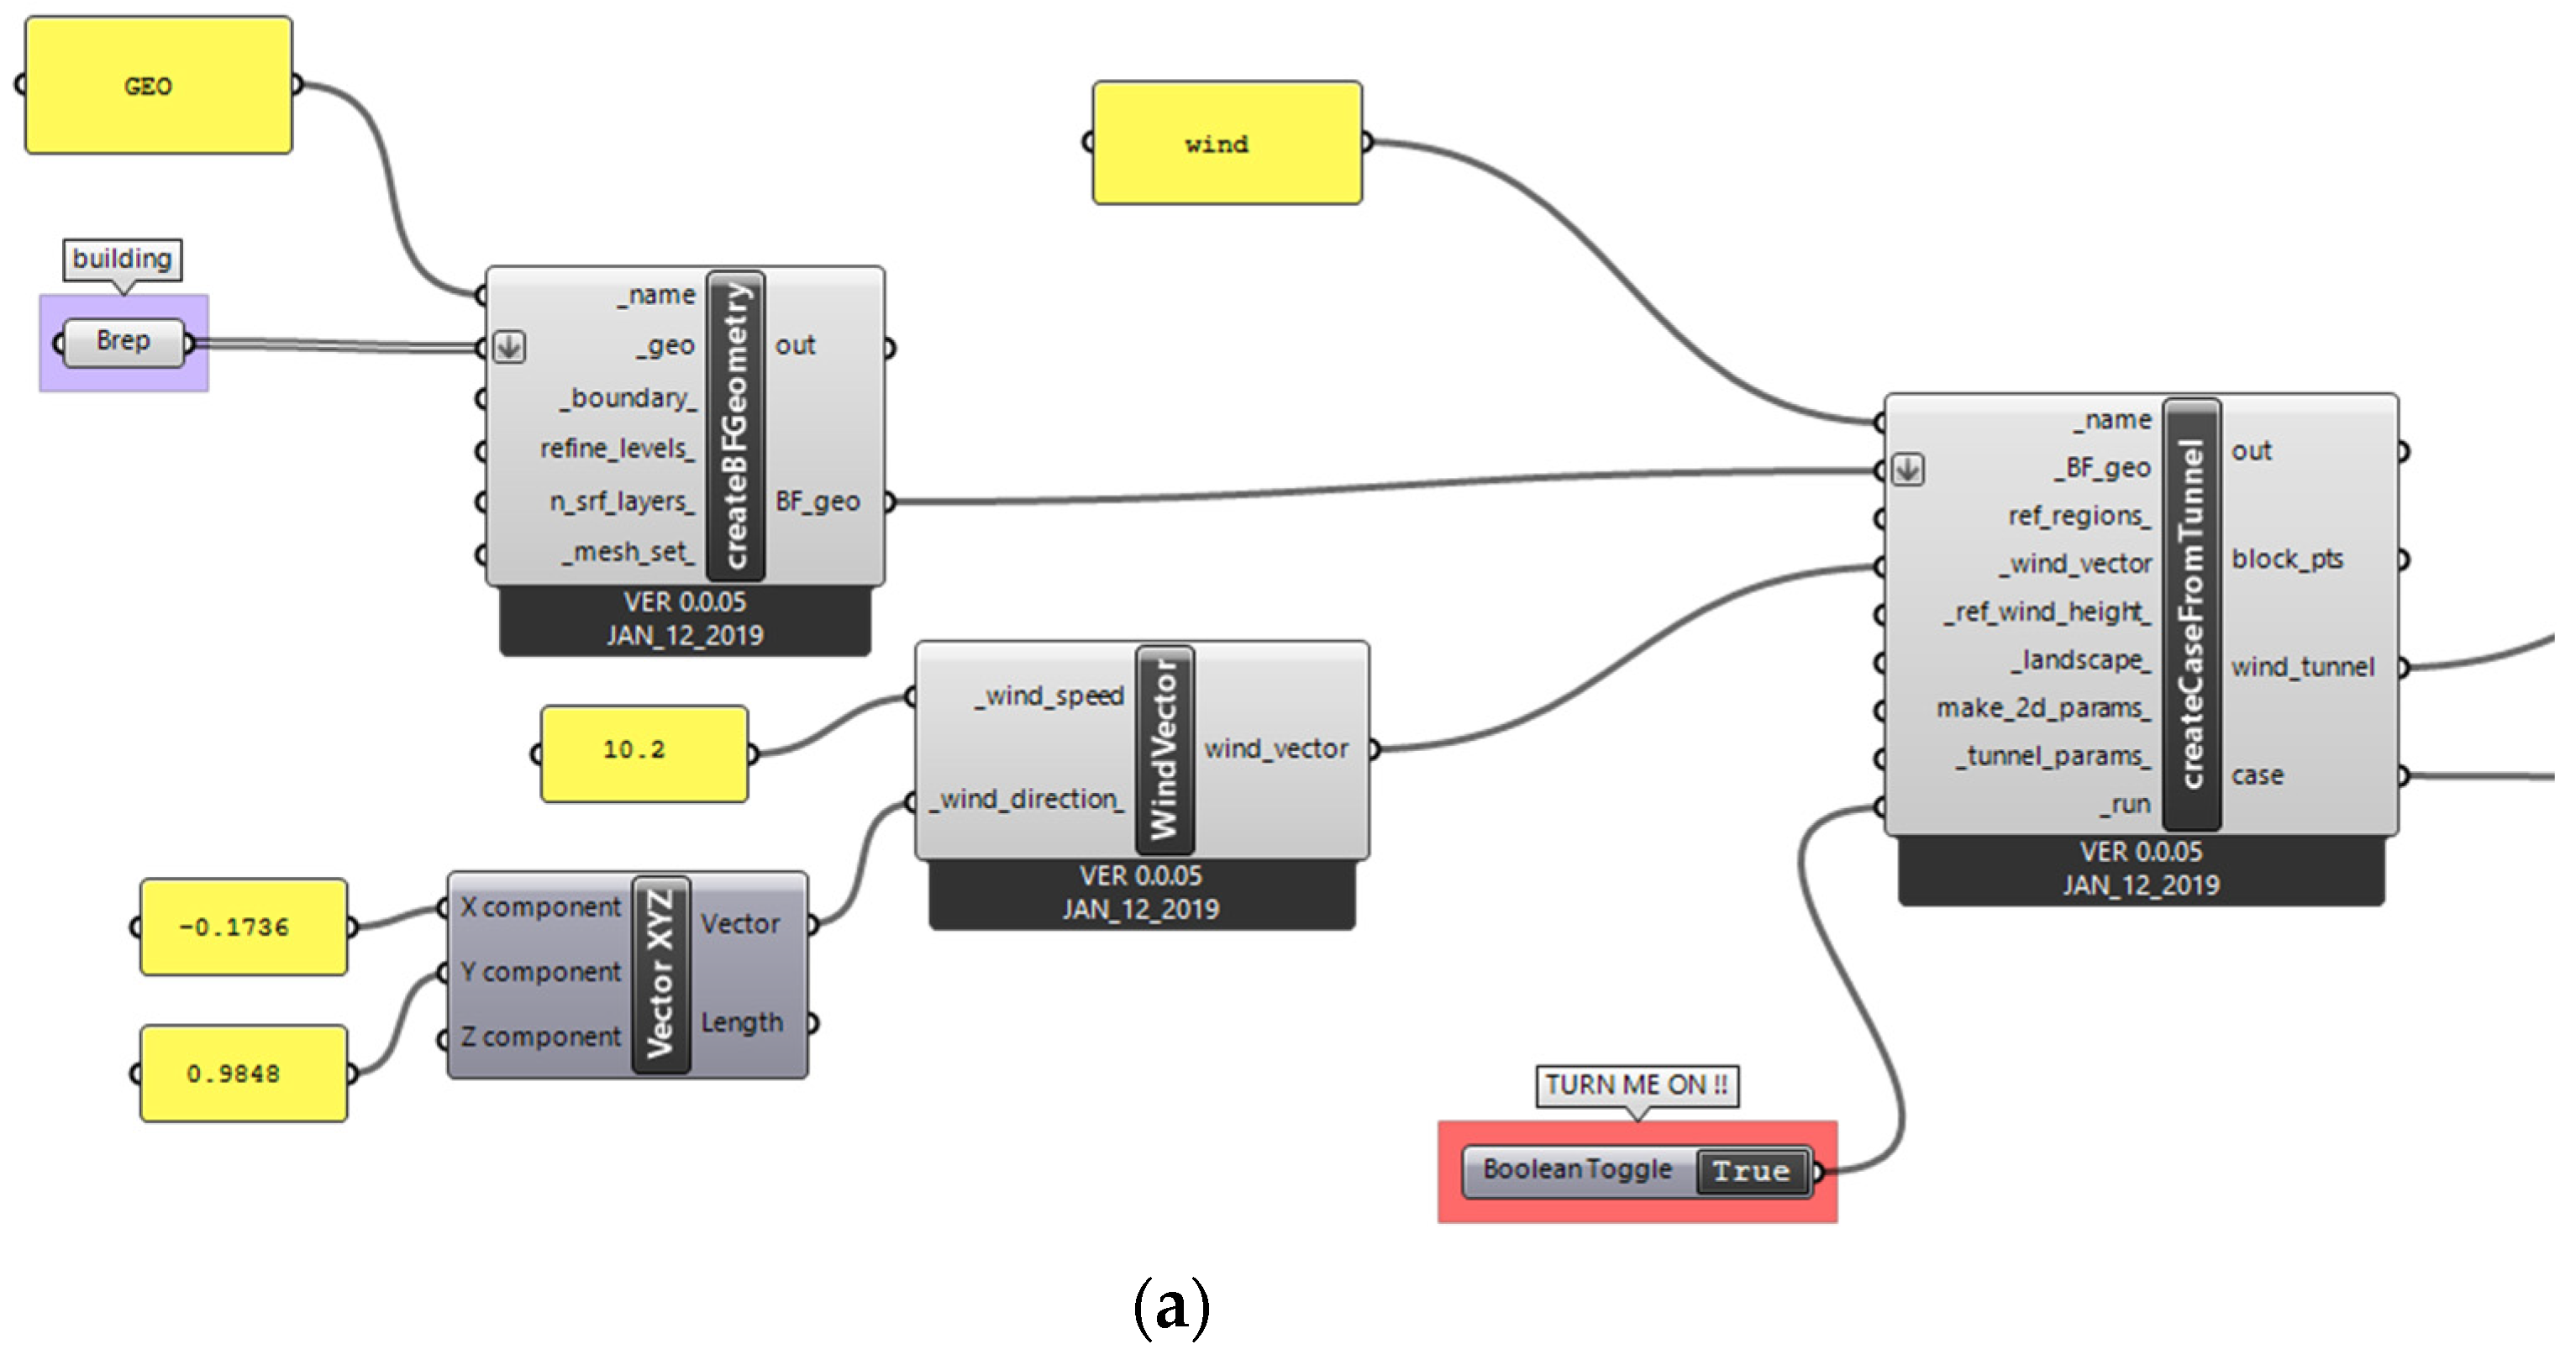
- Various design parameters could be analyzed by using computational tools like the Rhino–Grasshopper plug-ins EvoMass, LadyBug, Butterfly, and GH_Wind.
- The optimization-based design exploration workflow has the potential to be an effective tool for engineering design optimization, offering a methodical way of exploring the design space and finding the best solutions.
- Fast and accurate finite element analysis (FEA) allowed for the safe simulation of potentially dangerous or destructive load circumstances and failure modes.
Author Contributions
Funding
Data Availability Statement
Conflicts of Interest
References
- Baxter, G.; Wild, G.; Ogawa, H. Optimizing the Potential Location of Spaceport Australia based on Current Suborbital Space Tourism Requirements. In Proceedings of the Joint Conference: 30th International Symposium on Space Technology and Science (ISTS), 34th International Electric Propulsion Conference (IEPC) & 6th Nano-Satellite Symposium (NSAT), Kobe, Japan, 4–10 July 2015. [Google Scholar]
- Dissel, A.; Kothari, A.; Lewis, M. Comparison of Horizontally and Vertically Launched Airbreathing and Rocket Vehicles. J. Spacecr. Rocket. 2006, 43, 161–169. [Google Scholar] [CrossRef]
- Rogers, R.; Ibold, K.; Finger, J. Spaceports & Airports: Integrating the Similarities/Reconciling the Differences. In Proceedings of the AIAA SPACE 2015 Conference and Exposition, Pasadena, CA, USA, 31 August–2 September 2015. [Google Scholar]
- Adams, C.; Petrov, G. Spaceport Master Planning: Principles and Precedents. In Proceedings of the AIAA Space Forum, San Jose, CA, USA, 19–21 September 2006. [Google Scholar]
- Sierra County: Home of Spaceport America. Available online: https://sierracountynewmexico.info/home-of-spaceport-america/ (accessed on 7 January 2023).
- Robinson-Avila, K. Now we need a plan for Spaceport America. Albuquerque Journal, 5 February 2023. [Google Scholar]
- Wala, R. Conceptual Design Spaceport in Abu Dhabi; Faculty of Architecture, Warsaw University of Technology: Warsaw, Poland, 2016. [Google Scholar]
- Miles, V. Visit Khor Fakkan | 12 Things to Do and See. Available online: https://www.wandersmiles.com/visit-khor-fakkan/ (accessed on 10 January 2023).
- Oxman, R. Performance-based design: Current practices and research issues. Int. J. Archit. Comput. 2008, 6, 1–17. [Google Scholar] [CrossRef]
- Shi, X. Performance-based and performance-driven architectural design and optimization. Front. Archit. Civ. Eng. China 2010, 4, 512–518. [Google Scholar] [CrossRef]
- Wang, L.; Zhang, H.; Liu, X.; Ji, G. Exploring the synergy of building massing and façade design through evolutionary optimization. Front. Archit. Res. 2022, 11, 761–780. [Google Scholar] [CrossRef]
- Touloupaki, E.; Theodosiou, T. Performance simulation integrated in parametric 3D modeling as a method for early-stage design optimization—A review. Energies 2017, 10, 637, ahead of print. [Google Scholar] [CrossRef]
- Wang, L. Workflow for applying optimization-based design exploration to early-stage architectural design—Case study based on EvoMass. Int. J. Archit. Comput. 2022, 20, 41–60. [Google Scholar] [CrossRef]
- Maksoud, A.; Hussien, A.; Mushtaha, E.; Alawneh, S.I.A.-R. Computational Design and Virtual Reality Tools as an Effective Approach for Designing Optimization, Enhancement, and Validation of Islamic Parametric Elevation. Buildings 2023, 13, 1204. [Google Scholar] [CrossRef]
- Wang, L.; Chen, K.W.; Janssen, P.; Ji, G. Enabling optimization-based exploration for building massing design: A coding-free evolutionary building massing design toolkit in rhino-grasshopper. In RE: Anthropocene, Design in the Age of Humans, Proceedings of the 25th International Conference on Computer-Aided Architectural Design Research in Asia, CAADRIA 2020, Bangkok, Thailand, 5–6 August 2020; Association for Computer-Aided Architectural Design Research in Asia (CAADRIA): Hong Kong, China, 2020; pp. 255–264. [Google Scholar]
- Cichocka, J.; Browne, W.N.; Ramirez, E. Optimization in the Architectural Practice—An International Survey. In Protocols, Flows, and Glitches, Proceedings of the 22nd CAADRIA Conference, Xi’an Jiaotong-Liverpool University, Suzhou, China, 5–8 April 2017; Association for Computer-Aided Architectural Design Research in Asia (CAADRIA): Hong Kong, China, 2017; pp. 387–397. [Google Scholar]
- Wang, L.; Janssen, P.; Chen, K.W.; Tong, Z.; Ji, G. Subtractive building massing for performance-based architectural design exploration: A case study of daylighting optimization. Sustainability 2019, 11, 6965. [Google Scholar] [CrossRef]
- Caetano, I.; Santos, L.; Leitão, A. Computational design in architecture: Defining parametric, generative, and algorithmic design. Front. Archit. Res. 2020, 9, 287–300. [Google Scholar] [CrossRef]
- Maksoud, A.; Mushtaha, E.; Chouman, L.; Al Jawad, E.; Samra, S.A.; Sukkar, A.; Yahia, M.W. Study on Daylighting Performance in the CFAD Studios at the University of Sharjah. Civ. Eng. Archit. 2022, 10, 2134–2143. [Google Scholar] [CrossRef]
- Wang, L.; Shen, Y.; Zhang, R.; Tong, Z. EvoMass + GH_Wind—An agile wind-driven building massing design optimization framework. In Towards a New, Configurable Architecture, Proceedings of the 39th eCAADe Conference, Novi Sad, Serbia, 8–10 September 2021; Education and research in Computer Aided Architectural Design in Europe (eCAADe): Brussels, Belgium, 2021. [Google Scholar]
- Roudsari, M.S.; Pak, M. Ladybug: A parametric environmental plug-in for Grasshopper to help designers create an environmentally conscious design. In Proceedings of the BS 2013: 13th Conference of the International Building Performance Simulation Association, Chambery, France, 25–28 August 2013. [Google Scholar]
- Maksoud, A.; Mushtaha, E.; Al-Sadoon, Z.; Sahall, H.; Toutou, A. Design of Islamic parametric elevation for interior, enclosed corridors to optimize daylighting and solar radiation exposure in a desert climate: A case study of the University of Sharjah, UAE. Buildings 2022, 12, 161. [Google Scholar] [CrossRef]
- Xu, X.; Yin, C.; Wang, W.; Xu, N.; Hong, T.; Li, Q. Revealing urban morphology and outdoor comfort through genetic algorithm-driven urban block design in dry and hot regions of China. Sustainability 2019, 11, 3683. [Google Scholar] [CrossRef]
- Abdalla, S.B.; Rashid, M.; Yahia, M.W.; Mushtaha, E.; Opoku, A.; Sukkar, A.; Maksoud, A.; Hamad, R. Comparative Analysis of Building Information Modeling (BIM) Patterns and Trends in the United Arab Emirates (UAE) with Developed Countries. Buildings 2023, 13, 695. [Google Scholar] [CrossRef]
- Hu, Y.; Xu, F.; Gao, Z. A comparative study of the simulation accuracy and efficiency for the urban wind environment based on CFD plug-ins integrated into architectural design platforms. Buildings 2022, 12, 1487. [Google Scholar] [CrossRef]
- Roudsari, M.; Mackey. LadyBug Tools. 2022. Available online: https://www.ladybug.tools/butterfly.html (accessed on 12 March 2023).
- Reitebuch, U.; Skrodzki, M.; Polthier, K. Discrete Gyroid Surface. In Proceedings of the Bridges Linz 2019, Linz, Austria, 16–20 July 2019. [Google Scholar]
- Harvey, F. Graphene ‘a Game-Changer’ in Making Building with Concrete Greener. Available online: https://www.theguardian.com/environment/2018/apr/23/graphene-a-game-changer-in-making-building-with-concrete-greener (accessed on 14 March 2023).
- Qin, Z.; Jung, G.S.; Kang, M.J.; Buehler, M.J. The mechanics and design of a lightweight three-dimensional graphene assembly. Sci. Adv. 2017, 3, e1601536. [Google Scholar] [CrossRef] [PubMed]
- Maksoud, A.; Sahall, H.; Massarweh, M.; Al Khaled, S.; Auday, A. Parametric—Nature obsession. Int. J. Adv. Sci. Technol. 2020, 29, 2091–2095. [Google Scholar]
- Seharing, A.; Azman, A.H.; Abdullah, S. A review on integration of lightweight gradient lattice structures in additive manufacturing parts. Adv. Mech. Eng. 2020, 12, 1687814020916951. [Google Scholar] [CrossRef]
- Karamba 3D. 2022. Available online: https://manual.karamba3d.com/3-in-depth-component-reference/3.6-results/3.6.11-shellview (accessed on 10 May 2023).
- Udoeyo, F. Structural Analysis Defined. In Introduction to Structural Analysis, 1st ed.; Temple University Press: Philadelphia, PA, USA, 2020. [Google Scholar]
- Mujalli, M.A.; Dirar, S.; Mushtaha, E.; Hussien, A.; Maksoud, A. Evaluation of the Tensile Characteristics and Bond Behaviour of Steel Fibre-Reinforced Concrete: An Overview. Fibers 2022, 10, 104. [Google Scholar] [CrossRef]
- Nagy, D. Structural Analysis with Karamba. 2017. Available online: https://medium.com/generative-design/structural-analysis-with-karamba-a73b959587c0 (accessed on 23 June 2023).


| Virgin Galactic | Blue Origin | SpaceX | |
| Launch | Horizontal | Vertical | Vertical |
| Flight Duration | 2 h | 11 min | 3–6 days |
| Altitude | 262,000 ft | 327,360 ft | 984,252–1,640,420 ft |
| Flight Capacity | 4 passengers, 2 pilots | 6 passengers | 2–4 passengers |
| Flight Price | USD 450k | USD 28 million | N/A |
| Propulsion | Aircraft carrier | Rocket | Rocket |
| Landing | Glides back to Earth like a normal plane | Falls back to Earth using Parachutes | Falls into the water using parachutes |
| Spaceport Operational Requirements | Airport Operational Requirements |
|---|---|
| Post-flight spaceport operations | - |
| Aircraft maintenance facility | Aircraft maintenance facility |
| Passenger training | - |
| Medical screening and support | - |
| Emergency | Emergency |
| Conference facilities | Conference facilities |
| Security | Security |
| Type | Single Runway |
|---|---|
| Direction | Northwest |
| Dimensions | 12,000 × 200 ft (3658 × 61 m) |
| Sectors | Runway 16 Runway 34 |
| Materials | Concrete |
| Traffic Pattern | Left |
| Outcomes | Spaceport America | Abu Dhabi Spaceport |
|---|---|---|
| Design of launch areas | Horizontal launch area Vertical launch area | Horizontal launch area |
| Main zones | Hangar | Hangar |
| Terminal | Hotel | |
| Administration | Educational and training center | |
| Training center | Terminal | |
| Site | Desert of southern New Mexico | Artificial island along the coast of Dubai and Abu Dhabi |
| Isolated from high-population areas | Isolated from high-population areas | |
| 18,000 acres |
| Site Criteria | ||
|---|---|---|
| Operational Consideration | GCAA restrictions | The General Civil Aviation Authority (GCAA) is a federal organization created to regulate civil aviation and provide designated aviation services while ensuring adherence to safety and security standards in order to strengthen theUAE’s aviation industry and its airspace. |
| Air traffic | Tracking air movements and air traffic surrounding the site. | |
| Site area | The site area for a spaceport needs to be large enough to allow for future expansion and to accommodate both the horizontal launch area where spaceplanes are used with a runway length of at least three miles and the vertical launch area where spacecraft/rockets are used. Moreover, it is recommended that a spaceport be sited beside or on coastal locations to increase safety measures. | |
| Geographic Consideration | Safety | Spaceports should be located away from densely populated areas due to safety/environmental regulations and to protect people from the noise and air pollution caused by spacecraft launches. |
| Accessibility | Access to and from the spaceport, like airports, is critical to the overall efficiency of the transportation system. | |
| Landmarks | Selecting a site with nearby landmarks will attract many visitors and tourists to the spaceport. | |
| Near to the equator | According to various space travel sources, orbital travel or spacecraft launches along an equatorial path are the most efficient. | |
| Meteorological Consideration | Meteorological considerations and flight rules for aircraft apply to spacecraft operations as well, including those pertaining to flight visibility, cloud clearance, and strong crosswinds. | |
| Proposed Site 1 | Proposed Site 2 | Proposed Site 3 | |
|---|---|---|---|
| Location | 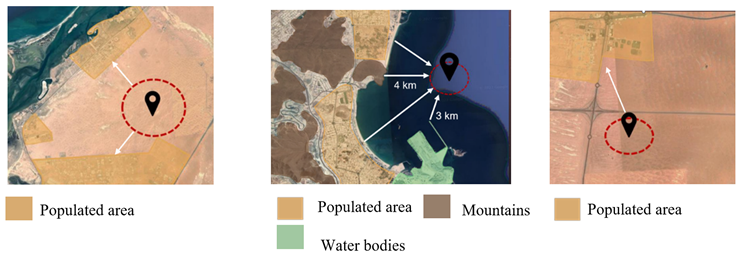 | ||
| The site is located in Al Rafah, Umm Al Quwain, having a latitude of 25°36′10″ north and a longitude of 55°43′9″ east. The site is near Umm Al Quwain Beach. | The site is located in the Gulf of Oman in Khorfakkan, Sharjah, with a latitude of 25°22′12″ north and a longitude of 56°20′51″ east. | The site is located in Al Bataeh, Sharjah, with a latitude of 25°15′58″ north and a longitude of 55°43′55″ east. | |
| Site area | Runway area: 1,200,000 m2 +; vertical launch pad: 4000 m2 +; build area: 50,000 m2 | Runway area: 1,200,000 m2 +; vertical launch pad: 4000 m2 +; build area: 50,000 m2 | Runway area: 1,200,000 m2 +; vertical launch pad: 4000 m2 +; build area 50,000 m2 |
| Safety | The site is near populated areas. The site is 2842.67 km north of the equator. | The site is located away from mountains, populated areas, and waterbodies. The site is 2816.72 km north of the equator. | The site is located away from populated areas. The site is 2821.23 km north of the equator. |
| Air traffic | There are a few flights on and some flights near the site. | There are no flights on and near the site. | There are a few flights on and some flights near the site. |
| Future expansion opportunities | As the site is close to populated areas, future expansion is not feasible. | The site is located away from populated areas, so future expansion is possible. | The site is located away from populated areas, so future expansion is possible. |
| GCAA restrictions | Site 1 is located in a free-fly zone. | Site 2 is located in a no-fly zone. | Site 3 is located in a free-fly zone. |
| Al Rafaah Site | Al Bataeh Site | Khorfakkan Site | |
|---|---|---|---|
| GCAA restrictions |  | | |
| Air traffic | | | |
| Area |  | | |
| Landmarks | | | |
| Safety | | | |
| Accessibility | | | |
| Cloud clearance | | | |
| Waterbodies | | | |
| Nearest to the equator | | | |
| Type | Input Constraints by Authors |
|---|---|
| 1, 2, 3, 4, 5, 6, 7, 8, 9, 10, 11, 12, 13, 14, 15, 16, 17, 20, 21, 22, 24, 26 | Number of Added Masses: 7 Size of Vertical Added Mass: 2 to 4 Size of Horizontal Added Mass: 2 to 4 Number of Floors: 3–4 Span Size: X: 8, Y: 8 Floor Height: 4.5 |
| 18, 28 | Number of Added Masses: 6 Size of Vertical Added Mass: 2 to 4 Size of Horizontal Added Mass: 2 to 4 Number of Floors: 3–4 Span Size: X: 8, Y: 8 Floor Height: 4.5 |
| 23, 27 | Number of Added Masses: 4 Size of Vertical Added Mass: 2 to 4 Size of Horizontal Added Mass: 2 to 4 Number of Floors: 3–4 Span Size: X: 8, Y: 8 Floor Height: 4.5 |
| 25, 30 | Number of Added Masses: 5 Size of Vertical Added Mass: 2 to 4 Size of Horizontal Added Mass: 2 to 4 Number of Floors: 3–4 Span Size: X: 8, Y: 8 Floor Height: 4.5 |
| The Range of UTCI (°C) | Stress Classification |
|---|---|
| >46 | Extreme heat stress |
| +38 to +46 | Very strong heat stress |
| +32 to +38 | Strong heat stress |
| +26 to +32 | Moderate heat stress |
| +9 to +26 | No thermal stress |
| 0 to +9 | Slight cold stress |
| −13 to 0 | Moderate cold stress |
| −27 to −13 | Strong cold stress |
| −40 to −27 | Very strong cold stress |
| <−40 | Extreme cold stress |
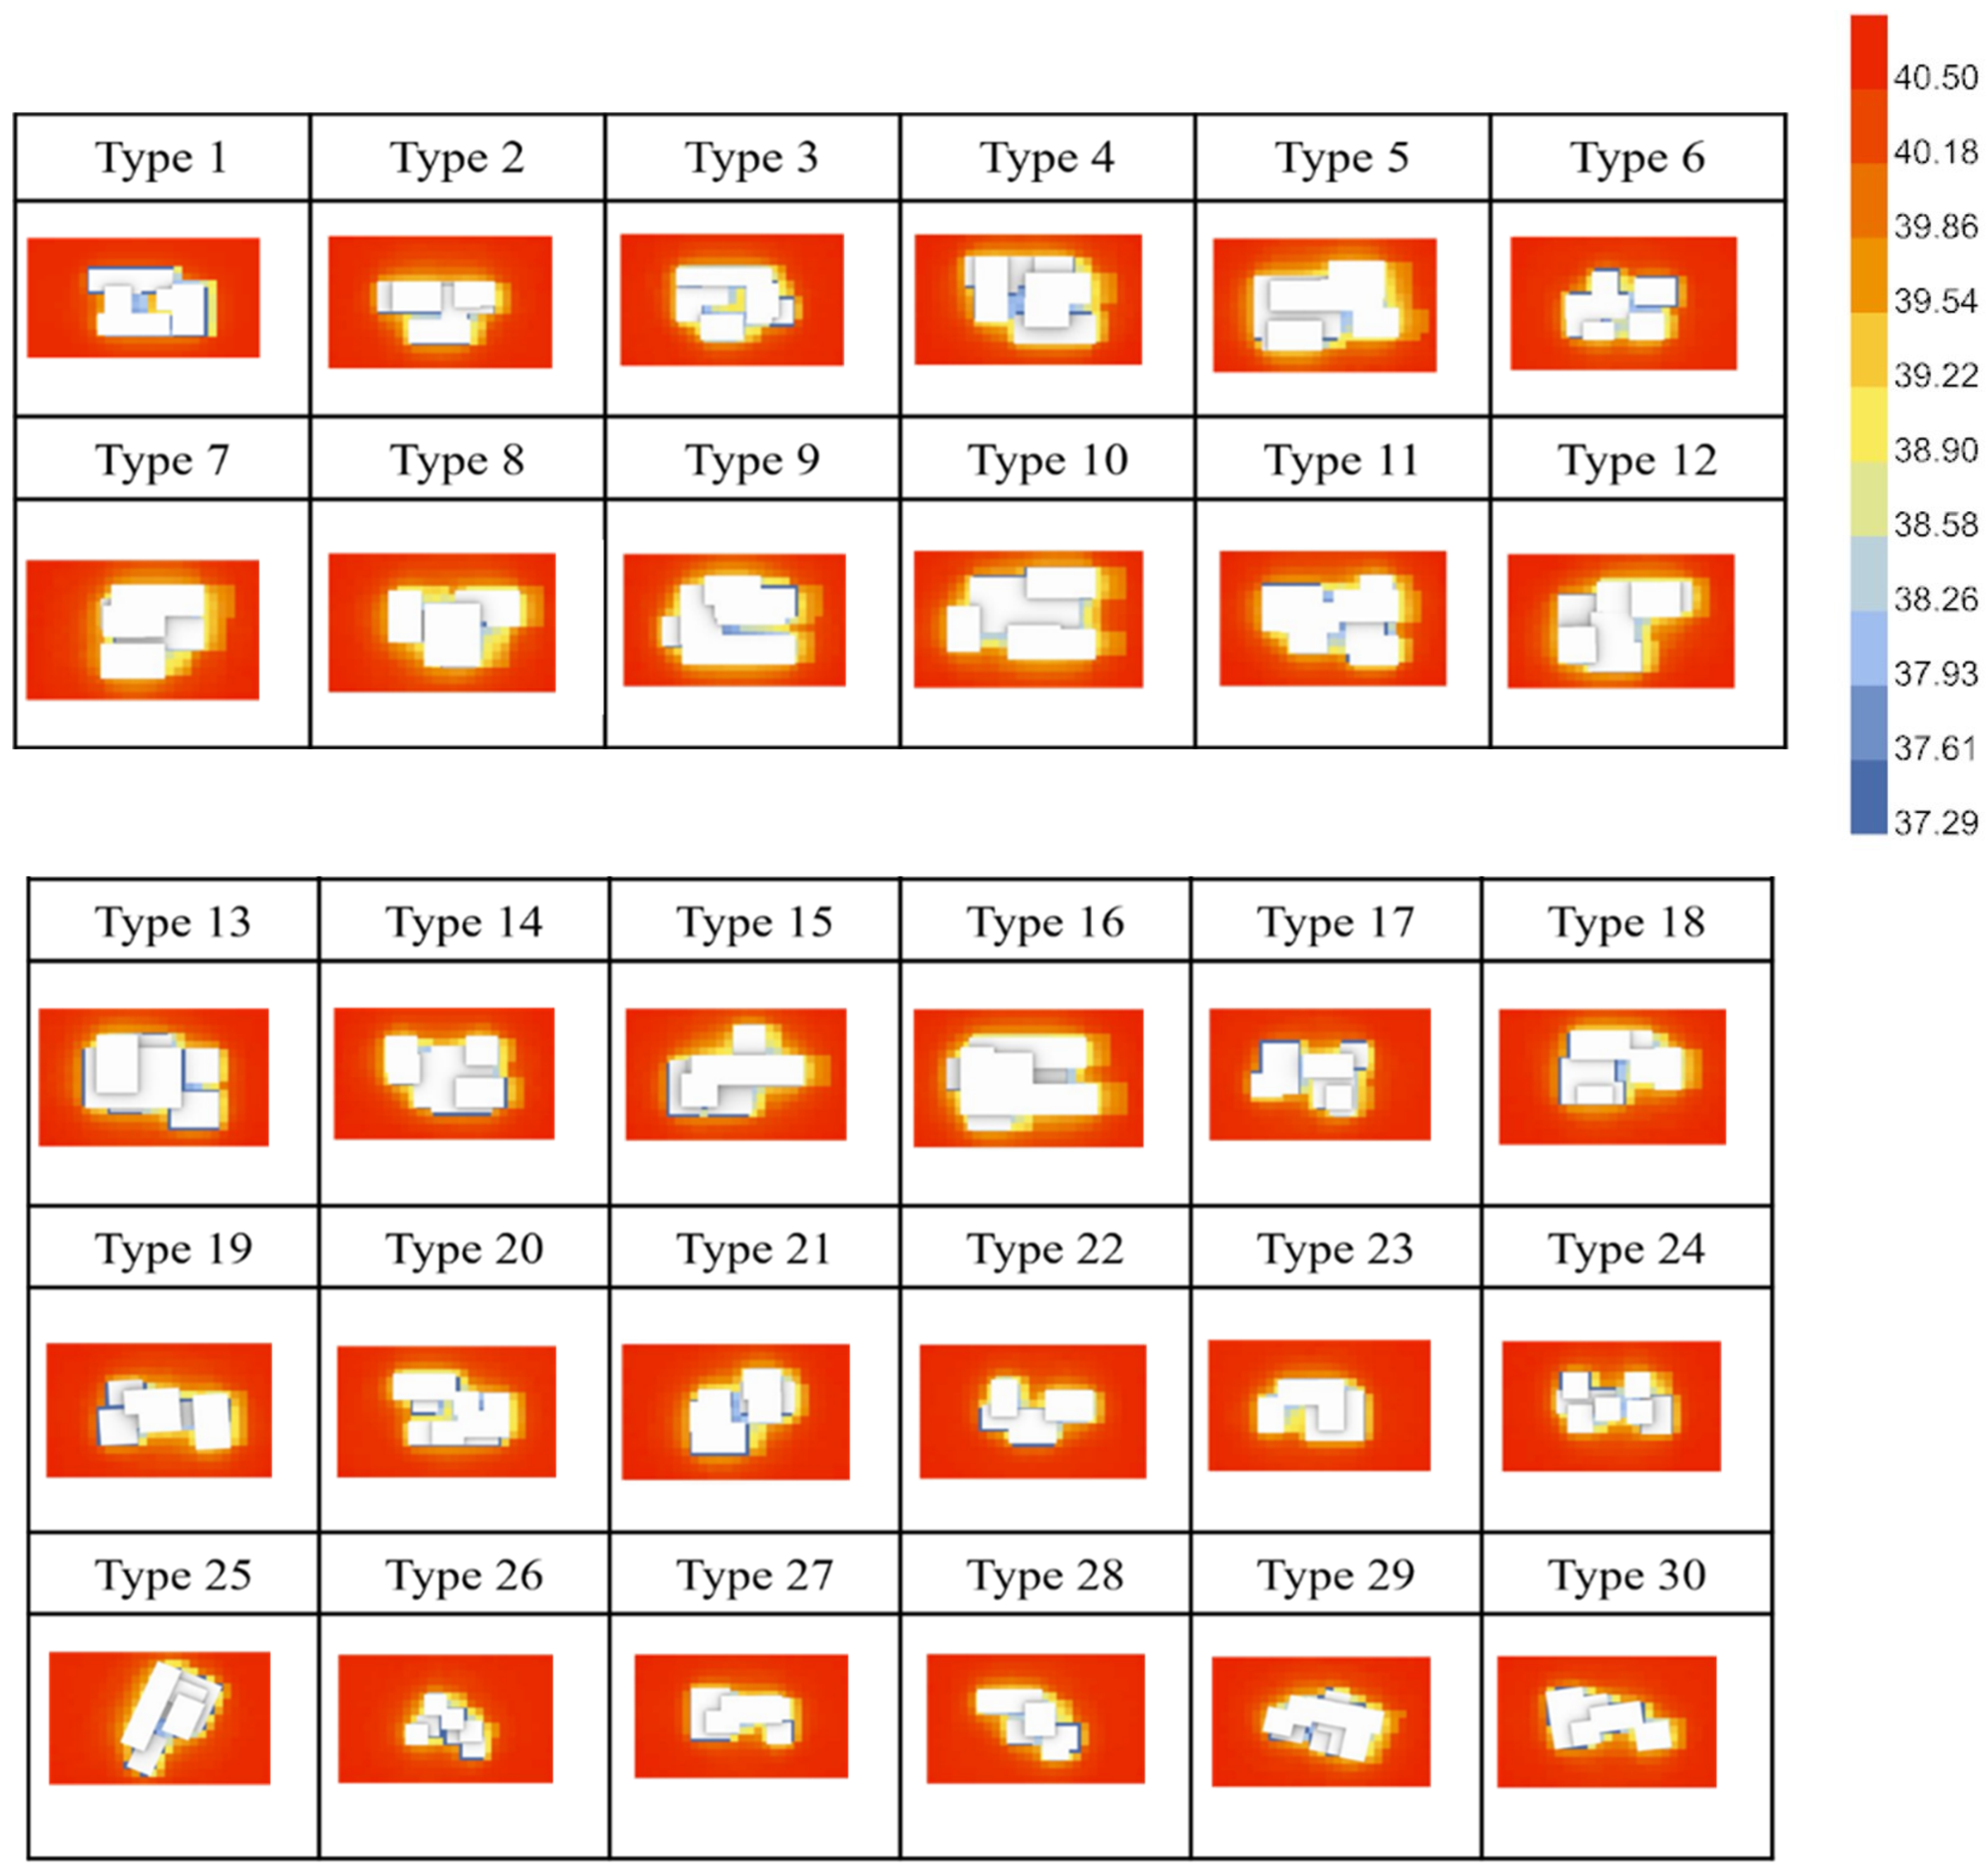
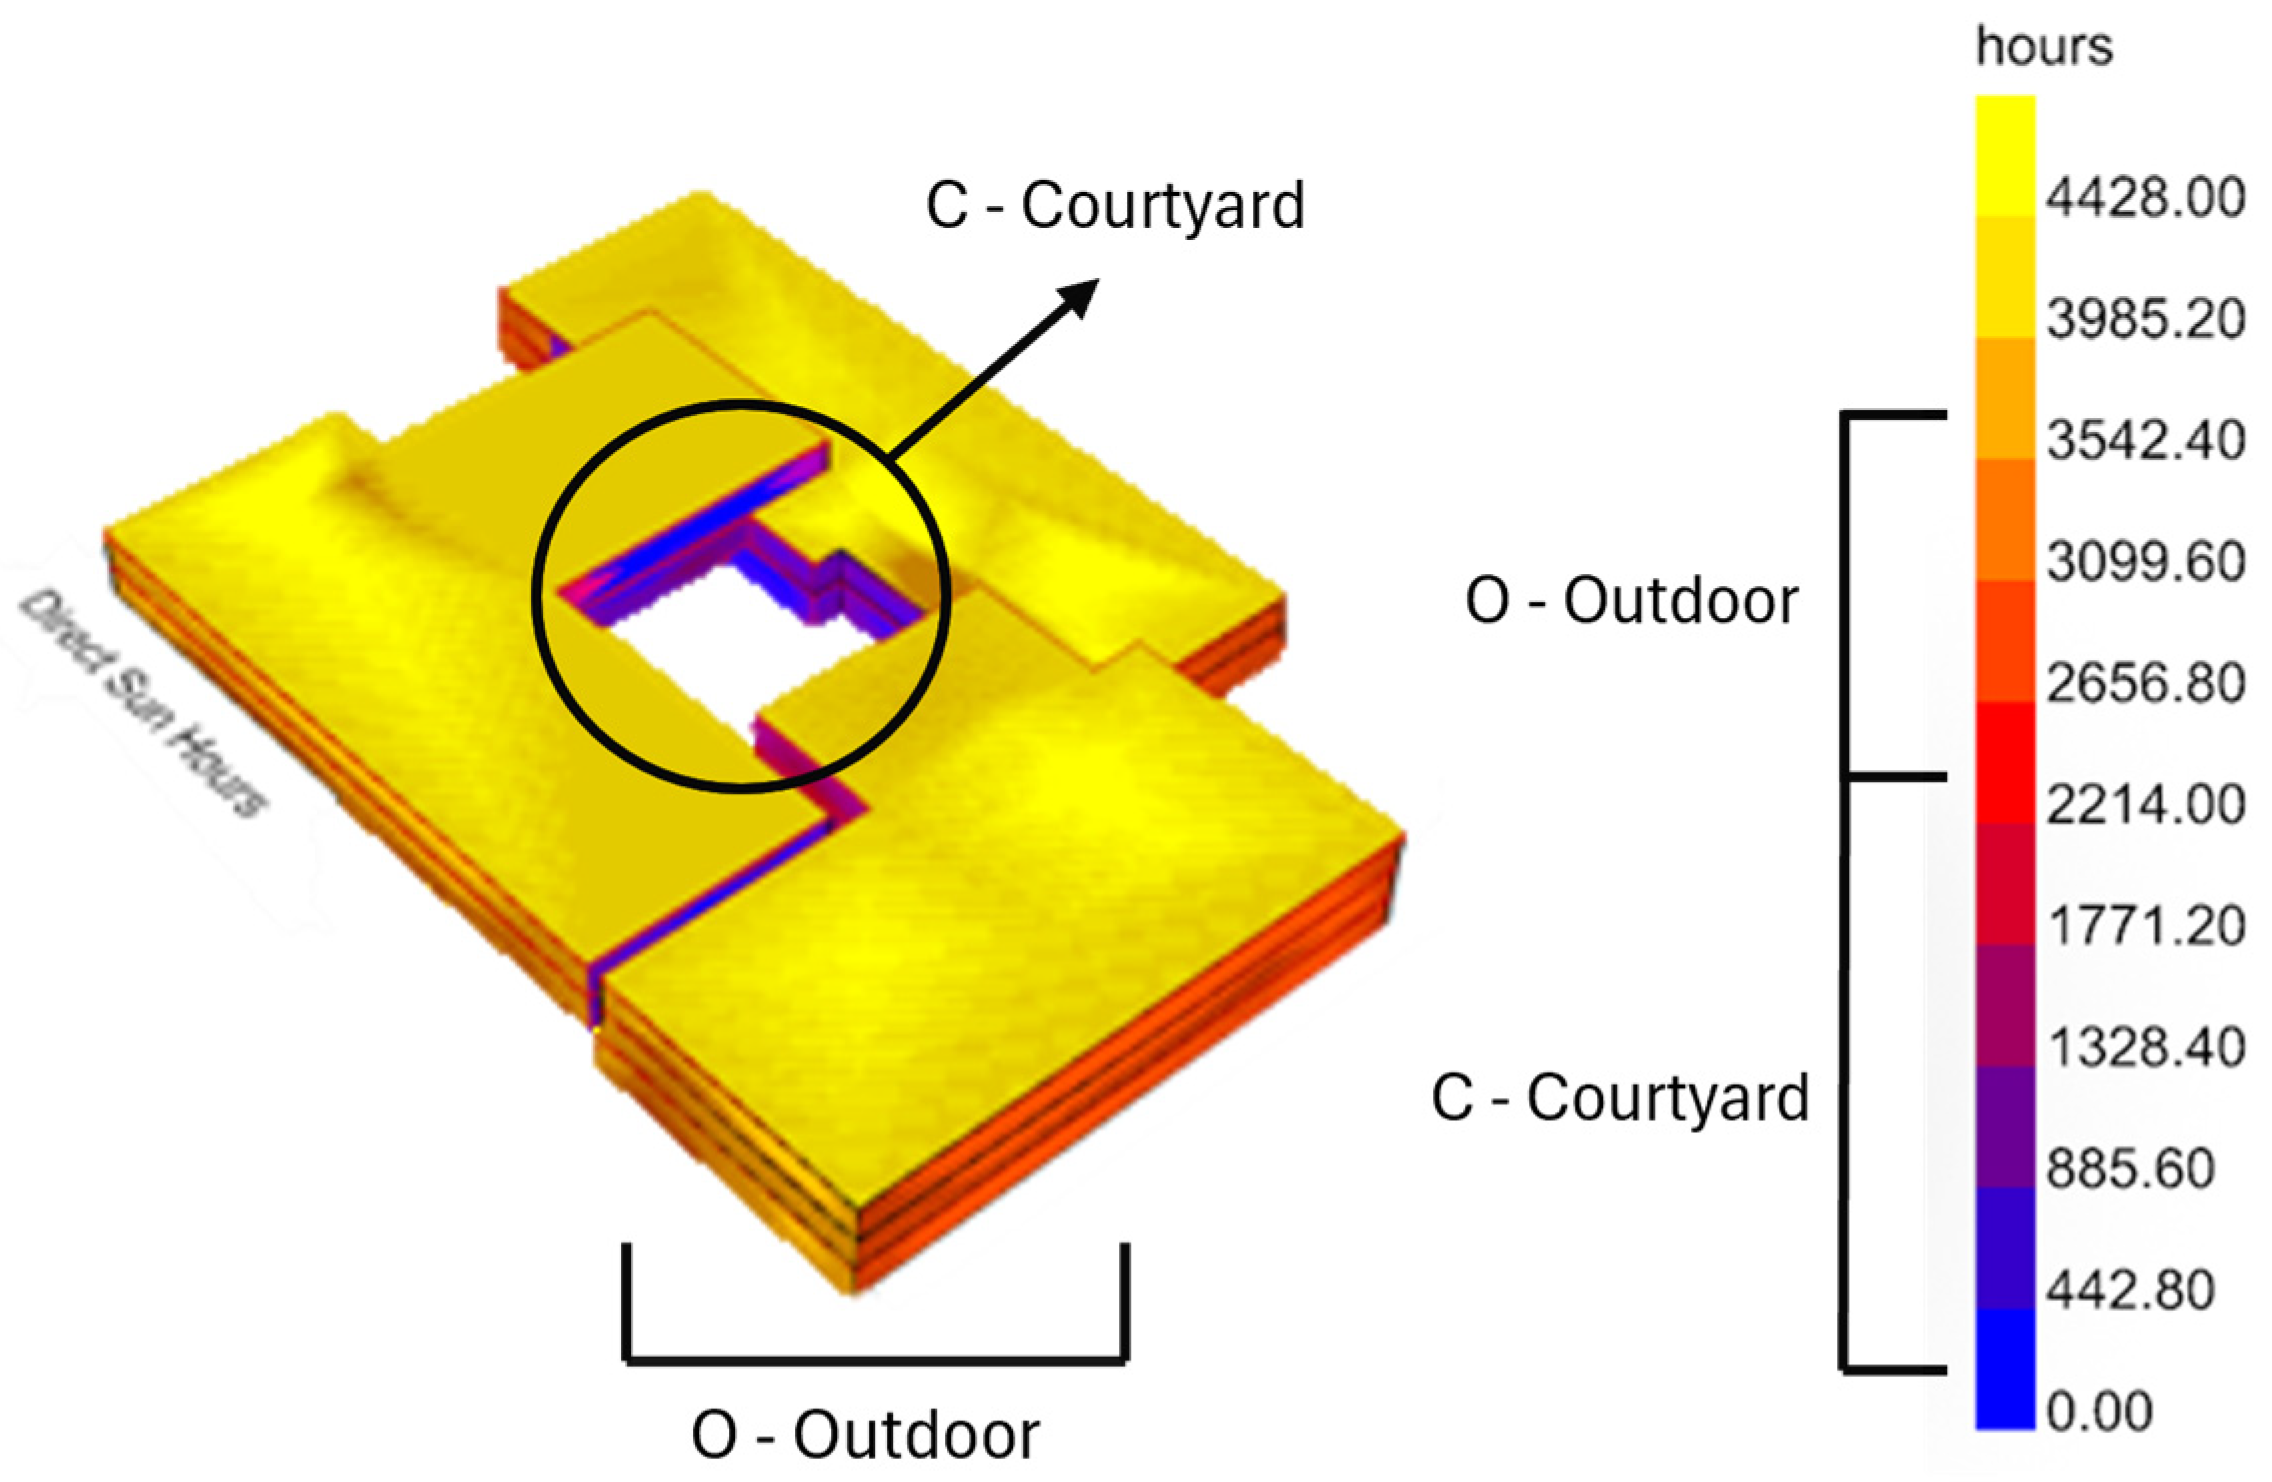
| Key | O—Outdoor C—Courtyard P—Patio 2—Winter 4—Spring 8—Summer | |||
|---|---|---|---|---|
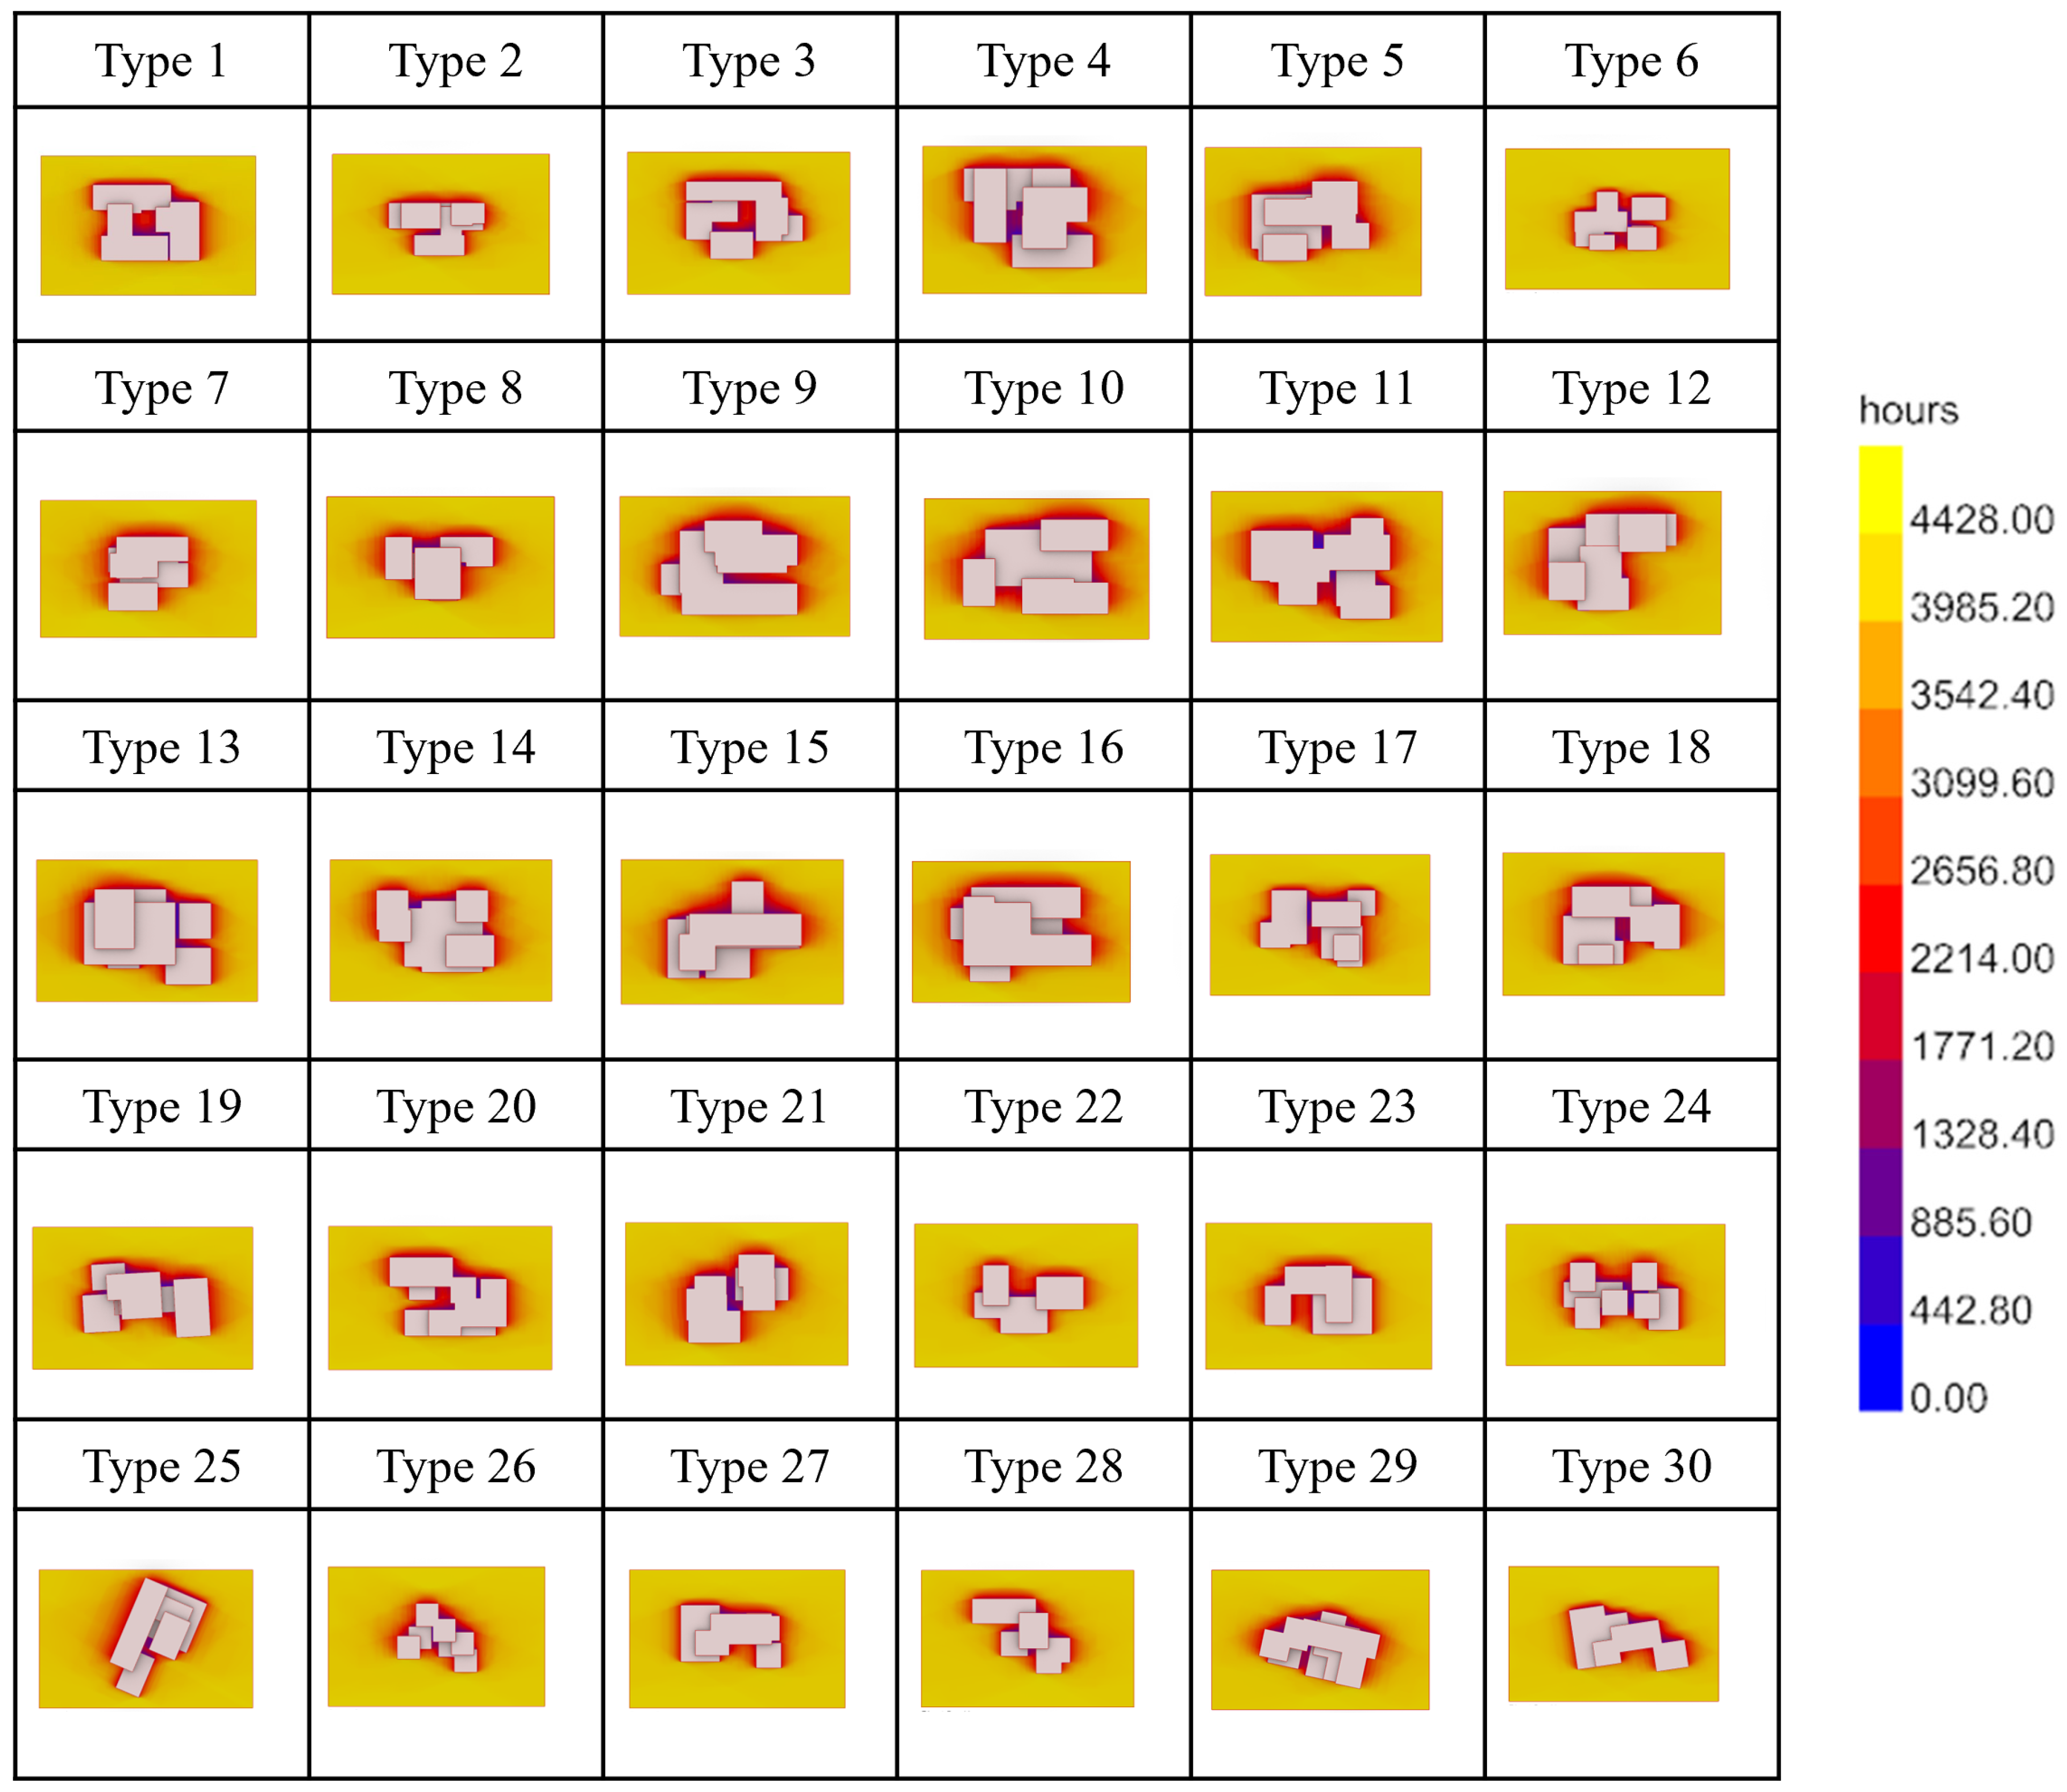
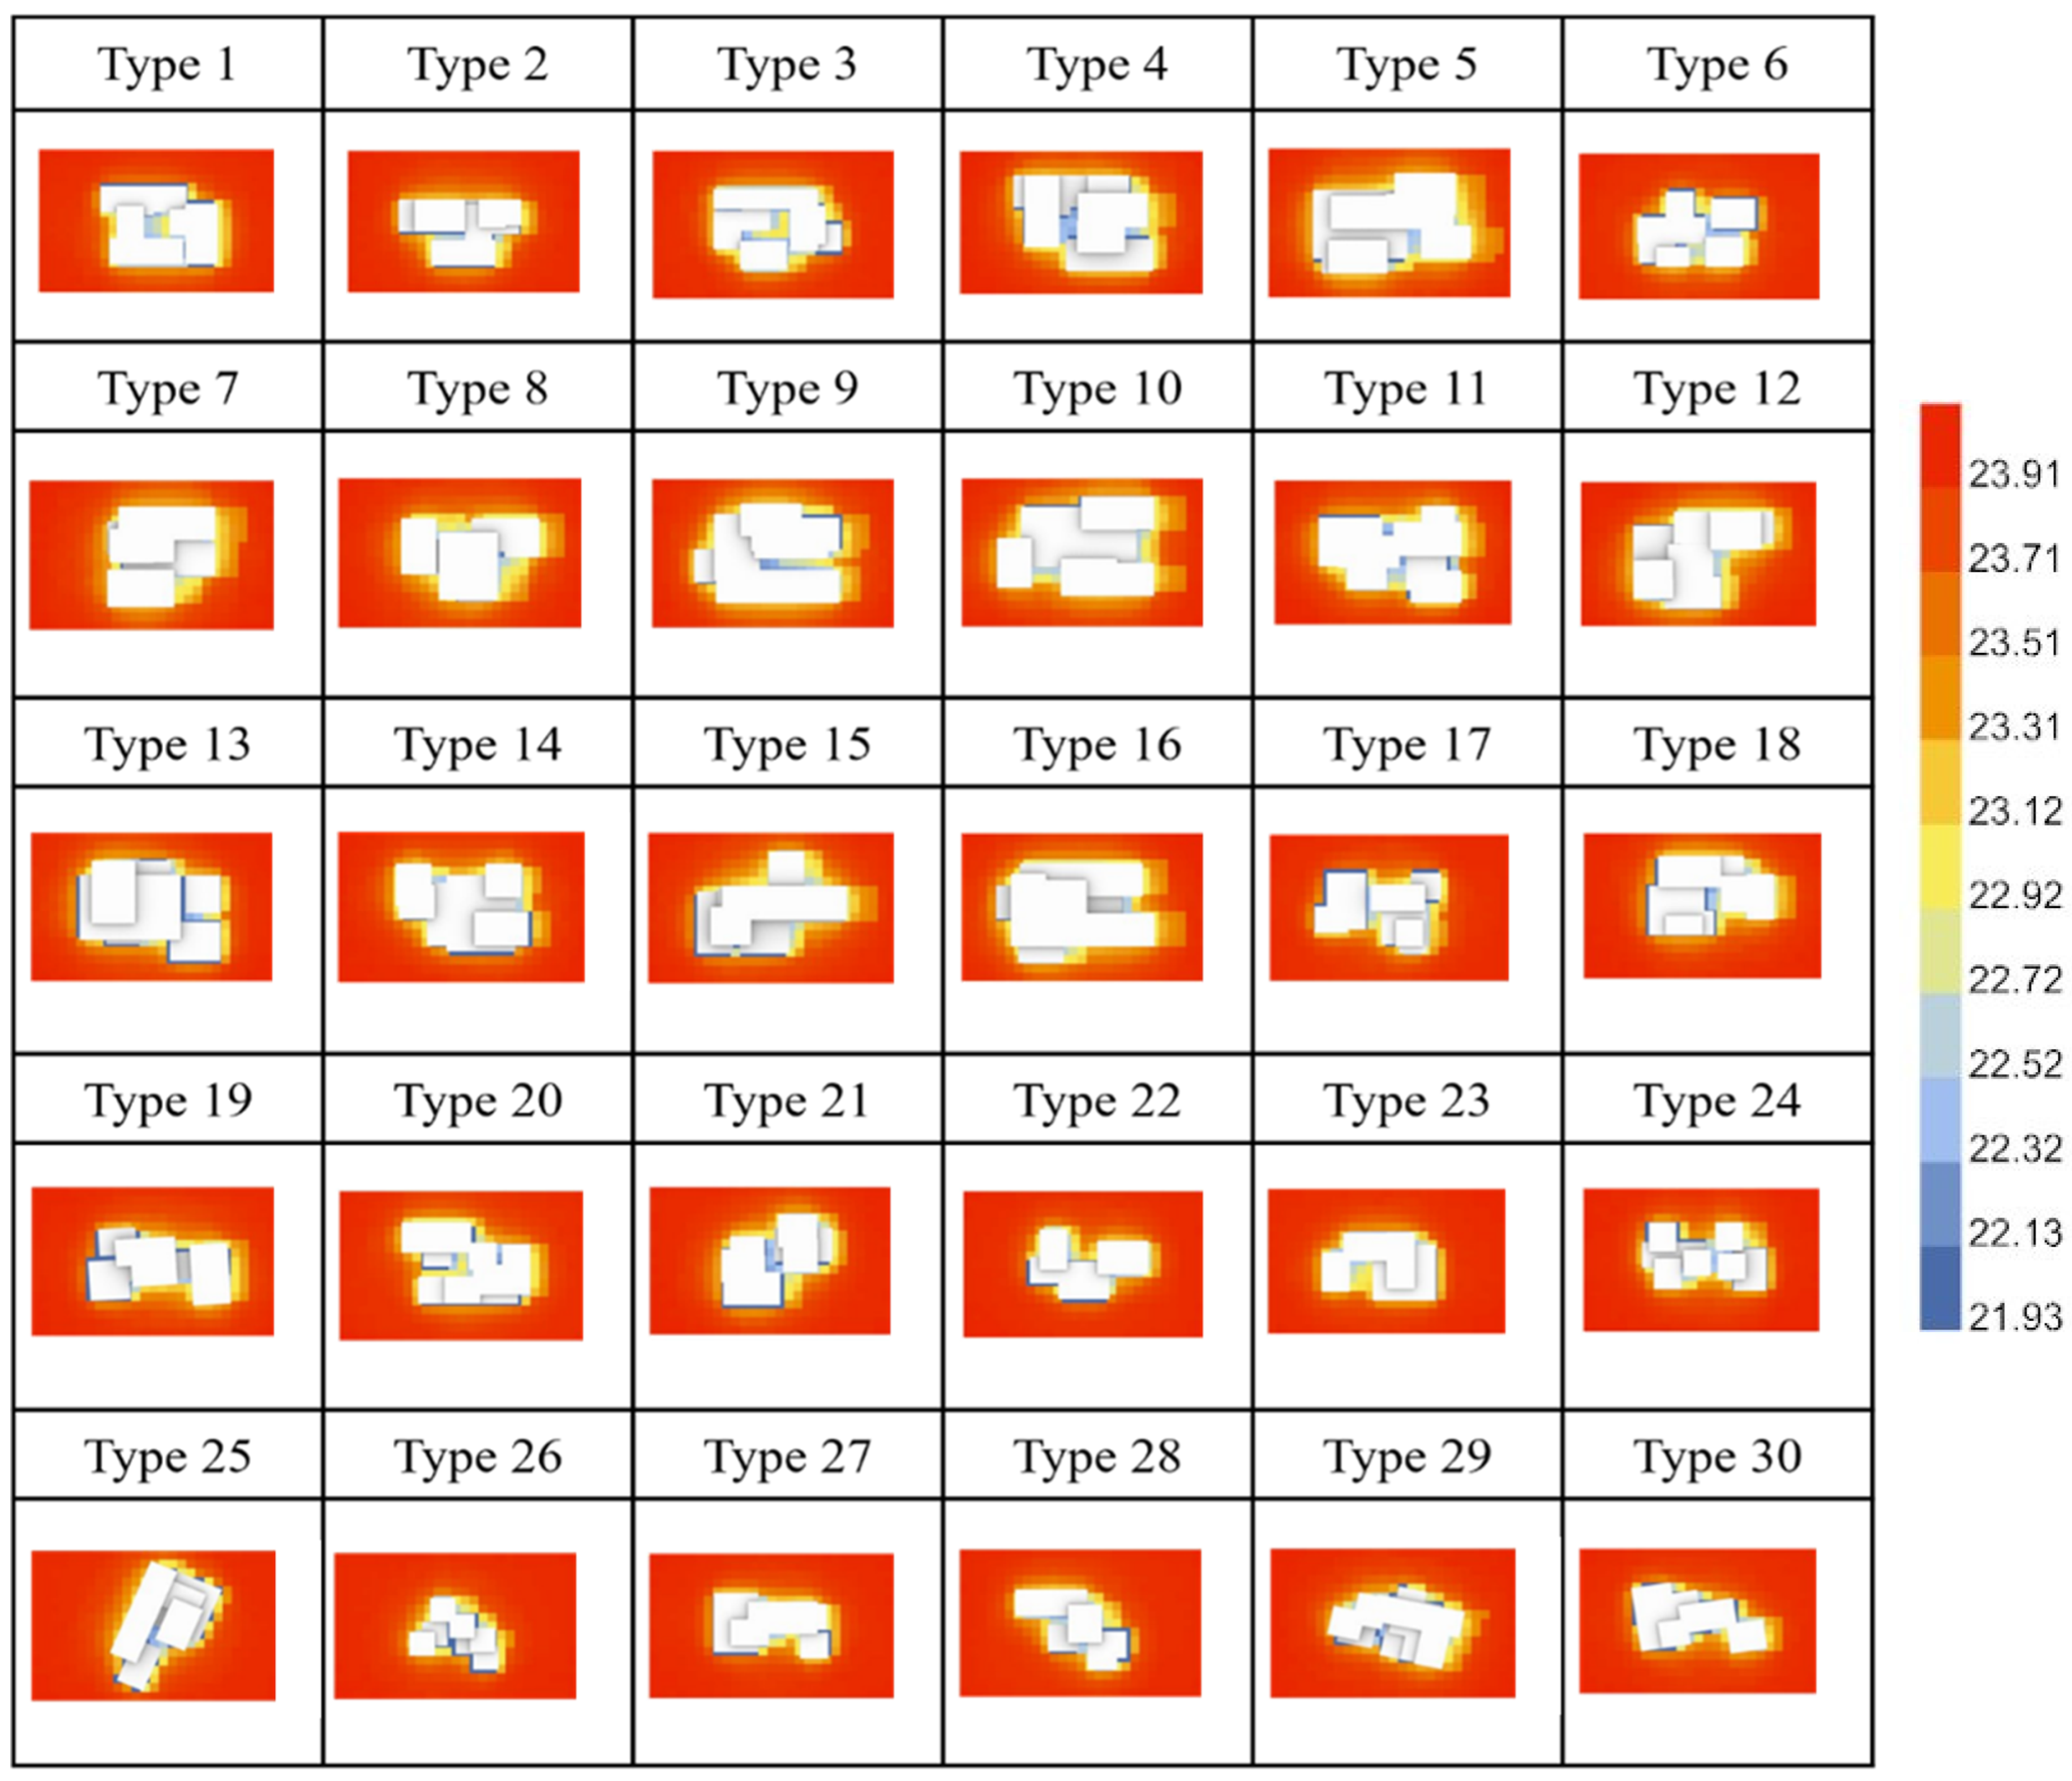
| Type | Sun Path | Shadow | Solar Radiation | Outdoor Comfort |
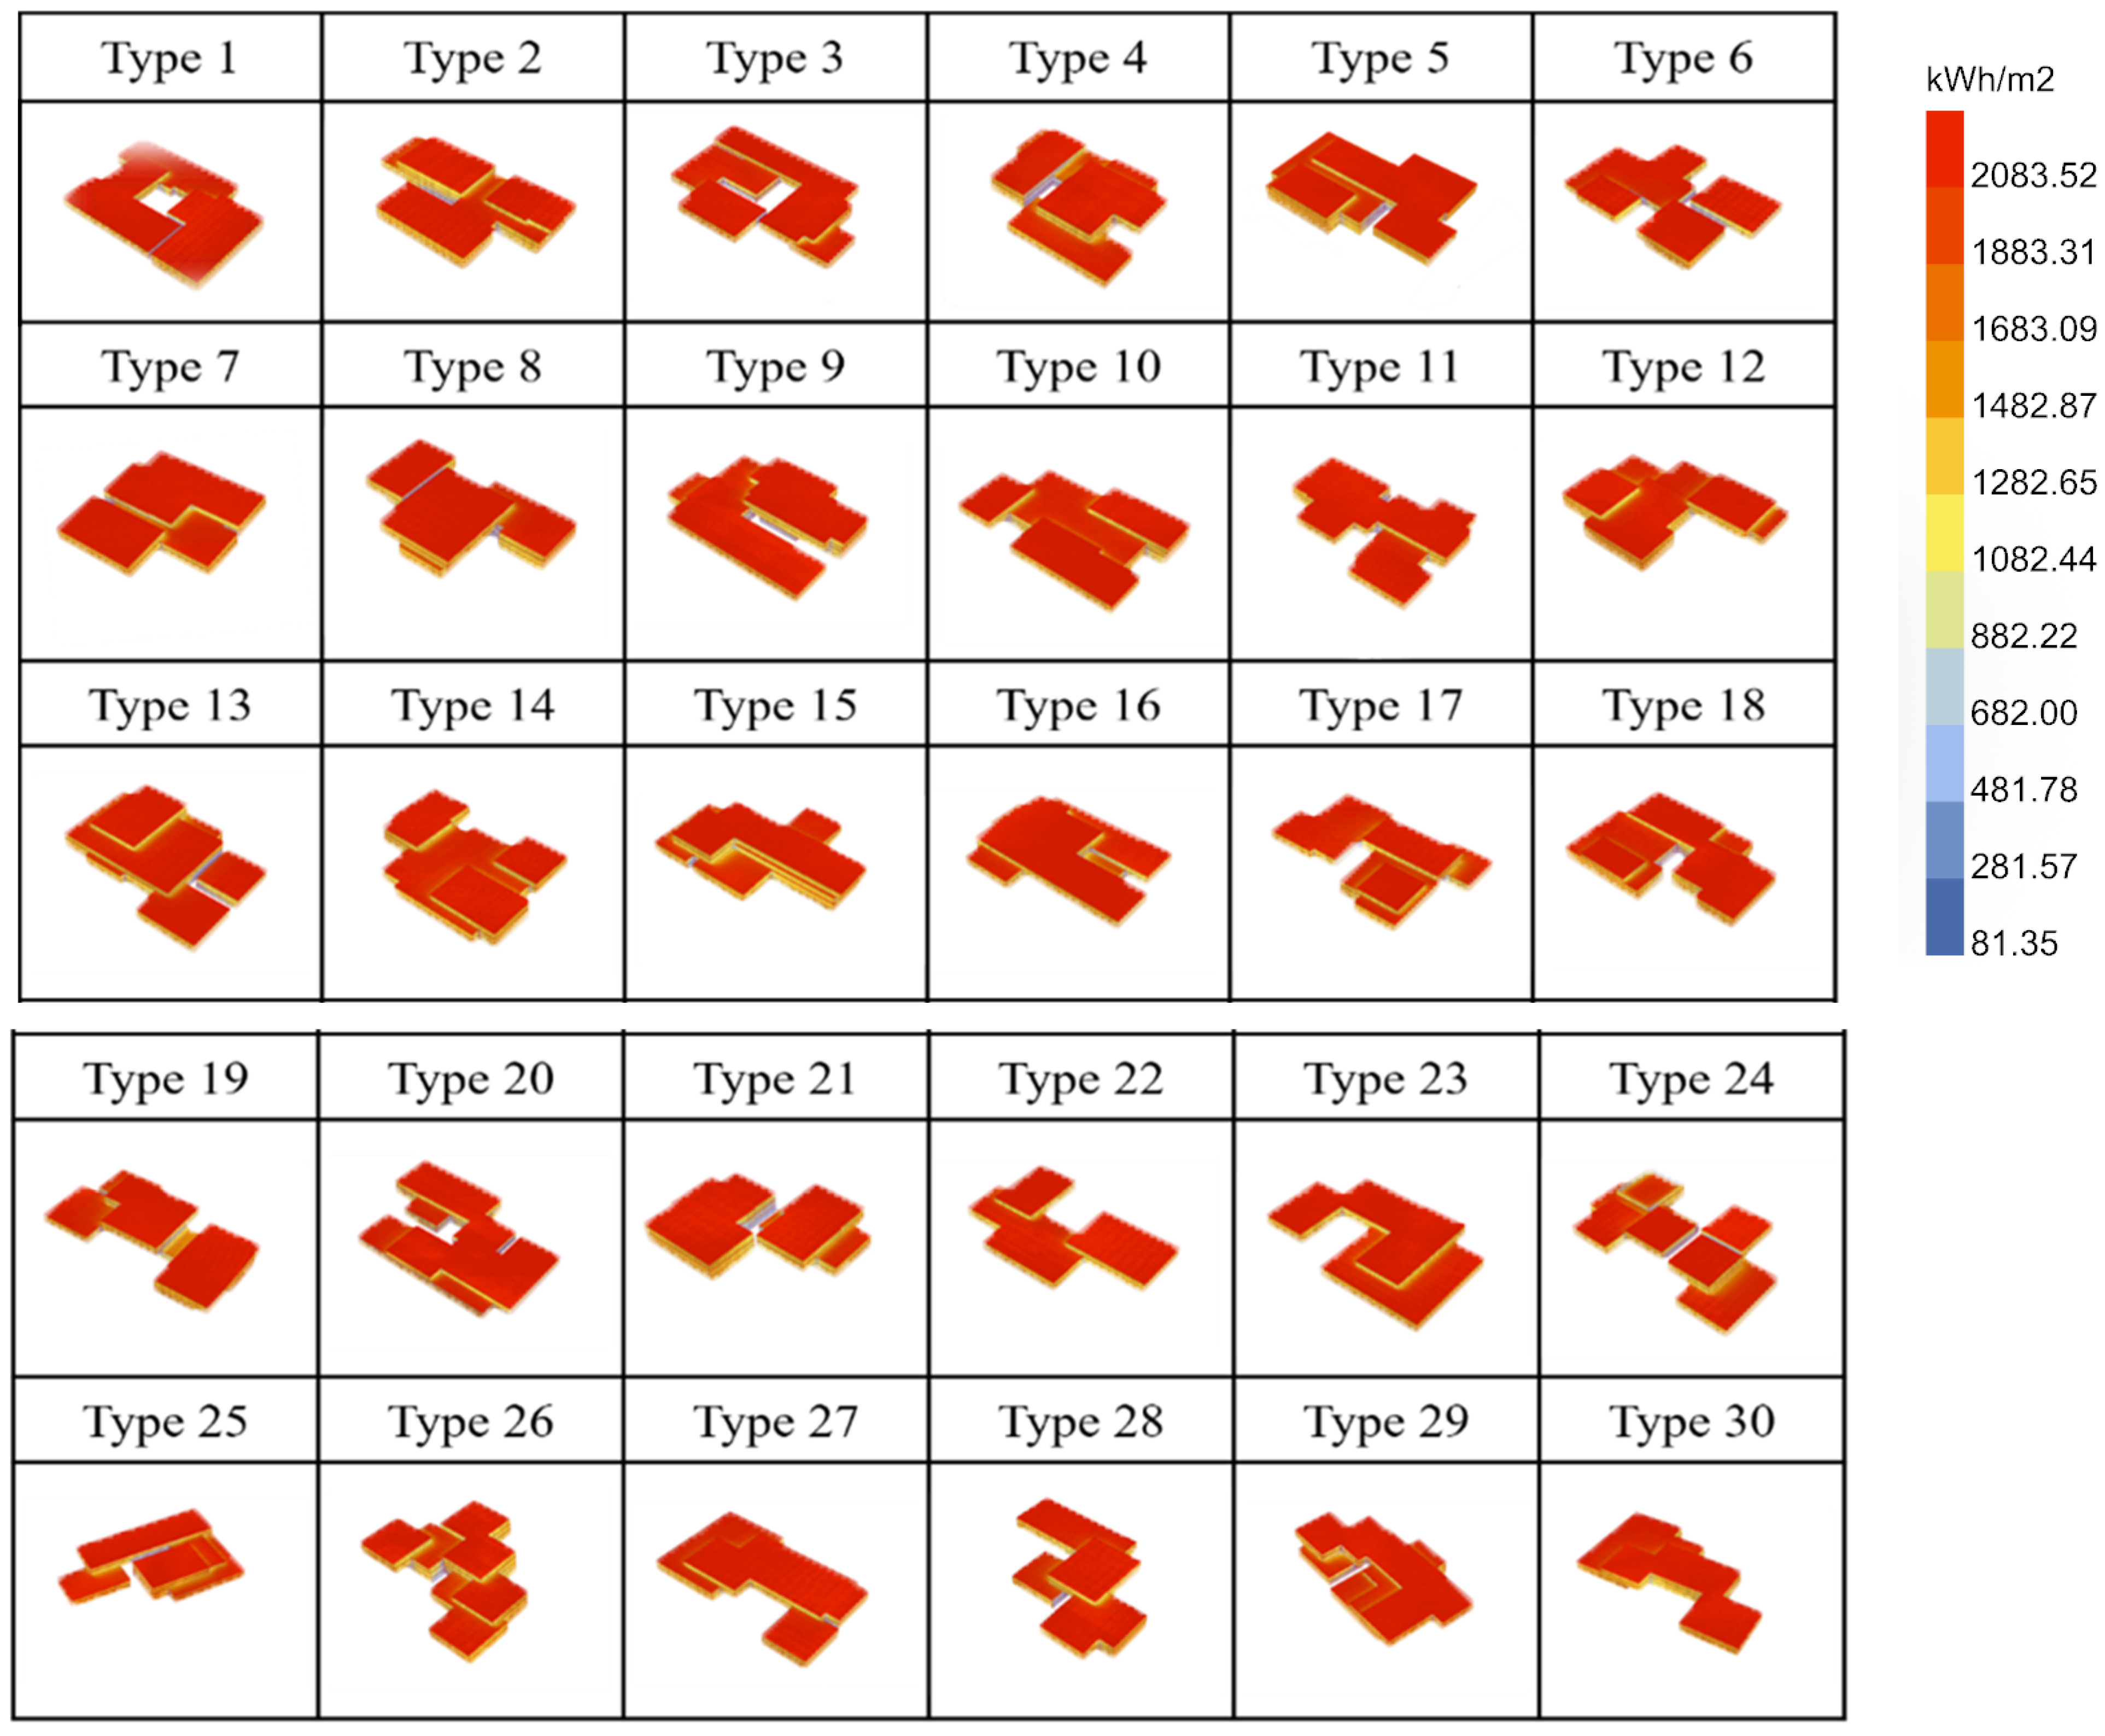
| 1 | O—3985.20-2214.00 C—2214.00-0.00 | O—3985.20-885.60 C—2214.00-442.80 | O—2083.52-1041.76 C—1250.11-416.70 | 2-O—23.44-20.95 C—22.51-20.33 4-O—23.91-21.93 C—22.92-22.13 8-O—40.50-37.29 C—38.90-37.29 |
| 2 | O—3542.40-0.00 | O—3985.20-885.60 | O—2083.52-416.70 | 2-O—23.43-20.33 4-O—23.90-21.93 8-O—40.47-37.61 |
| 3 | O—3099.60-2214.00 C—1771.20-0.00 | O—3542.40-2214.00 C—2214.00-885.60 | O—2083.52-1041.76 C—1041.76-416.70 | 2-O—23.43-20.33 C—22.50-20.33 4-O—23.90-21.93 C—22.91-22.12 8-O—40.49-37.29 C—39.21-37.29 |
| 4 | O—3542.40-2214.00 C—1771.20-0.00 | O—3099.60-885.60 C—1771.20-0.00 | O—2083.52-1041.76 C—625.06-208.35 | 2–O—23.42-20.33 C—20.46-20.33 4-O—23.87-21.93 C—22.32-21.93 8-O—40.47-37.29 C—37.39-37.29 |
| 5 | O—3985.20-2214.00 P—3099.60-0.00 | O—3985.20-1328.40 P—1328.40-885.60 | O—2083.52-1250.11 P—1250.11-416.70 | 2-O—23.40-20.33 P—20.95-20.64 4-O—23.86-21.93 P—22.70-22.31 8-O—40.45-37.29 P—37.92-37.61 |
| 6 | O—3099.6-0.00 | O—3542.40-442.80 | O—2083.52-416.70 | 2-O—23.45-20.33 4-O—23.92-21.93 8-O—40.52-37.29 |
| 7 | O—3099.60-442.80 | O—3985.20-1771.20 | O—2083.52-416.70 | 2-O—23.41-20.33 4-O—23.87-22.32 8-O--40.47-37.29 |
| 8 | O—3099.60-0.00 | O—3542.40-885.60 | O—2083.52-416.70 | 2-O—23.42-20.64 4-O—23.87-22.32 8-O—40.46-37.29 |
| 9 | O—3985.20-2214.00 P—2214.00-0.00 | O—3542.40-880.20 P—1760.40-440.10 | O—2083.52-416.70 P—1041.76-416.70 | 2-O—23.41-20.95 P—22.18-20.33 4-O—23.87-21.93 P—22.90-22.12 8-O—40.46-37.29 P—39.19-37.61 |
| 10 | O—3542.40-0.00 | O—3542.40-1328.40 | O—2083.52-625.06 | 2-O—23.42-20.33 4-O—23.85-21.93 8-O—40.45-37.29 |
| 11 | O—3542.40-2214.00 P—2214.00-0.00 | O—3542.40-2214.0 C—1771.20-0.00 | O—2083.52-625.06 C—1041.76-416.70 | 2-O—23.41-20.33 C—21.26-20.33 4-O—23.87-21.93 C—22.90-22.12 8-O—40.46-37.29 C—37.93-37.29 |
| 12 | O—3099.60-885.60 | O—3542.40-885.60 | O—2083.52-625.06 | 2-O—23.41-20.33 4-O—23.86-21.93 8-O—40.46-37.29 |
| 13 | O—3542.40-0.00 | O—3099.60-0.00 | O—2083.52-208.35 | 2-O—23.41-20.33 4-O—23.87-21.93 8-O—40.46-37.29 |
| 14 | O—3099.60-885.60 | O—3985.20-885.60 | O—2083.52-625.06 | 2-O—23.42-20.33 4-O—23.87-21.93 8-O—40.47-37.29 |
| 15 | O—2656.80-442.80 | O—3099.60-885.60 | O—2083.52-625.06 | 2-O—23.41-20.33 4-O—23.87-21.93 8-O—40.46-37.29 |
| 16 | O—2656.80-0.00 | O—3985.20-1328.40 | O—2083.52-625.06 | 2-O—23.41-20.33 4-O—23.86-22.51 8-O—40.46-37.29 |
| 17 | O—3099.60-442.80 | O—3542.40-442.80 | O—2083.52-416.70 | 2-O—23.44-20.33 4-O—23.91-21.93 8-O—40.50-37.29 |
| 18 | O—3099.60-442.80 P—1328.40-0.00 | O—3542.40-442.80 P—1771.20- 442.80 | O—2083.52-1041.76 C—1041.76-416.70 | 2-O—23.41-20.33 P—20.95-20.33 4-O—23.89-21.93 P—22.91-21.93 8-O—40.46-37.93 P—37.93-37.29 |
| 19 | O—3099.60-0.00 | O—3542.40-442.80 | O—2083.52-625.06 | 2-O—23.43-20.33 4-O—23.90-21.93 8-O—40.49-37.29 |
| 20 | O—2656.80-0.00 P—2214.00-0.00 | O—3542.40-885.60 P—3099.60-442.80 | O—2083.52-625.06 P—1041.76-416.70 | 2-O—23.45-20.33 P—22.52-20.33 4-O—23.92-21.93 P—22.92-21.93 8-O—40.49-37.29 P—38.89-37.29 |
| 21 | O—3099.60-2214.00 P—2214.00-442.80 | O—3542.40-1328.40 P—1328.40442.80 | O—2083.52-625.06 P—1041.76-416.70 | 2-O—23.42-20.33 P—21.26-20.33 4-O—23.89-21.93 P—22.32-21.93 8-O—40.47-37.29 P—38.89-37.61 |
| 22 | O—3542.40-0.00 | O—3099.60-442.80 | O—2083.2-1041.76 | 2-O—23.45-20.64 4-O—23.91-21.93 8-O—40.52-37.62 |
| 23 | O—3542.40-0.00 | O—3985.20-885.60 | O—2083.2-1041.76 | 2-O—23.44-20.33 4-O—23.91-22.32 8-O—40.49-37.29 |
| 24 | O—3099.60-0.00 | O—3985.2-442.80 | O—2083.2-208.35 | 2– O—23.42-20.33 4– O—23.89-21.93 8–O—40.49-37.29 |
| 25 | O—2214.00-1771.20 P—2214.00-0.00 | O—3542.40-1771.20 P—2214.00-885.60 | O—2083.52-1041.76 P—833.41-416.70 | 2-O—23.43-20.33 P—20.95-20.33 4-O—23.90-21.93 P—22.32-21.93 8-O—40.49-37.29 P—38.25-37.29 |
| 26 | O—2656.80-0.00 | O—3542.40-885.60 | O—2083.52-416.70 | 2-O—23.44-20.33 4-O—23.91-21.93 8-O—40.49-37.29 |
| 27 | O—3099.60-885.60 | O—3099.60-1328.40 | O—2083.52-416.70 | 2-O—23.44-20.33 4-O—23.91-21.93 8-O—40.50-37.29 |
| 28 | O—2656.8-0.00 | O—3542.40-885.60 | O—2083.52-416.70 | 2–O—23.43-20.64 4–O—23.91-21.93 8–O—40.50-37.28 |
| 29 | O—2656.80-0.00 | O—3985.20-885.60 | O—2083.52-416.70 | 2-O—23.42-20.64 4-O—23.89-21.93 8-O—40.47-37.29 |
| 30 | O—3099.60-1771.20 | O—3985.20-885.60 | O—2083.52-833.41 | 2-O—23.44-20.33 4-O—23.91-21.93 8-O—40.52-37.29 |
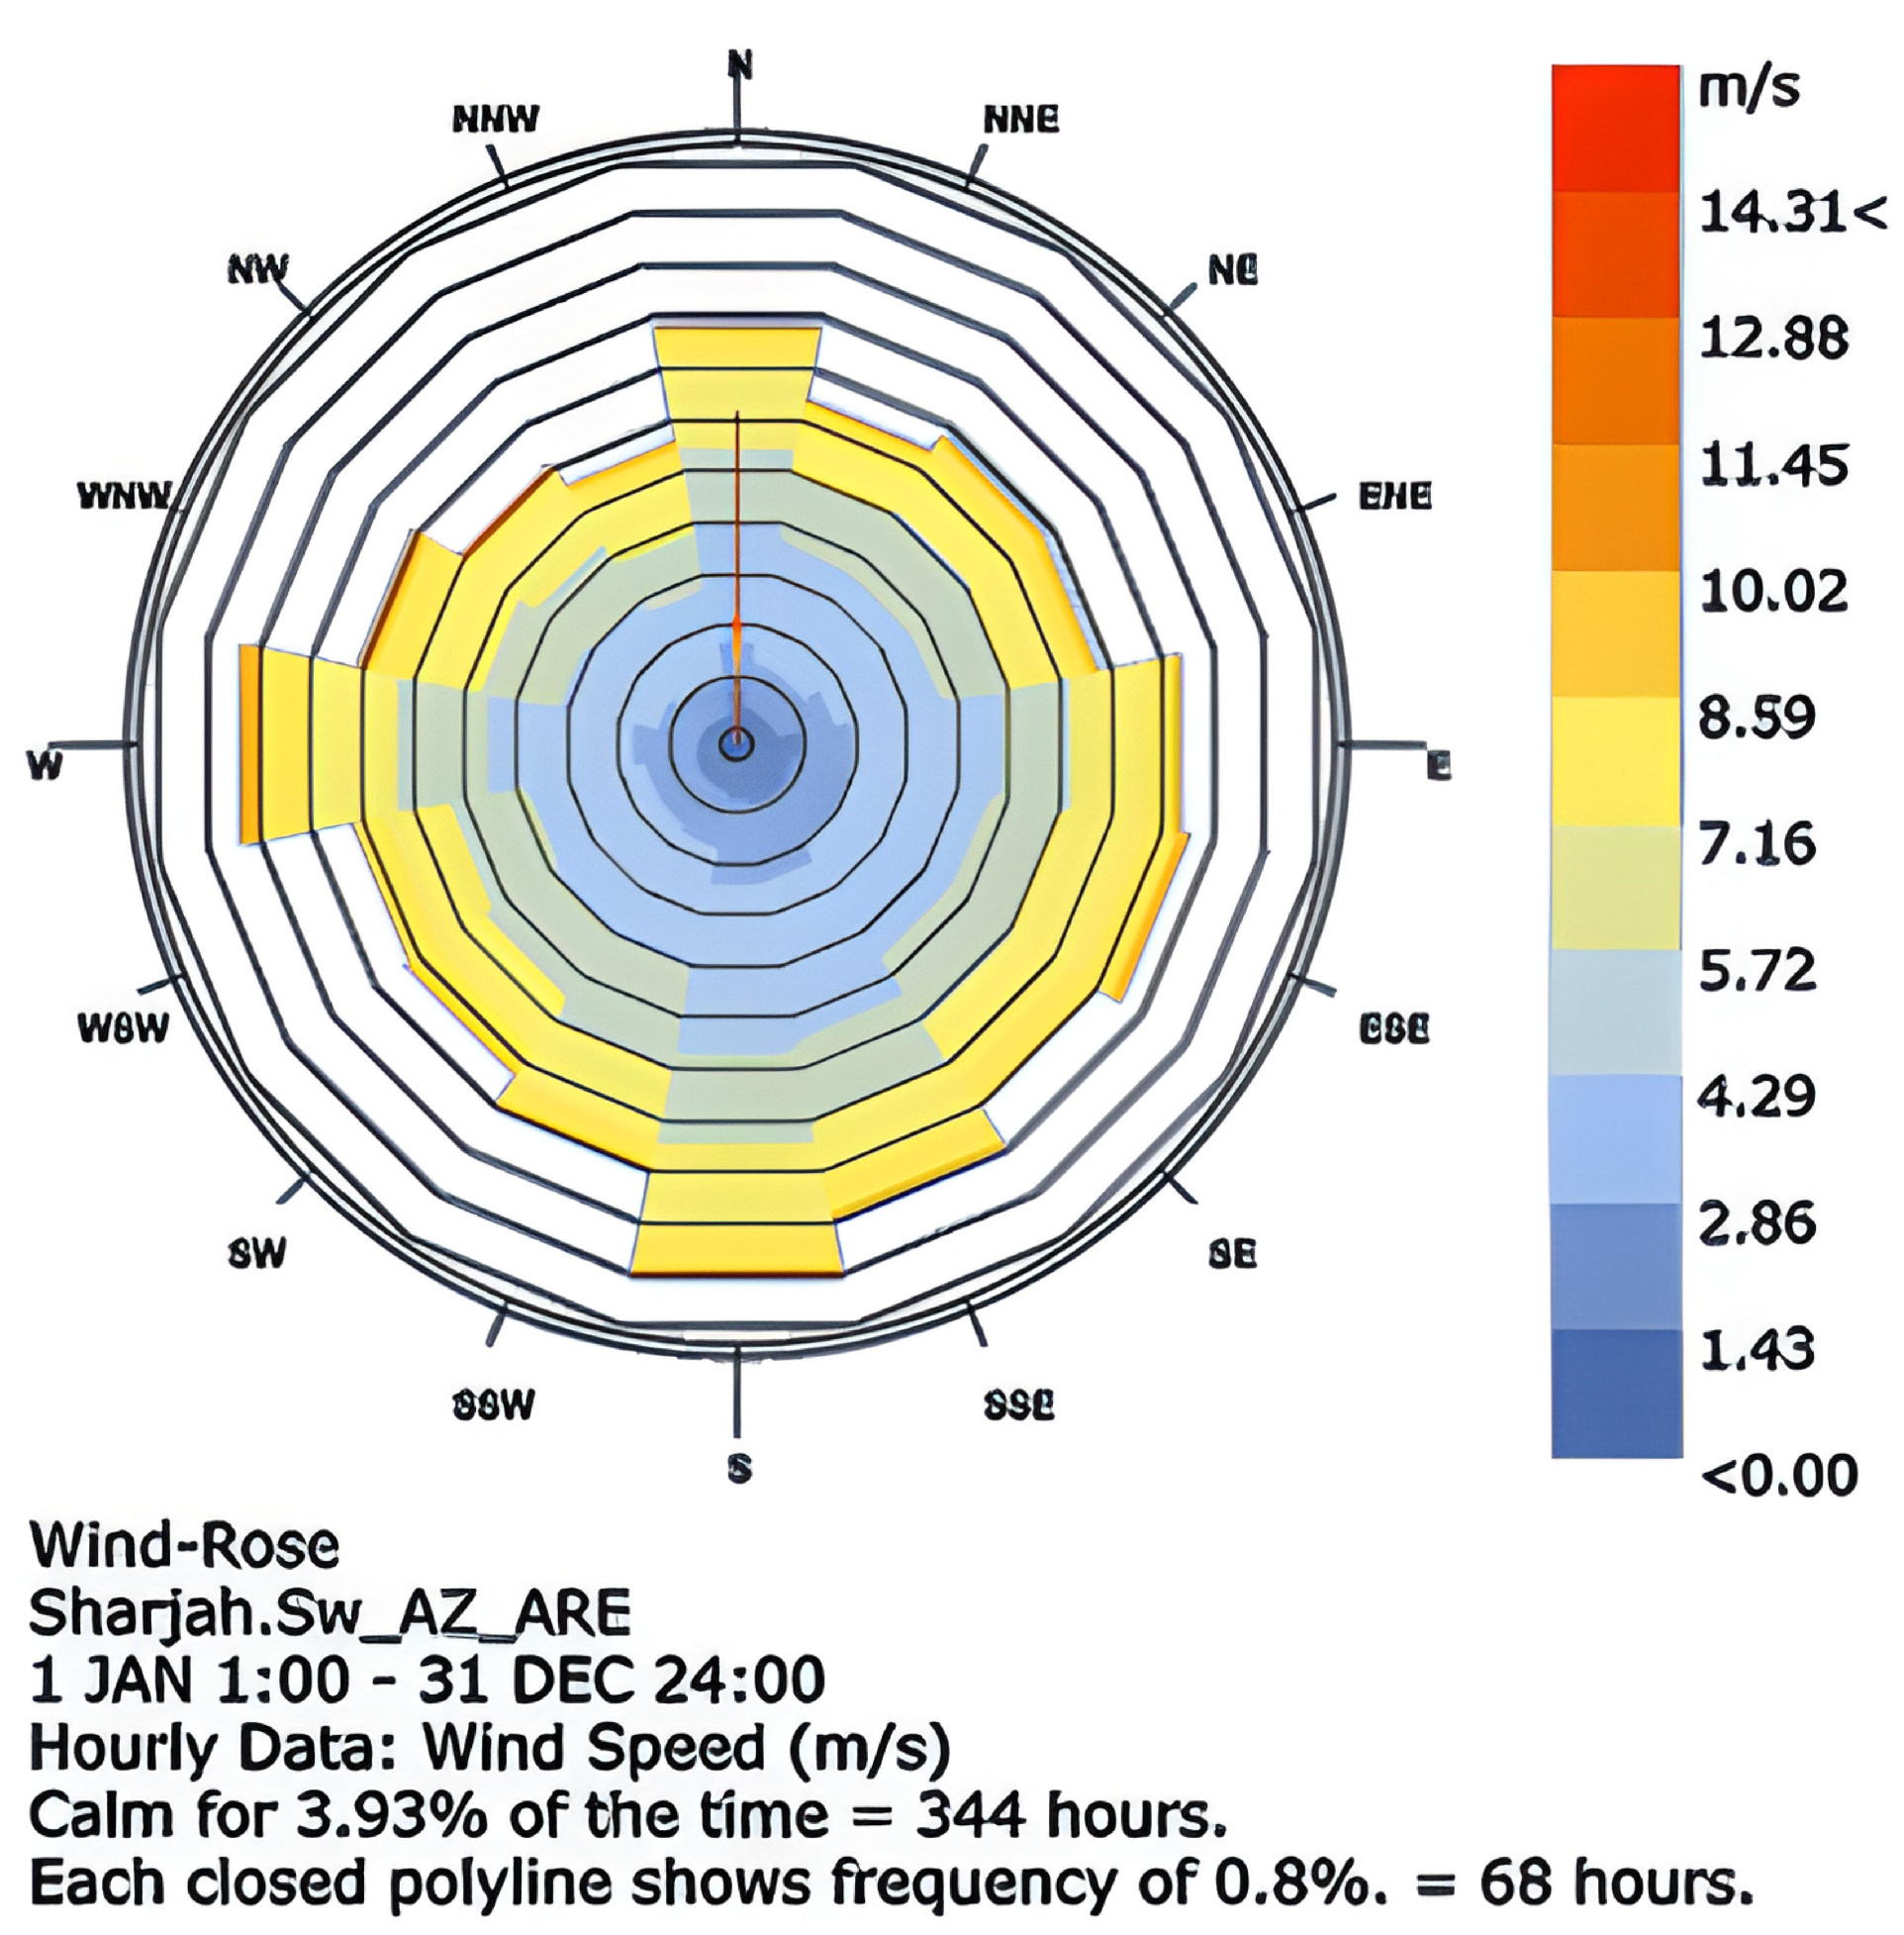
| Type | Wind Vectors < 4.4 (Comfortable Wind) | Wind Vectors > 4.4 (Uncomfortable Wind) |
|---|---|---|
| 1 | 118/1000 | 882/1000 |
| 2 | 131/1000 | 869/1000 |
| 3 | 138/1000 | 862/1000 |
| 4 | 196/1000 | 804/1000 |
| 5 | 131/1000 | 869/1000 |
| 6 | 105/1000 | 895/1000 |
| 7 | 91/1000 | 909/1000 |
| 8 | 178/1000 | 882/1000 |
| 9 | 197/1000 | 803/1000 |
| 10 | 145/1000 | 855/1000 |
| 11 | 91/1000 | 909/1000 |
| 12 | 102/1000 | 898/1000 |
| 13 | 164/1000 | 836/1000 |
| 14 | 103/1000 | 897/1000 |
| 15 | 140/1000 | 860/1000 |
| 16 | 91/1000 | 909/1000 |
| 17 | 117/1000 | 883/1000 |
| 18 | 150/1000 | 850/1000 |
| 19 | 84/1000 | 916/1000 |
| 20 | 168/1000 | 832/1000 |
| 21 | 93/1000 | 907/1000 |
| 22 | 101/1000 | 899/1000 |
| 23 | 83/1000 | 917/1000 |
| 24 | 145/1000 | 855/1000 |
| 25 | 78/1000 | 922/1000 |
| 26 | 150/1000 | 850/1000 |
| 27 | 107/1000 | 893/1000 |
| 28 | 159/1000 | 841/1000 |
| 29 | 150/1000 | 850/1000 |
| 30 | 97/1000 | 903/1000 |
| Shapes | Ground Floor Plan | First Floor Plan | Second Floor Plan |
|---|---|---|---|
| Shape 1 | 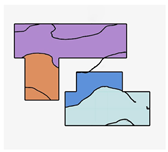 | 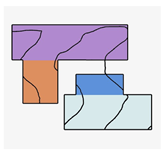 | 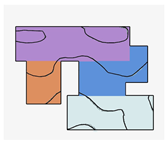 |
| Shape 18 | 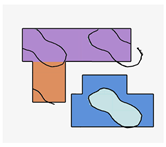 | 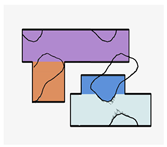 | 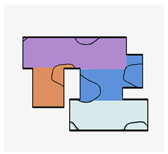 |
| Shape 20 | 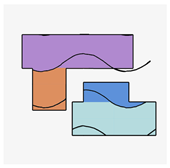 |  |  |
| Type | Outcome |
|---|---|
| Support |  |
| Local Axis |  |
| Z-Axis Gravity Load |  |
| X-Axis Wind Load |  |
| Utilization | 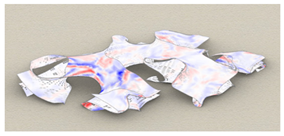 |
| Displacement | 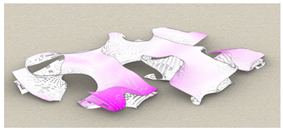 |
Disclaimer/Publisher’s Note: The statements, opinions and data contained in all publications are solely those of the individual author(s) and contributor(s) and not of MDPI and/or the editor(s). MDPI and/or the editor(s) disclaim responsibility for any injury to people or property resulting from any ideas, methods, instructions or products referred to in the content. |
© 2023 by the authors. Licensee MDPI, Basel, Switzerland. This article is an open access article distributed under the terms and conditions of the Creative Commons Attribution (CC BY) license (https://creativecommons.org/licenses/by/4.0/).
Share and Cite
Maksoud, A.; Hussien, A.A.; Tatan, L.; Soliman, E.B.A.B.A.; Elmaghraby, S. Simulation-Driven and Optimization-Based Design of an Architectural Building: A Case Study of a Space Tourism Building in the UAE. Buildings 2023, 13, 2927. https://doi.org/10.3390/buildings13122927
Maksoud A, Hussien AA, Tatan L, Soliman EBABA, Elmaghraby S. Simulation-Driven and Optimization-Based Design of an Architectural Building: A Case Study of a Space Tourism Building in the UAE. Buildings. 2023; 13(12):2927. https://doi.org/10.3390/buildings13122927
Chicago/Turabian StyleMaksoud, Aref, Aseel Ali Hussien, Leena Tatan, Elshaimaa Baz Ahmed Baz Ahmed Soliman, and Salwa Elmaghraby. 2023. "Simulation-Driven and Optimization-Based Design of an Architectural Building: A Case Study of a Space Tourism Building in the UAE" Buildings 13, no. 12: 2927. https://doi.org/10.3390/buildings13122927
APA StyleMaksoud, A., Hussien, A. A., Tatan, L., Soliman, E. B. A. B. A., & Elmaghraby, S. (2023). Simulation-Driven and Optimization-Based Design of an Architectural Building: A Case Study of a Space Tourism Building in the UAE. Buildings, 13(12), 2927. https://doi.org/10.3390/buildings13122927