Abstract
Sealing net structures are frequently used as protective devices for newly constructed transmission lines that intersect existing lines. They aim to ensure safety during the construction and operation of the intersecting lines. To explore the wind deflection response characteristics of sealing net structures under wind loads, a model of the sealing net structure was created using ANSYS/APDL software for finite element analysis. This model represents an overhead sealing net structure spanning an existing line. The results obtained from finite element simulations aligned well with the theoretical calculations, indicating the validity of the established finite element model for accurately analyzing the wind-induced response of the sealing net structure. Expanding on this foundation, the study analyzed the impact of various factors on the wind deflection of the sealing net. These factors encompass the span, wind speed, pretension of the catenary cable, wind direction angle, arrangement angle, and method of additional stay cables. The research investigated the influence of these factors on the wind deflection of the sealing net structure. Additionally, a proposal was presented for arranging the closure structure to mitigate wind deflection. This proposal provides valuable guidance for the design and safety considerations of transmission lines and sealing net structures.
1. Introduction
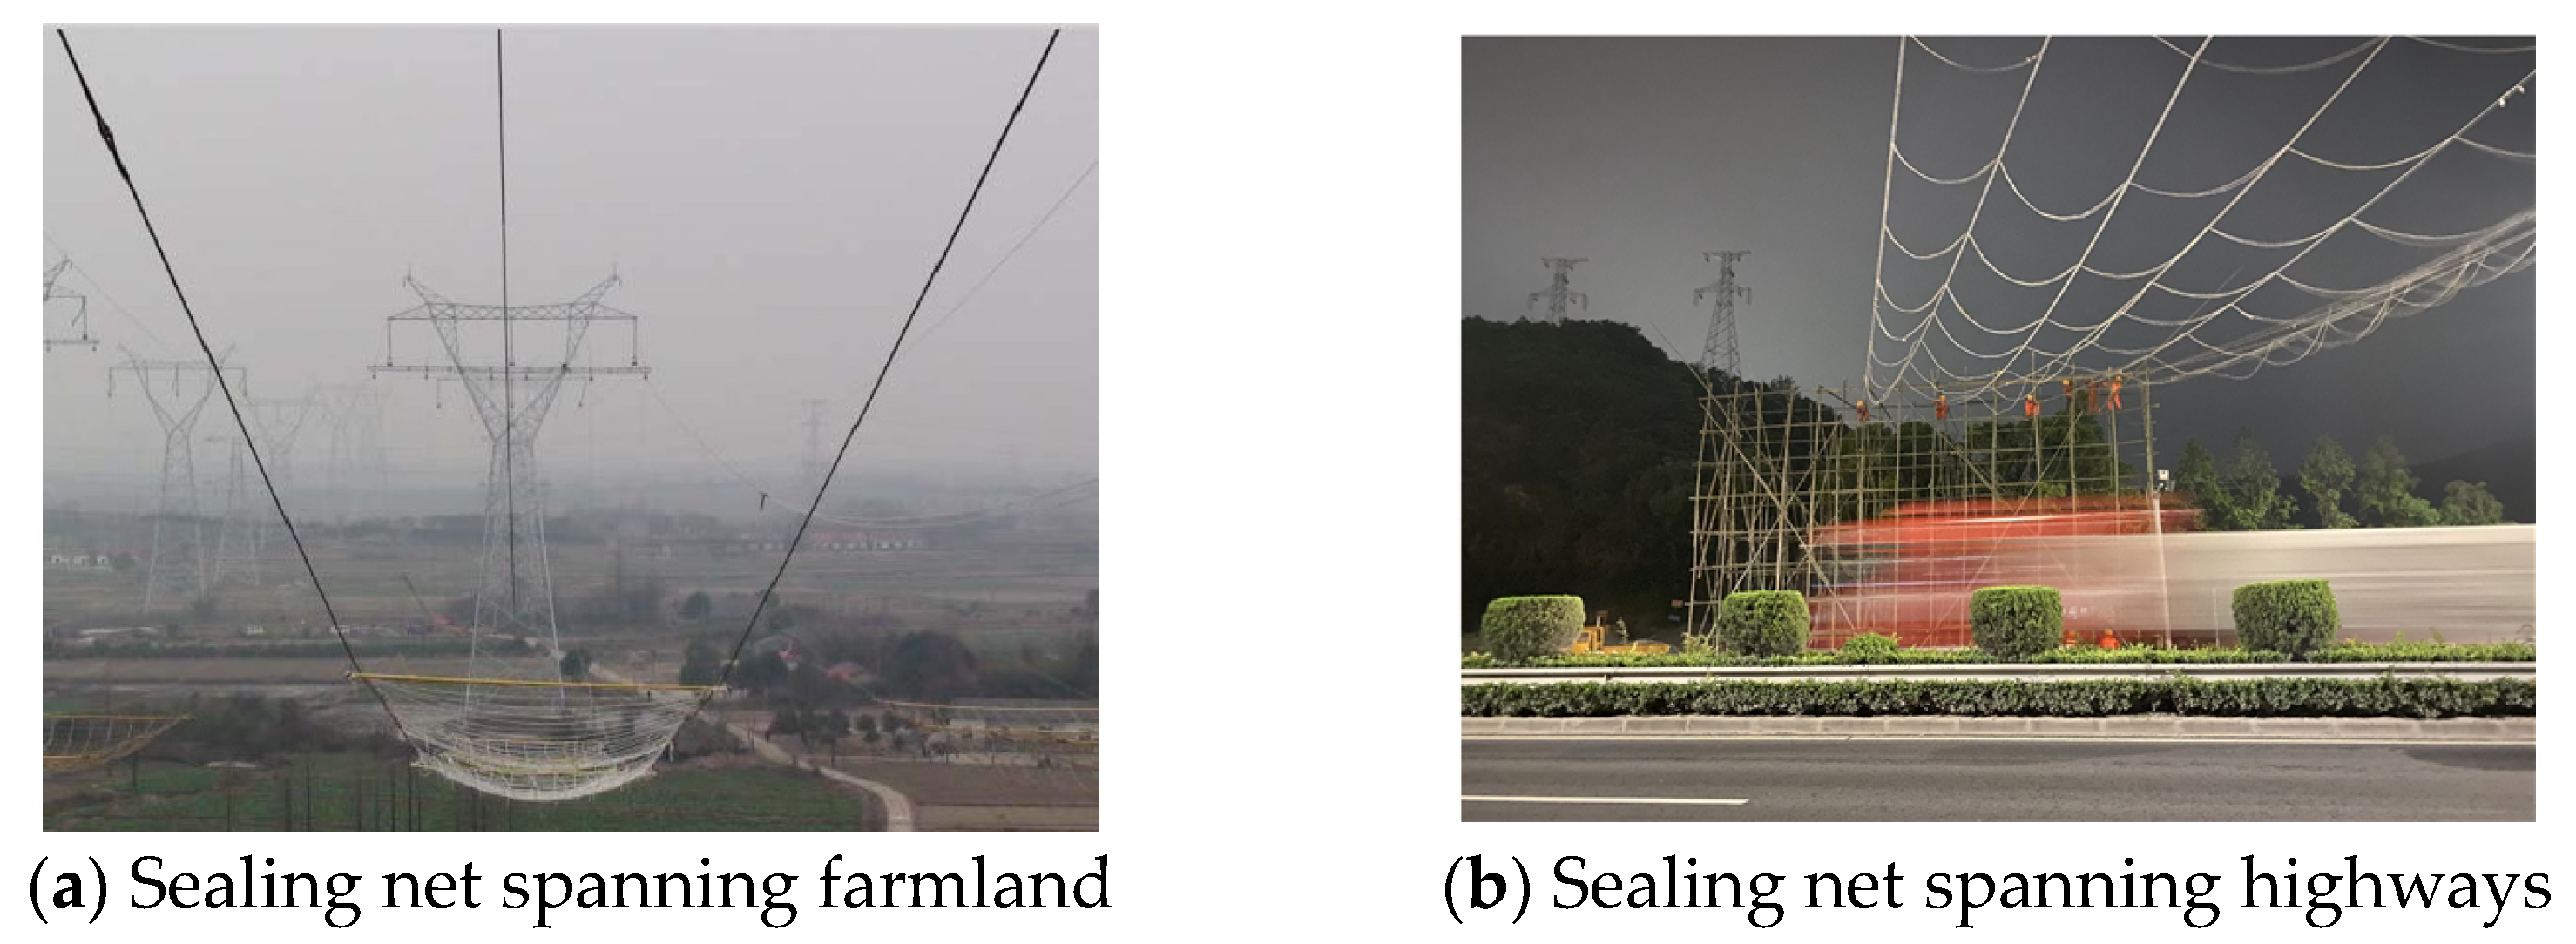
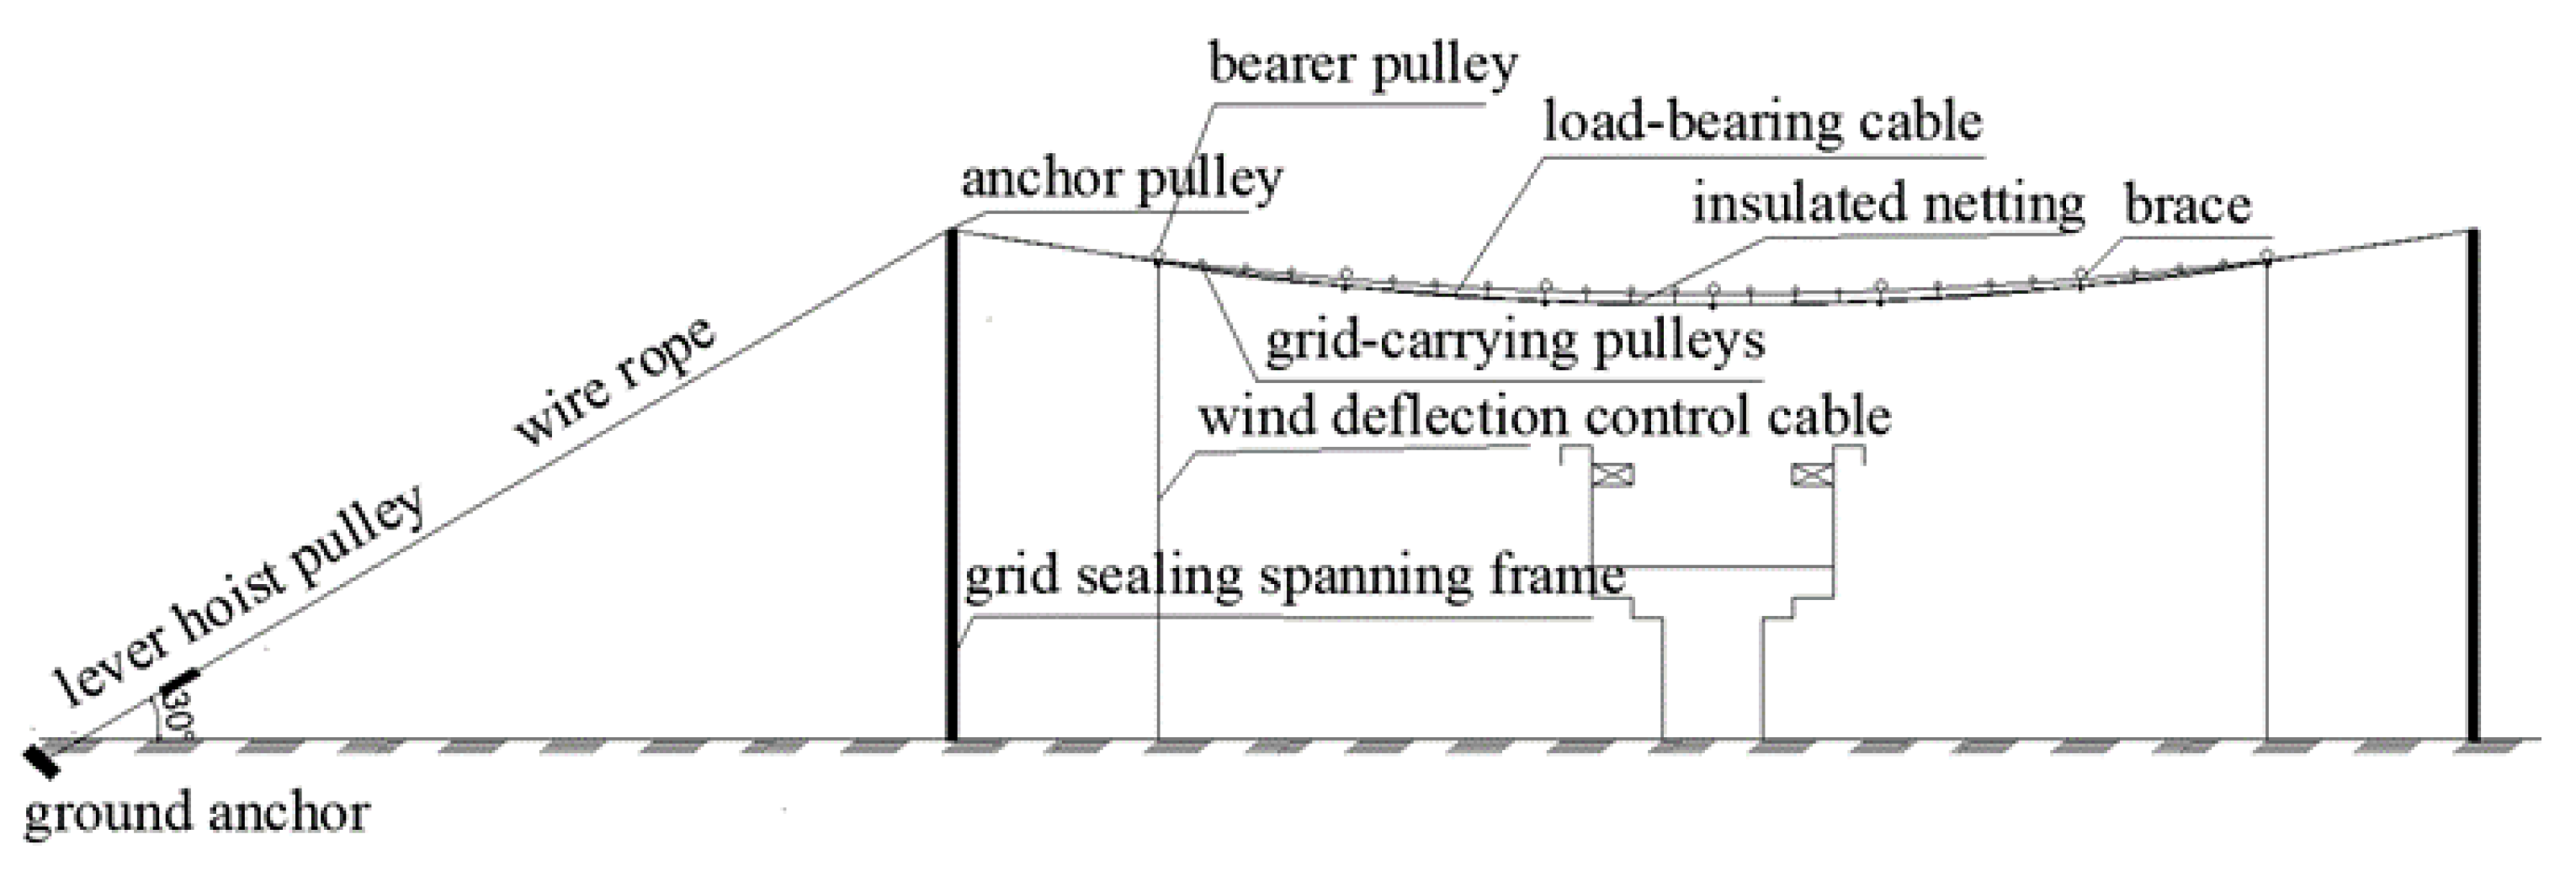
With the growing global demand for electricity, there is an increasing need for the development of long-distance, high-capacity power transmission projects that span regions. Additionally, there is a rising trend in constructing new transmission lines that traverse existing power lines, railways, highways, navigable waterways, elevated terrains, valleys, farmland, and pristine forests, among other specialized areas [1]. The installation of new transmission lines often necessitates the uninterrupted operation of the existing lines they intersect. To optimize the utilization of the traversed area and ensure its protection, an overhead sealing net structure is commonly employed as a safety measure during the installation of these transmission lines [2,3], as depicted in Figure 1.

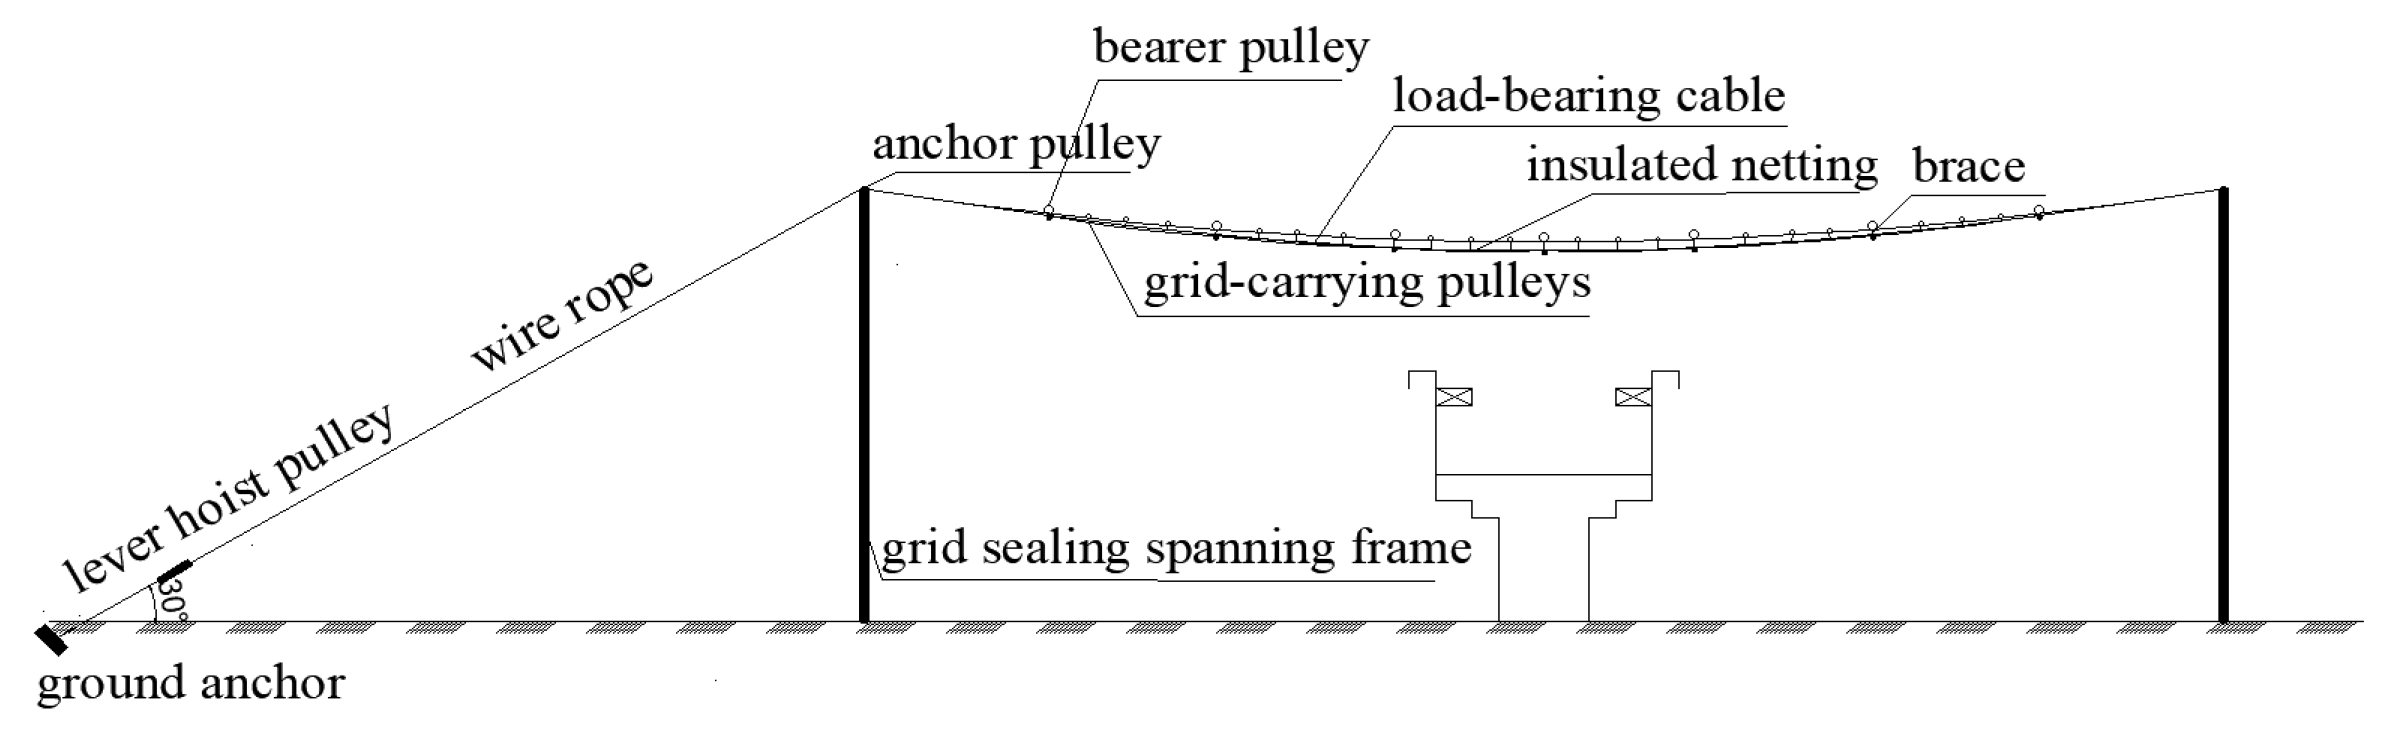
Figure 1.
Schematic diagram of the sealing net structure.
The sealing net structure set up in the overhead transmission line crosses railroads, highways, navigable waterways, and other existing lines, as shown in Figure 2. Its main function is to intercept the falling broken line and prevent impact when a line breakage accident occurs. For the existing circuits, ensure a safe distance between the two to protect the safety of the existing circuits [4]. To conduct a comprehensive safety study of the sealing net structure for transmission lines, it is imperative to ensure that the sealing structure not only meets the strength requirements for intercepting broken lines but also effectively intercepts falling transmission lines within a specific range.

Figure 2.
Arrangement of the sealing net structure.
With regard to the strength of the sealing net structure, scholars at home and abroad have conducted a large amount of research from different perspectives, such as the dynamic characteristics of the disconnection and the buffer characteristics of the sealing net structure. Gottardi and Govoni [5] presented an investigation on the performance of flexible protection network structures. They conducted extensive falling rock impact tests and analyzed the dynamic mechanical properties as well as the deformation energy dissipation of these systems when subjected to falling rock impacts. This study provided a comprehensive and valuable database for gaining a deeper understanding of the actual response and numerical modeling analysis of flexible protection network structures. Sasiharan et al. [6] conducted a finite element analysis on a flexible protection net structure, which helped in investigating the impact of individual element performance on the overall stability of the structure. Their findings revealed that the friction between the falling rocks and the protection net plays a crucial role in determining the stability of the entire structure. Meng et al. [7] employed the finite element method and used ANSYS/LS-DYNA software to precisely simulate the descent of the drawn wire on the sealing net structure. They analyzed the vertical displacement variation of the sealing net during the collision process. The investigation focused on evaluating the structural strength, and the calculation results confirmed that the sealing net structure meets the necessary requirements. Therefore, extensive research has been carried out to investigate the strength of sealing net structures under various material compositions and different influencing factors. By studying the material characteristics of the sealing net structure, we can select the appropriate materials to meet the strength and stability requirements of the structure. By studying the mechanical properties of the sealing net structure, we can understand its deformation and failure mechanisms under stress and provide the basis for structural design and optimization. The findings from these studies have consistently confirmed that the strength of the sealing net structure meets the relevant standards and can be widely used in engineering practice.
However, sealing nets possess characteristics such as a large span, high flexibility, light weight, and minimal damping [8]. These attributes make it particularly susceptible to wind loads, which have inherent frequency and uncertainty characteristics [9]. As a result, the wind-induced vibration response of the sealing net structure can become prominent. This causes oscillations that hinder its ability to effectively intercept broken lines or even allow the intrusion of other lines, leading to potential accidents. Consequently, the sealing net structure exhibits obvious nonlinear characteristics under wind loads [10]. Based on this characteristic, researchers have conducted studies on sealing net structures as well as structures that are similar to sealing net structures, including cable nets, humanoid suspension bridges, and protective net structures.
Vaezzadeh et al. [11] found the collapse resistance of cable net structures, considering 24 prototypes and 168 collapse scenarios. The highly nonlinear behavior of cables poses challenges, leading to large displacements and instabilities. Restraint failure was identified as the most destructive collapse scenario, particularly affecting corner columns in multispan cable nets. The analysis employed a step-by-step nonlinear pseudodynamic procedure with accurate rupture modeling. Wu et al. [12] focused on active vibration control of cable net structures using piezoelectric stacked actuators. A nonlinear method was proposed to address vibration problems in the presence of uncertainties. The uncertain model was derived from a nominal model, and a nonlinear state feedback control was deduced. The nonlinear approach demonstrated feasibility, robustness, and improved performance compared to linear control. Salvatori et al. [13] analyzed wind effects on suspension bridges by numerical simulation, considering structural nonlinearities. Self-excited effects and buffeting were included. The response to turbulent wind was evaluated using a Monte Carlo approach. A structural model with two cross-sections captured key characteristics. Structural nonlinearities limit oscillation amplitudes, and fully correlated flow may have underestimated the response. Escallon et al. [14] developed a finite element model to accurately simulate the mechanical behavior of chain-link wire nets in rockfall protection barriers. The model successfully reproduced the nonlinear force displacement response observed in laboratory tests and a full-scale barrier test. Khalkhaliha et al. [15] focused on the structural dynamics of a saddle-shaped cable net structure with prestressed cables. Parametric nonlinear dynamic analysis was conducted to evaluate the system’s response to different masses, geometries, pretensions, and excitation amplitudes. An equivalent single-degree-of-freedom model accurately estimated the displacement response, and a nonlinear active control algorithm effectively reduced the structural response to transient wind excitation. Lioyd et al. [16] described the performance of a series of safety nets of different configurations tested under low-velocity impacts. The overall performance of the different configurations of the nets is also presented. Conclusions and recommendations related to net configuration and connection details are provided. Bertolo et al. [17] proposed a test procedure for evaluating the overall performance of the protective net. They found that the test results of the protective net effectively captured the load—displacement curve during testing, providing an accurate representation of its behavior. Escallon et al. [18] developed a finite element model to analyze protective nets. This model incorporates the plasticity and damage behavior of the material and accurately represents the nonlinear load—displacement curves observed in experimental tests. Wang et al. [19] conducted a wind tunnel test using a scaled-down model to analyze methods for mitigating wind-induced deflection in sealing net structures. They specifically investigated the impact of employing figure-of-eight cables at various angles and positions to control the wind deflection of the sealing net. In the field of structural engineering, research has been conducted both domestically and internationally to comprehensively consider various factors when analyzing structures. These factors include material properties, geometric shapes, boundary conditions, and the strength and direction of wind loads. To gain a deeper understanding of similar structures, researchers have employed suitable numerical simulation methods and experimental testing approaches. These investigations have focused on study of the nonlinear responses exhibited by such structures, including the nonlinear behavior of materials, geometric nonlinearity effects, and contact nonlinearity.
According to previous research, both domestic and international scholars have extensively studied the materials, mechanical performance, and strength of sealing net structures. As a result, sealing net structures have been widely applied in engineering projects, highlighting the importance of ensuring their safety and reliability. However, current research lacks comprehensive studies and sufficient consideration of the wind-induced vibration response and wind-induced displacement control of sealing net structures under wind loading conditions. This gap exists primarily due to the complex and interconnected nature of the problem. The influence of wind loading on sealing net structures involves various factors, including the dynamic response of the structure, wind load characteristics, and geometric shape, all of which must be considered holistically. Moreover, sealed net structures are susceptible to significant deformations and displacements during high winds, which can lead to severe consequences such as structural damage or functional limitations. Therefore, studying wind-induced displacement control is also of great significance. To enhance the safety performance of sealing net structures, it is crucial to conduct in-depth research and analysis on wind-induced vibration response and wind-induced displacement.
This study comprehensively analyzes the wind-induced response of sealing net structures to simulate their behavior under wind action. The analysis takes into account factors such as stall distance, wind speed, pretensioning force of bearing cables, and wind angle. Additionally, the study investigates the impact of arrangement angles and methods of additional tensioning cables on the wind-induced deflection of sealing net structures. Based on these findings, recommendations are provided regarding the arrangement of sealing net structures to effectively prevent and control wind-induced deflections. This research contributes to supplementing the current progress in wind vibration analysis and wind displacement control and establishes a theoretical foundation for further enhancing the safety performance of sealing net structures.
2. Simulation of Wind Loads on Sealing Net Structures
In sealing net structures, wind loads have a significant impact due to their inherent characteristics. Therefore, it is essential to study the response mechanisms of sealing net structures when subjected to wind loading. This involves obtaining specific information about the wind field and the wind loads acting on the sealing net. In this chapter, we will primarily focus on presenting the theoretical knowledge of wind and simulating the wind field where sealing net structures are situated. The fundamental theoretical knowledge of wind includes various aspects, such as average wind characteristics and turbulent wind characteristics. In this study, the pulsating wind characteristics were considered, and the harmonic superposition method [20] was employed. Additionally, the Davenport spectrum [21] was used as the target spectrum to simulate the wind field at different wind speeds. The accuracy of the simulation results was validated, and subsequently, the wind speed was converted into the time history of the wind load. This converted wind load profile served as the input load for the structure, thus establishing the groundwork for studying the time history analysis of the wind-induced vibration response in the cable net structure.
2.1. Characteristics of Wind
Wind refers to the movement of air in relation to the Earth’s surface, resulting in the flow of air at a specific velocity. Analysis of observed wind data reveals that wind speed variation over time comprises two main components. The first component is the average wind speed, represented as U, which, despite its dynamic nature, exhibits behavior akin to a static force. The second component is the pulsating wind speed , characterized by fluctuations that introduce dynamic effects on structures. The impact of these two wind speed components on structures can be examined independently. It can be performed by considering the contribution of both the average wind analyzed in terms of static forces and the pulsating wind investigated with regard to dynamic forces.
2.2. Average Wind Characteristics
Within a specific time interval, the force exerted by the average wind on different types of structures remains constant in magnitude and direction. The magnitude of the average wind speed is affected by the height of the location being simulated. Within the atmospheric boundary layer, the change in average wind speed with height is characterized by the average wind profile. The power law wind profile equation is given as follows:
In this expression, represents the average wind speed at any given height, z represents the height at any given point, represents the average wind speed at the reference height, represents the reference height, and represents the roughness coefficients.
Building load regulations require the use of an exponential wind profile Equation (1) to determine wind loads on structures. This equation is classified into four groups based on different ground roughness conditions, with corresponding roughness coefficients assigned to various types of terrain. These coefficients are detailed in Table 1.

Table 1.
Roughness coefficient and gradient wind height under different landforms.
2.3. Pulsating Wind Characteristics
The pulsating wind demonstrates stochastic fluctuations in both time and space; however, its fundamental properties can still be captured through probabilistic approaches. Statistical analysis of time series samples of wind speed obtained from empirical measurements shows that turbulent wind exhibits noticeable nonstationarity, which is not dependent on the average wind. This nonstationarity can be adequately represented by a Gaussian stationary stochastic process with an average of zero.
The dynamic response of structures to vibrations caused by wind primarily depends on the turbulent movement of fluctuating wind. Turbulence occurs as a result of the interaction among small vortices formed due to obstructions in the wind flow. The characterization of turbulence involves four essential elements: turbulence intensity, turbulence integral scale, spectra of turbulent fluctuating wind speed, and cross-spectral density.
Pulsating intensity is a commonly employed metric for characterizing atmospheric turbulence. Specifically, it quantifies the level of turbulence in the streamwise direction at a given height z, and is defined as:
In the equation, denotes the turbulence intensity at height z, represents the root average square value of the streamwise fluctuating wind speed, and corresponds to the average wind speed at height z. Due to the gradual decrease in the root average square value of the fluctuating wind speed and the concurrent increase in the average wind speed with increasing height, the turbulence intensity exhibits a diminishing trend as height increases.
Pulsating Wind Power Spectrum
In practical applications, pulsating wind is often encountered as pulsating wind with three dimensions: in the direction of the wind, perpendicular to the wind direction, and vertical turbulence. The vertical turbulence has a negligible numerical value and can be disregarded in terms of its impact on the structure. The crosswind turbulence is also relatively small, and its mechanism of action is complex. Therefore, this chapter solely focuses on the influence of turbulence downstream on the structure. The pulsating wind power spectrum describes the distribution of pulsating wind energy in the frequency domain. It reflects the contribution of different frequency components in the pulsating wind to the total kinetic energy of turbulent pulsation. Based on the large-span and smooth characteristics of the cable net structure and the minimal variation in the height of the net closure plane, the Davenport wind speed spectrum, which remains constant along the height, is employed. The expression for the Davenport wind speed spectrum is as follows:
where , is the power spectral density, k is the ground drag coefficient, n is the fluctuating wind frequency, and is the average wind speed converted to standard height.
Pulsating winds exhibit both autocorrelation properties and spatial correlations [22]. The spatial correlation of pulsating winds can be described using the coherence function, which can be mathematically represented by an exponential decay function. The expression for the coherence function is as follows:
where is the attenuation coefficient, is the circular frequency, is the distance between two points in the space, and is the average wind speed at height .
The exponential coherence function is influenced by distance, frequency, and average wind speed. It can be inferred that as the distance between two points decreases, the frequency decreases, the average wind speed increases, and the spatial correlation becomes stronger.
where , , and are the spatial attenuation coefficients in the , , and directions, respectively. Based on experience, the spatial attenuation coefficients in the three directions are set to 16, 8, and 10. and are the average wind speeds at each height for points and , respectively.
2.4. Wind Speed Time History Simulation
In this study, the wind vibration response analysis of the sealing net structure is conducted using the time domain method. Prior to the analysis, it is necessary to simulate the time history of the wind speed for the structure. The simulation utilizes several key parameters, which are presented in Table 2.
Table 2.
Main parameters of the wind field simulation.
In the case of the 200 m span grid structure, the wind speed time histories at 61 points were simulated using MATLAB software. Considering the simulation of wind speed in this study, a wide range of wind speeds was considered. However, for the purpose of this study, we present the results for the basic wind speed of 10 m/s. The positions of the 61 simulation points are indicated in Figure 3. The curve of the pulsating wind speed time history at the node where the sealing net spans the middle and the self-power is displayed in Figure 4.
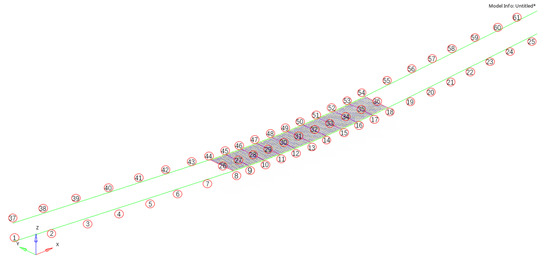
Figure 3.
Location of wind speed simulation points.
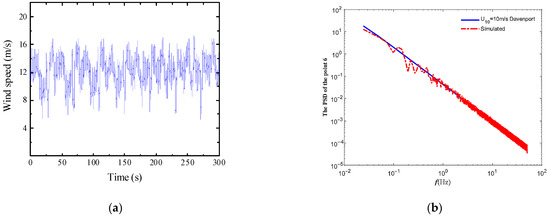
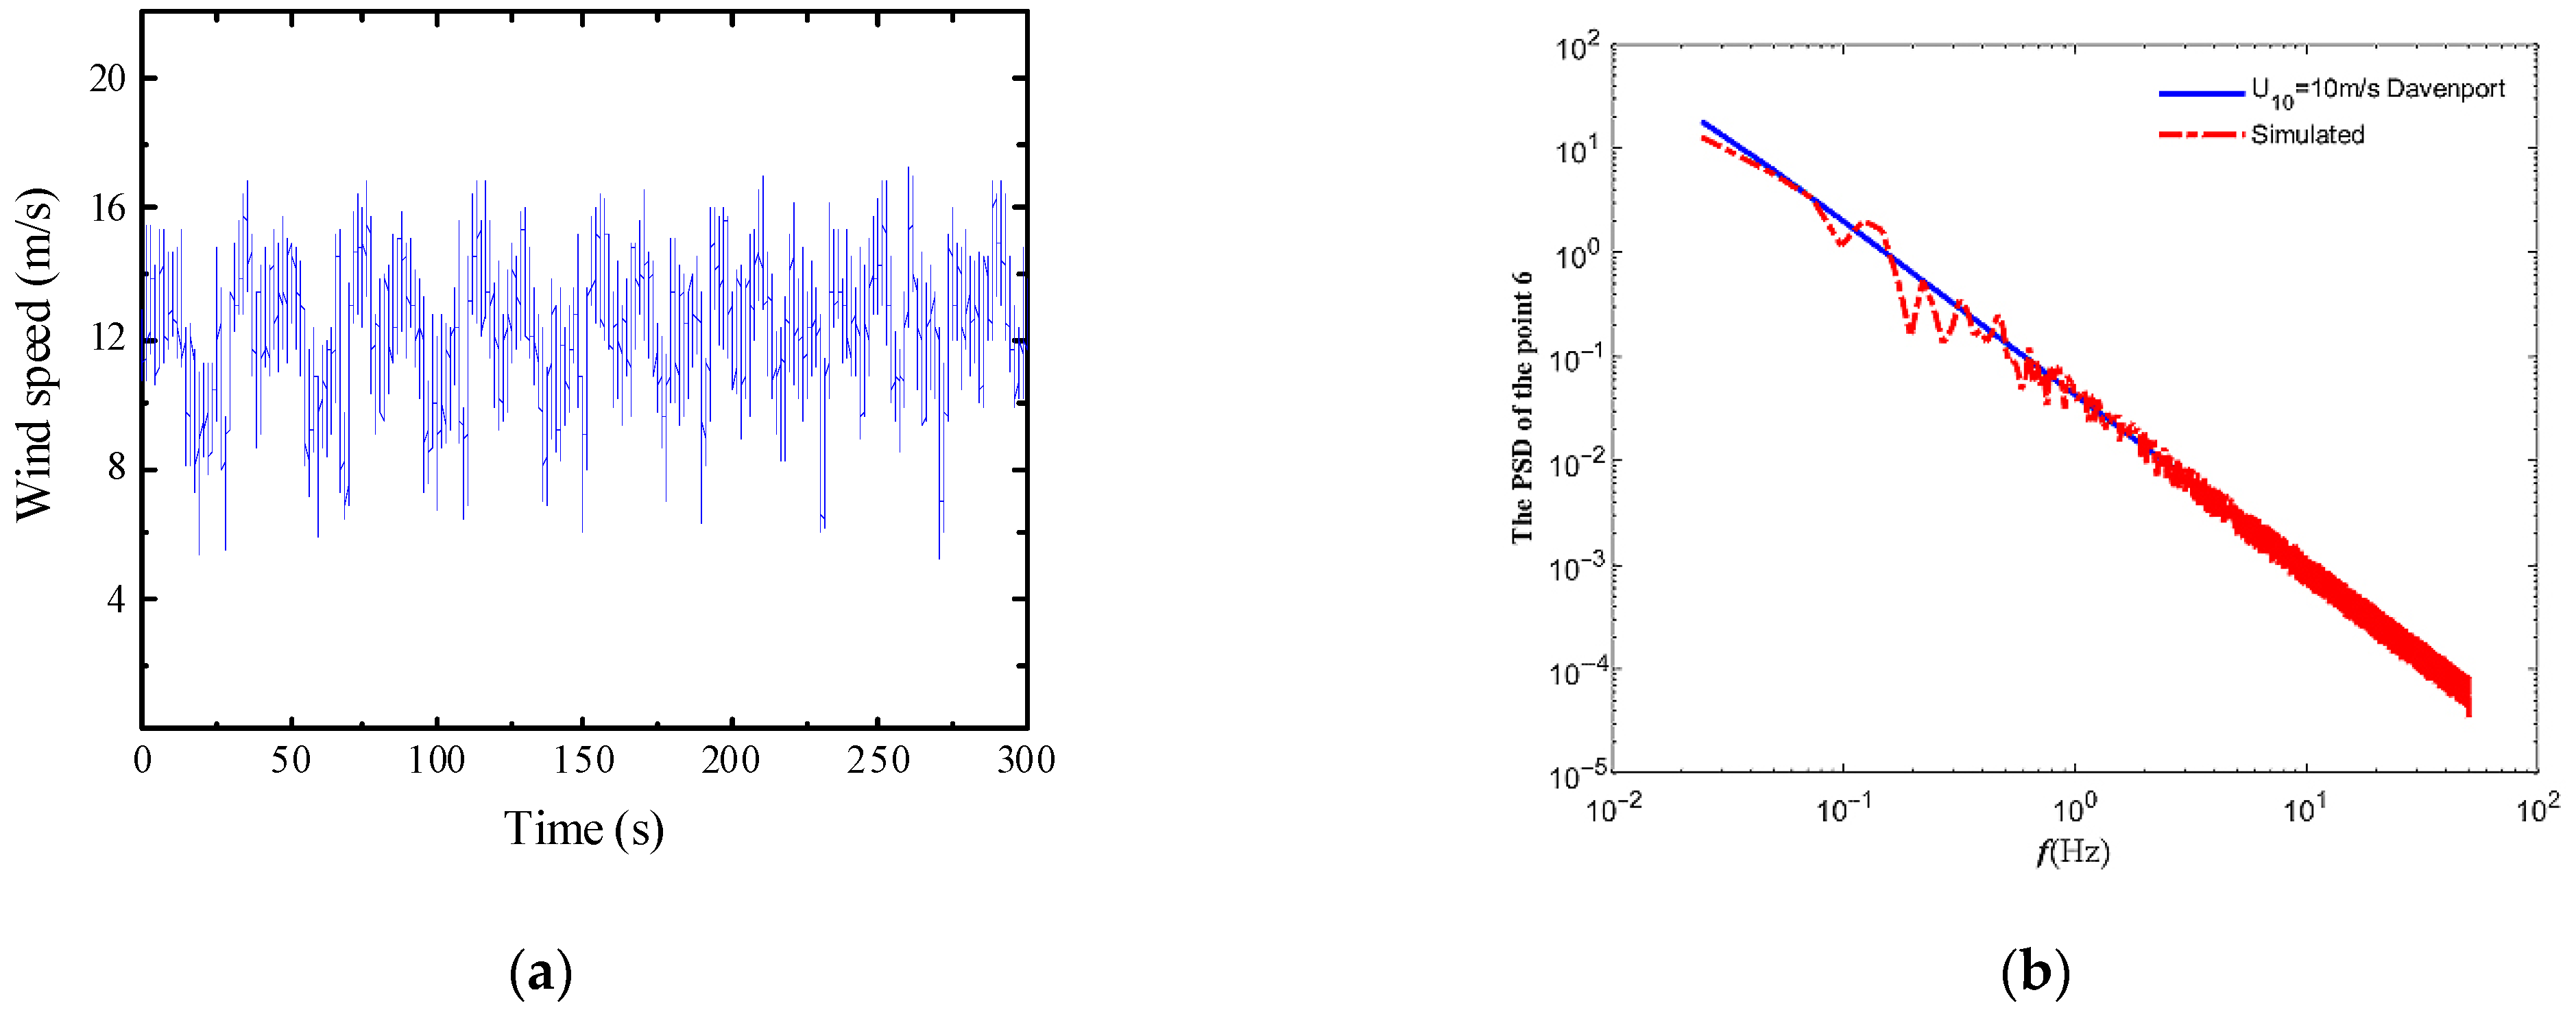
Figure 4.
Stochastic wind field simulation at point 13. (a) Simulate the wind speed time history curve at point 13 at a basic wind speed of 10 m/s. (b) Comparison of wind speed power spectrum and tar-get spectrum at simulation point 13.
According to Figure 4, the stochastic distribution of simulated wind speed over time is found to be independent, which aligns with the characteristics of the pulsating wind stochastic distribution. Additionally, the simulated wind speed power spectrum demonstrates a closer alignment with the Davenport spectrum. These findings indicate that the wind speed time history simulation in this study exhibits a high level of accuracy, rendering it suitable for dynamic structural analysis.
2.5. Wind Load Calculation
The wind speed obtained from the simulation cannot be directly used for structural response calculations. It must be converted into a wind load before applying it to the structure. Specifically, the pulsating wind load should be applied to the designated loading point on the sealing net structure for accurate calculations. The wind load applied to the line on the sealing net can be determined as follows:
where is the density of air; and are the average and pulsating wind speeds at height , respectively; is the projected width of the structure in the vertical wind direction; and is the wind load form factor of the structure, according to the standard DL/T 5486-2020 “Technical specification for the design of steel supporting structures of overhead transmission line” [23]. When the wind direction aligns with the overhead transmission line at a specific angle, the wind loads on the transmission line’s vertical and downward components are determined based on the values specified in Table 3. It is worth noting that the wind load levels experienced by the sealing net structure and conductor are comparable. Therefore, for the sealing net component, different wind angles in the vertical and downward directions are also chosen in accordance with the values provided in Table 3.
Table 3.
Wind loads on closure lines under angular winds.
3. Numerical Model Construction and Wind-Induced Response Analysis of the Closure Grid Structure
3.1. Finite Element Model
This study focuses on the investigation of the overhead sealing structure associated with a newly developed 500 kV transmission line. The sealing net structure comprises load-bearing cables, an insulating rope net, insulating struts, a spanning frame, guide wires, lever blocks, supporting blocks, and ground anchors. The load-bearing cables within the sealing net are installed on the spanning frame through support pulleys and anchored to the ground using steel wire ropes. The spanning frame primarily serves the purpose of fixation and support, exerting minimal influence on the wind deflection of the sealing net structure. Consequently, the impact of the spanning frame on the wind deflection of the sealing net was not considered in this study. Furthermore, for the sake of modeling convenience, this study does not account for the effects of pulling lines, hand hoists, guide lines, and ground anchors on the closure of the net. When the new transmission line intersects with an existing line during construction, the spanning sealing net is not implemented with a spanning frame. Instead, a local sealing net layout is adopted, and the sealing net takes the form of a combination of net and poles. The load-bearing cables are suspended at equal heights.
3.1.1. Finite Element Model Parameters
The parameters associated with the sealing net structure were calculated based on the guidelines provided in “Construction Technology Guide for Tension Stringing of Overhead Transmission Line When Overcrossing Live Lines without Cross Frame” [24]. The calculations determined that the sealing net had a length of 50 m and a width of 8 m. The load-bearing cables were suspended at a height of 30 m at both ends. Within the net sealing, 10 insulating rope nets were installed, with each rope net measuring 8 m by 5 m. Additionally, a total of 11 insulating stays were positioned at intervals of 5 m within the net sealing device.
The load-bearing cables used in the sealing net structure are composed of Dyneema ropes with a 16 mm diameter, which can withstand a failure tension of 215 kN. On the other hand, insulating ropes are constructed from nylon ropes measuring 10 mm in diameter. The insulating struts are ordinary FRP struts, with an inner diameter of 34 mm and an outer diameter of 50 mm.
The safety factor of the catenary cable is:
where is the breaking tension of the loaded cable and is the tension on the loaded cable. According to the guidelines provided in “Construction Technology of Overhead Power Transmission Lines across High-Speed Railway” [25], it is necessary to ensure that the integrated safety factor of the load-bearing cable meets the specification requirements and is not less than 6.
The main structural parameters of the sealing net are shown in Table 4.
Table 4.
Main structural parameters of the sealing net.
3.1.2. Simulation Key Parameters
This study employs ANSYS finite element software to perform dynamic analysis on a sealing net structure. When conducting the finite element simulation for the cable-stayed structure, the selection of appropriate element types is of utmost importance. This ensures the accurate modeling and analysis of the wind-induced vibration response of the cables. The conductor, load-bearing cable, and insulating net are considered flexible structures, and the LINK10 unit is chosen. The insulating spacer is classified as a 3D linear finite strain beam unit due to its high stiffness. The cross-section attributes of the spacer are set to match the actual state of a round tube, using the BEAM188 beam unit [26]. In the finite element model of the sealing net structure, there are 2017 nodes and 3616 elements.
In the sealing net structure, the deformation is significant when it bears a load due to its low stiffness. Therefore, it is essential to establish an equilibrium equation for the deformed position and find the appropriate shape [27]. To achieve this, the force density method is employed in the modeling of the sealing net [28]. Figure 5 illustrates the finite element model obtained after shape finding.
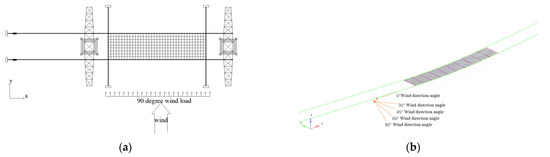
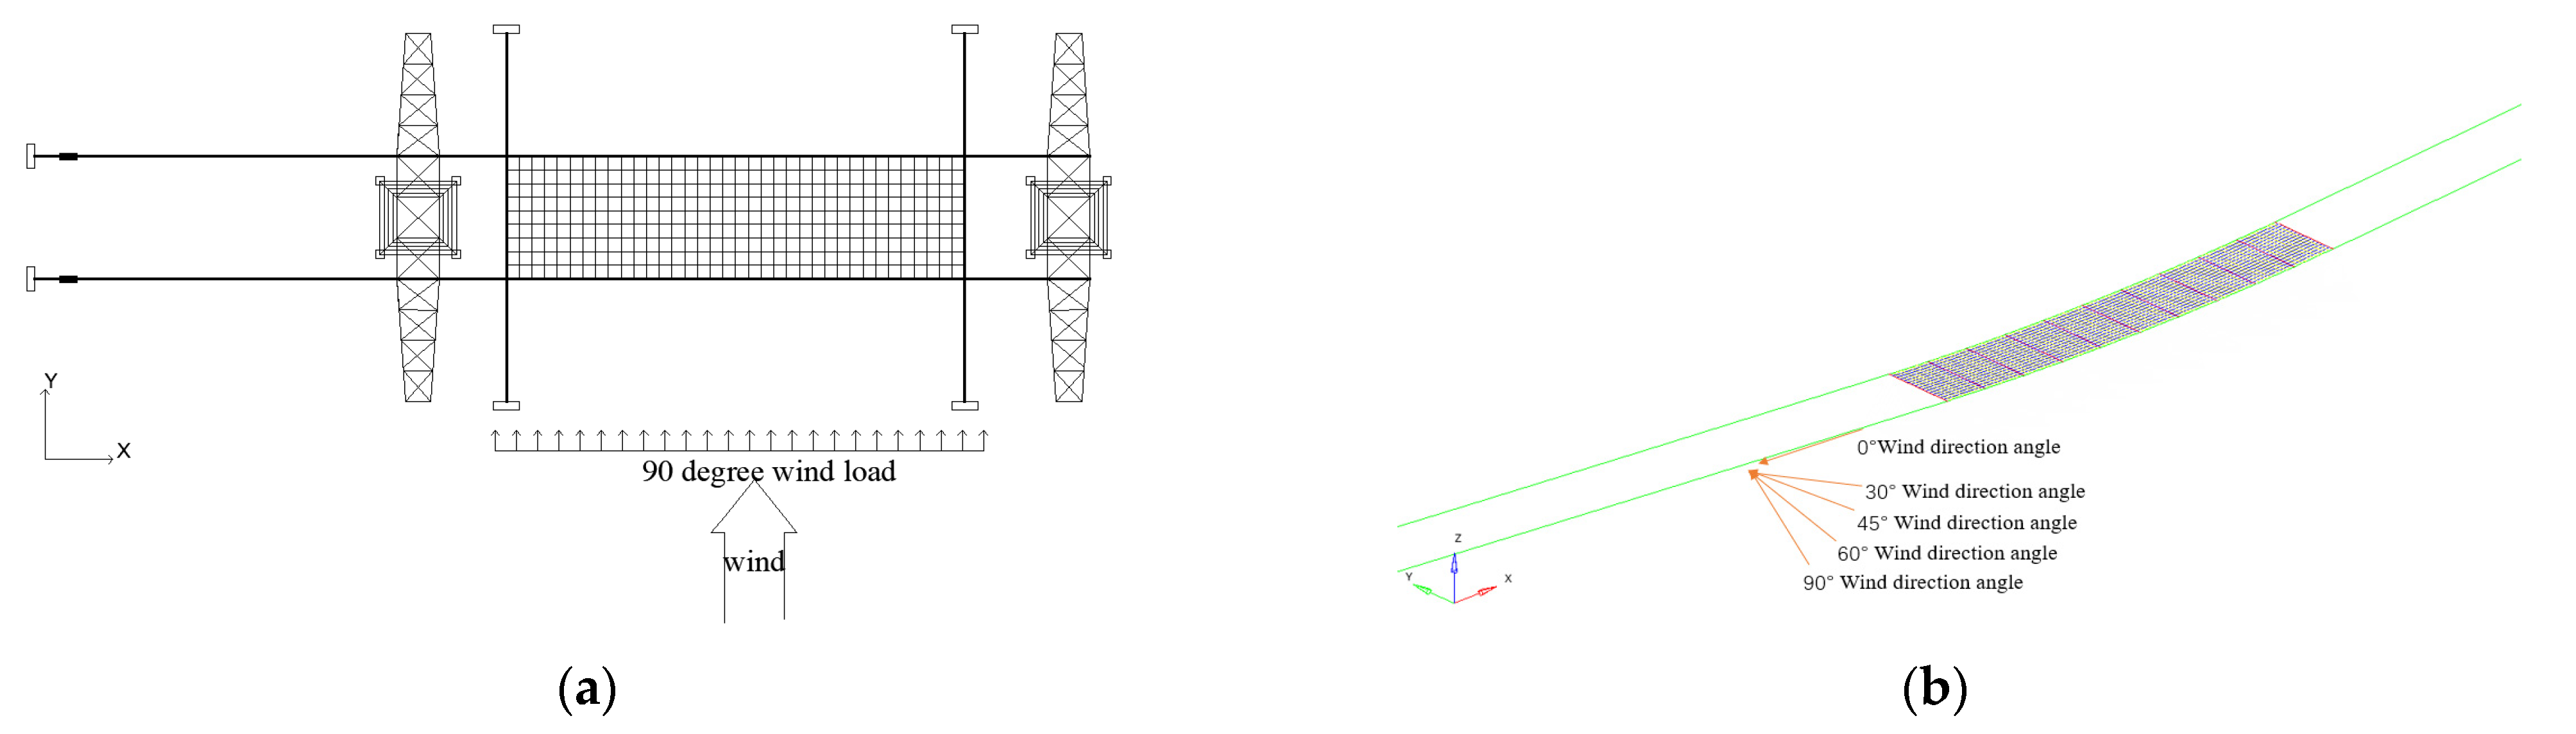
Figure 5.
Finite element model and wind direction angle. (a) 90° wind direction acting on the structure. (b) Finite element model of sealing net structure.
3.1.3. Model Validation
To validate the accuracy and validity of the finite element model for the sealing net structure, the shaped sealing net undergoes a verification process. In accordance with the theoretical calculation method outlined in “Construction Technology Guide for Tension Stringing of Overhead Transmission Line When Over-Crossing Live Lines Without Cross Frame” [24], the corresponding arc droop of the spanning sealing net is computed. Subsequently, the results are compared with those obtained from the finite element simulation to ensure their consistency.
In instances where the height difference of the spanning gear is equal to zero, the arc droop of the sealing net is measured at the midpoint of the span. Given that the arc droop of the sealing net is influenced by several factors, including the span stall distance, pretension of the bearing cable, sealing net form, and material properties, the remaining variables are held constant. By varying the span stall distance and considering cable pretension of the sealing net as an independent variable, a comparative analysis between the theoretical values and simulation results can be conducted.
(1) The stall spacing of the sealing net is adjusted, with the stall spacing as the variable and the pretension of the bearing ropes set at 10 kN. A comparison between the calculated and theoretical values of the arc droop for various stall spacings of the sealing net is presented in Table 5.
Table 5.
Comparison of calculation results.
Based on the findings presented in Table 5, it can be concluded that altering the stall distance of the sealing mesh results in a minimal error between the calculated and theoretical values of the finite element model simulation. The maximum error observed is only 6.33%, indicating the reliability of the model.
(2) In addition, the pretension of the load-bearing cable is modified, keeping the pretension as a variable and a distance of 200 m between the sealing net stalls. Then, a comparison is conducted between the calculated and theoretical values of the pretension. The relationship between the arc sag of the sealing net structure is also examined, and the results are summarized in Table 6.
Table 6.
Comparison table of calculation results.
From Table 6, it can be inferred that when the magnitude of the bearing cable’s pretension is adjusted, the difference between the calculated value and the theoretical value of the finite element model simulation results is negligible. The maximum error observed is only 8.32%, demonstrating the reliability of the model.
3.2. Modal Analysis
The self-oscillation characteristics of the sealing net structure are analyzed using ANASYS software. Since the model of the sealing net structure in this study is extensive, Block Lanczos modal analysis is employed [29]. Table 7 presents the results of the first 10 self-oscillating frequencies and vibration modes obtained without the application of external forces and damping.
Table 7.
Characteristics of the self-oscillation frequency and vibration pattern of the sealing structure.
The table reveals that the initial ten frequency orders exhibit a more rapid increase, with a significant difference. The sealing net experiences alternating torsion in both the in-plane and out-of-plane directions when the neighboring frequency disparity is small; however, in the out-of-plane direction, it is prone to vibration-induced bending. This phenomenon arises due to the joint influence of structural mass and stiffness on the modal characteristics of the structure, with the effect of mass being relatively straightforward. The tension stiffness of the sealing structure is primarily influenced by factors such as the tension of the bearing cables, the vector-to-span ratio of the sealing net surface, and the role of the insulating spacer. Since the sealing net structure possesses high flexibility, its stiffness primarily relies on tension, rendering it highly responsive to variations in parameters affecting stiffness. Consequently, it is susceptible to vibration-induced bending and torsion.
3.3. Structural Finite Element Dynamic Time History Analysis Method
Two approaches are commonly used to analyze wind-induced dynamic responses in structures: the frequency domain method and the time domain method. The time domain method is particularly suitable for investigating the dynamic response of nonlinear structural systems. Therefore, in this study, we adopt the time domain method to calculate the structural dynamic response. This approach involves using specific vibration and structural models and considering the restitution force characteristics of the components. Subsequently, the motion equations are incrementally integrated to obtain the temporal evolution of the numerical solution for the structural response.
3.3.1. Transient Dynamic Time History Analysis
The differential equation of motion of the sealing structure under wind load is:
In the formula, is the mass matrix of the sealing structure; is the damping matrix; is the stiffness matrix; , , and are the acceleration, velocity, and displacement vectors of the structure, respectively; and is the wind load vector to which the structure is subjected.
Based on the specific characteristics of the chosen enclosure structure in this study, we have opted for the implicit integration method within the direct integration approach for the solution. This method eliminates the need for coordinate transformation of the motion equations and instead performs numerical integration directly in a step-by-step manner. It discretizes time and calculates the response variables within each time increment, enabling the determination of the structural response through incremental integration. Several notable implicit step-by-step integration methods exist, including the Wilson method, the Newmark method, the Gurtin method, and the linear acceleration method. For the analysis of the wind-induced dynamic response in the enclosure structure in this study, we employed the Newmark- method. This method discretizes time by assuming the acceleration variation patterns within time periods of , , and of the structural motion at a certain time t and performing integral calculations to obtain the expressions of , , and . By incorporating them into the motion differential Equation (8), the solution of the motion equation at time can be obtained.
The Newmark- method represents the motion balance equation within time as follows:
Assuming that the velocity and displacement of the structure at time are expressed as follows:
According to Equations (10) and (11), the velocity and acceleration at time can be represented by the displacement at that time as follows:
In the equation, the values of the control parameters and affect the accuracy and stability of the entire algorithm. When is taken as 1/2, the algorithm has second-order accuracy. Under the condition of ensuring the accuracy of the algorithm, it is generally taken as = 1/2 and = 1/4.
3.3.2. Definition of Structural Damping
The energy dissipation performance of structures during vibration processes is a crucial aspect in analyzing problems related to structural dynamic responses. Currently, this performance is commonly assessed through the damping characteristics of the structure. The damping effect on structures consists primarily of two components: structural damping and viscous damping. The value of structural damping is influenced by internal factors such as friction and hysteresis within the structure. On the other hand, viscous damping arises from air friction during structural vibrations and is directly proportional to the structural vibration velocity. In practical engineering applications, viscous damping is typically considered, and within the ANSYS finite element software, various forms of viscous damping can be defined. The widely used Rayleigh damping model is expressed by the damping matrix equation as follows:
In the formula, is the Rayleigh damping matrix, and and are the mass damping coefficient and stiffness damping coefficient, respectively. These two damping coefficients can be determined using the following two formulas:
In the equation, and represent the natural frequencies of the and orders of the structure, respectively, while and , respectively, represent the modal damping ratios of the and orders of the structure. The damping ratio of cable structures can generally be taken as 0.02.
3.4. Analysis of the Wind Vibration Response of the Sealing Net When the Wind Angle Changes
To investigate the wind-induced vibration response of the sealing net structure under different wind directions, this study considers four wind angles: 30 degrees, 45 degrees, 60 degrees, and 90 degrees (with the X-axis negative direction as 0 degrees, rotating clockwise), as depicted in Figure 5. The bearing cable is pretensioned at 10 kN, and a wind speed of 10 m/s [30] is assumed for the installation of the sealing net. The distance between the gears is set to 200 m. A simulated pulsating wind load is applied to the selected loading point on the sealing net structure to analyze its vibration response to wind.
The two ends of the sealing net structure are fixed, and when the wind load acts horizontally, it can be simplified as a uniform force. Considering the constraints of the sealing net structure and the force distribution, the midspan displacement of the sealing net structure is known to be the largest. To provide a more visual representation of the displacement trends of the sealing net and the stresses at the end of the bearing cables in all directions over time for different wind angles, time history diagrams of the midspan displacements of the corresponding sealing net structure are plotted, as shown in Figure 6. Similarly, time history diagrams of the stresses at the ends of the bearing cables are shown in Figure 7.
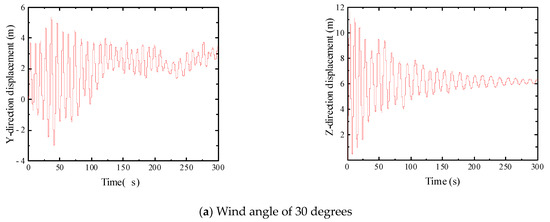
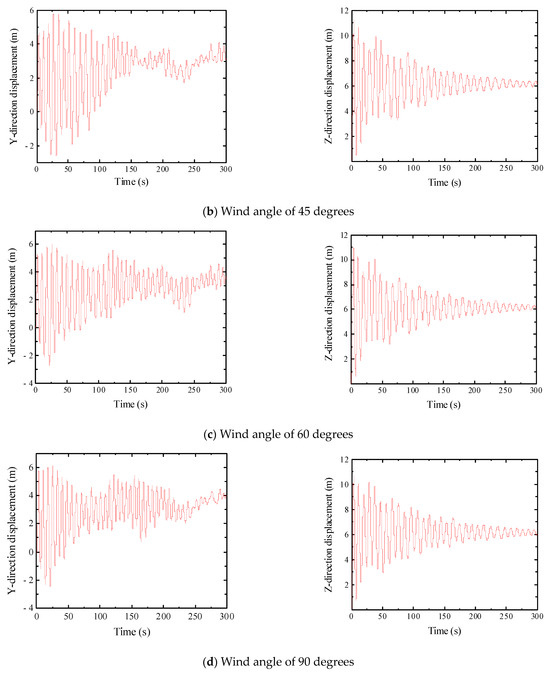
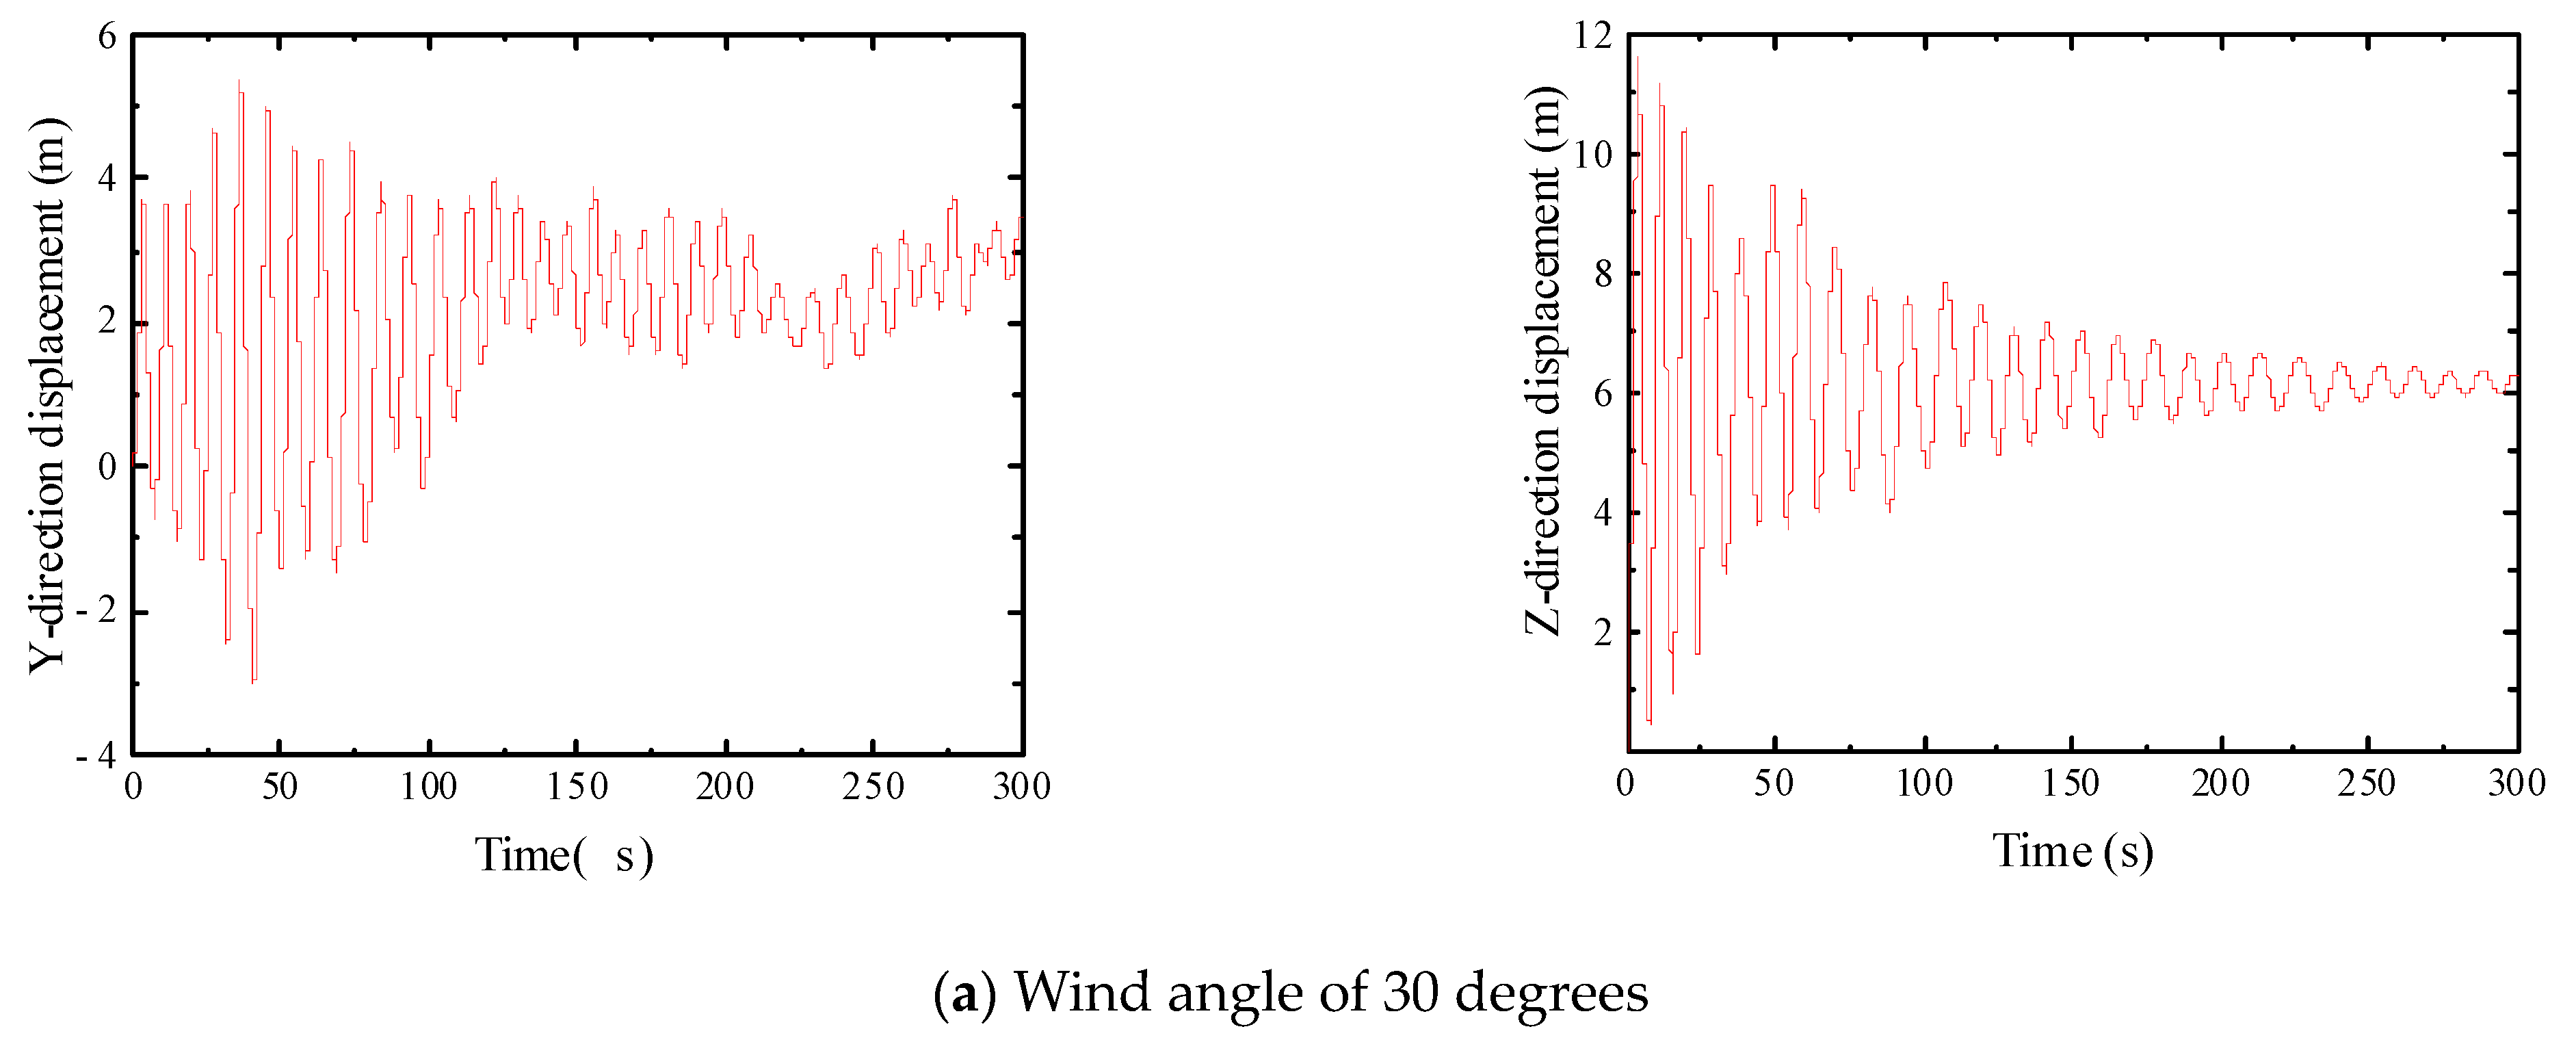
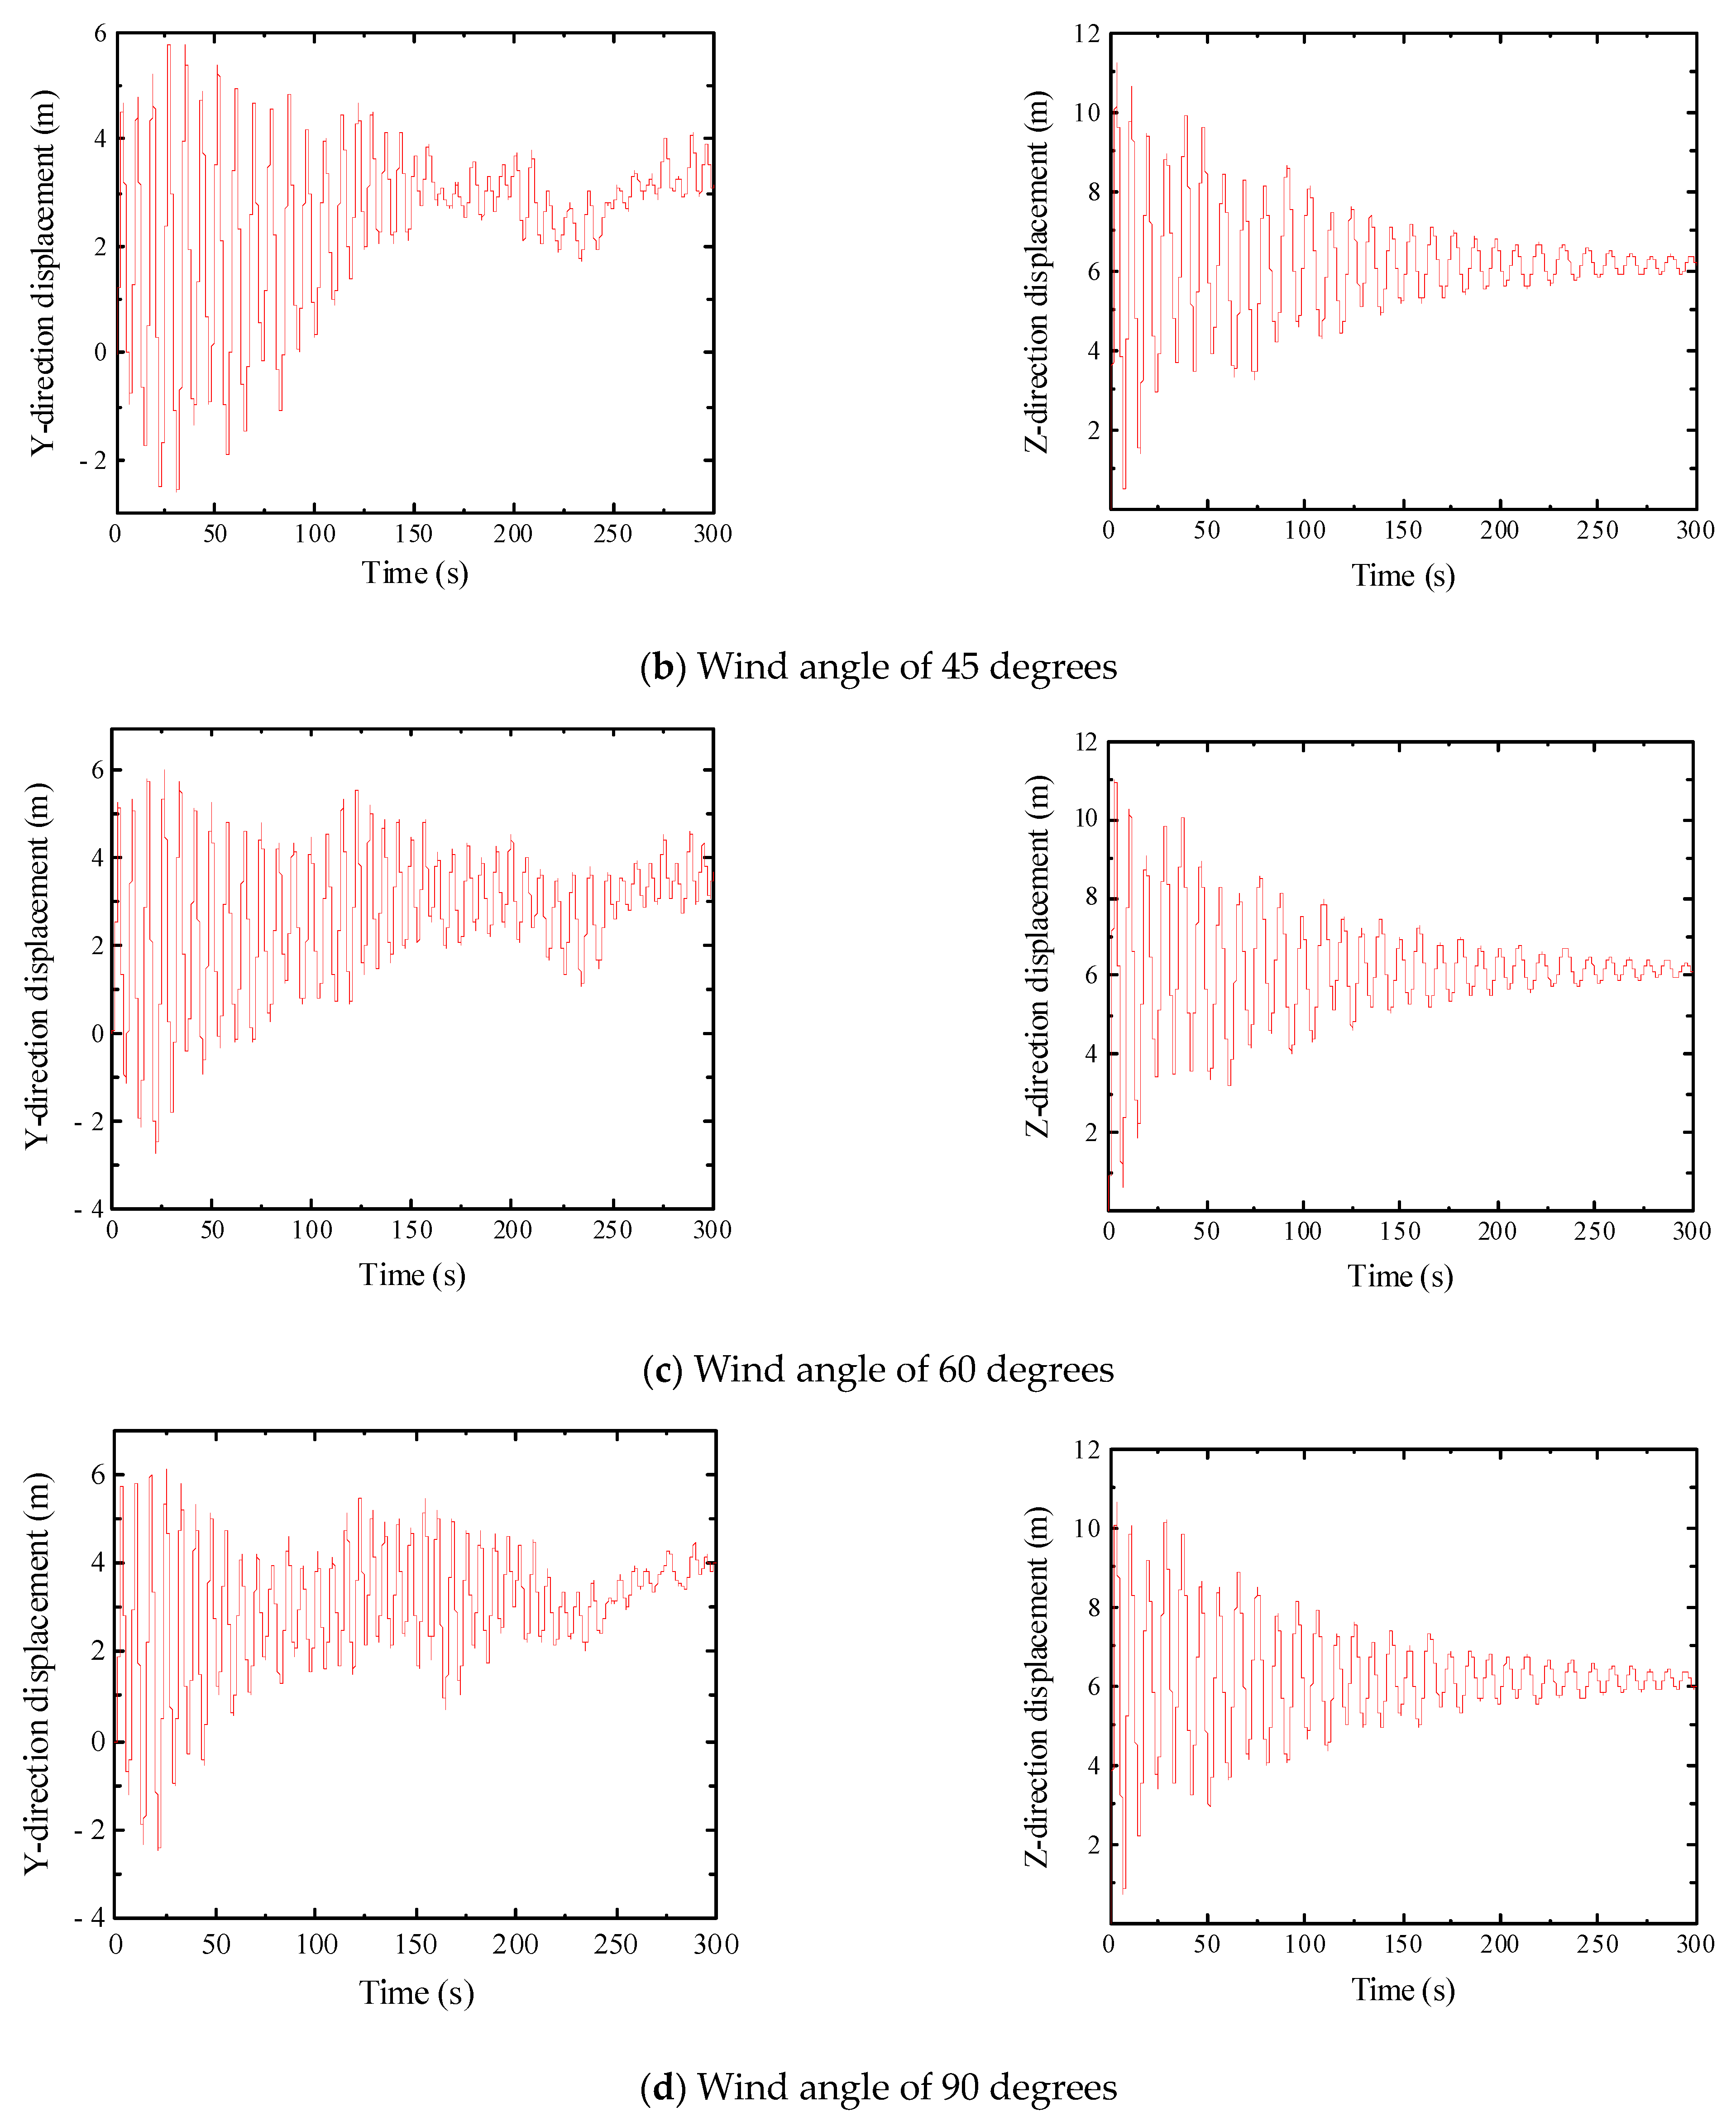
Figure 6.
Time history of span-to-span displacements under different wind directions for the sealing net structure.
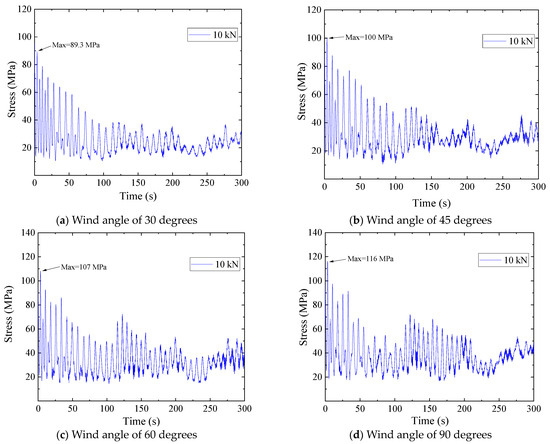
Figure 7.
Time history of stress at the end of the sealing net under different wind directions.
According to Figure 6, when the basic wind speed is 10 m/s and the span is 200 m, the wind-induced displacement of the sealing structure decreases in both the horizontal and vertical directions. Specifically, the fluctuation amplitude of the sealing net in the horizontal direction gradually diminishes, eventually exhibiting random vibrations within a certain range. On the other hand, the fluctuation amplitude in the vertical direction tends to converge to a specific value. This is a consequence of the interaction between structural vibration, air friction, and material viscosity, which gradually dissipates energy and reduces the oscillation amplitude. Figure 7 illustrates that the maximum stress at the end of the bearing cable occurs during the initial loading stage. As the loading time increases, the stress gradually stabilizes. This is because during the initial loading phase, the bearing cable experiences a significant external force, leading to the highest stress value. Over time, the cable gradually adapts to this external load and undergoes elastic deformation, causing the stress to decrease. Once the cable has adapted to the external load and reached a stable state, the stress no longer undergoes significant changes, and the curve tends to stabilize. By analyzing the stress response at the end of the bearing cable under different pretensions, it can be inferred that higher pretension applied to the bearing cable results in greater stress at the end.
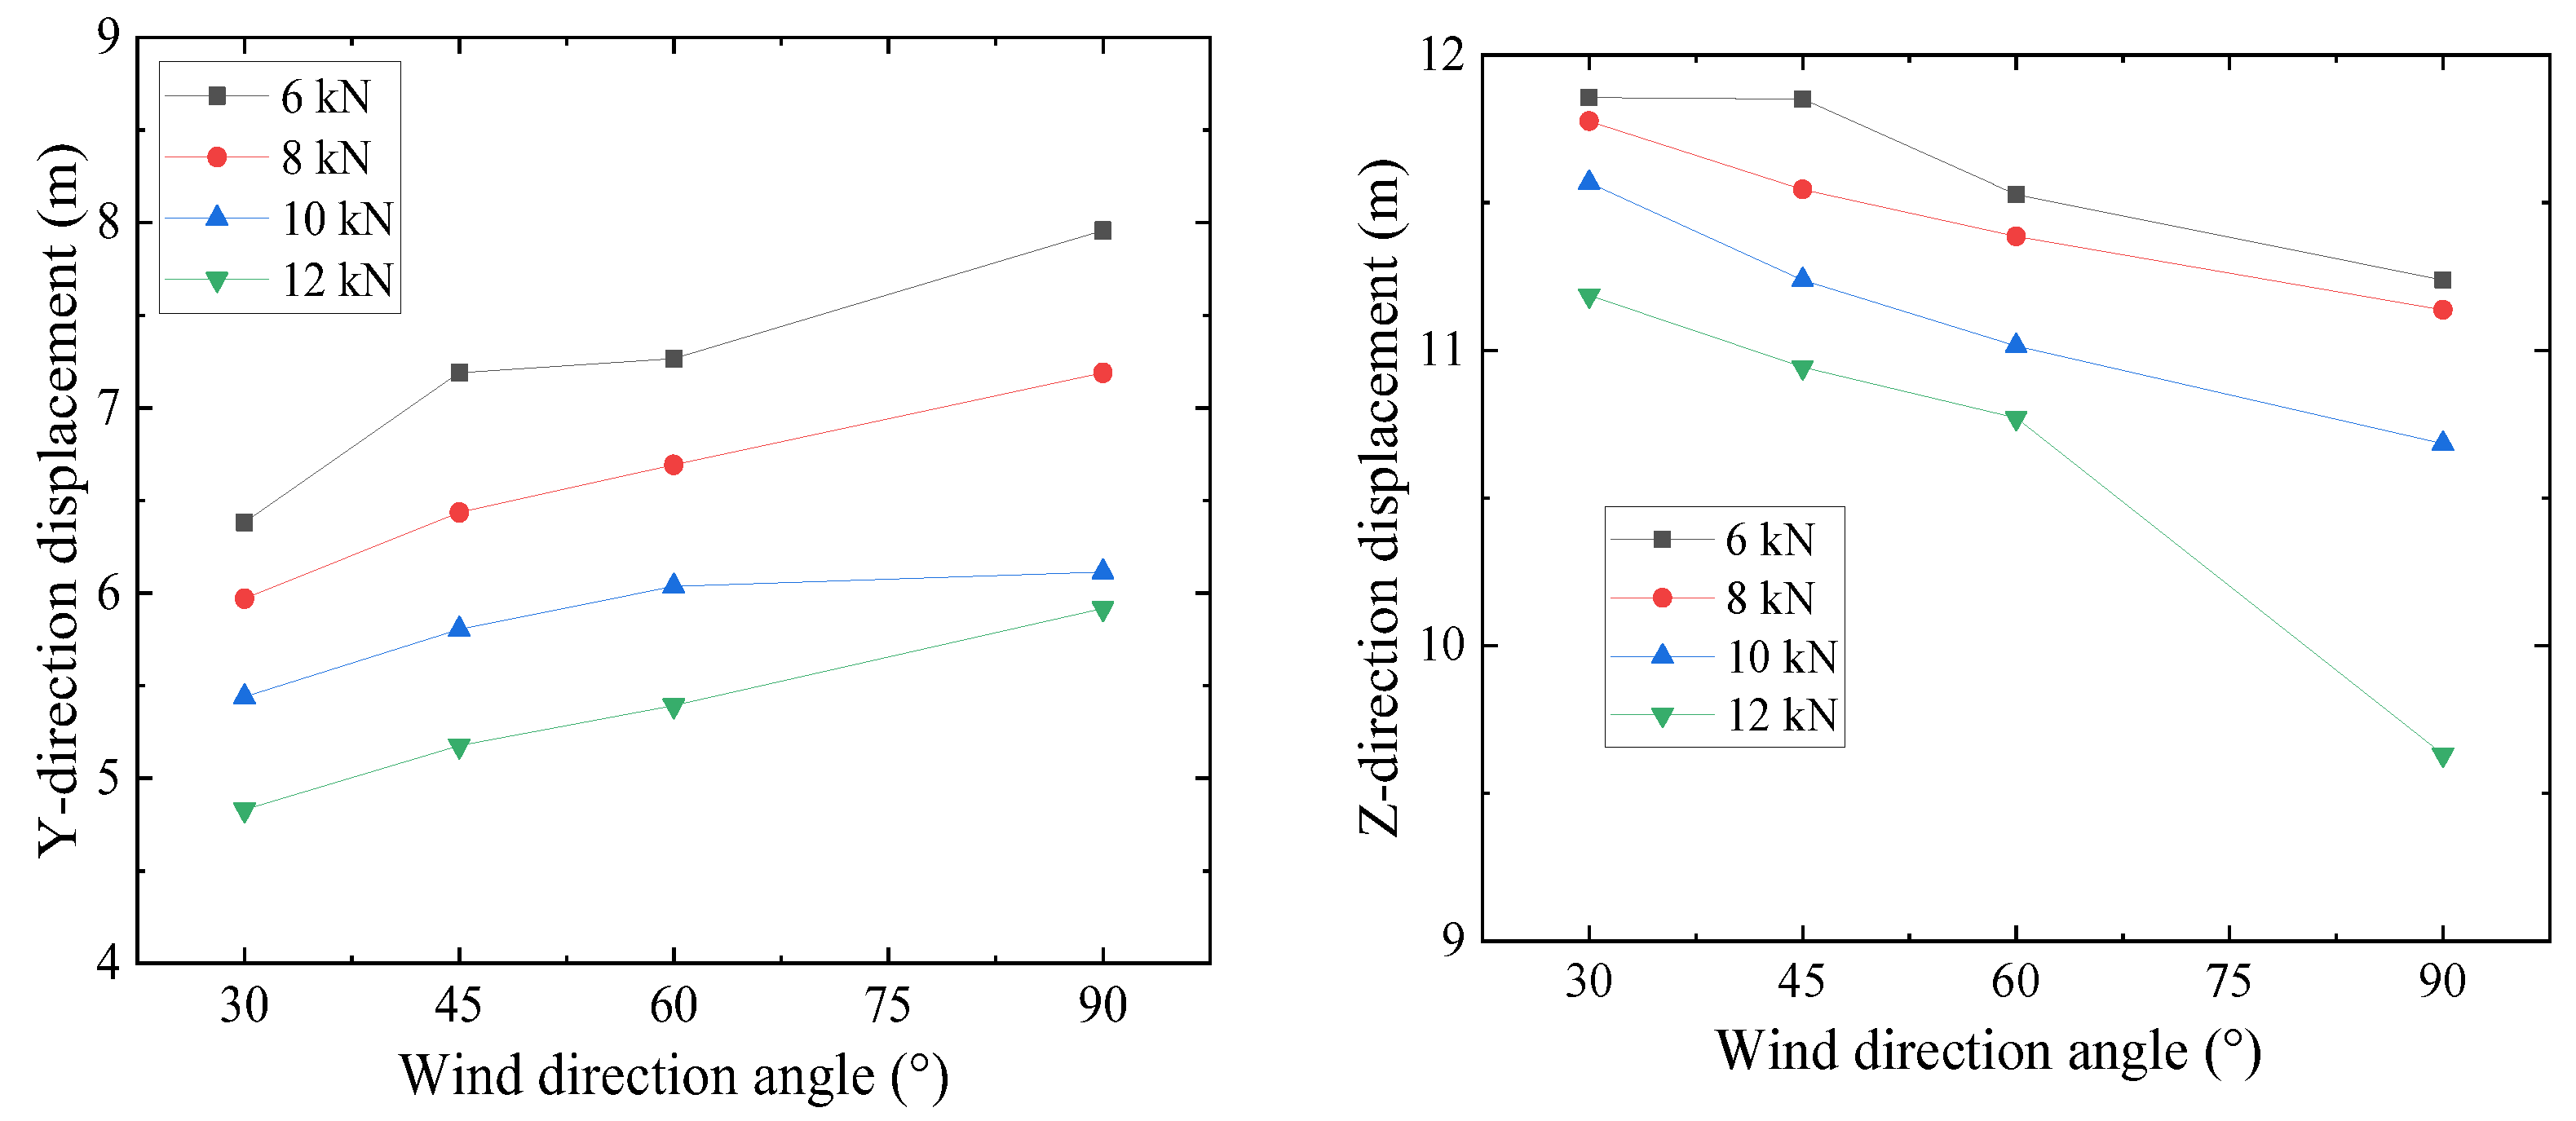
To compare the relationship between the wind deflection displacement and pretension in the span of the sealing net structure under various wind angles, the obtained data were organized, as presented in Figure 8. Similarly, Figure 9 depicts the relationship between stress and pretension at the end of the sealing net structure under different wind angles.
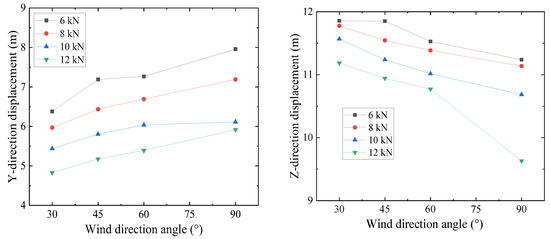
Figure 8.
Comparison of wind deflection displacement and pretension curves in the span of sealing nets at different wind angles.
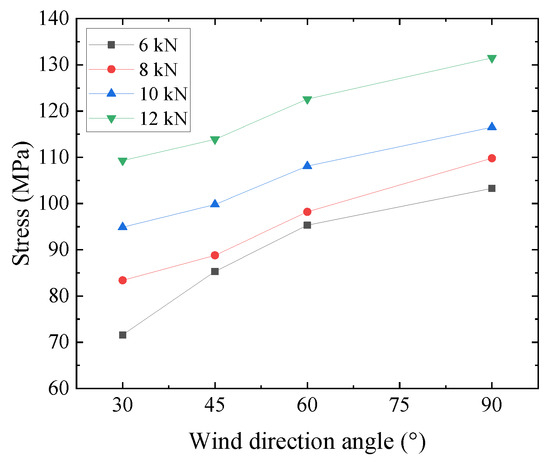
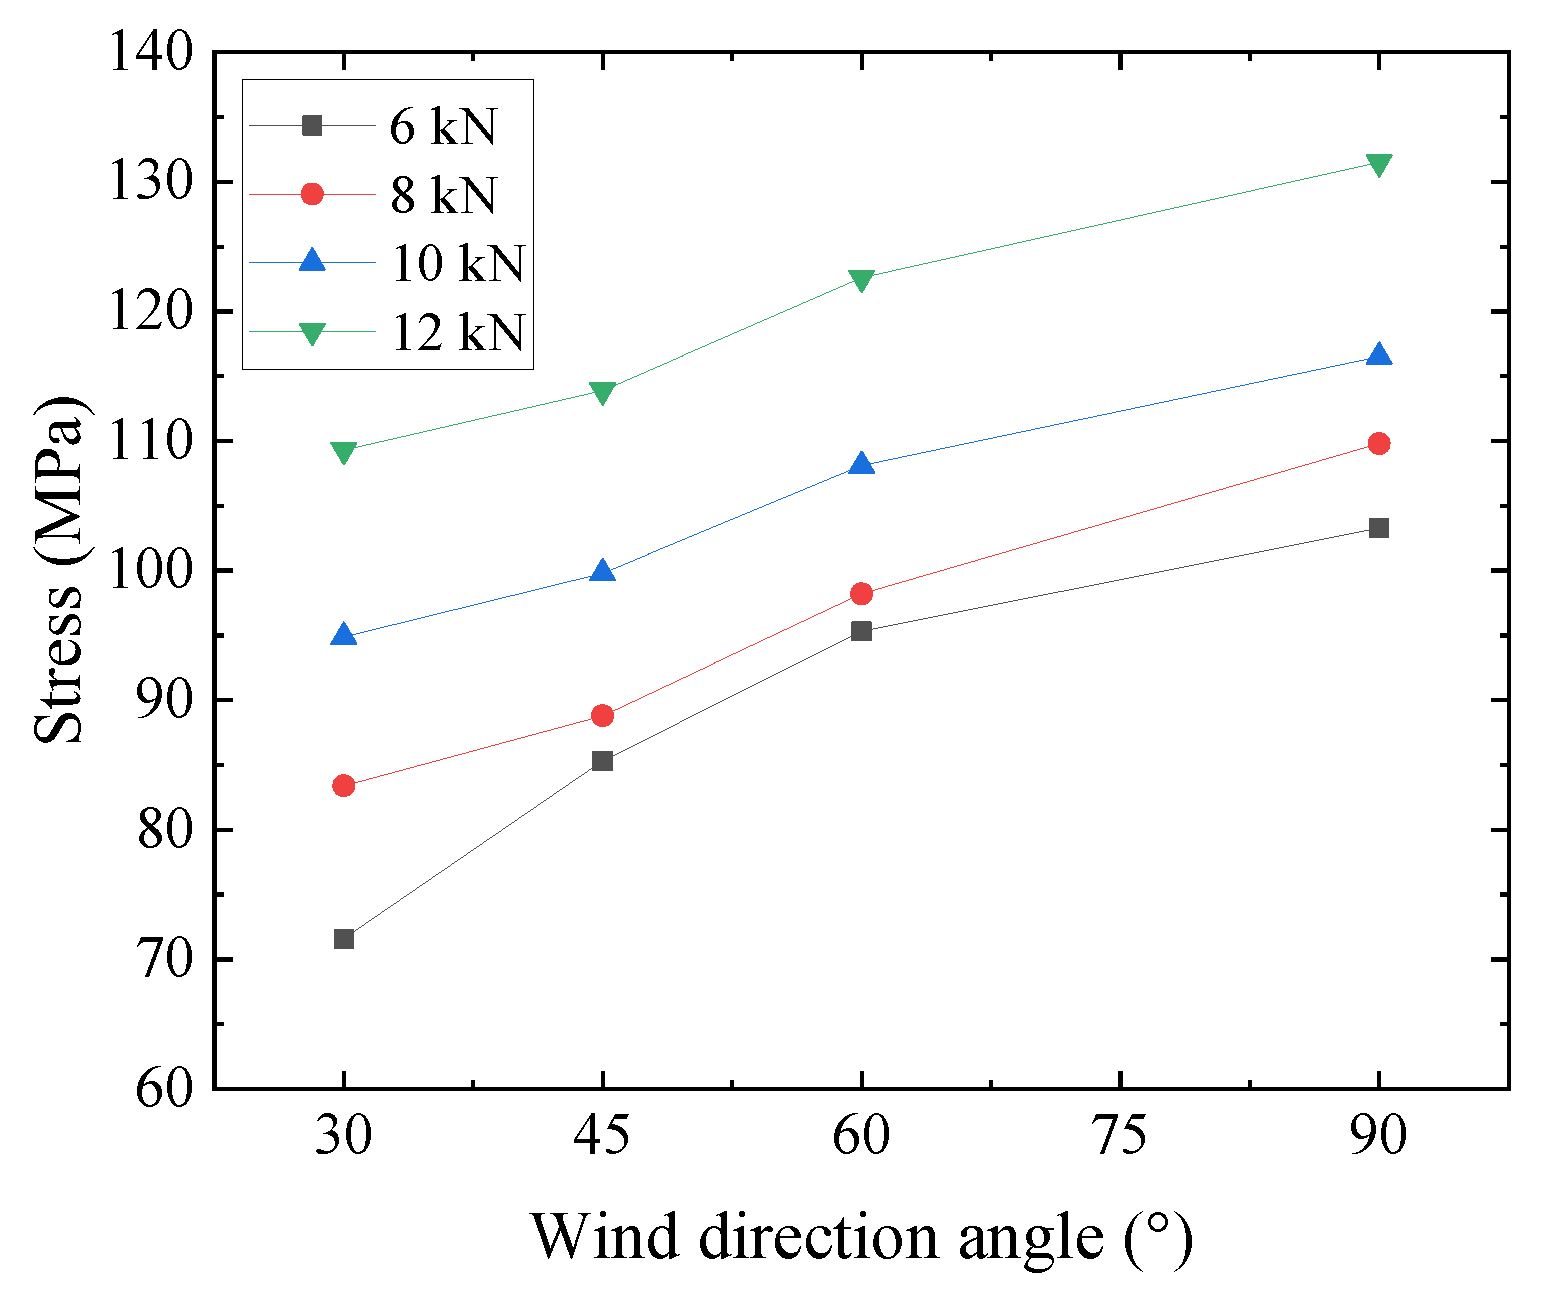
Figure 9.
Comparison of end stress versus pretension curves of sealing nets at different wind angles.
It is evident that the sealing net experiences significant wind deflections in both the horizontal and vertical directions under varying wind angles. The wind deflection displacement of the sealing net structure increases in the horizontal direction as the wind angle rises, while the displacement in the vertical direction remains relatively unchanged. This phenomenon occurs because, as the wind angle approaches 90 degrees, the wind load becomes increasingly perpendicular to the sealing net. Consequently, the force along the y-axis in the horizontal direction progressively intensifies, leading to increased displacement, whereas the z-axis direction has minimal impact. As the pretension increases, the wind displacement of the sealing net gradually diminishes, while the stress within the sealing net gradually amplifies. Specifically, when the pretension of the bearing cable reaches 12 kN, the stress at the end is 134.3% higher than when the pretension is 6 kN. However, it is important to note that even with the increased stress at the end of the web bearing cable, it still remains well below the destructive tension threshold, ensuring that the bearing cable operates within a safe range. By considering the mid-span displacements and the stresses at the end of the bearing cables in relation to the wind angle, it becomes apparent that the most unfavorable wind angle for the sealing net structure is 90 degrees.
3.5. Analysis of the Wind Vibration Response of the Sealing Mesh when the Gear Pitch Changes
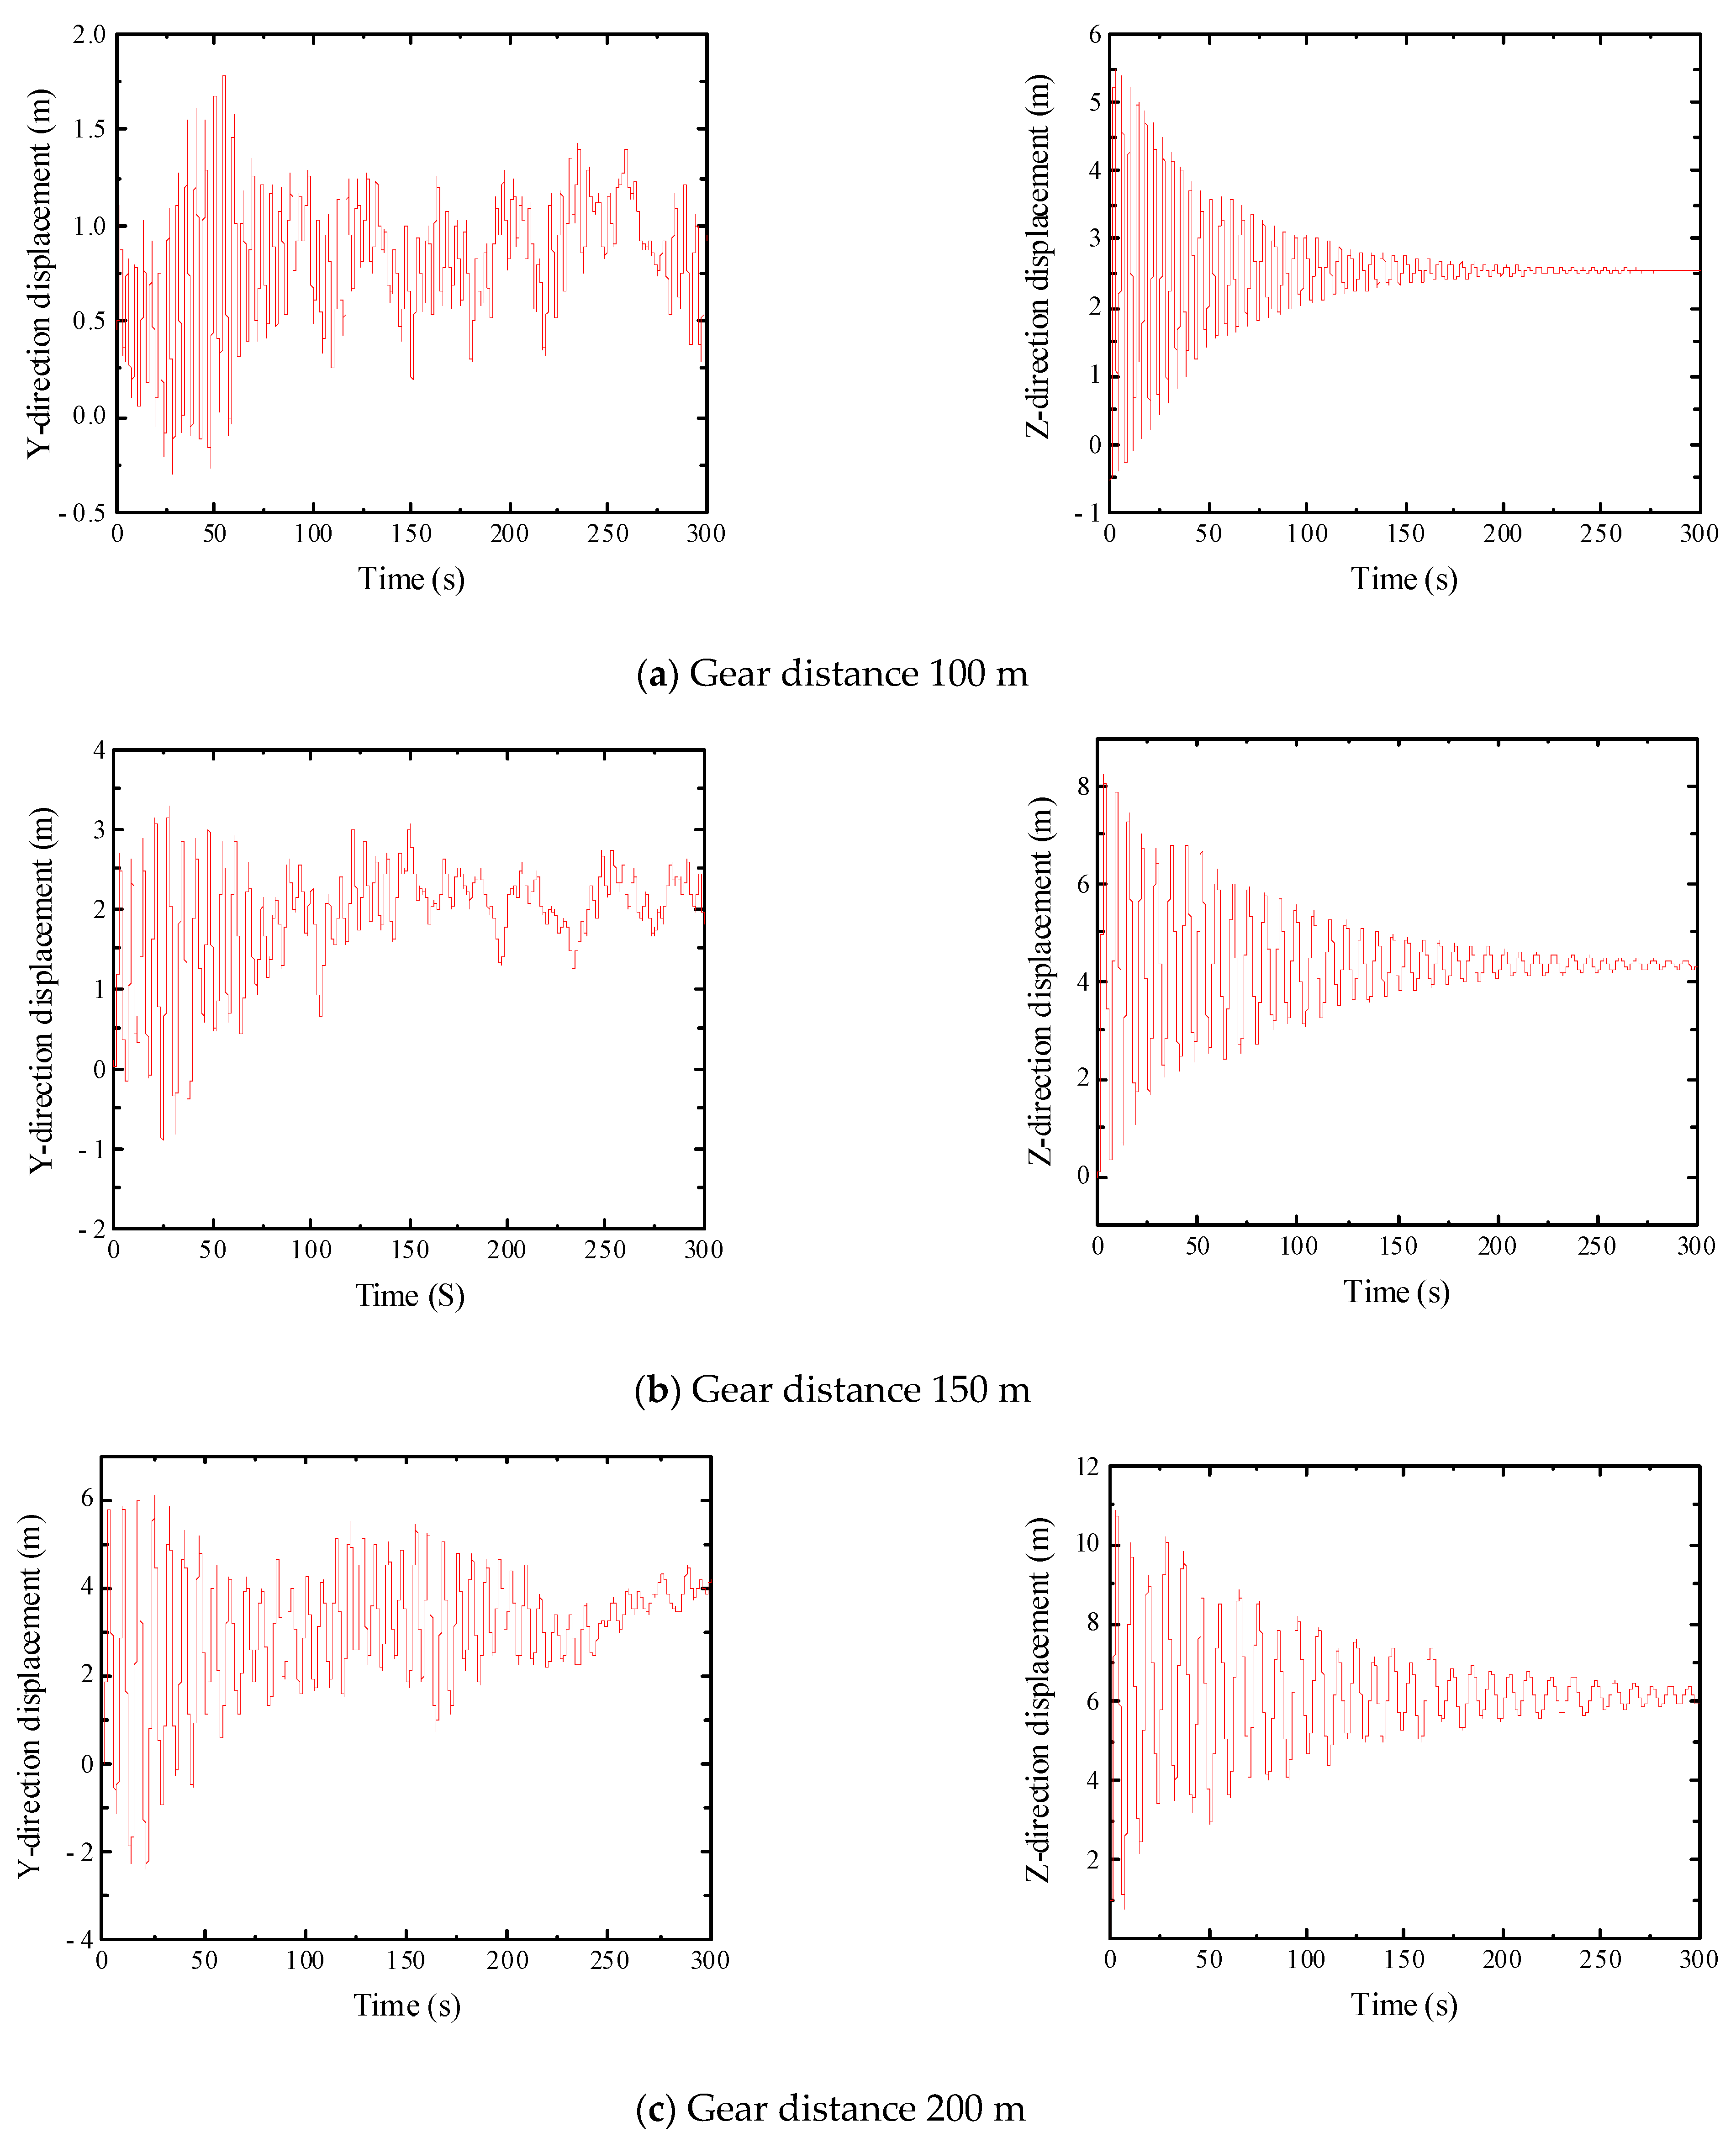
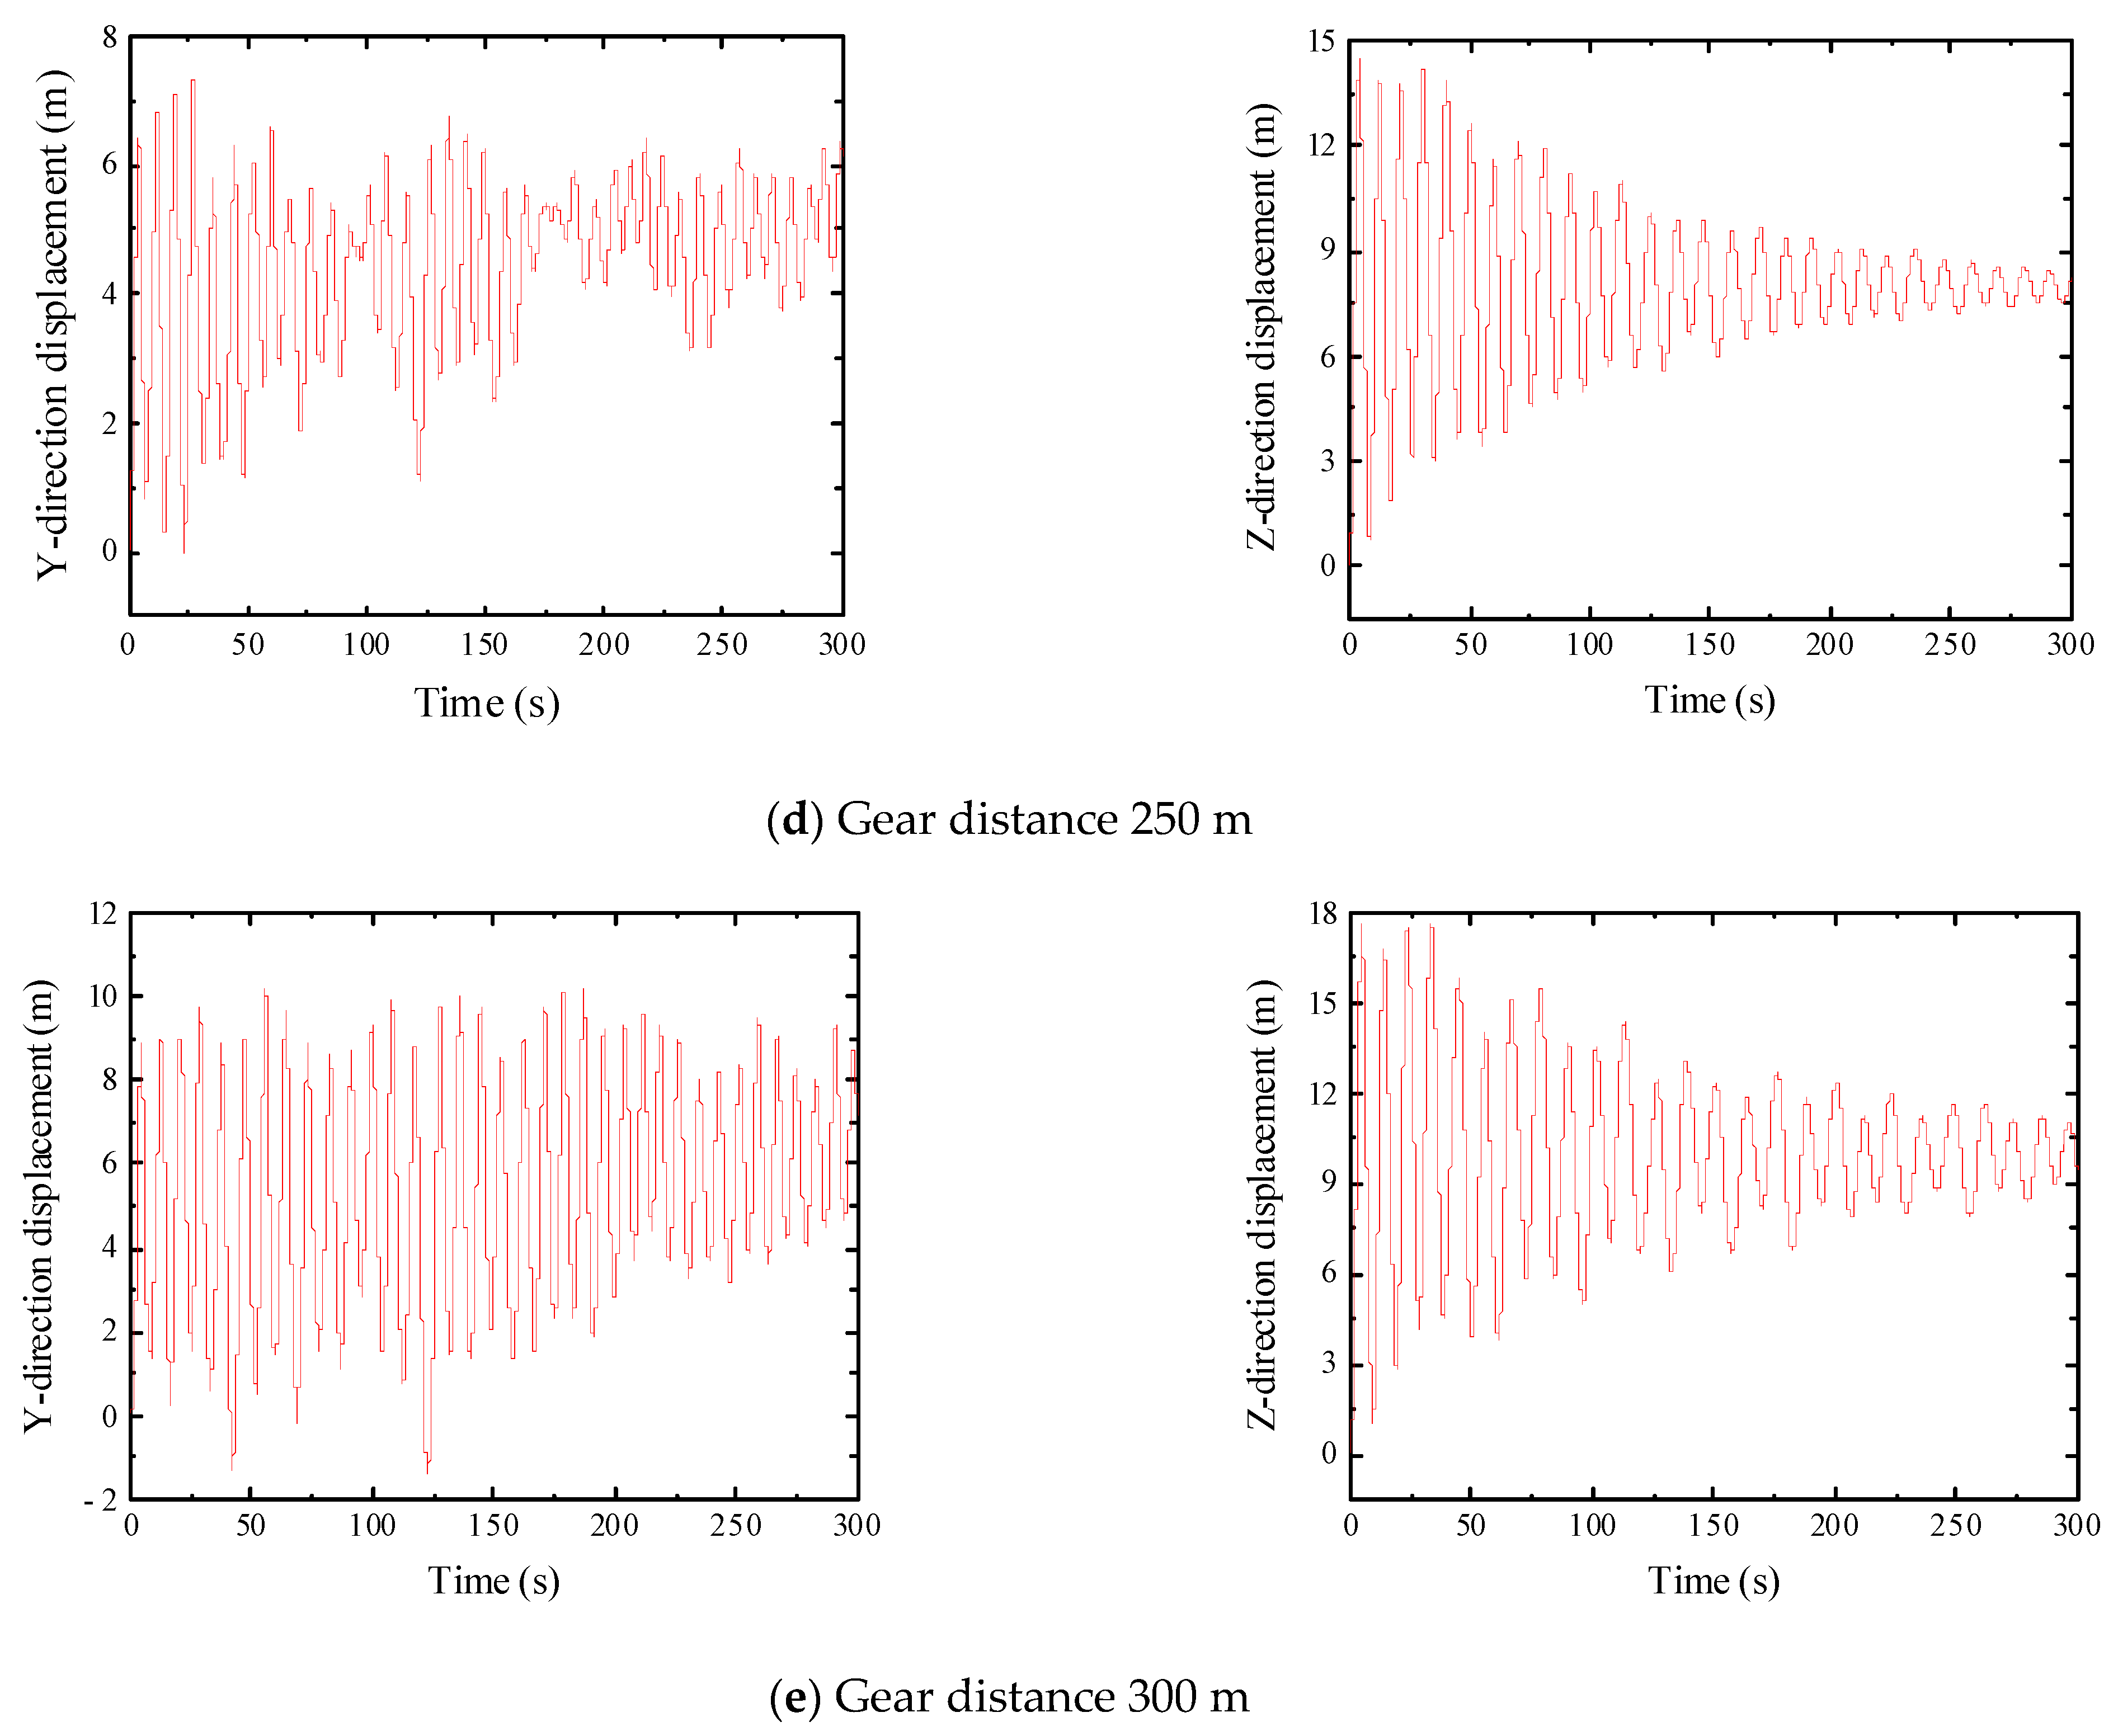
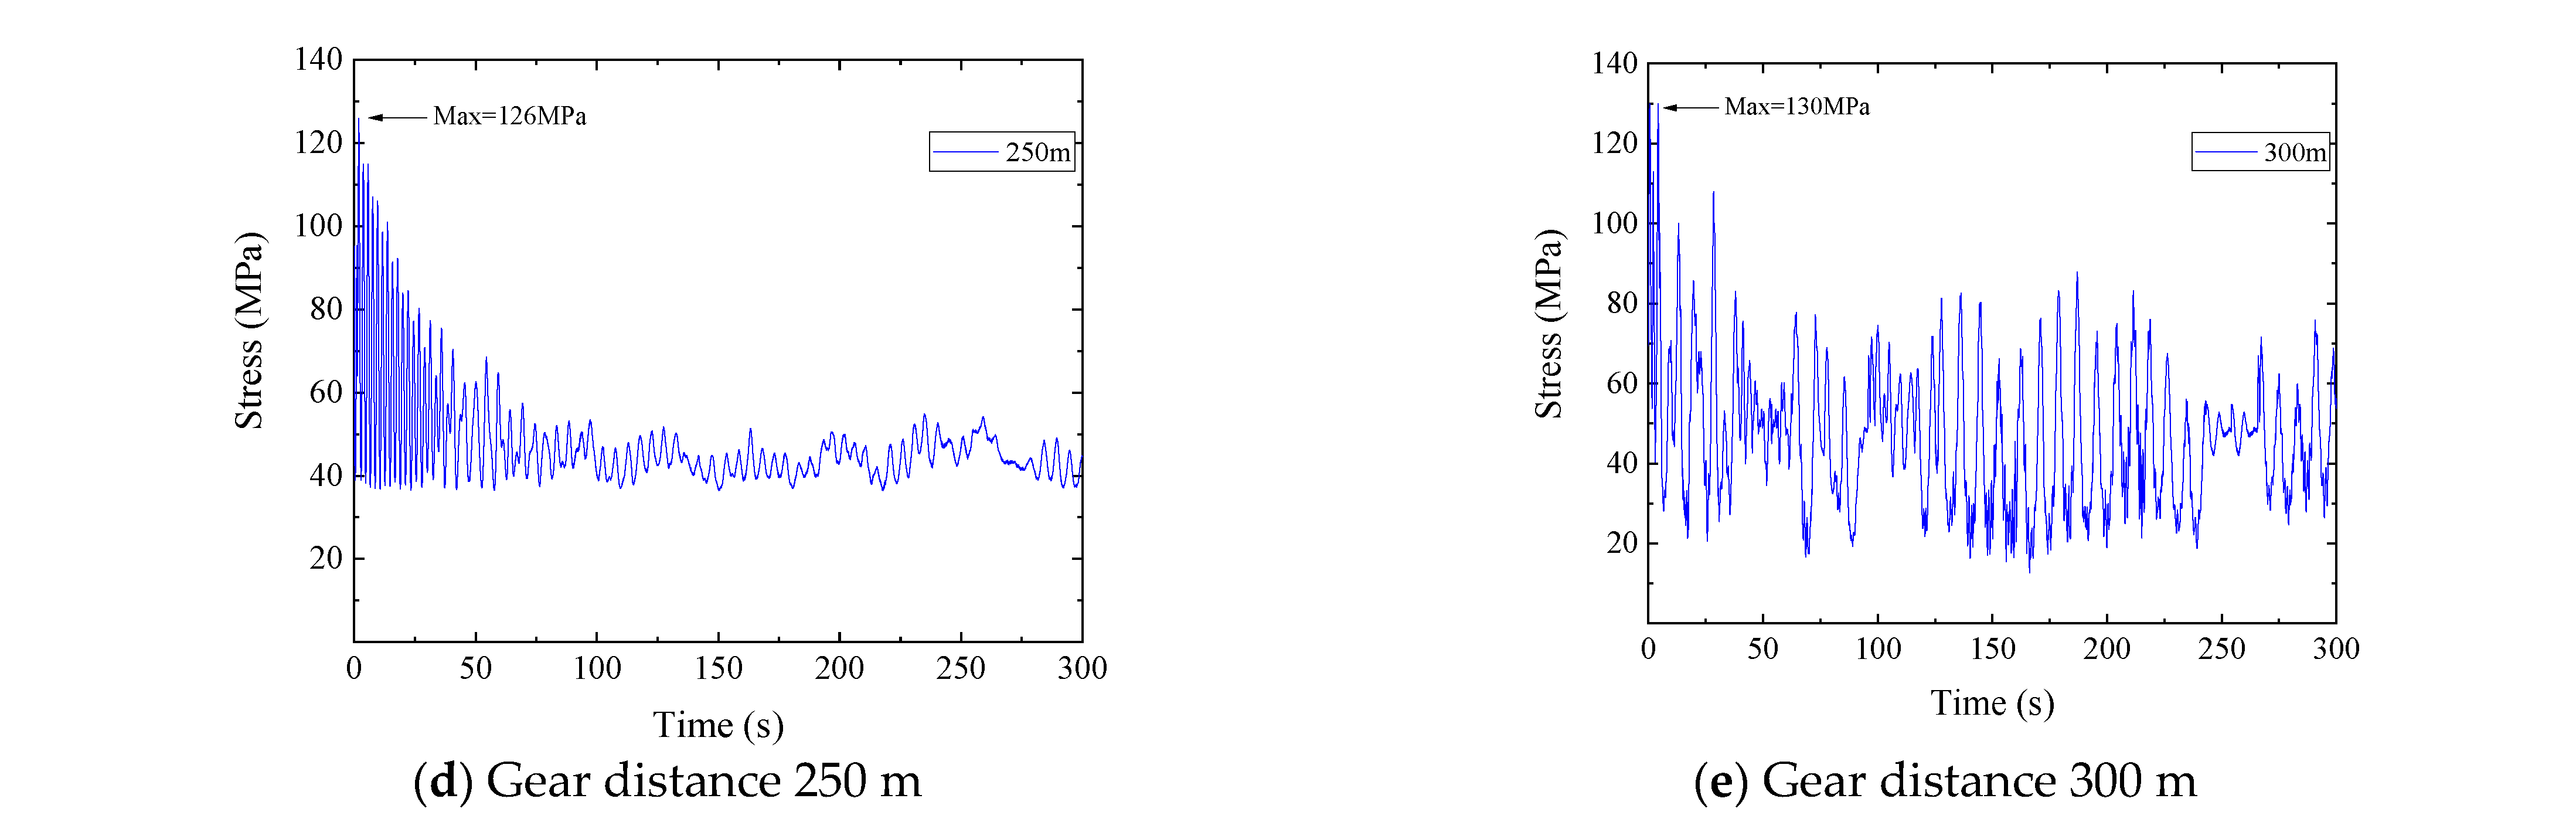
According to the given data, the selection of the sealing net span distance varies for different transmission lines. In actual construction, the chosen span distance for the sealing net typically ranges from 100 to 300 m or less [31]. Therefore, the span distance considered in the analysis ranges from 100 to 300 m, with an increment of 50 m. A wind speed of 10 m/s is selected, along with a wind angle of 90 degrees as the most unfavorable condition and a cable tension of 10 kN for analyzing the wind-induced vibration response. The displacement over time in the span of the corresponding sealing net structure is presented in Figure 10, while the stress over time at the ends of the load-bearing cables is displayed in Figure 11.
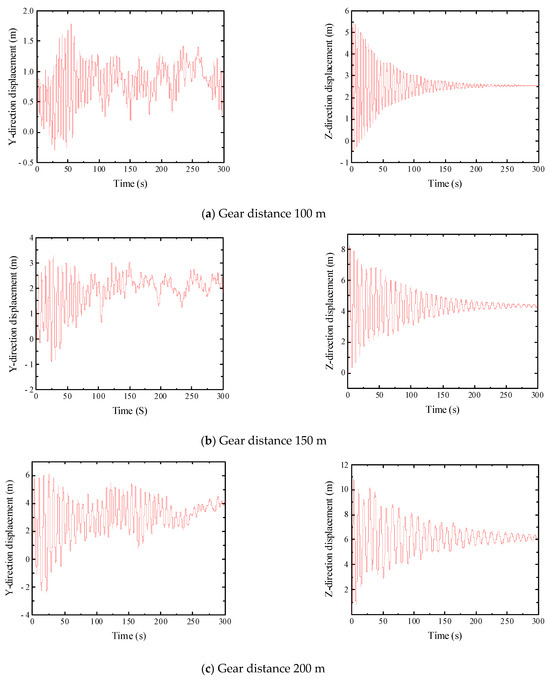
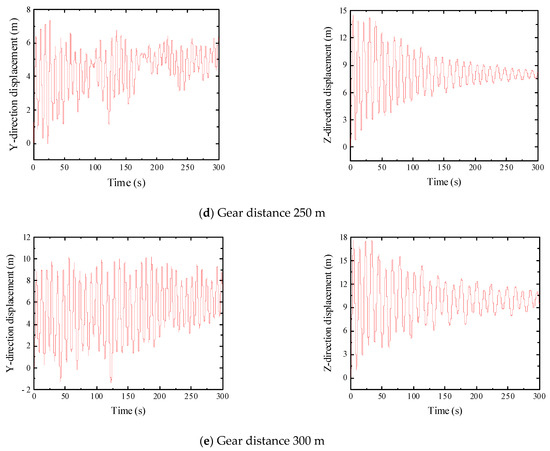
Figure 10.
Time history of displacements at different gear spacing of the sealing net.
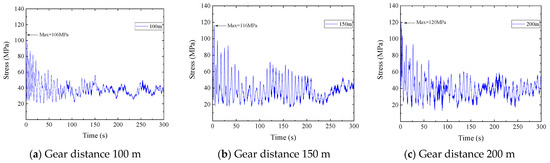
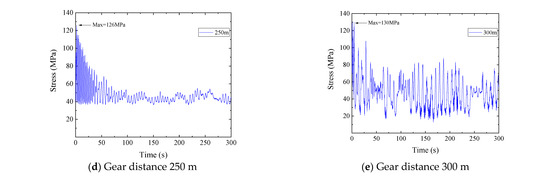
Figure 11.
Time history of stresses at the end of bearing cables with different gear spacing.
Based on the analysis of Figure 10 and Figure 11, it can be observed that when the prevailing wind speed is 10 m/s and the wind direction angle is 90 degrees, the horizontal oscillation of the sealing net diminishes in amplitude and eventually reaches a steady range. In the vertical direction, the oscillation tends toward a specific value. The maximum stress at the end of the sealing mesh cable occurs within a 5 s interval prior to the application of a fluctuating wind load on the structure. Moreover, with the passage of time, the stress value gradually stabilizes within a defined range.
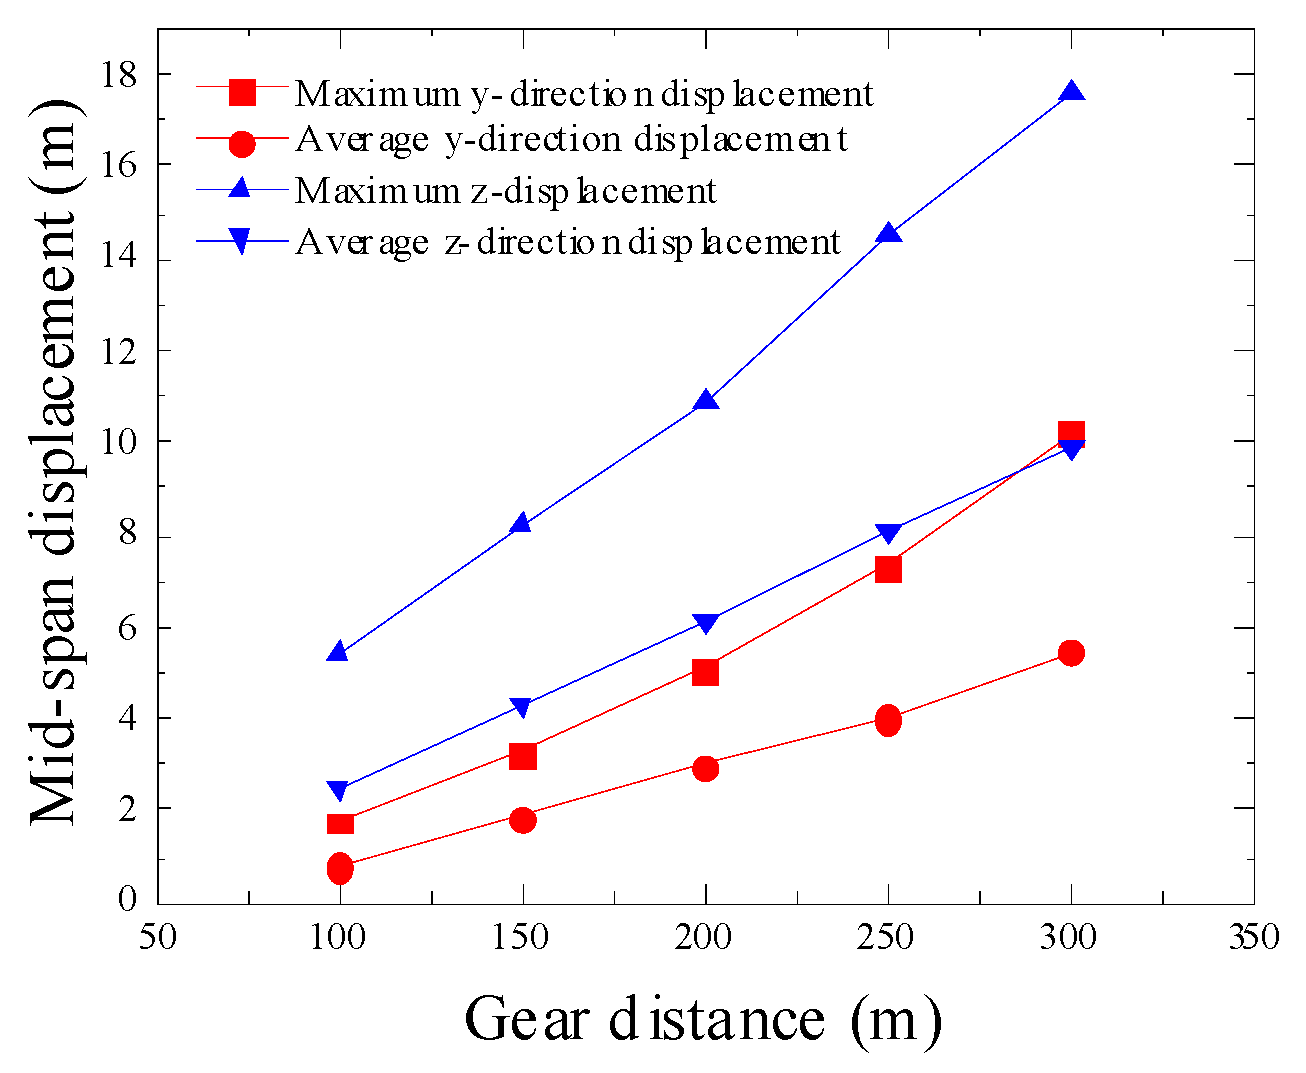
Following the organization of the computed data, Figure 12 presents the windage displacement curves of the sealing structure for different spans. Additionally, Table 8 provides information about the stresses at the end of the sealing structure associated with varying spans.
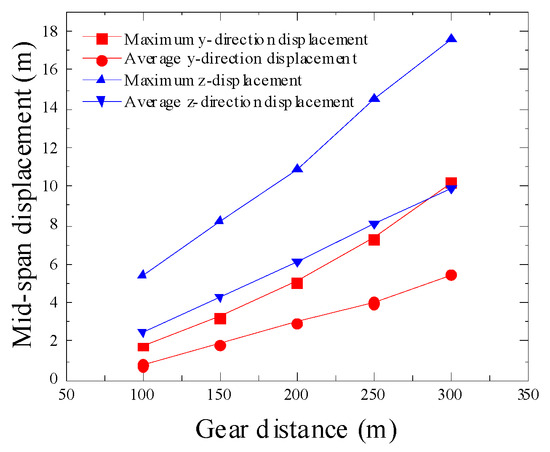
Figure 12.
Changes in displacement of the sealing structure with different gear spacing.
Table 8.
Stress at the end of the sealing net with different spans.
Figure 12 illustrates substantial wind displacements in both the horizontal and vertical directions of the sealing net. The magnitudes of these displacements increase with larger stall spacing, indicating a significant influence of stall spacing changes on the sealing net’s wind displacement. Vertical displacements range from 100 m to 300 m pitch. With a 50 m increase in pitch, the maximum span-to-span displacement of the sealing net increases by 2.108 m horizontally and 3.030 m vertically. This finding highlights the considerable impact of pitch changes on the sealing net structure in the vertical direction.
Table 8 reveals that stress at the end of the load-bearing cable increases with larger spanning pitches. This effect is due to the increased length of the load-bearing cable, resulting in a greater overall mass of the sealing structure. Simultaneously, the wind load on the sealing structure generates an increased combined force, leading to higher stress at the end of the load-bearing cable. For a spanning distance of 300 m, the peak stress reaches approximately 129.6 MPa, with a safety coefficient of 9.67, indicating that the stress remains within a safe range.
Consequently, wind displacement and stress in each upward direction of the sealing net structure escalate with larger spanning gear distances. During the construction of overhead lines, it is recommended to choose smaller gear distances for sealing the net to minimize wind displacement and stress on the sealing net structure, ensuring safety.
3.6. Analysis of the Wind Vibration Response of the Sealing Net When the Bearing Cable Tension and Wind Speed Change
The tension of the bearing cables is a crucial factor that affects the wind displacement of the sealing net. By increasing the pretension of the bearing cables, the wind displacement of the sealing net can be effectively controlled. However, it is important to note that increasing the pretension also leads to higher tension in the bearing cables when subjected to wind loads, which can result in a lower safety coefficient. During the construction of the spanning sealing net in this study, it is anticipated that the erected structure may face windy weather conditions. Considering the actual circumstances, four different levels of pretension were selected for the bearing cables: 6 kN, 8 kN, 10 kN, and 12 kN. These pretension values were chosen to ensure the safe utilization of the bearing cables. To investigate the wind vibration response of the closure structure at various wind speeds, simulations were conducted for five different wind speeds: 6 m/s, 8 m/s, 10 m/s, 12 m/s, and 14 m/s. The stall distance was set at 200 m, and a wind direction angle of 90 degrees was used for the wind vibration calculation and analysis.
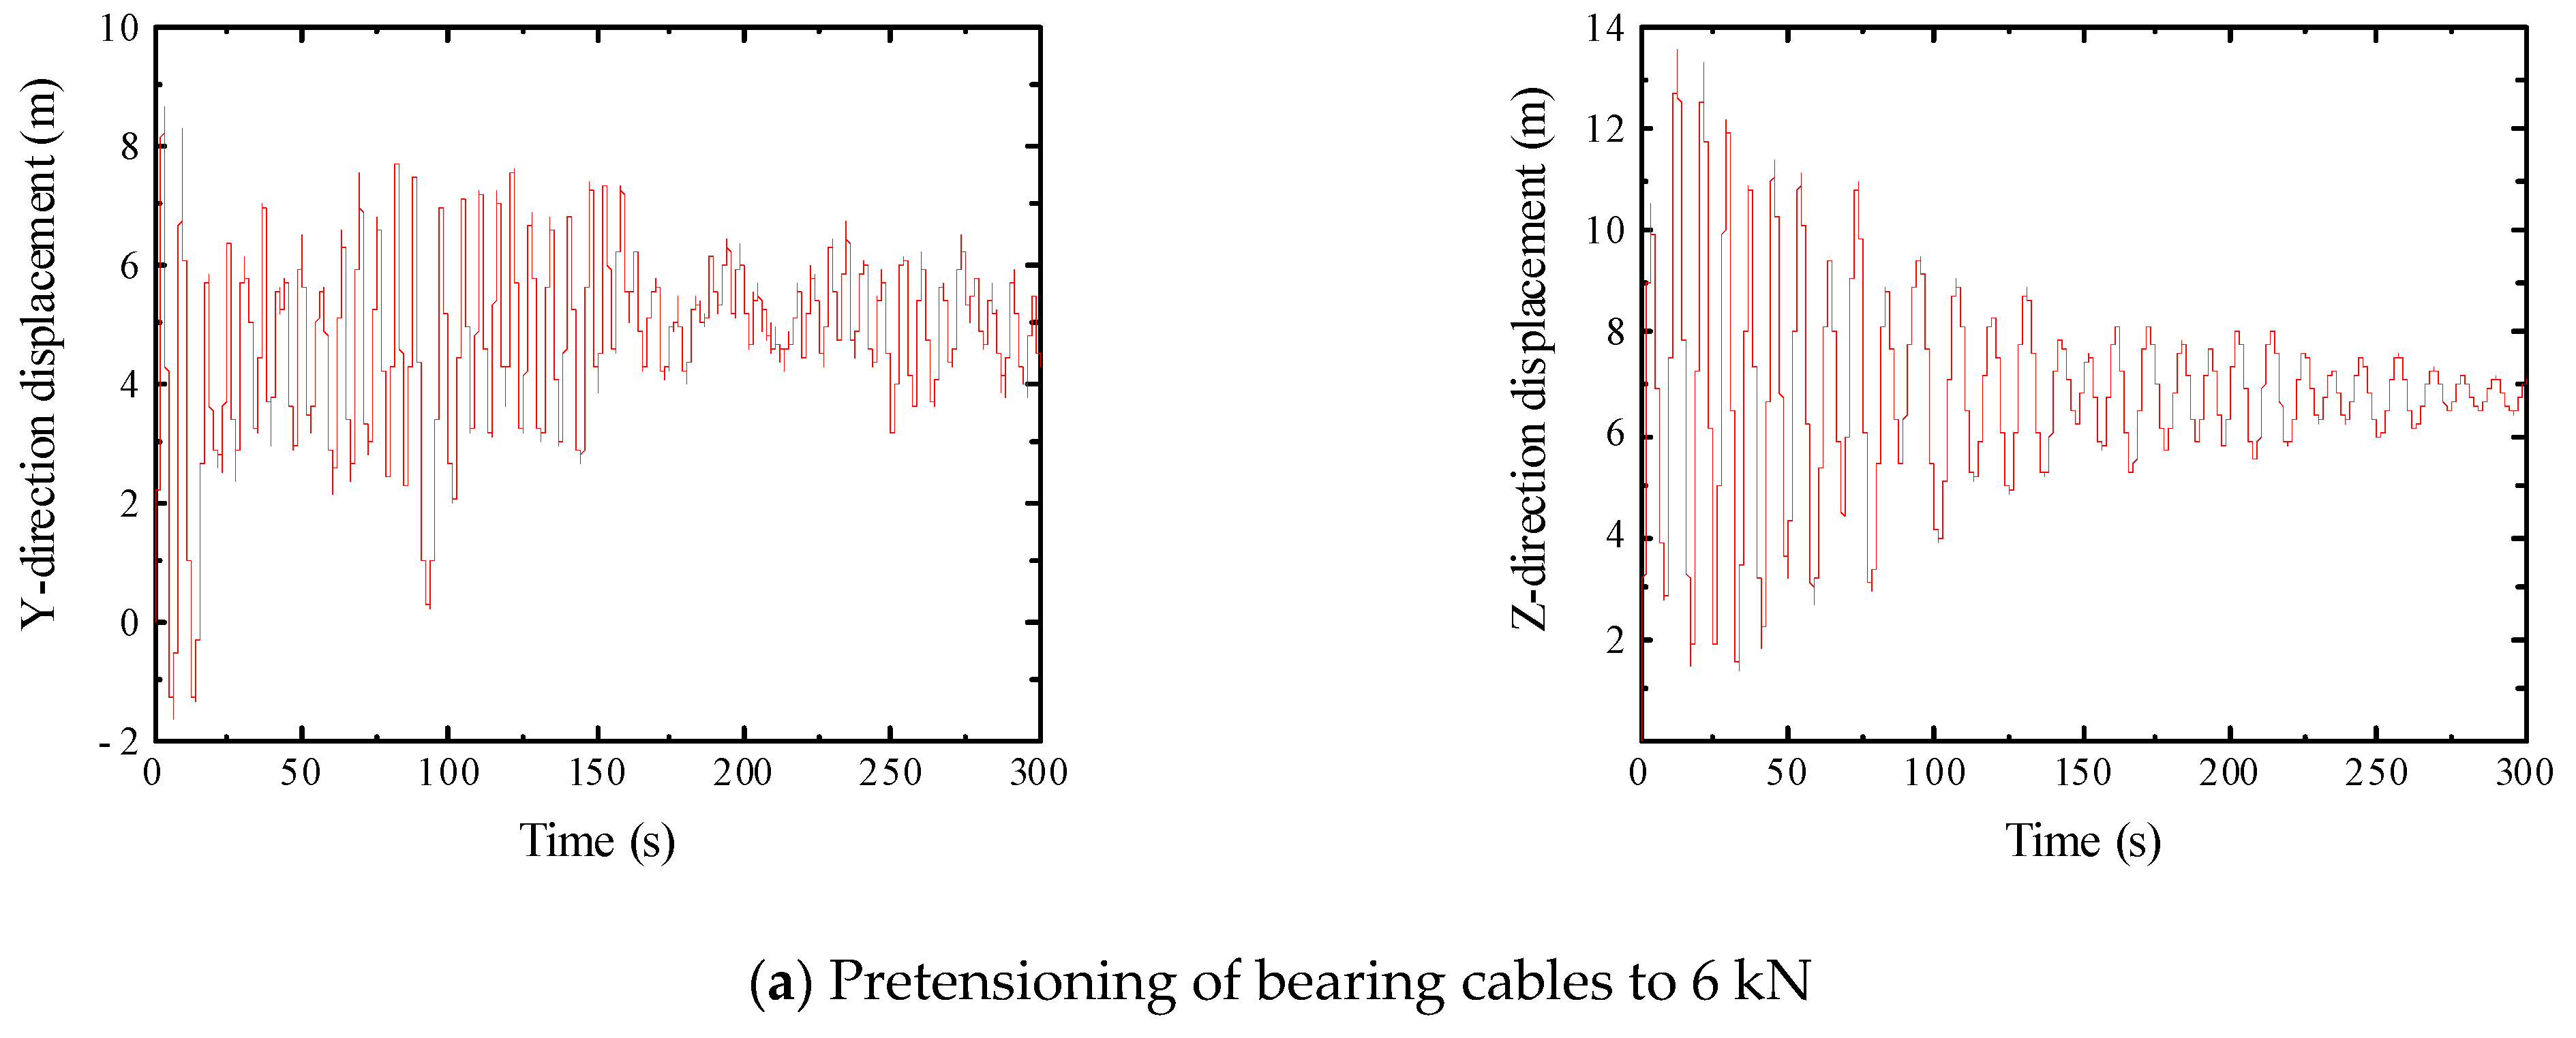
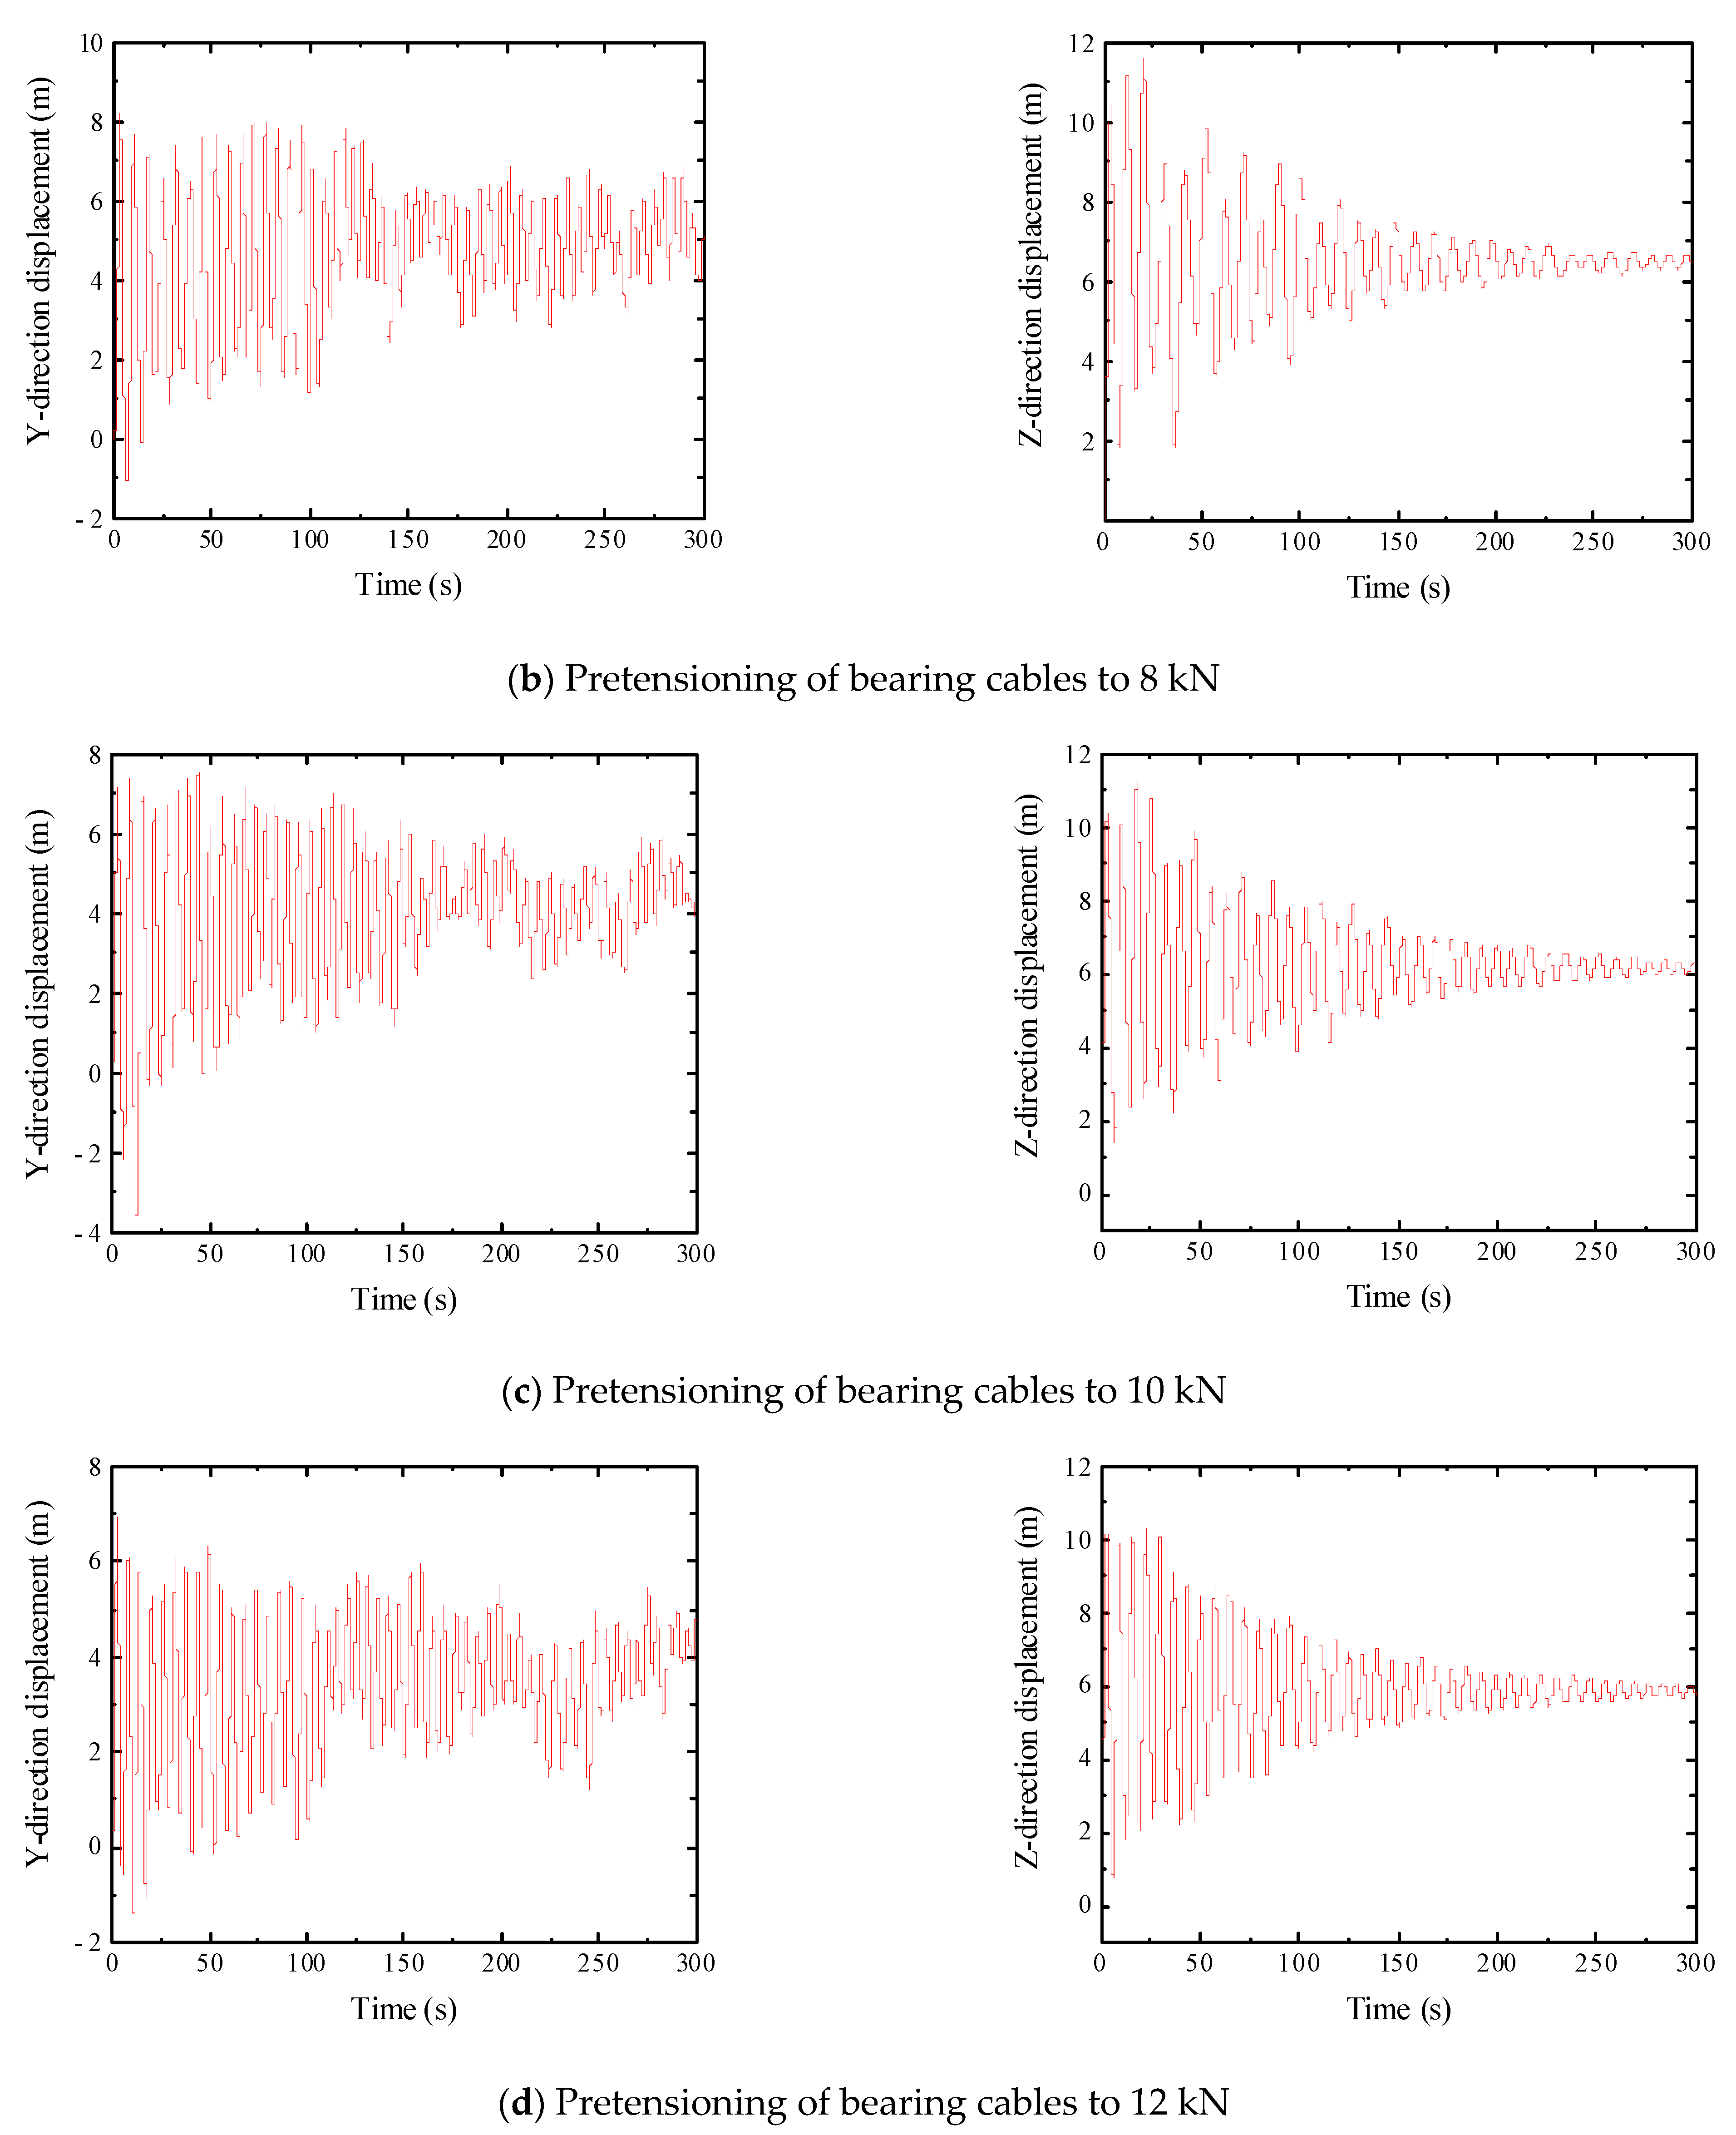
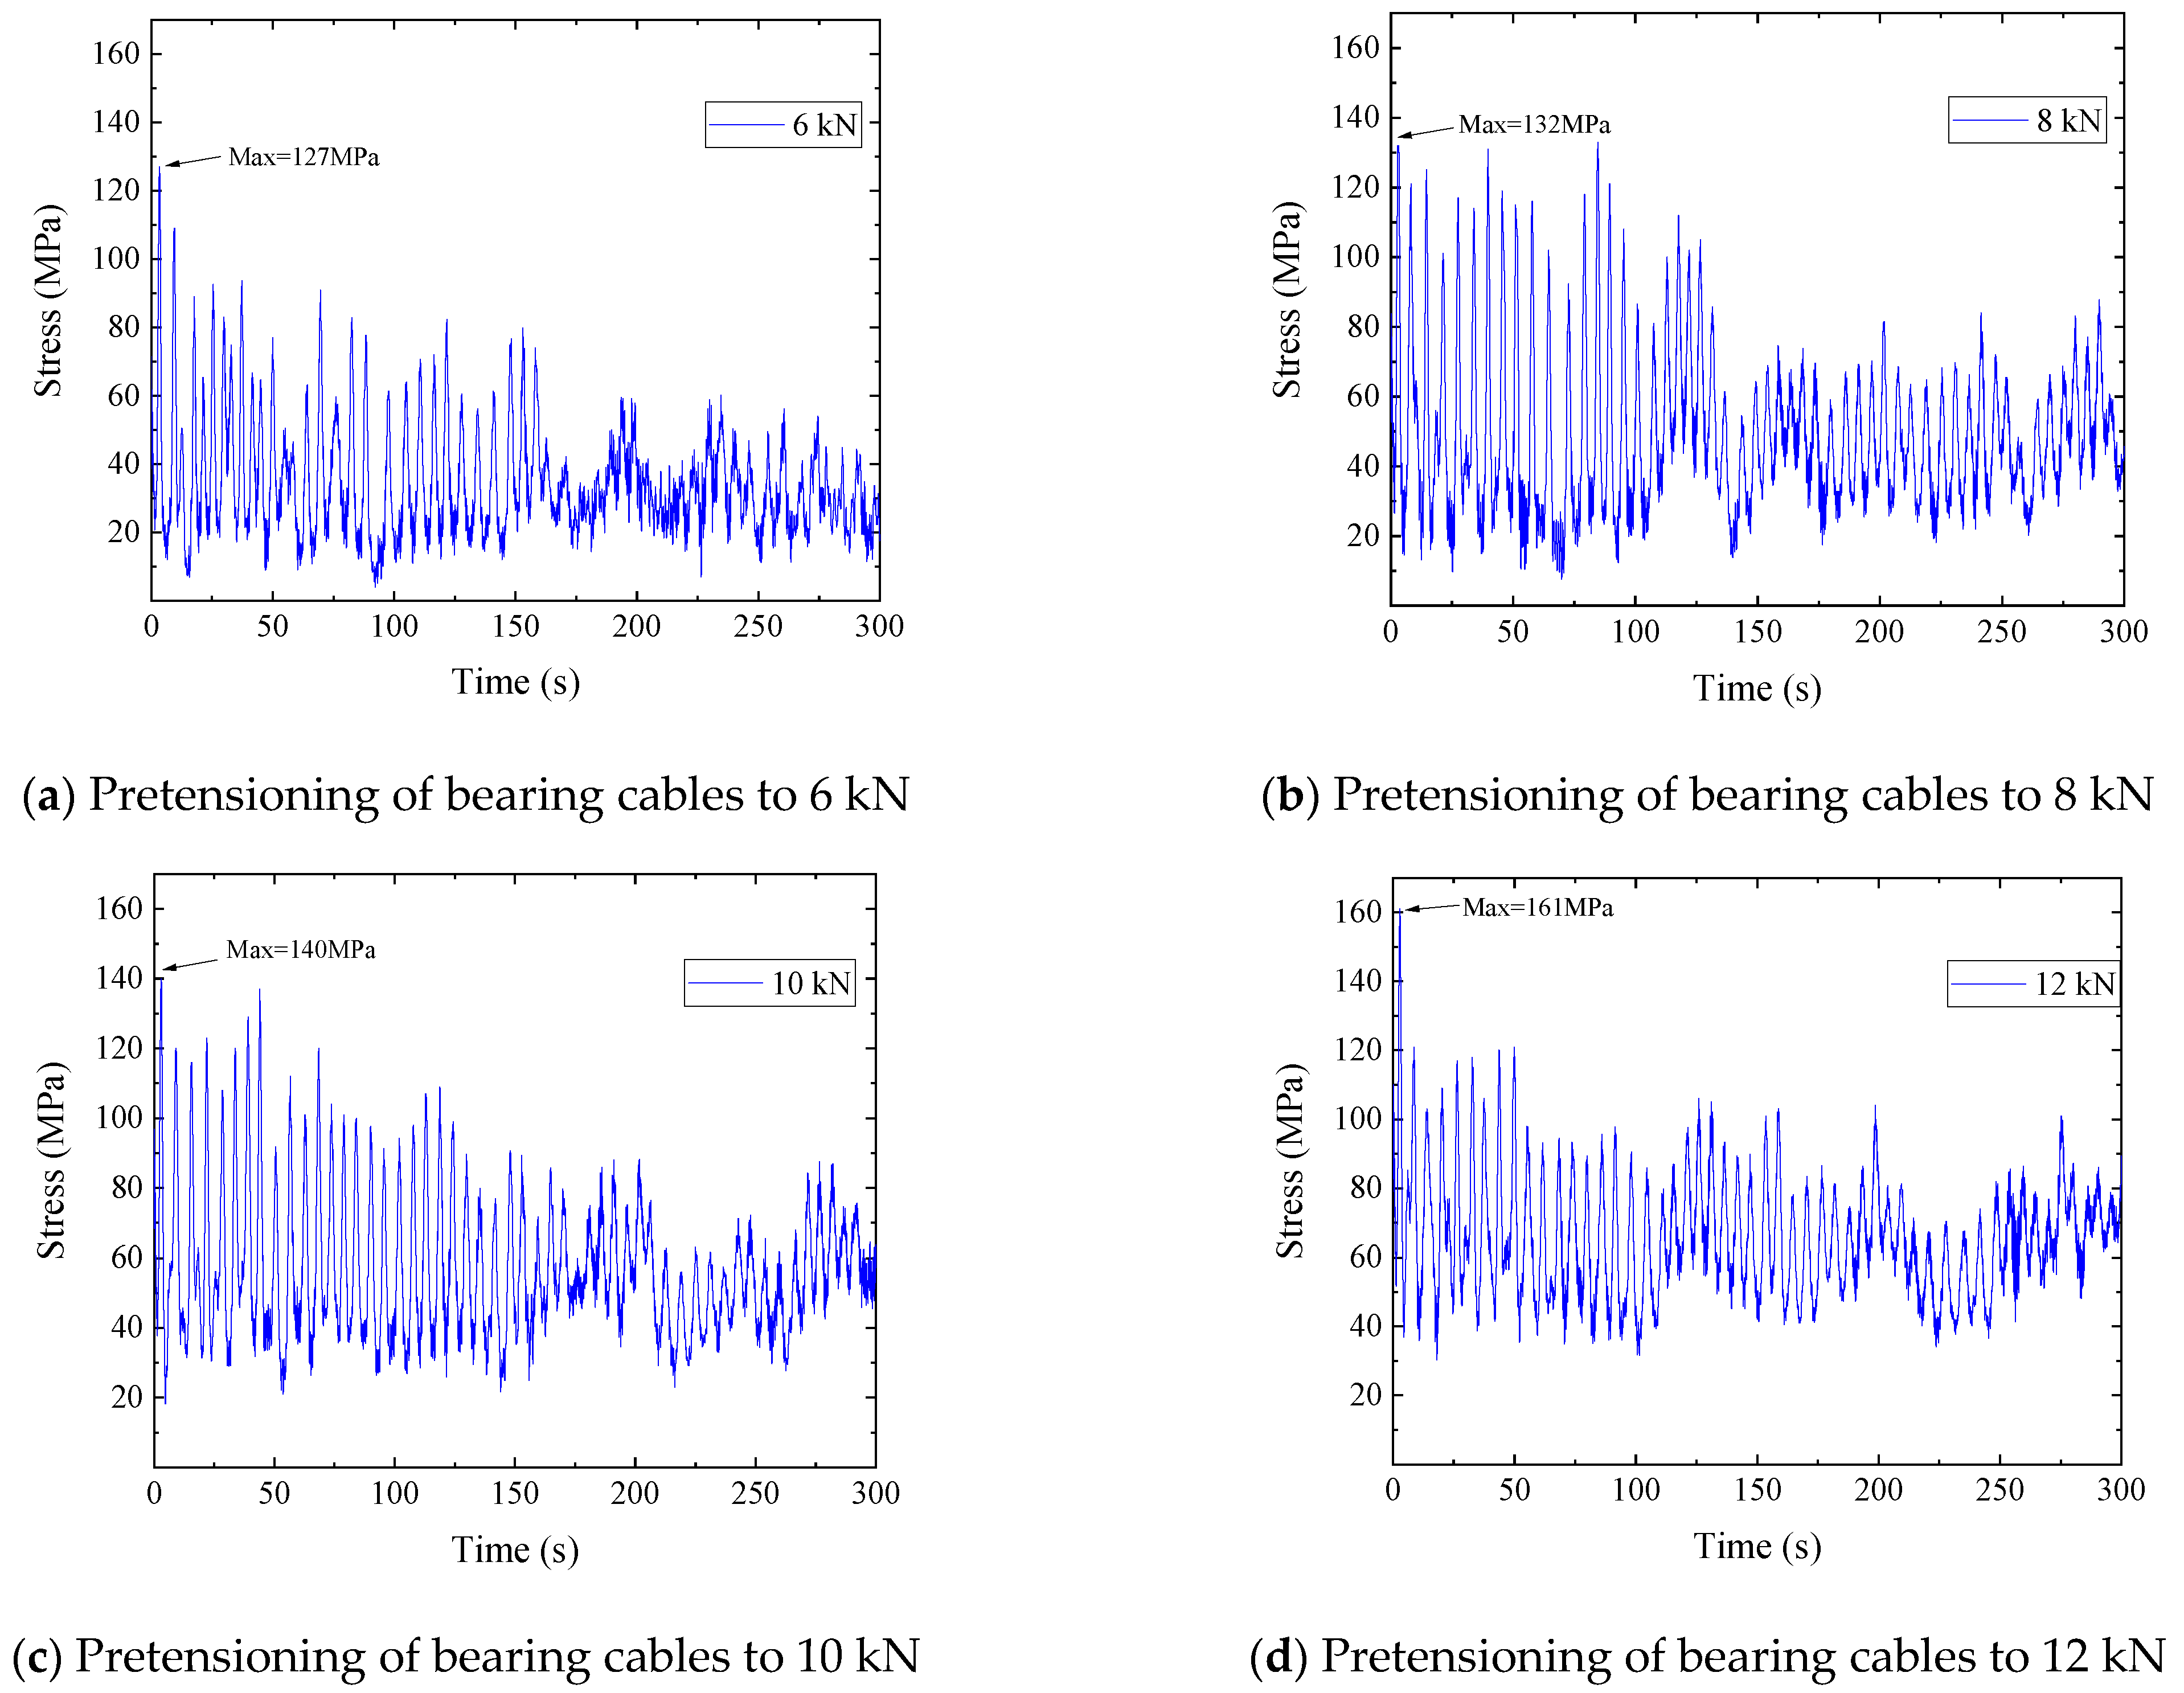
Due to the large number of working conditions, only the time history diagram of the midspan displacement is extracted when the wind speed is 14 m/s, which is a relatively unfavorable working condition, as shown in Figure 13. The stress time history diagram of the bearing cable end of the sealing net structure is shown in Figure 14.
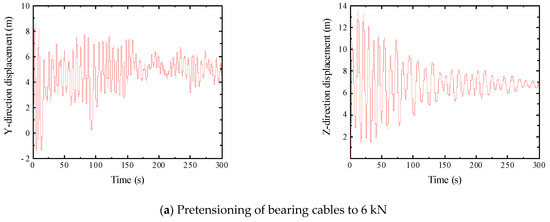
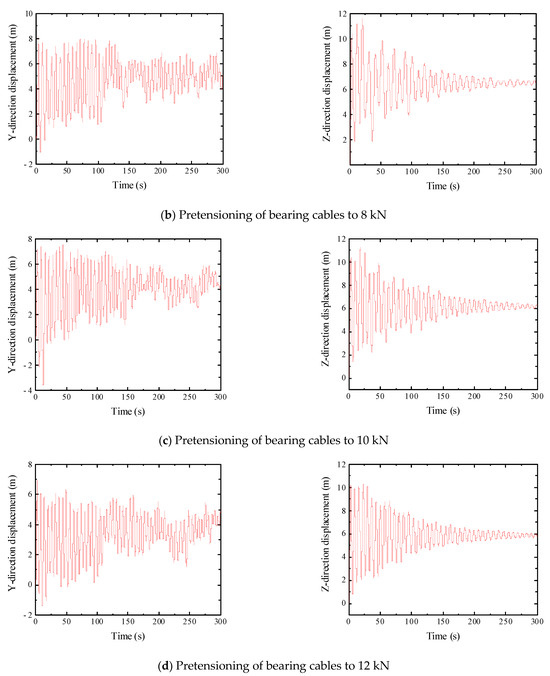
Figure 13.
Time history of mid-span displacements of bearing cables under different pretensions at a wind angle of 90 degrees.
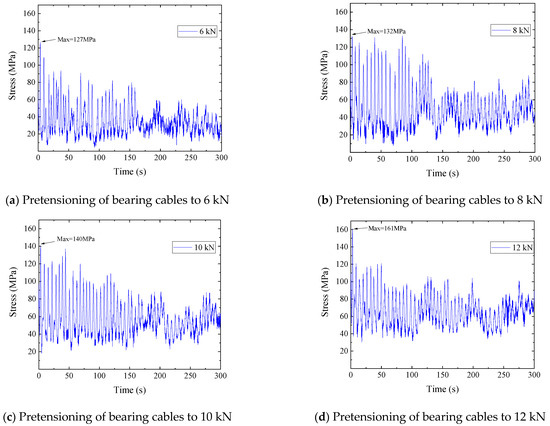
Figure 14.
Time history of stress at the end of the bearing cable under different pretensions at a wind angle of 90 degrees.
Based on the analysis of Figure 13 and Figure 14, it can be observed that the horizontal fluctuation amplitude of the sealing net gradually decreases and eventually vibrates randomly within a specific range when subjected to a 90-degree wind angle at a stall distance of 200 m. The vertical fluctuation amplitude tends to stabilize at a certain value. The maximum stress on the end of the load-bearing cable occurs during the initial loading stage, and as the loading time increases, the stress gradually stabilizes. Analyzing the stress response at the end of the bearing cable for different pretensions, it can be deduced that higher pretension levels result in greater stress at the end of the cable. Specifically, when a pretension of 12 kN is applied to the bearing cable, the peak stress is approximately 161 MPa, yielding a safety factor of 7.8. Therefore, the stress in the bearing cable remains within a safe range.
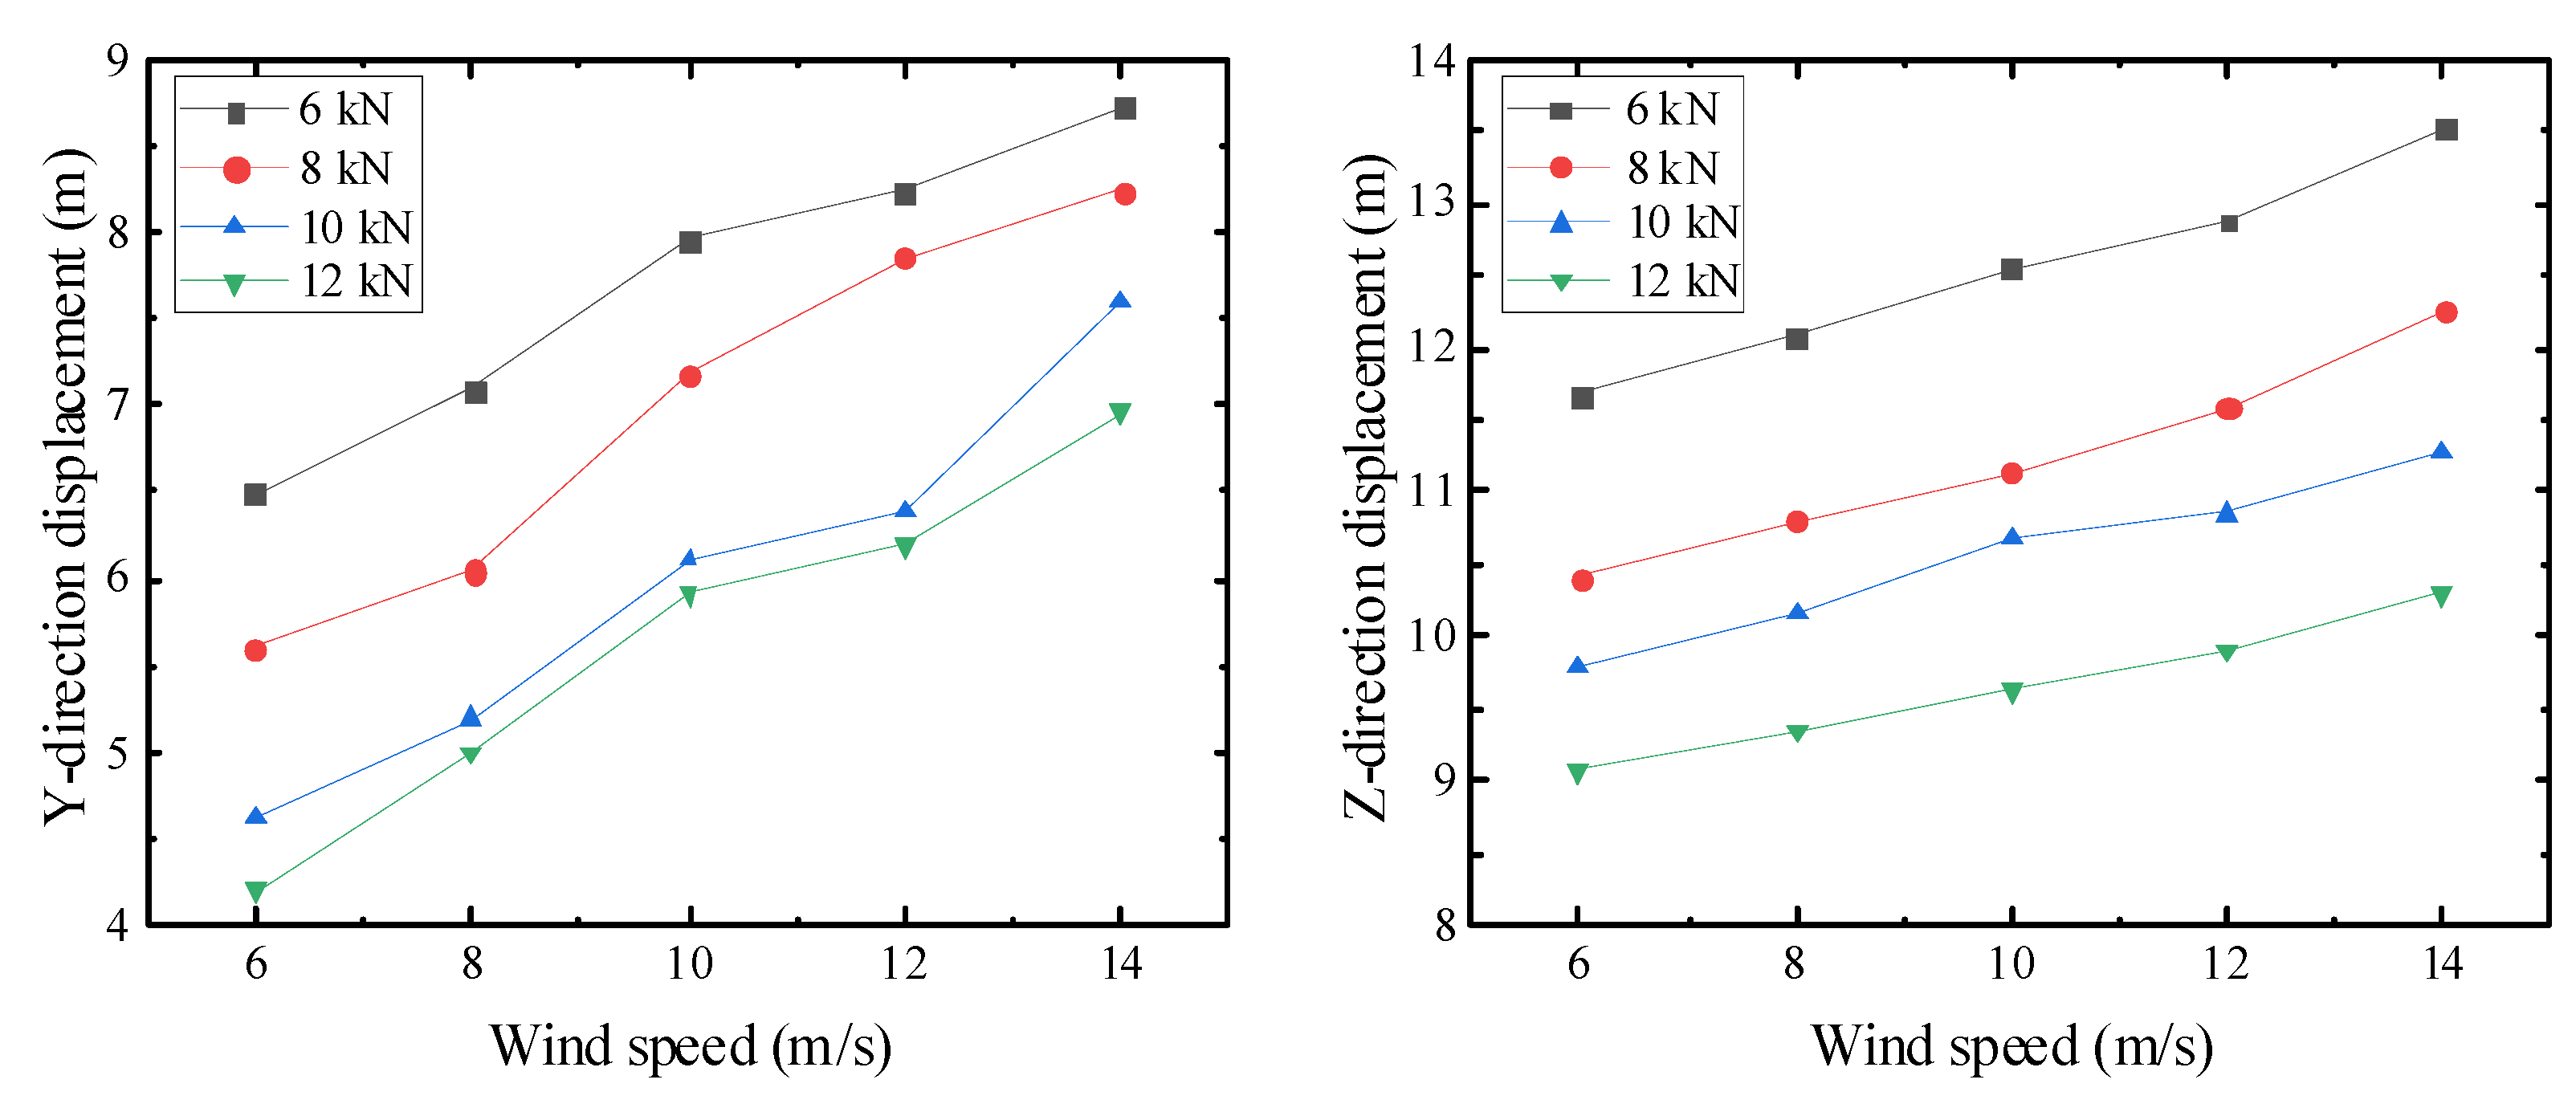
Considering the calculated data, the relationship curves between the wind deflection displacement and the pretension curves in the mid-span of the sealing net are obtained, as shown in Figure 15. The stress at the end of the sealing structure is shown in Figure 16.
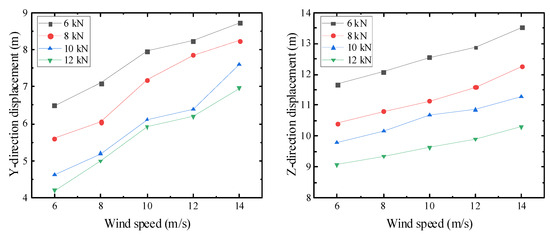
Figure 15.
Comparison of wind deflection displacement and pretension curves in the span of the sealing net with different wind angles and bearing cable tensions.
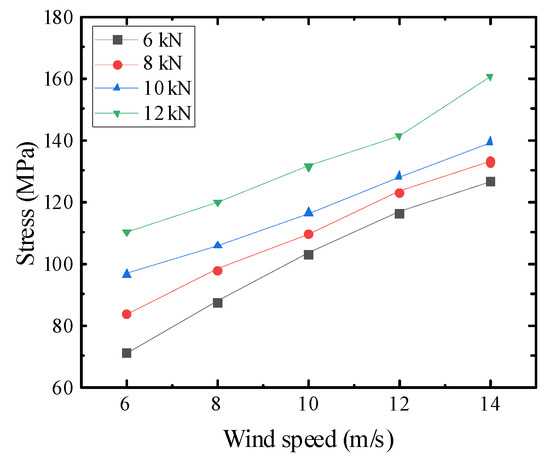
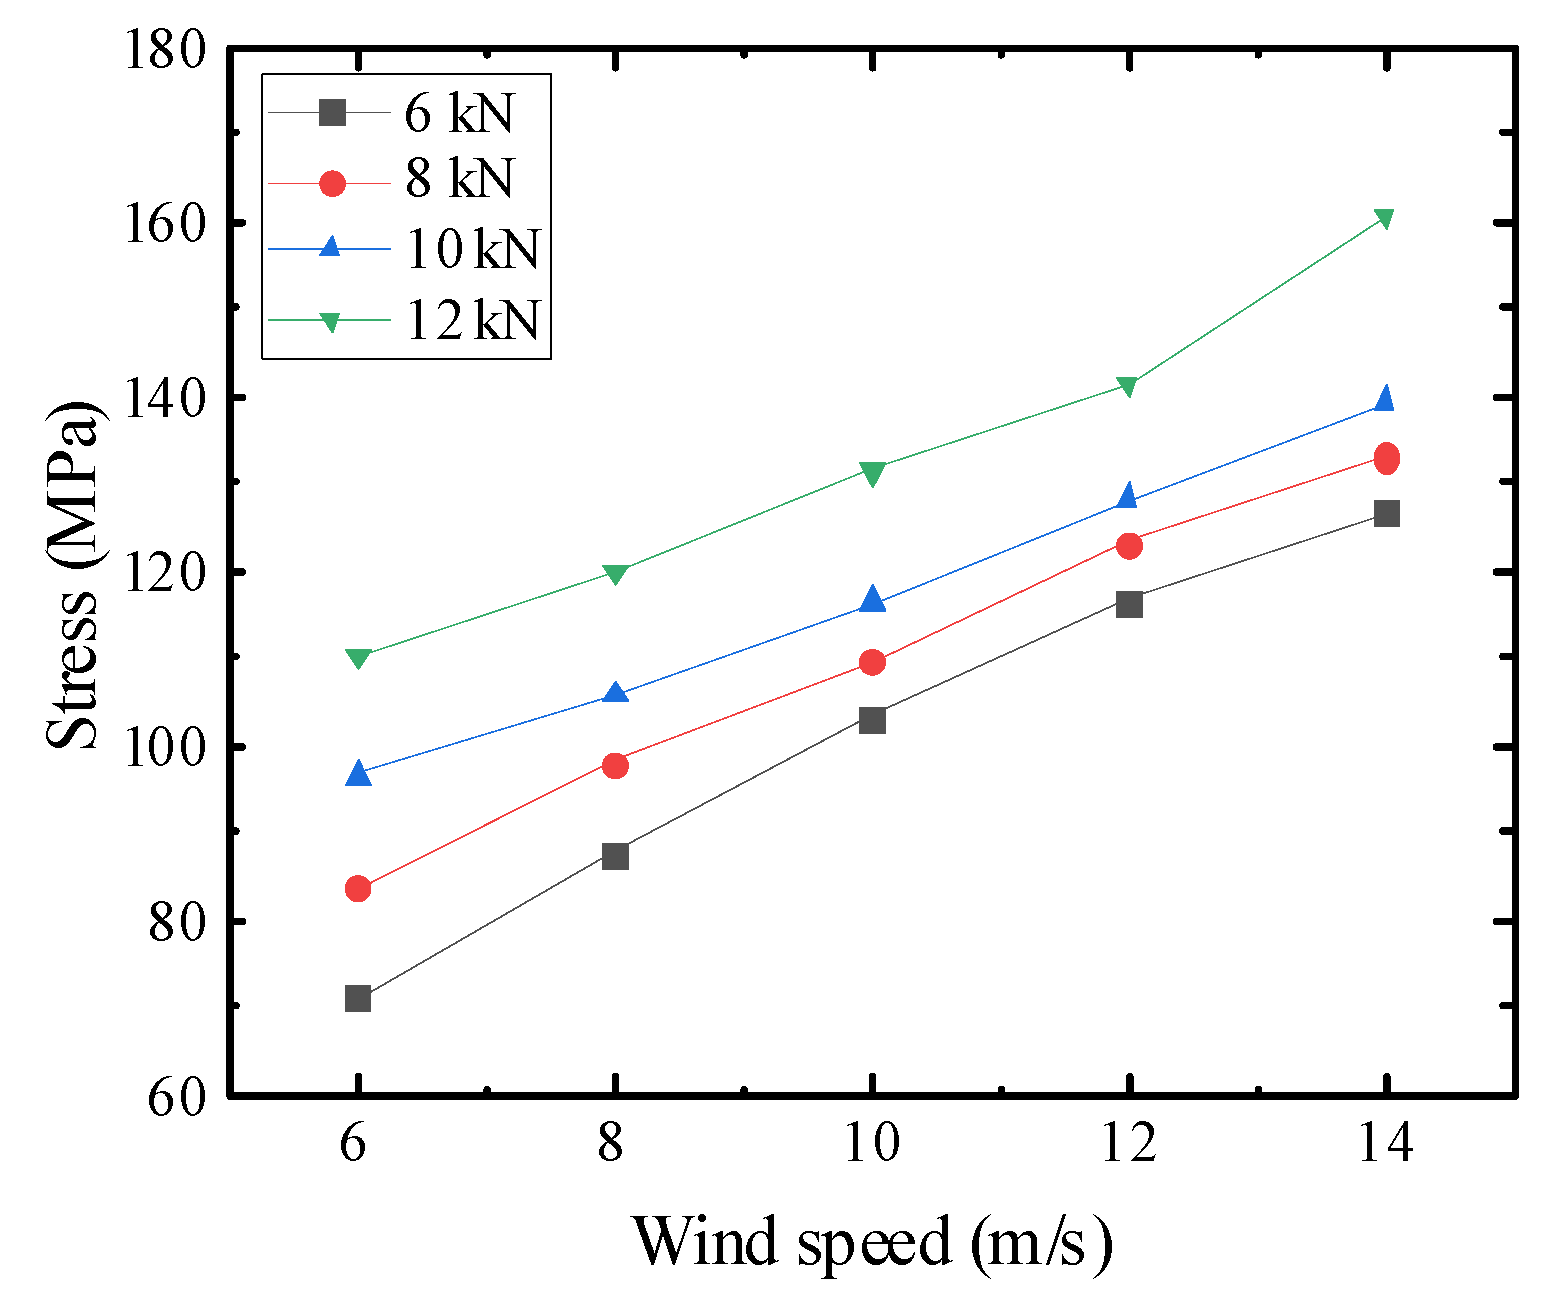
Figure 16.
Comparison of the stress at the end of the sealing net with the pretension curve at different wind angles and bearing cable tensions.
According to Figure 15 and Figure 16, the wind deflection of the sealing net increases in both the horizontal and vertical directions with higher pretensioning of the bearing ropes and wind speed. Additionally, there is a noticeable increase in end stresses, indicating that the pretension of the bearing cables and wind speed significantly affect the wind deflection and stress magnitude of the sealing net. When the pretension of the load-bearing cables increases, the wind deflection displacements of the sealing net structure decrease in both the horizontal and vertical directions. Conversely, an increase in the basic wind speed leads to an increase in the wind deflection displacements of the sealing net structure in both the horizontal and vertical directions. By considering wind speed as a variable, the wind deflection displacement and stress of the sealing net exhibit an approximately linear relationship with the wind speed. The maximum wind deflection displacement and stress occur when the basic wind speed is 14 m/s. Similarly, the maximum wind deflection displacement and stress occur when the pretension of the bearing cables is 14 m/s. When the pretension of the bearing cable is 12 kN, the stress at the end is 131.2% of that when the pretension of the bearing cable is 6 kN. Despite the increase in stress at the end of the sealing net bearing cable, it remains within the safe range.
However, when the wind speed is below 10 m/s (the permissible wind speed for overhead line construction and installation), the horizontal wind displacement of the sealing net exceeds half the width of the sealing net device (4 m). In the event of the breaking of a newly built conductor, the broken line may still deviate from the protective net, rendering it ineffective. Moreover, if the vertical wind deflection displacement of the sealing net exceeds the clearance distance between the sealing device and the crossed line (3.6 m), the sealing device may intrude into the line below, causing damage and severe consequences. Despite the possibility of reducing the horizontal and vertical wind displacements of the sealing net by increasing the pretension of the bearing cables, they still exceed the theoretical allowable values. Therefore, it is imperative to implement measures to restrict the wind displacement of the sealing net structure in all directions.
4. Wind Deflection Control of the Sealing Net Structure with Additional Control Cables
The above analysis demonstrates that the traditional grid sealing structure is susceptible to significant wind deflection when subjected to wind loads, rendering it ineffective and leading to severe consequences. Previous studies have shown that attaching a wind deflection control cable (referred to as a cable) to the sealing net can effectively suppress wind deflection in all directions [32,33,34]. However, these studies only focused on the cable’s ability to control wind deflection and downward wind deflection without examining the cable arrangement or the angle between the cable and the ground. Therefore, building upon this knowledge, this study investigates the impact of the cable on the wind vibration response of the sealing net by considering the angle between the cable and the ground as a variable. A comparative analysis is conducted at different wind speeds and wind direction angles, aiming to comprehensively assess the influence of the cable on the wind deflection of this type of structure. The findings of this study will provide valuable theoretical insights for effectively controlling wind deflection in such structures.
4.1. Basic Parameters and Arrangement of the Wind Deflection Control Cable
There are many methods to inhibit the displacement of wind deflection across a sealing net. From the previous study, it can be concluded that the displacement of wind deflection in the sealing net can be inhibited by reducing the pitch of the sealing net and increasing the pretension of the bearing cables. However, the inhibition effect is extremely limited, and it does not satisfy the safety requirements of actual construction. The wind deflection of the sealing net can be effectively suppressed by attaching tension cables to the bearing cables of the sealing net structure. The tension cables are set at the four corners of the insulated net, as shown in Figure 17 and Figure 18. The tie ropes are connected to the bearing cables at one end and anchored to the ground by ground anchors at the other end.

Figure 17.
Front view of the structure of the spanning sealing net and its wind deflection control measures.
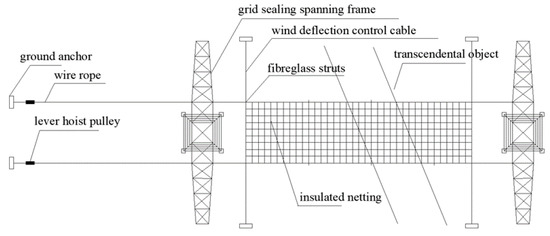
Figure 18.
Top view of the structure of the spanning sealing net and its wind deflection control measures.
4.2. Comparison of Modal Analysis of Sealing Grids with Additional Wind Bias Control Ties
In this study, the dynamic characteristics of the additional cable closure structure were analyzed using ANSYS software. The goal was to determine the intrinsic frequency and vibration pattern of the structure and compare it with the closure structure without cables. This analysis serves as a foundation for the subsequent dynamic analysis.
4.2.1. Finite Element Modeling of the Sealing Mesh
The model is at a height of 30 m with a stall distance of 200 m. On the basis of the finite element model without additional tension ropes, the tension ropes are set at the four corners of the insulated net, with a load-bearing rope attached at one end at each corner and the other end anchored to the ground by ground anchors. The tie ropes are created by choosing the insulating material, Dyneema rope, as stated in the previous section. The model has a total of 2221 nodes and 3816 units, and the finite element model is shown in Figure 19.
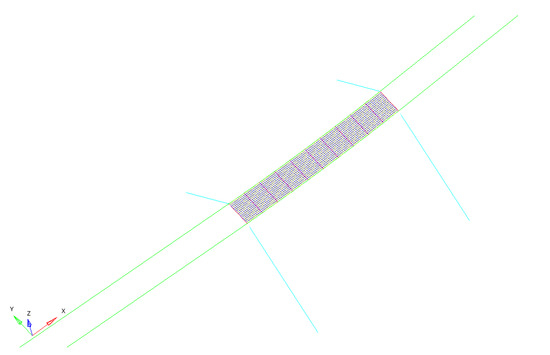
Figure 19.
Finite element modeling of additional tie seal grids.
4.2.2. Modal Analysis and Comparison
The self-oscillation characteristics of the sealing net will change when attaching a tension cable to the sealing net structure. The finite element software ANASYS is used to analyze the self-oscillation characteristics of the sealing net structure with additional cables to grasp its self-oscillation frequency and vibration pattern. Table 9 shows a comparison of the vibration frequency between the whole net sealing structure with additional cables and the net sealing structure without additional cables. The vibration pattern of the part of the net sealing structure after the additional cable is installed is shown in Figure 20.
Table 9.
Comparison of the self-resonance frequency between the whole structure with and without additional cable closure.
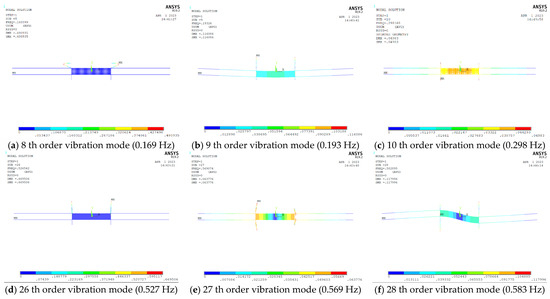
Figure 20.
Partial vibration pattern of the structure of the sealing net after the additional tension cable. (Note: The default value of the numbers before the decimal point is 0 in Figure 20.).
The analysis of the sealing net structure with additional ties reveals that the structure exhibits low-frequency and mode-intensive dynamic characteristics when considering the first 50 modes. The vibration of the ties is primarily influenced by the vibration of the closure structure in the low-frequency range. The first to eighth modes correspond to cable vibrations, while the ninth, tenth, twenty-seventh, and twenty-eighth modes represent the overall vibration modes of the closure structure with the attached cable. Specifically, the ninth, tenth, and twenty-seventh modes correspond to longitudinal bending vibrations, while the twenty-eighth modes correspond to transverse bending vibrations.
In the comparison of the self-oscillation frequency of the additional cable closure structure with that of the unattached cable closure structure, a noticeable difference of up to 8.9% is observed. This indicates that the mass matrix and stiffness matrix of the model for the additional cable closure structure have undergone changes, resulting in an increased self-oscillation frequency. Consequently, the additional wind bias control cable exhibits a certain suppressive effect on the vibration of the closure network.
4.3. Effect of Additional Control Cables on the Wind-Induced Response of the Sealing Network
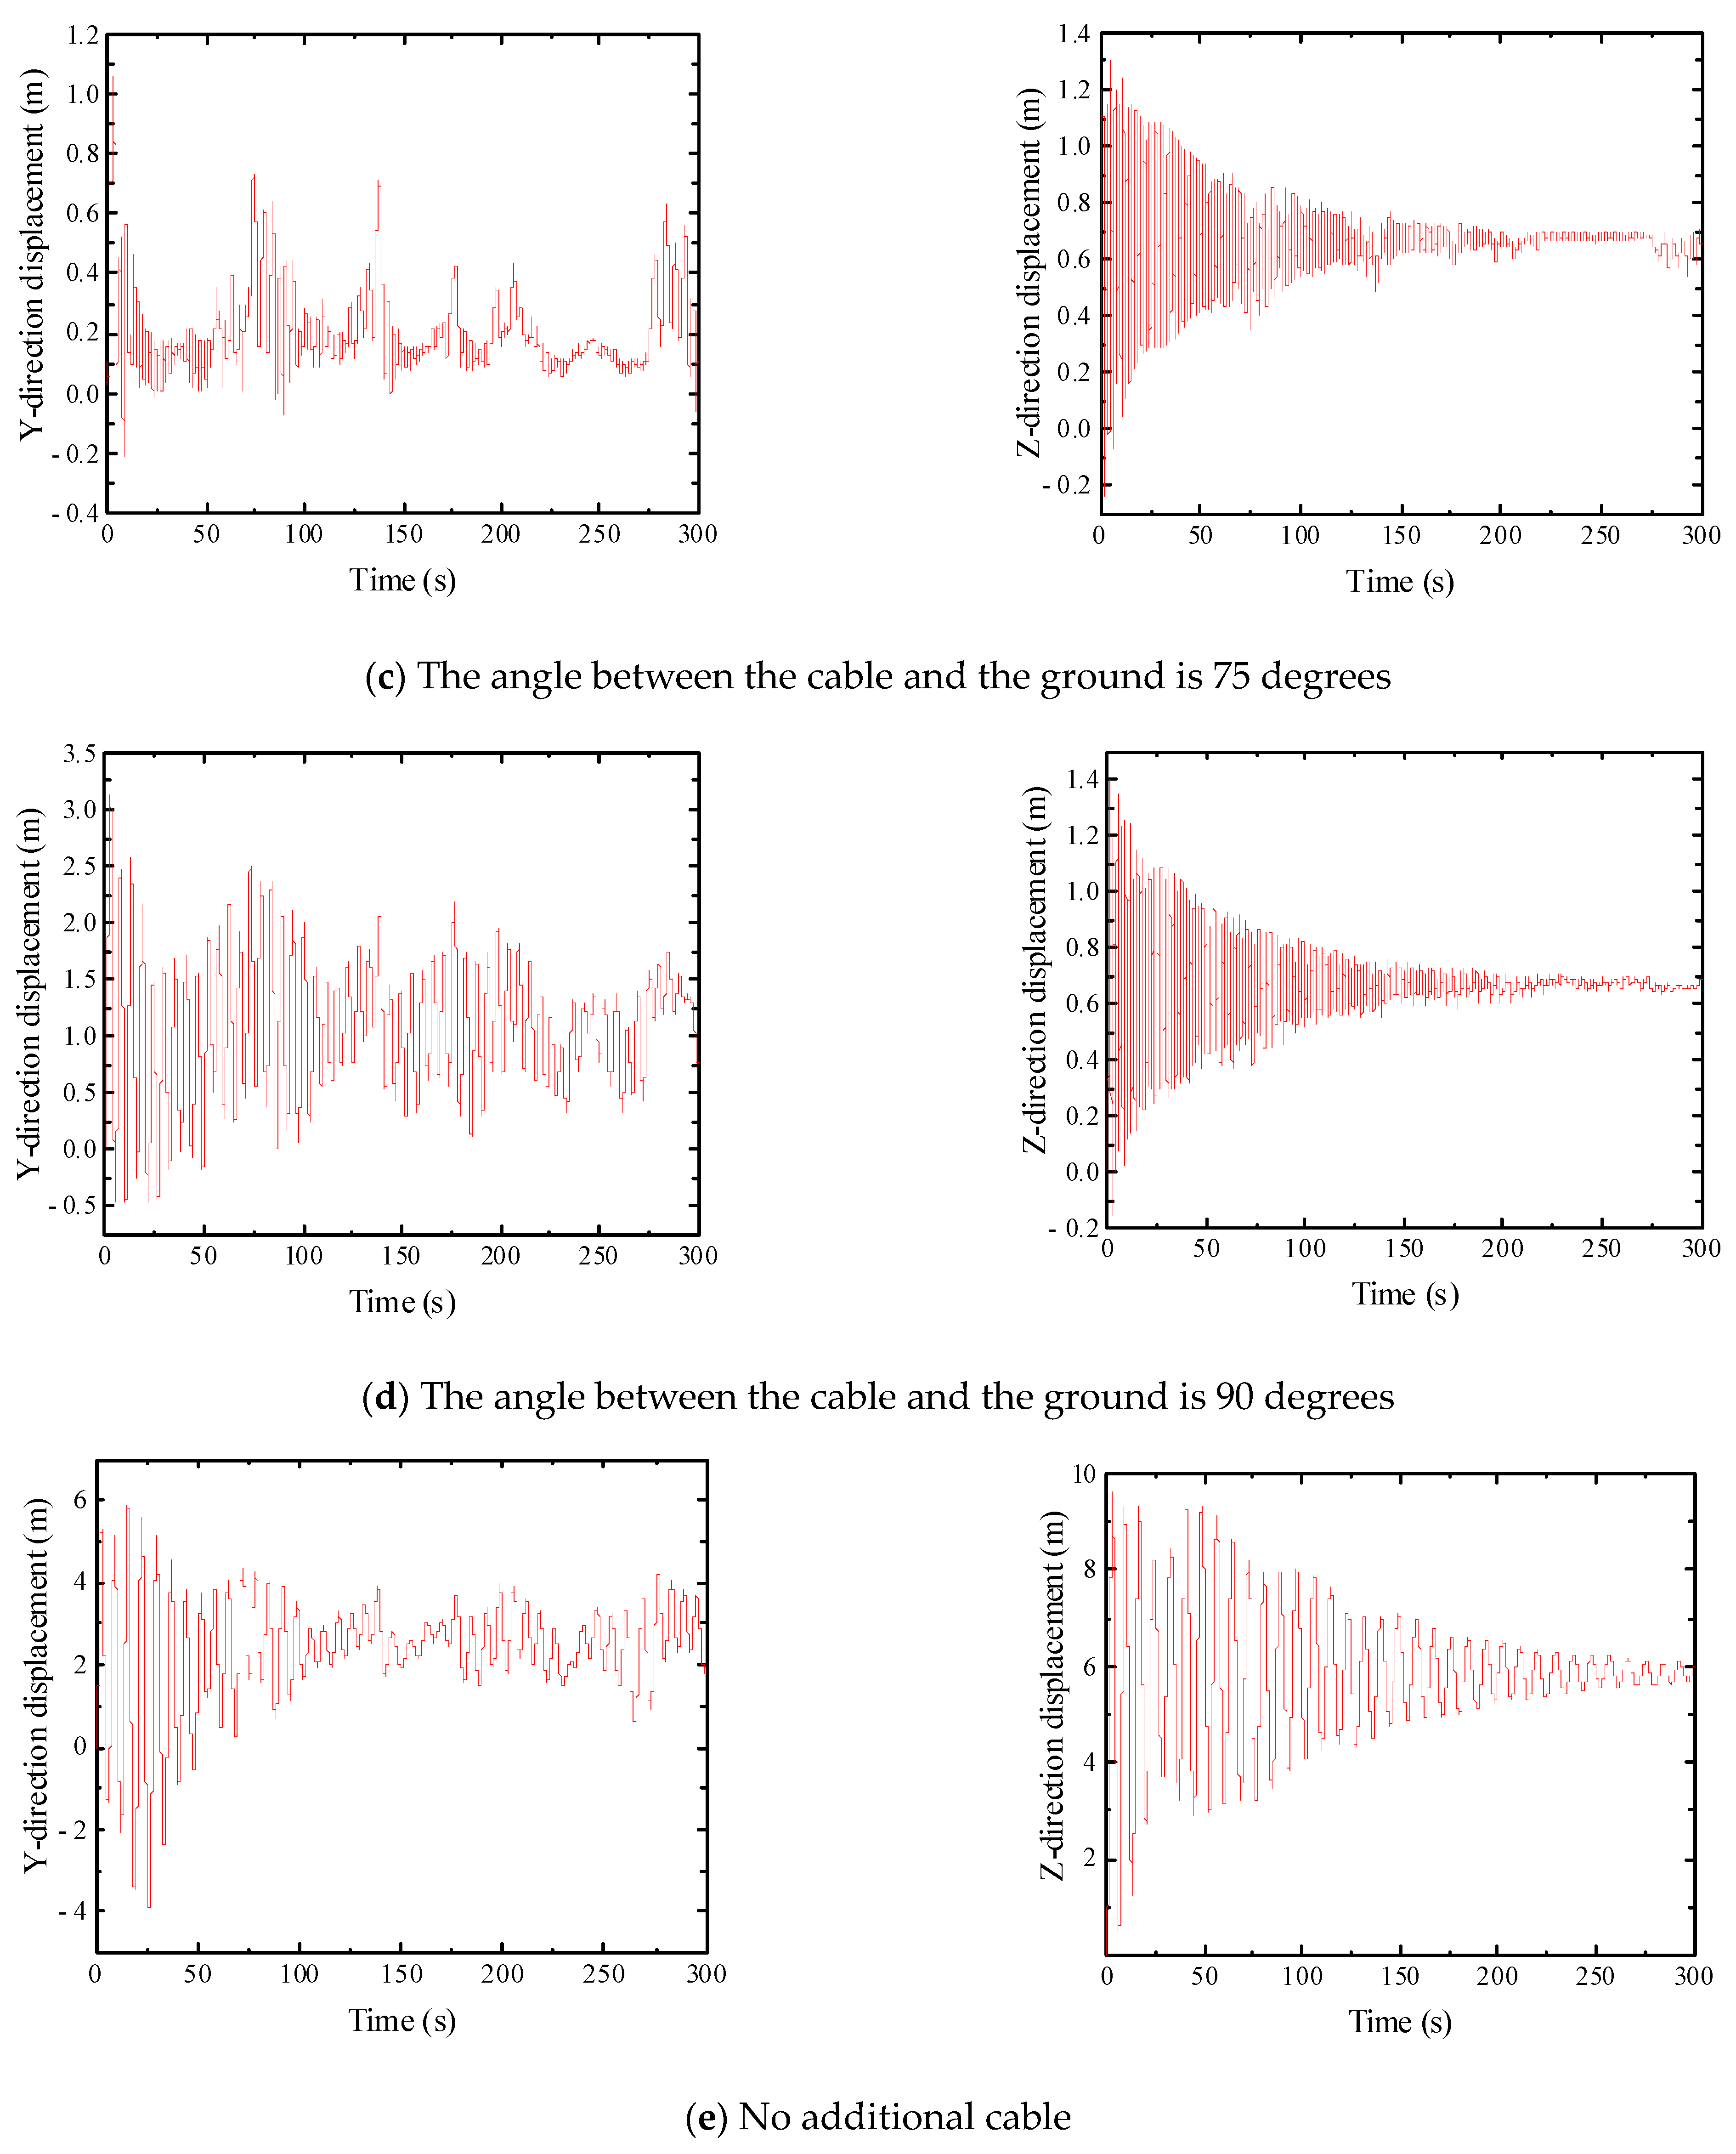
During the construction of the closure network, it is crucial to address wind deflection and control the extent of tie rope occupation. This study examines four different working conditions by selecting tie ropes inclined at angles of 45 degrees, 60 degrees, 75 degrees, and 90 degrees with respect to the ground. To assess the wind-induced vibration response of the closure structure at varying wind speeds, the analysis considers basic wind speeds of 6 m/s, 8 m/s, 10 m/s, 12 m/s, and 14 m/s. The most unfavorable wind angle for the closure network structure is determined to be 90 degrees; hence, it is chosen for the calculations. Due to the numerous working conditions, only the displacement—time diagram of the closure network structure is provided for a distance of 200 m, with a pretension of 12 kN for the bearing cables and a basic wind speed of 10 m/s. This diagram is then compared to the displacement time history diagram of the sealing net structure without additional cables, as depicted in Figure 21.
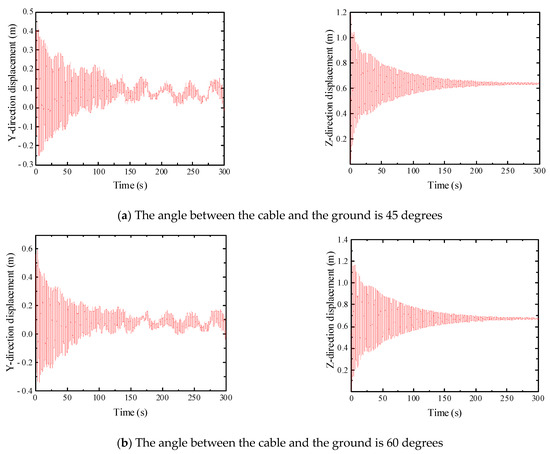
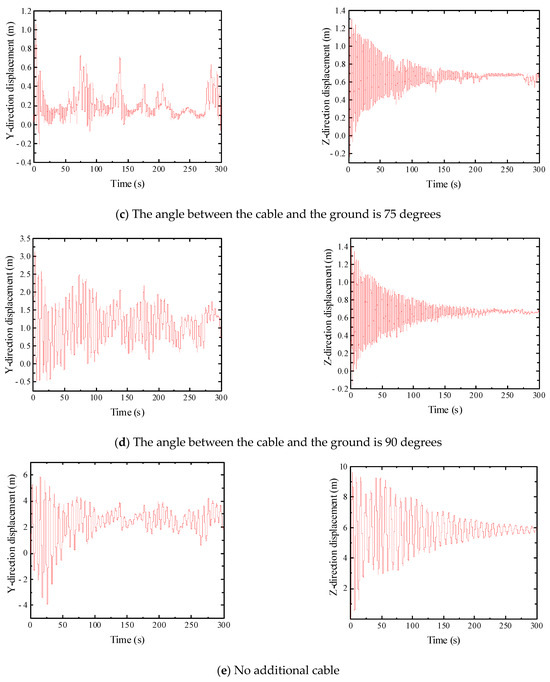
Figure 21.
Time history of mid-span displacements at different angles between the cable and the ground for a basic wind speed of 10 m/s.
As shown in Figure 21, at the basic wind speed of 10 m/s, the wind deflection of the sealing net is reduced substantially when the sealing net is attached to the wind deflection control cable. Among them, the fluctuation amplitude of the sealing net in the horizontal direction decreases gradually and vibrates randomly within a certain range; the fluctuation amplitude in the vertical direction tends to a certain value. The maximum and average values of the midspan displacements of the sealing net were obtained by organizing the calculated data, as shown in Table 10.
Table 10.
Span-to-span displacements of sealing nets with different tie-rope and ground angles for a basic wind speed of 10 m/s.
Table 10 provides a conclusive analysis of the impact of attaching the sealing net to the pulling cable on controlling wind deflection. This reveals that the cable’s influence on wind deflection gradually diminishes as the angle between the cable and the ground increases from 45 to 75 degrees in the horizontal direction while remaining consistent in the vertical direction. However, when the angle between the cable and the ground is 90 degrees, the cable’s inhibitory effect on horizontal wind deflection significantly decreases compared to the inclined cable, while its effect on vertical wind deflection remains unchanged. In terms of specific values, when the angle between the cable and the ground is 45 degrees, the maximum spanwise displacement of the sealing net in the horizontal direction is 0.485 m, representing a decrease of 91.8%, and 1.170 m in the vertical direction, reflecting a decrease of 87.9%. Similarly, for an angle of 60 degrees, the maximum spanwise displacement is 0.629 m in the horizontal direction, reduced by 89.4%, and 1.182 m in the vertical direction, reduced by 87.7%. The average spanwise displacement of the sealing net follows a similar trend to the maximum displacement.
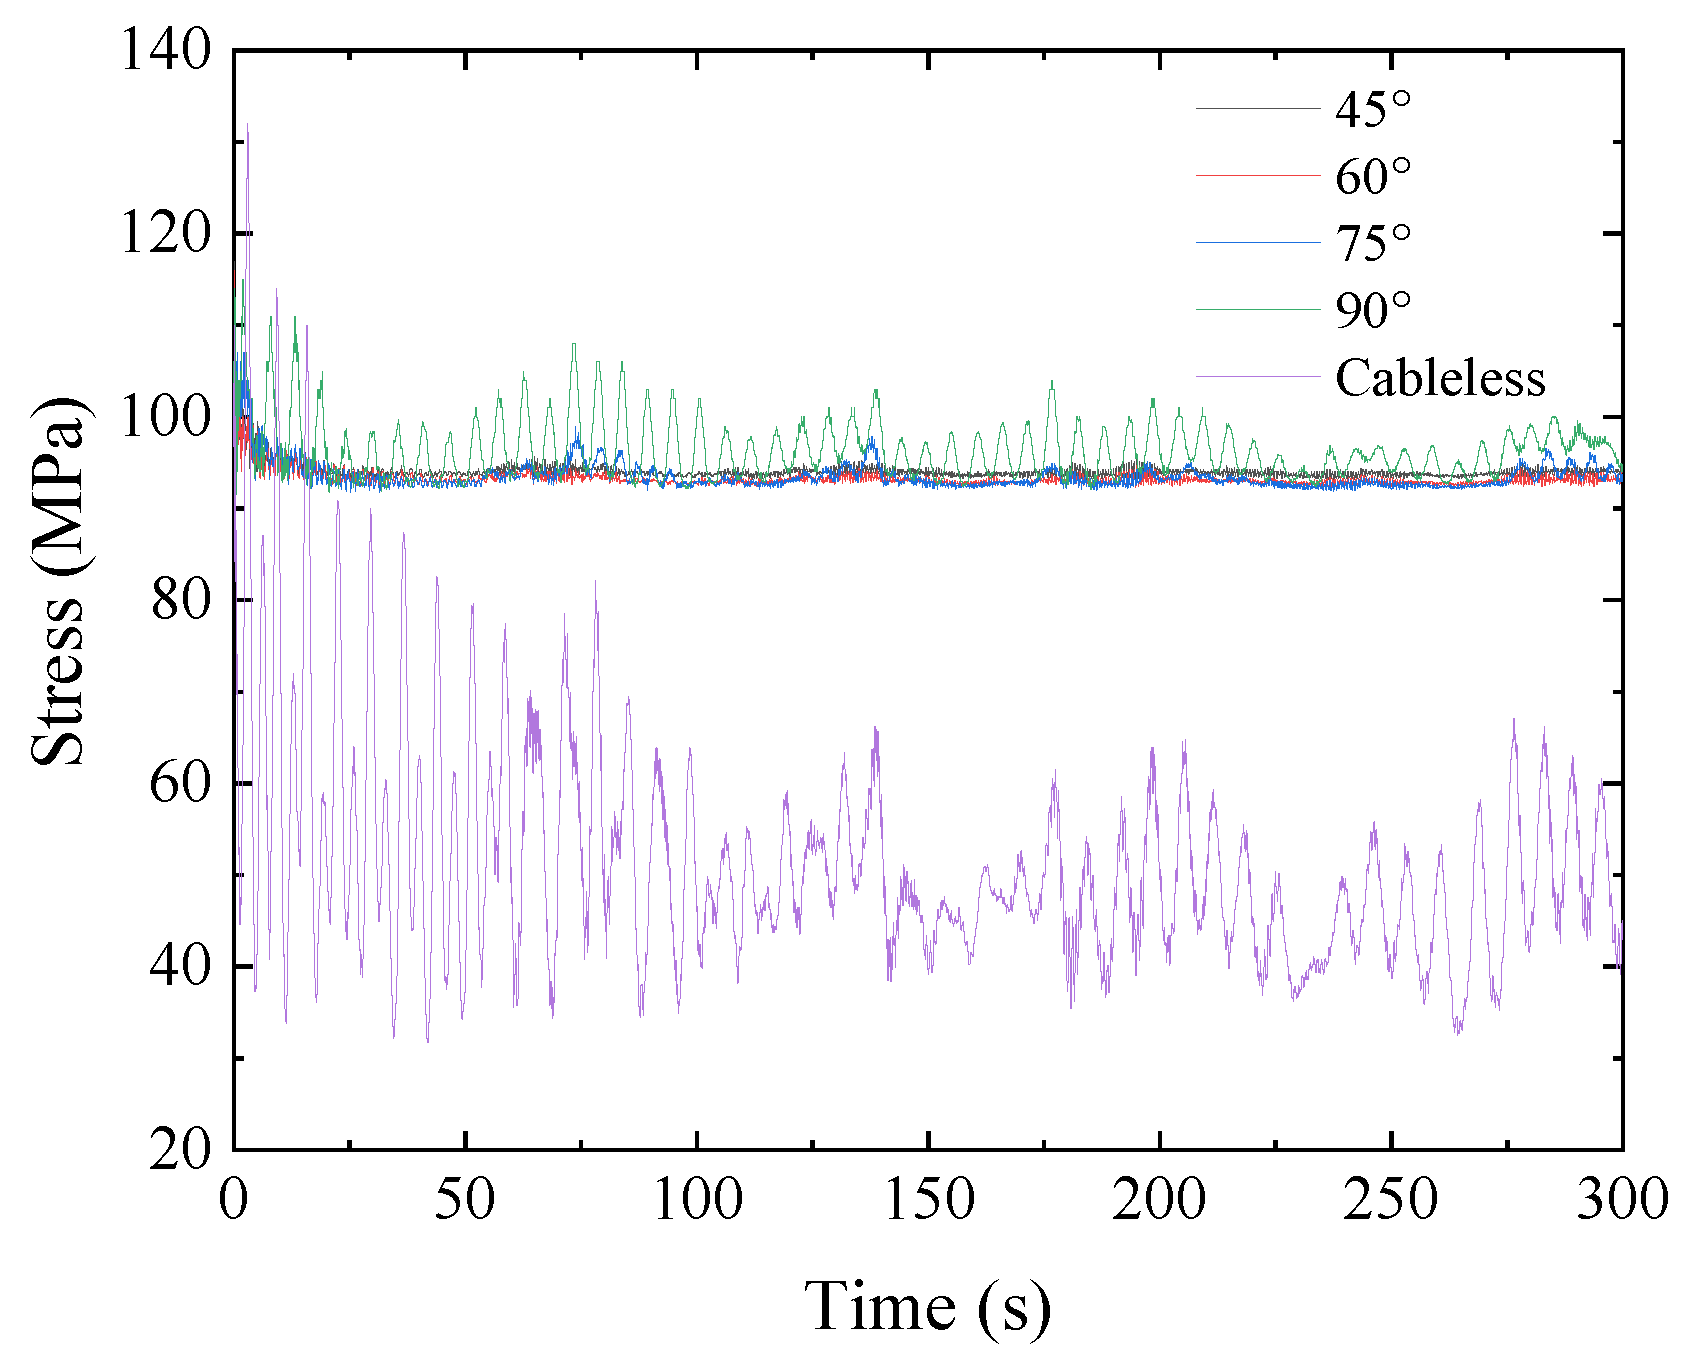
To provide a more descriptive representation of the stress trend at the end of the sealing net as the angle between the pulling cable and the ground changes, a time history graph is presented in Figure 22. It depicts the stress at the end of the load-bearing cable for the respective sealing net structure. This graph allows for a visual examination of the stress variations resulting from the attachment of the pulling cable.
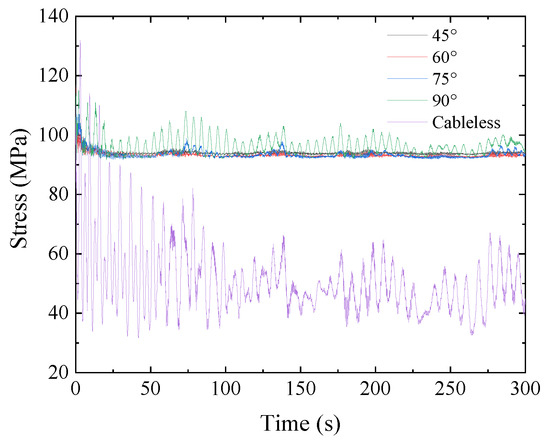
Figure 22.
Time history of stress at different angles between the cable and the ground for a basic wind speed of 10 m/s.
Based on Figure 22, it can be inferred that the maximum stress occurs at the end of the bearing cable during the initial loading stage. An analysis of the stress response at the end of the bearing cable, considering the sealing net with additional ties, reveals that the stress values at the cable’s end do not vary significantly but are consistently higher compared to when the net is sealed without ties. With the additional tie ropes in place, the peak stress value reaches approximately 117 MPa, resulting in a safety factor of 10.7. Consequently, the stress experienced by the bearing ropes falls within the safe range.
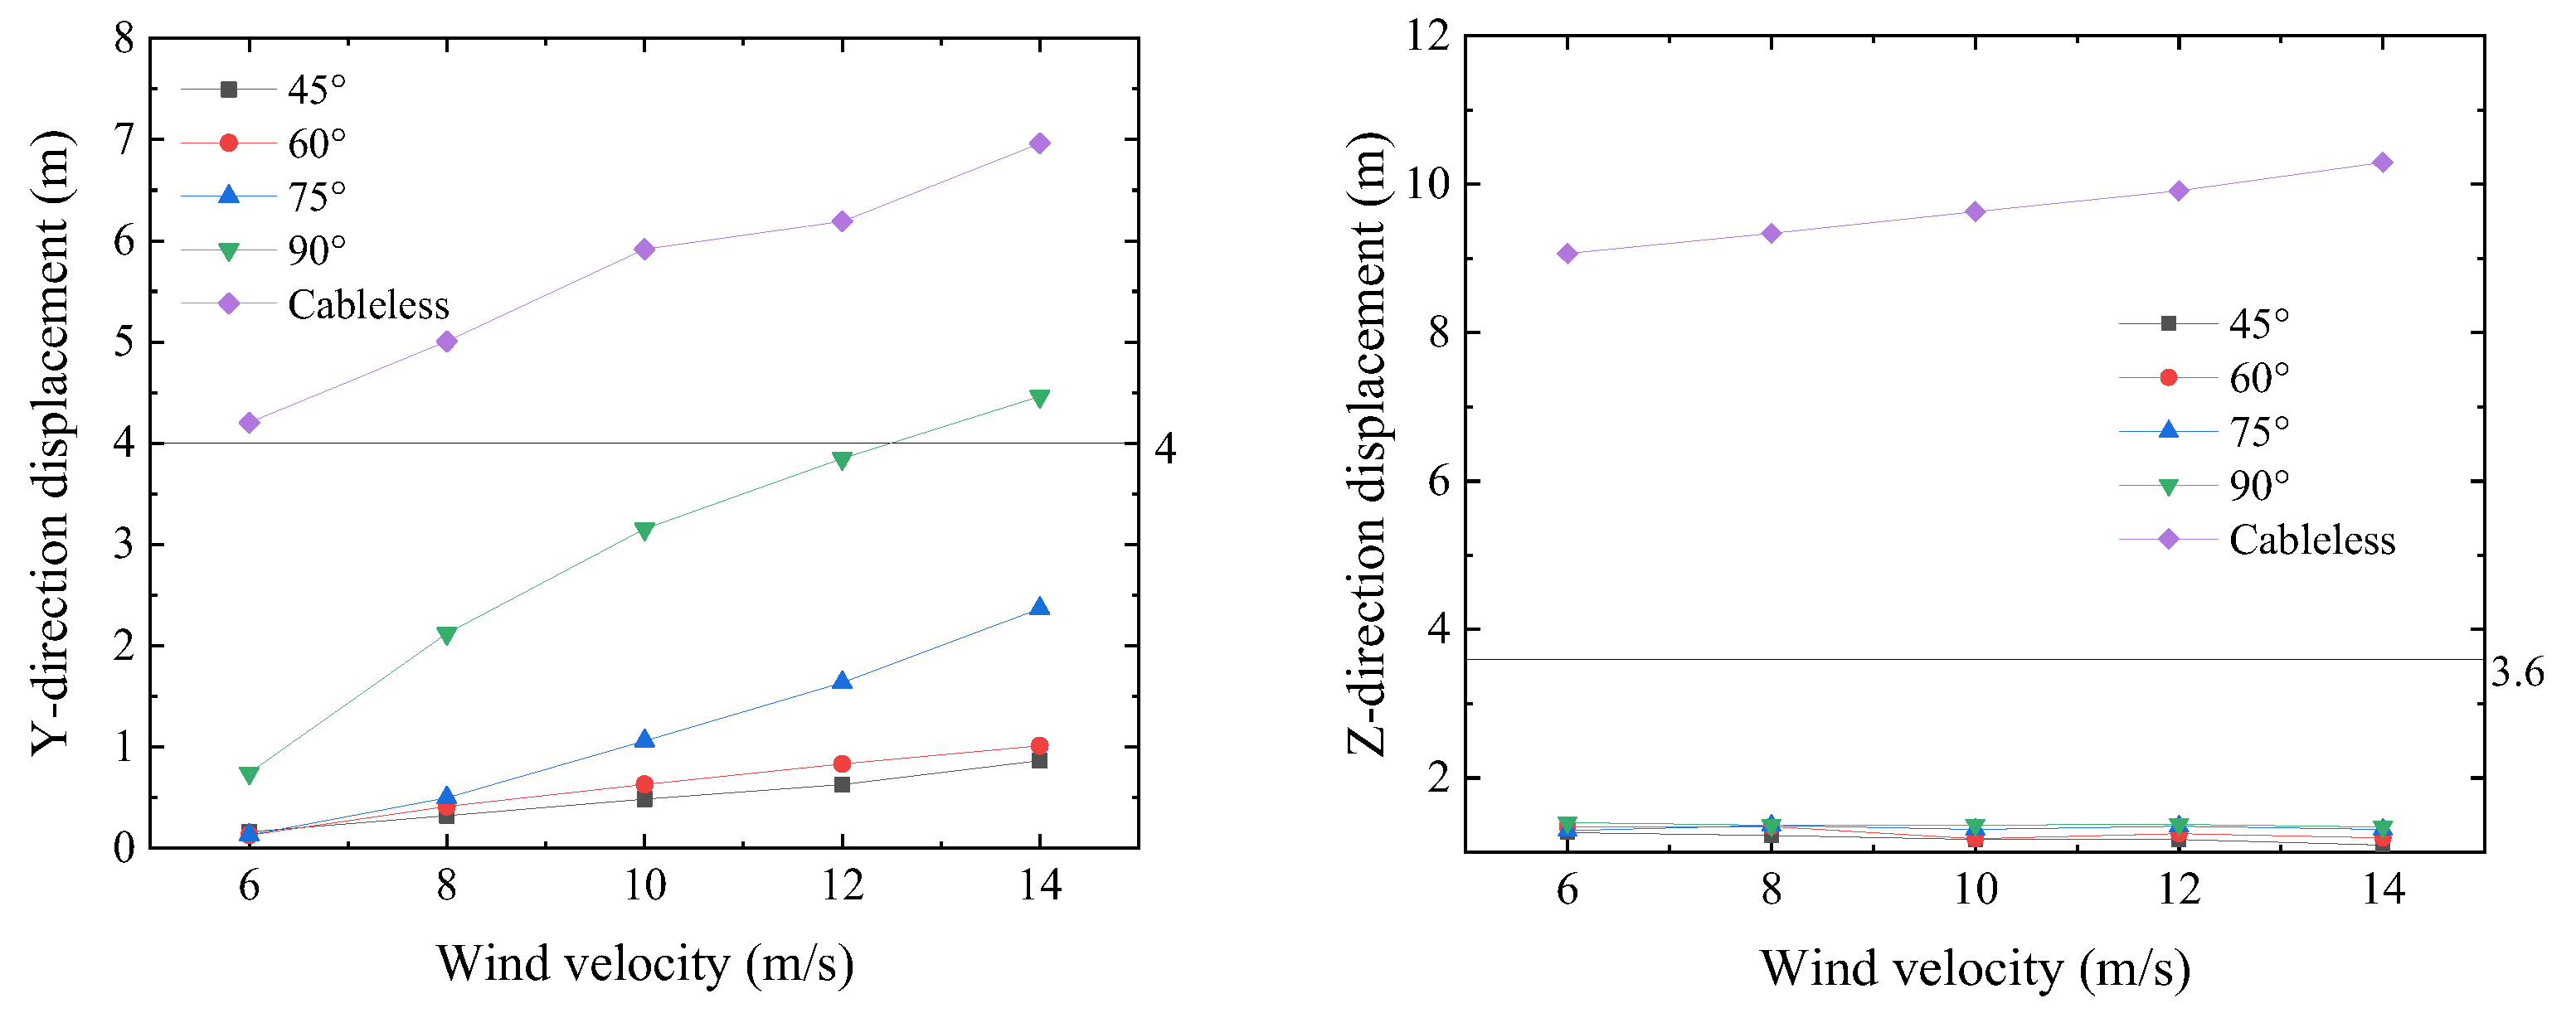
To summarize, at a wind angle of 90 degrees, a comparison of the wind deflection displacement in the span of the sealing net structure with the angle of the tension cable under different wind speeds was performed, as shown in Figure 23. A comparison of the stress at the end of the sealing net structure with the angle of the tension cable is shown in Figure 24.
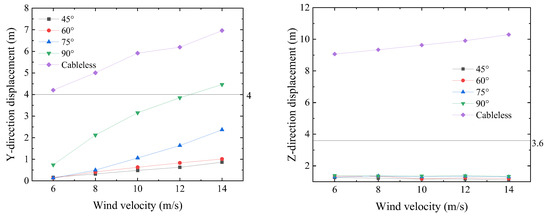
Figure 23.
Comparison of mid-span wind deflection displacements of the sealing net structure with the curves in relation to the angle of the tie ropes.
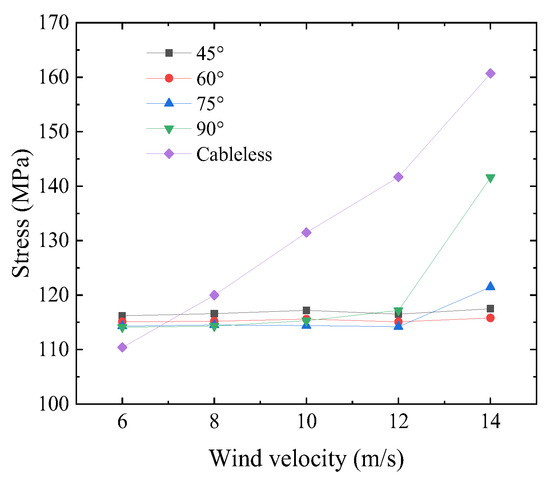
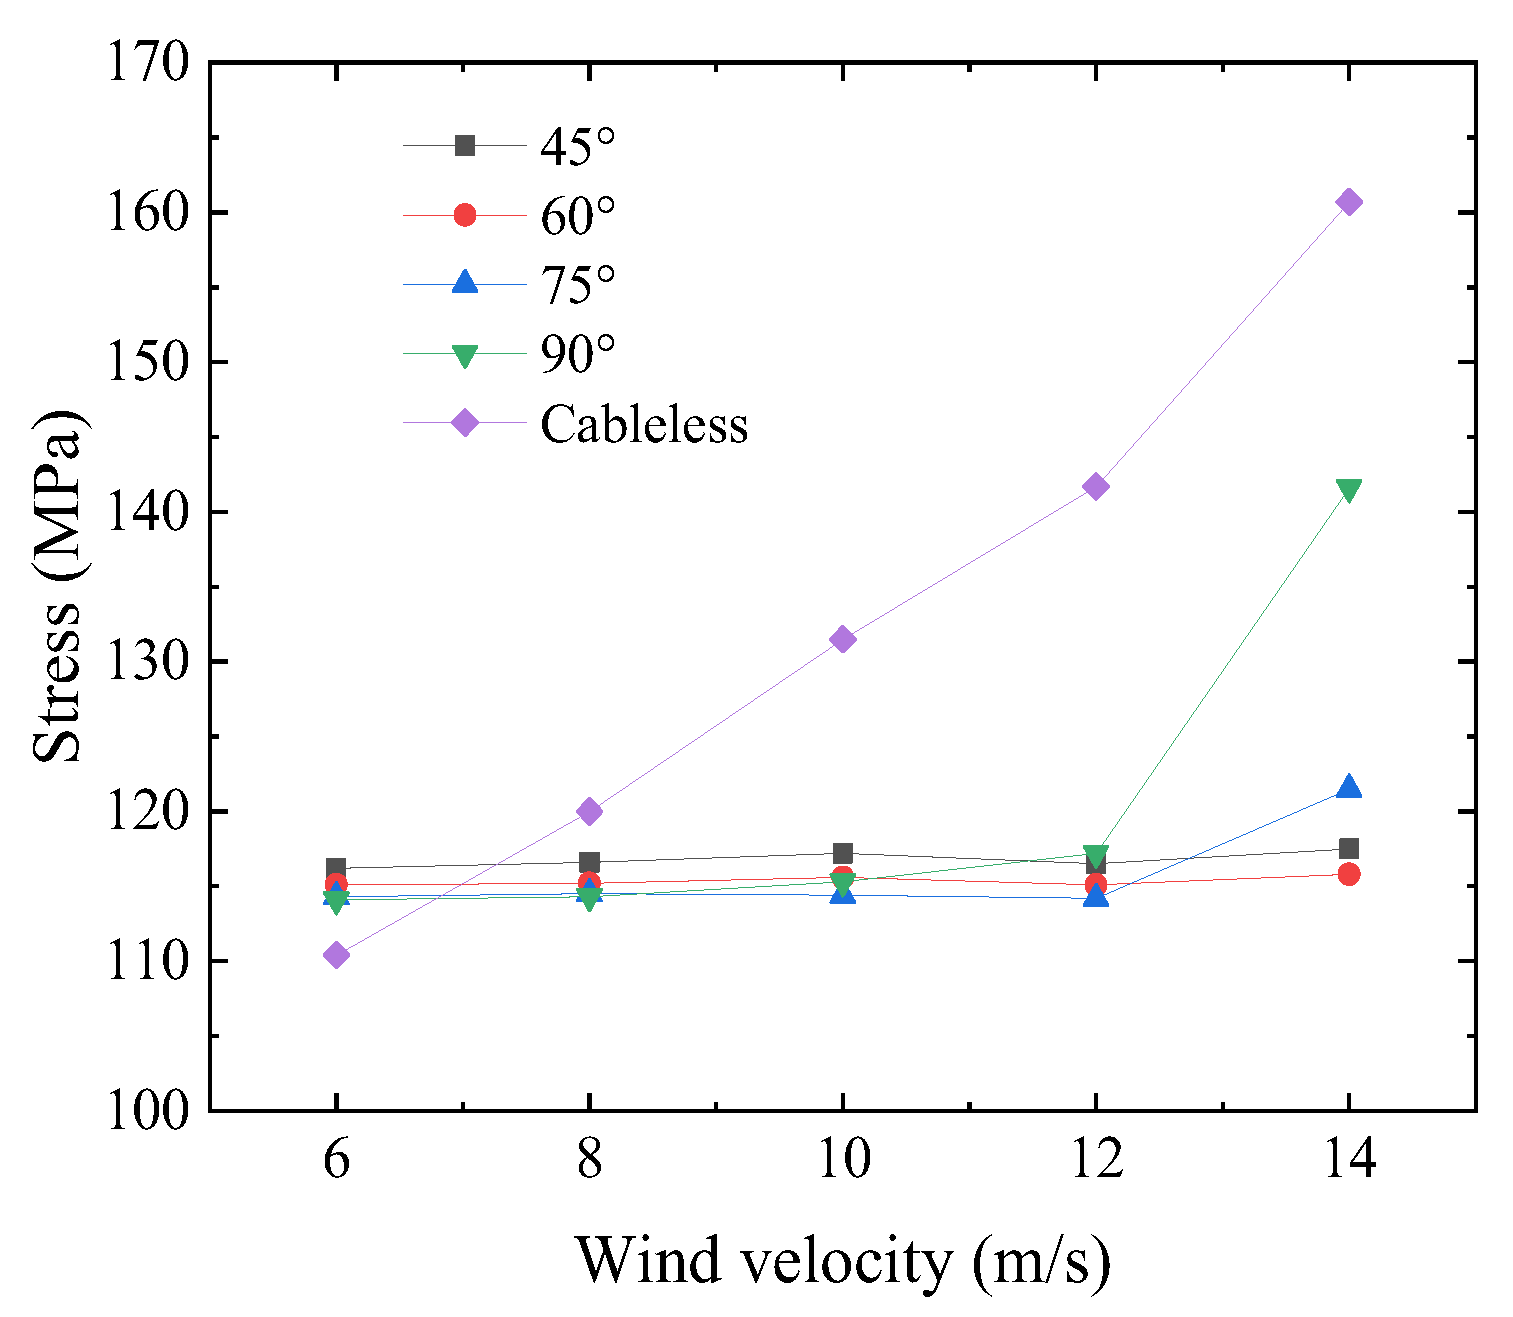
Figure 24.
Comparison of end stress versus tie angle curves of the sealing mesh structure.
According to Figure 23 and Figure 24, the wind speed range of 6–14 m/s significantly impacts the wind deflection control of the sealing net when attached to a zipper. The control effectiveness of horizontal wind displacement increases as the angle between the cable and the ground decreases. For instance, at a 45-degree angle, the wind displacement of the sealing net with an additional zip wire is only 8.7% compared to that without a zip wire. Similarly, in terms of vertical wind displacement, the control effect of the sealing net remains consistent after adding the zip wire, accounting for only 13.5% of the wind displacement without a zip wire. Consequently, the wind deflection displacement of the sealing net is noticeably reduced in all directions. In relation to stress, the stress values of the three types of diagonal cables are essentially equal, whereas the 90-degree vertical cable experiences higher stress. However, the sealing net with the additional cable exhibits lower stress than the sealing net without a cable. Moreover, the bearing cables remain within a safe range. Therefore, the sealing net with the extra diagonal cable meets the safety requirements for construction protection in terms of wind displacement and stress in all directions. Considering the principles of space and material conservation, it is recommended to use a wind deflection control cable inclined at a 60-degree angle with the ground when erecting the sealing net.
5. Conclusions
In this study, ANSYS software was used to establish a finite element model of the sealing net structure. A time history analysis was performed to examine the wind vibration response of the sealing net structure. By controlling the spanning distance of the sealing net and the pretension of the bearing cables, the structure’s response to different wind directions and wind speeds was analyzed. On this basis, the wind deflection control analysis was also conducted, considering the varying angle between the wind deflection control cables and the ground. The key findings are as follows:
- The difference in self-oscillation frequency between the sealing structure with and without the additional wind deflection control cable is noticeable. The presence of the wind deflection control cable increases the overall self-oscillation frequency of the sealing structure. This indicates that the additional wind deflection control cable effectively suppresses the vibration of the sealing structure. As a result, the wind deflection of the sealing net structure can be reduced through structural improvement by incorporating an additional wind deflection control cable.
- The horizontal wind displacement and end stress of the sealing structure are influenced by the wind direction and wind speed. The most critical wind direction is 90 degrees, and the wind displacement and stress increase with increasing wind speed.
- To reduce wind deflection in all directions (horizontal and vertical), measures can be taken to reduce the span and increase the pretension of the load-bearing cable. However, relying solely on these measures may not meet the protective performance needed for construction. Therefore, it is still recommended to adopt additional wind deviation control measures, such as wind deviation control cables, to further reduce wind deviation in all directions. In practical engineering, a control cable with an angle of 60 degrees from the ground for wind deflection control can be suitable.
- It is noted that the following guidelines, according to the above conclusions, can also be used for the design of similar structures to ensure their efficient and reliable performance under wind loads. For example, installing the wind-induced control cable helps reduce wind-induced vibrations. Ensure that the pretension of the load-bearing cables remains within a safe range. Evaluate the impact of reducing the spacing between cables and increasing precipitation on wind-induced displacements. Implement additional wind-induced control measures, such as wind-induced control cable stays, to meet specific construction safety requirements.
Author Contributions
Conceptualization, M.Z. and G.Z.; methodology, M.Z., G.F. and X.Z.; software G.Z.; validation, G.F. and X.Z.; formal analysis, G.F., X.Z. and G.Z.; investigation, G.F. and X.Z.; resources, M.Z. and G.Z.; data curation, G.F.; writing—original draft preparation, M.Z. and G.F.; writing—review and editing, X.Z. and G.Z. All authors have read and agreed to the published version of the manuscript.
Funding
This research was funded by the Natural Science Foundation of Henan (grant no. 222300420549) and the Cultivating Fund Project for Young Teachers of Zhengzhou University (grant no. JC21539028).
Data Availability Statement
Data are contained within this article.
Conflicts of Interest
The authors declare no conflict of interest.
References
- Shu, Y.; Chen, W. Research and application of UHVpower transmission in China. High Volt. 2018, 3, 1–13. [Google Scholar] [CrossRef]
- Shao, T. Discussion and application of construction technology of nonstop crossing of transmission lines. Electr. Eng. 2017, 8, 135–136, 139. [Google Scholar]
- China Electric Power Planning and Design Institute. General Specification for Transmission Line Protection Equipment GB/T 15145-2017; China Planning Press: Beijing, China, 2017; pp. 1–5. [Google Scholar]
- Mu, Y. Simulation Analysis of Transmission Line Breaks Acting on Protective Gear Protection Nets Across Tracks. Master’s Thesis, Southwest Jiaotong University, Chengdu, China, 2021. [Google Scholar]
- Gottardi, G.; Govoni, L. Full-scale modeling of falling rock protection barriers. Rock Mech. Rock Eng. 2010, 43, 261–274. [Google Scholar] [CrossRef]
- Sasiharan, N.; Muhunthan, B.; Badger, T.C.; Shu, S.; Carradine, D.M. Numerical analysis of the performance of wire mesh and cable net rockfall protection systems. Eng. Geol. 2006, 88, 121–132. [Google Scholar] [CrossRef]
- Meng, S.-M.; Shen, W.; Tang, B. Simulation analysis of the collision between the drawn conductor and the sealing net in the construction of charged crossing. J. Three Gorges Univ. (Nat. Sci. Ed.) 2020, 42, 91–95. [Google Scholar]
- Liu, H.; Meng, H.; Li, D.; Yao, J.; Liu, C.; Liu, R.; Shen, H. Design of spanning frame used for bearing network of UHV transmission line. In Proceedings of the 18th International Conference on AC and DC Power Transmission (ACDC 2022), Virtual, 2–3 July 2022; pp. 1446–1452. [Google Scholar]
- Wu, Y.; Sun, Y.; Zheng, Z.; Sun, X. Wind Engineering and Structural Wind Design, 1st ed.; Harbin Institute of Technology Press: Harbin, China, 2014; pp. 22–37. [Google Scholar]
- Abad, M.S.A.; Shooshtari, A.; Esmaeili, V.; Riabi, A.N. Nonlinear analysis of cable structures under general loadings. Finite Elem. Anal. Des. 2013, 73, 11–19. [Google Scholar] [CrossRef]
- Vaezzadeh, A.; Dolatshahi, K.M. Progressive collapse resistance of cable net structures. J. Constr. Steel Res. 2022, 195, 107347. [Google Scholar] [CrossRef]
- Wu, Y.; Zhang, W.; Meng, X.; Su, Y. Nonlinear vibration control of cable net structures with bounded uncertainties. Acta Mech. 2016, 227, 2985–3000. [Google Scholar] [CrossRef]
- Salvatori, L.; Spinelli, P. Effects of structural nonlinearity and along-span wind coherence on suspension bridge aerodynamics: Some numerical simulation results. J. Wind Eng. Ind. Aerod. 2006, 94, 415–430. [Google Scholar] [CrossRef]
- Escallon, J.P.; Boetticher, V.; Wendeler, C.; Chatzi, E.; Bartelt, P. Mechanics of chain-link wire nets with loose connections. Eng. Struct. 2015, 101, 68–87. [Google Scholar] [CrossRef]
- Khalkhaliha, M.; Zarfam, P.; Zarfam, R. Nonlinear structural behavior and vibration control of a double curved cable net under the dynamic excitations. Lat. Am. J. Solids Struct. 2020, 17, e267. [Google Scholar] [CrossRef]
- Lloyd, A.; Barry, P. Performance of Safety Netting Under Low Velocity Impact Loading. In Proceedings of the Canadian Society of Civil Engineering Annual Conference 2021: CSCE21 Structures Track Volume 2. Lecture Notes in Civil Engineering; Springer: Berlin/Heidelberg, Germany, 2022; Volume 244, pp. 421–431. [Google Scholar]
- Bertolo, P.; Oggeri, C.; Peila, D. Full-scale testing of draped nets for rock fall protection. Can. Geotech. J. 2009, 46, 306–317. [Google Scholar] [CrossRef]
- Escallon, J.P.; Wendeler, C.; Chatzi, E.; Bartelt, P. Parameter identification of rockfall protection barrier components through an inverse formulation. Eng. Struct. 2014, 77, 1–16. [Google Scholar] [CrossRef]
- Wang, Y. Wind Tunnel Test Study on the Sealing Network Structure of Power Transmission Project Across High-Speed Railway Line. Master’s Thesis, Shantou University, Shantou, China, 2022. [Google Scholar]
- Li, C.; Liu, C. Simulation of wind velocity fields by resorting to harmonic superposition method based on interpolation technique. J. Vib. Shock 2009, 28, 65–69. [Google Scholar]
- Holmes, J.D.; Bekele, S. Wind Loading of Structures; CRC Press: Boca Raton, FL, USA, 2020; pp. 154–195. [Google Scholar]
- Simiu, E.; Yeo, D. Wind Effects on Structures Modern Structural Design for Wind, 4th ed.; Wiley Blackwell: Hoboken, NJ, USA, 2019; pp. 17–51. [Google Scholar]
- China Electric Power Planning and Design Institute. Technical Specification for the Design of Steel Supporting Structures of Overhead Transmission Line DL/T 5486-2020; China Planning Press: Beijing, China, 2020; pp. 85–87. [Google Scholar]
- China Electricity Council. Construction Technology Quide for Tension Stringing of Overhead Transmission Line When Overcrossing Live Lines without Cross Frame DL/T 5301-2013; China Electric Power Publishing House: Beijing, China, 2014; pp. 7–18. [Google Scholar]
- Zhang, G.; Sun, W.; Wu, Y.; Fu, J.; Yao, Y. Construction technology of overhead power transmission lines across high-speed railway. Power Constr. 2011, 32, 94–97. [Google Scholar]
- Otarawanna, S.; Ngiamsoongnirn, K.; Malatip, A.; Eiamaram, P.; Phongthanapanich, S.; Juntasaro, E.; Kowitwarangkul, P.; Intarakumthornchai, T.; Boonmalert, P.; Bhothikhun, C. An educational software suite for comprehensive learning of computer-aided engineering. Comput. Appl. Eng. Educ. 2020, 28, 1083–1109. [Google Scholar] [CrossRef]
- Yang, Q.; Li, C.M. Ansys cable structure shape finding and simulation of suspended chain lines. Inf. Technol. Civ. Eng. Constr. 2010, 2, 61–65. [Google Scholar]
- Wojcik-Grzaba, I. Extended force density method for cable nets under self-weight. Part II—Examples of application. Arch. Civ. Eng. 2022, 68, 45–61. [Google Scholar]
- Qi, X.; Lingfeng, Z.; Jingsu, C.; Yi, Z. Ansys modeling and dynamic properties analysis of compact and narrow basal transmission tower. Water Resour. Power 2011, 29, 167–168, 186. [Google Scholar]
- Railway Law of the People’s Republic of China. Bulletin of the Standing Committee of the National People’s Congress of the People’s Republic of China; China Railway Publishing House: Beijing, China, 2015; pp. 14–20. [Google Scholar]
- Zhang, Z. Construction process of spanning across live lines without spanning frame spanning system. Technol. Wind. 2011, 20, 156–157. [Google Scholar]
- Tang, J.; Xie, X. Study on vibration serviceability of large-span pedestrian suspension bridge under cross winds. J. Zhejiang Univ. (Eng. Ed.) 2021, 55, 1903–1911. [Google Scholar]
- Wang, D.; Wang, J.; Xia, Z.; Zhang, X.; Wang, J.; Wang, J. Development of insulation masking device for fixing phase leads and cross-arms at the edge of tension rod in distribution network. Power Energy 2023, 44, 29–32. [Google Scholar]
- Nitesh, K.; Shetty, K.K.; Sheoy, P. Influence of cable profiles on the performance of cable stayed bridge. Int. J. Civ. Eng. Technol. 2018, 9, 1136–1142. [Google Scholar]


Disclaimer/Publisher’s Note: The statements, opinions and data contained in all publications are solely those of the individual author(s) and contributor(s) and not of MDPI and/or the editor(s). MDPI and/or the editor(s) disclaim responsibility for any injury to people or property resulting from any ideas, methods, instructions or products referred to in the content. |
© 2023 by the authors. Licensee MDPI, Basel, Switzerland. This article is an open access article distributed under the terms and conditions of the Creative Commons Attribution (CC BY) license (https://creativecommons.org/licenses/by/4.0/).