Article

Optimisation Investigation and Bond-Slip Behaviour of High Strength PVA-Engineered Geopolymer Composite (EGC) Cured in Ambient Temperatures

by
Vishal Avinash Ramesh
1,
Ehsan Nikbakht Jarghouyeh
1,*,
Ahmed Saleh Alraeeini
1 and
Amin Al-Fakih
2
1
Civil Engineering Department, Universiti Teknologi PETRONAS, Seri Iskandar 32610, Perak, Malaysia
2
Department of Civil and Environmental Engineering, King Fahd University of Petroleum and Minerals, Dhahran 31261, Saudi Arabia
*
Author to whom correspondence should be addressed.
Buildings 2023, 13(12), 3020; https://doi.org/10.3390/buildings13123020
Submission received: 29 September 2023 / Revised: 2 November 2023 / Accepted: 6 November 2023 / Published: 4 December 2023
(This article belongs to the Section Building Structures)

Abstract

:
Engineered geopolymer composite (EGC) is becoming an uprising product in the civil industry as a substitute and solution for conventional geopolymer concrete (GPC) as GPC exhibits brittleness and has poor cracking resistance. In this paper, we explored high strength engineered geopolymer composite (EGC) made of polyvinyl alcohol (PVA) fibre and without coarse aggregate constituents characterised as high-performance geopolymer concrete. Varying alkaline solution to fly ash ratio (AL/FA) was investigated. Bond-slip behaviour and the mechanical properties, including compressive, tensile, and flexural strengths, were studied. PVA-EGC mix designs in this research was optimised using response surface methodology (RSM). Various parameters, including the amount of ground granulated blast slag (GGBS) and silica fume, were included in the parametric and optimisation study. Based on the RSM study, the use of quadratic studies found the responses to be well-fitted. Next, the optimised mix design was utilised for the casting of all the samples for the mechanical and bond-slip tests in this study. The main parameters of bonding behaviour include multiple embedment lengths (7 d, 10 d, 12 d and 15 d) and various sizes of rebar diameter used for pull-out tests. Moreover, the mechanical properties and bond behaviours of EGC were compared with those of conventional geopolymer concrete (GPC). The compressive strength of EGC and GPC at 28 days were designed to be similar for comparison purposes; however, EGC shows higher early compressive strength on day 1 compared to GPC. In addition, results indicate that EGC has superior mechanical properties and bond performance compared to GPC, where EGC is approximately 9 and 150% higher than GPC in terms of flexural and tensile strength, respectively. Pull-out tests showed that EGC samples exhibited higher ductility, as evidenced by the presence of multiple cracks before any exhibited failure in tension and flexure. Ductile failure modes, such as pull-out failure and pull-out splitting failure, are observed in EGC. In contrast, GPC specimens show brittle failure, such as splitting failure.

1. Introduction

Concrete is one of the main building materials utilised within the construction industry, due to its strong characteristics in resisting multiple forces. The main binder utilised in concrete is the Ordinary Portland cement (OPC). While conventional concrete produced with OPC serves as a strong material for structures, its production has a significant impact on the environment. Approximately 3 billion tonnes of cement are widely mass-produced each year, contributing to 8% of global carbon dioxide emissions [1]. To address these environmental concerns, geopolymer concrete (GPC) is being introduced and implemented as an environmentally friendly alternative. GPC indirectly decreases environmental impact, leads to energy conservation, and maintains the performance [2]. The enhanced durability and compressive strength of GPC make it suitable for use in the construction industry [3]. Fly ash is chosen to be utilised as the main binder or base material in the production of geopolymer, due to its high availability in silica and alumina elements, which highly influences the geopolymerisation process [4,5] and, not only that, fly ash also allows the recovery of waste materials, thus contributing to the principles of circular economy. Several studies have highlighted fly ash-based geopolymer cured at ambient temperature. However, one drawback observed in fly ash-based geopolymer is poor early strength development, mainly due to the delayed geopolymerisation process [6,7]. To overcome this issue, researchers have attempted to enhance the reaction of fly ash by partially adding calcium-containing material to the matrix. The addition of ground granulated blast furnace slag (GGBS), which has a high calcium content, to fly ash in the binary mix has been studied by [4]. While the utilisation of fly ash and GGBS in the GPC matrix has advantages, degradation of GPC quality has been observed over time, such as increased brittleness and the development of cracks, which ultimately affects the service life of GPC [8]. Moreover, the brittle nature and insufficient strength of GPC to withstand applied loads are significant issues that hinder its use as a construction material [3,9]. It is known that the incorporation of fibres in the matrix can control cracking and enhance fracture toughness by reducing brittleness, as fibres act as bridges across cracks [10]. Several researchers have carried out studies on fibre-reinforced geopolymer concrete. However, most of these studies have focused on curing fibre-reinforced geopolymer concrete at elevated temperatures, limiting its application in precast structures [11,12].
Many studies have been carried out on the types and quantities of fibres to be included in GPC in order to achieve optimal matrix strength. Firstly, steel fibres have been investigated, and their addition has shown improvements in the flexural and tensile behaviour of GPC, reducing the development of cracks in brittle materials. However, steel fibres are susceptible to rusting, and their high price also presents a drawback [13]. Another type of fibre used is polypropylene fibre, which possesses favourable properties such as high toughness and chemical stability, and it can be evenly distributed within the geopolymer matrix. Nevertheless, polypropylene fibre has a disadvantage of low elastic modulus and low tensile strength [14]. Furthermore, it has been observed that the addition of polypropylene fibres do not significantly enhance compressive strength but do result in a slight increase in tensile and flexural strength [15]. Polyvinyl alcohol fibres (PVA) have been found to significantly increase the tensile and flexural strength of GPC compared to fibre-free geopolymer concrete. Additionally, according to [16], the incorporation of PVA fibres in GPC leads to improvements in compressive and flexural strength, with the strength increasing as the fibre ratio rises.
Fibre-reinforced geopolymer concrete (FRGC) is a geopolymeric material that incorporates fibres to enhance its properties. FRGC offers improved ductility and is considered a greener alternative when compared to engineered cementitious composites (ECC), since it eliminates the need for cement [17,18]. Additionally, FRGC exhibits greater deflection and elongation capacity, along with good tensile strength, which contributes to its favourable bendability [19,20]. When designing FRGC, it is crucial to consider key structural and mechanical properties, such as the bond between reinforcement and the composite, compressive, tensile, and flexural strength, as these properties directly influence the structural behaviour of FRGC members [21].
In summary, FRGC stands out not only for its environmental safety but also for its impressive qualities, such as bendability, high mechanical strength, and resistance to high temperatures and acid attacks [22]. However, despite the extensive research carried out on FRGC, there is still a research gap where most studies have focused on heat curing with single or binary geopolymer binders, leaving a gap in knowledge [23,24]. Additionally, there is a lack of literature on the bonding performance and factors influencing the bond behaviour of EGC, as most researchers have primarily concentrated on the bond behaviour of GPC. Furthermore, there is a scarcity of published literature on the bonding behaviour of fibre-reinforced geopolymer composite cured at ambient temperatures in a ternary binder mixture.
It is evident that there is limited research on the effect of GGBS on the properties of EGC cured in ambient temperature. Therefore, this study aims to investigate and optimise the impact of GGBS and the alkaline solution to fly ash ratio (AL/FA) as input factors on the mechanical properties of EGC, utilizing the response surface methodology (RSM) method. The optimised parameters obtained from RSM will then be used to assess the suitability and bond behaviour of EGC with PVA fibres in a ternary binder mixture, which includes fly ash, GGBS, and silica fumes in the matrix design. Subsequently, the study analyses the mechanical properties and bonding performance of EGC when compared with the data of conventional GPC with the same compressive strengths. It is important to study and focus on the bonding performance of EGC with rebars, considering the significant differences in matrix formation and chemical reactions, compared to conventional GPC. Hence, the present study is therefore committed to investigate the bonding behaviour between rebar and EGC together with mechanical properties of EGC with the incorporation of PVA fibres and when comparing the values with GPC in ambient temperatures.

2. Experimental

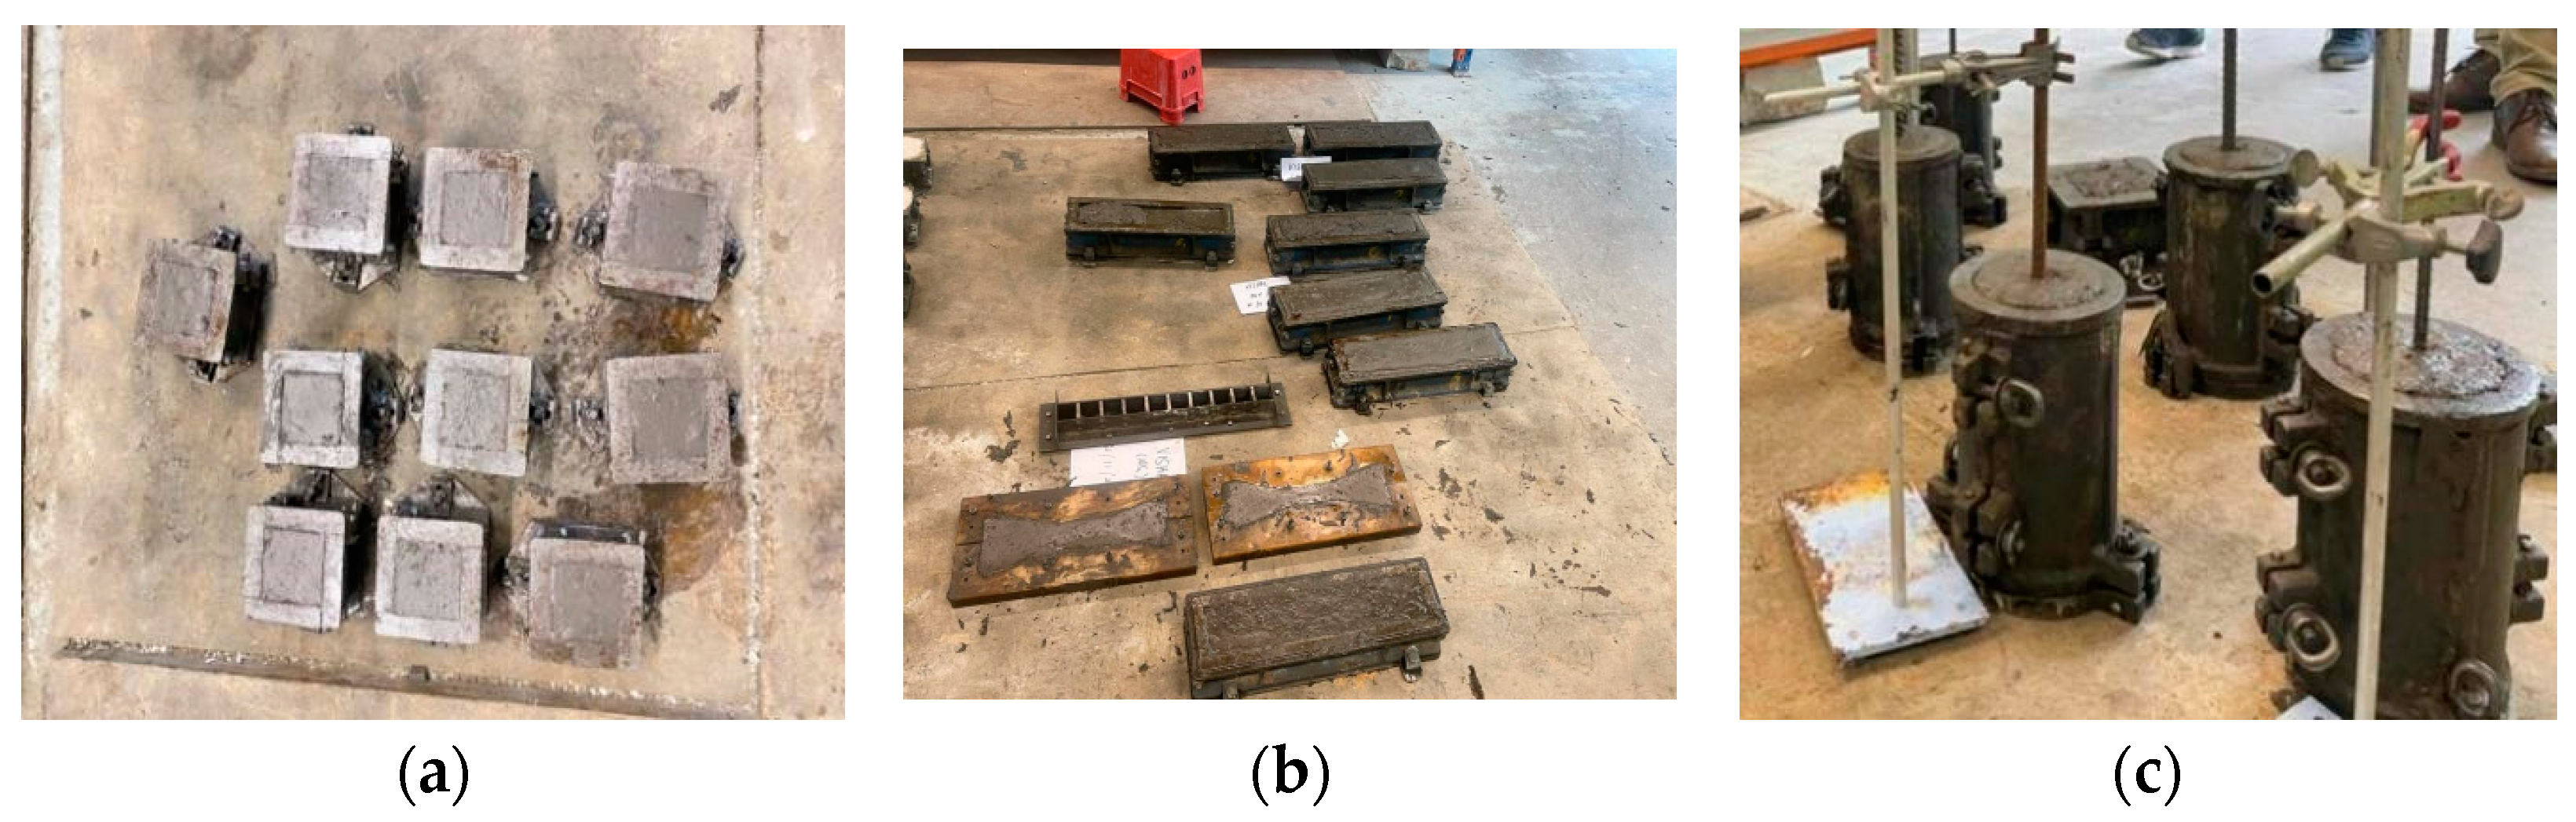
2.1. Materials and Specimen Preparation

In this research, material used as the main component to produce EGC are tabulated in Table 1.
Low-calcium fly ash (Class F) was utilised in this research, following ASTM C618 standards [25]. Class F fly ash was chosen over class C fly ash due to its more consistent mineralogy and chemical composition, providing more stable results. Next, is the GGBS where it is included in the EGC matrix to enhance the strength. A higher content of calcium in GGBS promotes the geopolymerisation process in EGC. The silica fume that is utilised in the EGC matrix has a dark colour due to the presence of iron oxide and silicon. The alkaline activators used to bind the dry ingredients and produce EGC were sodium silicate and sodium hydroxide, with a chemical purity ranging from 95 to 98%. The preparation of sodium hydroxide is depicted in Figure 1, and a constant molarity of 10 M was chosen for this study as a reason to maintain the strength and workability of the EGC mix produced. In order to enhance the early strength and flowability of the mixture, Sika type ViscoCrete-2088 was employed. For reinforcement in the EGC mixture, polyvinyl alcohol (PVA) fibres were used at a volume fraction of 2% in this study. The characteristics of the PVA fibres used in this research can be found in Figure 2 and Table 2.
In this study, deformed rebar was utilised for conducting the pull-out test on the cylinder specimens. T10 rebar with a diameter of 10 mm was used for the embedment length specimens, with cylinder sizes of 100 × 200 mm. Various embedment lengths were employed to analyse the bonding strength, including 70, 100, 120, and 150 mm. Regarding the rebar diameter, 8, 10, and 16 mm diameters were selected with a fixed embedded length of 100 mm. Detailed specifications of the rebar variables can be found in Table 3.
Next, a steel formwork measuring 100 × 100 × 100 mm was used for casting EGC concrete cubes. For the tensile test, dog-bone specimens were employed, while prism beam specimens measuring 100 × 100 × 500 mm were used for the flexural strength test. The pull-out specimens were prepared using a steel formwork in the shape of a cylinder with dimensions of 100 × 200 mm. Figure 3 illustrates the specimens utilised in this study.
Various tests were carried out on EGC samples in this research. Firstly, the flow table test was performed according to ASTM C1437-15 [26]. The fresh EGC mortar was poured into a mould with dimensions of 100 mm at the bottom, 70 mm at the top, and a depth of 50 mm. The mould was then placed on a wet flow table, and, after uplifting the mould, the table was dropped 25 times in 15 s. The spread diameter of the EGC sample was measured to obtain the average flow value (D).
Secondly, compressive strength tests were carried out on 100 × 100 × 100 mm EGC and GPC mixture cubes following BS 1881: Part 116:1983 [27]. The tests were performed at the ages of 1, 3, 7, 14, and 28 days, with three samples tested for each mixture. A compression testing machine was used for the tests, following the specifications of BS 1881-117:1983 [28].
Thirdly, the tensile strength test was carried out using the universal testing machine. Two dog-bone samples were cast and tested for EGC, and two dog-bone samples were cast and tested for GPC, following ASTM D3039 [29]. Next, a four-point loading flexural test was conducted on beams in accordance with the specifications of ASTM D5045-14 [30]. The flexural strength of the beams was measured, and the ductility of the beams was analysed using a ductility index graph as shown in Figure 4.
Finally, a pull-out test was performed to study the bond performance of steel reinforcing bars with EGC and GPC. The pull-out test followed the procedure outlined in ASTM C234 (ASTM 1988) [31] and was conducted using a universal testing machine.

2.2. Mix Design Preparation

Before conducting the main mix, trial mixes were prepared for this research, as shown in Table 4. The primary parameter that varied among the mixes was the percentage of silica fume replacement, which ranged from 5% to 20%. The sodium silicate to sodium hydroxide ratio and the molarity of sodium hydroxide were kept constant at 2.5 and 10 M, respectively. In order to maintain the fluidity and workability of the EGC produced in this research, 10 M of NaOH and 2.5 sodium silicate to sodium hydroxide ratio was adopted to be utilised in preparing the alkaline solution.
After finalising the trial mix design, the effect of GGBS and alkaline solution to fly ash ratio was investigated using the response surface methodology (RSM) method. The central composite design (CCD) technique, a common design approach in RSM, was employed. The entire procedure consisted of four steps: designing experiments, collecting data from the experiments, developing a numerical model using RSM, and optimising and validating the model. The GGBS values ranged from 20% to 40%, while the AL/FA ratio varied from 0.3 to 0.5. The main reason a range of 20–40% was chosen for GGBS is because it was observed that the increase in strength kickstarts at 20% of GGBS used and according to [32], a decreasing trend in the strength of geopolymer was noticed when the value exceeds 40% of GGBS. Meanwhile, the AL/FA ratio ranges from 0.3–0.5 because it was found that, with a lower alkaline solution of 0.3, compressive strength is enhanced while with an AL/FA of 0.5, a higher workability but lower compressive strength is observed according to [33]. However, the optimum amount of GGBS content and AL/FA ratio in producing the highest strength of geopolymer is not mentioned and analysed by the past literatures. Hence, these independent variables are chosen to be analysed, and the optimised values of independent variables in producing the highest compressive strength of EGC with the aid of RSM are studied in this research. After the optimisation process, the optimised parameters were analysed by creating a few mixes to ensure consistent results before casting the cube, prism, cylindrical, and dog-bone specimens required for this research. The mix design with the highest compressive strength, obtained using the optimised parameters from RSM, was selected for casting the remaining specimens to study the bond behaviour of EGC. The mixing process for EGC and GPC followed the standards specified in BS 1881: Part 125: 1986 [34]—Methods for Mixing and Sampling Fresh Concrete in the Laboratory. The mix designs used for EGC and GPC in this research are presented in Table 5 and Table 6, respectively.

3. Results and Discussion

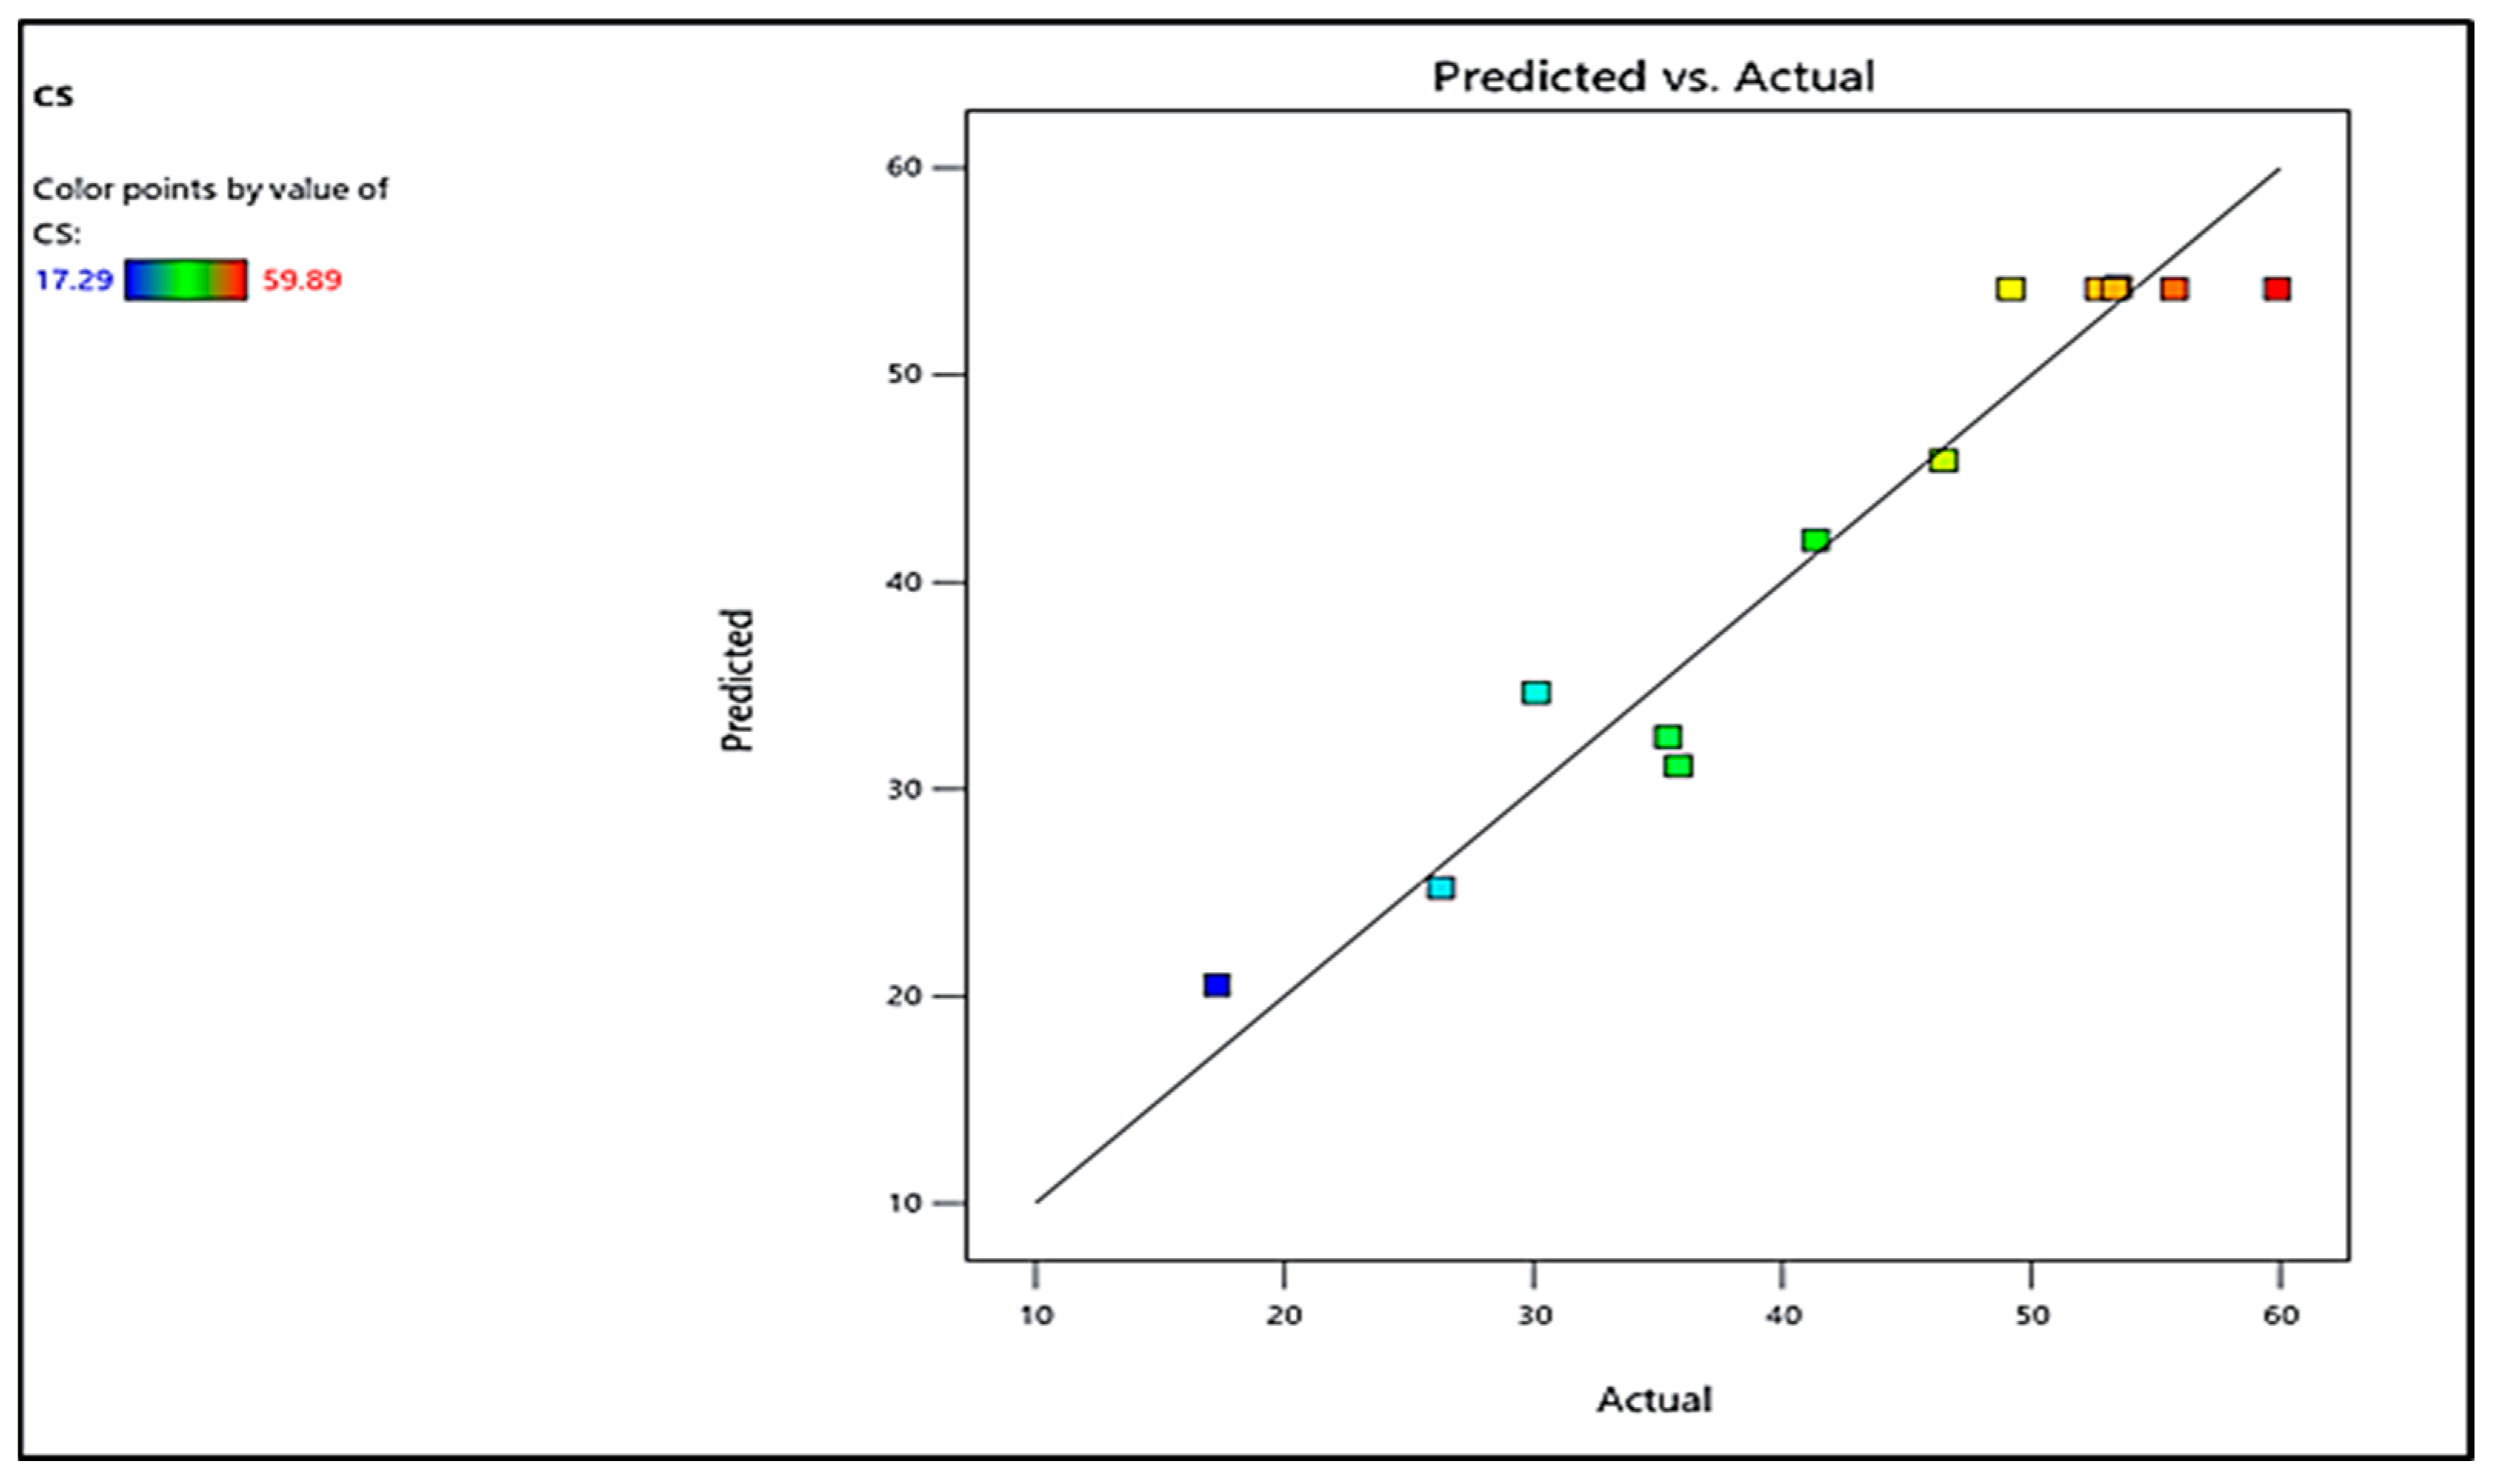
3.1. Response Surface Methodology Analysis

The main independent variables assessed as input factors in this study were the percentage of GGBS and the alkaline solution to fly ash ratio (AL/FA). The response variable analysed and considered was the compressive strength (CS). The experimental runs were designed using the central composite design (CCD) method, as shown in Table 7, to generate the empirical data of the responses at 28 days. According to Table 7, it can be observed that the values of Factor A: GGBS, which is 15.8579 and 44.1421 from run 1 and 5, and Factor B: AL/FA, which is 0.541421 together with 0.258579 from run 4 and 9, varies from the specified range because these values act as an outlier where it is the maximum and minimum range produced by the RSM software (Design Expert Version 13).
Based on the RSM study, the responses were found to be well-fitted by quadratic models, as shown in Equation (1), in terms of coded factors. The purpose of coding the factors is to predict responses for different levels of each variable. The high level and low level of the factors are set as defaults during the analysis, with +1 representing the high level and −1 representing the low level. The coded equations presented in Equation (1) can be used to determine the relative significance of the factors by comparing their coefficients.
CS = 54.18 − 3.96 × A − 7.60 × B + 6.91 × AB − 6.95 × A2 − 11.44 × B2

3.1.1. Analysis of Variance (ANOVA) of the Response Model
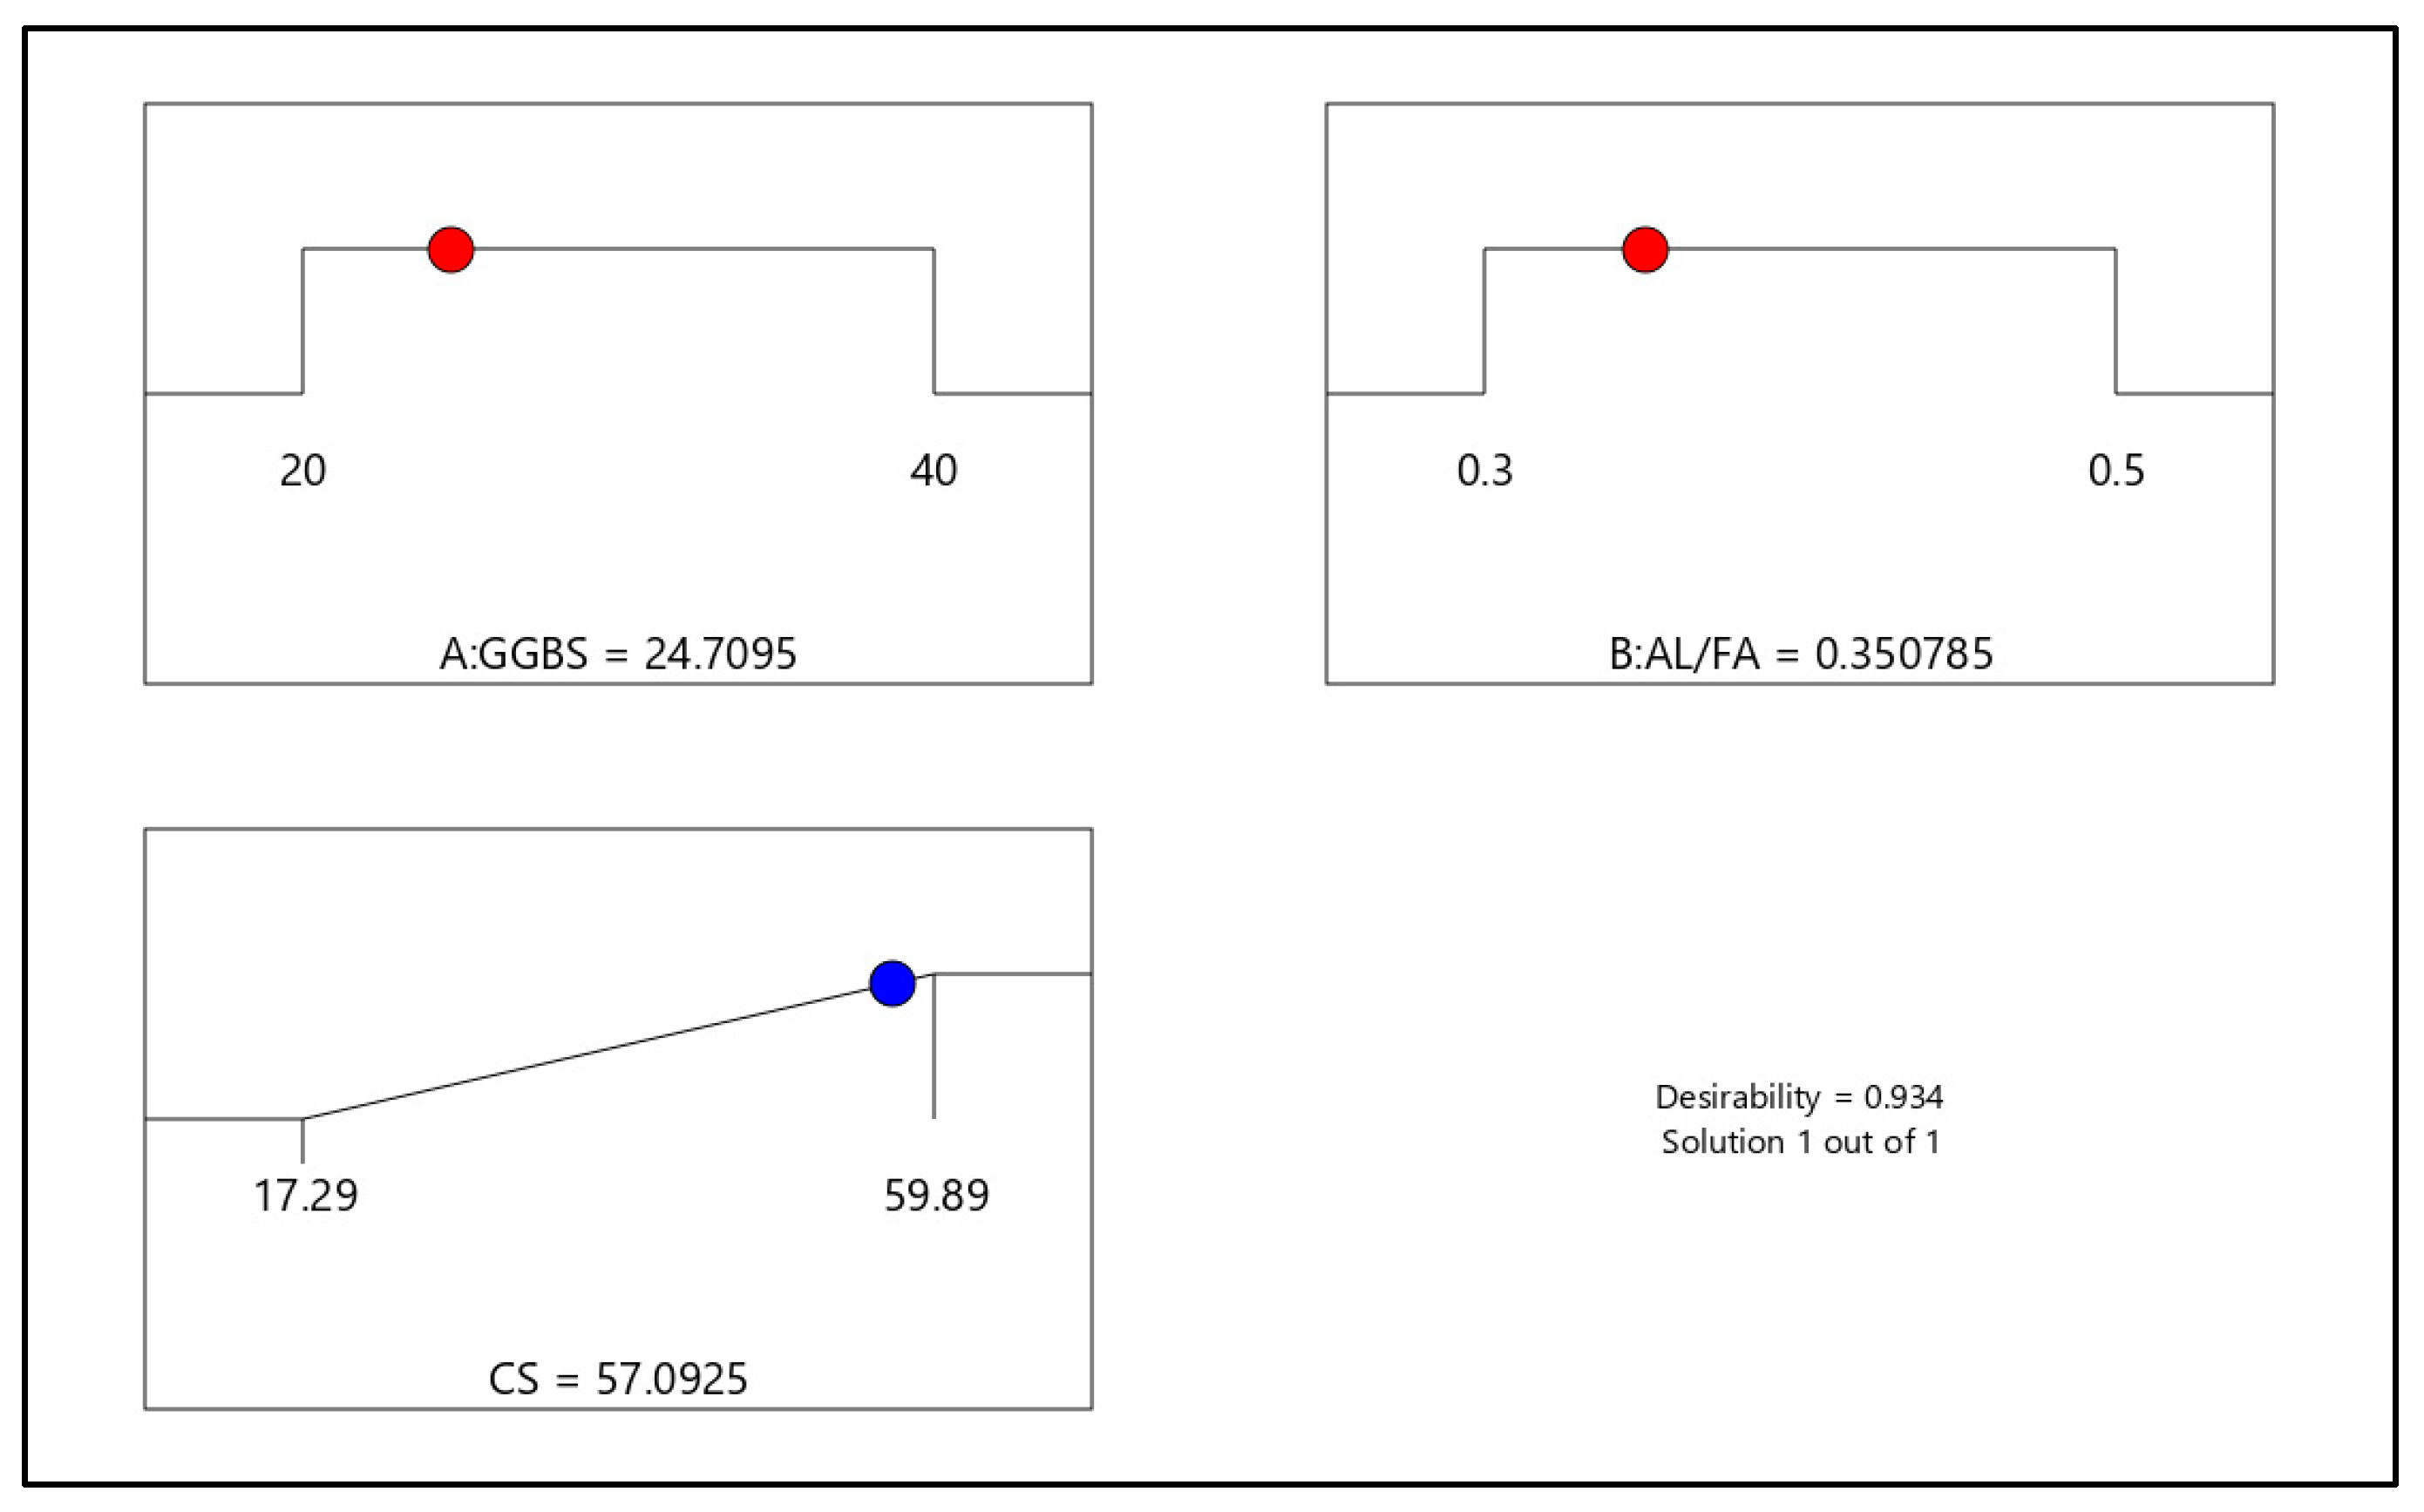
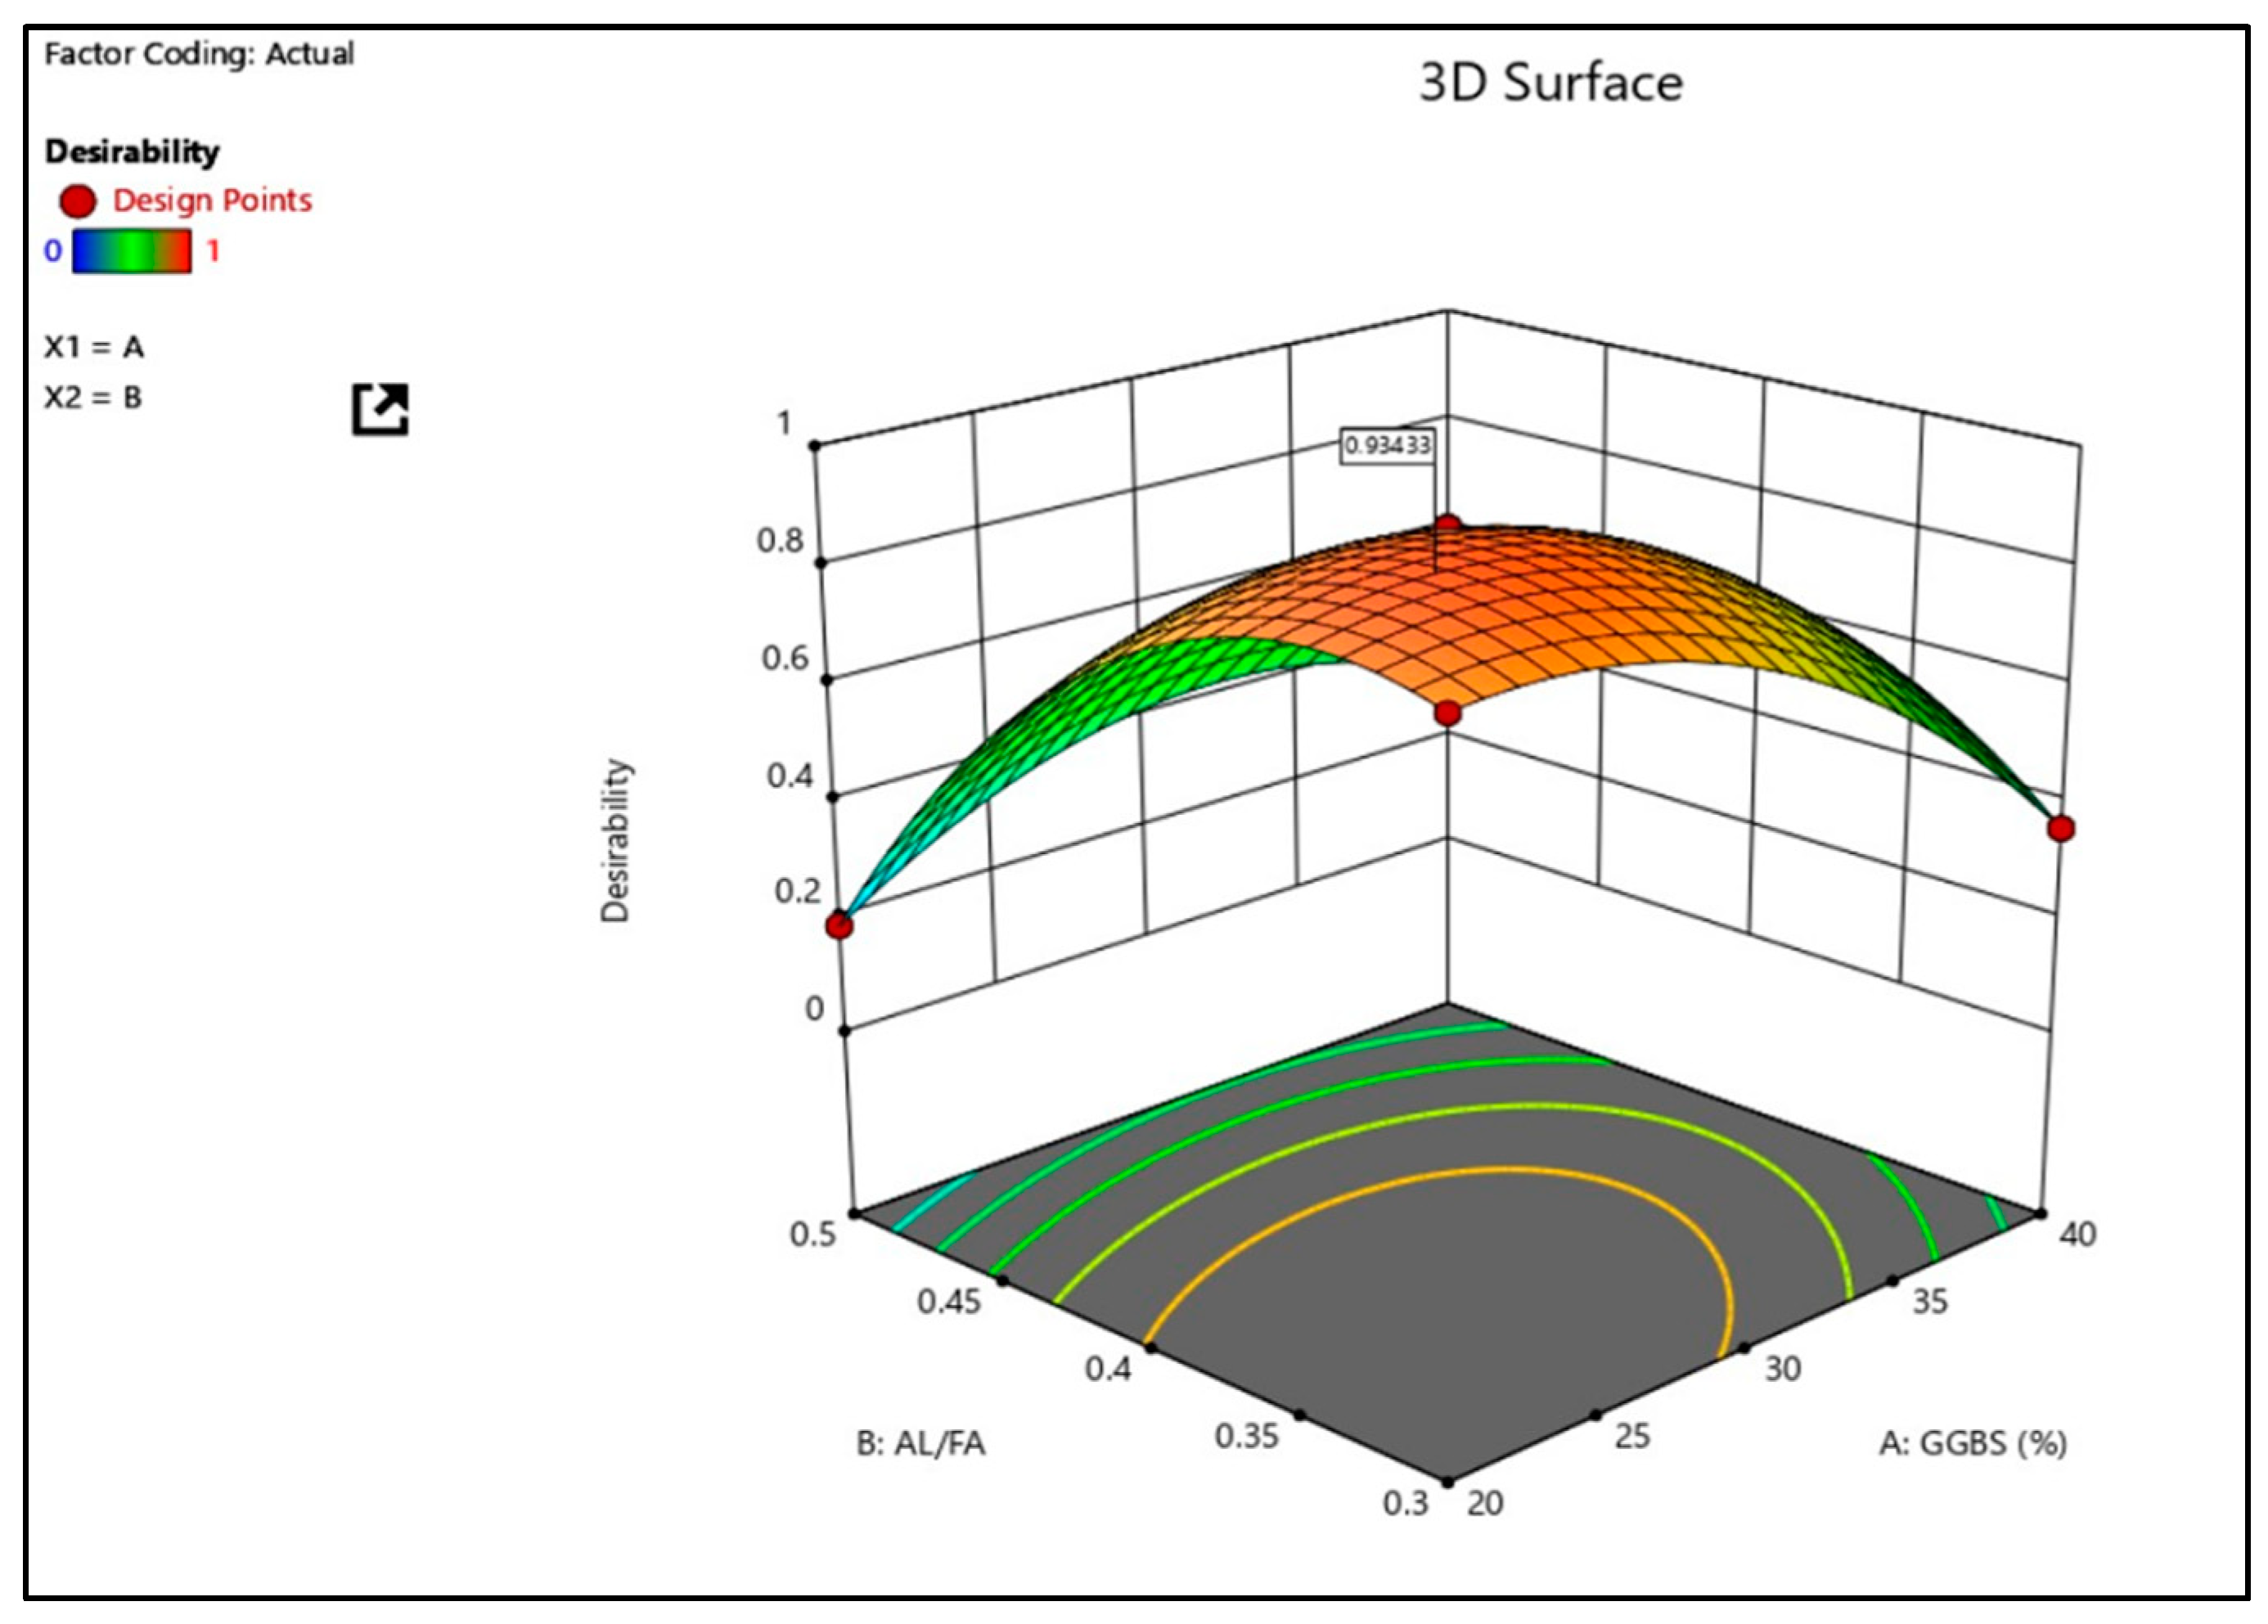
Table 8 presents the validation parameters for the model. Among the various parameters, the coefficient of determination (R2) is particularly important. R2 is typically expressed as 0 ≤ R2 ≤ 1 or as a percentage. In this case, the developed model has an R2 value of 93%, indicating a good fit. Additionally, adequate precision measures the signal-to-noise ratio for the model. A ratio greater than four is desirable to effectively navigate the design space. The obtained ratio from Table 8 is 11.636, indicating a sufficient signal and suggesting that the model is reliable and efficient for navigating the design space and making accurate predictions.
Subsequently, the advanced models were evaluated using an analysis of variance (ANOVA) with a 95% confidence level. A probability value of less than 5% (0.05) indicates statistical significance, meaning that the occurrence is unlikely to be due to chance [35]. Based on Table 9, the developed model is considered significant when its probability value is less than 5%. Conversely, a value exceeding 0.1000 indicates that the model term is not significant. Significant values indirectly influence the response, which is the compressive strength, meanwhile insignificant values do not influence the response. Upon examining the individual model terms, it can be observed that A, B, AB, A2, and B2 are statistically significant for the compressive strength model.
To further assess the effectiveness and reliability of the developed response models, the main diagnostic tool used is the “Actual versus Predicted” plot, shown in Figure 5. This graph illustrates the relationship between the experimental data and the predicted outcomes based on the models. Based on Figure 5, the alignment of the data point on the normal plot of residuals stipulates that error terms are normally distributed, which is preferable. Furthermore, the pattern of the data point along the line of fit on the predicted versus actual graph indicates that there is an adequate agreement between the predicted and the actual response [36]. Therefore, the strength and accuracy of the models are verified.
Additionally, 2D-contour and 3D-response surface diagrams are utilised to analyse the interaction and combined effects of the input factors on the responses. Figure 6 and Figure 7 display the developed 2D and 3D plots. In these graphs, the colours represent the intensity (magnitude) of the input factors, with red indicating the highest magnitude and blue indicating the lowest.
Based on Figure 6, both input factors, A (amount of GGBS) and B (alkaline solution to fly ash ratio), have a significant impact on the response, which is the compressive strength (CS). The compressive strength shows a high intensity when the amount of GGBS is around 30% and the alkaline solution to fly ash ratio is 0.4. However, an increase in both input factors leads to a decrease in compressive strength. Firstly, an increase in A (amount of GGBS) results in a drier and tighter mix, due to the high presence of calcium oxide in GGBS. This indirectly absorbs more water from the mixture, reducing its workability [37]. Secondly, an increase in B (alkaline solution to fly ash ratio) increases the amount of alkaline solution in the mixture. This causes the mix to become more viscous, and prolongs the setting time, ultimately reducing the compressive strength of the material.

3.1.2. Optimisation

To achieve the objective of determining the optimum amount of GGBS in the mix design of EGC that would result in the highest compressive strength, an optimisation process was carried out as part of the RSM analysis. During this analysis, the optimisation module searches for a combination of factor levels that satisfies the predefined goals for the response [38]. This analysis is achieved by initiating goals for the input factors and responses with varying criteria and level of importance. Desirability value that ranges from 0 to 1 is used to evaluate the optimisation outcome.
The optimisation goals and criteria are presented in Table 10. The desirability value, as shown in Table 10, is used to determine the optimal value. The main purpose of conducting optimisation is to maximise the response, which is the compressive strength (CS). The two input factors, GGBS and AL/FA, were set within a range for the optimisation process to determine the best values that would fulfil the overall goal, considering the impact of these factors on the workability of the design mix. Once the criteria for the input factors and responses were established, the optimisation process was initiated. The optimisation yielded a maximum value of 57.092 for CS and a desirability value of 93%, where the desirability value can be stated as the closeness of a response to its ideal value as shown in Figure 8 and Figure 9.

3.1.3. Experimental Validation

Finally, experimental confirmation was carried out by preparing an EGC mix using the optimal input variables obtained from the optimisation process, namely the amount of GGBS and AL/FA ratio, to determine the CS value. Three samples were casted using these inputs to assess the response based on the RSM analysis. The predicted value, which is 57.092 MPa, is the strength produced by the RSM, meanwhile the experimental value, which is 58.235, is the value attained from conducting triplicate runs using the optimised input variables, which can be seen in Table 11. The percentage error between the predicted and experimental values was calculated. This demonstrates the effectiveness of the developed response models in accurately predicting the responses. The experimental error between the predicted and actual values was found to be 2%, which is within the acceptable limit and indicates the reliability of the response model.

3.2. Mix Design of EGC and GPC

Two types of concrete, EGC and GPC, were cast and tested in this study at different time intervals (1, 7, 14, and 28 days). The mix design for both types of concrete was developed based on the optimised parameters obtained from the RSM analysis. The compressive strength results for the 100 mm cubes of EGC and GPC are presented in Table 12 and Table 13, respectively. From Table 12, it can be observed that the varying factor in the mix design of EGC is the percentage of silica fume replacement, which ranges from 5 to 20% for mix 1, mix 2, mix 3, and mix 4, respectively. Among these mixture designs, mix 4, with a silica fume replacement of 20%, exhibited the highest compressive strength for EGC. This mix was chosen to cast all the other specimens and compare the results with the GPC specimens. To facilitate a comparison of other mechanical properties such as tensile strength, flexural strength, and bond strength between EGC and GPC, both types of concrete were designed to achieve the same compressive strength after 28 days of testing.

3.3. Fresh Property of EGC

Flow Table Test

The flowability of EGC is illustrated in Figure 10. EGC exhibits satisfactory workability with a flow value of 106%, meeting the standard requirements outlined in ASTM C1437-01 [39]. According to the standard, the acceptable range for flowability falls between 100 and 150%. This indicates that the EGC sample could be efficiently casted into the moulds. The PVA fibre used is 2% in this study. In this research, the workability of EGC was further improved by adding a superplasticizer (SP) to the mix, making it more workable when compared to GPC. The EGC mix included 2% of superplasticizer to enhance its workability.

3.4. Mechanical Properties of EGC and GPC

One of the important properties in attaining a ductile and durable concrete was to achieve a high compressive strength. The compressive strength obtained ensures that the concrete meets the minimum strength requirements of a structure.
Figure 11 shows the compressive strength of EGC and GPC. By comparing the compressive strength, it can be denoted that EGC has a slightly higher compressive strength than GPC. Based on Figure 11, EGC and GPC has achieved compressive strength of 12.58 MPa and 5 MPa on day 1, and 46.42 MPa and 27.26 MPa on day 7, respectively. Meanwhile, for 14 days, EGC and GPC have achieved 47.45 Mpa and 45.62 MPa and, finally, for 28 days, EGC and GPC have attained 60 MPa and 58.8 MPa, respectively. Notably, the compressive strength of EGC at 7 days with a value of 46.42 MPa was approximately 70% higher than that of GPC. The significant increase in strength from day 1 to day 7 can be attributed to the positive influence of GGBS in enhancing the early compressive strength of EGC, supported by [32]. Additionally, the partial incorporation of silica fume in the EGC matrix contributes to the early strength development, as it acts as a filler between the fly ash and GGBS, resulting in a denser matrix. Moreover, the presence of PVA fibres in EGC improves its ductility, preventing instant and brittle failure during compression testing. Furthermore, the addition of GGBS in the EGC matrix reduces the curing time and setting time of EGC. Figure 12 highlights another notable difference between EGC and GPC in terms of their failure behaviour. EGC exhibits a ductile failure, while GPC demonstrates a brittle failure. This ductile behaviour in EGC is mainly due to the presence of PVA fibres, which provide a bridging mechanism. As the EGC reaches its maximum load, crack growth is reduced, allowing the EGC sample to maintain its original shape.
The average tensile strength of EGC and GPC is provided in Table 14 and Table 15. Based on these tables, the average tensile strength of EGC and GPC is 4.003 MPa and 1.6 MPa, respectively. It is evident that the average tensile strength of EGC is approximately 150% higher than GPC. During the tensile test, both EGC and GPC specimens exhibited different failure behaviours where the dog-bone specimens used in the test experienced distinct outcomes. The EGC specimen stretched and was pulled-out without separating into two pieces, while the GPC specimen separated into two parts when the load was applied. This behaviour can be attributed to the significant influence of PVA fibres in enhancing the strength and ductility of EGC. The PVA fibres enhance the bridging effect between the fibres and the matrix, improving both flexural and tensile strength, as supported by [40].
Figure 13a,b depicts the crack patterns observed after the direct tensile test of the dog-bone specimens for EGC and GPC. Based on Figure 13a, it is evident that the cracks are distributed along the loaded length of the EGC specimen. This distributed crack pattern indicates the ability of the EGC specimen to withstand high loads for an extended period, even after the appearance of the first crack. This behaviour is classified as ductile crack behaviour, as the EGC specimen can sustain high loads without immediate failure, which is consistent with the crack pattern observed in [41]. The presence of multiple cracking zones, as shown in Figure 13a, serves as a warning or indication before failure occurs, making EGC a ductile material. In contrast, the behaviour of the GPC dog-bone specimens, as shown in Figure 13b, is opposite to that of EGC, where the GPC specimens exhibit brittle failure, and the specimen fails immediately after the first crack appears.
Furthermore, the flexural strength and ductility of EGC and GPC beams obtained from the four-point bending test are presented in Table 14 and Table 15. As observed from the tables, the flexural strength of EGC is slightly higher than that of GPC. EGC achieved a flexural strength of 5.575 MPa, while GPC achieved 5.137 MPa, resulting in a 9% higher flexural strength for EGC. However, there is a significant difference in terms of ductility between EGC and GPC, as indicated in Table 14 and Table 15. Ductility refers to the ability of a structure to withstand large deformations without losing its load-carrying capacity [42]. The failure displacement value is obtained at 85% of the maximum load at the peak, while the yielding displacement is the value corresponding to the first yield of the specimen [43]. Ductility values are calculated by dividing the failure displacement by the yielding displacement, and it is observed that EGC exhibits higher ductility compared to GPC. Specifically, for the 28-day test period, EGC and GPC have average ductility values of 3.3 mm and 1.2 mm, respectively, indicating that the ductility of EGC is approximately 47% higher than that of GPC specimens. The presence of fibres in the EGC matrix plays a crucial role in enhancing elongation and displacement, allowing the EGC beam to be more flexible in comparison to the GPC beam. The fibres also contribute to controlling crack propagation. Additionally, as shown in Figure 14a, GPC beams split into two pieces during the flexural test, while Figure 14b demonstrates that EGC beams do not undergo such splitting, indicating their superior flexural ability and bendability. Multiple cracks can be observed before failure in EGC specimens under tension and flexure, whereas GPC specimens do not exhibit fine cracks before failure due to the absence of PVA fibres in GPC. These cracks signify the higher ductility and bendability of EGC, along with its good strain-hardening properties. The PVA fibres in the EGC matrix act as bridges for the cracks, and when the first cracks appear, the fibres become activated and experience stress until they are pulled out or broken [44].
As observed from Figure 15, the elastic modulus of EGC is higher than GPC. Although both EGC and GPC specimens exhibit similar compressive strength, there is a significant difference in yield strength between the two. The graph clearly illustrates that GPC beams are more brittle. This difference indicates that EGC can withstand higher loads and accommodate a greater deflection than GPC before entering the plastic region or experiencing failure [41]. Furthermore, from Figure 15, the graph of EGC demonstrates strain-hardening behaviour. Initially, the graph shows a linear relationship between stress and deformation. After the first crack appears, the beam begins to yield, and as the load approaches its maximum, the graph gradually decreases. This behaviour aligns with the visual representation of fibres acting as bridges across the cracks. In contrast, the graph for GPC specimens initially follows a linear trend. However, once the maximum load is reached, a sudden failure occurs, causing the graph to drop drastically in the descending branch.

3.5. Bond Behaviour

3.5.1. Bond Strength

As a motive to investigate and analyse the bond behaviour and bond strength of rebar with EGC and GPC, the pull-out test is conducted. For the average bond strength, the maximum pull-out load is divided by the bond area of reinforcing bars.
The bond stress of the cylinder specimens is calculated as below:
τ = P m a x π d b L d
where P m a x is maximum pull-out load, d b = rebar diameter, and L d = Embedded bar length.
The bond strength of EGC and GPC with varying rebar diameter and embedment length are shown in Table 16 and Table 17, respectively.
As can be seen from Table 16 and Table 17, the bond strength of EGC surpasses GPC. The bond stress of EGC with varying rebar diameter ranges from 9–11 MPa for 28 days. Additionally, the bond stress for EGC with varying embedment length ranges from 9–12 MPa for 28 days. On the other hand, the bond strength of GPC with different rebar diameter ranges from 7–9 MPa for 28 days. Similarly, for GPC specimens with varying embedment length, the obtained bond strength falls between 7–12 MPa for 28 days. The previous research and literature have indicated that larger diameters result in lower bond strength when they exceed 16 mm in diameter [45]. Furthermore, based on the results in Table 17, it can be observed that increasing the embedment length of the rebar leads to a decrease in bonding strength. This demonstrates that a lower embedded length, such as 70 mm (7 d), achieves higher bonding strength between EGC and the reinforcement bar. One explanation for the decrease in bond strength is that, as the embedment length increases, the dispersion of bond stress in the bonded area becomes nonuniform, resulting in a lower average bond stress [46]. Therefore, it can be concluded that a lower embedment length of the rebar corresponds to a higher bonding strength between EGC and the rebar.

3.5.2. Bond Failure Modes

The pull-out test explains more than just the bond strength between rebar and concrete, where it can also provide understanding of the observation on the failure modes of the specimen. The main type of failure modes can be divided into three parts which are pull-out failure (P-O), pull-out splitting failure (P-S), and yielding failure of steel rebar (Y). All of the failure modes of EGC and GPC were tested at 28 days and are tabulated in Table 18.
From Table 18, it can be observed that the main type of failure in EGC specimens tested at 28 days, with varying rebar diameter and embedment length, is pull-out splitting failure (P-S). However, EGC specimens with an embedment length of 15 d (150 mm) tested at 28 days exhibited yielding failure. Generally, pull-out failure and pull-out splitting failure are considered ductile failures, which occur when there is confinement provided in the concrete matrix. In this study, the main source of confinement in the EGC matrix is the PVA fibre, which acts as a bridging effect and propagates stress in the concrete. Pull-out failure can be observed in EGC specimens with an 8 mm rebar diameter at 28 days. Additionally, pull-out failure was also observed in EGC specimens with a 7 D embedment length at 28 days. The occurrence of pull-out failure in specimens with short embedment lengths is due to the insufficient bonded length to create radial splitting tension, resulting in narrower longitudinal cracks in the geopolymer concrete. Furthermore, in pull-out failure, there is an absence of radial splitting cracks on the surface of the cylinder, and smaller rebar diameters tend to lead to early pull-out failure as the rebar grips tend to disconnect and become loose from the concrete layer before reaching the peak load, a type of failure that was also observed in [47]. On the other hand, pull-out splitting failure (P-S) consists of pulling out and splitting columnar cracks, which occurred in rebars with an embedment length of 10 d (100 mm) and 12 d (120 mm) based on Table 18. One of the reasons for this failure with larger embedment lengths and rebar diameters is that these samples have sufficient embedded lengths to generate splitting tensile loads inside the EGC specimen. This stress results in the expansion of longitudinal cracks, spreading to the outer surface of the concrete. Ribbed bars were used as the rebars in this study, and, according to the researchers’ view, pull-out splitting failure normally occurs in ribbed rebars [48]. Pull-out splitting failure was also observed in EGC specimens with rebar diameters of 10 mm and 16 mm at 28 days, characterised by cracks occurring at the top loaded face. The addition of PVA fibres in the EGC matrix enhances the energy absorption capacity and transfers loads and stresses across the cracks, preventing splitting failure, which is a brittle failure. The mode of failure of EGC and GPC is shown in Figure 16 and Figure 17.
On the other hand, GPC specimens with rebar diameters of 10 mm and 16 mm, as well as embedment lengths of 7 D and 12 D, experienced splitting failure of the whole concrete or splitting failure with longitudinal cracks. Meanwhile, for GPC specimens tested at 28 days, the specimen with an 8 mm rebar diameter and embedment lengths of 12 D and 15 D undergoes yielding failure. The splitting failure in GPC specimens occurred in an explosive brittle manner, resulting in the specimen separating into two pieces. This can be attributed to the absence of confinement, such as PVA fibres in the matrix, which provides sufficient support to withstand the stresses generated during the bond strength test, as well as the loss of chemical adhesion between the rebar and concrete. Lastly, when comparing the splitting cracks developed by EGC and GPC based on Figure 16b and Figure 17b, it is observed that the cracks in the GPC specimens are wider. One possible reason for this is the presence of reinforcement, specifically the PVA fibre in the EGC matrix, which can control the expansion of cracks by acting as a bridge. In contrast, the GPC matrix lacks reinforcement to control the width of cracks produced during the bond test.

3.5.3. Bond Stress Slip Curves

There are 3 main types of force transfer that primarily made up the bond mechanism which includes the chemical adhesion, friction, and the mechanical interlock between the rebar and the concrete. The correlation between both bond stress and slip has proven to evolve as an efficient method for investigating the bond behaviour of rebar and concrete. The stress slip curves are shown in the Figure 18 and Figure 19.
Based on Figure 18a and Figure 19a, the stress–slip curves can be divided into several stages. Firstly, in stage 1, at the initial loading point, there is a small movement at the loading end. As the pull-out load gradually increases, the slip between the reinforcement bars and the concrete also increases. During this phase, the main force providing support between the rebar and concrete is the chemical adhesion force. Moving on to stage 2, as the pull-out load continues to increase, the chemical adhesion force gradually deteriorates from the loaded end to the free end. This results in relative slip between the reinforcement bars and the concrete, causing the chemical adhesion force to diminish. The cracks that develop on the exterior of the concrete contribute to the progression of slip between the rebar and concrete, and during this phenomenon, force transmission relies on the sliding friction force [49].
In stage 3, as the pull-out stress increases, the bond stress–slip curves start to exhibit nonlinear behaviour and eventually reach the maximum limit. In stage 4, with further rebar slip, the mechanical interlock becomes unable to withstand the applied force, leading to a rapid decline in load with increasing slip. Cracks start to form on the cover layer from the inside to the outside, and the stress–slip curve enters the descending stage. The amount of slippage increases as the load reduces to a certain point, and the load eventually fluctuates around a certain value. Sliding friction primarily contributes to the bond stress.
When comparing the stress–slip curves between EGC and GPC, as shown in Figure 18 and Figure 19, it can be observed that both specimens’ curves start with a steep slope, indicating good chemical adhesion and mechanical interlock between the rebar and concrete. However, after reaching the maximum peak load, the descending curve of the EGC specimen declines slowly and smoothly, indicating better ductile behaviour. Ductile failure modes, such as pull-out failure and pull-out splitting failure, are observed in EGC. In contrast, the GPC specimen shows a steep descending branch, indicating brittle behaviour and brittle failure modes, such as splitting failure.

3.5.4. Factors Affecting Bond Strength of EGC

In this study, four different embedded lengths were analysed for both EGC and GPC, namely 7 d, 10 d, 12 d, and 15 d (where d represents the diameter of the rebar). These embedment lengths were chosen based on recommendations from various standards and guidelines, which suggest a minimum embedment length of 5 d [50]. The calculated experimental results with similar diameter with varying embedment lengths is tabulated in Table 17.
From Table 17, it is observed that as the embedment length of the rebar increases, the bonding strength decreases for both EGC and GPC. However, EGC exhibits higher bond strength compared to GPC. This finding demonstrates that a lower embedment length, such as 7 d (70 mm), leads to a higher bonding strength between EGC and the reinforcement bar. The bond strength of EGC decreases by approximately 30% from 7 d to 15 d. Previous studies have also identified potential reasons for the reduction in bond strength. The decrease in bond strength is primarily attributed to the rapid appearance of cracks and the loosening grip of the rebar when the maximum pull-out load or peak load increases with longer embedment lengths, ultimately causing the specimen to fail before reaching its full bond strength [51]. Furthermore, as the embedment length increases, the Poisson’s ratio effect significantly diminishes the confinement effect of the surrounding concrete on the rebar. Additionally, with increased embedment length, the bond stress distribution in the bonded section tends to increase nonlinearly, leading to a reduction in bond stress [52]. In conclusion, the relationship between bonding strength and embedment length of the rebar indicates that a lower embedment length results in higher bonding strength between EGC and the rebar.
Another factor influencing the bond strength of EGC is the rebar diameter. To facilitate the pull-out study and comparison of results, the embedment length was kept constant at 10 d (100 mm). Based on Table 16, bar diameters of 8 mm, 10 mm, and 16 mm were studied for their bond behaviour. As observed from Table 16, there is an increasing trend in the bond strength of EGC specimens with larger rebar diameter, with a 19% increase in bond strength for 16 mm diameter when compared to 8 mm diameter. Some references in the literature review have indicated that larger diameters tend to develop lower bond strengths when the rebar diameter exceeds 20 mm [53]. Additionally, according to the Poisson’s effect, as the pull-out load increases, the larger diameter of the rebar undergoes significant reduction, resulting in reduced confining pressure and ultimately lower bond strength. Another research study has stated that smaller rebar diameters tend to exhibit higher ductility in bond performance for GPC [54]. Furthermore, from Table 16, it can be observed that for EGC, the bond strength increases with increasing rebar diameter, whereas for GPC, the bond strength values fluctuate, indicating non-linear stress distribution within the rebar and concrete of the GPC specimen.

4. Conclusions

In this study, the key findings of the research on a new ambient cured (EGC) with comparable mechanical and bond properties to (GPC) are presented. The developed ambient temperature-cured EGC terminates the essential needs for heat curing, which gives way for in situ application. This study analysed the experimental data of EGC and GPC in order to differentiate the performance in terms of mechanical properties, such as compressive strength, flexural strength, and tensile strength. This study investigated on the factors affecting the bond behaviour of EGC and GPC, which include the rebar diameter and embedment length. The following are the conclusions that were drawn from this study:
  • Optimisation was performed using the optimum values of 25% for GGBS and 0.4 for the alkaline solution to fly ash ratio, which achieved a desirability of 93% in ANOVA. Triplicate experiments were conducted to validate the optimum conditions. The predicted and experimental values of the compressive strength in this study were 57.092 MPa and 58.235 MPa, respectively. The error between the predicted and experimental results was less than 5%.
  • The highest compressive strength that was achieved by the EGC specimen on 28 days is 60 MPa with silica fume replacement of 20%. Moreover, it was able to obtain the highest workability.
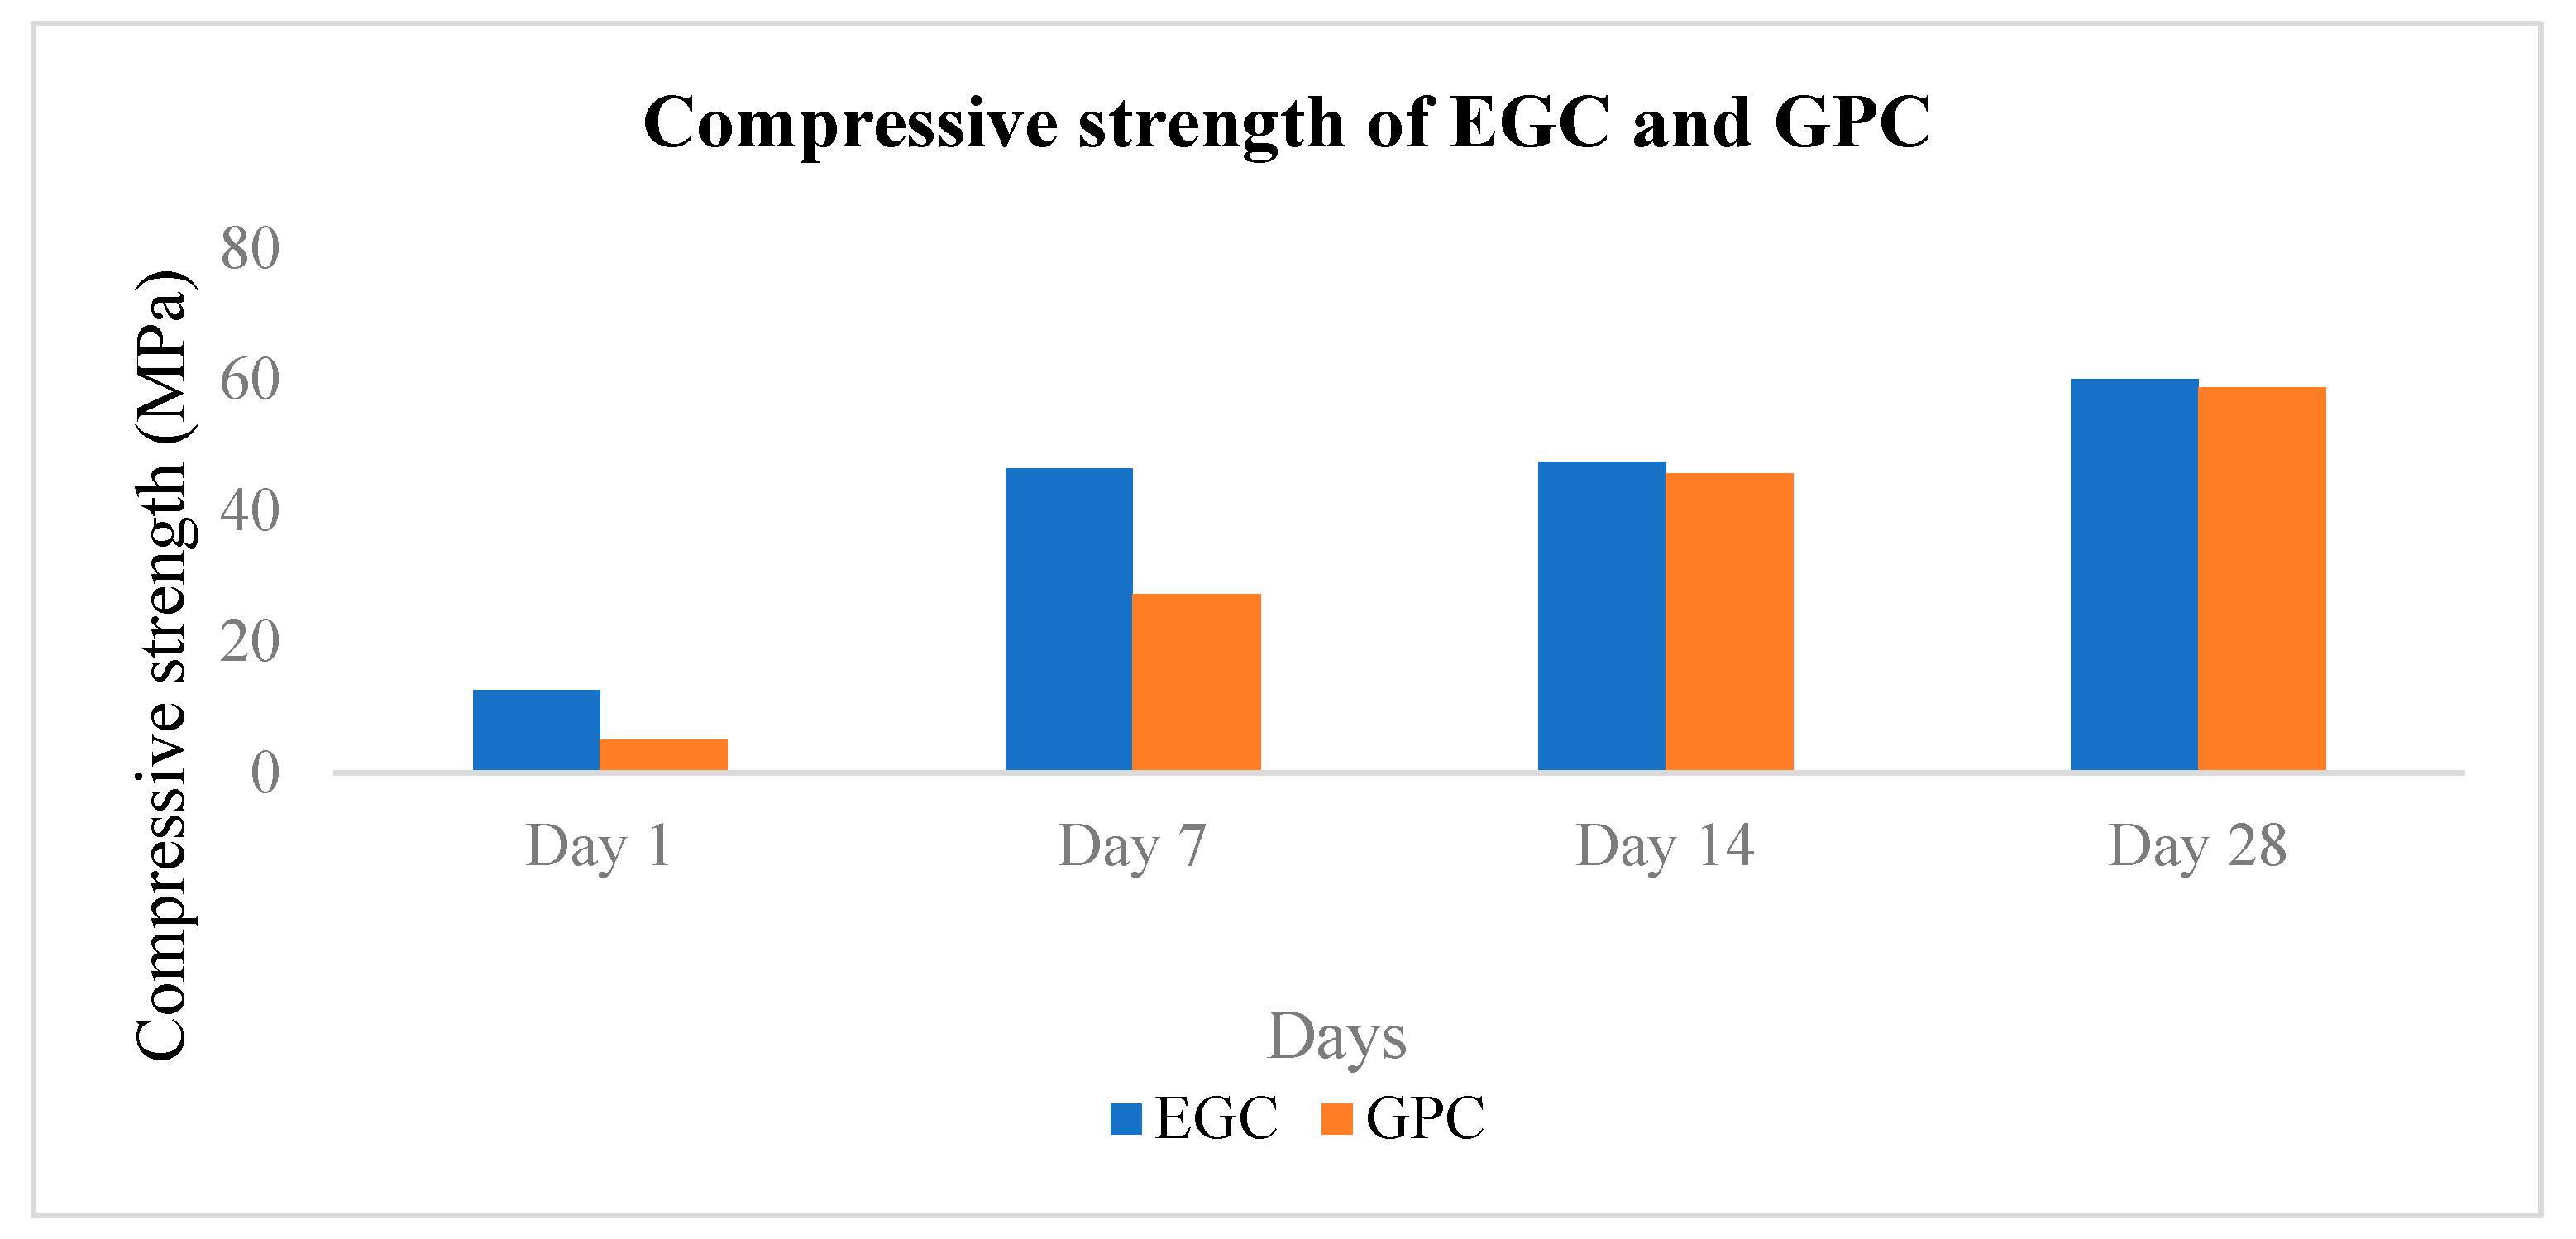
  • EGC reached higher early strength on day 1 with a value of 12.58 MPa compared to GPC, which only produces 5 MPa in ambient curing without the need of heat curing due to the absence of GGBS in the GPC matrix. The presence of GGBS in EGC is able to provide internal heating in EGC matrix, which reduces the curing time and enhances the early strength of EGC. Meanwhile, the compressive strength of EGC and GPC at 28 days were produced to be similar to ensure accuracy of the results during the comparison of mechanical properties, such as tensile strength and flexural strength.
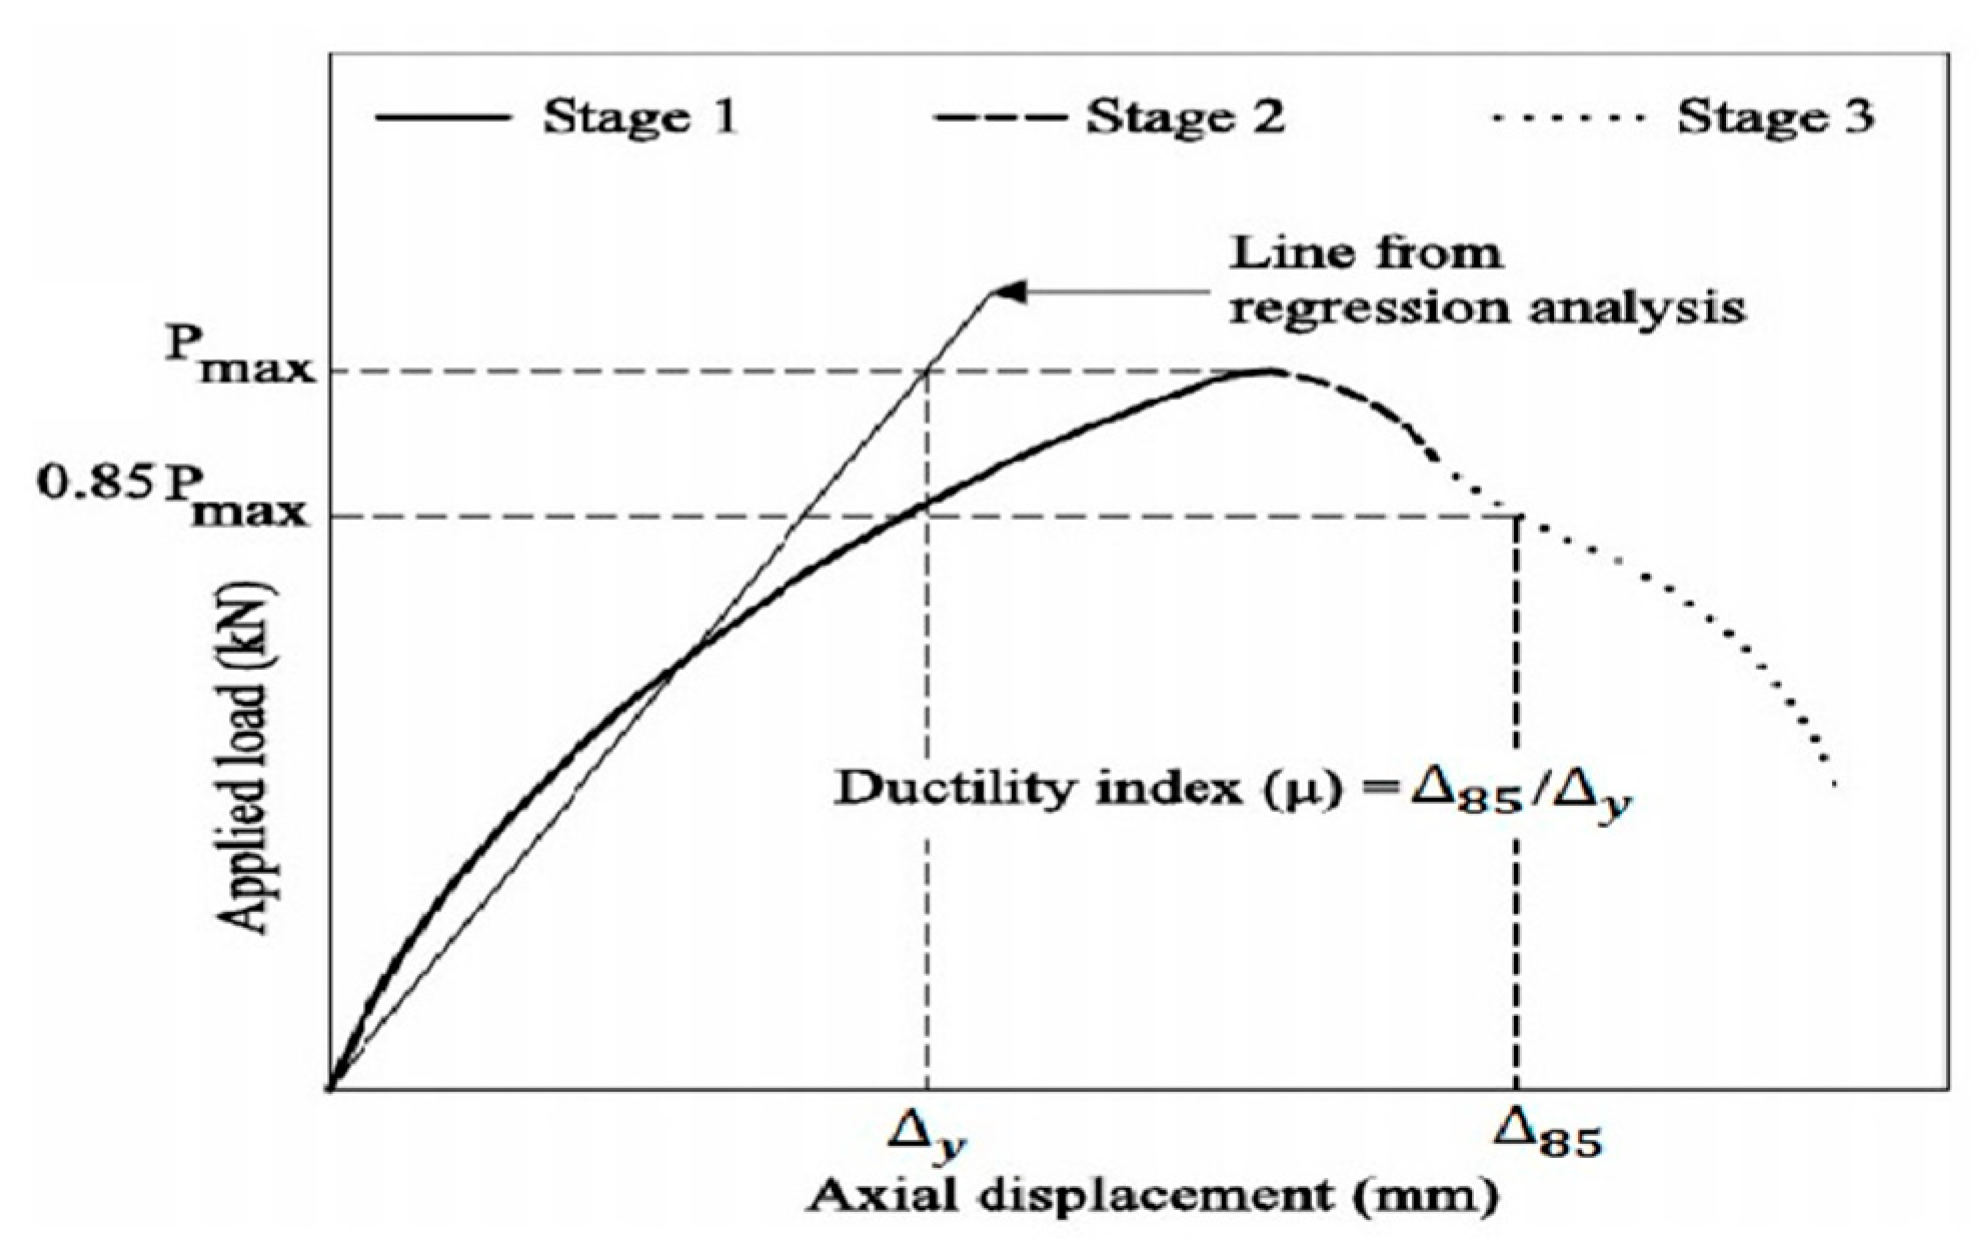
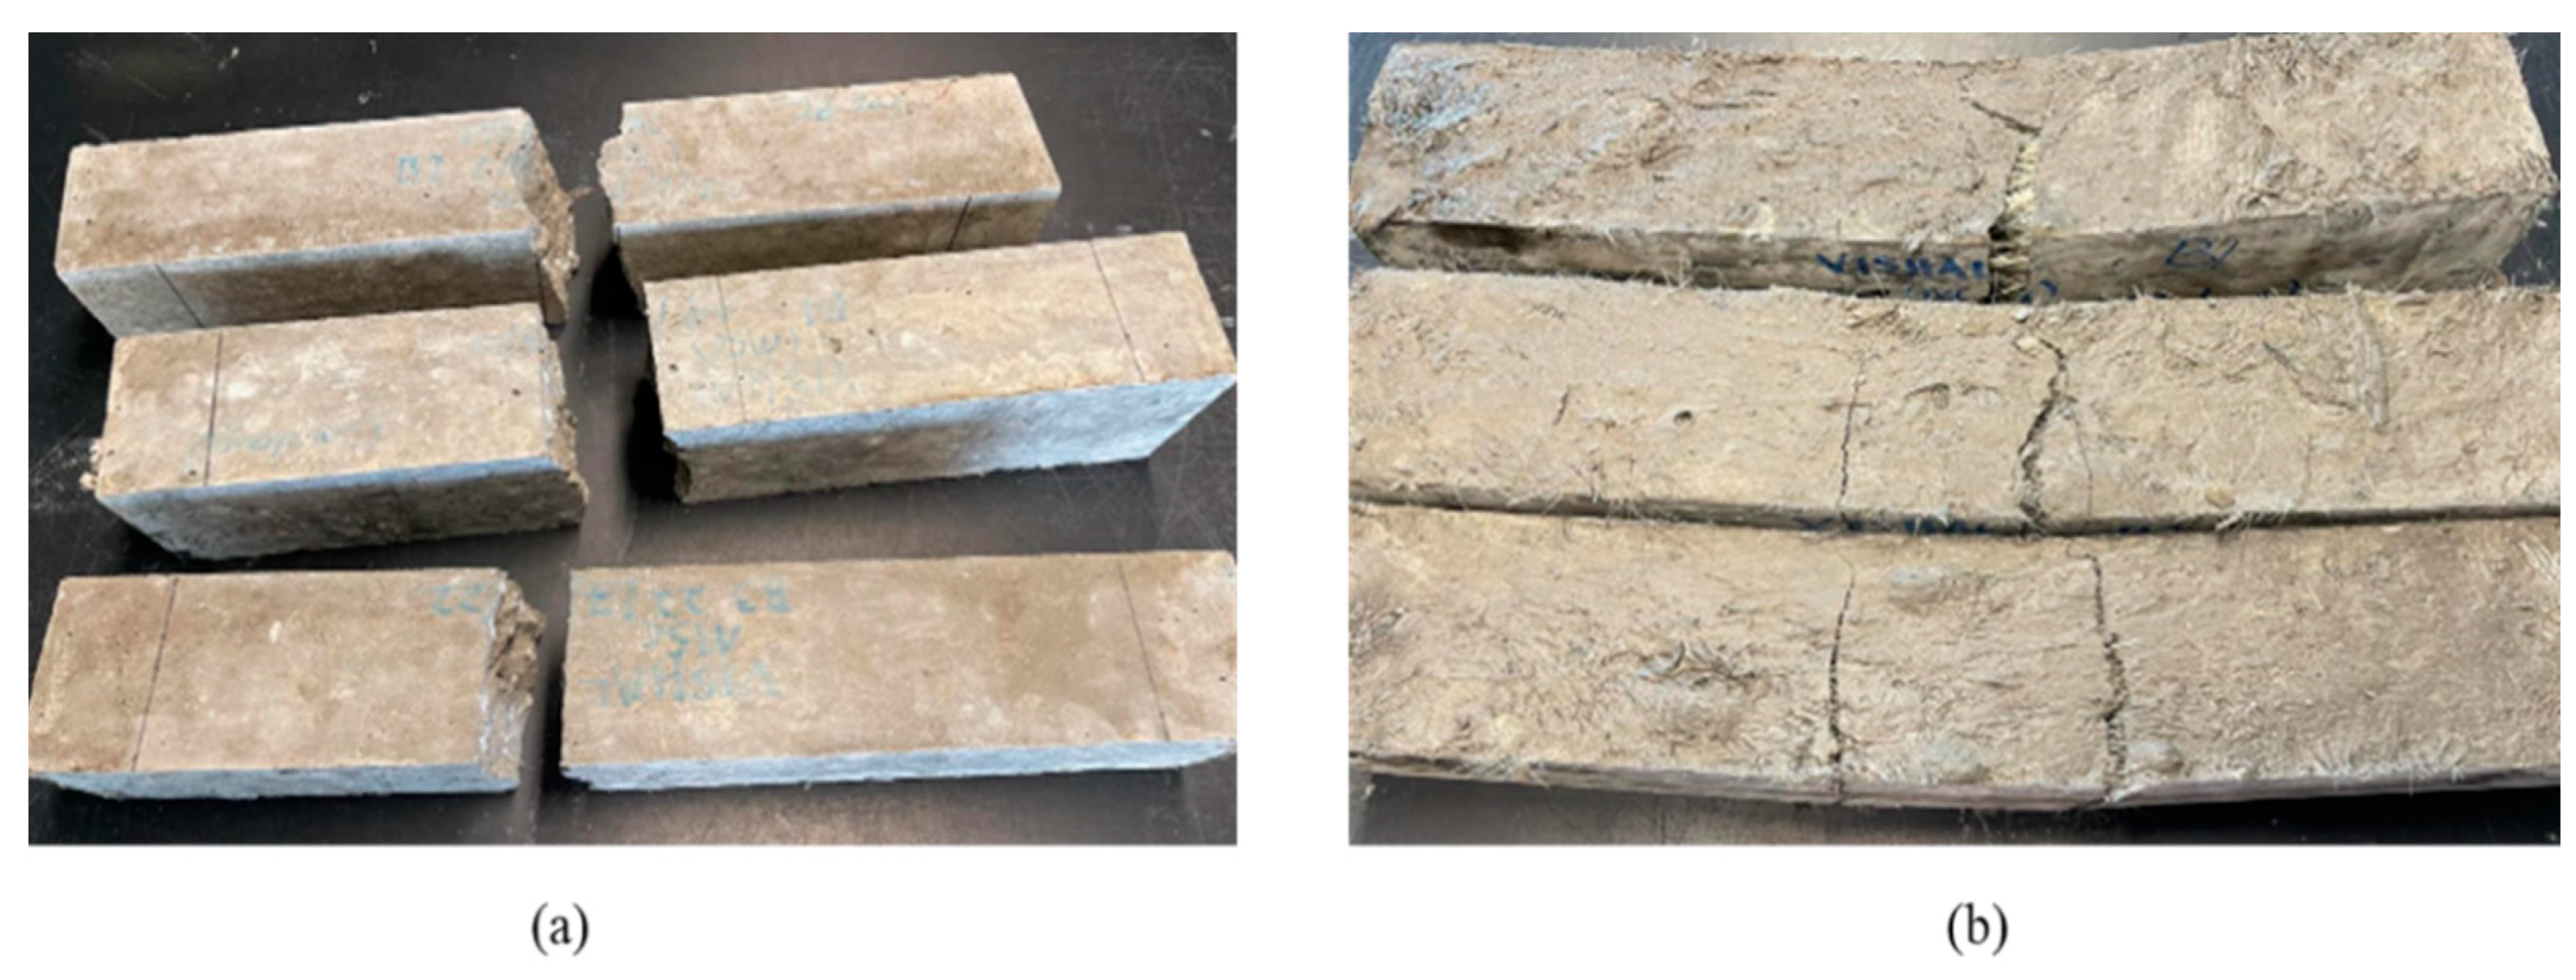
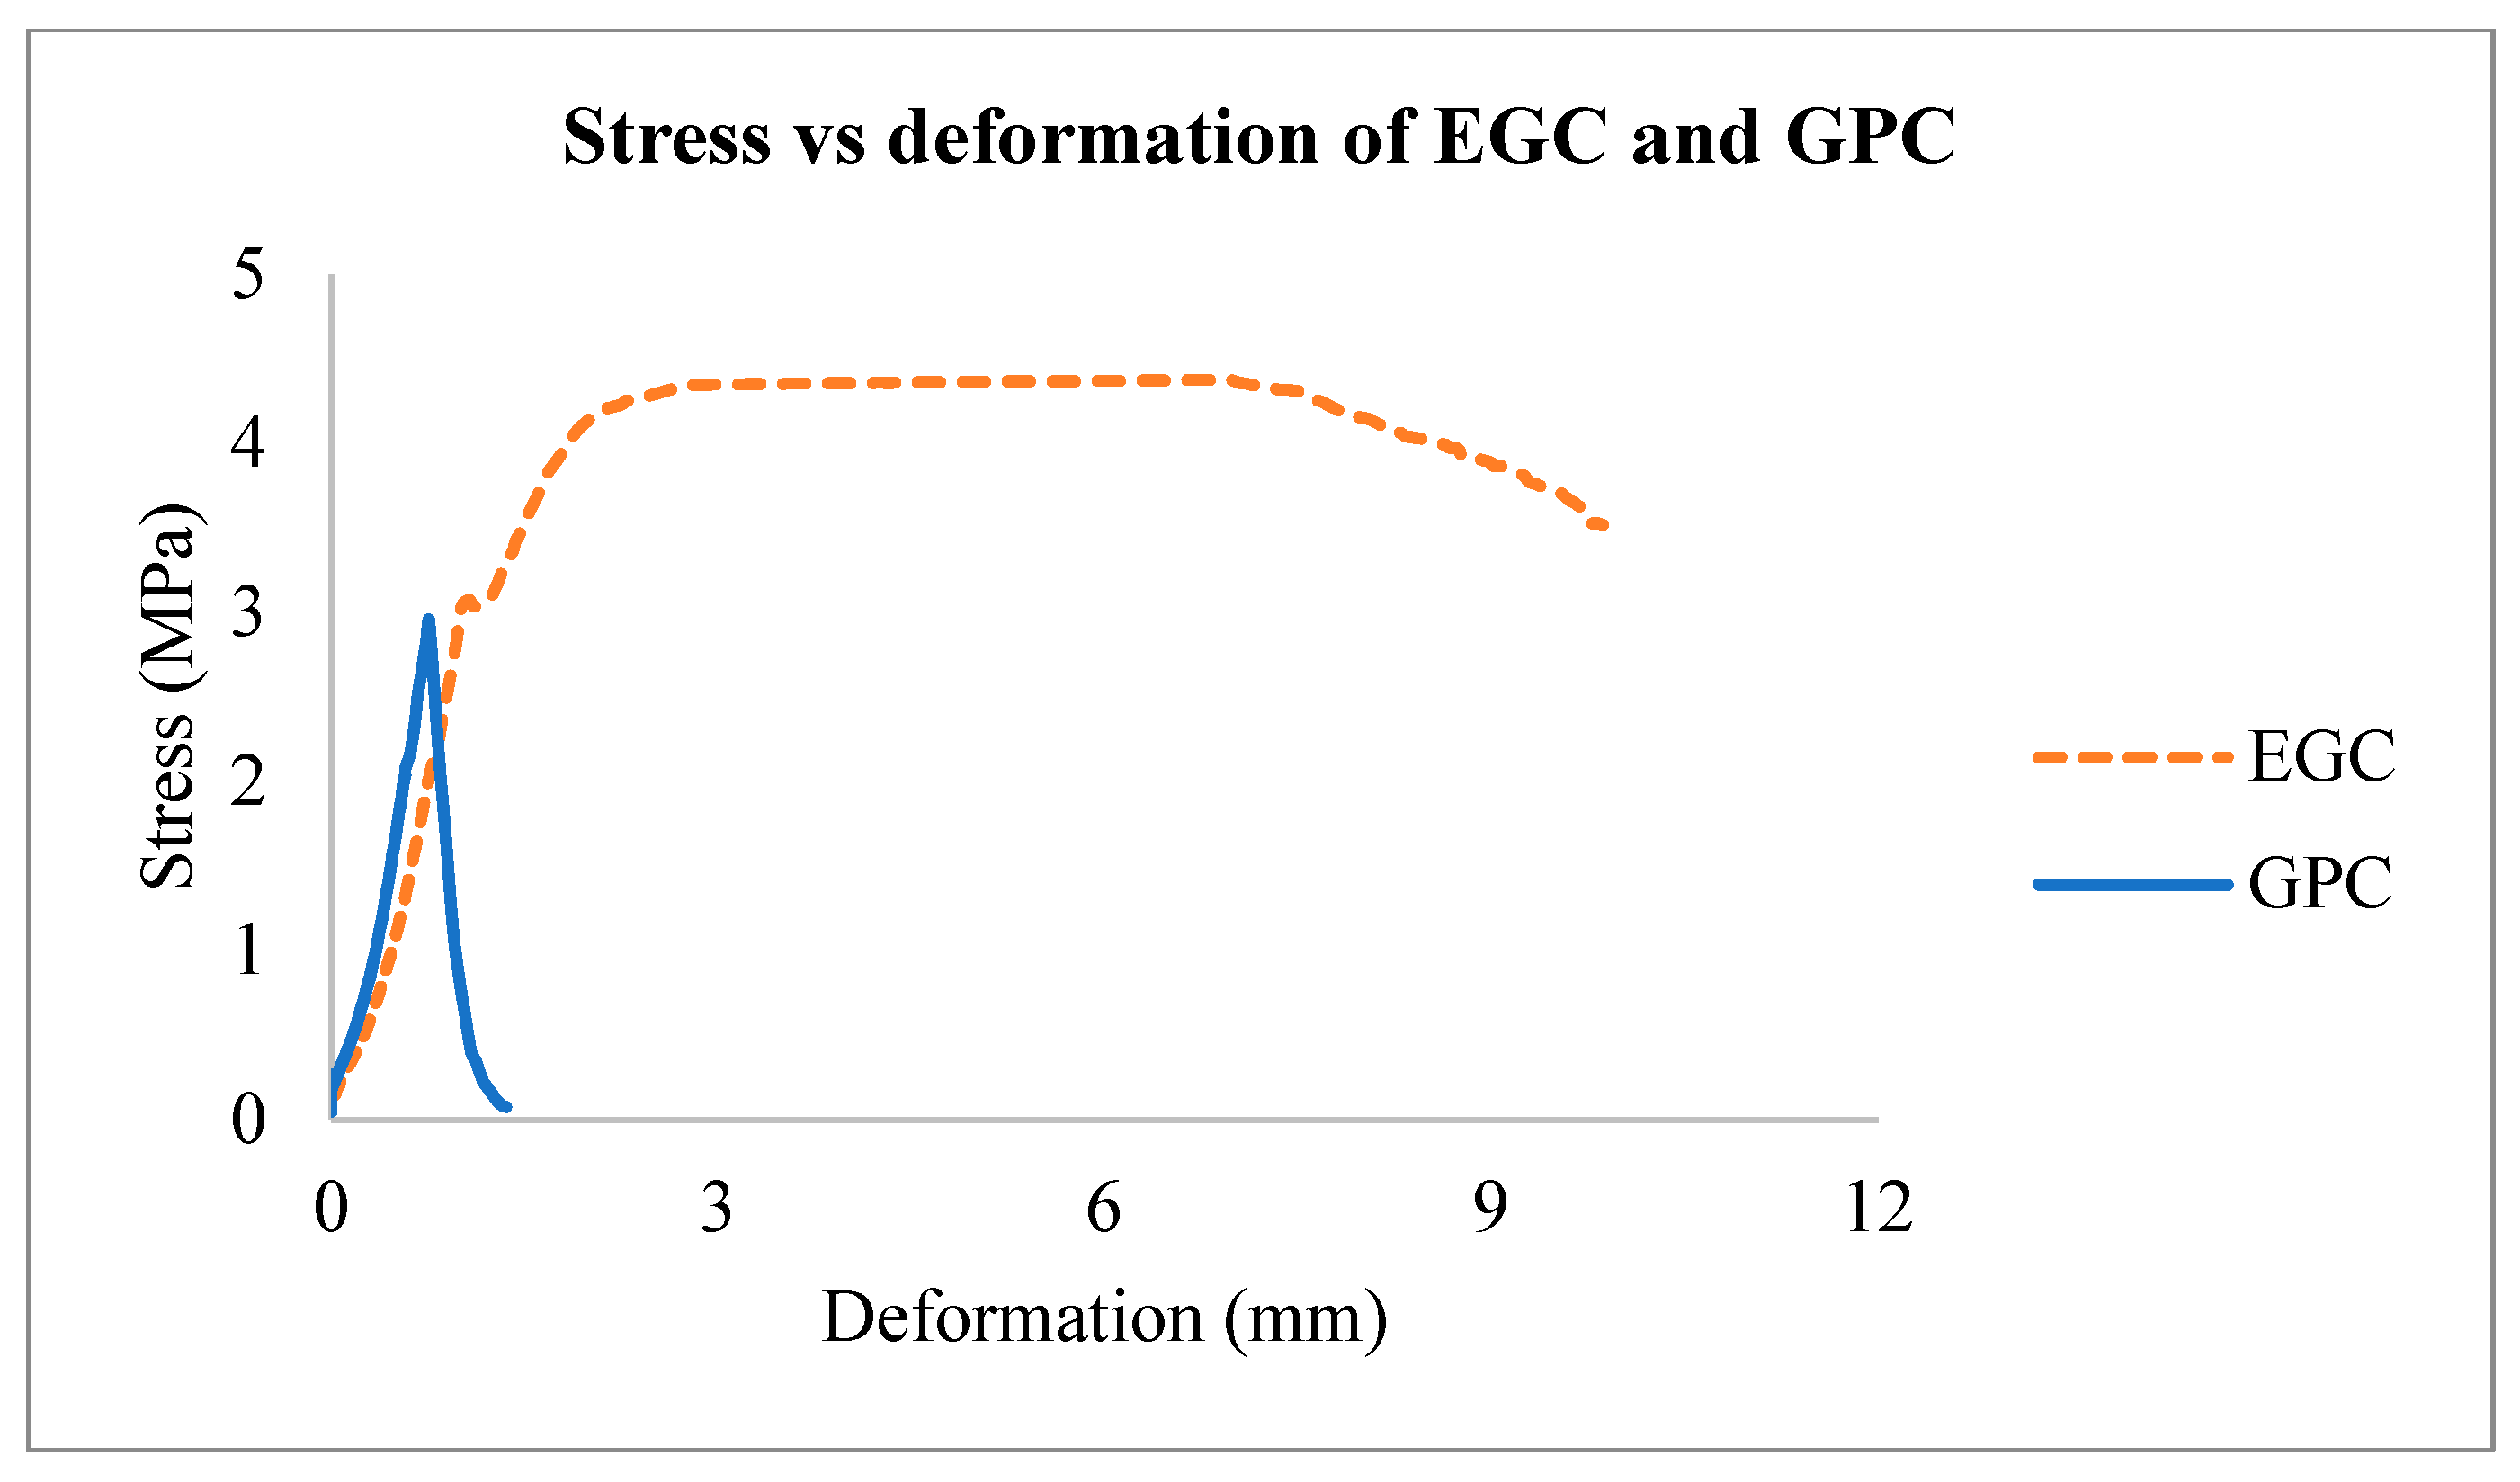
  • EGC demonstrated approximately 9% higher flexural strength and 150% higher tensile strength compared to GPC. Moreover, EGC exhibited higher ductility, as evidenced by the presence of multiple cracks before failure in tension and flexure, whereas GPC specimens exhibited no fine cracks before failure. The presence of PVA fibres in the EGC matrix enhanced the bridging effect in the beams, indicating that EGC is more ductile with good strain hardening properties.
  • The average bond strength of EGC was observed to be higher than that of GPC for both embedment length and rebar diameter parameters.
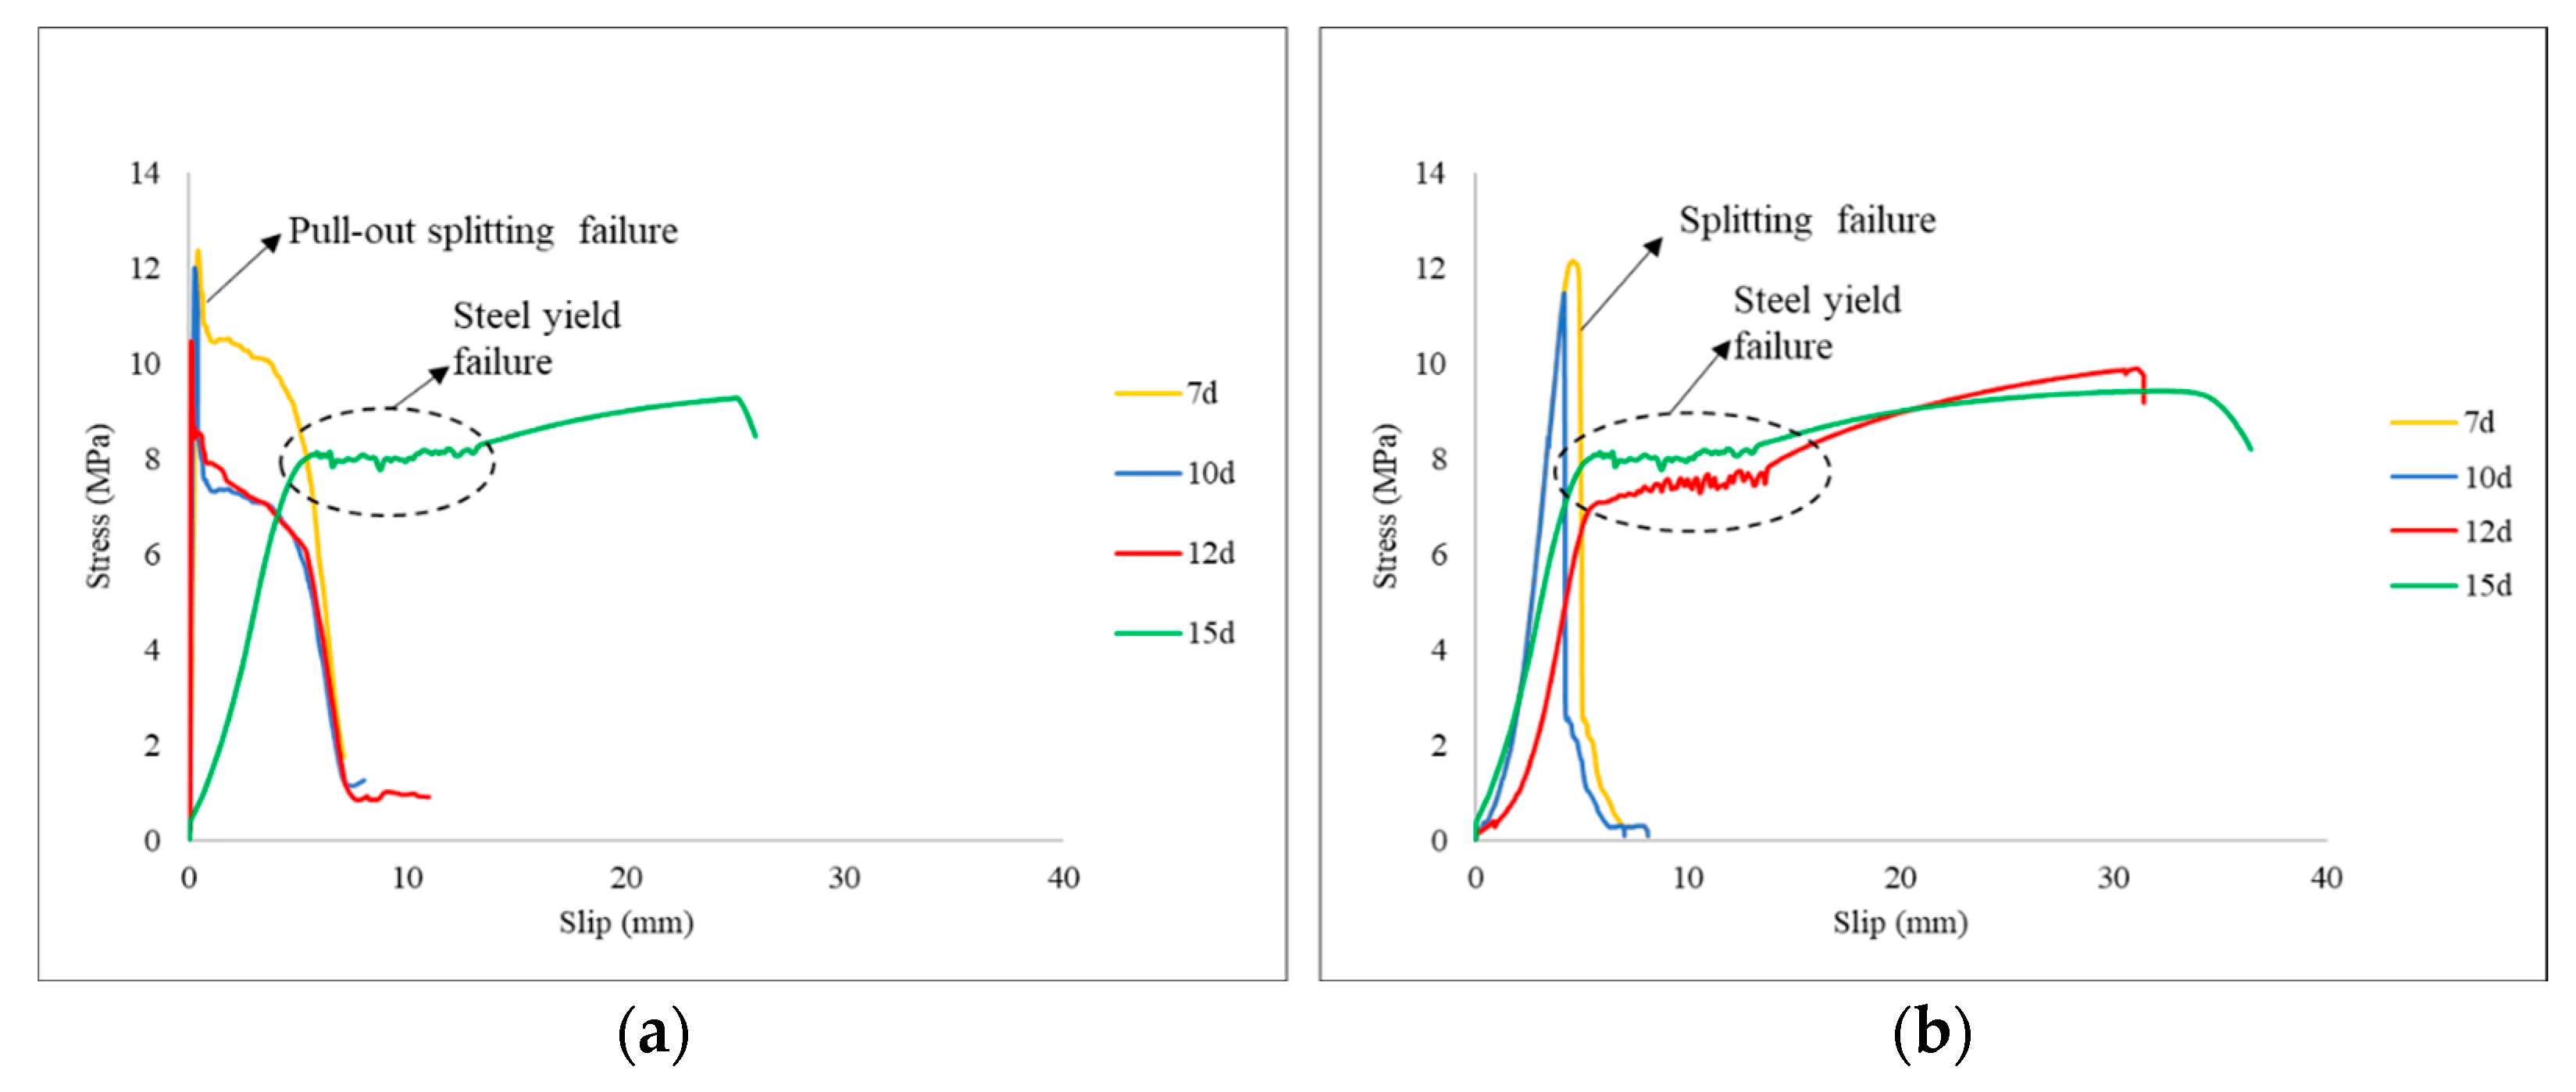
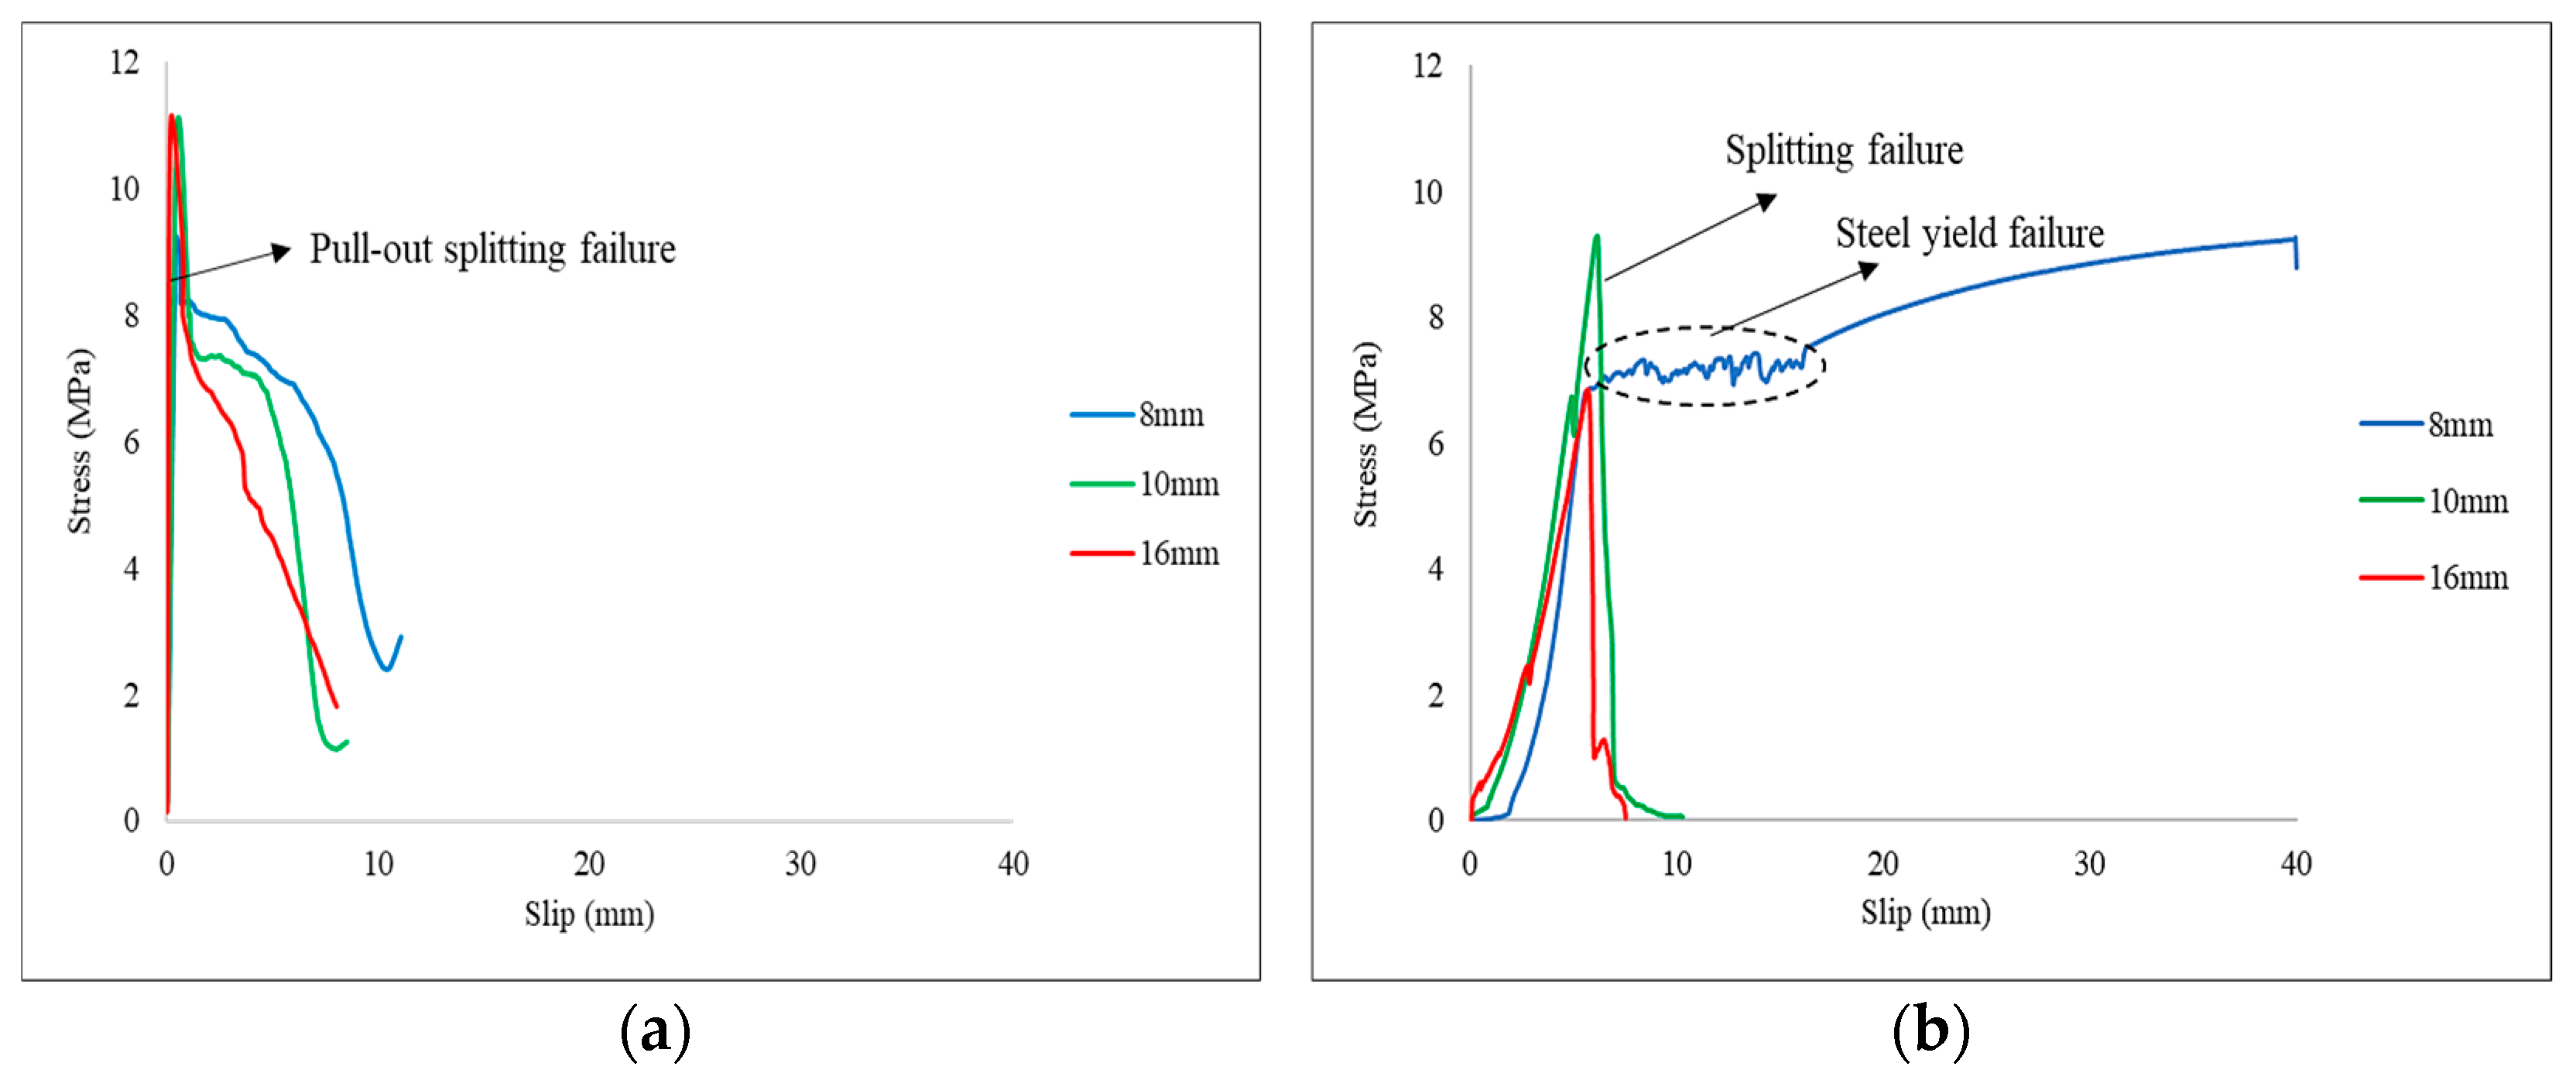
  • According to the results, it was noticed that, as the embedment length of rebar increases, the bond strength of EGC decreases. This is mainly due to the increases in the non-uniform transfer of bond stress along the rebar. Other than that, the bond strength of EGC rises with the increase in rebar diameter. The increase in rebar diameter influences the relative bond area between the rebar and concrete which indirectly influence the bond behaviour and bond strength of EGC.
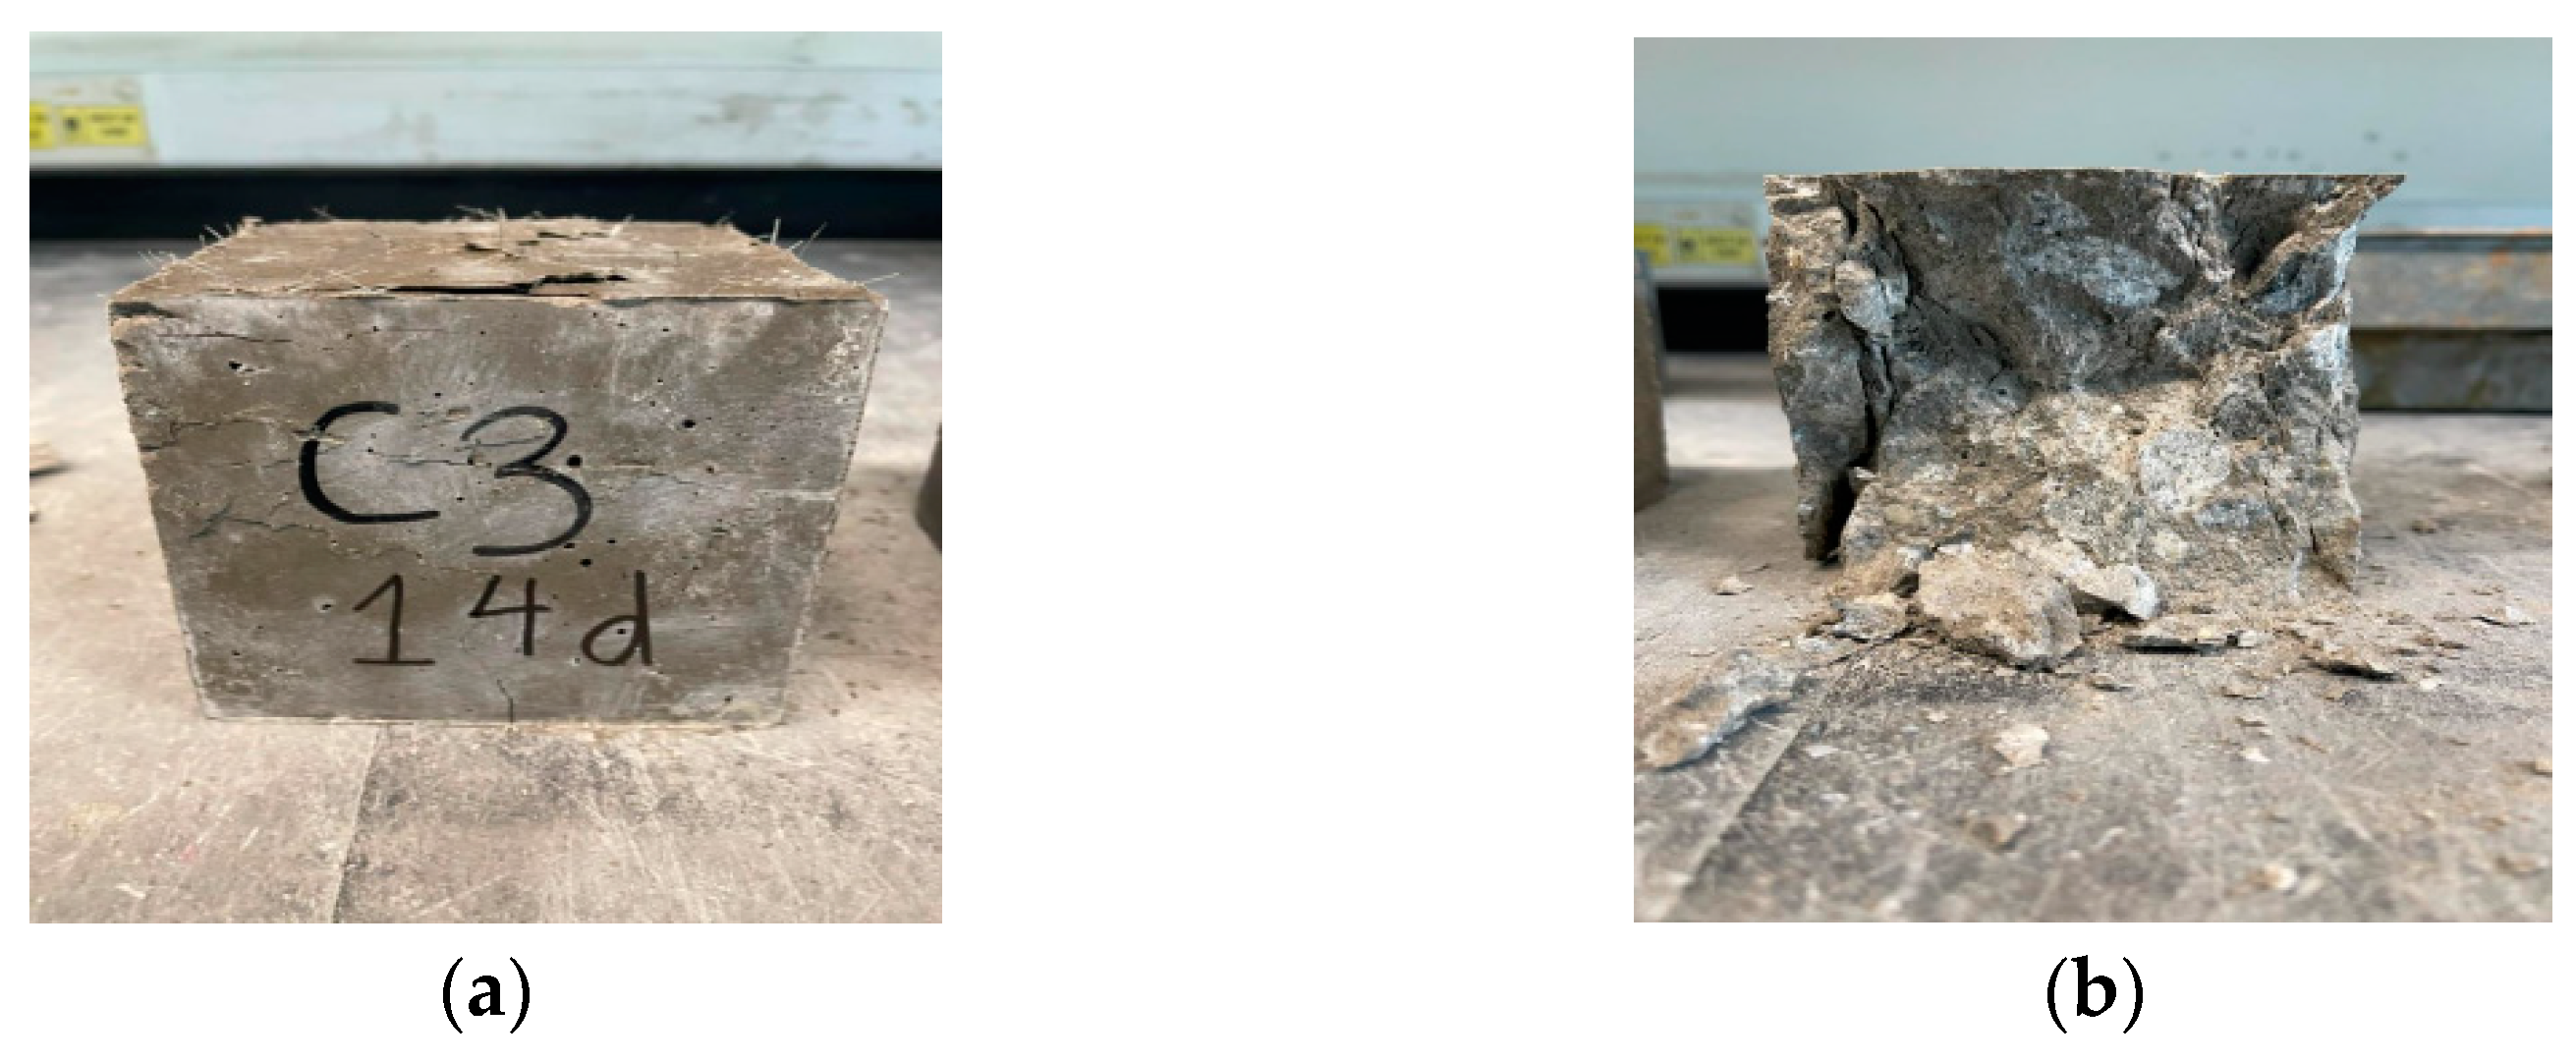
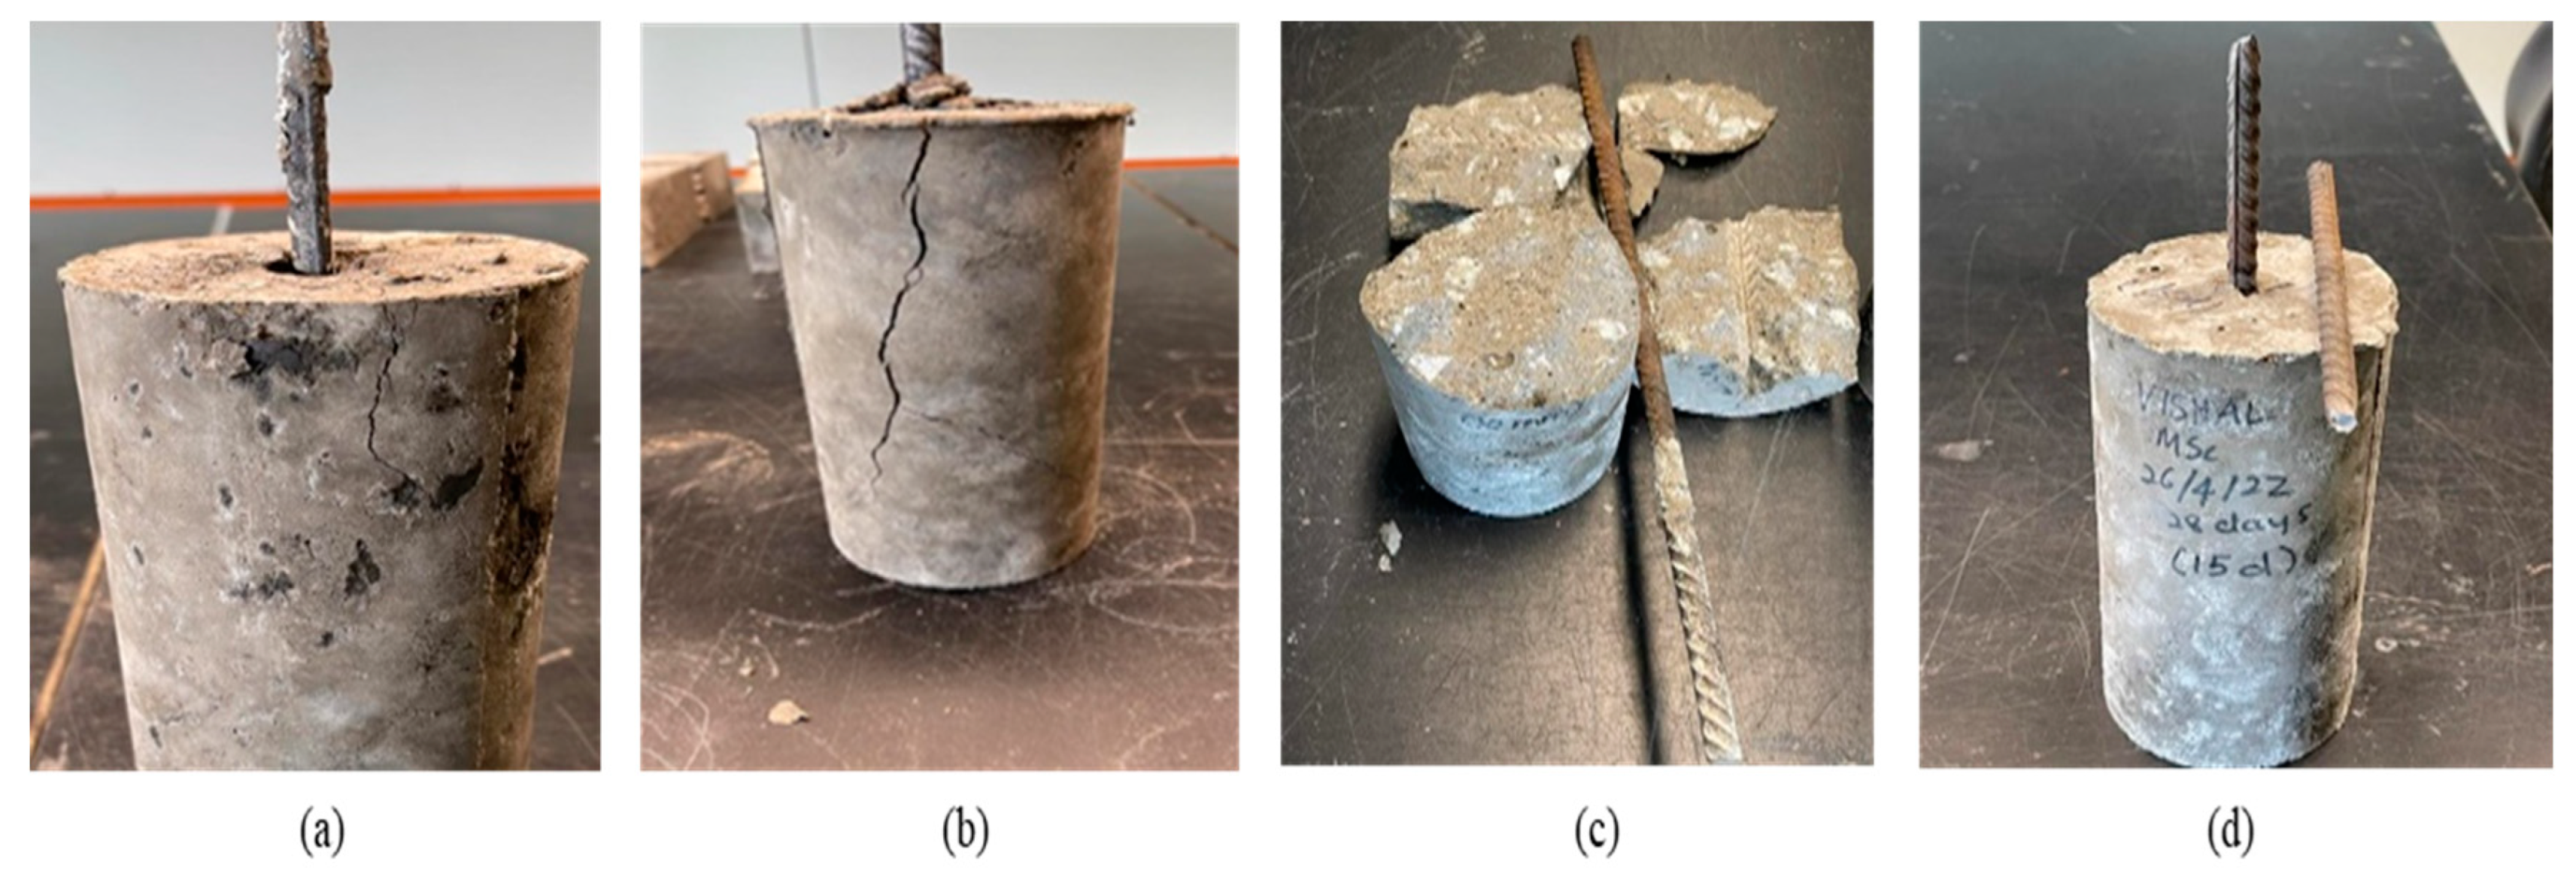
  • Based on the failure modes, it has been denoted that EGC specimens exhibit ductile failure modes by failing in pull-out or pull-out splitting failure, while GPC specimens fails in brittle nature by failing in splitting mode.
  • Based on the bond stress–slip curve, which is influenced by the bond failure modes, it could be denoted that EGC specimen produces better bonding strength compared to GPC specimen. This is supported by the pattern of the stress–slip curve in the descending branch of EGC which has a steady and gradual decrease rather than a sudden drop which can be observed in the descending branch of GPC specimen.

Author Contributions

Methodology, A.S.A.; Validation, A.A.-F.; Investigation, V.A.R. and E.N.J.; Writing—original draft, V.A.R.; Writing—review & editing, E.N.J. and A.S.A.; Visualization, A.A.-F.; Supervision, E.N.J. All authors have read and agreed to the published version of the manuscript.

Funding

This research was funded by Universiti Teknologi PETRONAS Malaysia under grant number YUTP 015LC0-345.

Data Availability Statement

No new data were created or analyzed in this study. Data sharing is not applicable to this article.

Acknowledgments

The authors would like to express their gratitude for the financial assistance they have received from the Universiti Teknologi PETRONAS Malaysia under grant number YUTP 015LC0-345.

Conflicts of Interest

The authors declare no conflict of interest. The funders had no role in the design of the study; in the collection, analyses, or interpretation of data; in the writing of the manuscript; or in the decision to publish the results.

References

  1. Zhang, Z.; Provis, J.L.; Reid, A.; Wang, H. Geopolymer foam concrete: An emerging material for sustainable construction. Constr. Build. Mater. 2014, 56, 113–127. [Google Scholar] [CrossRef]
  2. Asghar, R.; Khan, M.A.; Alyousef, R.; Javed, M.F.; Ali, M. Promoting the green Construction: Scientometric review on the mechanical and structural performance of geopolymer concrete. Constr. Build. Mater. 2023, 368, 130502. [Google Scholar] [CrossRef]
  3. Zahid, M.; Shafiq, N. Effects of Sand/Fly Ash and the Water/Solid Ratio on the Mechanical Properties of Engineered Geopolymer Com-posite and Mix Design Optimization. Minerals 2020, 10, 333. [Google Scholar] [CrossRef]
  4. Nath, P.; Sarker, P.K. Effect of GGBFS on setting, workability and early strength properties of fly ash geopolymer concrete cured in ambient condition. Constr. Build. Mater. 2014, 66, 163–171. [Google Scholar] [CrossRef]
  5. Luhar, I.; Luhar, S. A Comprehensive Review on Fly Ash-Based Geopolymer. J. Compos. Sci. 2022, 6, 219. [Google Scholar] [CrossRef]
  6. Al-Majidi, M.H.; Lampropoulos, A.; Cundy, A.; Meikle, S. Development of geopolymer mortar under ambient temperature for in situ applications. Constr. Build. Mater. 2016, 120, 198–211. [Google Scholar] [CrossRef]
  7. Adak, D.; Sarkar, M.; Mandal, S. Effect of nano-silica on strength and durability of fly ash based geopolymer mortar. Constr. Build. Mater. 2014, 70, 453–459. [Google Scholar] [CrossRef]
  8. Afroughsabet, V.; Ozbakkaloglu, T. Mechanical and durability properties of high-strength concrete containing steel and polypropylene fibers. Constr. Build. Mater. 2015, 94, 73–82. [Google Scholar] [CrossRef]
  9. Ohno, M.; Li, V.C. A feasibility study of strain hardening fiber reinforced fly ash-based geopolymer composites. Constr. Build. Mater. 2014, 57, 163–168. [Google Scholar] [CrossRef]
  10. Zhang, N.; Yan, C.; Li, L.; Khan, M. Assessment of fiber factor for the fracture toughness of polyethylene fiber reinforced geopolymer. Constr. Build. Mater. 2022, 319, 1–18. [Google Scholar]
  11. Ganesan, N.; Abraham, R.; Deepa Raj, S. Durability characteristics of steel fibre reinforced geopolymer concrete. Constr. Build. Mater. 2015, 93, 471–476. [Google Scholar] [CrossRef]
  12. Abbas, A.-G.N.; Abdul Aziz, F.N.A.; Abdan, K.; Nasir, N.A.M.; Huseien, G.F. Experimental evaluation and statistical modeling of kenaf fiber-reinforced geopolymer concrete. Constr. Build. Mater. 2023, 367, 130228. [Google Scholar] [CrossRef]
  13. Liu, Y.; Zhang, Z.; Shi, C.; Zhu, D.; Li, N.; Deng, Y. Development of ultra-high performance geopolymer concrete (UHPGC): Influence of steel fiber on mechanical properties. Cem. Concr. Compos. 2020, 112, 103670. [Google Scholar] [CrossRef]
  14. Humur, G.; Cevik, A. Effects of hybrid fibers and nanosilica on mechanical and durability properties of lightweight engineered geopoly-mer composites subjected to cyclic loading and heating–cooling cycles. Constr. Build. Mater. 2022, 326, 126846. [Google Scholar] [CrossRef]
  15. Xu, S.; Malik, M.A.; Qi, Z.; Huang, B.; Li, Q.; Sarkar, M. Influence of the PVA fibers and SiO2 NPs on the structural of fly ash based sustainable geopolymer. Constr. Build. Mater. 2018, 164, 238–245. [Google Scholar] [CrossRef]
  16. Zhang, P.; Wei, S.; Wu, J.; Zhang, Y.; Zheng, Y. Investigation of mechanical properties of PVA fiber-reinforced cementitious composites under the coupling effect of wet-thermal and chloride salt environment. Case Stud. Constr. Mater. 2022, 17, e01325. [Google Scholar] [CrossRef]
  17. Cai, J.; Pan, J.; Han, J.; Wang, X. Mechanical Behaviors of Metakaolin-Based Engineered Geopolymer Composite under Ambient Curing Condition. J. Mater. Civ. Eng. 2022, 34, 04022152-1–04022152-12. [Google Scholar] [CrossRef]
  18. Alraeeini, A.S.; Nikbakht, E. Corrosion effect on the flexural behaviour of concrete filled steel tubulars with single and double skins using engineered cementitious composite. Structures 2022, 44, 1680–1694. [Google Scholar] [CrossRef]
  19. Al-Majidi, M.H.; Lampropoulos, A.; Cundy, A.B. Tensile properties of a novel fibre reinforced geopolymer composite with enhanced strain hardening characteristics. Compos. Struct. 2017, 168, 402–427. [Google Scholar] [CrossRef]
  20. Abbas, A.-G.N.; Abdul Aziz, F.N.A.; Abdan, K.; Nasir, N.A.M.; Huseien, G.F. A state-of-the-art review on fibre-reinforced geo-polymer composites. Constr. Build. Mater. 2022, 330, 127187. [Google Scholar] [CrossRef]
  21. Attaurrehman; Khan, A.; Hasnain, M. A Review of Structural Performance of Geopolymer Concrete. Glob. Sci. J. 2019, 7, 447–455. [Google Scholar]
  22. Law, D.W.; Adam, A.A.; Molyneaux, T.K.; Patnaikuni, I.; Wardhono, A. Long term durability properties of class F fly ash geopolymer concrete. Mater. Struct. 2015, 48, 721–731. [Google Scholar] [CrossRef]
  23. Shaikh, F. Deflection hardening behaviour of short fibre reinforced fly ash based geopolymer composites. Mater. Des. 2013, 50, 674–682. [Google Scholar] [CrossRef]
  24. Bernal, S.; Gutierrez, R.D.; Delvasto, S.; Rodriguez, E. Performance of an alkali-activated slag concrete reinforced with steel fibers. Constr. Build. Mater. 2010, 24, 208–214. [Google Scholar] [CrossRef]
  25. ASTM C618; Standard Specification for Coal Fly Ash and Raw or Calcined Natural Pozzolan for Use as a Mineral Admixture in Concrete. ASTM International: West Conshohocken, PA, USA, 2001.
  26. ASTM C1437-15; Standard Test Method for Flow of Hydraulic Cement Mortar. ASTM International: West Conshohocken, PA, USA, 2015.
  27. BS 1881-116:1983; Method for Determination of Compressive Strength of Concrete Cubes. British Standards Institution: London, UK, 1983.
  28. BS 1881-117:1983; Method for Determination of Tensile Splitting Strength. British Standards Institution: Pilsen, Czech Republic, 1983.
  29. ASTM D3039; Standard Test Method for Tensile Properties of Polymer Matrix Composite Materials. ASTM International: West Conshohocken, PA, USA, 2017.
  30. ASTM D5045-14; Standard Test Methods for Plane-Strain Fracture Toughness and Strain Energy Release Rate of Plastic Materials. ASTM International: West Conshohocken, PA, USA, 2014.
  31. ASTM C234-91a; Standard Test Method for Comparing Concretes on the Basis of the Bond Developed with Reinforcing Steel (Withdrawn 2000). ASTM International: West Conshohocken, PA, USA, 1991.
  32. Rafiza, A.; Zarina, Y.; Al Bakri, A.M.; Subaer, S.; Khairunnisa, M.; Wazien, A.W.; Teng, T. Effect of Ground Granulated Blast Slag (GGBS) to the Bonding Strength of Geopolymer Mortar as Repairing Material. J. Adv. Manuf. Technol. (JAMT) 2020, 14, 57–64. [Google Scholar]
  33. Fauzi, A.; Nuruddin, M.F.; Malkawi, A.B.; Abdullah, M.M.A.B.; Mohammed, B.S. Effect of Alkaline Solution to Fly Ash Ratio on Geopolymer Mortar Properties. Cem. Concr. Compos. 2017, 733, 85–88. [Google Scholar] [CrossRef]
  34. BS 1881-125:1986; Testing Concrete Methods for Mixing and Sampling Fresh Concrete in the Laboratory. British Standards Institution: London, UK, 2013.
  35. Abdulkadir, I.; Mohammed, B. RSM analysis and study on the 6 months compressive strength development and shrinkage behaviour of high volume fly ashrubberized ecc (hvfa-recc). Int. J. Adv. Res. Eng. Technol. 2020, 11, 965–980. [Google Scholar]
  36. Rahim, N.I.; Mohammed, B.S.; Abdulkadir, I.; Dahim, M. Effect of Crumb Rubber, Fly Ash, and Nanosilica on the Properties of Self-Compacting Concrete Using Response Surface Methodology. Materials 2022, 15, 1501. [Google Scholar] [CrossRef]
  37. Zhang, L.; Yue, Y. Influence of waste glass powder usage on the properties of alkali-activated slag mortars based on response surface methodology. Constr. Build. Mater. 2018, 181, 527–534. [Google Scholar] [CrossRef]
  38. Appana, P.M.; Mohammed, B.S.; Abdulkadir, I.; Ali, M.A.; Liew, M. Mechanical, Microstructural and Drying Shrinkage Properties of NaOH-Pretreated Crumb Rubber Concrete: RSM-Based Modeling and Optimization. Materials 2022, 15, 2588. [Google Scholar] [CrossRef]
  39. ASTM C1437-01; Standard Test Method for Flow of Hydraulic Cement Mortar. ASTM International: West Conshohocken, PA, USA, 2015.
  40. Shaikh, F.U.A. Tensile and flexural behaviour of recycled polyethylene terephthalate (PET) fibre reinforced geopolymer composites. Constr. Build. Mater. 2020, 245, 118438. [Google Scholar] [CrossRef]
  41. Zahid, M.; Shafiq, N.; Razak, S.N.A.; Tufail, R.F. Investigating the effects of NaOH molarity and the geometry of PVA fibers on the post-cracking and the fracture behavior of engineered geopolymer composite. Constr. Build. Mater. 2020, 265, 120295. [Google Scholar] [CrossRef]
  42. Deepa Raj, S.; Bhoopesh, J. Strength and behaviour of recycled aggregate geopolymer concrete beams. Adv. Concr. Constr. 2017, 5, 145–154. [Google Scholar] [CrossRef]
  43. Saranya, P.; Nagarajan, P.; Shashikala, A. Behaviour of GGBS-dolomite geopolymer concrete beam-column joints under monotonic loading. Structures 2020, 25, 47–55. [Google Scholar] [CrossRef]
  44. Cai, J.; Pan, J.; Han, J.; Lin, Y.; Sheng, Z. Impact behaviours of engineered geopolymer composite exposed to elevated temperatures. Constr. Build. Mater. 2021, 312, 125421. [Google Scholar] [CrossRef]
  45. Deng, M.; Pan, J.; Sun, H. Bond behavior of steel bar embedded in Engineered Cementitious Composites under pullout load. Constr. Build. Mater. 2018, 168, 705–714. [Google Scholar] [CrossRef]
  46. Yoo, D.-Y.; Shin, H.-O. Bond performance of steel rebar embedded in 80–180 MPa ultra-high-strength concrete. Cem. Concr. Compos. 2018, 93, 206–217. [Google Scholar] [CrossRef]
  47. Rahman, S.K.; Al-Ameri, R. Experimental Investigation and Artificial Neural Network Based Prediction of Bond Strength in Self-Compacting Geopolymer Concrete Reinforced with Basalt FRP Bars. Appl. Sci. 2021, 11, 4889. [Google Scholar] [CrossRef]
  48. Xiao, J.; Long, X.; Ye, M.; Jiang, H.; Liu, L.; Zhai, K. Experimental Study of Bond Behavior Between Rebar and PVA-Engineered Cementitious Composite (ECC) Using Pull-Out Tests. Front. Mater. 2021, 8, 633404. [Google Scholar] [CrossRef]
  49. Cong, X.; Zhou, W.; Elchalakani, M. Bond performance of reinforced alkali-activated composites using water-quenched slag as alternative fine aggregates. Structures 2020, 24, 137–150. [Google Scholar] [CrossRef]
  50. Solyom, S.; Benedetti, M.D.; Guadagnini, M.; Balazs, G.L. Effect of temperature on the bond behaviour of GFRP bars in concrete. Compos. Part B Eng. 2020, 183, 107602. [Google Scholar] [CrossRef]
  51. Tekle, B.H.; Khennane, A.; Kayali, O. Bond Properties of Sand-Coated GFRP Bars with Fly Ash–Based Geopolymer Concrete. J. Compos. Constr. 2016, 20, 04016025. [Google Scholar] [CrossRef]
  52. Shin, H.-O.; Lee, S.-J.; Yoo, D.-Y. Bond Behavior of Pretensioned Strand Embedded in Ultra-High Performance Fiber-Reinforced Concrete. Int. J. Concr. Struct. Mater. 2018, 12, 34. [Google Scholar] [CrossRef]
  53. Paswan, R.; Rahman, M.R.; Singh, S.; Singh, B. Bond Behavior of Reinforcing Steel Bar and Geopolymer Concrete. J. Mater. Civ. Eng. 2020, 32, 04020167. [Google Scholar] [CrossRef]
  54. Nurwidayati, R.; Ekaputri, J.; Triwulan; Suprobo, P. Bond Behaviour between Reinforcing Bars and Geopolymer Concrete By Using Pull-out Test. MATEC Web Conf. 2019, 280, 04008. [Google Scholar] [CrossRef]
Figure 1. Preparation of sodium hydroxide solution; (a) sodium hydroxide powder is weighed, (b) sodium hydroxide is dissolved in water, (c) prepared sodium hydroxide solution is left to cool.
Buildings 13 03020 g001
Figure 2. PVA fibres.
Buildings 13 03020 g002
Figure 3. (a) 100 mm cube specimen, (b) prism beam and dog-bone specimens, (c) cylinder specimens.
Buildings 13 03020 g003
Figure 4. Ductility index curve.
Buildings 13 03020 g004
Figure 5. Predicted versus actual plot for compressive strength (CS).
Buildings 13 03020 g005
Figure 6. 2D-Contour plot.
Buildings 13 03020 g006
Figure 7. 3D- Response surface diagram for CS.
Buildings 13 03020 g007
Figure 8. Optimisation ramp. Red circle indicates the input variables while blue circle indicates the response.
Buildings 13 03020 g008
Figure 9. 3D-response surface diagram for desirability.
Buildings 13 03020 g009
Figure 10. Flowability of EGC (a) before removal of mould; (b) after removal of mould; (c) after 25 drops.
Buildings 13 03020 g010
Figure 11. Compressive strength of EGC and GPC.
Buildings 13 03020 g011
Figure 12. Failure modes after compression test, (a) EGC and (b) GPC.
Buildings 13 03020 g012
Figure 13. (a) Crack pattern of EGC and (b) Crack pattern of GPC.
Buildings 13 03020 g013
Figure 14. (a) Prism beam of GPC, (b) Prism beam of EGC.
Buildings 13 03020 g014
Figure 15. Stress vs. deformation of EGC and GPC.
Buildings 13 03020 g015
Figure 16. EGC cylinder after pull-out test: (a) pull-out failure, (b) pull-out splitting failure, (c) yielding failure.
Buildings 13 03020 g016
Figure 17. GPC cylinder after pull-out test: (a) pull-out failure, (b) pull-out splitting failure, (c) splitting of concrete failure, (d) yielding failure.
Buildings 13 03020 g017
Figure 18. (a) Stress-slip curves of EGC with varying embedment length on 28 days. (b) Stress-slip curves of GPC with varying embedment length on 28 days.
Buildings 13 03020 g018
Figure 19. (a) Stress-slip curves of EGC with varying rebar diameter on 28 days. (b) Stress-slip curves of GPC with varying rebar diameter on 28 days.
Buildings 13 03020 g019
Table 1. Materials used for experiment.
No.Materials
1Fly ash (Type F)
2Fine aggregate (silica sand)
3Silica fume
4GGBS
5Sodium hydroxide
6Sodium silicate
7Polyvinyl alcohol (PVA) fibre
8Water
9Superplasticizer
Table 2. Characteristic of PVA fibres.
FibreLength (mm)Diameter (mm)Volume (mm3)Young’s Modulus (GPa)Elongation (%)Density (g/cm3)Fibre Strength (MPa)
PVA180.20.572791.31600
Table 3. Rebar specimens.
ParameterSize of Specimen (mm)Diameter of Rebar (mm)Embedment Length of Rebar (mm)
Embedment length100 × 2001070 (7 d)
100(10 d)
120 (12 d)
150 (15 d)
Rebar diameter100 × 2008100 (10 d)
10100 (10 d)
16100 (10 d)
Table 4. Trial mixes of EGC.
MIX IDSilica Fume Replacement (%)Molarity (M)Sodium Silicate to Sodium Hydroxide Ratio
15102.5
210102.5
315102.5
420102.5
Table 5. Mix design of EGC.
Materialkg/m³
Fine Aggregate (Silica sand)330
Class F Fly Ash880
Ground granulated blast furnace slag (GGBS)220
Silica fume176
Sodium Hydroxide Solution (10 M)112
Sodium Silicate Solution283
Water88
Polyvinyl Alcohol fibre (PVA)26
Superplasticizer17.6
Molarity of NaOH = 10 M; (400 g of NaOH pellets in 1 L of H2O).
Table 6. Mix design of GPC.
Materialkg/m³
Coarse aggregates 1092
Fine Aggregate (Silica sand)588
Class F Fly Ash440
Sodium Hydroxide Solution (10 M)90
Sodium Silicate Solution180
Table 7. RSM design responses.
StandardRunFactor 1: A: GGBS%Factor 2: B:AL/FAResponse 1: CS (MPa)
5115.85790.446.48
92300.459.89
13200.353.5
84300.54142117.29
6544.14210.430.11
26400.335.42
37200.526.29
138300.453.35
79300.25857941.33
410400.535.83
1211300.455.74
1012300.452.71
1113300.449.19
Table 8. Model Validation Parameters.
ParametersCS
Std. Dev.4.26
Mean42.86
C.V. %9.95
R20.9372
PRESS556.65
−2 Log Likelihood66.55
Adjusted R20.8924
Predicted R20.7254
Adeq. Precision11.6356
BIC81.94
AICc92.55
Std. Dev.: Standard deviation; C.V.: coefficient of variance; PRESS: predicted residual error sum of squares; R2: Coefficient of determination; Adeq. Precision: Adequate precision; BIC: Bayesian Information Criteria; AICc: Akaike’s Information Criteria.
Table 9. ANOVA results.
ResponseSourceSum of SquaresdfMean SquareF-Valuep-Value
1900.165380.0320.90.0004
A-GGBS125.541125.546.90.034
B-AL/FA462.041462.0425.410.0015
Compressive Strength (Mpa)AB190.721190.7210.490.0143
A2336.131336.1318.490.0036
B2911191150.110.0002
Residual127.27718.18
Lack of Fit64.48321.491.370.3725
Pure Error62.79415.7
Cor Total2027.4312
Table 10. Goals and results of optimisation.
Factors A: GGBSB:AL/FACS
Valueminimum200.317.29
maximum400.559.89
Goal in rangein rangemaximize
Optimisation results 24.710.35157.092
Desirability 0.934 (93%)
Table 11. Experimental validation.
ResponsePredictedExperimentalError
CS (MPa)57.09258.2352%
Table 12. Compressive strength of EGC.
MIX IDSilica Fume Replacement (%)1st Day Compressive Strength (MPa)7th Day Compressive Strength (MPa)14th Day Compressive Strength of (MPa)28th Day Compressive Strength of (MPa)
155.78.419.6630.67
2106.58182239.2
3159.2222.1837.2840.29
42012.5846.4247.4560
Table 13. Compressive strength of GPC.
MIX ID1st Day Compressive Strength (MPa)7th Day Compressive Strength (MPa)14th Day Compressive Strength of (MPa)28th Day Compressive Strength of (MPa)
1527.2645.6258.8
Table 14. Experimental results of EGC.
Age DaysFlexural Strength of EGC (MPa)Average Strength (MPa)Failure Displacement (mm)Yielding Displacement (mm)Ductility (mm)Compressive Strength (MPa)Tensile Strength (MPa)
286.0315.575414604.003
5.325313
5.368313
Table 15. Experimental results of GPC.
Age DaysFlexural Strength of GPC (MPa)Average Strength (MPa)Failure Displacement (mm)Yielding Displacement (mm)Ductility (mm)Compressive Strength (MPa)Tensile Strength (MPa)
284.9485.1370.80.61.358.81.6
5.3951.10.921.2
5.0671.351.11.2
Table 16. Bond strength of EGC and GPC with varying rebar diameter at 28 days.
No.Bar Diameter (mm)Embedded Length (mm)Bond Strength of EGC (MPa)Bond Strength of GPC (MPa)
181009.229.10
21010.869.29
31610.966.85
Table 17. Bond strength of EGC and GPC with varying embedment length at 28 days.
No.Bar Diameter (mm)Embedment Length (mm)Bond Strength of EGC (MPa)Bond Strength of GPC (MPa)
1107012.2712.13
210011.9211.47
312010.459.47
41509.417.43
Table 18. Bond failure modes of EGC and GPC.
Bond Failure Modes
ParametersEGCGPC
28 Days28 Days
Rebar diameter
8 mmP-OY
10 mmP-SS
16 mmP-SS
Embedment length
7 DP-OS
10 DP-SS-S
12 DP-SY
15 DYY
(P-S), Pull-out splitting failure; (P-O), Pull-out failure; (S), Splitting of concrete failure; (S-S), Splitting with longitudinal cracks; (Y), Yielding failure.
Disclaimer/Publisher’s Note: The statements, opinions and data contained in all publications are solely those of the individual author(s) and contributor(s) and not of MDPI and/or the editor(s). MDPI and/or the editor(s) disclaim responsibility for any injury to people or property resulting from any ideas, methods, instructions or products referred to in the content.

