Article

Analysis of the Impact of Layout Mode on the Wind Environment of Dormitories in Coastal Universities in Southern Fujian Province

1
School of Architecture and Urban-Rural Planning, Fuzhou University, Fuzhou 350025, China
2
School of Architecture and Civil Engineering, Xiamen University, Xiamen 361005, China
*
Author to whom correspondence should be addressed.
Buildings 2023, 13(12), 3030; https://doi.org/10.3390/buildings13123030
Submission received: 26 October 2023 / Revised: 28 November 2023 / Accepted: 2 December 2023 / Published: 5 December 2023
(This article belongs to the Section Building Energy, Physics, Environment, and Systems)

Abstract

:
The building wind environment in coastal areas is highly complex and variable, particularly during winter when strong winds prevail. Understanding the influence of winter winds on human comfort and addressing health issues caused by wind noise in human settlements are very valuable research topics. This study focuses on developing strategies to optimize the wind environment in dormitory buildings located in the southern coastal area, where prolonged periods of strong winds have a significant impact. Specifically, we investigated the current wind in the teacher–student dormitory at Jinjiang Campus of Fuzhou University through questionnaire surveys and field measurements. Additionally, computational fluid dynamics (CFD) simulations were employed to evaluate different dormitory layouts. The research results indicate that it is preferable to position the dormitory areas downwind of large-scale buildings, adopt a staggered layout instead of a regular determinant layout to mitigate the narrow tube effect, avoid designing large-scale squares in the center of the dormitory areas, and enclose the dormitory groups with low-level corridors. These findings provide valuable guidance for the optimizing of winter windproof designs of university buildings located in the same climatic zone along the southeast coast.

1. Introduction

The comfort of dormitory buildings, a crucial component of campus infrastructure, is directly related to the physical and emotional wellbeing of faculty and students [1,2,3]. In the temperate and rainy southern coastal region of China, characterized by hot summers and mild winters, the spatial design of dormitory buildings often incorporates open corridors and enclosed courtyards. However, despite the prevalence of severe winter winds and the variability caused by the shifting sea and land winds, the complicated buildings’ wind environment in this coastal region has received little attention. Due to site constraints, the layout of the dormitory area is also more compact than that of other building types. This compactness often leads to various issues, such as poor ventilation, the accumulation of pollutants, and uncomfortably hot conditions in summer [4]. For this reason, it is extremely important to conduct research on how the layouts of dormitory buildings affect the outdoor wind environment in the coastal region of southern Fujian.
The following three research techniques are frequently employed in the subject of building wind environment: (1) wind tunnel testing; (2) field measurement; (3) computational fluid dynamics (CFD). Among these techniques, the wind tunnel test is an older technique for simulating the wind environment, but it is not very popular nowadays due to the expensive and rigorous testing requirements. Tetsu Kubot [5] used wind tunnel experiments to investigate the connection between building density and pedestrian height–averaged wind speed in a residential environment. The study demonstrated a significant relationship between the average wind speed ratio and total building coverage and suggested a strategy for developing guidelines to achieve a reasonable wind environment in residential regions. Wider buildings have a negative impact on the surrounding pedestrian layer of the high-rise building, according to C.W. Tsang [6], who conducted a wind tunnel study on the wind environment of the pedestrian layer around a high-rise building and conducted a wind tunnel test for various building sizes, spacings, and podiums. It was determined that taller buildings improve the ventilation close to the ground level whereas wider structures have a negative impact on the natural ventilation of the nearby pedestrian levels. Physical measurements made on-site offer first-hand knowledge of the data, but they have their limits. The technique is time consuming, the number of test points is constrained, and the limitations are restricted to existing buildings. As a result, the approach is frequently used to back up the outcomes of numerical models and wind tunnel tests. Ayman Al-Quraan [7] examined the potential wind energy in cities using wind tunnel tests and on-site measurements, comparing the findings of the tests with the data, and confirming the accuracy of the calculations run in the wind tunnel. A high-resolution wind resource assessment technique for difficult terrain was developed by B.W. Yan [8] using field observations and CFD. Numerical simulation is a useful tool for studying the external wind environment since it is convenient and less expensive than the first two methods. The impacts of buildings with various heights, densities, and layouts on the target building were examined by Shu ZhengWen [9] using the Reynolds-averaged Navier Stokes (RANS) equations of the k-turbulence model. In order to examine the effects of building layout and envelope features on the danger of pollution exposure for pedestrians and neighboring road dwellers, Dongjin Cui [10] researched the influence of building layout and envelope characteristics on pedestrians and surrounding buildings by CFD. The findings demonstrated that overhangs, followed by balconies, had the greatest impact on the rate of change of personal intake fraction (P_IF).C-Y [11] tested four RANS turbulence models (standard k-ε model, Realizable model, RNG model, and SST model) with wind tunnel measurements and discovered that the standard k-ε and RNG k-ε models performed well in terms of wind flow accuracy. Therefore, this work adopts the conventional k-ε model. Furthermore, the questionnaire surveys, which can provide a relatively accurate description of human subjective comfort, are widely used in the studies of building microclimate connected to the wind environment [12,13].
Extensive academic research has been conducted on the relationship between building layout and the outdoor wind environment. The research objects encompass residential buildings, urban neighborhoods, office buildings, campus buildings, and other structures. Table 1 presents a summary of the relevant literature. Taking residential areas in extremely cold regions as an example, Shui Tt [14] analyzed the wind environment of various building plans. The study revealed that the hybrid and closed design are more suitable for residential areas in extremely cold locations. According to a study by Zhang and H [15], courtyard layouts in coastal towns can help high-rise residential buildings in tropical areas better withstand tropical cyclones. Xiaotong Zhang [16] discovered that for high-rise residential buildings in the Chongqing, the lifting position at both ends or in the middle has the most significant effect on increasing the MVR of the lifting in order to control the wind–heat environment around high-rise office buildings. Fusuo Xu [17] investigated the impact of typical street-facing public building forms on the ventilation performance of streets and squares and discovered that the square space formed by the setback of a public building can form a wide space, which is conducive to the intake of air. Nancy Y. [18] studied the role and relationship between geometric (form, orientation, size) and material (type, volume) parameters. For campus buildings, Hong Jin [19] investigated the impact of street space morphology on the microclimate of the campus in severely cold areas using a university campus in Daqing City as an example. Liping Fan [20] investigated the coupling relationship between building and street space morphology. Based on the assessment of the literature, the majority of these studies has focused on high-rise offices, urban areas, and residential buildings. However, as important campus buildings, college dormitories have not received sufficient attention in wind environment research. Additionally, the majority of wind environment research has been conducted in China’s cold regions, hot summer and cold winter regions, with relatively fewer investigations conducted in hot summer and warm winter cities. As a result, there is an urgent need for further research into the optimization of the wind environment of dormitory buildings in the southern coastal region.
This study aims to investigate the impact of dormitory area layout on the building wind environment utilizing a combination of questionnaires, field measurements of wind environment, and CFD simulations. The research objective is the teacher–student dormitory at Jinjiang Campus of Fuzhou University. Prior to making on-site measurements to give the fundamental boundary conditions and validation data for the simulation on a typical winter day, a field survey was carried out to clarify the present status issue and collect the subjective evaluation of the users. Based on the on-site measured data, a CFD simulation model is then established to determine simulation schemes for different layouts. This model analyzes the wind environment data for different schemes in different seasons, identifies the factors affecting the wind environment of the dormitory buildings in the southern coastal area, proposes optimization strategies at the layout level, and provides scientific guidelines for the dormitory building design in the same climatic zone.

2. Materials and Methods
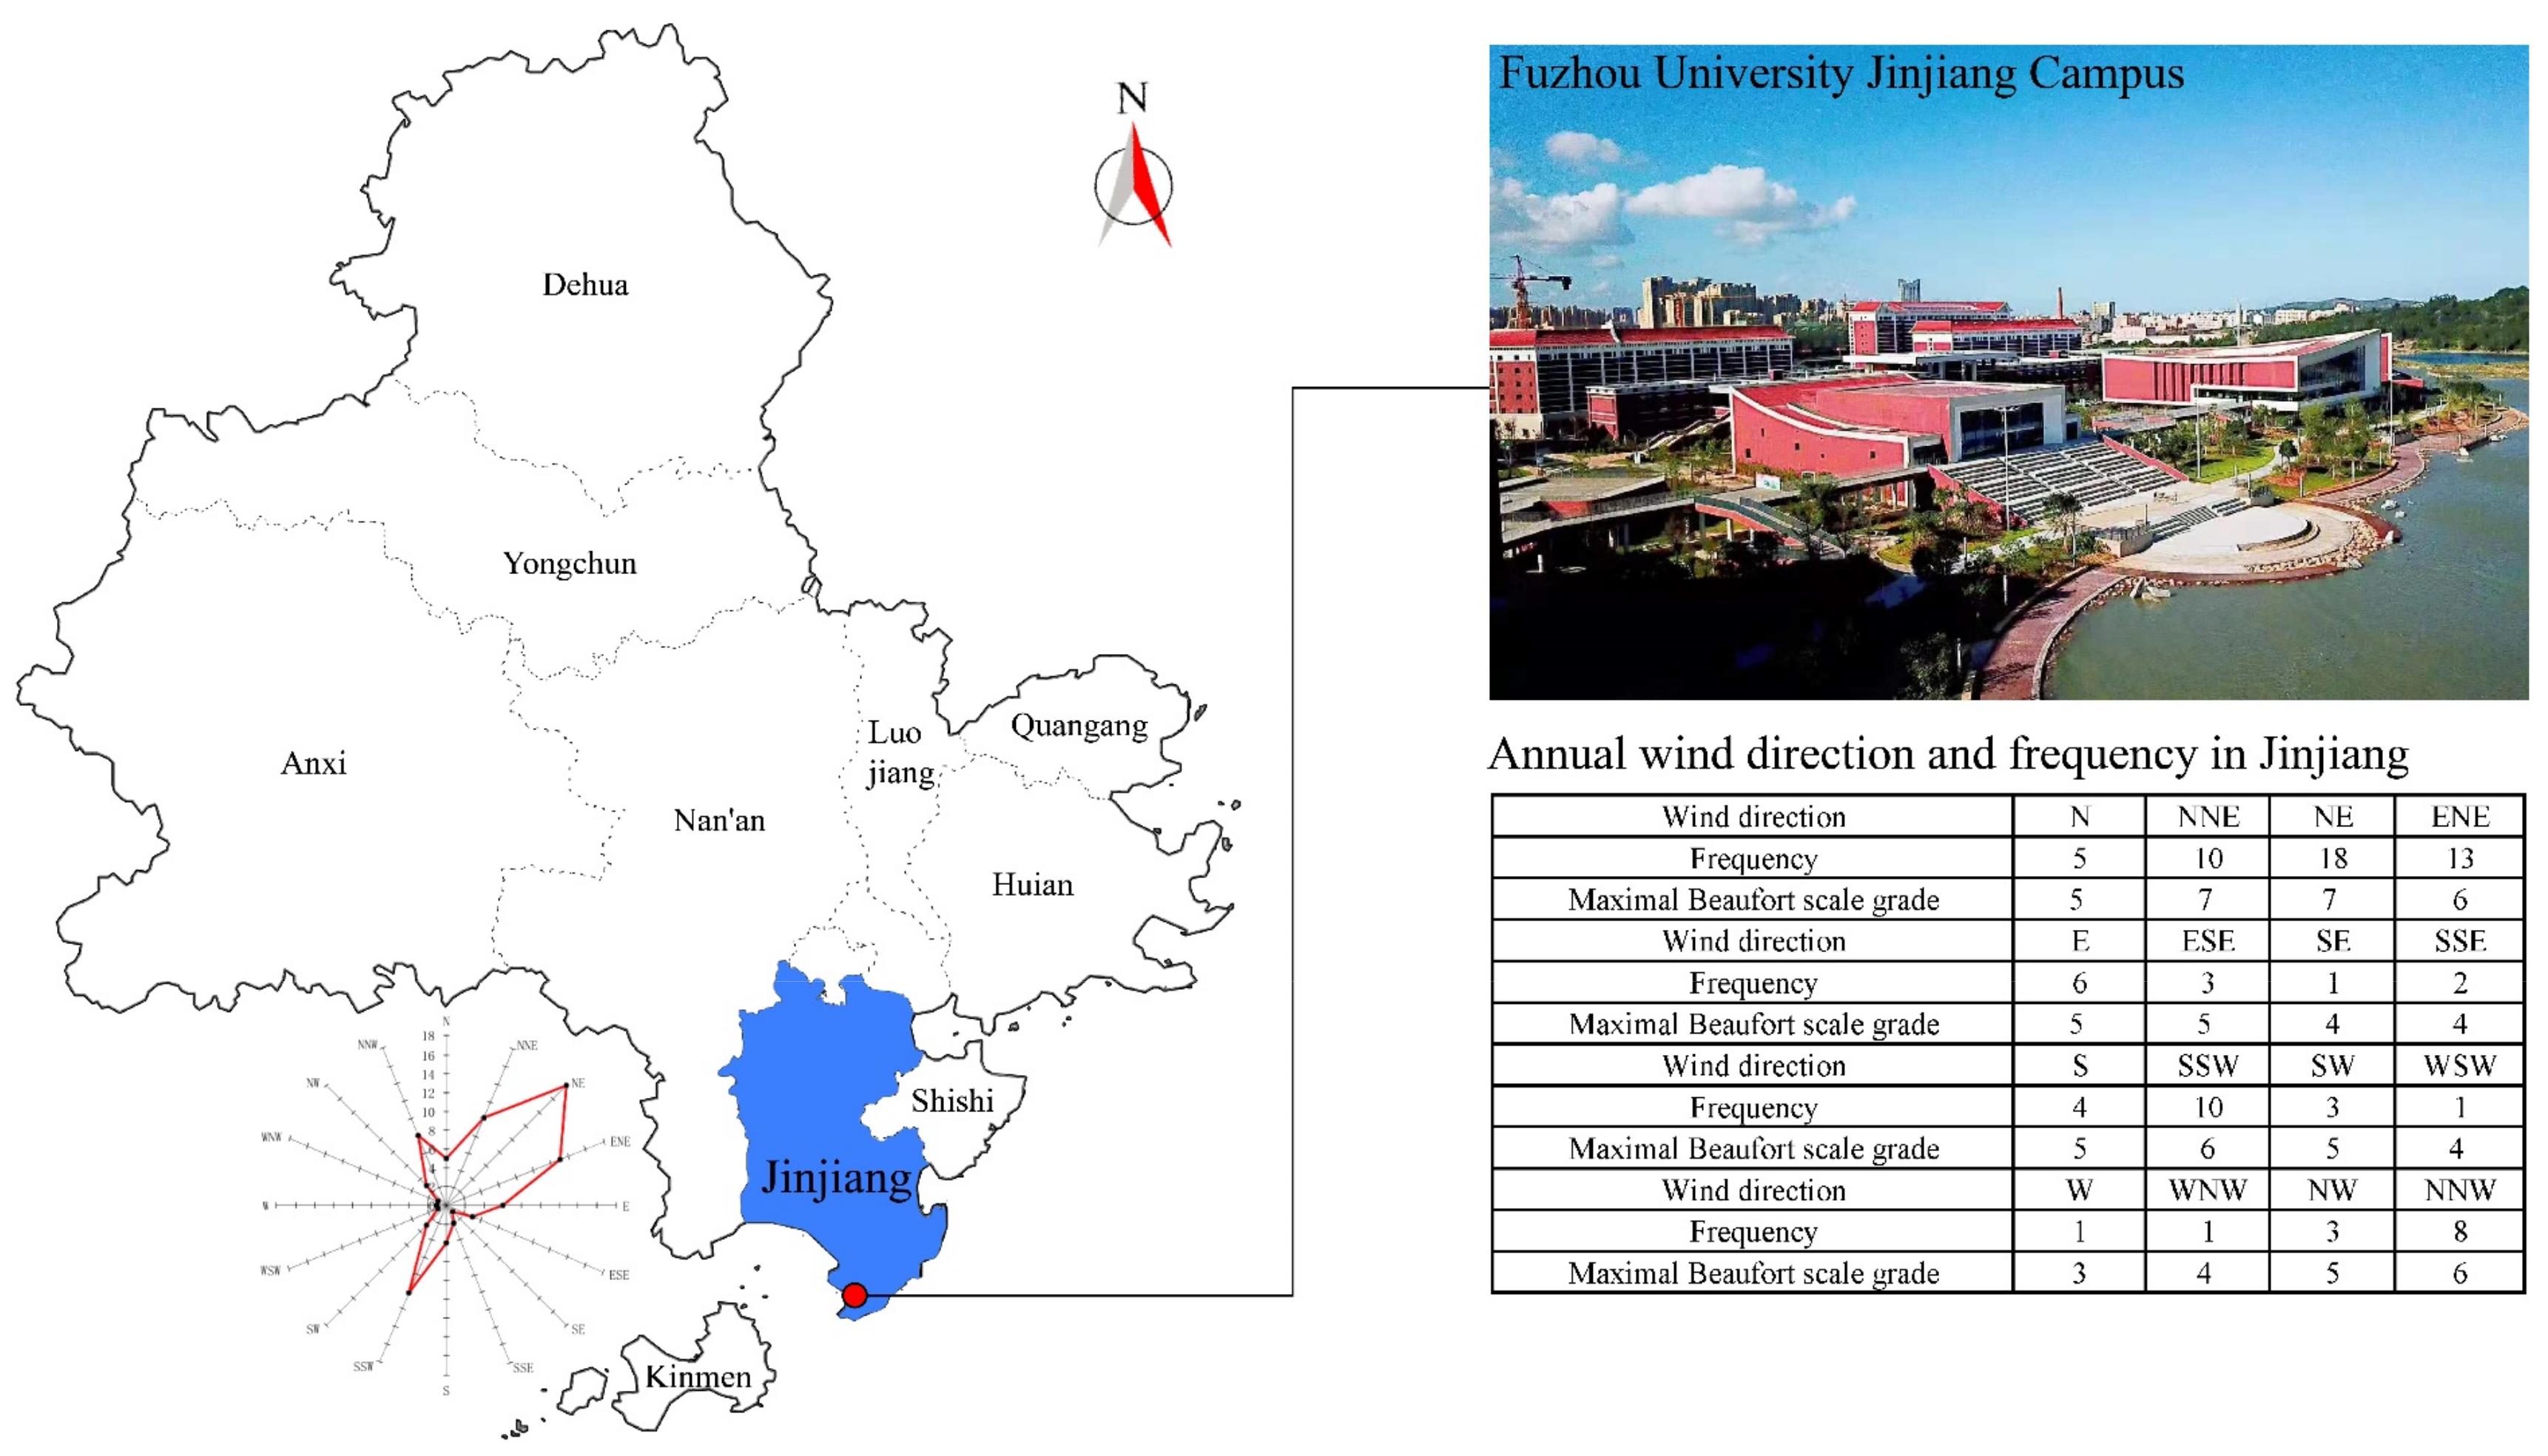
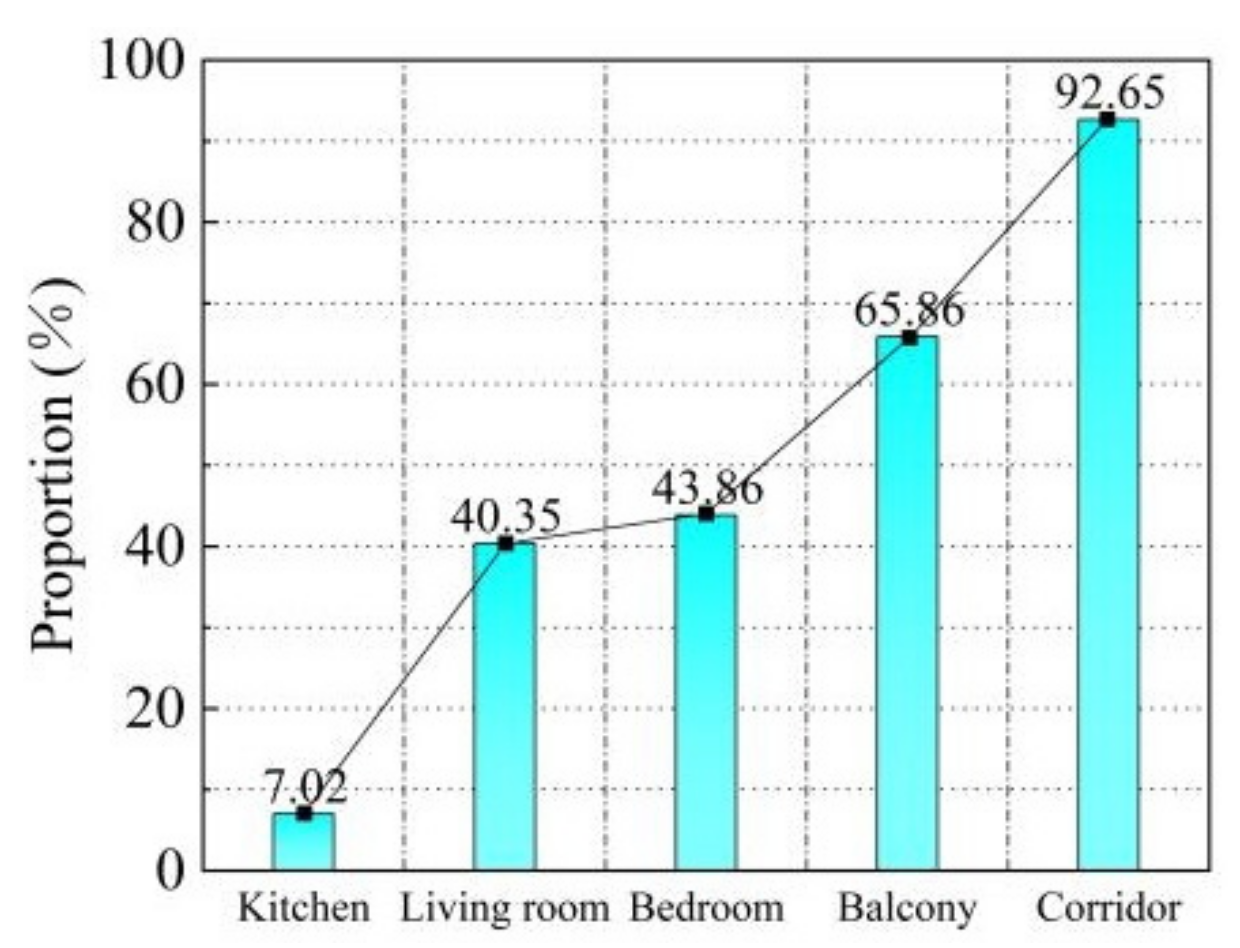
Jinjiang, located on the southeast coast of Fujian Province, has a subtropical monsoon climate with an average annual temperature of 21 °C. In winter, the predominant wind direction is to the northeast with an average wind speed of 2.62 m per second, whereas in summer, the predominant wind direction is to the southwest with an average wind speed of 2.27 m per second. The frequency of northeasterly winds (including NNE, NE, and ENE winds) throughout the year is about 41%. The maximum wind velocity value in these directions can reach Grade 7 on the Beaufort scale (13.9–17.1 m/s). Jinjiang Campus of Fuzhou University is located in Jinjing Town which is on the south part of Jinjiang City with developed transportation. The campus is located on the coastal plain (Figure 1). Approximately 1500 students are currently enrolled at the 1000-acre campus, which consists of faculties and institutions such as the Advanced Manufacturing College, Ocean College, College Students’ Entrepreneurship Education Park, and the Jinjiang Branch of National University Science and Technology Park. The campus structures are primarily comprised of red bricks and white stones, and their design is replete with characteristics of traditional Minnan residences. The teacher–student dormitories are located in the east living area of Jinjiang Campus, adjacent to the basketball court on the north, the stadium on the east, the dining hall on the south, and the undergraduate dormitory groups on the west (Figure 2).
On the north side of the teacher–student dormitory is the apartment teachers live in, and on the south side is the graduate student dormitory, which are connected by a 5 m tall grille corridor enclosing an open courtyard facing inward. The teachers’ apartment has a length of 67 m, a width of 15 m, a height of 30 m, and a total of 9 floors. The first floor of the apartment is raised for parking, while the second to fourth floors are designated as hospitality rooms for experts. The fifth to ninth floors are dormitories for teachers. Each standard floor consists of 12 single rooms and 2 suites, with open balconies in the south and open corridors in the north (Figure 3). The graduate student dormitory is a six-story multi-story building with the same length and width as the teachers’ apartment and a height of 22 m. The first floor serves as the service room, while the second to sixth floors accommodate the student dormitories. Each standard floor contains 16 quadruple rooms.

2.1. Questionnaire

Through the distribution of a questionnaire, a survey of the current status of the winter wind environment in the teacher–student dormitory was conducted. Due to the high vacancy rate of the graduate student dorms, the majority of survey respondents were residents of the teachers’ apartments, resulting in a male-to-female ratio of approximately 2:1. The questionnaire content included the following: (1) the age of the survey respondents, the floor they were on, and the location of the room; (2) evaluation of indoor and outdoor wind environment comfort in winter and ranking of dissatisfied spaces. To ensure that the survey space covers the users’ main daily activity area, the outdoor space includes the passageway around the teacher–student dormitory and courtyard, and the indoor space includes the north side corridor and all functional rooms. There can be multiple choices for dissatisfaction spaces, and the ranking is obtained by the proportion which is shown in percents; the higher the proportion, the higher the dissatisfaction of the space, thus collecting residents’ subjective perception of comfort, and identification of existing issues in the current status of the wind environment [28].
There are ten sets of vacant rooms out of a total of 70 teachers’ apartments. A total of 60 questionnaires were distributed and 57 valid questionnaires were collected. The results of the survey indicate the following: The age of the respondents is mainly distributed between 30–40, accounting for 50.88%. The proportion of respondents living on the 7th to 9th floors reached 70.18%, 29.82% on the 4th to 6th floors, and 0% on the 2nd to 3rd floors. More than half of the respondents rated the outdoor wind environment of the teacher–student dormitory in winter as bad (Figure 4), while satisfaction with the wind environment of the courtyard space was the lowest (Figure 5). The on-site research also revealed that the courtyard had limited usage for rest and recreation during the winter, resulting in a low utilization rate. Respondents on all floors reported that the wind speed of the open corridor on the north side was higher in winter (Figure 6), while the balcony on the south side had the noise of “whistling” generated by the strong winds passing through the doorway, which is more intense during the night compared to daytime. Overall, 61.4% of the respondents believe that the winter wind environment problems on the 7th to 9th floors of apartments are more serious than those on the 4th to 6th floors. The results of the questionnaire provide a subjective assessment of the wind environment by the occupants and serve as a foundation for site selection in the forthcoming wind environment field measurement.

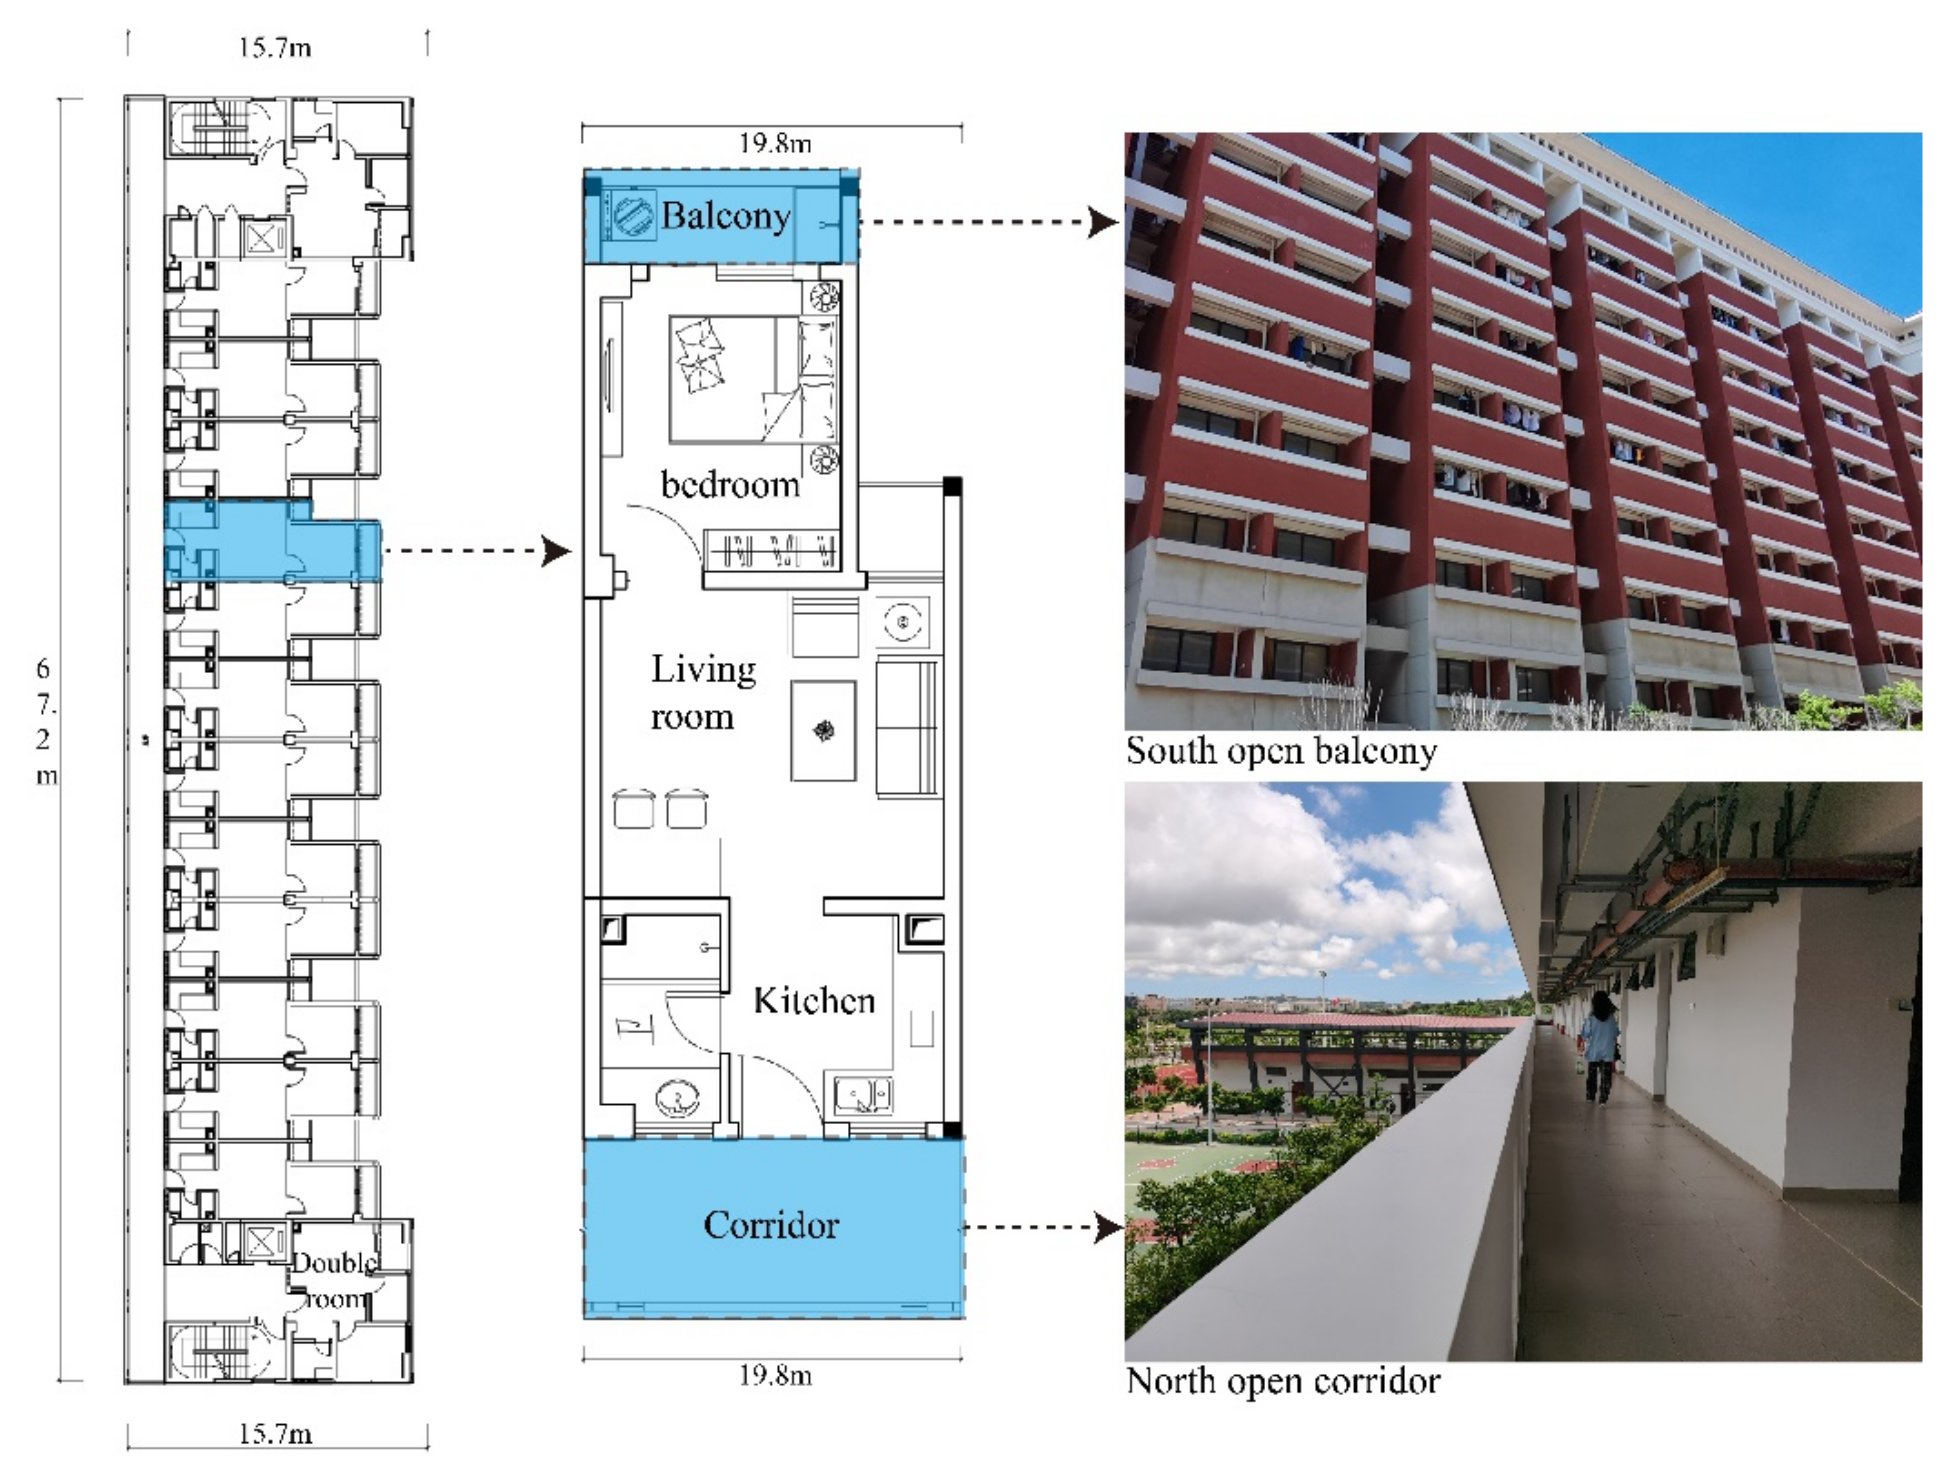
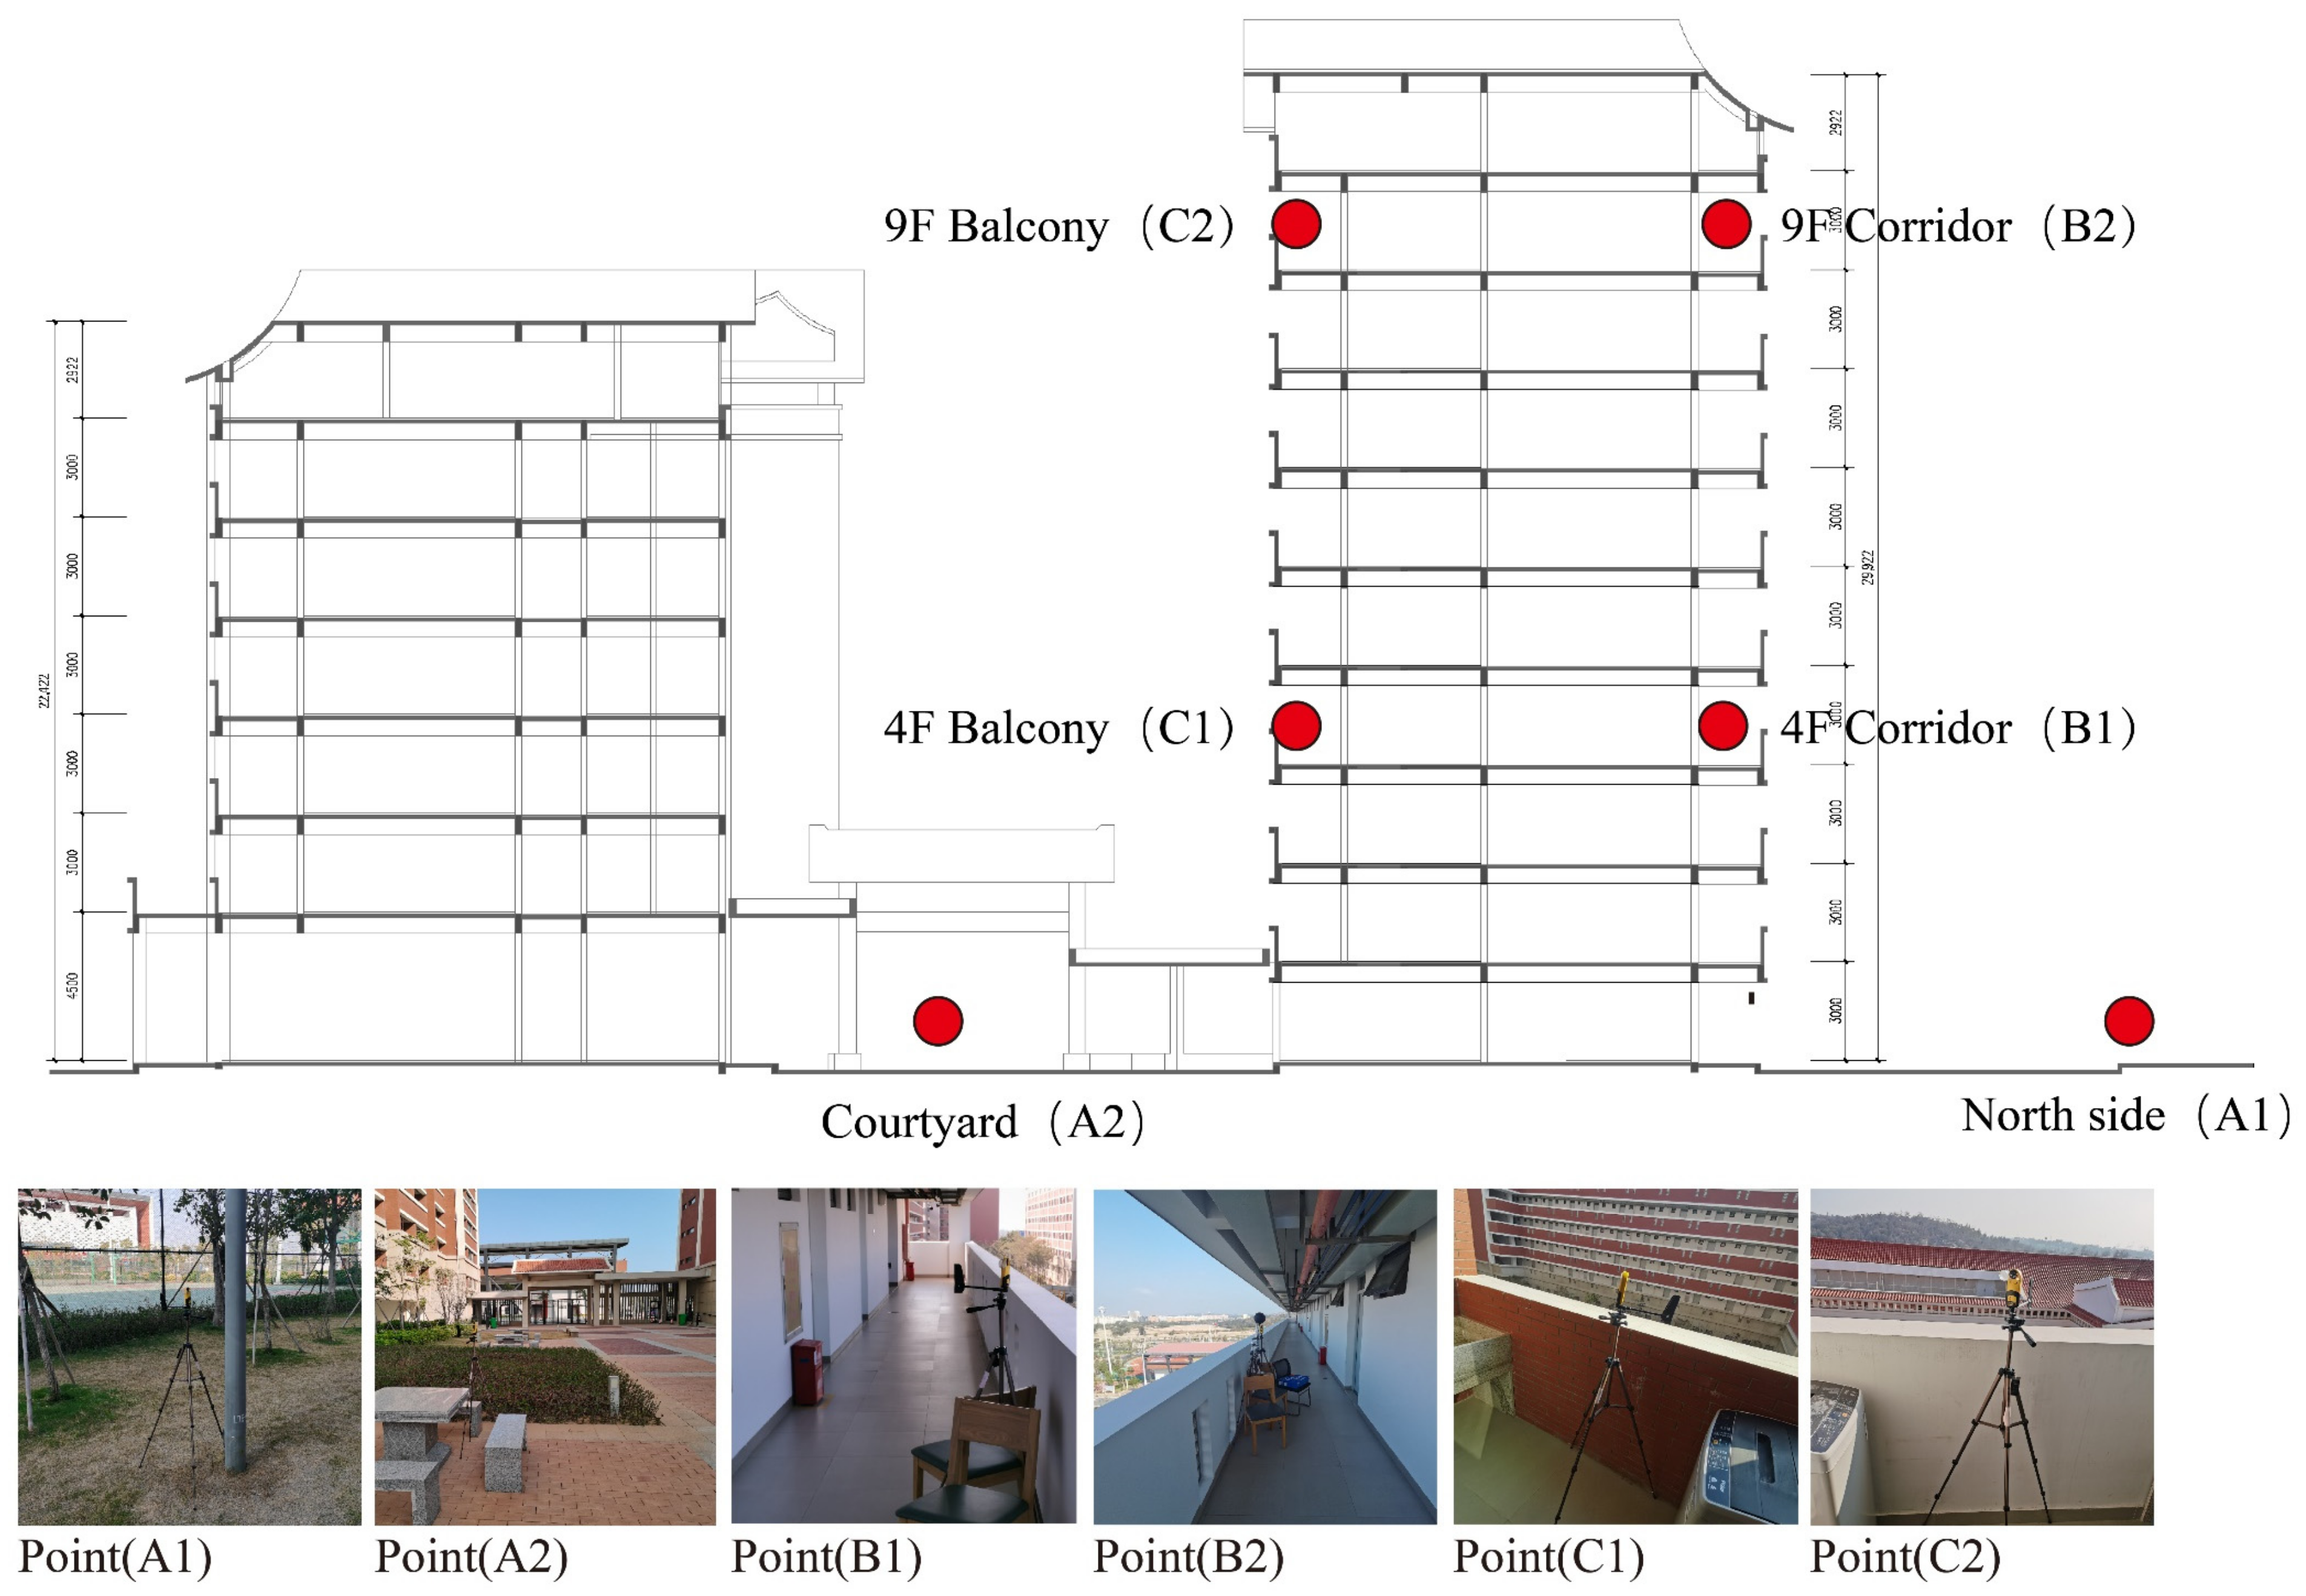
2.2. On-Site Measurement

2.2.1. Measurement Methods

The evaluation standard of wind environment is based on the current Chinese specification “Assessment standard for green building” (GB/T50378-2019) [29] and relevant studies on the correlation between the wind environment and human comfort [30,31], which establish 5 m/s as the outdoor wind environment evaluation threshold and 0~1.0 m/s as the range of indoor wind speed comfort value.
The flow of air is conducive to accelerating the evaporation of human sweat and taking away excess heat from the body surface in a timely manner. However, under low temperature conditions in winter, high-speed airflow will quickly take away heat and reduce human comfort. Meteorological data for the past five years show that the average daily minimum temperature in the coldest month of winter in Jinjiang City is only 10 °C. Therefore, 15–16 January 2022, as January is the coldest month in southern Fujian, has been designated as the actual measurement date. Meteorological data from the Jinjiang National Meteorological Observatory (24°49′ N, 118°34′ E) show that the dominant wind direction from the 15th to 16th was northeast, the average wind speed was 3.7 m/s value, and the minimum temperature was 11.1 °C.
The Kestrel anemometer model NK5500 (Nielsen-Kellerman Company, Minneapolis, MN, United States) was used for the actual measurement of the wind environment. The specific parameters of the instrument are shown in Table 2. The research team conducted the field survey and survey point layout on the morning of the 15th, and began continuously recording 24 h wind environment data with a 2 min data collection interval at 15:30 p.m. on the same day. Based on the survey results, we selected the key areas where respondents reported a poor wind environment and established 6 measuring points, including 2 outdoor measuring points at the roadside grassland on the north side of the teachers’ apartment (A1) and the courtyard center area (A2). There are four indoor measuring locations, including the apartments’ north corridor (B1, B2) and south balcony (C1, C2) on the fourth and ninth floors. The outdoor measuring points are arranged at a height of 1.5 m from the ground. The indoor measuring points are 1 m from walls and other reflective surfaces and 1.5 m from the floor of the building. In order to prevent strong winds from blowing the instruments over during the measurement, all instrument installations were reinforced. According to the users’ living conditions, the sliding door of the south-facing balcony remains open while the north-facing entrance door is closed (Figure 7).

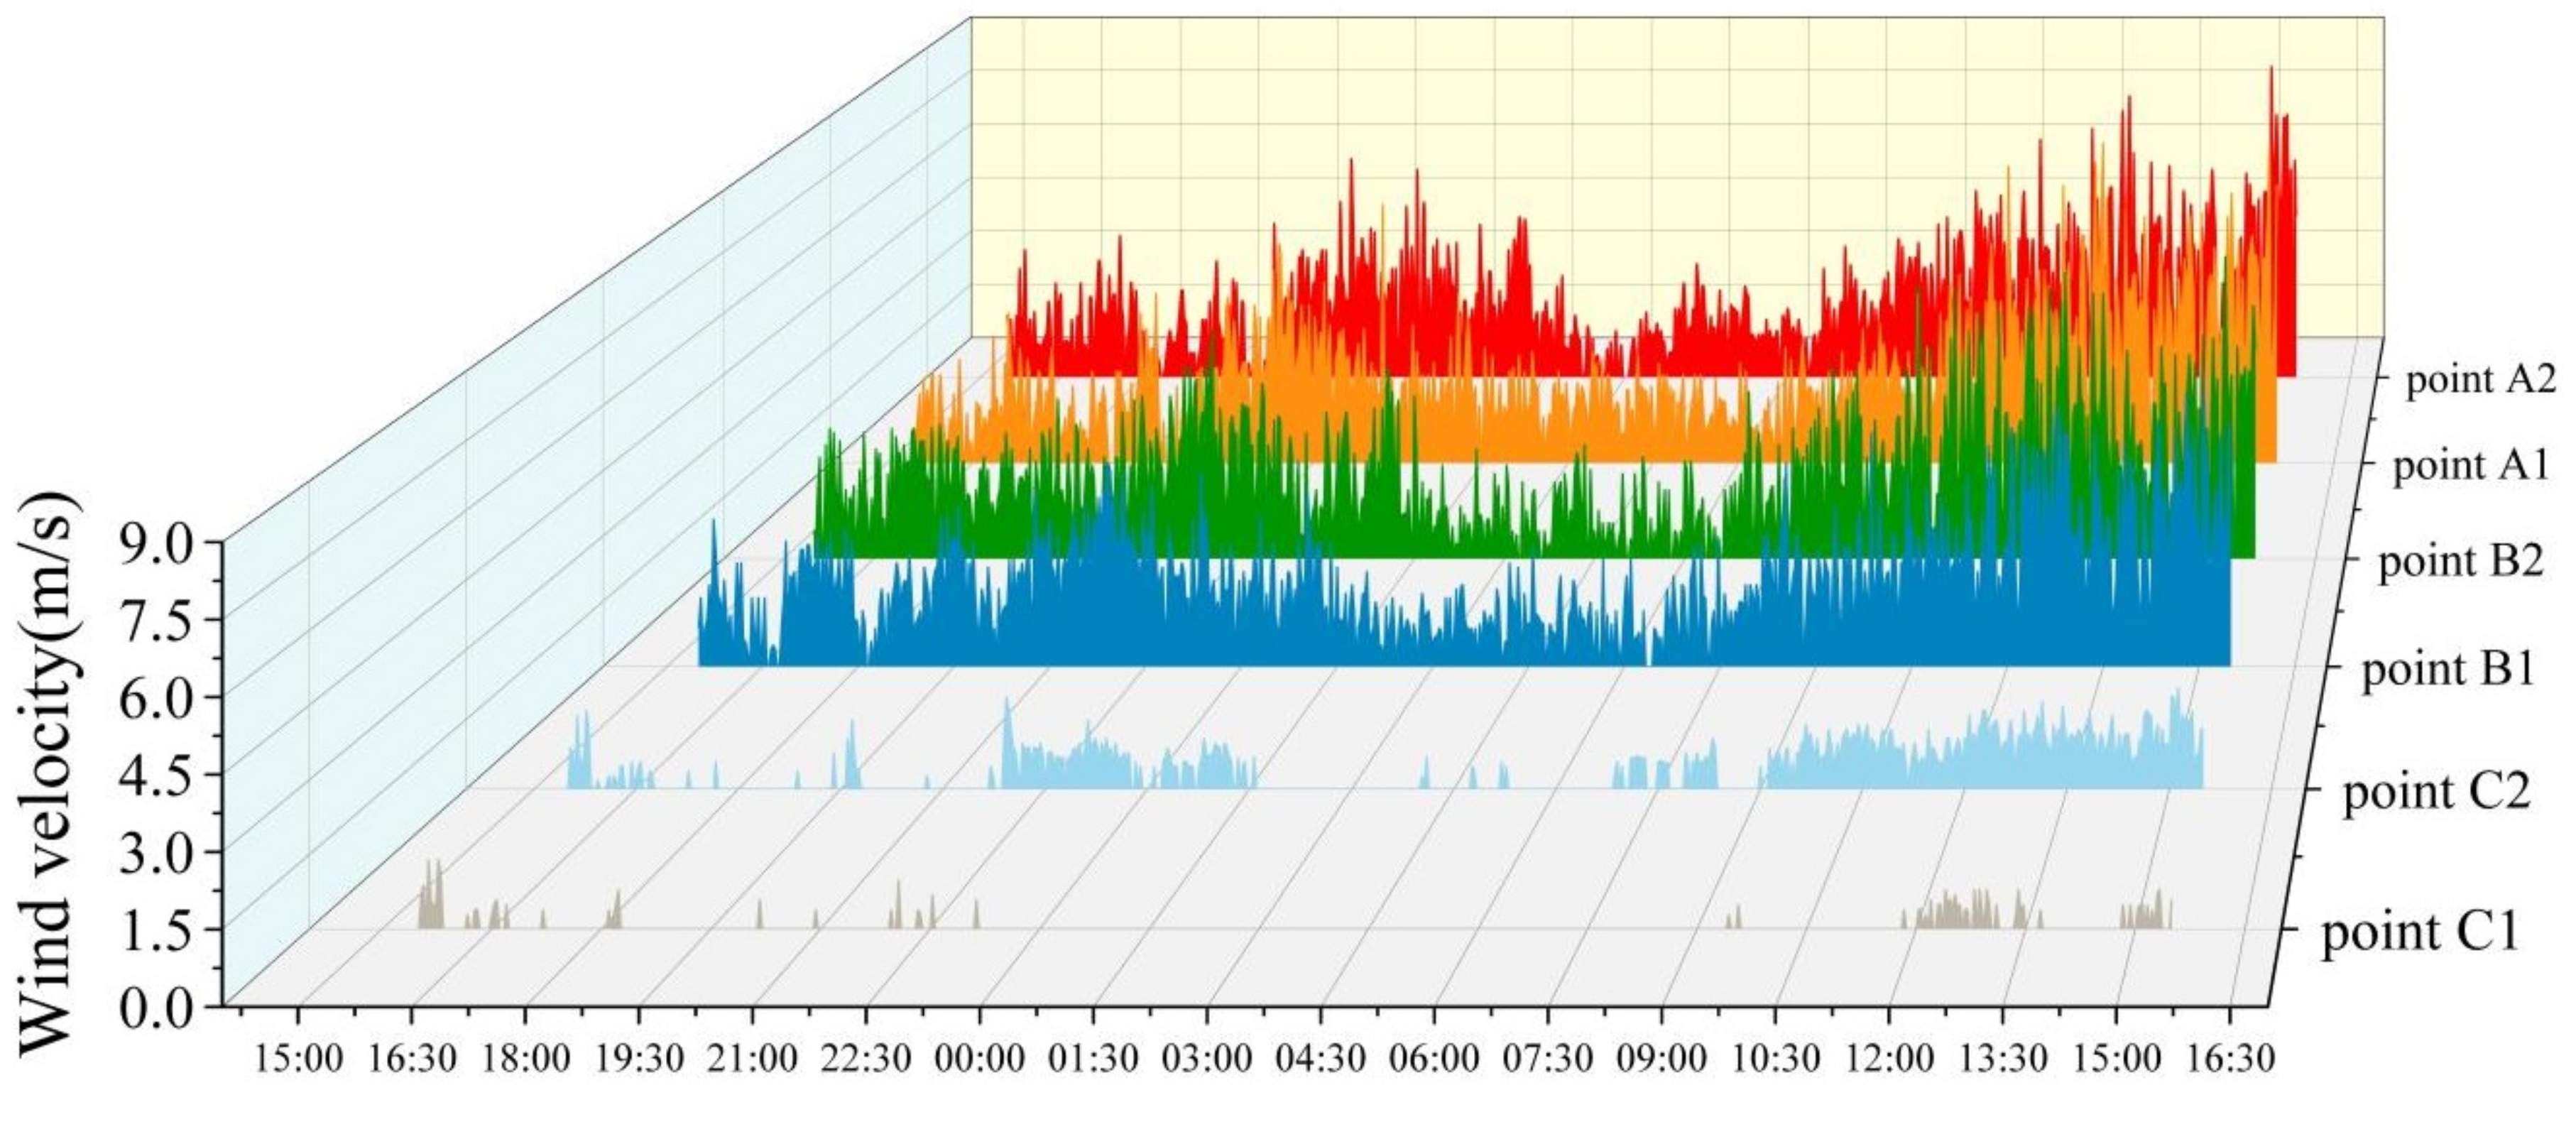
2.2.2. Measured Data Analysis

It can be observed that, under the influence of the dominant winter winds in the coastal region, both outdoor test points exhibit the similar trend in wind speed variation: a gradual increase from afternoon to evening, a slow decrease from midnight to early morning, and a significant increase from morning to late afternoon. In the courtyard, strong transient winds exceeding 5 m/s occur frequently in the afternoon and at night, and the maximal wind speed value can reach 8 m/s, which is significantly higher than the comfort evaluation threshold (Figure 8). Comparing the wind speed values at test points A1 and A2, it is noted that the wind speed in the courtyard is slightly lower than that in the green area. The main reason for this is the lack of wind barriers in the grassland area, whereas the teachers’ apartment partially blocks the airflow, reducing the wind speed in the courtyard. However, the effect of wind protection is limited, leading to a severe outdoor wind environment in winter.
The wind speed variation trend at the test points in the corridor of the teachers’ apartment is consistent with the outdoor trend, with the average wind speed in the corridor remaining above 2 m/s, and the maximum instantaneous wind speed can be above 7 m/s, which is significantly higher than the evaluation threshold of 1 m/s. The values of the wind speed in the middle- and high-rise corridors are similar, with the high-rise corridor being slightly higher than the middle-level corridor. The high-rise balconies experienced periods of instantaneous wind speed exceeding 1 m/s only in the late afternoon and at night, but it did not exceed 2 m/s. In comparison, the wind environment in the mid-rise balconies was relatively comfortable. The significant difference between the wind speed values of the balcony area on the middle and high floors can be attributed to the location of the balcony on the leeward side, which exposed it primarily to the courtyard’s penetrating wind. Furthermore, the effect of gradient wind results in lower wind speeds at the balcony on the middle floors, while significantly higher wind speeds are experienced on the high floors. According to the questionnaire survey and wind environment measurement, the outdoor wind environment of the teachers’ apartment is poor. During the winter, there are higher wind speeds in the outdoor space, resulting in a decrease in human thermal comfort. The design of the open corridors and balconies exacerbates the issue of deterioration of the wind–thermal environment within the building. Strong winds from the courtyard penetrate through gaps in the sliding doors of the balconies, generating wind noise and cold wind infiltration, thus affecting the quality of the indoor living environment. To further explore the causes of the adverse wind environment, a CFD simulation was conducted to analyze the current situation of the apartment.

2.3. CFD Simulations

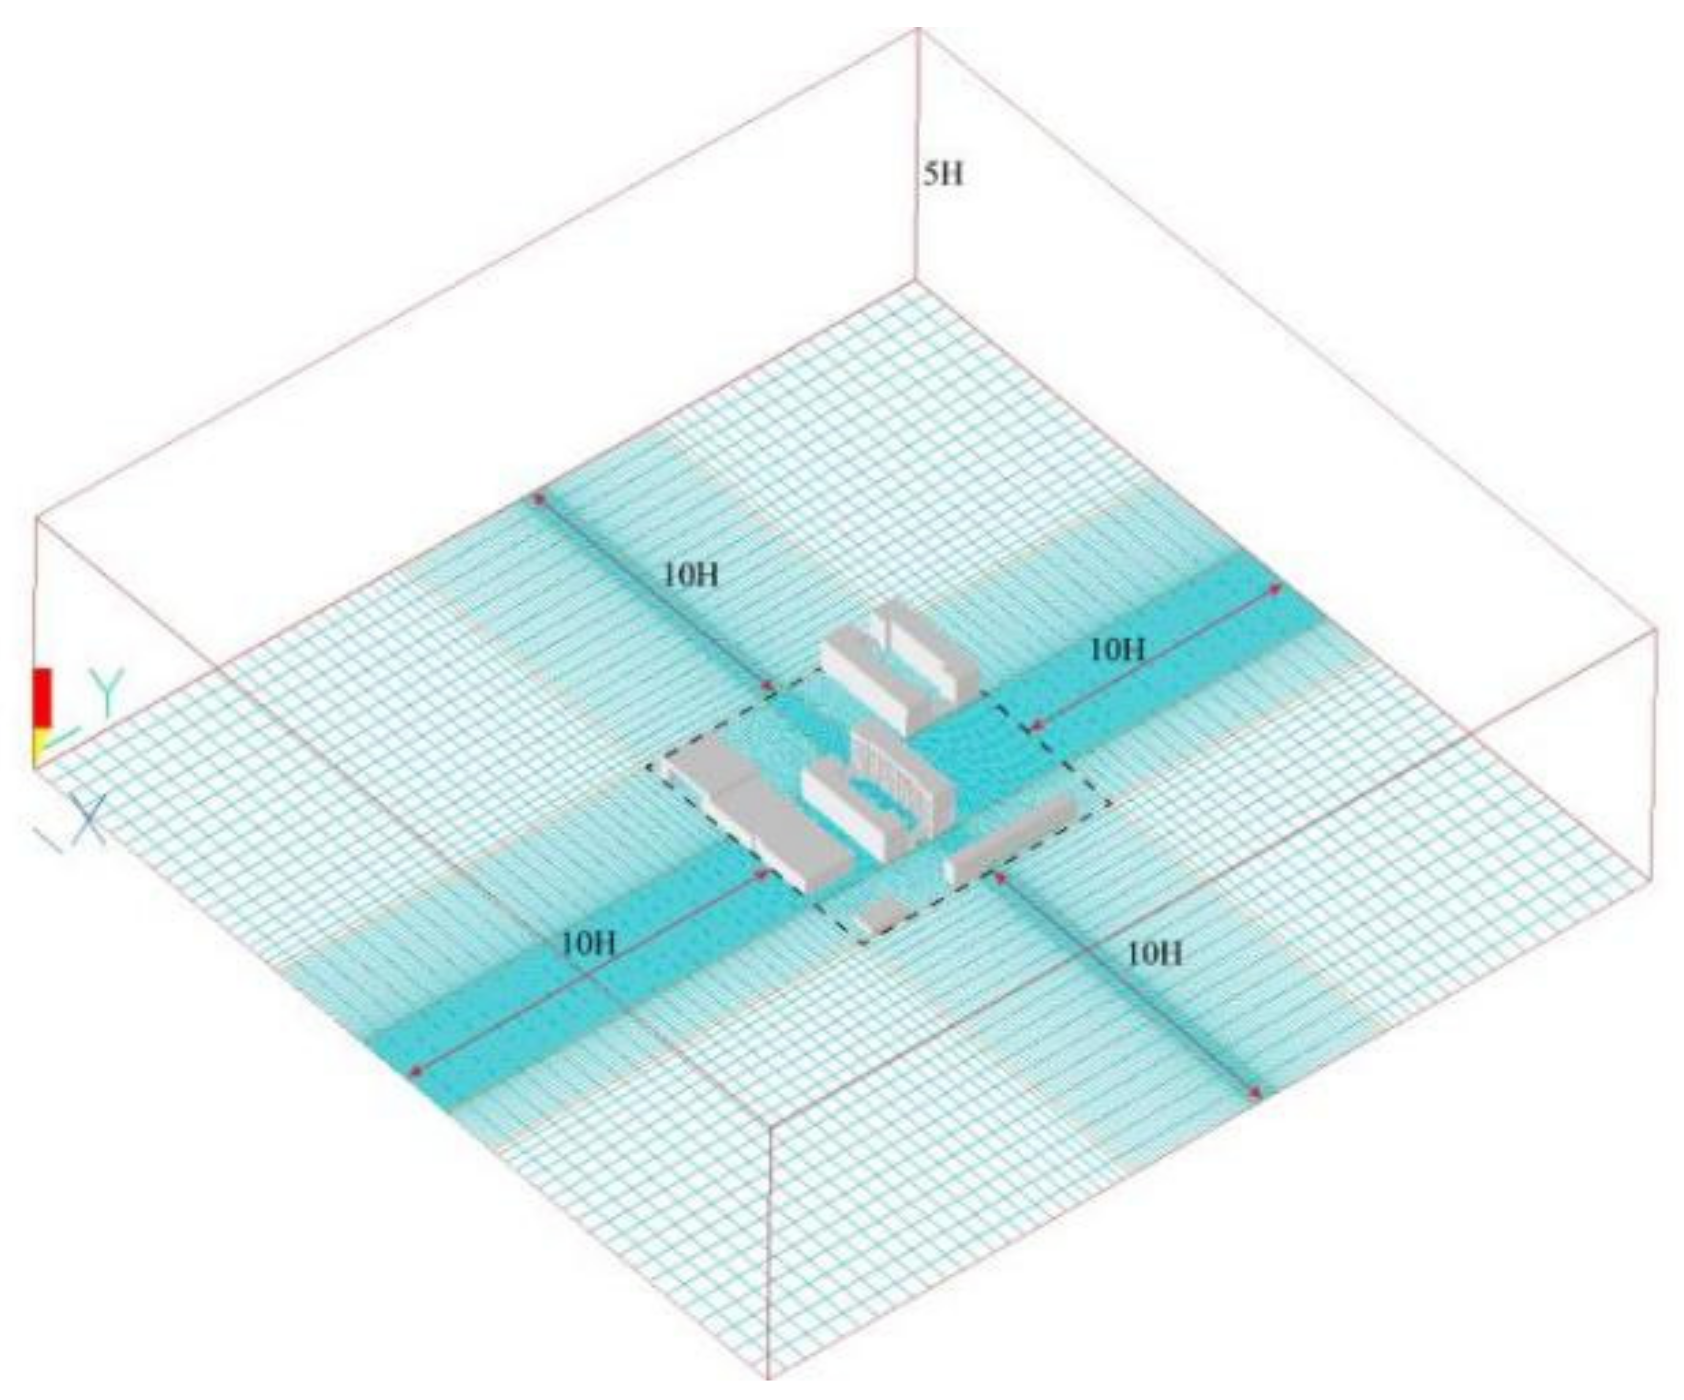
2.3.1. Model Development and Computational Domain

The wind environment at pedestrian heights in the living area is influenced by the heights, forms, and layouts of the upstream and downstream buildings [32]. The Phoenics (2019) was chosen as the simulation platform, in which a scaled-down model of the teacher–student dormitory, along with adjacent buildings, was created to conduct the simulations. To ensure consistency in building arrangement, shape, and orientation based on the actual design of the master plan, a 3D solid model was created using CAD (2014) and imported into PHOENICS. To enhance the efficiency of the simulation, the architectural features at the micro level were appropriately simplified [33]. Moreover, adhering to the requirement of a blocking ratio of the physical model under 3%, the simulation area is defined according to the relevant regulations and suggestions of the pertinent codes for the simulation domain [34]. The modeling area spans approximately 180 m in the east–west direction and 170 m in the north–south direction. The dimensions of the teacher–student dormitory are 67.4 m in length, 45.8 m in width, and 30.0 m in height (Figure 9).
The size of the simulation area directly influences the outcomes of the simulation [35]. A smaller computational domain can distort the flow field, while a larger computational domain leads to an increased number of grids, resulting in higher computational costs. The computational domain is set to 10H, 10H, and 5H for upstream, downstream, lateral, and height, respectively, based on the experience of previous researchers in setting the computational domain for CFD simulation of residential wind environments [36] (Figure 10).

2.3.2. Turbulence Model and Boundary Conditions

CFD software (Phoenics 2019) is generally equipped with various turbulence models, among which k-ε model is one of the most commonly employed in engineering applications. This model is favored for its relatively low computational cost, low fluctuation, and high numerical accuracy [37]. On the other hand, transient numerical models such as large eddy simulation (LES) and direct numerical simulation (DNS) are more accurate with the mean flow values obtained through time averaging over a sufficiently long sampling period from the instantaneous ones and the discretization time steps [38,39]. In this particular study, where the mean flow field exhibits inherent complexity, Large Eddy Simulation (LES) is inherently superior to the k-ε model in terms of turbulence modeling. However, the k-ε modeling approach remains the most frequently used in urban physics. This is because LES involves complex simulation processes, requires significant computational resources, and lacks best practice guidelines. They are difficult to tune and incur higher computational costs, making these methods less popular for urban wind assessment [40]. Extensive studies have verified the accuracy and reliability of the standard k-ε modeling approach. Therefore, the standard k-ε model was selected for simulation in this study. The turbulent kinetic energy k (m2/s2) and its dissipation rate ε (m2/s3) were calculated using Equations (1) and (2) [41].
t   ( ρ k ) +   x i   ( ρ k u i ) =   x j [   ( μ + μ t δ k ) k x j ] + G k + G b ρ ε + S k
t   ( ρ ε ) +   x i   ( ρ ε u i ) =   x j [   ( μ + μ t δ k ) ε x j ] + G 1 ε ε k   ( G k + C 3 ε G b ) C 2 ε ρ ε 2 k + S ε
c μ = 0.09 ; δ k = 1.0 ; δ ϵ = 1.3 ; c 1 ε = 1.44 ; c 2 ε = 1.92
The lower atmospheric layer belongs to incompressible fluids. The velocity–inlet boundary is applicable to the incompressible fluids. Therefore, the type of inlet was velocity–inlet during numerical simulation in this study. The inlet profile for the mean wind speed U was calculated using Equation (3) [42]. In this formula, Zref is the standard height above ground, which is generally 10 m. The incoming flow velocity at this height is Uref, z is the variable height from the ground, and α is the roughness coefficient of the ground [43]. The subject of this study falls within the standard definition of urban building density as defined in the Thermal Environment Design Standard for Urban Residential Areas (JGJ286-2013) [44], as such, the roughness coefficient (α) is 0.22. The outlet boundary was set as an unrestricted free outlet using fully developed outflow boundary conditions. The two sides and top boundaries of a computational domain are specified as “slip boundary conditions”, implying that the airflow will be unaffected by these three shells and that the real outdoor wind flow is reproduced.
The independence of the Reynolds number (Re) is necessary for numerical simulations applying reduced-scale models. The models used in this study are scaled down at a ratio of 1:15. According to the calculations, the Re at the heights of buildings and around the envelope features are near 2.2 × 10⁵ and larger than 1 × 10⁴ on average, which meets the independence requirement [45].
U = U r e f ( z z r e f ) α
According to findings of the questionnaire study, it was observed that most residents perceive the wind environment to be more severe at night when the air temperature is lower compared to daytime, and higher wind speeds during winter worsen people’s thermal comfort. Therefore, the boundary conditions for simulations were determined by the meteorological parameters at 21:30 at night. The NK5500 integrated wind speed meteorological meter was utilized to keep track of the meteorological parameters. The air temperature at the outside monitoring point 1 was 14.4 °C, the wet bulb temperature was 12.8 °C, the relative humidity was 83.6%, the atmospheric pressure was 1025.5 mb, and the measured instantaneous wind speed was 5.5 m/s from the northeast. The average wind speed in winter from December to February was a northeast wind speed of 2.62 m/s according to data from the national station in Jinjiang City, Fujian Province, and the automatic meteorological stations for the previous five years. It is worth noting that the study object is situated in Jinjiang City’s southwest coastal plain and the Jinjiang station’s climate monitoring site is situated in inland hills at 24°49′ N latitude and 118°34′ E longitude. The difference in thermal characteristics between land and sea induces the sea–land wind effect, which accelerates the air flow velocity. Therefore, the measured wind environment data hold scientific value. The simulation parameters were set as shown in Table 3.

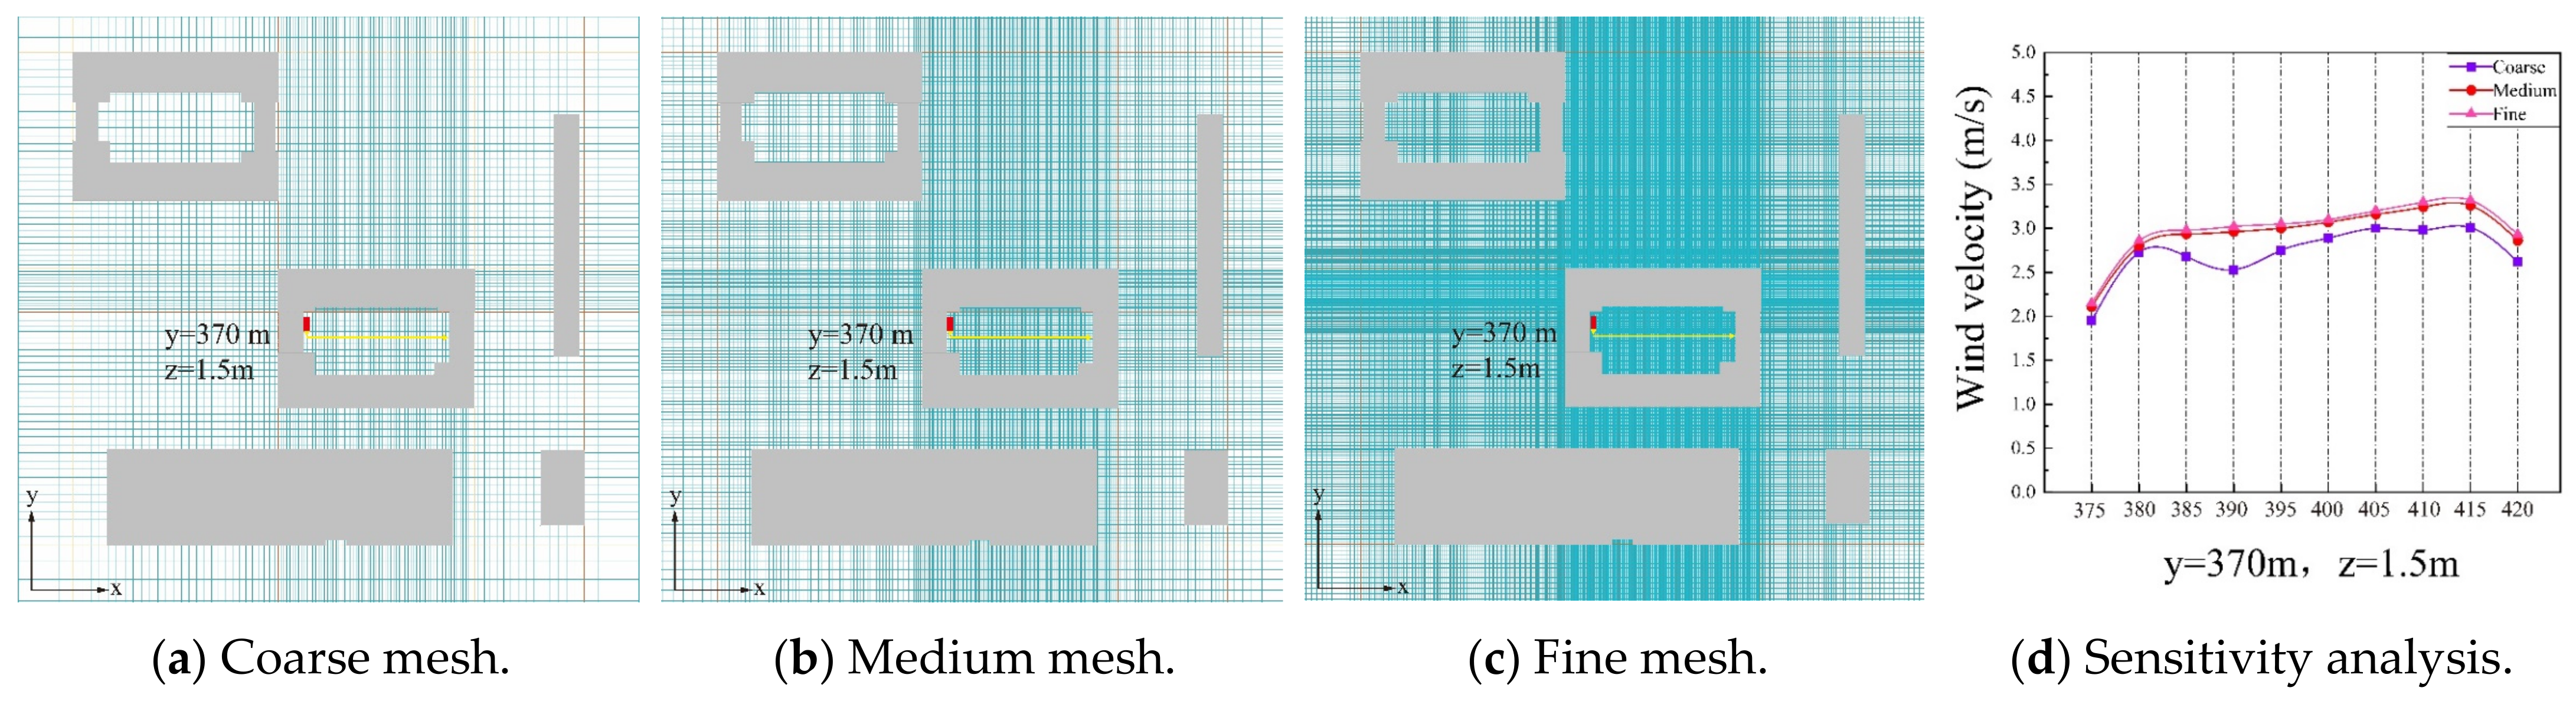
2.3.3. Grid Arrangements and Sensitivity Analysis

The SPARSOL mesh generation method developed in PHOENICS was used to generate a mesh for the computational domain in such a way that the mesh was dense in areas near the target models and sparse in areas away from the target models. Grid sensitivity analysis was carried out to ensure that the results of the selected grid will not change significantly with finer grid resolution [9]. The analysis used coarse grid (minimal grid size is 0.2 m, 1.81 million cells in total), middle grid (minimal grid size is 0.05 m, 3.28 million cells in total), and fine grid (minimal grid size is 0.02 m, 5.95 million cells in total). As shown in Figure 11a–c, the difference in size of the three types of grids in the research area must meet the requirement of at least 1.5 times [46]. The simulated data at the leeward side of apartment (y = 370 m, z =1.5 m) [31] of three mesh systems are compared in Figure 11d. The mean deviation between the simulation results by the coarse grid and the medium grid is as large as 24.5%, while the deviation between the medium and fine grids is only 5.2%. Therefore, considering the accuracy and expenditure of computational resources, a medium mesh system was used in this study.

2.3.4. Simulation Data Analysis

Since the average wind speed better reflects the actual wind environment, we chose the measured average wind speed to validate the accuracy of the simulation, and compared the measured data with the simulated data. It can be observed that the variation trends of the wind speed are consistent, and there is a high similarity between different test points. In addition, the accuracy of the simulated values can be assessed using the mean absolute percentage error (MAPE). The calculation is based on Equation (4), where Xsim is the simulated value, Xme is the measured value, and N is the number of measurements. The MAPE of 9.5% (Table 4) for the dormitory wind environment simulation falls within a reasonable margin of error. This indicates that the method of modeling and simulation can accurately reflect the real situation. The data discrepancy can be attributed primarily to factors such as pedestrians, vegetation, and other influences that may affect the measurement process, leading to some degree of error.
M A P E = i = 1 n | X m e d X s i m | X m e d N
From the H = 1.5 m pedestrian height wind speed contour map (Figure 12a), it can be observed that there are several high wind speed zones around the teacher–student dormitory, which are mainly distributed in the passages and corners between the buildings. Among them, the high wind speed zone between the apartments and the northwestern side of the student dormitories appears to be the most pronounced. Additionally, there is a sharp increase in wind speed in the courtyard, mainly due to the intensified airflow between the apartments and the graduate student dormitories in the narrow courtyard. From the measured points inside the building (Figure 12b,c), it can be observed that under the condition of the entrance door on the north side being open, the strong winter winds penetrate through the building, creating a corridor–living room–bedroom–balcony wind channel. Although the balcony is at the end of the wind channel, it is also affected by the strong winds from the courtyard, as it is situated closer to the outer side of the building.
Based on the previous questionnaire and on-site measurement results, the direct cause of the severe winter wind environment in the teacher–student dormitory is the strong winter wind generated by the unique climatic and geographic conditions of the coastal area of southern Fujian. However, the inappropriate layout of the dormitory area further exacerbates the situation. Some spaces in the dormitory area such as the open basketball court are too open and lack effective wind barriers. As a result, the buildings are directly exposed to the strong northeasterly wind. Some spaces are too compact, resulting in strong corner wind and crosswind, such as the corridors around the dormitory and open courtyard. The high winter wind speed not only leads to low thermal comfort for the occupants but also allows the strong wind from the courtyard to penetrate through the gaps of the balcony sliding door, causing wind noise and cold air infiltration, which leads to indoor living environment health problems. Therefore, the next step involves simulating and analyzing different layout patterns for the dormitory area to explore the ideal winter layout mode.

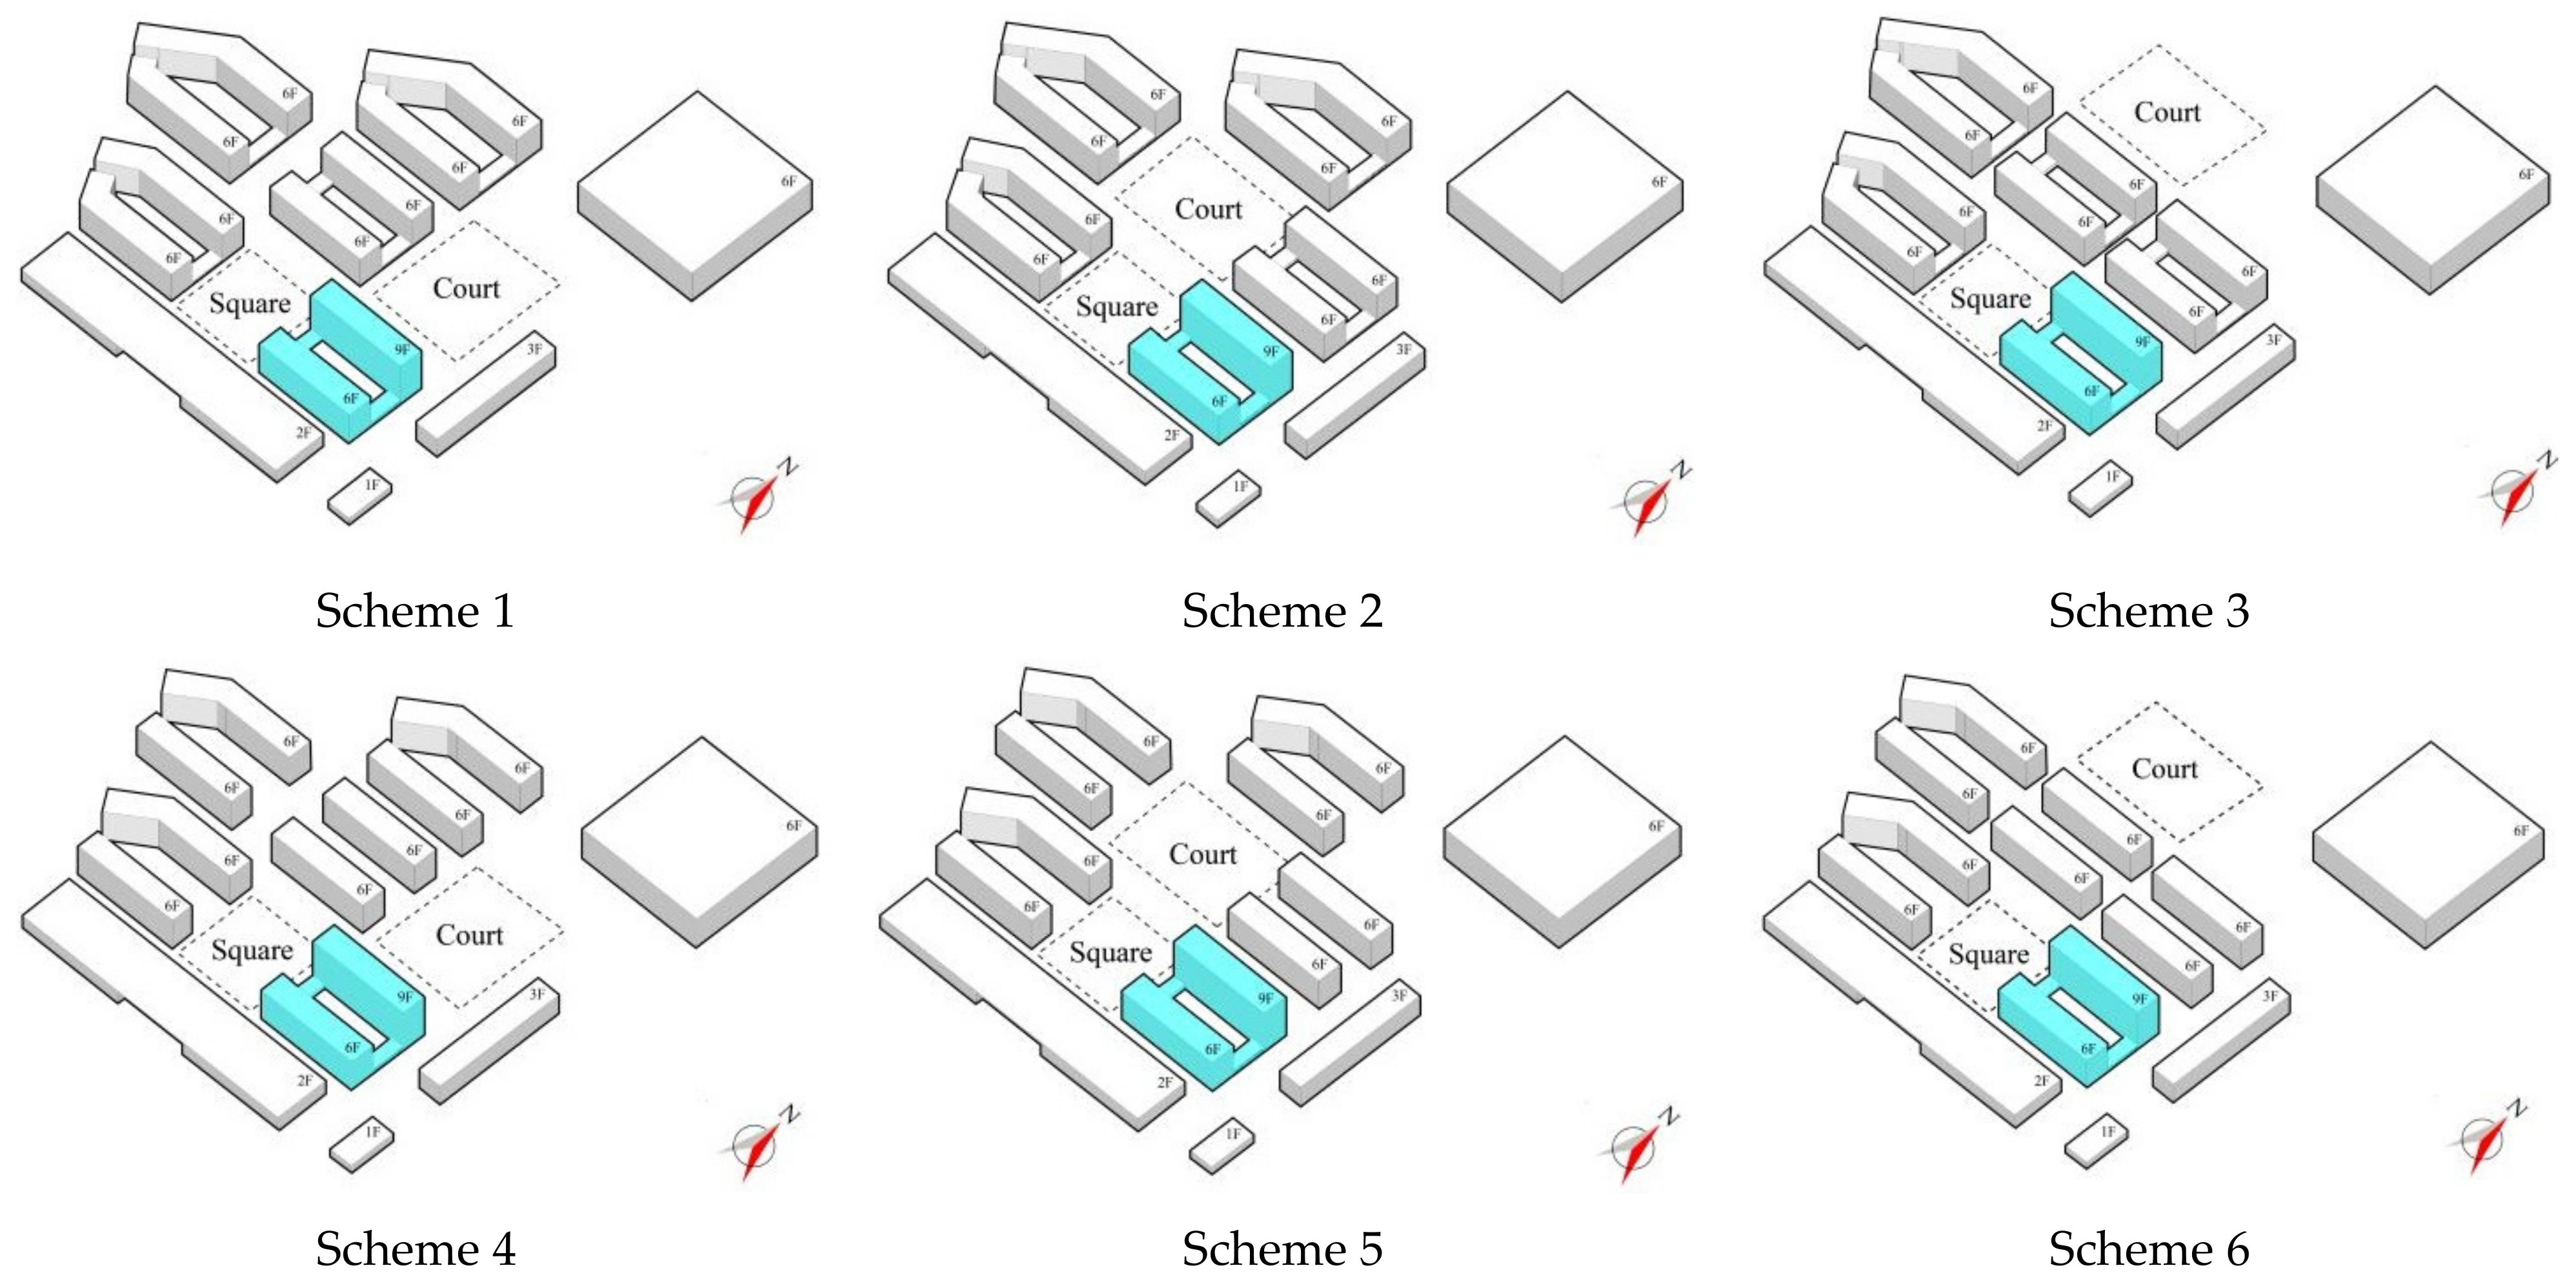
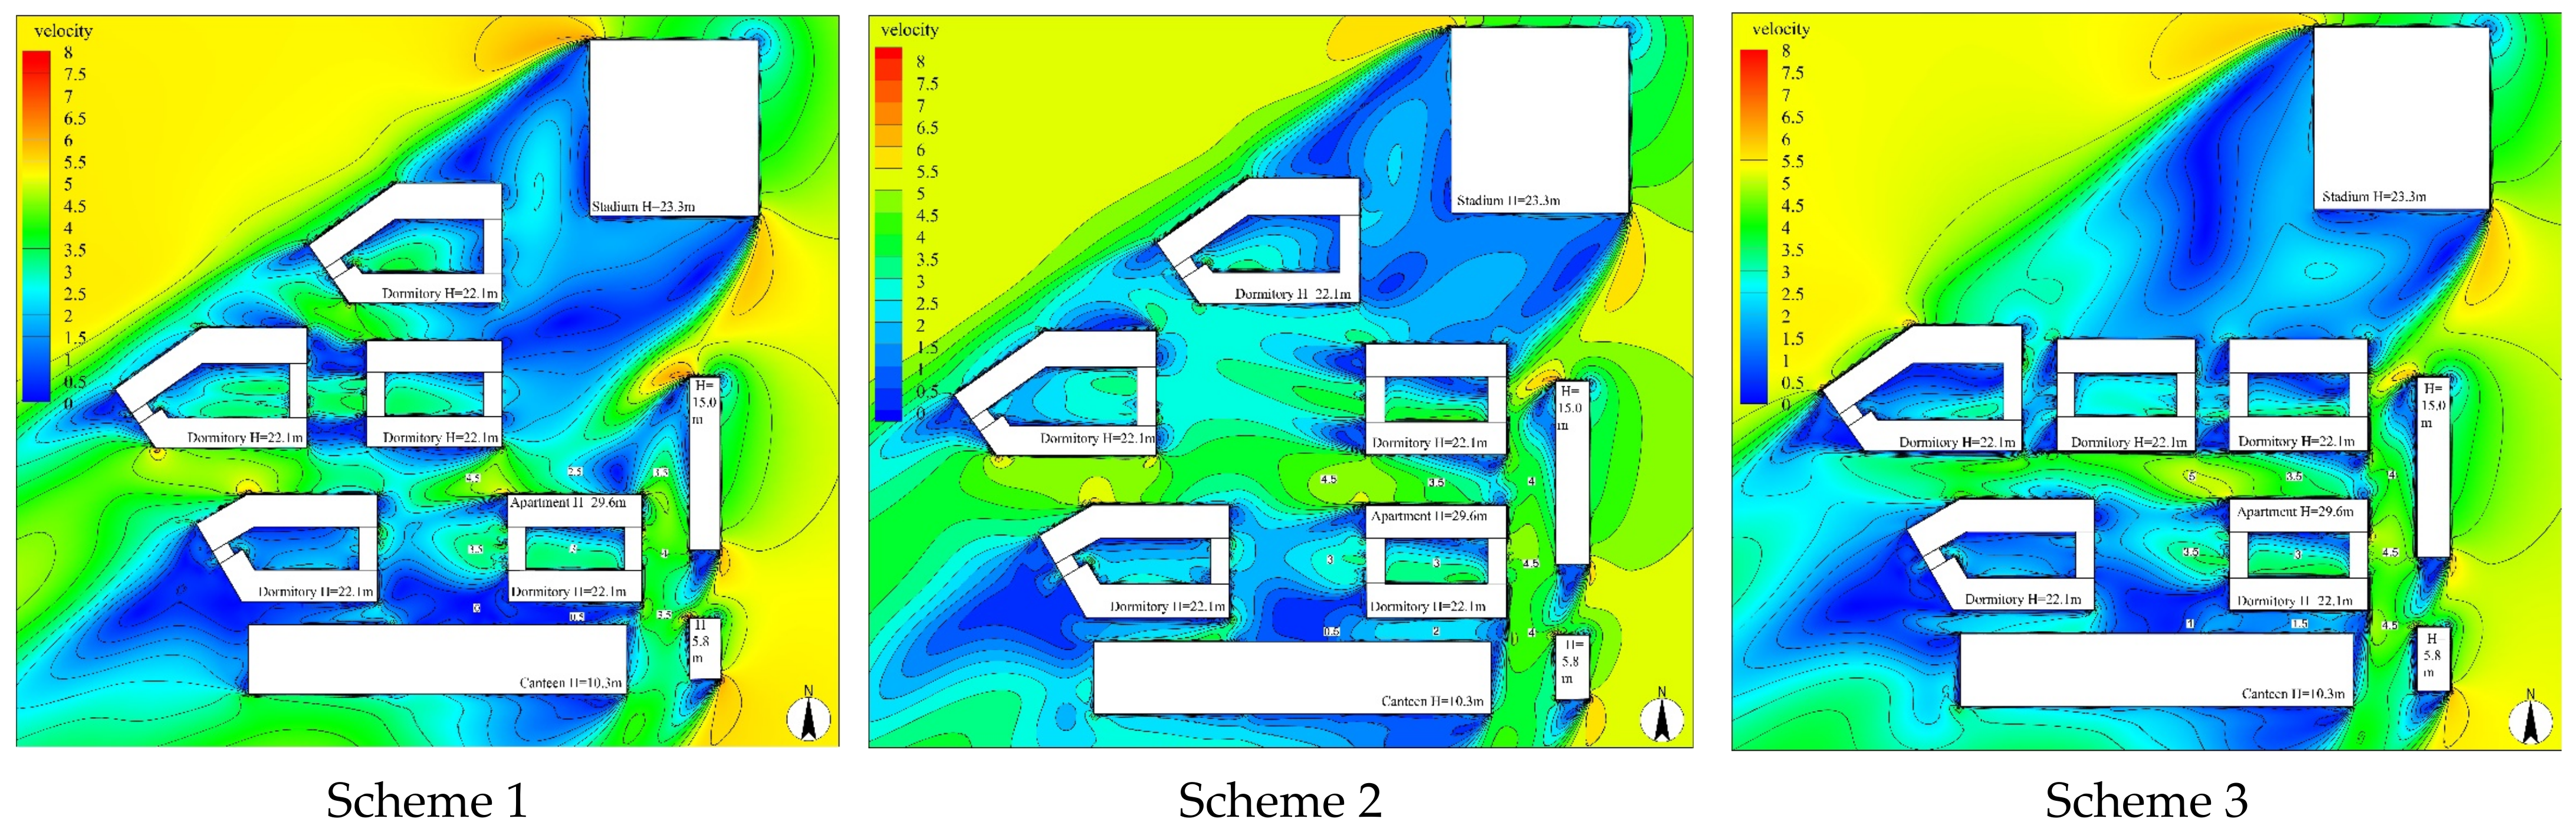
2.3.5. Different Layout Scheme Design

This study is based on the existing college campus, where the layout of the dormitory area is constrained by the road network and the surrounding buildings. The location of the square on the west side of the teacher–student dormitory, serving as a communal area between the canteen and the dormitory area, is not suitable for relocation. On the other hand, the relative positions of the basketball court and undergraduate dormitory located in the upwind direction of the teacher–student dormitory have a more significant impact on the wind environment. In terms of the dormitory grouping approach, both determinant type and enclosure type are common forms in the construction of the dormitory area in Chinese universities. Therefore, based on the original layout framework, this study investigates the relative positions of the basketball court and the student dormitory as well as the different enclosure methods of dormitory groups. From these two dimensions, we propose six programs, categorized into two types, of which Programs 1~3 represent an enclosing layout, and Programs 4~6 adopt a row-type layout (Figure 13).

3. Results and Analysis
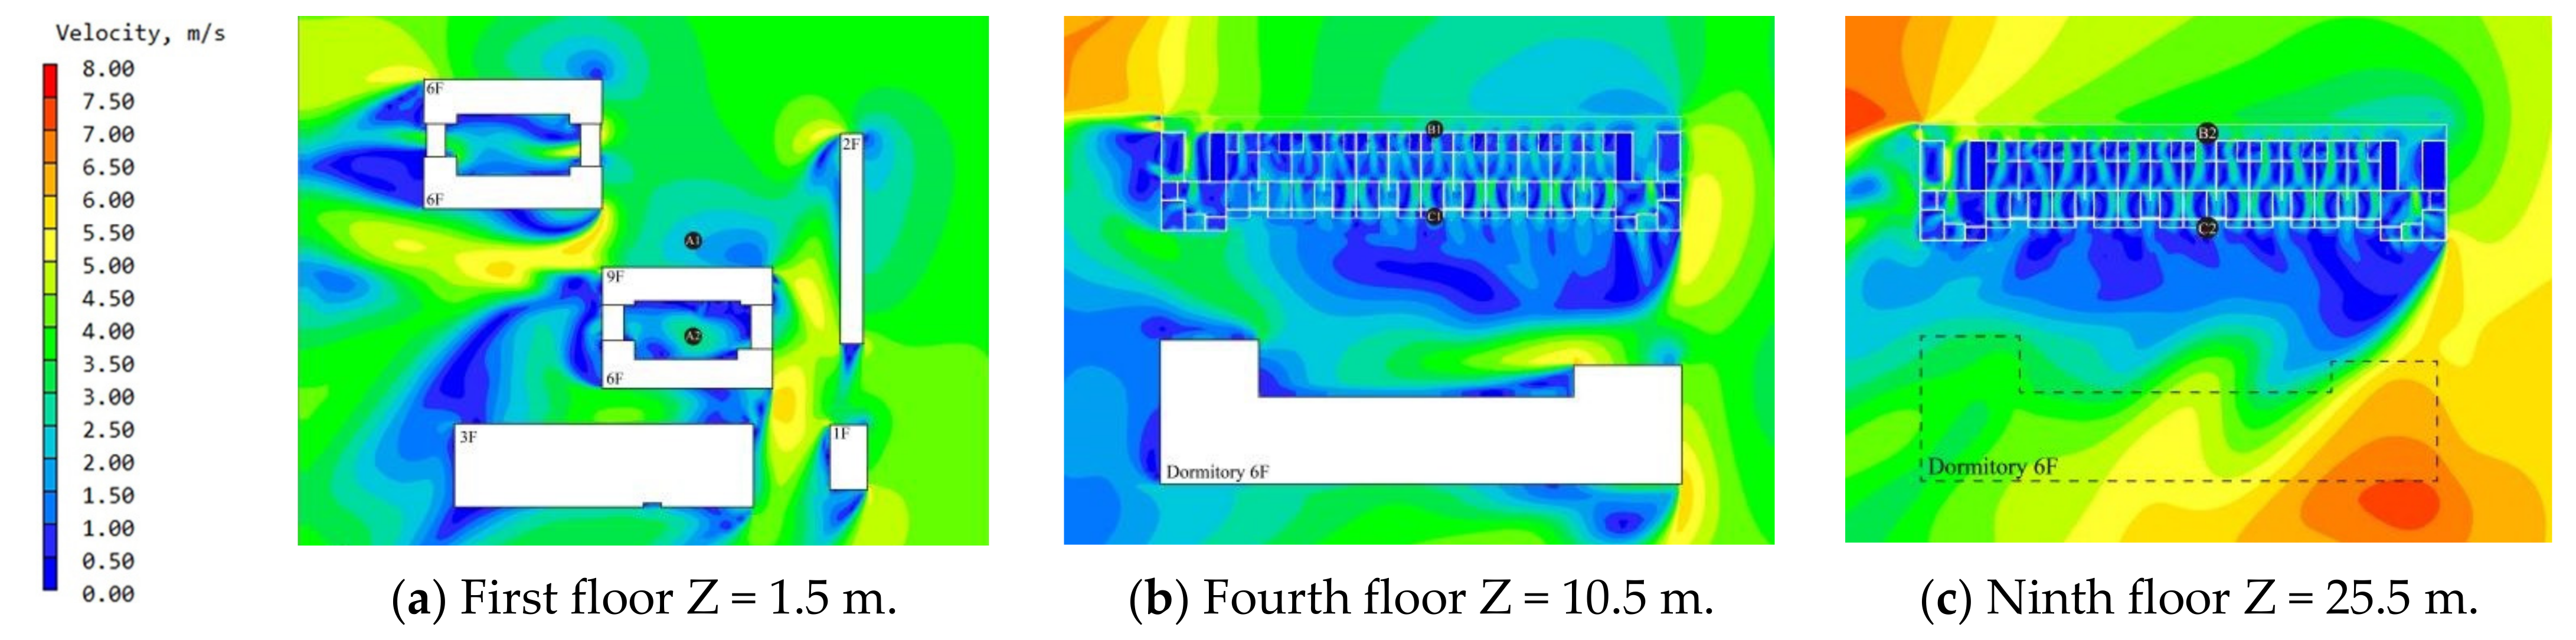
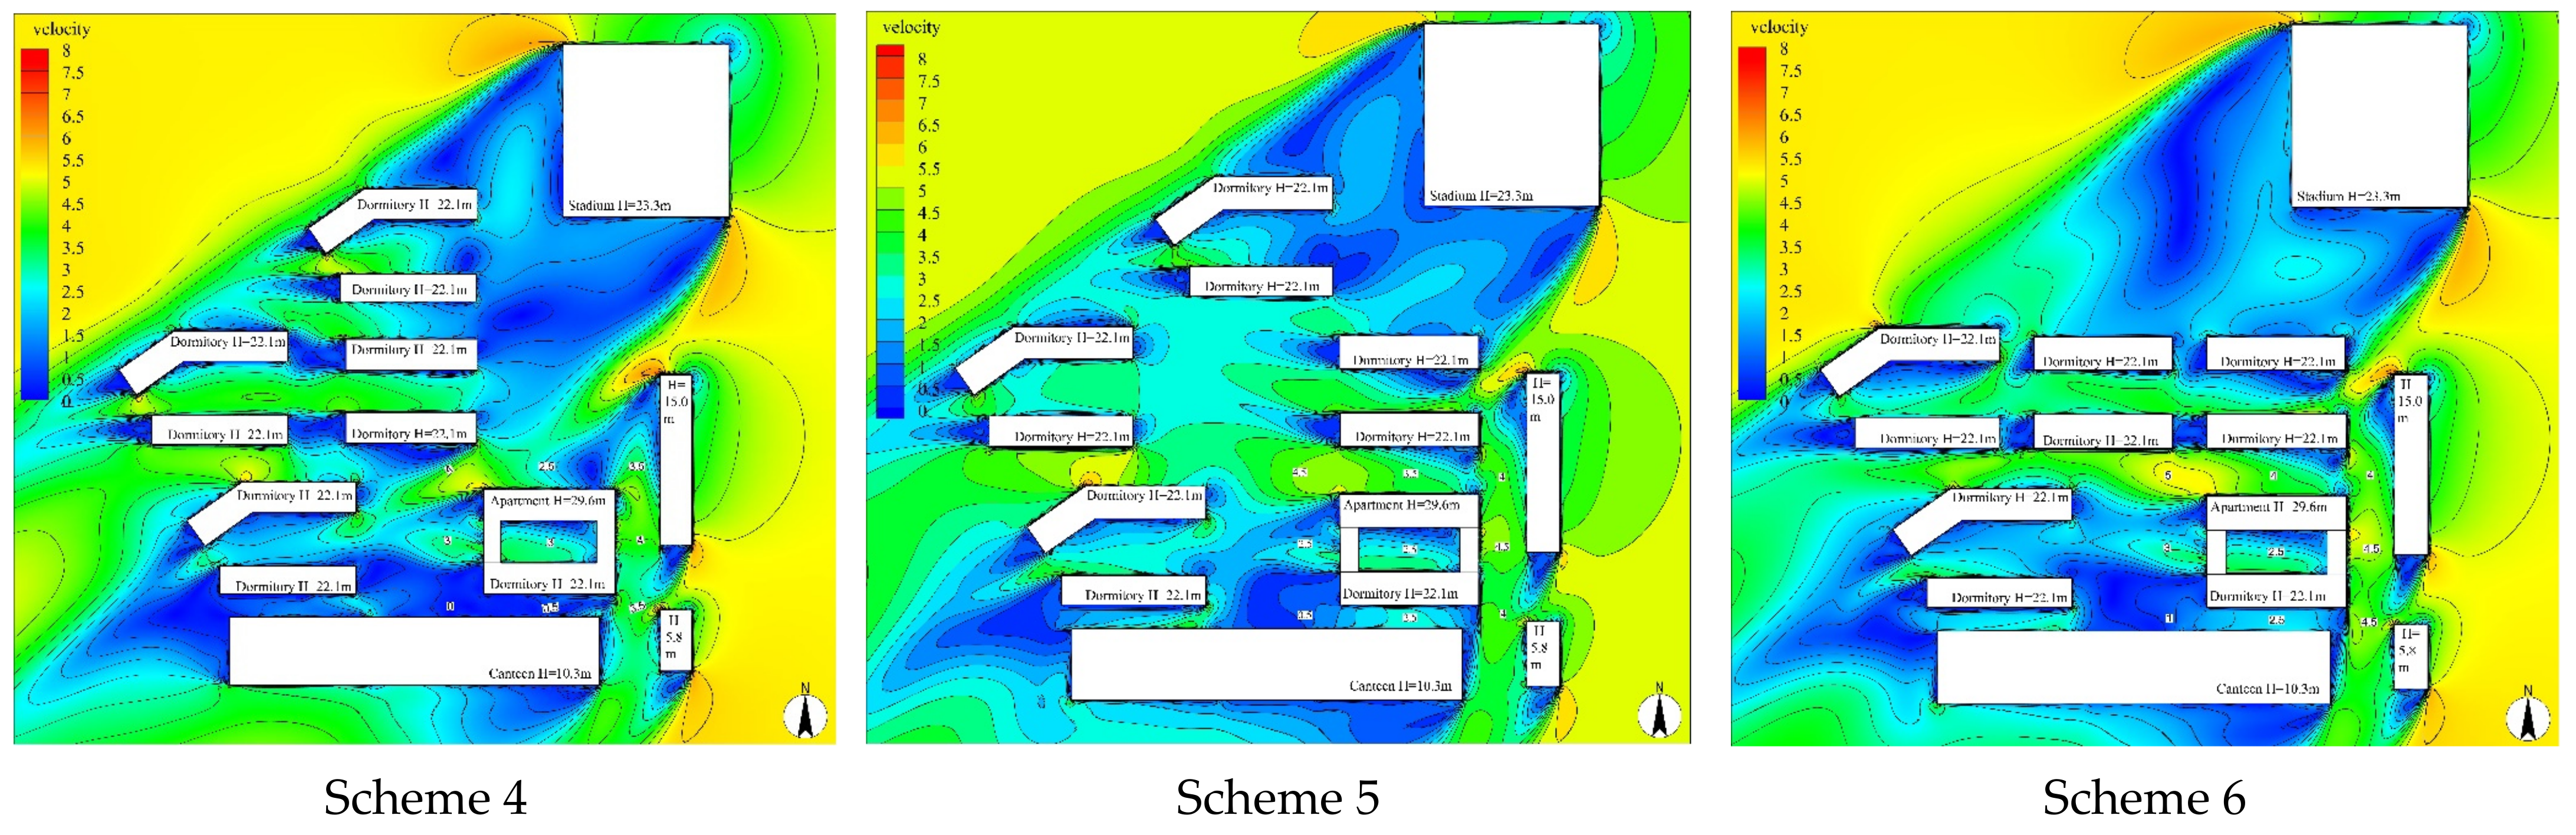
3.1. Wind Contours

The simulation platform and parameter settings used in the wind environment simulation of six different layouts are the same as in the previous Section 2.3. Figure 14 demonstrates the wind speed contour map. Due to the large volume of the stadium on the northeast side of the site, a significant wind shadow area appears on the southwest side of the stadium, which weakens the airflow within the dormitory area. Different layout modes form squares and passages of varying sizes and locations. When the square is located in the east side, as in scheme 1 and 4, because of the wind shadow area of the gymnasium, it results in lower wind speed. When the square is located in the central part of the area, as in schemes 2 and 5, the presence of the large scale open square and low enclosure of surrounding dormitory buildings result in a significant area of high wind speed. The layout of scheme 5 shows the most significant impact. When the square is located on the north side of the dormitory area, as in scheme 3 and 6, it has less influence on the wind environment. Different dormitory grouping methods also have a greater impact on the wind field. The comparison of scheme 3 and 6 reveals that the high wind speed zone in the open layout is significantly larger than that in the enclosed layout.
Therefore, dormitory areas in the Minnan coastal region can be arranged in the downwind of the large volume of buildings, such as gymnasiums, under the premise of meeting the sunlight spacing. Due to the functional characteristics, such buildings generally have a larger volume and higher building enclosure, making it more suitable as winter windbreak barriers. The utilization of the outdoor square is greatly reduced under strong winter wind conditions, which means the design of a large-scale open courtyard inside the dormitory area should be avoided. To further analyze the specific characteristics of different schemes and quantify the simulation results, 40 test points were selected for each scheme, which were evenly distributed on the windward and leeward sides of the buildings as well as between the walls of the adjacent buildings, so as to ensure that the test points cover the users’ main daily activity spaces. Specifically, the test points can be chosen along the central line of the passageway, courtyard, and other spaces around the teacher–student dormitory. The test points can be numbered from 1~10 in a north to south and east to west direction, for comparative analysis.

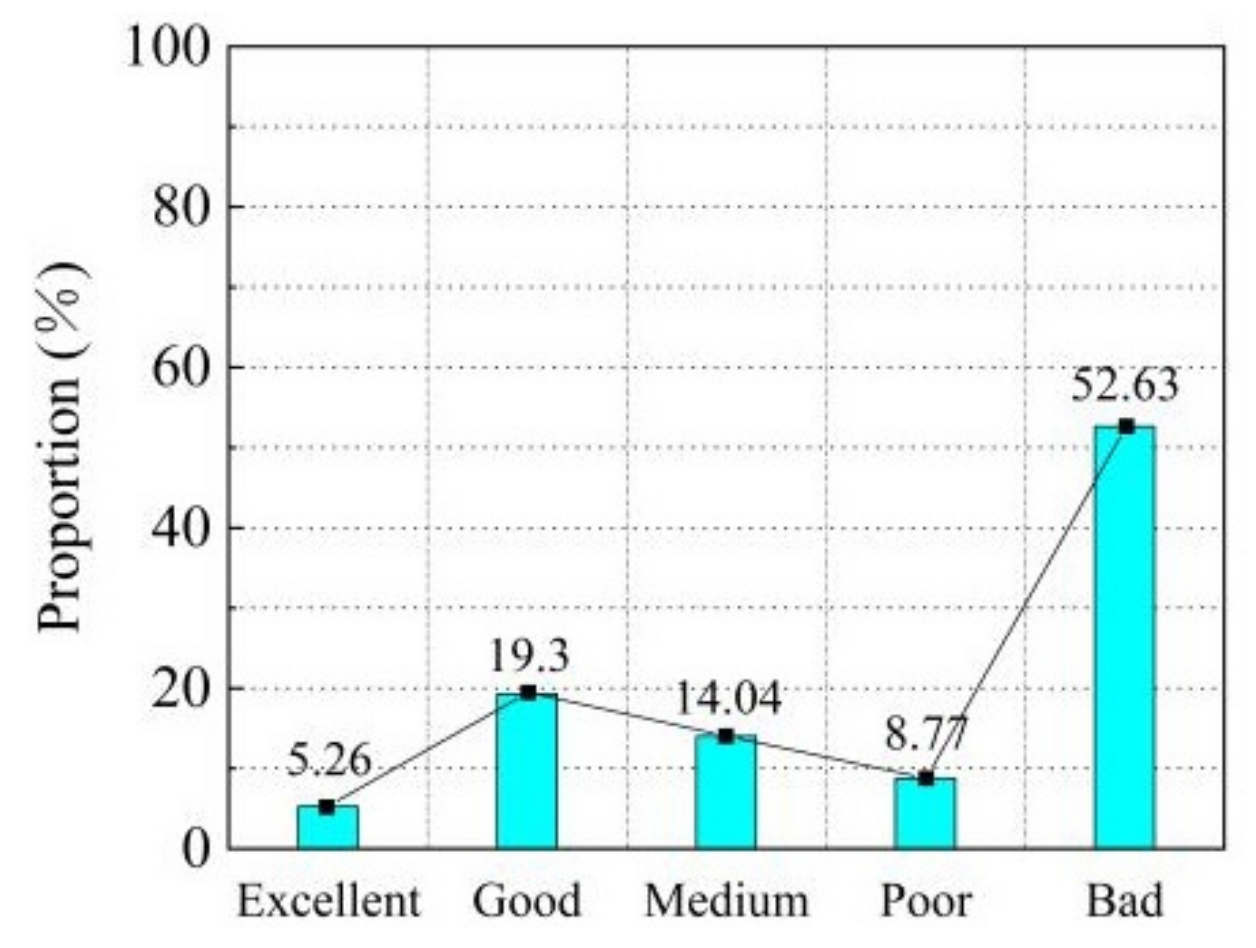
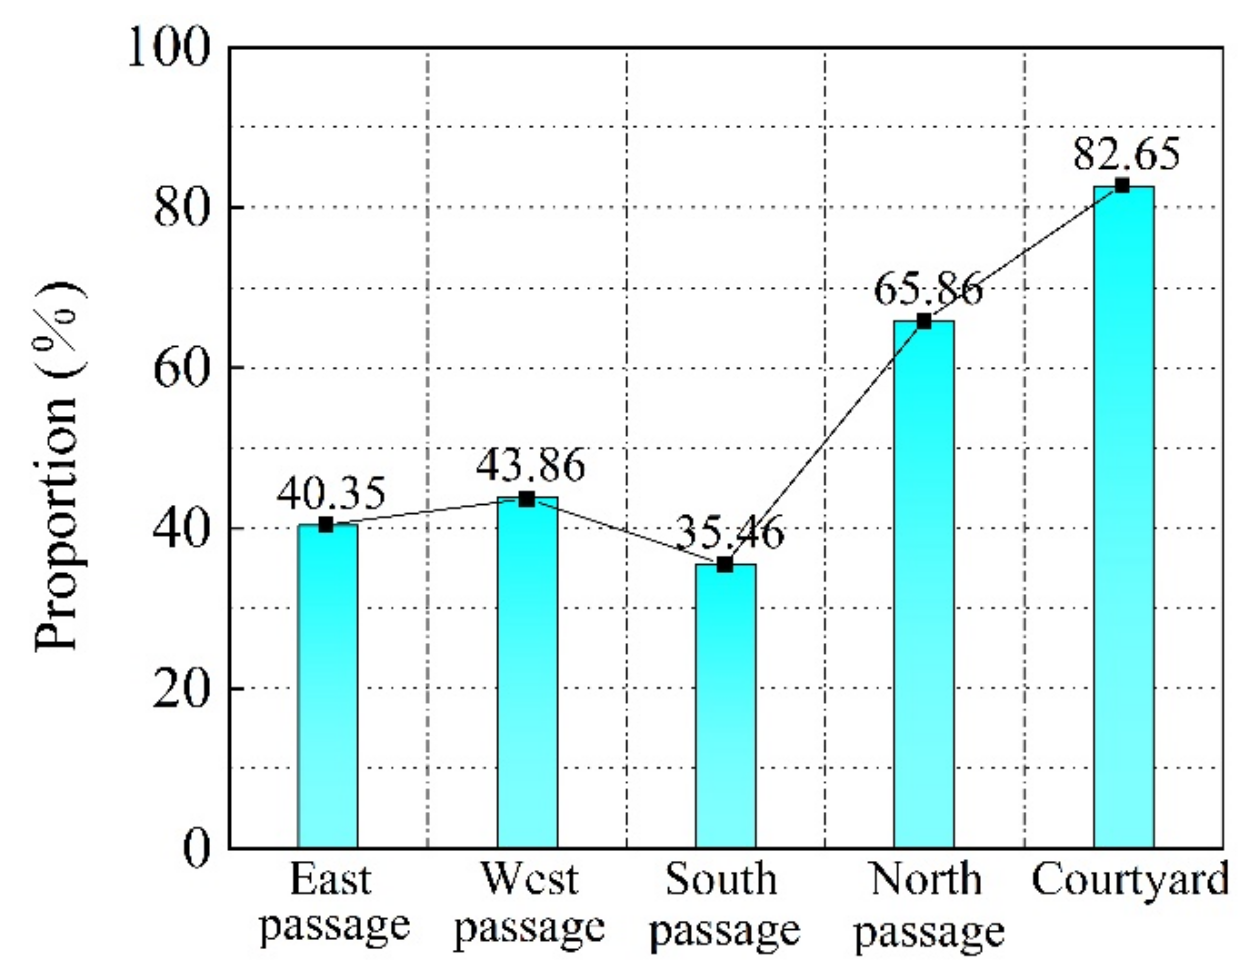
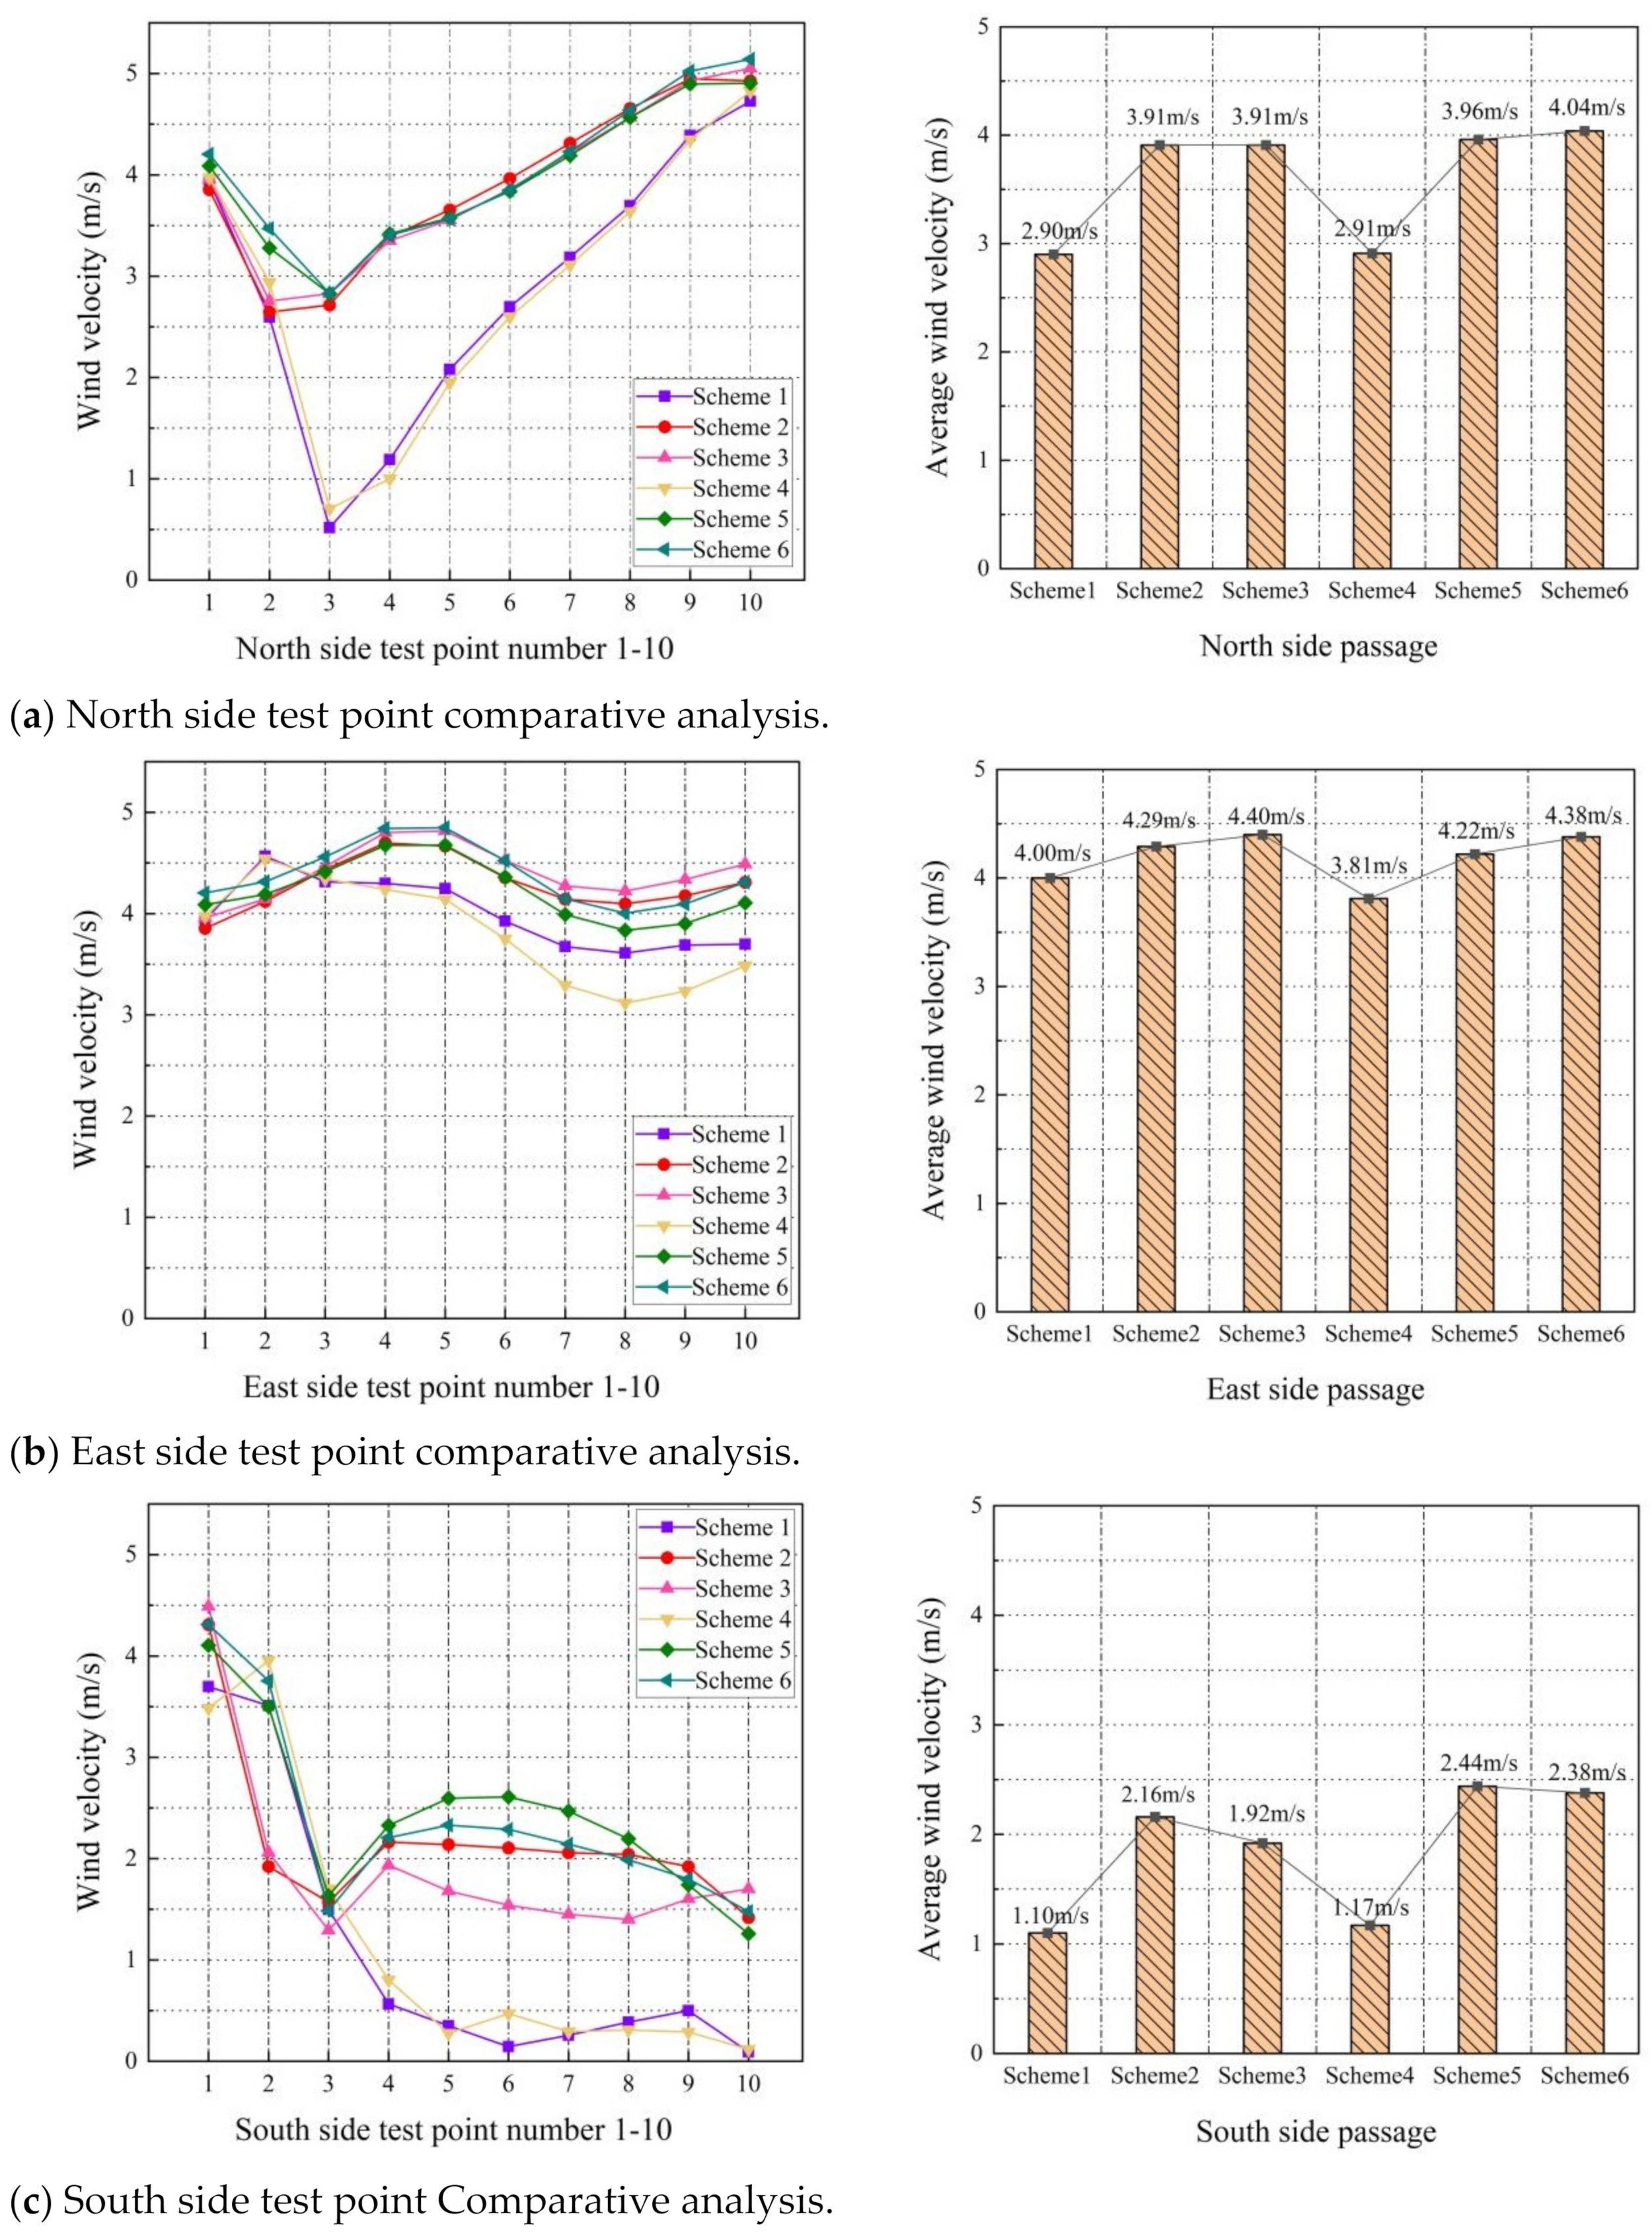
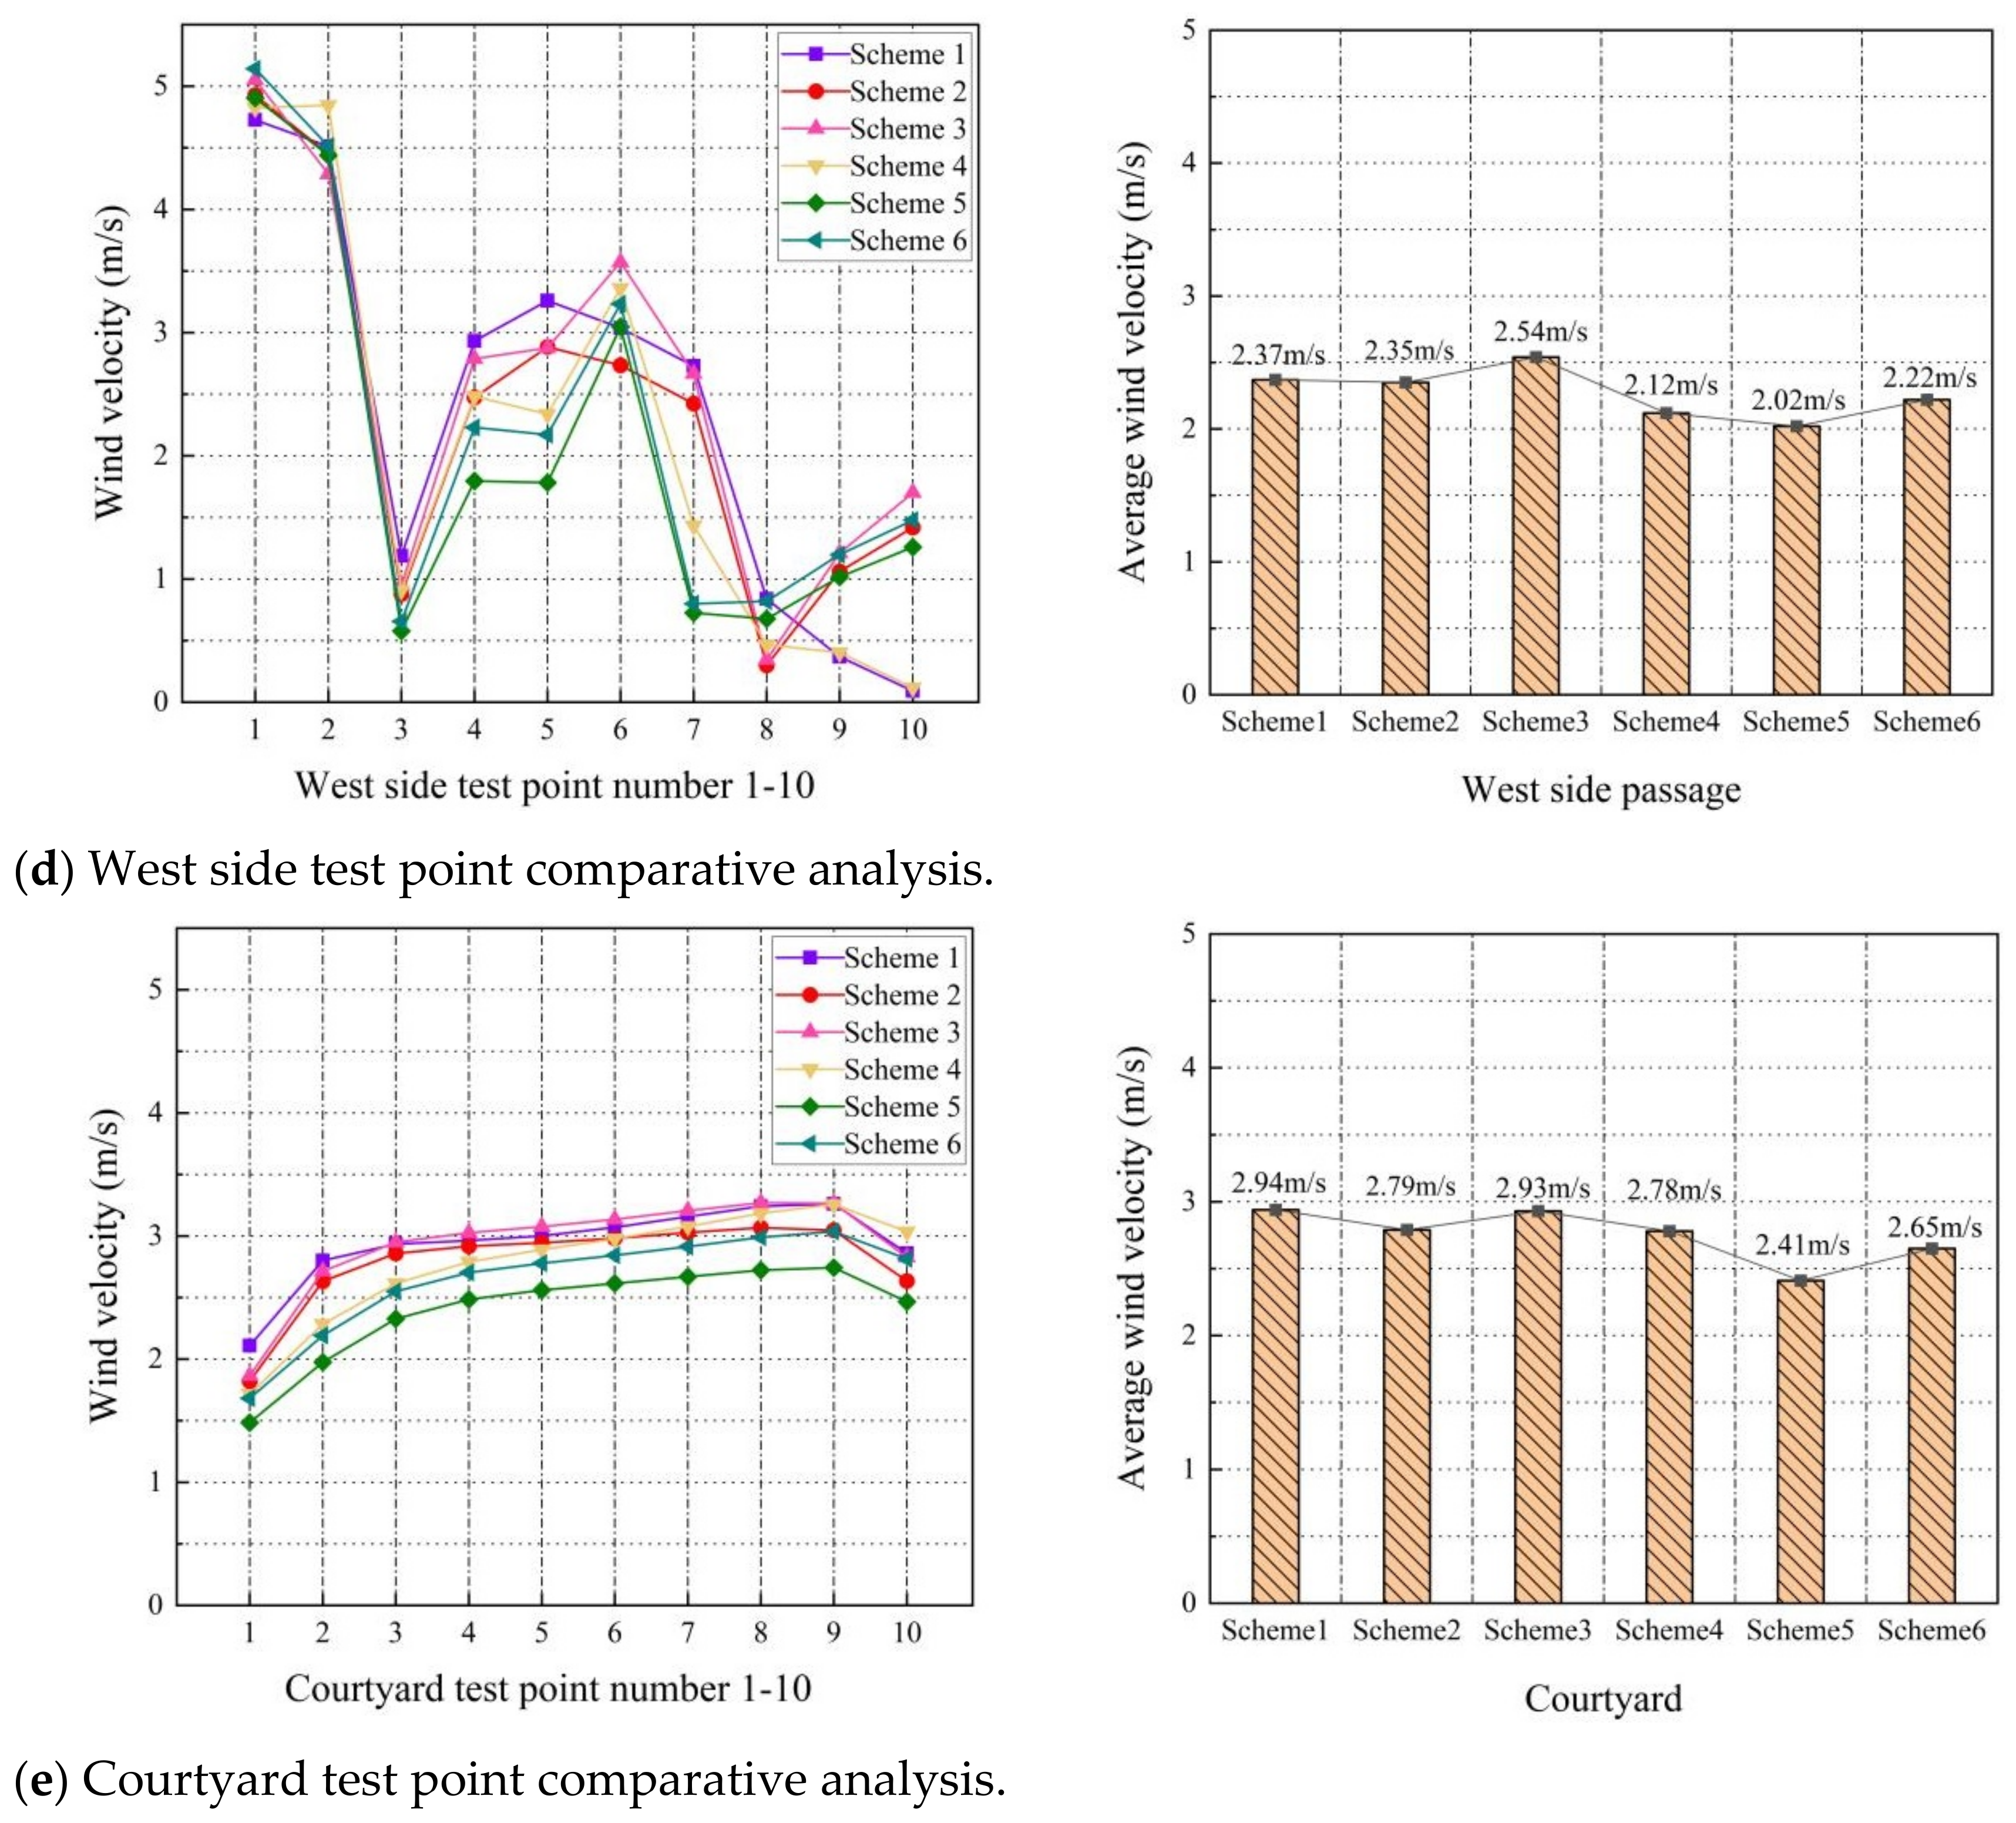
3.2. Comparative Analysis of Test Points

3.2.1. North Passage

The comparative analysis of the wind speed values at each test point of the wind environment simulation of the teacher–student dormitory is shown in Figure 15. As can be seen from the comparison of wind speeds at the 1~10 test points of the north passage (Figure 15a), each scheme shows a changing trend from east to west, decreasing from 1~3 points and gradually increasing from 3~10, with the wind speed at the west end slightly higher than that at the east end. This is due to the formation of side winds at the corners of the building, where the wind speed increases steeply, while the vortex area on the windward side leads to a decrease in the wind speed at the test points in the middle part of the passage. The average wind velocity comparison is as follows: scheme 6 (4.04 m/s) > scheme 5 (3.96 m/s) > scheme 2 (3.91 m/s) = scheme 3 (3.91 m/s) > scheme 4 (2.91 m/s) > scheme 1 (2.90 m/s). The average wind speeds of schemes 1 (2.90 m/s) and 4 (2.91 m/s) are similar and significantly lower than the rest of the schemes (wind speed increased by 38%), which is different from the general assumption that wind speeds are lower in the presence of a building barrier on the windward side. This is due to the passage between the undergraduate dormitory and the teachers’ apartments on the north side of the remaining schemes being too narrow (20 m), enhancing the airflow in the narrow tube, accelerating the body heat loss in winter.

3.2.2. East Passage

Comparing the wind speed change diagrams of each test point in the east passage, it can be seen (Figure 15b) that the change trend of each scheme is consistent, showing a slight fluctuation from north to south. The difference between wind speed at the north and south ends and the middle section is not significant. The average wind velocity comparison is as follows: scheme 3 (4.40 m/s) > scheme 6 (4.38 m/s) > scheme 2 (4.29 m/s) > scheme 5 (4.22 m/s) > scheme 1 (4.00 m/s) > scheme 4 (3.81 m/s). There is not much difference between the schemes, and all of them show the characteristics of higher wind speed. This is due to the fact that the east passage is far away from the wind shadow area formed by the stadium and lacks a suitable barrier to alleviate the strong wind. The high-speed airflow passes through the narrow channel between the grandstand and the equipment room causing the wind speed to further increase.

3.2.3. South Passage

Comparing the wind speed change graphs of each test point in the south side passage (Figure 15c), it can be observed that the trends of all schemes are the same. The wind speeds decrease abruptly from test point 1 to 3, while the fluctuation from test point 3 to 10 is smoother, showing an overall decrease from the east side to the west side. The average wind velocity comparison is as follows: scheme 5 (2.44 m/s) > scheme 6 (2.38 m/s) > scheme 2 (2.16 m/s) > scheme 3 (1.92 m/s) > scheme 4 (1.17 m/s) > scheme 1 (1.10 m/s). The wind speed of scheme 1 and 4 is significantly lower compared to the other schemes which is due to the strong canyon wind effect formed in the south passage by the aligned layout along with the building barrier on the north side of the teacher–student dormitory. The high-speed airflow in scheme 1 and 4 is concentrated in the passage of the north side of the open space and the west side of the square, while the wind speed in the south passage is lower.

3.2.4. West Passage

The wind speed variations at each test point in the west side square exhibit significant fluctuations (Figure 15d). The trend is characterized by a steep decrease from the north to the south, a slow increase at point 3, followed by continuous decreases. This is due to the complexity of the wind field in the west side square, which is simultaneously affected by the wind fields in the north side passage, south side passage, and courtyard canyon. The corner wind in the north side and the wind through the courtyard lead to a steep increase in the wind speed, while the wind speed of each test point located in the wind shadow area in the south side is lower. The average wind velocity comparison is as follows: scheme 3 (2.54 m/s) > scheme 1 (2.37 m/s) > scheme 2 (2.35 m/s) > scheme 6 (2.22 m/s) > scheme 4 (2.12 m/s) > scheme 5 (2.02 m/s). The difference in the average wind speed at each test point of each scheme is not significant, showing that the impact of the large square’s location and layout mode on the wind environment of the west side square is limited.

3.2.5. Courtyard

Comparing the wind speed variations at each test point in the courtyard of the dormitory, it can be seen (Figure 15e) that there is minimal change in the wind speed from the east to the west. The trend is gradual, with slightly lower wind speeds at the east and west ends compared to the middle position. This can be attributed to the implementation of the enclosed layout mode in all schemes. The average wind velocity comparison is as follows: scheme 1 (2.94 m/s) > scheme 3 (2.93 m/s) > scheme 2 (2.79 m/s) > scheme 4 (2.78 m/s) > scheme 6 (2.65 m/s) > scheme 5 (2.41 m/s). Since the width of the north passage is similar to that of the courtyard, comparing the average wind velocity in the courtyard and the north passage can be found that the average wind velocity in the courtyard dropped by 23.8%. The enclosed courtyard layout can effectively cope with the weather background of strong winds through mitigating the high-speed airflow. The wind field within the courtyard is stable and appropriate compared to passages.

4. Discussion

4.1. Implications of Wind Environment Optimization Research

This study is based on the existing university campus. In view of the current wind environment problem in winter, several different dormitory area layouts are compared through CFD simulation and a winter wind protection strategy suitable for dormitory areas in the coastal areas of southern Fujian is proposed. Many scholars have used similar research methods to conduct exploration in different regions [37,47,48,49,50,51,52,53]. Comparing these research results, it can be found that China has a vast territory and the climate varies greatly between different regions. For the inland areas in the south with hot summers and warm winters, in order to cope with the high temperature and high humidity climate, it is more important to increase the openness of the building layout and strengthen natural ventilation in summer than to prevent wind in winter. For northern China, where the winter temperature can reach below 0 °C, whether on the coast or inland, the need for winter wind protection always precedes natural ventilation, and an enclosed layout with lower wind speed may be a more suitable choice. However, in the hot and humid coastal areas of the south, sea wind and land wind fluctuate. In order to balance winter wind protection and summer ventilation, a high-enclosure layout should be prevented so that heat accumulation in the courtyard during summer does not occur. Some movable components can be used to improve layout enclosure, such as movable windbreak. Outdoor microclimate research must be targeted and designed based on local climate conditions.
In practical applications, plans can be compared in the early stages of project design to guide optimal design, which can help promote the positive design of buildings. This study demonstrates the important impact of layout on the wind environment surrounding buildings and highlights the need for the wind environmental assessment of alternatives during the design phase of large-scale projects such as residence halls. Although it is impractical to make changes to the layout of current dormitory areas, it is still possible to optimize the outdoor wind environment through the use of trees, landscaping, and movable windbreaks. The optimization strategy proposed in this research can be applied to the subsequent construction of dormitory areas in other cities with similar climate conditions on the southeast coast.

4.2. Limitations and Future Work

Although this study has made a number of important findings, it inevitably has some limitations. Firstly, the study focuses on the impact of layout mode on the wind environment of the dormitory area. However, this study is limited to an existing university campus, constrained by the road network and the surrounding buildings. The explored layout modes within the dormitory area are limited within a certain framework, and the relationship between the position of the dormitory area and the wind environment can be further investigated. Secondly, the building models in and around the study area are abstracted and simplified into a mix of smooth surface and regular-shaped blocks. To some extent, the original detailed structures of the buildings, such as the sloped roofs frequently used in dormitory buildings, are ignored. This may result in inconsistency between the simulation results and the real winter wind conditions in the dormitory area. Thirdly, the pedestrian level wind comfort can be significantly improved under low wind speed conditions in winter. However, excessively low wind speed can impair summertime thermal comfort. Therefore, future work should further investigate the impact of layout modes on pedestrian wind and thermal comfort during the summer season. Additionally, the vegetation, water bodies, and landscape vignettes in the dormitory area also influence the outdoor wind environment, which are not considered in this paper. Subsequent research will focus on incorporating vegetation, water bodies, and landscape vignettes into numerical models to simulate different building layouts in different seasons.

5. Conclusions

In this study, we utilized subjective questionnaires, objective physical measurements, and CFD simulations to investigate the effects of different layouts on the winter wind environment of college dormitory areas in the coastal region of Minnan. Our findings indicate the following:
(1)
Dormitory buildings in the southern region prioritize natural ventilation in summer, often featuring high openness designs. However, this results in a strong wind velocity value exceeding 9 m/s in outdoor spaces such as courtyards in winter. The strong wind generates doorway wind noise and negatively affects the physical and mental health of the students and teachers, and this issue deserves attention.
(2)
The research results recommend placing the dormitory area downwind of large buildings such as gymnasiums, and to use the wind shadow area formed by large-scale buildings to optimize winter winds and avoid the design of large-area internal open squares. The large square can be broken down into multiple small squares to meet the needs of outdoor activities.
(3)
The shielding effect between buildings can weaken airflow, but when the distance between buildings in the dormitory area is less than 20 m, the narrow tube effect between buildings causes the wind velocity value to increase by 38%. The appropriate distance should be determined according to local conditions through CFD simulation in the early planning stage.
(4)
In the hot and humid coastal areas of the south, where sea wind and land wind fluctuate, an enclosed dormitory group layout is suggested which can reduce the wind velocity value by 23.8% compared with passages and maintain the stable air flow in the dormitory courtyard.
This study quantitatively evaluated wind comfort of the target building from wind velocity value. Such quantitative evaluation methods can be applied to similar issues. The findings enrich the knowledge of how the layout influences wind comfort around the dormitory area, which can inspire architects and city planners to make good use of building design to create a livable and comfortable residential environment.

Author Contributions

Data analysis and writing, Z.W. and B.L.; methodology, X.H.; software, B.L.; validation, Z.X.; formal analysis, F.S.; investigation, B.L.; supervision, X.H. All authors have read and agreed to the published version of the manuscript.

Funding

This research was funded by Fujian Natural Science Foundation, China (2021J01639); National Natural Science Foundation of China (52208052); Program of Humanities and Social Science Research Program of Ministry of Education of China (Grant No. 21YJCZH038); Fujian Natural Science Foundation, China (2023J05108); National Natural Science Foundation of China (52078443); Fuzhou University (XRC-21027).

Data Availability Statement

Data are contained within the article.

Conflicts of Interest

The authors declare no conflict of interest.

References

  1. Wu, Z.; Li, N.; Wargocki, P.; Peng, J.; Li, J.; Cui, H. Adaptive thermal comfort in naturally ventilated dormitory buildings in Changsha, China. Energy Build. 2019, 186, 56–70. [Google Scholar] [CrossRef]
  2. Hou, H.C.; Lai, J.H.K.; Edwards, D. Gap theory based post-occupancy evaluation (GTbPOE) of dormitory building performance: A case study and a comparative analysis. Build. Environ. 2020, 185, 107312. [Google Scholar] [CrossRef] [PubMed]
  3. He, Y.; Li, N.; Peng, J.; Zhang, W.; Li, Y. Field study on adaptive comfort in air conditioned dormitories of university with hot-humid climate in summer. Energy Build. 2016, 119, 1–12. [Google Scholar] [CrossRef]
  4. Blocken, B.; Janssen, W.D.; van Hooff, T. CFD simulation for pedestrian wind comfort and wind safety in urban areas: General decision framework and case study for the Eindhoven University campus. Environ. Model. Softw. 2012, 30, 15–34. [Google Scholar] [CrossRef]
  5. Kubota, T.; Miura, M.; Tominaga, Y.; Mochida, A. Wind tunnel tests on the relationship between building density and pedestrian-level wind velocity: Development of guidelines for realizing acceptable wind environment in residential neighborhoods. Build. Environ. 2008, 43, 1699–1708. [Google Scholar] [CrossRef]
  6. Tsang, C.W.; Kwok, K.C.S.; Hitchcock, P.A. Wind tunnel study of pedestrian level wind environment around tall buildings: Effects of building dimensions, separation and podium. Build. Environ. 2012, 49, 167–181. [Google Scholar] [CrossRef]
  7. Al-Quraan, A.; Stathopoulos, T.; Pillay, P. Comparison of wind tunnel and on site measurements for urban wind energy estimation of potential yield. J. Wind Eng. Ind. Aerodyn. 2016, 158, 1–10. [Google Scholar] [CrossRef]
  8. Yan, B.W.; Li, Q.S. Coupled on-site measurement/CFD based approach for high-resolution wind resource assessment over complex terrains. Energy Convers. Manag. 2016, 117, 351–366. [Google Scholar] [CrossRef]
  9. Zheng, S.; Wang, Y.; Zhai, Z.; Xue, Y.; Duanmu, L. Characteristics of wind flow around a target building with different surrounding building layers predicted by CFD simulation. Build. Environ. 2021, 201, 107962. [Google Scholar] [CrossRef]
  10. Cui, D.; Li, X.; Liu, J.; Yuan, L.; Mak, C.M.; Fan, Y.; Kwok, K. Effects of building layouts and envelope features on wind flow and pollutant exposure in height-asymmetric street canyons. Build. Environ. 2021, 205, 108177. [Google Scholar] [CrossRef]
  11. Wen, C.-Y.; Juan, Y.-H.; Yang, A.-S. Enhancement of city breathability with half open spaces in ideal urban street canyons. Build. Environ. 2017, 112, 322–336. [Google Scholar] [CrossRef]
  12. Stathopoulos, T.; Wu, H.; Zacharias, J. Outdoor human comfort in an urban climate. Build. Environ. 2004, 39, 297–305. [Google Scholar] [CrossRef]
  13. Huang, T.; Li, J.; Xie, Y.; Niu, J.; Mak, C.M. Simultaneous environmental parameter monitoring and human subject survey regarding outdoor thermal comfort and its modelling. Build. Environ. 2017, 125, 502–514. [Google Scholar] [CrossRef]
  14. Shui, T.; Liu, J.; Yuan, Q.; Qu, Y.; Jin, H.; Cao, J.; Liu, L.; Chen, X. Assessment of pedestrian-level wind conditions in severe cold regions of China. Build. Environ. 2018, 135, 53–67. [Google Scholar] [CrossRef]
  15. Zhang, H.; Xiong, M.; Chen, B.; Wang, Y. Influence of Tropical Cyclones on Outdoor Wind Environment in High-Rise Residential Areas in Zhejiang Province, China. Sustainability 2022, 14, 3932. [Google Scholar] [CrossRef]
  16. Zhang, X.; Gao, Y.; Tao, Q.; Min, Y.; Fan, J. Improving the pedestrian-level wind comfort by lift-up factors of panel residence complex: Field-measurement and CFD simulation. Build. Environ. 2023, 229, 109947. [Google Scholar] [CrossRef]
  17. Xu, F.; Gao, Z.; Zhang, J.; Hu, Y.; Ding, W. Influence of typical street-side public building morphologies on the ventilation performance of streets and squares. Build. Environ. 2022, 221, 109331. [Google Scholar] [CrossRef]
  18. Nugroho, N.Y.; Triyadi, S.; Wonorahardjo, S. Effect of high-rise buildings on the surrounding thermal environment. Build. Environ. 2022, 207, 108393. [Google Scholar] [CrossRef]
  19. Jin, H.; Qiao, L.; Cui, P. Study on the Effect of Streets’ Space Forms on Campus Microclimate in the Severe Cold Region of China-Case Study of a University Campus in Daqing City. Int. J. Environ. Res. Public Health 2020, 17, 8389. [Google Scholar] [CrossRef]
  20. Fan, L.; Ren, S.; Ma, Y.; Liu, Q. The Coupling Relationship between Building Morphology and Outdoor Wind Environment in the High-Rise Dormitory Area in China. Energies 2023, 16, 3655. [Google Scholar] [CrossRef]
  21. Hong, B.; Lin, B. Numerical studies of the outdoor wind environment and thermal comfort at pedestrian level in housing blocks with different building layout patterns and trees arrangement. Renew. Energy 2015, 73, 18–27. [Google Scholar] [CrossRef]
  22. Li, L.; Yang, X.; Qian, Y. CFD Simulation Analysis of the Influence of Floor Area Ratio on the Wind Environment in Residential Districts. J. Eng. Sci. Technol. Rev. 2018, 11, 185–192. [Google Scholar] [CrossRef]
  23. Wei, D.; Hu, X.; Chen, Y.; Li, B.; Chen, H. An Investigation of the Quantitative Correlation between Urban Spatial Morphology Indicators and Block Wind Environment. Atmosphere 2021, 12, 234. [Google Scholar] [CrossRef]
  24. Feng, W.; Ding, W.; Fei, M.; Yang, Y.; Zou, W.; Wang, L.; Zhen, M. Effects of traditional block morphology on wind environment at the pedestrian level in cold regions of Xi’an, China. Environ. Dev. Sustain. 2020, 23, 3218–3235. [Google Scholar] [CrossRef]
  25. van Moeseke, G.; Gratia, E.; Reiter, S.; De Herde, A. Wind pressure distribution influence on natural ventilation for different incidences and environment densities. Energy Build. 2005, 37, 878–889. [Google Scholar] [CrossRef]
  26. Yang, Y.; Gou, A. Research on Wind Environment Simulation of Commercial District Based on Phoenics—Taking Shanghai Central Building Group as an Example. IOP Conf. Ser. Earth Environ. Sci. 2021, 647, 012193. [Google Scholar] [CrossRef]
  27. Ying, X.; Wang, Y.; Li, W.; Liu, Z.; Ding, G. Group Layout Pattern and Outdoor Wind Environment of Enclosed Office Buildings in Hangzhou. Energies 2020, 13, 406. [Google Scholar] [CrossRef]
  28. Li, S.-Y.; Chen, Z.; Guo, L.-H.; Hu, F.; Huang, Y.-J.; Wu, D.-C.; Wu, Z.; Hong, X.-C. How Do Spatial Forms Influence Psychophysical Drivers in a Campus City Community Life Circle? Sustainability 2023, 15, 10014. [Google Scholar] [CrossRef]
  29. GB/T50378-2019; Assessment Standard for Green Building. China Architecture & Building Press: Beijing, China, 2019; pp. 30–31.
  30. Mochida, A.; Lun, I.Y.F. Prediction of wind environment and thermal comfort at pedestrian level in urban area. J. Wind Eng. Ind. Aerodyn. 2008, 96, 1498–1527. [Google Scholar] [CrossRef]
  31. Ghasemi, Z.; Esfahani, M.A.; Bisadi, M. Promotion of Urban Environment by Consideration of Human Thermal & Wind Comfort: A Literature Review. Procedia-Soc. Behav. Sci. 2015, 201, 397–408. [Google Scholar] [CrossRef]
  32. Chen, L.; Mak, C.M. Integrated impacts of building height and upstream building on pedestrian comfort around ideal lift-up buildings in a weak wind environment. Build. Environ. 2021, 200, 107963. [Google Scholar] [CrossRef]
  33. Janssen, W.D.; Blocken, B.; van Hooff, T. Pedestrian wind comfort around buildings: Comparison of wind comfort criteria based on whole-flow field data for a complex case study. Build. Environ. 2013, 59, 547–562. [Google Scholar] [CrossRef]
  34. Toja-Silva, F.; Kono, T.; Peralta, C.; Lopez-Garcia, O.; Chen, J. A review of computational fluid dynamics (CFD) simulations of the wind flow around buildings for urban wind energy exploitation. J. Wind Eng. Ind. Aerodyn. 2018, 180, 66–87. [Google Scholar] [CrossRef]
  35. Wang, H.; Chen, Q. A new empirical model for predicting single-sided, wind-driven natural ventilation in buildings. Energy Build. 2012, 54, 386–394. [Google Scholar] [CrossRef]
  36. Chen, L.; Mak, C.M. Numerical evaluation of pedestrian-level wind comfort around “lift-up” buildings with various unconventional configurations. Build. Environ. 2021, 188, 107429. [Google Scholar] [CrossRef]
  37. Kang, G.; Kim, J.-J.; Choi, W. Computational fluid dynamics simulation of tree effects on pedestrian wind comfort in an urban area. Sustain. Cities Soc. 2020, 56, 102086. [Google Scholar] [CrossRef]
  38. Zahid Iqbal, Q.M.; Chan, A.L.S. Pedestrian level wind environment assessment around group of high-rise cross-shaped buildings: Effect of building shape, separation and orientation. Build. Environ. 2016, 101, 45–63. [Google Scholar] [CrossRef] [PubMed]
  39. Liu, J.; Niu, J.; Du, Y.; Mak, C.M.; Zhang, Y. LES for pedestrian level wind around an idealized building array—Assessment of sensitivity to influencing parameters. Sustain. Cities Soc. 2019, 44, 406–415. [Google Scholar] [CrossRef]
  40. Blocken, B.; Stathopoulos, T.; van Beeck, J.P.A.J. Pedestrian-level wind conditions around buildings: Review of wind-tunnel and CFD techniques and their accuracy for wind comfort assessment. Build. Environ. 2016, 100, 50–81. [Google Scholar] [CrossRef]
  41. Huo, H.; Chen, F.; Geng, X.; Tao, J.; Liu, Z.; Zhang, W.; Leng, P. Simulation of the Urban Space Thermal Environment Based on Computational Fluid Dynamics: A Comprehensive Review. Sensors 2021, 21, 6898. [Google Scholar] [CrossRef]
  42. Du, Y.; Mak, C.M.; Li, Y. A multi-stage optimization of pedestrian level wind environment and thermal comfort with lift-up design in ideal urban canyons. Sustain. Cities Soc. 2019, 46, 101424. [Google Scholar] [CrossRef]
  43. Li, X.; Wang, J.; Eftekhari, M.; Qi, Q.; Jiang, D.; Song, Y.; Tian, P.; Yao, H. Improvement Strategies Study for Outdoor Wind Environment in a University in Beijing Based on CFD Simulation. Adv. Civ. Eng. 2020, 2020, 8850254. [Google Scholar] [CrossRef]
  44. JGJ286-2013; Design Standard for Thermal Environment of Urban Residential Areas. China Architecture & Building Press: Beijing, China, 2014; pp. 1–78.
  45. Snyder, W.H. Guideline for Fluid Modeling of Atmospheric Diffusion; Fluid Modeling Report No. 10; Environmental Protection Agency: Research Triangle Park, NC, USA, 1981; pp. 197–200.
  46. Ferziger, J.H.; Peri, M.; Street, R.L. Computational Methods for Fluid Dynamics; Springer: Berlin/Heidelberg, Germany, 2020. [Google Scholar]
  47. Yang, S.; Zhou, D.; Wang, Y.; Li, P. Comparing impact of multi-factor planning layouts in residential areas on summer thermal comfort based on orthogonal design of experiments (ODOE). Build. Environ. 2020, 182, 107145. [Google Scholar] [CrossRef]
  48. Srivanit, M.; Jareemit, D. Modeling the influences of layouts of residential townhouses and tree-planting patterns on outdoor thermal comfort in Bangkok suburb. J. Build. Eng. 2020, 30, 101262. [Google Scholar] [CrossRef]
  49. Peng, Z.; Chen, Y.; Deng, W.; Lun, I.Y.F.; Jiang, N.; Lv, G.; Zhou, T. An Experimental and Numerical Study of the Winter Outdoor Wind Environment in High-Rise Residential Complexes in a Coastal City in Northern China. Buildings 2022, 12, 2011. [Google Scholar] [CrossRef]
  50. Ma, T.; Chen, T. Classification and pedestrian-level wind environment assessment among Tianjin’s residential area based on numerical simulation. Urban Clim. 2020, 34, 100702. [Google Scholar] [CrossRef]
  51. Hong, X.-C.; Cheng, S.; Liu, J.; Guo, L.-H.; Dang, E.; Wang, J.-B.; Cheng, Y. How Should Soundscape Optimization from Perceived Soundscape Elements in Urban Forests by the Riverside Be Performed? Land 2023, 12, 1929. [Google Scholar] [CrossRef]
  52. Hong, X.-C.; Liu, J.; Wang, G.-Y. Soundscape in Urban Forests. Forests 2022, 13, 2056. [Google Scholar] [CrossRef]
  53. Guo, L.-H.; Cheng, S.; Liu, J.; Wang, Y.; Cai, Y.; Hong, X.-C. Does social perception data express the spatio-temporal pattern of perceived urban noise? A case study based on 3,137 noise complaints in Fuzhou, China. Appl. Acoust. 2022, 201, 109129. [Google Scholar] [CrossRef]
Figure 1. Location (left) and wind environment of Jinjiang (right).
Buildings 13 03030 g001
Figure 2. Dormitory area and surrounding buildings.
Buildings 13 03030 g002
Figure 3. North open corridor and south open balcony.
Buildings 13 03030 g003
Figure 4. Wind environment satisfaction.
Buildings 13 03030 g004
Figure 5. Outdoor dissatisfaction ranking.
Buildings 13 03030 g005
Figure 6. Indoor dissatisfaction ranking.
Buildings 13 03030 g006
Figure 7. Measuring point layout.
Buildings 13 03030 g007
Figure 8. Twenty-four hour wind speed measured data.
Buildings 13 03030 g008
Figure 9. Modeling area.
Buildings 13 03030 g009
Figure 10. Grid arrangements.
Buildings 13 03030 g010
Figure 11. Grid sensitivity analysis.
Buildings 13 03030 g011
Figure 12. Wind contour.
Buildings 13 03030 g012
Figure 13. Scheme design.
Buildings 13 03030 g013
Figure 14. Wind speed simulation at 1.5 m pedestrian height outdoor for each scheme.
Buildings 13 03030 g014aBuildings 13 03030 g014b
Figure 15. Comparative analysis of test points.
Buildings 13 03030 g015aBuildings 13 03030 g015b
Table 1. Representative literature regarding building morphology and wind environment.
TypeSub-FactorsRef.Method
Residential buildingPedestrian-level wind in severe cold regions of China[14]Numerical simulation
Influence of tropical cyclones on outdoor wind environments[15]Numerical simulation
Effects of lift-up ratio and positions of lift-up design around a residence[16]Numerical simulation
Building layout patterns and trees arrangement[21]Numerical simulation + wind tunnel test
Relationship between FAR and the wind environment in residential districts[22]Numerical simulation + field measurement
City blockPublic building morphology and urban ventilation is currently scarce[17]Numerical simulation + field measurement
Urban Spatial Morphology Indicators and Block Wind Environment[23]Questionnaire + numerical simulation
Block morphology on wind environment[24]Questionnaire + numerical simulation
Office buildingNatural ventilation performance of closed office buildings with different layouts[18]Numerical simulation
Group Layout Pattern and Outdoor Wind Environment[25]Numerical simulation
Research on Wind Environment Simulation of Commercial District[26]Numerical simulation
Wind pressure distribution influence on natural ventilation[27]Numerical simulation
Campus buildingEffect of Streets’ Space Forms on Campus Microclimate[19]Numerical simulation + field measurement
Effects of building layout, building length, width, and height on dormitory[20]Numerical simulation + field measurement
Table 2. Specifications of measuring instruments.
Meteorological Parameter Wind VelocityAir TemperatureRelative HumidityPressureAltitude
Measuring range0.0~60 m/s−29~70 °C0~100%750~1100 hpa/mbAt 25 °C, <6000 m
Accuracy±3%1 °C3%1.5 hpa/mb15 m
Measurement resolution0.1 m/s0.1 °C0.10.1 hpa/mb1 m
Table 3. Simulation parameter settings.
Boundary Conditions Value
Wind velocity5.5 m/s
wind directionNE
Ground roughness0.22
Gradient wind height10 m
FluidIdeal gas
Atmospheric pressure1025.5 mb
Turbulence modelsStandard k-ε
Table 4. Model validation.
Test PointXmeXsimDeviation
A12.262.322%Buildings 13 03030 i001
A22.142.3811%
B12.001.838%
B22.082.237%
C10.050.0420%
C20.430.329%
Disclaimer/Publisher’s Note: The statements, opinions and data contained in all publications are solely those of the individual author(s) and contributor(s) and not of MDPI and/or the editor(s). MDPI and/or the editor(s) disclaim responsibility for any injury to people or property resulting from any ideas, methods, instructions or products referred to in the content.

