


Analysis of Sectoral Environmental Product Declarations as a Data Source for Life Cycle Assessment


Abstract
:1. Introduction
2. Materials and Methods
2.1. Sectoral EPD Analysis in the Context of Construction Products in Spain
- Established objective and scope, and the association and declaration of the different products that each association represents; current regulation applicable to the development of the EPD, including the recently updated EN 15804:2020+A2 standard, the old and new standard having co-existed until the end of October 2022;
- Declared life cycle stages, which, although already established in the current mandatory standard, were affected by the recent update;
- Compliance PCRs: these being the specific regulations established for each category or product family that aim to provide detailed guidelines for the specific preparation of their EPDs.
2.2. Sectoral EPD Analysis in the International Context of Ceramic Bricks for Cladding, Corrugated Steel Bars, and Mass Concrete Production
3. Results
3.1. Results of Sectoral EPD Analysis in the Context of Construction Products in Spain
3.2. Results of Sectoral EPD Analysis in the International Context of Ceramic Bricks for Cladding, Corrugated Steel Bars, and Mass Concrete Production

| EN 15804+A1 | Stages A1–3 % of the Country Compared to Average | Stage A4 % of the Country Compared to Average | Stage A5 % of the Country Compared to Average | |||||||||||
|---|---|---|---|---|---|---|---|---|---|---|---|---|---|---|
| Unit Indicator | AVG. 1 A1–3 | Spain (%) | UK (%) | Germany (%) | AVG. 1 A4 | Spain (%) | UK (%) | Germany (%) | AVG. 1 A5 | Spain (%) | UK (%) | Germany (%) | ||
| Impact assessment | (kg CO2-eq.) | GWP | 2.15 × 10² | 9.7 | −1.0 | −8.7 | 6.53 × 100 | −28.2 | 22.8 | 5.4 | 5.10 × 100 | −88.9 | 124.8 | −35.9 |
| (kg CFC 11-eq.) | ODP | 6.17 × 10⁻⁶ | −99.7 | 199.7 | −100.0 | 4.93 × 10⁻⁷ | −100.0 | 200.0 | −100.0 | 3.60 × 10⁻⁷ | −99.9 | 199.9 | −100.0 | |
| (kg SO2-eq.) | AP | 1.51 × 100 | −41.3 | 130.5 | −89.2 | 1.45 × 10⁻² | −19.8 | 86.7 | −66.9 | 5.97 × 10⁻² | −97.2 | 196.7 | −99.5 | |
| (kg Phosphat-eq.) | EP | 6.83 × 10² | −4.7 | 56.6 | −51.9 | 3.65 × 10⁻³ | −21.9 | 94.0 | −72.1 | 2.14 × 10⁻³ | −87.0 | 183.9 | −96.9 | |
| (kg NMVOC eq.) | POCP | 9.20 × 10⁻² | −15.1 | 92.4 | −77.3 | 3.15 × 10⁻⁴ | −1230.9 | 1386.7 | −155.8 | 3.17 × 10⁻³ | −94.8 | 194.1 | −99.3 | |
| (kg Sb-eq.) | ADPE | 5.05 × 10⁻⁵ | −79.6 | 145.5 | −65.9 | 7.37 × 10⁻⁶ | −95.0 | 186.4 | −91.4 | 2.81 × 10⁻⁶ | −100.6 | 199.8 | −99.2 | |
| (MJ) | ADPF | 2.26 × 10³ | 6.4 | 5.0 | −11.4 | 9.25 × 101 | −30.9 | 31.0 | 0.0 | 4.50 × 101 | −91.6 | 190.6 | −98.9 | |
| Resource use | (MJ) | PERE | 2.99 × 10² | 34.8 | −59.9 | 25.1 | 3.80 × 100 | 15.9 | −57.7 | 41.7 | 2.21 × 100 | −81.1 | 178.5 | −97.5 |
| (MJ) | PERM | 1.85 × 10⁻⁴ | 5.99 × 10⁻⁶ | 9.90 × 10⁻⁶ | 0% | |||||||||
| (MJ) | PERT | 2.99 × 10² | 34.8 | −59.9 | 25.1 | 3.80 × 100 | 15.9 | −57.7 | 41.7 | 2.21 × 100 | −81.1 | 178.5 | −97.5 | |
| (MJ) | PENRE | 2.33 × 10³ | 8.0 | 4.1 | −12.1 | 9.23 × 101 | −30.4 | 30.0 | 0.4 | 4.60 × 101 | −91.5 | 191.3 | −99.8 | |
| (MJ) | PENRM | |||||||||||||
| (MJ) | PENRT | 2.33 × 10³ | 8.0 | 4.1 | −12.1 | 9.23 × 101 | −30.4 | 30.0 | 0.4 | 4.60 × 101 | −91.5 | 191.3 | −99.8 | |
| (Kg) | SM | 2.47 × 10² | 0% | |||||||||||
| (MJ) | RSF | 3.92 × 10⁻³ | 0% | |||||||||||
| (MJ) | NRSF | 4.12 × 10⁻² | 0% | |||||||||||
| (m3 world eq.) | FW | 3.89 × 100 | 170.2 | −77.8 | −92.3 | 1.20 × 10⁻¹ | 174.1 | −78.3 | −95.8 | 8.70 × 10⁻² | 139.0 | −47.1 | −91.9 | |
| Wast × 10 | (Kg) | HWD | 4.63 × 10⁻¹ | −99.9 | 199.9 | −100.0 | 2.55 × 10⁻² | −100.0 | 100.0 | −100.0 | 3.75 × 10⁻² | −100.0 | 100.0 | −100.0 |
| (Kg) | NHWD | 1.82 × 100 | −97.3 | 197.3 | −100.0 | 2.83 × 100 | −100.0 | 100.0 | −100.0 | 4.37 × 10⁻¹ | 3681.3 | 97.0 | −97.0 | |
| (Kg) | RWD | 3.42 × 10⁻² | 35.7 | −79.6 | 43.9 | 3.48 × 10⁻⁴ | −68.1 | 140.1 | −72.0 | 1.50 × 10⁻⁴ | −100.0 | 190.6 | −90.6 | |
| Outflows | (Kg) | CRU | 3.36 × 101 | 0% | 5.17 × 101 | 0% | ||||||||
| (Kg) | MFR | 1.74 × 10⁻¹ | 0% | 1.41 × 101 | 0% | |||||||||
| (Kg) | MER | 9.40 × 10⁻³ | 0% | 1.10 × 10⁻¹ | 0% | |||||||||
| (MJ) | EEE | 4.47 × 10⁻² | 0% | 3.33 × 100 | −78.7 | 78.7 | ||||||||
| (MJ) | EET | 1.37 × 101 | ||||||||||||
| Stage C2 % of the Country Compared to the Average | Stage C3 % of the Country Compared to the Average | Stage C4 % of the Country Compared to the Average | Stage D % of Country Compared to Average | ||||||||||||||
|---|---|---|---|---|---|---|---|---|---|---|---|---|---|---|---|---|---|
| EN 15804+A1 Unit Indicator | AVG. 1 C2 | Spain (%) | UK (%) | Germany (%) | AVG. 1 C3 | Spain (%) | UK (%) | Germany (%) | AVG. 1 C4 | Spain (%) | UK (%) | Germany (%) | AVG. 1 D | UK (%) | Germany (%) | ||
| Impact assessment | (kg CO2-eq.) | GWP | 1.90 × 100 | 102.2 | −86.8 | −15.4 | −4.38 × 100 | −127.6 | −173.0 | 300.6 | 3.52 × 100 | 146.1 | −70.8 | −75.3 | −9.27 × 100 | 72.6 | −72.6 |
| (kg CFC 11-eq.) | ODP | 1.54 × 10⁻⁸ | −99.9 | 199.9 | −100.0 | 1.96 × 10⁻⁷ | −100.0 | 200.0 | −100.0 | 9.10 × 10⁻⁸ | −99.9 | 199.9 | −100.0 | −9.15 × 10⁻⁷ | 100.0 | −100.0 | |
| (kg SO2-eq.) | AP | 3.70 × 10⁻³ | 147.3 | −77.3 | −70.0 | 1.64 × 10⁻² | −48.9 | 49.7 | −0.8 | 2.16 × 10⁻² | 141.2 | −66.4 | −74.8 | −5.20 × 10⁻² | 88.2 | −88.2 | |
| (kg Phosphat-eq.) | EP | 9.05 × 10⁻⁴ | 148.7 | −75.6 | −73.1 | 4.03 × 10⁻³ | −49.9 | 51.4 | −1.6 | 3.36 × 10⁻³ | 110.7 | −28.8 | −81.9 | −1.47 × 10⁻² | 92.1 | −92.1 | |
| (kg NMVOC eq.) | POCP | −8.78 × 10⁻⁴ | 212.0 | −116.6 | −95.3 | 2.40 × 10⁻³ | −49.2 | 75.3 | −26.1 | 2.20 × 10⁻³ | 127.3 | −45.5 | −81.8 | −6.32 × 10⁻³ | 91.4 | −91.4 | |
| (kg Sb-eq.) | ADPE | 3.70 × 10⁻⁷ | −19.1 | 78.9 | −59.8 | 2.01 × 10⁻⁶ | 7.2 | −45.1 | 37.9 | 1.60 × 10⁻⁶ | 87.4 | −7.9 | −79.5 | −3.88 × 10⁻⁵ | 98.3 | −98.3 | |
| (MJ) | ADPF | 2.60 × 101 | 102.3 | −85.4 | −16.9 | 3.84 × 101 | −40.4 | 20.3 | 20.0 | 5.01 × 101 | 125.4 | −49.3 | −76.1 | −1.30 × 10² | 76.8 | −76.8 | |
| R × 10source use | (MJ) | PERE | 1.64 × 100 | 120.2 | −96.9 | −23.3 | 2.34 × 100 | −24.2 | −45.5 | 69.7 | 5.68 × 100 | 134.3 | −86.3 | −47.9 | −1.10 × 101 | 14.1 | −14.1 |
| (MJ) | PERM | 1.87 × 10⁻⁷ | −100.0 | −100.0 | 6.37 × 10⁻⁷ | −100.0 | −100.0 | 2.12 × 10⁻⁶ | −100.0 | −100.0 | −3.68 × 10⁻⁵ | −100.0 | |||||
| (MJ) | PERT | 1.64 × 100 | 120.2 | −96.9 | −23.3 | 2.34 × 100 | −24.2 | −45.5 | 69.7 | 5.68 × 100 | 134.3 | −86.3 | −47.9 | −1.10 × 101 | 14.1 | −14.1 | |
| (MJ) | PENRE | 2.61 × 101 | 102.2 | −85.6 | −16.6 | 3.87 × 101 | −39.3 | 17.5 | 21.7 | 5.50 × 101 | 112.7 | −53.5 | −59.2 | −1.37 × 10² | 75.8 | −75.8 | |
| (MJ) | PENRM | ||||||||||||||||
| (MJ) | PENRT | 2.61 × 101 | 102.2 | −85.6 | −16.6 | 3.87 × 101 | −39.3 | 17.5 | 21.7 | 5.50 × 101 | 112.7 | −53.5 | −59.2 | −1.37 × 10² | 75.8 | −75.8 | |
| (Kg) | SM | 9.37 × 10² | |||||||||||||||
| (MJ) | RSF | ||||||||||||||||
| (MJ) | NRSF | ||||||||||||||||
| (m3 world eq.) | FW | 9.03 × 10⁻² | 197.8 | −99.1 | −98.7 | 1.89 × 10⁻¹ | 189.3 | −95.8 | −93.5 | 2.19 × 100 | 198.4 | −98.7 | −99.7 | −1.90 × 10⁻¹ | 96.8 | −96.8 | |
| Waste | (Kg) | HWD | 7.95 × 10⁻⁴ | −100.0 | 99.9 | −99.9 | 1.46 × 10⁻² | −100.0 | 100.0 | −100.0 | 9.55 × 10⁻³ | −100.0 | 100.0 | −100.0 | −1.09 × 10⁻¹ | 100.0 | −100.0 |
| (Kg) | NHWD | 9.04 × 10⁻² | −100.0 | 95.8 | −95.8 | 1.88 × 10⁻² | −100.0 | 24.8 | −24.8 | 2.13 × 10² | 153.1 | −53.1 | −100.0 | −1.32 × 101 | −59.4 | 59.4 | |
| (Kg) | RWD | 4.67 × 10⁻⁵ | 95.3 | −44.1 | −51.2 | 3.17 × 10⁻⁴ | −28.1 | 4.7 | 23.4 | 6.80 × 10⁻⁴ | 139.8 | −76.9 | −62.9 | −1.38 × 10⁻³ | −17.4 | 17.4 | |
| Outflows | (Kg) | CRU | 9.00 × 10² | 0% | |||||||||||||
| (Kg) | MFR | 4.60 × 10² | 0% | ||||||||||||||
| (Kg) | MER | ||||||||||||||||
| (MJ) | EEE | ||||||||||||||||
| (MJ) | EET | ||||||||||||||||
| Stages A1–3 Percentage of the Country Compared to the Average | Stages C3 Percentage of the Country Compared to the Average | Stages D Percentage of the Country Compared to the Average | ||||||||||||
|---|---|---|---|---|---|---|---|---|---|---|---|---|---|---|
| EN 15804+A1 Unit Indicator | AVG. 1 A1–3 | Spain (%) | CCL Scand-UK (%) | Arcelor Mittal Europe (%) | Outokumpu Oyj UK, USA and Sweden (%) | AVG. 1 C3 | Arcelor Mittal Europe (%) | Outokumpu Oyj UK, USA and Sweden (%) | AVG. 1 D | Spain (%) | Arcelor Mittal Europe (%) | Outokumpu Oyj UK, USA and Sweden (%) | ||
| Impact assessment | (kg CO2-eq.) | GWP | 1.65 × 10³ | −75.1 | 50.3 | −50.4 | 75.2 | 2.04× 100 | −21.6 | 21.6 | −1.97× 10² | −74.7 | −308.3 | 383.0 |
| (kg CFC 11-eq.) | ODP | 1.43 × 10⁻⁵ | 216.2 | −16.2 | −100.0 | −100.0 | 3.52× 10⁻¹² | −98.7 | 98.7 | −1.69 × 10⁻⁶ | 200.0 | −100.0 | −100.0 | |
| (kg SO2-eq.) | AP | 7.45 × 100 | −61.7 | −40.9 | −77.9 | 180.5 | 6.30 × 10⁻³ | −52.5 | 52.5 | −1.89 × 100 | −84.6 | −133.9 | 218.5 | |
| (kg Phosphat-eq.) | EP | 5.68 × 10⁻¹ | −23.0 | 3.4 | −72.5 | 92.1 | 8.19 × 10⁻⁴ | −45.3 | 45.3 | −1.49 × 10⁻¹ | 8.6 | −131.0 | 122.5 | |
| (kg NMVOC eq.) | POCP | 7.73 × 10⁻¹ | 90.2 | −30.4 | −82.8 | 22.9 | 4.80 × 10⁻⁴ | −45.8 | 45.8 | −6.26 × 10⁻² | −68.5 | −405.3 | 473.8 | |
| (kg Sb-eq.) | ADPE | 5.12 × 10⁻² | −86.8 | −98.3 | −99.8 | 284.9 | 8.05 × 10⁻⁷ | −41.6 | 41.6 | −2.08 × 10⁻² | −46.3 | −105.1 | 151.4 | |
| (MJ) | ADPF | 1.13 × 10⁴ | −55.7 | −100.0 | −25.1 | 180.8 | 2.35 × 101 | −22.4 | 22.4 | −2.58 × 10³ | −77.6 | −265.0 | 342.6 | |
| Resource use | (MJ) | PERE | 2.97 × 10³ | −42.8 | −21.2 | −82.8 | 146.8 | 1.21 × 101 | 0.8 | −0.8 | −7.16 × 10² | −92.5 | −63.0 | 155.5 |
| (MJ) | PERM | 4.21 × 10⁻⁴ | 0.0 | |||||||||||
| (MJ) | PERT | 2.97 × 10³ | −42.8 | −21.2 | −82.8 | 146.8 | 1.21 × 101 | 0.8 | −0.8 | −7.16 × 10² | −92.5 | −63.0 | 155.5 | |
| (MJ) | PENRE | 2.05 × 10⁴ | −64.9 | 38.8 | −55.7 | 81.8 | 3.45 × 101 | −18.1 | 18.1 | −2.69 × 10³ | −73.9 | −256.6 | 330.5 | |
| (MJ) | PENRM | |||||||||||||
| (MJ) | PENRT | 2.05 × 10⁴ | −64.9 | 38.8 | −55.7 | 81.8 | 3.45 × 101 | −18.1 | 18.1 | −2.69 × 10³ | −73.9 | −256.6 | 330.5 | |
| (Kg) | SM | 7.64 × 10² | 46.6 | −96.5 | 50.5 | −0.6 | ||||||||
| (MJ) | RSF | |||||||||||||
| (MJ) | NRSF | |||||||||||||
| (m3 world eq.) | FW | 1.45 × 101 | −83.1 | 50.3 | −89.8 | 122.6 | 1.42 × 10⁻² | −16.6 | 16.6 | 4.33 × 100 | −123.1 | 532.3 | −409.2 | |
| Stages A1–3 Percentage of the Country Compared to the Average | Stages C3 Percentage of the Country Compared to the Average | Stages D Percentage of the Country Compared to the Average | ||||||||||||
|---|---|---|---|---|---|---|---|---|---|---|---|---|---|---|
| EN 15804+A1 Unit Indicator | AVG. 1 A1–3 | Spain (%) | CCL Scand-UK (%) | Arcelor Mittal Europe (%) | Outokumpu Oyj UK, USA and Sweden (%) | AVG. 1 C3 | Arcelor Mittal Europe (%) | Outokumpu Oyj UK, USA and Sweden (%) | AVG. 1 D | Spain (%) | Arcelor Mittal Europe (%) | Outokumpu Oyj UK, USA and Sweden (%) | ||
| Waste | (Kg) | HWD | 3.02 × 100 | −99.2 | 264.0 | −65.9 | −98.9 | 1.67 × 10⁻⁷ | −95.8 | 95.8 | −4.12 × 10⁻² | −91.5 | −100.0 | 191.4 |
| (Kg) | NHWD | 7.69 × 101 | −100.0 | 15.1 | −96.2 | 181.0 | 2.51 × 101 | −99.9 | 99.9 | -1.37 × 101 | −99.9 | 292.6 | −192.7 | |
| (Kg) | RWD | 5.83 × 101 | −99.9 | −99.2 | −99.6 | 298.7 | 4.35 × 10⁻³ | −10.5 | 10.5 | −3.35 × 10⁻² | −94.6 | −98.6 | 193.2 | |
| Outflows | (Kg) | CRU | ||||||||||||
| (Kg) | MFR | 3.62 × 101 | 0.00% | 9.50 × 10² | 0.00% | |||||||||
| (Kg) | MER | |||||||||||||
| (MJ) | EEE | |||||||||||||
| (MJ) | EET | |||||||||||||
| Stages A1–3 Percentage of the Country Compared to the Average (%) | |||||||||||
|---|---|---|---|---|---|---|---|---|---|---|---|
| EN 15804+A1 Unit Indicator | AVG. 1 A1–3 | Spain (Association) | UK (Association) | Germany (Association) | Thinkstep Germany | Denmark (Association) | DK Beton | Valla Iceland | Cemex Poland | ||
| Impact assessment | (kg CO2-eq.) | GWP | 2.69 × 10² | 0.7 | −18.3 | −18.6 | 5.2 | 4.8 | 11.1 | 10.7 | 4.4 |
| (kg CFC 11-eq.) | ODP | 3.51 × 101 | −99.8 | −100.0 | −100.0 | −100.0 | −100.0 | −100.0 | −100.0 | 699.8 | |
| (kg SO2-eq.) | AP | 4.11 × 10⁻¹ | 69.4 | −11.4 | −22.9 | −27.8 | 6.1 | 13.9 | −63.5 | 36.3 | |
| (kg Phosphat-eq.) | EP | 1.30 × 10⁻¹ | 25.5 | −73.3 | −54.5 | −55.8 | 7.8 | 18.5 | 2.4 | 129.4 | |
| (kg NMVOC eq.) | POCP | 5.13 × 10⁻² | 33.5 | 126.2 | −49.7 | −104.8 | −69.0 | −63.9 | −35.5 | 163.2 | |
| (kg Sb-eq.) | ADPE | 1.18 × 10⁻¹ | −99.8 | −99.6 | −99.4 | −100.0 | −99.9 | −99.9 | −99.9 | 698.6 | |
| (MJ) | ADPF | 1.09 × 10³ | 87.2 | −89.7 | −8.5 | −20.7 | 24.8 | 33.1 | −10.8 | −15.3 | |
| Resource use | (MJ) | PERE | 1.79 × 10² | −35.3 | −67.0 | 13.8 | 44.3 | 6.0 | −5.7 | 43.9 | −100.0 |
| (MJ) | PERM | 7.51 × 10⁻² | 596.5 | −100.0 | −100.0 | −100.0 | −100.0 | −96.5 | −100.0 | −100.0 | |
| (MJ) | PERT | 2.46 × 10² | −52.4 | −75.9 | −16.9 | 5.3 | −22.6 | −31.2 | 5.0 | 188.7 | |
| (MJ) | PENRE | 1.33 × 10³ | 65.6 | −8.6 | −17.6 | −29.6 | 3.4 | 11.7 | −25.0 | −100.0 | |
| (MJ) | PENRM | 1.41 × 101 | 79.6 | 118.5 | −100.0 | −100.0 | 16.7 | 35.8 | −50.6 | −100.0 | |
| (MJ) | PENRT | 1.15 × 10³ | 87.2 | −96.4 | −4.2 | −18.3 | 21.9 | 31.4 | −12.1 | −9.5 | |
| (Kg) | SM | 3.71 × 101 | −73.4 | −16.6 | −38.0 | −100.0 | 81.0 | 137.7 | 35.2 | −25.8 | |
| (MJ) | RSF | 2.82 × 10² | −82.7 | −85.3 | −27.5 | −98.9 | −45.6 | −28.2 | 124.2 | 244.2 | |
| (MJ) | NRSF | 2.74 × 10² | −69.3 | −5.3 | 41.8 | −88.3 | 2.3 | −17.8 | 67.7 | 68.8 | |
| (m3 world eq.) | FW | 2.03 × 101 | 208.9 | −98.5 | −95.4 | −97.8 | 338.7 | −94.9 | −97.5 | −63.6 | |
| Waste | (Kg) | HWD | 1.07 × 10⁻² | 50.1 | 254.3 | −96.5 | −99.9 | −54.1 | 12.8 | −95.4 | 28.7 |
| (Kg) | NHWD | 4.32 × 101 | −97.7 | 100.5 | −9.7 | 95.9 | −7.9 | −57.6 | 14.8 | −38.2 | |
| (Kg) | RWD | 2.02 × 10⁻² | −75.8 | 107.7 | 108.2 | 47.6 | −83.7 | −17.7 | −100.0 | −86.4 | |
| Outflows | (Kg) | CRU | |||||||||
| (Kg) | MFR | 4.96 × 10⁻¹ | −90.2 | −100.0 | −100.0 | −100.0 | −99.4 | −15.4 | −100.0 | 605.0 | |
| (Kg) | MER | 1.06 × 10⁻¹ | 384.0 | −100.0 | −100.0 | −100.0 | 35.8 | 80.2 | −100.0 | −100.0 | |
| (MJ) | EEE | ||||||||||
| (MJ) | EET | ||||||||||
| Stages A1–3 Percentage of the Country Compared to the Average | ||||||||
|---|---|---|---|---|---|---|---|---|
| EN 15804+A2 Unit Indicator | AVG. 1 A1–3 | HOLCIM Germany (%) | Iston Istanbul Turkey (%) | Aggelos Greece (%) | Interbeton Greece (%) | Votorantim Brazil (%) | ||
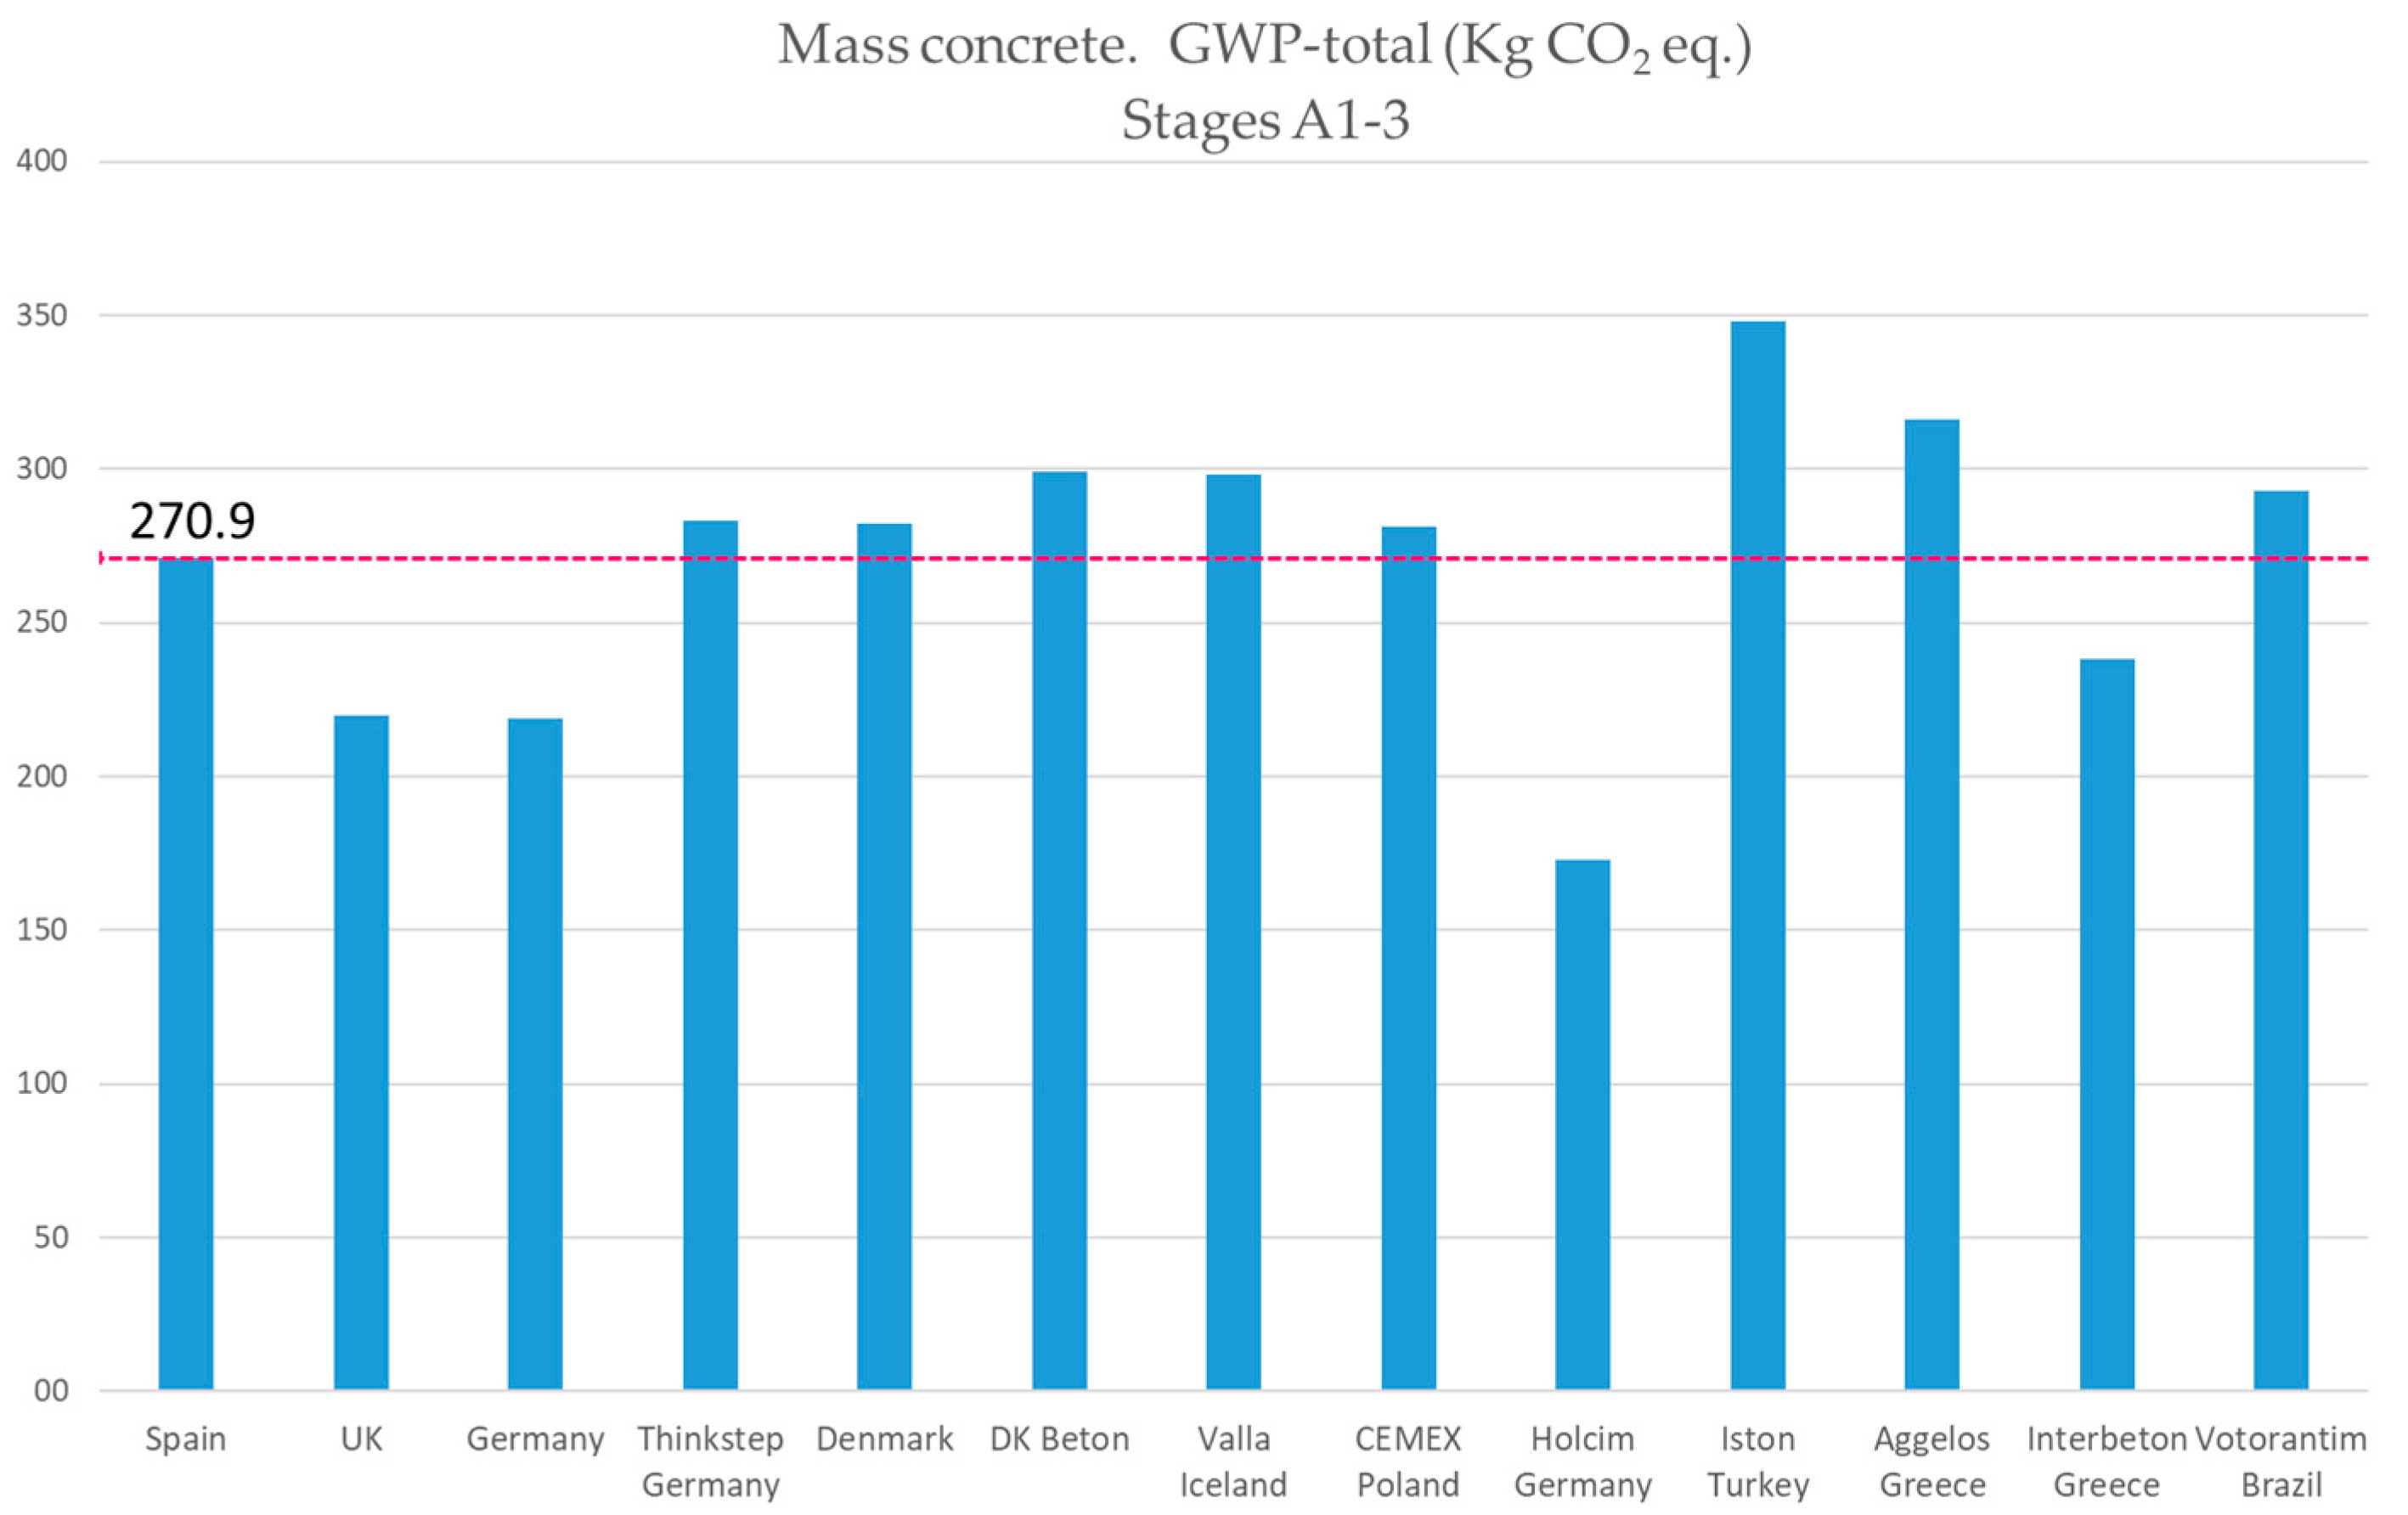
| Impact assessment | (kg CO2-eq.) | GWP-total | 2.74 × 10² | −36.8 | 27.2 | 15.5 | −13.0 | 7.1 |
| (kg CO2-eq.) | GWP-fossil | 2.72 × 10² | −36.4 | 26.6 | 14.4 | −12.4 | 7.8 | |
| (kg CO2-eq.) | GWP-biogenic | 1.77 × 100 | −89.3 | 94.4 | 184.1 | −96.6 | −92.6 | |
| (kg CO2-eq.) | GWP-luluc | 1.01 × 10⁻¹ | −0.9 | 44.7 | −29.2 | −64.3 | 49.7 | |
| (kg CFC 11-eq.) | ODP | 1.09 × 10⁻⁵ | −100.0 | 75.4 | 18.5 | −33.4 | 39.6 | |
| (mol H+ eq.) | AP | 8.13 × 10⁻¹ | −58.2 | 22.2 | 1.6 | −33.1 | 67.4 | |
| (kg P eq.) | EP-freshwater | 8.49 × 10⁻² | −99.9 | −52.8 | 283.8 | −52.0 | −79.2 | |
| (kg N eq.) | EP-marine | 1.20 × 10⁻¹ | −8.4 | 124.0 | 82.4 | −99.2 | −98.8 | |
| (mol N eq.) | EP-terrestrial | 2.64 × 100 | −51.1 | 15.3 | −5.9 | −32.1 | 73.7 | |
| (kg NMVOC eq.) | POCP | 6.62 × 10⁻¹ | −54.7 | 20.5 | −5.5 | −32.6 | 72.3 | |
| (kg Sb-eq.) | ADPE | 6.06 × 10⁻⁴ | −98.9 | 117.8 | 102.9 | −76.4 | −45.4 | |
| (MJ) | ADPF | 1.16 × 10³ | −14.9 | 74.8 | −37.5 | −36.0 | 13.7 | |
| (m3) | WDP | 7.67 × 101 | −95.0 | 8.7 | 23.7 | 25.7 | 36.9 | |
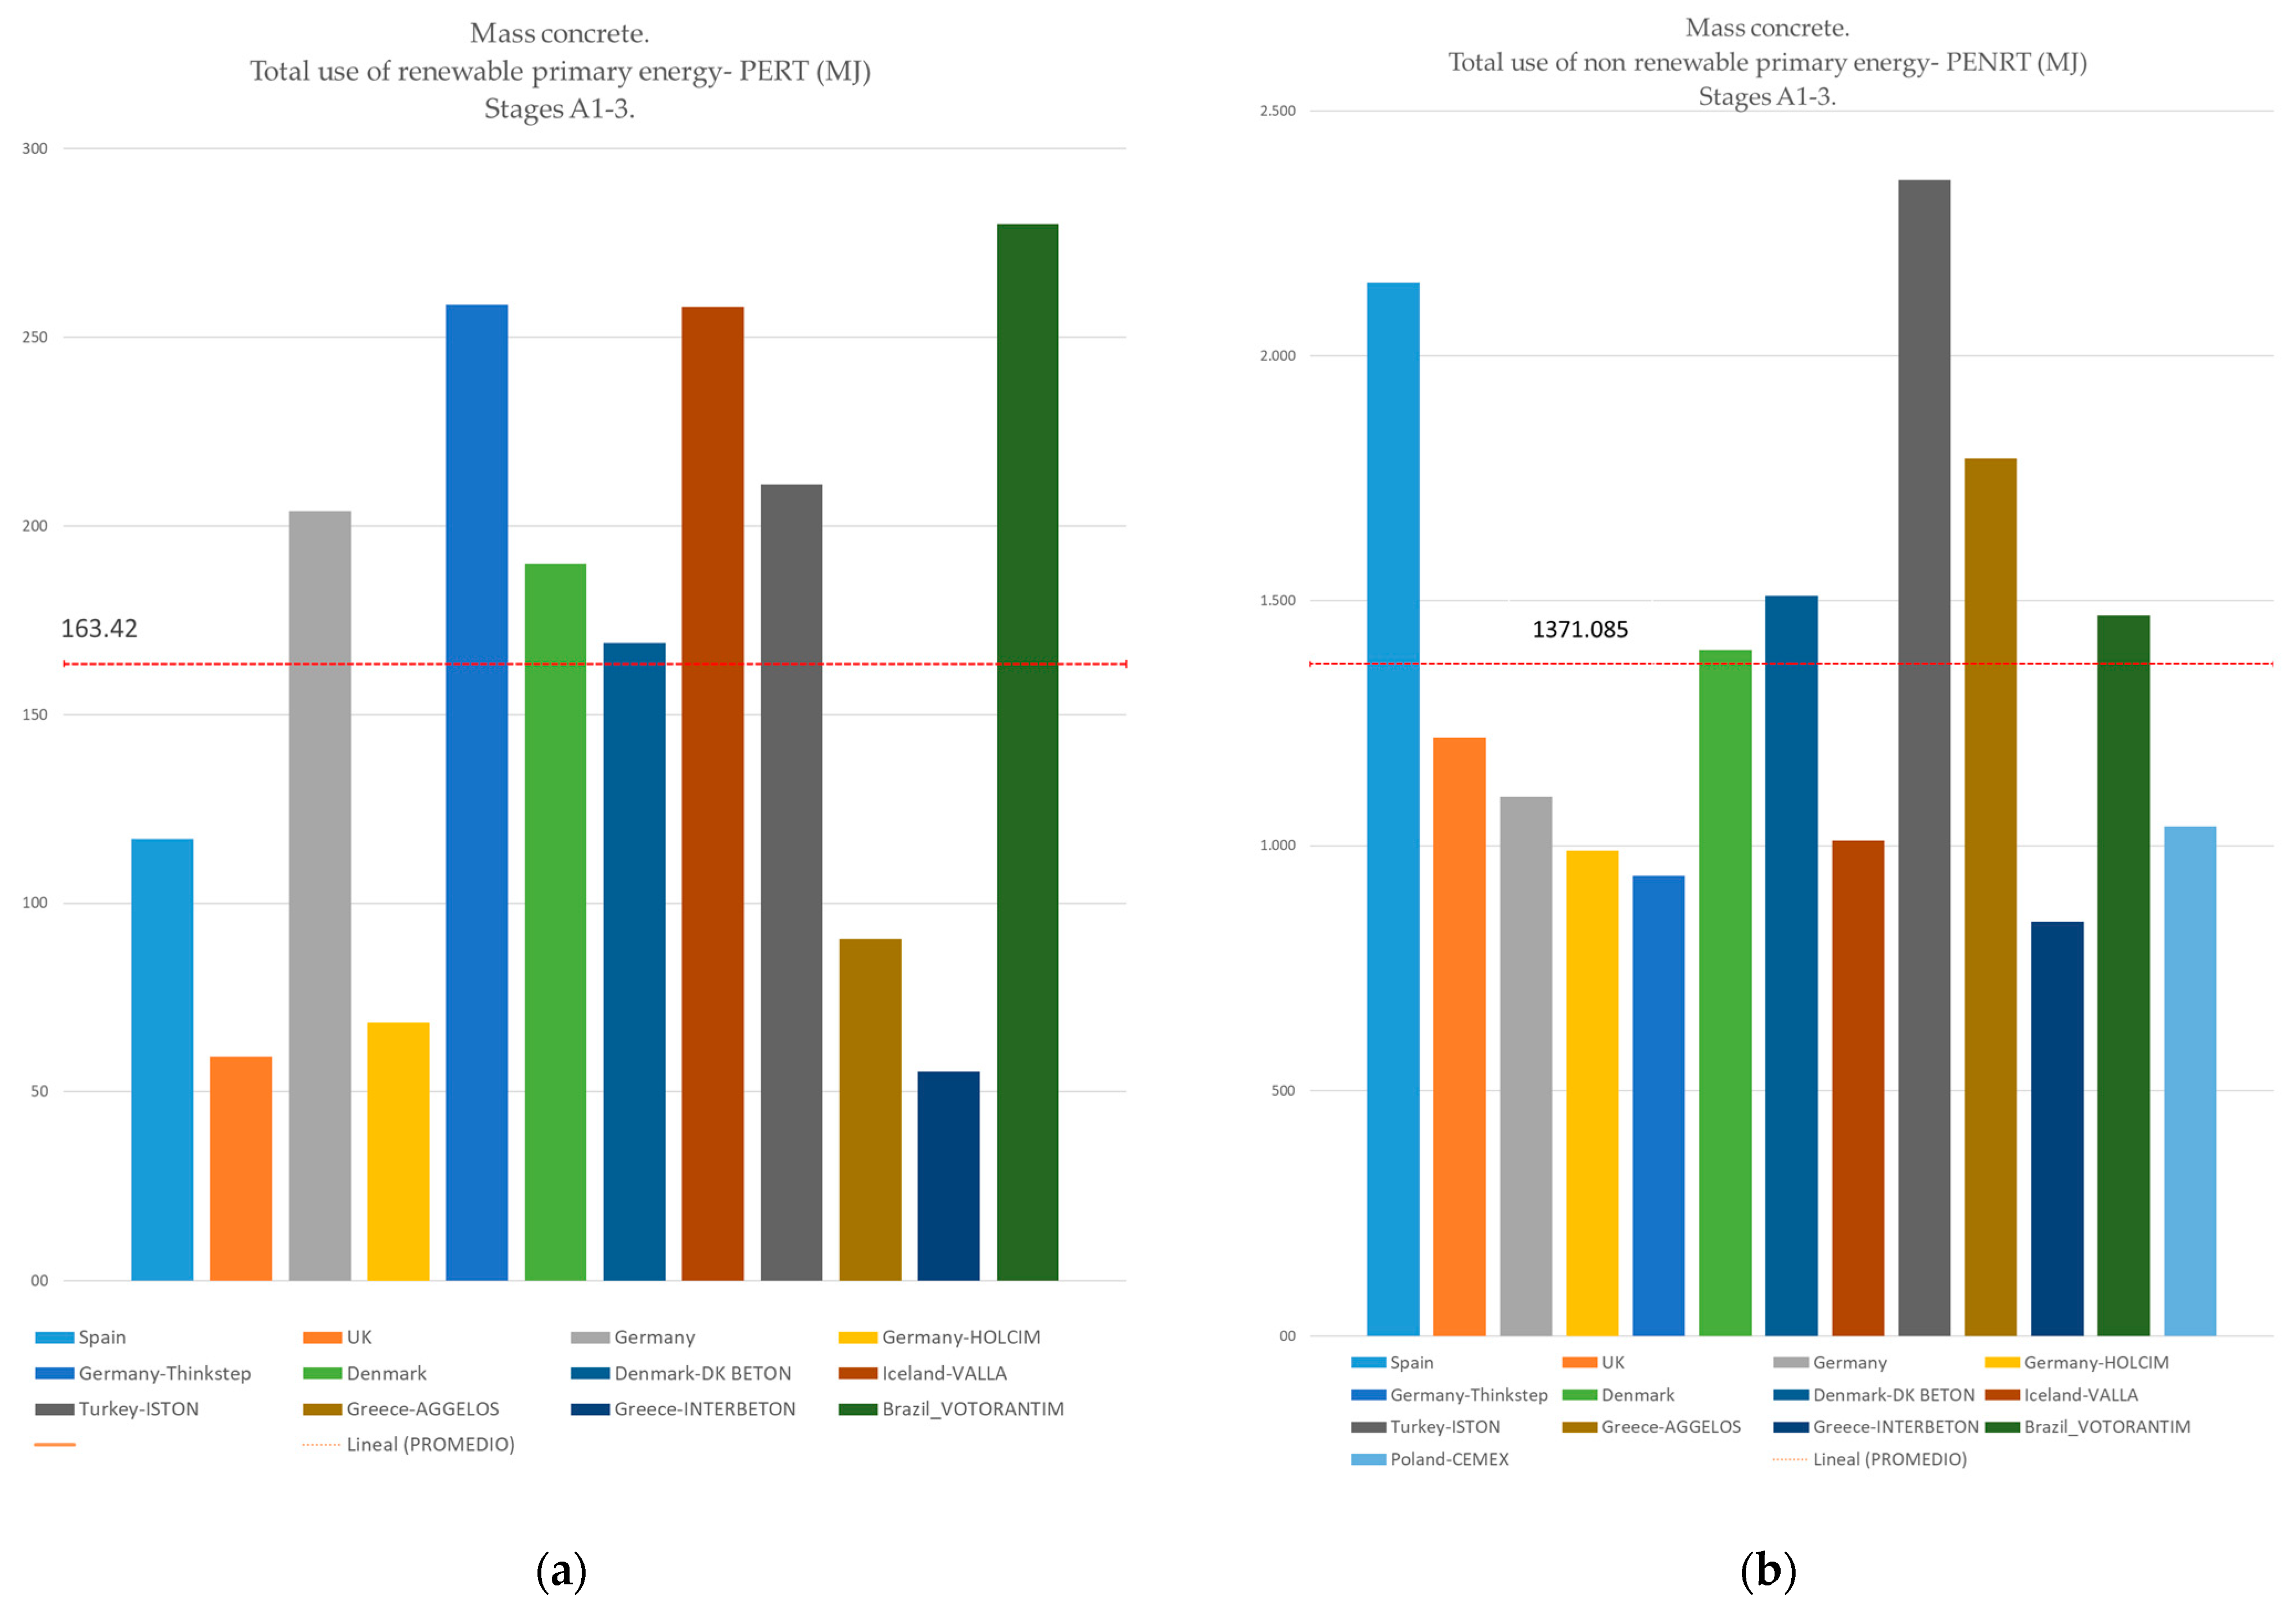
| Resource use | (MJ) | PERE | 1.37 × 10² | −50.1 | 54.3 | −49.5 | −59.6 | 104.8 |
| (MJ) | PERM | 4.32 × 100 | −95.8 | −100.0 | 395.8 | −100.0 | −100.0 | |
| (MJ) | PERT | 1.41 × 10² | −51.5 | 49.6 | −35.8 | −60.8 | 98.5 | |
| (MJ) | PENRE | 1.32 × 10³ | −25.5 | 79.4 | −29.9 | −35.8 | 11.8 | |
| (MJ) | PENRM | 1.76 × 10² | −94.3 | −99.9 | 394.3 | −100.0 | −100.0 | |
| (MJ) | PENRT | 1.49 × 10³ | −33.6 | 58.3 | 20.1 | −43.3 | −1.4 | |
| (Kg) | SM | 1.54 × 101 | −33.9 | −100.0 | −41.0 | −23.5 | 198.3 | |
| (MJ) | RSF | 4.66 × 101 | 288.5 | −100.0 | −93.7 | 5.2 | −100.0 | |
| (MJ) | NRSF | 7.73 × 101 | 307.5 | −100.0 | −93.5 | −14.0 | −100.0 | |
| (m3 world eq.) | FW | 1.95 × 100 | −71.8 | 2.1 | 15.4 | 18.5 | 35.9 | |
| Stages A1–3 Percentage of the Country Compared to the Average | ||||||||
|---|---|---|---|---|---|---|---|---|
| EN 15804+A2 Unit Indicator | AVG. 1 A1–3 | HOLCIM Germany (%) | Iston Istanbul Turkey (%) | Aggelos Greece (%) | Interbeton Greece (%) | Votorantim Brazil (%) | ||
| Waste | (Kg) | HWD | 4.98 × 101 | −100.0 | −100.0 | 300.0 | −100.0 | −100.0 |
| (Kg) | NHWD | 3.54 × 101 | 5.5 | −0.7 | −58.1 | −100.0 | 53.3 | |
| (Kg) | RWD | 6.14 × 10⁻² | −18.5 | −85.1 | 103.7 | −100.0 | −100.0 | |
| Outflows | (Kg) | CRU | ||||||
| (Kg) | MFR | 2.47 × 101 | −100.0 | −100.0 | −78.9 | −100.0 | 278.9 | |
| (Kg) | MER | 4.33 × 10⁻³ | −100.0 | −100.0 | −100.0 | −100.0 | 300.0 | |
| (MJ) | EEE | |||||||
| (MJ) | EET | |||||||
| EN 15804+A1 Stages A1–3 | GWP—Total (Kg CO2-eq.) | PERT (MJ) | PENRT (MJ) | |
|---|---|---|---|---|
| Reinforcing bar | Spain 2 | 410.0 | 1700.0 | 7190.0 |
| CCL scand-UK 1 | 2480.0 | 2340.0 | 28,400.0 | |
| ArcelorMittal Europa 4 | 818.0 | 512.0 | 9070.0 | |
| Outokumpu UK, USA and Sweden 4 | 2890.0 | 7330.0 | 37,200.0 | |
| Ceramic bricks for cladding | Spain 2 | 236.0 | 403.0 | 2520.0 |
| UK 2 | 213.0 | 120.0 | 2430.0 | |
| Germany 2 | 196.5 | 373.9 | 2052.0 | |
| Mass concrete | Spain 2 | 271.0 | 117.0 | 2150.0 |
| United Kingdom 2 | 220.0 | 59.2 | 41.3 | |
| Germany 2 | 219.0 | 204.0 | 1100.0 | |
| Thinkstep Germany 3 | 283.1 | 258.6 | 939.1 | |
| Denmark 2 | 282.0 | 190.0 | 1400.0 | |
| DK Beton 4 | 299.0 | 169.0 | 1510.0 | |
| Valla Iceland 4 | 298.0 | 258.0 | 1010.0 | |
| CEMEX Poland 4 | 281.0 | 709.0 | 1040.0 |
4. Discussion
5. Conclusions
Author Contributions
Funding
Data Availability Statement
Acknowledgments
Conflicts of Interest
Appendix A
| Owner | Participation | Number of EPDs | Product Definition 1 | PCR | EN15804 | Lifecycle Stages | |
|---|---|---|---|---|---|---|---|
| Nº | (Units) | ||||||
| ANEFHOP | 300 | Companies | 1 | Several (2) | EN 16757:2018 [42] | A1 | Partial |
| HISPALYT | +150 | Associates | 6 | Single | Global EPD-RCP-008 | A1 | Partial |
| FdA | 700 | Companies | 3 | Single | Not stated | A2 | Partial |
| AEA | 89 64 | Associates % Market share | 2 | Several (6) | PCR 2019:14 v1.0 EPD System | A2 | Partial |
| AISBL-EWA | 43 95 | Factories % Market share | 1 | Several (8) | PCR 2019:14. EPD System | A2 | Partial |
| ASE | 80–100 | % Market share | 3 | Several (3) | PCR 2019:14 v1.0 EPD System | A1 | Partial |
| ANFAPA | 10 | Companies | 4 | Single | Global EPD-RCP-006 and 007 | A1 | Full |
| OFICEMEN + IECA | 100 | % Market share | 7 | Several (7) | Global EPD-RCP-003 | A1/A2 | Partial/Full |
| ATEDY | 9 | Factories | 2 | Single | Global EPD-RCP-004 | A1 | Partial |
| ASCER | 40 | % Market share | 1 | Single | Global EPD-RCP-002 | A1 | Full |
| Owner | Standard | Declared Stages | Value Type | Database | Software | Date of Data |
|---|---|---|---|---|---|---|
| ASCER | 15804+A1 | All | Matrix value | Company PD 1,2 GaBi SD 3, compilation 8.7.0.18. | GaBi 8.7.0.18. | 2017 |
| PAMESA CERÁMICA, S.L. | 15804+A1 | All except A4–A5, B2, C2–C4 | Standard | Company PD GaBi SD, compilation 8007 | GaBi 9.1.053. | 2018 |
| GEOLÓFICA TILE, S.L.U. | 15804+A1 | All except A4–A5, B2, C2–C4 | Standard | Company PD GaBi SD, compilation 8007 | GaBi 9.1.053. | 2018 |
| CERAMIC TILE INTERNATIONAL, S.L.U. | 15804+A1 | All except A4, A5, B2, C2, C3, C4. | Standard | Company PD GaBi SD, compilation 8007 | GaBi 9.1.053. | 2018 |
| AZULEJOS FOSET, S.L.U. | 15804+A1 | All except A4, A5, B2, C2, C3, C4. | Standard | Company PD GaBi SD, compilation 8007 | GaBi 9.1.053. | 2018 |
| NAVARTI CERÁMICA, S.L.U. | 15804+A1 | All except A4, A5, B2, C2, C3, C4. | Standard | Company PD GaBi SD, compilation 8007 | GaBi 9.1.053. | 2018 |
| TAU CERÁMICA SOLUTIONS, S.L.U. | 15804+A1 | All except A4, A5, B2, C2, C3, C4. | Standard | Company PD GaBi SD, compilation 8007 | GaBi 9.1.053. | 2018 |
| PERONDA GROUP, S.A. | 15804+A1 | All | Different values | Company PD GaBi SD, compilation 8007 | GaBi 8.0.7.18 | 2017 |
| GRESPANIA, S.A. | 15804+A1 | All | Different values | Company PD GaBi SD, compilation 8007 | GaBi 8.0.7.18 | 2017 |
| EQUIPE CERÁMICA, S.L. | 15804+A1 | All except A4, A5, B2, C2, C3, C4. | Different values | Company PD GaBi SD, compilation 8007 | GaBi 9.1.053. | 2018 |
| MANUFACTURA INDUSTRIAL AZULEJERA S.L. | 15804+A1 | All | Different values | Company PD GaBi SD, compilation 8007 | GaBi 9.1.053. | May 2019–May 2020 |
| Owner Association | Declared Product | Standard | PCR | Declared Stage | Database | Software | Year Data | Service Life (Years) |
|---|---|---|---|---|---|---|---|---|
| Federal Association of the German Brick and Roof Tile Industry | 1 m3 of unfilled brick (density: 575 Kg/m3) | 15804+A1 | RCP bricks 1.2017 (IBU) | All except B1, B2, B6 and B7 (module not relevant B3, B4 and B5) | BBDD GaBi SP39 2019 | GaBi 9 | 2019 | 150 |
| Brick Development Association | 1 Tm of average UK brick BDA | 15804+A1 | BRE Environmental Profiles | All (module not relevant B1-B7 and C1) | Ecoinvent 3.2 | SimaPro v8 | 2017 | 60 |
| Spanish Association of Manufacturers of Baked Clay Bricks and Tiles (HISPALYT) | 1000 kg of ceramic facing bricks and their special parts | 15804+A1 | GlobalEPD-RCP-008 | All except module D (module not relevant B1–7, C1 and D) | No specified | No specified | 2015 | 150 |
| Owner | Declared Product | Standard | PCR | Declared Stages | Database | Software | Year Data | Service Life (Years) |
|---|---|---|---|---|---|---|---|---|
| CCL Scandinavia A/S | 1 kg of corrugated conduit used in precast and post-tensioned concrete | 15804+A1 | BRE PCR PN514 | A1, A2, A3, A1–3 | ecoinvent v3.2 (2015) | Pat Hermon BRE LINA v2 | 2020 | No specified |
| Arcelor Mittal Europe | 1 Tm of reinforcing steel | 15804+A1 | Reinforcing Steel, 11.2017 (IBU) | A1–3, C3, C4, D | GaBi (2021) | GaBi v. 2021.2 | 2022 | No specified |
| Outokumpu | 1 Tm of long stainless steel | 15804+A1 | Structural steels, 07.2014 (IBU) | A1–3, C3, D | GaBi DataBase SP36 | GaBi v. 2018 | 2017–2018 | No specified |
| Association for Steel Sustainability | 1000 kg of rebar production | 15804+A1 | UNE 36904-1:2018 | A1, A2, A3, A4, D | Ecoinvent 3.5 (2018) | SimaPro 9.0.0.30 | 2016–2017 | No specified |
| Owner | Declared Product | EN 15804 | PCR | Declared Stages | Database | Software | Year Data | Service Life (Years) |
|---|---|---|---|---|---|---|---|---|
| ANEFHOP | 1 m3 of ready-mixed concrete | +A1 | UNE-EN 16757:2018 | Partial | Ecoinvent 3.6 database 2020 | Sectoral calculator based on Simapro 9.1.1 (2020) | 2017 | 50–100 |
| British Ready-Mixed Concrete Association | 1 m3 generic ready-mixed concrete | +A1 | IBU | Partial | GaBi and data of associates | Precast Envision EPD Tool v. 2017 | 2014 | 100 |
| Concrete GmbH | 1 m3 unreinforced structural concrete (C30/37) | +A1 | IBU | Partial | GaBi v 8.7.0.18, SP 34 | GaBi v. 8.7.0.18, SP 34 | 2016 | <50 |
| Thinkstep | 1 m3 unreinforced structural concrete (C30/37) | +A1 | No specified | Partial | GaBi v. 2020, SP40 | GaBi | 2018 | Not specified |
| Danish Concrete Manufacturers Association | 1 m3 of factory concrete (exposure class XC2, XC3, XC4, XF1 y XA1) | +A1 | DS/EN 16757:2017 | Partial | BBDD GaBi 2019 | Not specified | 2018 | 100 |
| DK Beton | 1 m3 of factory concrete (exposure class XC2, XC3, XC4, XF1 y XA1) | +A1 | DS/EN 16757:2017 | Partial | GaBi 8.7 | GaBi | 2020 | 100 |
| BM Valla | 1 m3 exterior ready-mixed concrete C30/37 | +A1 | EPD norge | Partial | Ecoinvent | Not specified | 2020 | 60 |
| CEMEX Poland | 1 m3 ready-mixed concrete | +A1 | ETB-EPD | Partial | Ecoinvent v.3.9. | Not specified | 2020 | Not specified |
| Holcim GmbH | 1 m3 of unreinforced concrete C30/37 XC4 XF1 XA1 F3 16 M ECOPact | +A2 | IBU | Partial | GaBi SP40, 2020 | GaBi v. 10.6.1.35 | 2020 | 50 |
| ISTON | 1 m3 of ready-mixed concrete C 30/37 Ready-mixed concrete | +A2 | EPD System | Partial | Ecoinvent 3.8 | SimaPro 9.3 | 2021 | Not specified |
| Aggelos B. Peppass S.A | 1 m3 of ready-mixed concrete | +A2 | EPD System and UNE-EN 16757 | Partial | Ecoinvent database (3.8) | OpenLCA 1.11.0 | 2021 | Not specified |
| Interbeton Building Materials S.A | 1 m3 of ready-mixed concrete | +A2 | EPD System and UNE-EN 16758 | Full | Ecoinvent v.3.5 | GCCA industry EPD tool v3.1 | 2020–2021 | 50 |
| Votorantim Cimentos | 1 m3 of ready-mixed concrete | +A2 | EPD System and UNE-EN 16759 | Partial | Ecoinvent v.3.5 | BetonTec v.2021 | 2021 | 50 |
References
- WorldGBC-2021-Annual-Report.Pdf. Available online: https://worldgbc.org/wp-content/uploads/2022/08/WorldGBC-2021-Annual-Report.pdf (accessed on 18 October 2023).
- ISO 14040; Environmental Management—Life Cycle Assessment—Principles and Framework. International Organization for Standardization: Geneva, Switzerland, 2006.
- Meex, E.; Hollberg, A.; Knapen, E.; Hildebrand, L.; Verbeeck, G. Requirements for Applying LCA-Based Environmental Impact Assessment Tools in the Early Stages of Building Design. Build. Environ. 2018, 133, 228–236. [Google Scholar] [CrossRef]
- EN 15978; Sustainability of Construction Works—Assessment of Environmental Performance of Buildings—Calculation Method. European Committee for Standardization: Brussels, Belgium, 2011.
- Rasmussen, F.N.; Ganassali, S.; Zimmermann, R.K.; Lavagna, M.; Campioli, A.; Birgisdóttir, H. LCA Benchmarks for Residential Buildings in Northern Italy and Denmark—Learnings from Comparing Two Different Contexts. Build. Res. Inf. 2019, 47, 833–849. [Google Scholar] [CrossRef]
- Anand, C.K.; Amor, B. Recent Developments, Future Challenges and New Research Directions in LCA of Buildings: A Critical Review. Renew. Sustain. Energy Rev. 2017, 67, 408–416. [Google Scholar] [CrossRef]
- Häfliger, I.-F.; John, V.; Passer, A.; Lasvaux, S.; Hoxha, E.; Saade, M.R.M.; Habert, G. Buildings Environmental Impacts’ Sensitivity Related to LCA Modelling Choices of Construction Materials. J. Clean. Prod. 2017, 156, 805–816. [Google Scholar] [CrossRef]
- CEN/TR 15941 IN; Sustainability of Construction Works—Environmental Product Declarations Methodology for Selection and Use of Generic Data. European Committee for Standardization: Brussels, Belgium, 2011.
- Crawford, R.H.; Stephan, A.; Prideaux, F. The EPiC Database: Hybrid Embodied Environmental Flow Coefficients for Construction Materials. Resour. Conserv. Recycl. 2022, 180, 106058. [Google Scholar] [CrossRef]
- EN 15804:2012+A2:2020; Sustainability of Construction Works—Environmental Product Declarations—Core Rules for the Product Category of Construction Products. European Committee for Standardization (CEN): Brussels, Belgium, 2020.
- Kellenberger, D.; Althaus, H.-J. Relevance of Simplifications in LCA of Building Components. Build. Environ. 2009, 44, 818–825. [Google Scholar] [CrossRef]
- Takano, A.; Winter, S.; Hughes, M.; Linkosalmi, L. Comparison of Life Cycle Assessment Databases: A Case Study on Building Assessment. Build. Environ. 2014, 79, 20–30. [Google Scholar] [CrossRef]
- Emami, N.; Heinonen, J.; Marteinsson, B.; Säynäjoki, A.; Junnonen, J.-M.; Laine, J.; Junnila, S. A Life Cycle Assessment of Two Residential Buildings Using Two Different LCA Database-Software Combinations: Recognizing Uniformities and Inconsistencies. Buildings 2019, 9, 20. [Google Scholar] [CrossRef]
- Lasvaux, S.; Habert, G.; Peuportier, B.; Chevalier, J. Comparison of Generic and Product-Specific Life Cycle Assessment Databases: Application to Construction Materials Used in Building LCA Studies. Int. J. Life Cycle Assess. 2015, 20, 1473–1490. [Google Scholar] [CrossRef]
- Our Mission—Eco Platform, En. Available online: https://www.eco-platform.org/the-mission.html (accessed on 24 October 2023).
- inData Networking. Available online: https://www.indata.network/about (accessed on 24 October 2023).
- Soust-Verdaguer, B.; Palumbo, E.; Llatas, C.; Acevedo, A.V.; Hoxha, E.; Passer, A. Environmental Product Declarations (EPDs) of Construction Products in Spain: Current Status and Future Challenges. IOP Conf. Ser. Earth Environ. Sci. 2022, 1078, 012128. [Google Scholar] [CrossRef]
- U.S. Green Building Council. Building Product Disclosure and Optimization—Environmental Product Declarations. Available online: https://www.usgbc.org/credits/new-construction-core-and-shell-schools-new-construction-retail-new-construction-data-43 (accessed on 28 November 2023).
- Gomes, R.; Silvestre, J.D.; de Brito, J.; Lasvaux, S. Environmental Datasets for Cement and Steel Rebars to Be Used as Generic for a National Context. J. Clean. Prod. 2021, 316, 128003. [Google Scholar] [CrossRef]
- AENOR—Declaraciones GlobalEPD En Vigor. Available online: https://www.aenor.com/certificacion/certificacion-de-producto/declaraciones-ambientales-de-producto/declaraciones-globalepd-en-vigor (accessed on 26 October 2023).
- EPD International. Available online: https://www.environdec.com/home (accessed on 26 October 2023).
- Kietzmann, A. EPD Programme at IBU. Available online: https://ibu-epd.com/en/epd-programme/ (accessed on 26 October 2023).
- DAPcons. Available online: https://www.dapcons.com/login (accessed on 26 October 2023).
- UNE-EN 14411:2016; Ceramic Tiles—Definition, Classification, Characteristics, Assessment and Verification of Constancy of Performance and Marking. European Committee for Standardization, Spanish Standardization Association, (AEN/CEN 138): Madrid, Spain, 2016.
- Bahramian, M.; Yetilmezsoy, K. Life Cycle Assessment of the Building Industry: An Overview of Two Decades of Research (1995–2018). Energy Build. 2020, 219, 109917. [Google Scholar] [CrossRef]
- Pomponi, F.; Moncaster, A. Scrutinising Embodied Carbon in Buildings: The next Performance Gap Made Manifest. Renew. Sustain. Energy Rev. 2018, 81, 2431–2442. [Google Scholar] [CrossRef]
- Marsh, E.; Orr, J.; Ibell, T. Quantification of Uncertainty in Product Stage Embodied Carbon Calculations for Buildings. Energy Build. 2021, 251, 111340. [Google Scholar] [CrossRef]
- Anderson, J.; Moncaster, A. Embodied Carbon of Concrete in Buildings, Part 1: Analysis of Published EPD. Build. Cities 2020, 1, 198–217. [Google Scholar] [CrossRef]
- EN 15804:2012+A1:2012; Sustainability of Construction Works—Environmental Product Declarations—Core Rules for the Product Category of Construction Products. European Committee for Standardization (CEN): Brussels, Belgium, 2012.
- Saade, M.R.M.; Guest, G.; Amor, B. Comparative Whole Building LCAs: How Far Are Our Expectations from the Documented Evidence? Build. Environ. 2020, 167, 106449. [Google Scholar] [CrossRef]
- Silvestre, J.D.; Lasvaux, S.; Hodková, J.; de Brito, J.; Pinheiro, M.D. NativeLCA—A Systematic Approach for the Selection of Environmental Datasets as Generic Data: Application to Construction Products in a National Context. Int. J. Life Cycle Assess. 2015, 20, 731–750. [Google Scholar] [CrossRef]
- Marsh, E.; Allen, S.; Hattam, L. Tackling Uncertainty in Life Cycle Assessments for the Built Environment: A Review. Build. Environ. 2023, 231, 109941. [Google Scholar] [CrossRef]
- Gelowitz, M.D.C.; McArthur, J.J. Comparison of Type III Environmental Product Declarations for Construction Products: Material Sourcing and Harmonization Evaluation. J. Clean. Prod. 2017, 157, 125–133. [Google Scholar] [CrossRef]
- Strazza, C.; Del Borghi, A.; Blengini, G.A.; Gallo, M. Definition of the Methodology for a Sector EPD (Environmental Product Declaration): Case Study of the Average Italian Cement. Int. J. Life Cycle Assess. 2010, 15, 540–548. [Google Scholar] [CrossRef]
- Martínez-Rocamora, A.; Solís-Guzmán, J.; Marrero, M. LCA Databases Focused on Construction Materials: A Review. Renew. Sustain. Energy Rev. 2016, 58, 565–573. [Google Scholar] [CrossRef]
- Loli, A.; Skaar, C.; Bergsdal, H.; Reenaas, M. Comparing Embodied GHG Emissions between Environmental Product Declaration and Generic Data Models: Case of the ZEB Laboratory in Trondheim, Norway. Build. Environ. 2023, 242, 110583. [Google Scholar] [CrossRef]
- Scrucca, F.; Baldassarri, C.; Baldinelli, G.; Bonamente, E.; Rinaldi, S.; Rotili, A.; Barbanera, M. Uncertainty in LCA: An Estimation of Practitioner-Related Effects. J. Clean. Prod. 2020, 268, 122304. [Google Scholar] [CrossRef]
- Pomponi, F.; Moncaster, A.; De Wolf, C. Furthering Embodied Carbon Assessment in Practice: Results of an Industry-Academia Collaborative Research Project. Energy Build. 2018, 167, 177–186. [Google Scholar] [CrossRef]
- Waldman, B.; Huang, M.; Simonen, K. Embodied Carbon in Construction Materials: A Framework for Quantifying Data Quality in EPDs. Build. Cities 2020, 1, 625–636. [Google Scholar] [CrossRef]
- Castro, R.; Terranova, E.; Bruce-Hyrkäs, T.; Pasanen, P. The Embodied Carbon Review—Embodied Carbon Reduction in 100+ Regulations & Rating System Globally; Bionova Ltd.: Helsinki, Finland, 2018. [Google Scholar]
- Moré, F.B.; Galindro, B.M.; Soares, S.R. Assessing the Completeness and Comparability of Environmental Product Declarations. J. Clean. Prod. 2022, 375, 133999. [Google Scholar] [CrossRef]
- UNE-EN 16757:2018; Sustainability of Construction Works—Environmental Product Declarations—Product Category Rules for Concrete and Concrete Elements. European Committee for Standardization: Madrid, Spain, 2018.


| Country | Environmental DB | LCI DB | LCA Software | Administrator/Operator |
|---|---|---|---|---|
| Spain | OpenDAP | - | - | Global EPD and DAPcons |
| France | INIES | INIES | - | INIES |
| Germany | ÖKOBAUDAT and IBU | ÖKOBAUDAT | - | IBU |
| Denmark | Nationale Milieudatabase (NMD) | Nationale Milieudatabase (NMD) and ÖKOBAUDAT | LCAbyg 2023 | EPD Denmark |
| Norway | Klimagassregnskap | - | Excel based tool (2022a) | EPD Norge |
| Sweden | Boverkets | - | - | The International EPD |
| Netherlands | - | - | - | Stichting MRPI |
| Italy | - | - | - | EPD Italy |
| CEN/TR 15941:2011 Types of EPD (Art. 5.4) | Manufacturer-Specific EPDs (1 Manufacturer) | Collective EPDs (from >1 Manufacturer, Associations, Sectors) |
|---|---|---|
| Specific product | 1 product, 1 plant | 1 product, >1 plant, >1 manufacturer |
| 1 product, >1 plant | ||
| Average product | Average product, 1 plant | Average product, >1 plant, >1 manufacturer |
| Average product, >1 plant | ||
| Representative product | Representative product, 1 plant | Representative product, >1 product group |
| Representative product, >1 plant | ||
| Worst-case product | 1 product, survey > 1 manufacturer, >1 product group |
| Product | Functional Unit | Features of Interest |
|---|---|---|
| Ceramic brick for cladding | 1000 kg of ceramic brick for cladding | |
| Corrugated steel bars | 1000 kg of corrugated steel bars | |
| Mass concrete | 1 m3 of mass concrete | Mechanical strength: 30–37 MPa Density: 2380 kg/m3 Without added additives 1 |
| Category | Deviation from the Mean (%) | Color |
|---|---|---|
| I | [0, ±10) | Black text on pale yellow background |
| II | [±10, ±20) | Black text on salmon background |
| III | [±20, ±50) | Black text on coral background |
| IV | [±50, ±90) | Black text on red background |
| V | >±90 | White text on maroon background |
| VI | Not available | Empty cell |
| LCA Stages | A1 | A2 | A3 | A1–3 | D |
|---|---|---|---|---|---|
| EIC 1 | EC Value 2/SV 3 | EC Value/SV | EC Value/SV | EC Value/SV | EC Value/SV |
| GWP—total | 1.57 | 0.37 | 1.23 | 1.26 | 2.03 |
| ODP | 1.79 | 2.68 | 1.18 | 1.79 | 14.33 |
| AP | 1.65 | 0.92 | 0.78 | 1.15 | 1.79 |
| EP | 1.29 | 0.85 | 1.30 | 1.23 | 4.00 |
| POCP | 1.43 | 0.83 | 1.05 | 1.17 | 1.83 |
| ADPE | 3.88 | 0.21 | 2.17 | 3.67 | 2.12 |
| ADPF | 1.46 | 0.36 | 1.24 | 1.25 | 1.64 |
| LCA Stages A1–3 | ||||||
|---|---|---|---|---|---|---|
| EIC 1 | Equipe Cerámica / MV 2 | Mainzu / MV | Peronda Group / MV | Grespania / MV | SV 3 / MV | Average 10 EPD / MV |
| GWP-total | 1.14 | 0.62 | 1.08 | 1.31 | 0.90 | 0.77 |
| ODP | 1.69 | 0.83 | 1.05 | 1.20 | 0.95 | 0.86 |
| AP | 1.43 | 5.71 | 1.35 | 1.29 | 1.24 | 1.47 |
| EP | 1.26 | 1.96 | 1.25 | 0.96 | 1.03 | 0.95 |
| POCP | 1.36 | 3.13 | 1.33 | 1.27 | 1.16 | 1.17 |
| ADPE | 0.28 | 1.12 | 0.31 | 0.16 | 0.08 | 0.22 |
| ADPF | 1.29 | 0.74 | 1.23 | 1.51 | 1.03 | 0.89 |
Disclaimer/Publisher’s Note: The statements, opinions and data contained in all publications are solely those of the individual author(s) and contributor(s) and not of MDPI and/or the editor(s). MDPI and/or the editor(s) disclaim responsibility for any injury to people or property resulting from any ideas, methods, instructions or products referred to in the content. |
© 2023 by the authors. Licensee MDPI, Basel, Switzerland. This article is an open access article distributed under the terms and conditions of the Creative Commons Attribution (CC BY) license (https://creativecommons.org/licenses/by/4.0/).
Share and Cite
Otero, M.S.; Garnica, T.; Montilla, S.; Conde, M.; Tenorio, J.A. Analysis of Sectoral Environmental Product Declarations as a Data Source for Life Cycle Assessment. Buildings 2023, 13, 3032. https://doi.org/10.3390/buildings13123032
Otero MS, Garnica T, Montilla S, Conde M, Tenorio JA. Analysis of Sectoral Environmental Product Declarations as a Data Source for Life Cycle Assessment. Buildings. 2023; 13(12):3032. https://doi.org/10.3390/buildings13123032
Chicago/Turabian StyleOtero, María Seila, Teresa Garnica, Soledad Montilla, Marta Conde, and José A. Tenorio. 2023. "Analysis of Sectoral Environmental Product Declarations as a Data Source for Life Cycle Assessment" Buildings 13, no. 12: 3032. https://doi.org/10.3390/buildings13123032
APA StyleOtero, M. S., Garnica, T., Montilla, S., Conde, M., & Tenorio, J. A. (2023). Analysis of Sectoral Environmental Product Declarations as a Data Source for Life Cycle Assessment. Buildings, 13(12), 3032. https://doi.org/10.3390/buildings13123032