Review

Configurations for Four Urban Tree Species in the Santiago Metropolitan Region and Their Impact on the Environment According to CO2, PM2.5, Biogenic Volatile Organic Compounds and Water Resource Criteria

by
Marco Antonio Díaz
1,*,
David Blanco
2,*,
María Belén Almendro-Candel
1,
Ignacio Herrera
2,
Ignacio Allende
2,
Pablo Pulgar Rubilar
1,
Marcela Lizana
3,
Francisco Pardo
4,
Luis Perillán
5 and
Carolina Tapia
2
1
Department of Agrochemistry and Environment, Miguel Hernández University of Elche, Av. Universidad s/n, 03202 Elche, Spain
2
Department of Construction Sciences, Universidad Tecnológica Metropolitana, Dieciocho 161, Santiago 833-0689, Chile
3
Doctoral Program in Local Development and International Cooperation, Universitat Jaume I, Av. Vicent Sos Baynat s/n, 12071 Castellón de la Plana, Spain
4
Department of Education, Universidad CEU Cardenal Herrera, C/Grecia 31, 12006 Castellón de la Plana, Spain
5
Faculty of Social Sciences, Universidad de Chile, Av. Libertador Bernardo O’Higgins 1058, Santiago 833-0689, Chile
*
Authors to whom correspondence should be addressed.
Buildings 2023, 13(12), 3052; https://doi.org/10.3390/buildings13123052
Submission received: 1 September 2023 / Revised: 29 September 2023 / Accepted: 6 October 2023 / Published: 7 December 2023

Abstract

:
The rapid and disproportionate growth of many cities in South America, such as Santiago de Chile, has not included a design that considers the impact caused. Furthermore, industrial and housing growth has been based mainly on unsustainable economic criteria, attributing less importance to environmental criteria. This has caused problems related to global warming, pollution, water scarcity and health, especially harming populations with fewer resources. This study estimates and compares the impact of four tree species commonly used at the urbanization level, according to variables such as carbon dioxide (CO2), fine particulate matter (PM2.5), water resources, and biogenic volatile organic compounds (BVOCs). Then, we will use the variable PM2.5 to assess the trees’ impact on the population and their economic resources using these tree species as a method of capturing this pollutant. The results obtained will be used to determine which one of the four species is the most suitable in each type of space within the Metropolitan Region of Chile (small spaces, uncultivated areas, large spaces near industrial areas, areas with patients with breathing problems, etc.) according to three criteria: a comparison between species using the number of trees in the investigated territory; contrasting the species with the amount of social housing; and a comparison between the species according to the total number of dwellings.

1. Introduction

Urban development has experienced constant problems over time due to the large number of variables that come into play within cities. The most important ones, according to a state-of-the-art study carried out, are the effect that the increase in population has had on the demand for land use [1], connectivity and proximity between territories [2,3], the detriment to the environment [4], accessibility to goods and services [5], and harmful effects on the health of the population [6], among others. Factors like these lead to urban landscaping, which is the result of the effects produced by the interrelation between population growth and city expansion [7]. However, from the start, this process was developed as a system where ornamental aspects prevailed [8] and with a lack of planning, among other characteristics [9,10].
Today, the situation is different, since many professions are adapting their vision into a more sustainable one with a serious commitment to national and international treaties, laws and regulations. This is how, for example, the choice of trees for a project went from covering a simple need to impacting other economic, environmental and social aspects [11,12,13]. Therefore, this selection should be more rigorous when distinguishing between the best options for a project based on their environmental, economic, social and public health advantages. However, this situation does not conform to reality because developing countries present many difficulties in developing design and management systems [14].
Chile currently has a legislative proposal that aims to regulate the planting of trees in the city, which would grant certain responsibilities in this matter to municipalities [15]. However, the country also neglects aspects that are essential to achieve positive changes. An example is the large gap between green areas within the Metropolitan Region of Santiago de Chile, where communities with greater financial power have access to larger green areas and better management plans [16,17]. At the same time, pollution follows the same distribution pattern, where communities of a medium or low social stratum register higher pollution levels [18,19,20,21]. This is also affected by geographical factors that worsen the air quality during winter [22,23].
Meanwhile, the projected housing demand in Chile in 2022, according to estimates from the Ministry of Housing and Urban Development (MINVU) based on data from the 2017 census, rose to 643,534 homes and is projected to reach 1,300,000 in 2035. This deficit is due to factors such as population growth, the high cost of housing, overcrowding, precariousness and the lack of effective public policies on environmental matters.
On 3 July 2022, the Republic of Chile presented the Emergency Housing Plan (PEH, in Spanish) 2022–2025 (Emergency Housing Plan—Ministry of Housing and Urban Development (Plan de Emergencia Habitacional: Las claves de la estrategia y las metas por región—Gob.cl (www.gob.cl) accessed on 5 October 2023), a strategy developed by the MINVU to urgently address Chile’s housing deficit, and this is part of the new Law of Social and Urban Integration. Its main objectives include recovering the state’s central role in housing planning and management, along with delivering 260,000 homes during the government’s current term. Thanks to the PEH, it will be possible to cover at least 40% of the current housing requirements, which are concentrated, mainly, in the Metropolitan Regions (accounting for an estimated 40% of the deficit at the national level), followed by Valparaíso and Biobío.
This context has produced a historic opportunity for the present proposal to use native tree species to capture CO2 and improve the environmental indicators, mainly in the Metropolitan Region of Chile, which has a population of 7,112,808 inhabitants according to the last census carried out in 2017.
These reasons create the need to learn about the economic, environmental and health impacts that the choice of tree can have in an urban environment such as the Metropolitan Region of Santiago. The results could help obtain a viewpoint for the medium term and provide the bases for future regulations.

2. State of the Art

Over the years, environmental problems such as urban heat islands, soil erosion, water stress or the generation of various types of waste and pollution [24,25,26] (all products of urbanization) have been worsening as cities grow, representing a constant concern for authorities. This is how various international groups and countries sought strategies to reduce or control these phenomena. During the development of these measures, it became clear that one of the most controversial issues is the relationship between the uneven development of green and urban areas depending on the wealth and social context of the city area concerned, leaving out aspects such as the link between green areas and economic growth, the insertion of trees in cities, the inequality between socioeconomic groups and the proportion of wooded areas. This led the European Union (EU) to investigate new alternatives and to propose three policies on the management and promotion of green areas and urban trees. These three policies are building green infrastructure for Europe [27], the European Green Deal [28] and the European Union Strategy on Biodiversity for 2030 [29].
The ‘Building a Green Infrastructure for Europe’ project [30] set out to promote and facilitate green infrastructure projects using existing financial, political and legal instruments. On the other hand, it managed to obtain financing through the Cohesion Fund, intended for states that present a gross national income per inhabitant lower than 90% of the EU average [31], and the European Regional Development Fund, which strengthens economic and social partnerships in the EU by correcting regional imbalances [32]. The EU also supports research and innovation in the environmental field [33].
The ‘European Green Deal’ [28] developed a program focused on biodiversity through proposals that seek to establish greener cities and that promote urban spaces, allowing the protection of biodiversity and control over its deterioration. This agreement also contains detailed information on green infrastructure, the percentage of green areas in cities and their distribution, and the percentage of representativeness of artificial and natural elements, in addition to the number of green areas per person [34].
In Europe, there is quite a unique development at the country level, since each one autonomously generates its own laws, norms or standards for designs that fit their cultural, economic, political and urban realities. Some European countries have policies similar to the Chilean regulations on urban planning, like Great Britain, where there are national technical documents that establish voluntary protocols [35]. On the other hand, in Spain, each city decrees its own system to guarantee its well-being under a mixed legal framework, with voluntary manuals [36] or mandatory provisions through communal ordinances [37,38]. Meanwhile, Germany stands out because it has legal information at the governmental [39] and local levels [40,41,42], and all its documentation is mandatory.
At the Chilean national level, there is a legal body governed by the General Urban Planning and Building Ordinance (OGUC) [43], which is not rigorous or specific in terms of the implementation of tree species. In its articles, it defines green area projects as ‘plantations and ornamental works’. Meanwhile, the Organic Constitutional Law of Municipalities [44] establishes that it is the municipalities’ task to uphold ‘communal cleanliness and ornateness’ and that they must have a municipal unit to do so. Therefore, each city has different parameters for planning, using and caring for urban tree species.
In the absence of specific normative or legislative figures, the available options clearly tend to be voluntary or informative. These categories include technical manuals [45,46], studies on the link between the number of green areas and the people’s socioeconomic level [47], magazines on the situation of urban trees [48], studies on quality of life in relation to tree species [49] and private initiatives [50]. However, in 2018, the Ministry of Agriculture set out to produce a law on urban trees [51] and created a legislative proposal in April 2021 [15].
Regarding financing these projects, Chile does not have a clear public policy that promotes, supports or subsidizes sustainable urban development proposals, ignoring aspects such as the maintenance of species (pruning, root care and growth control), soil conservation (nutrients, composition and water) and the relationship between the tree and its environment (interactions between signs, poles, electrical wiring and diseases). It is up to each municipality to ensure the creation and conservation of green areas and trees, creating a gap between municipalities with a high purchasing power [52,53] versus others with fewer resources [54,55]. This could be one of the reasons behind a possible link between socioeconomic level and environmental pollution [47,56,57].
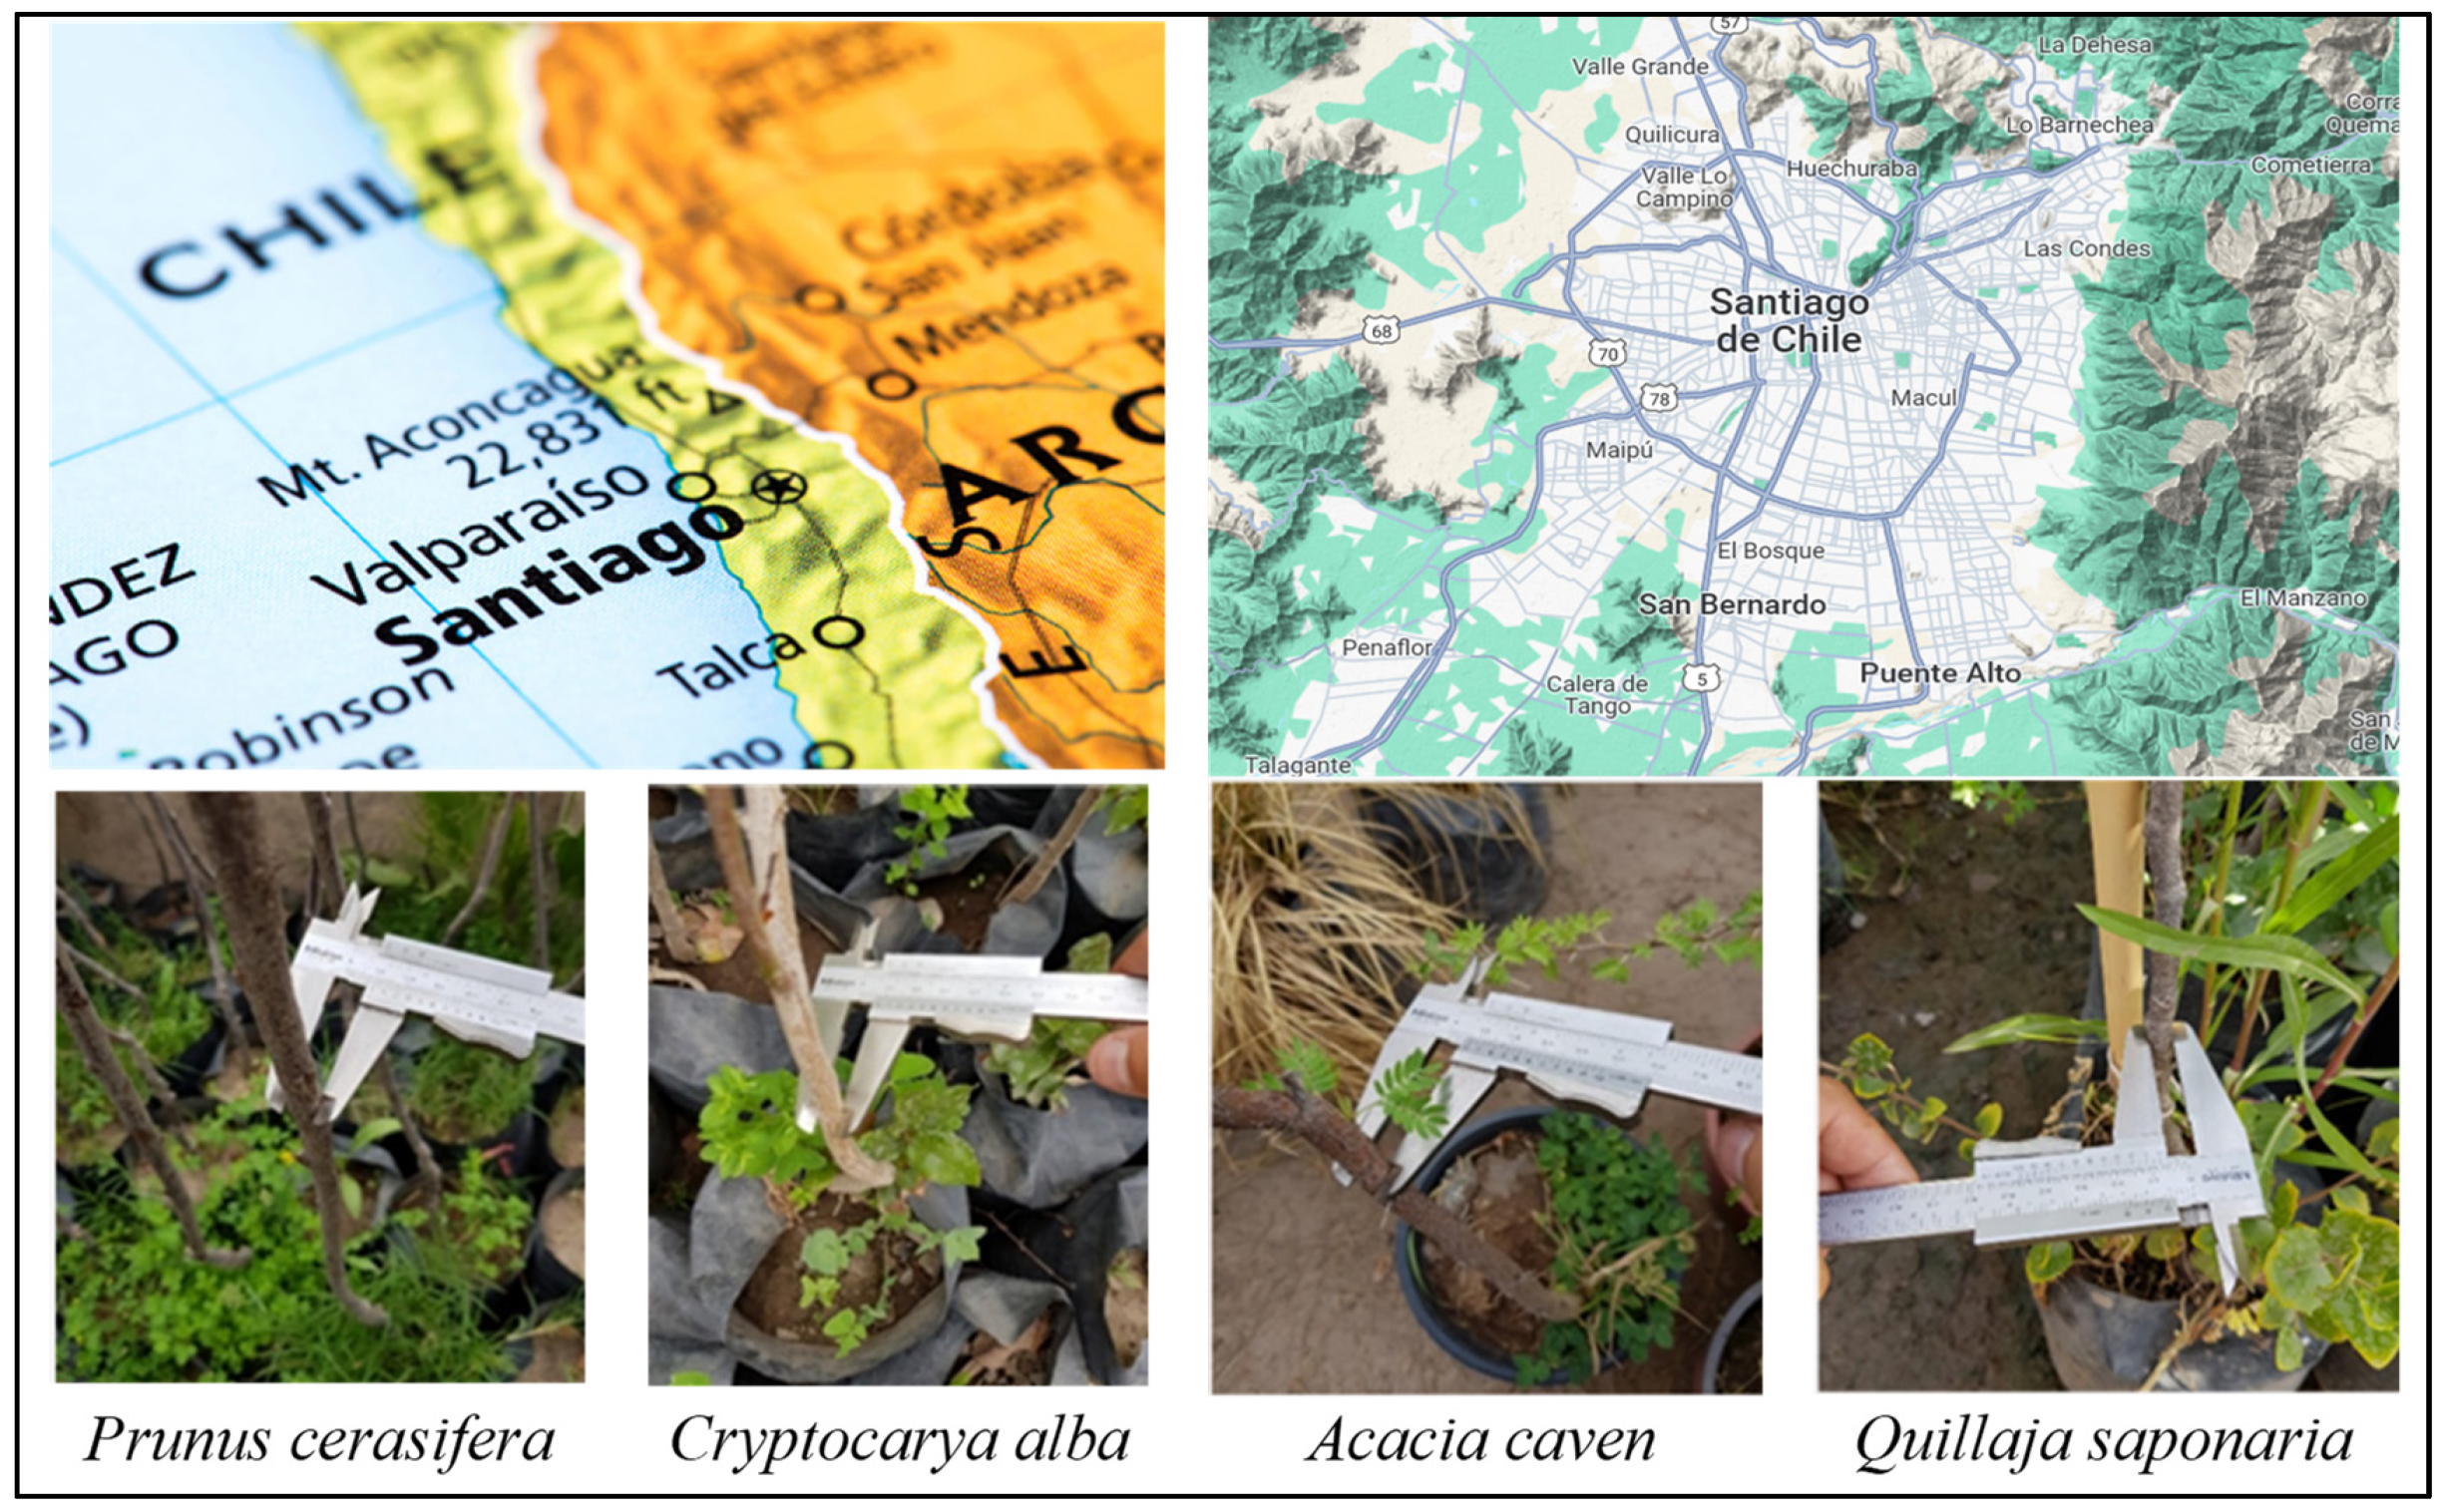
In light of the above, it is highly important to analyze the environmental behavior of urban tree species (in this case, one introduced and three native trees) frequently used in the Metropolitan Region of Santiago de Chile (represented in Figure 1) with respect to four variables: carbon dioxide (CO2) emissions and capture, PM2.5 particulate matter emissions and deposition, biogenic volatile organic compound (BVOC) emissions, and the water requirement and amount of rainwater.
On the other hand, the comparison between using tree species only in social housing or using them in all existing housing will allow us to reveal the potential significant differences in the environmental, economic and health aspects using the same parameters mentioned in the previous paragraph.

3. Materials and Methods

Since this applied methodology is our own, it has not been published and is not referenced in the literature, and it is summarized so that it can be replicated in other research.
The first step is determining, according to the statistical criteria laid out in the Chilean National Census of 2017, the population size, available social houses and the total number of homes that exist in the area. This will make it possible to learn about the number of inhabitants that are environmentally affected in the region.
Then, the measurement of the tree trunk is used to analyze two variables. The first is related to the maturity of the species in question, since it is closely linked to the trunk’s diameter. However, the growth in diameter is statistically insignificant for the first 10 years, which is why it is more important during this period to calculate the second variable, which is the maintenance cost of each species.
Next, the following parameters, the criteria of maintenance, permanence over time and relationship with its environment for each tree, are studied. Subsequently, with the results obtained for each of the species, comparative analysis is conducted. To do so, the variables chosen are the following:
(a)
Maintenance: investigating the data related to tree management over time and how they should be cared for according to sustainable parameters.
(b)
Soil conservation: providing the necessary elements to the land that maintains the tree so that its nutritional contribution is sustainable over time.
(c)
Tree–environment relationship: characteristics of the interrelation of the species with elements of the city and the environment.
This would make it possible to obtain information to project a city toward greater constructive, urban and architectural integration, since the city’s environmental neighborhoods would improve, and the buildings’ conditions would improve.

4. Application of the Methodology

4.1. Research Location

This research focused on the Santiago Metropolitan Region in the central area of the country, which is surrounded by mountain ranges. In the summer, there is a thermal inversion layer that enables the evacuation of certain pollutants. In the winter, the opposite occurs as the layer descends [58,59,60].

4.2. Population

The Santiago Metropolitan Region has the highest population index in the country and the largest urban area [61,62]. This research was backed by data from the National Institute of Statistics (INE) and a methodological report on urban growth from the Ministry of Housing and Urban Planning (MINVU), which showed the highest rate of population growth in the region.

4.3. Tree Species

We analyzed a set of autochthonous tree species and an introduced species planted in the city, comparing their characteristics and behaviors in an urban environment using urban tree recognition guides and studies related to BVOC emissions [63,64,65,66,67].

4.4. Dwellings

In this study, we also looked at social interest housing, with the aim of promoting community integration and the sustainable development of people in vulnerable socioeconomic situations. Social housing was defined according to the DS49 housing subsidy granted by the state to families in a situation of social vulnerability and in need of housing. We used data from the MINVU Urban Observatory and the decree law that transfers the ‘social housing’ programs and the law on real estate co-ownership to the Ministry of Housing and Urbanism [68,69,70,71]. In addition, the types of houses in the area, which includes social housing, were analyzed to compare the results [72,73].
The total number of homes, whether they are social or non-social, addressed in this study corresponds to official statistics from the corresponding government entity [68,69] and is presented in Table 1.
The introduced species with deciduous leaves and edible fruits and which is currently the most used species in the city is Ciruelo Flor (Prunus cerasifera Ehrh) [74]. The others are native: Peumo (Cryptocarya alba) and Quillay (Quillaja saponaria), with perennial leaves, and Espino (Acacia caven), with deciduous leaves and less foliage [74]. Although they cannot compete in regard to quantity with the first species, they are readily available on the market.
The number of individuals or trees that each species has, shown in Table 2, was calculated based on the percentage of real prevalence in a study of tree diversity [74].

4.5. Capture and Emission of CO2

CO2 is currently the gas that contributes the most to global warming [75]. This is why most countries worldwide have made commitments to reduce these emissions. In Chile, there is a National Plan [76] that sets out to reduce it by 30% by the year 2030.
To help balance these levels out, we learned about the CO2 capture capacities of each species by using the following procedure, In the case of the introduced species (Ciruelo de Flor), we conducted an analysis in Ecuador Park in the city of Concepción [77] using its surface area, the number of individual Ciruelo de Flor trees and CO2 absorption capacity to establish proportional relationships and the absorption capacity of this gas that the city of Santiago could have; for the other species, we analyzed a native forest [78].
Finally, to estimate the individual absorption capacity of each tree (kg/m2), we determined the characteristic diameters and crown surfaces [63,79,80,81] of each species, using the result to calculate the absorption capacity. An individual tree’s maximum capacity to capture CO2 during a given period is shown in Table 3.
The information was extracted from the website of the National System of Greenhouse Gas Inventories (SNI) of the Ministry of the Environment (MMA) for the years 2017 and 2018 [82]. For 2016, there was information at the regional level [83,84], which was used to project values at the Metropolitan Region level for 2017 and 2018. There was no information for 2019, so the results of Table 4 were obtained using a geometric method and trend line, thus obtaining a relationship between emissions and the surface of the study area.

4.6. PM2.5 Particulate Emissions

Particulate matter is currently a problem in urban areas of the world, raising the number of respiratory diseases in the winter and causing an increase in said diseases and the collapse of health systems [85,86]. This creates the need to assess trees’ capacity to deposit or capture particulate matter.
We obtained the deposition capacity of Ciruelo de Flor from the analysis carried out in Ecuador Park [77] and of the other species from a report carried out in the research region [87]. The information collected is shown in Table 5.

4.7. Water Requirement and Rainfall

There have been droughts in Chile since 2007 [88]. To combat them, the government has implemented measures for the management of water resources [88,89,90]. The deficient management of water use [91] has increased the water stress in many areas of the country, requiring extensive technological management to reduce the costs of the resource in the long term [92]. An example of relevant management could be the use of ozone for treating gray water, which yields recovered water of a high quality for reuse [93,94,95,96]. This research used the parameter ‘Water requirement’ (m3/m2/year) to analyze the necessary amount of this resource according to each tree species and their consumption to reach maturity [80,97,98,99,100]. These data were contrasted with the amount of annual rainfall in the Metropolitan Region (m3/m2/year), which was obtained from the website of the Chilean Meteorological Directorate [101].
This allowed us to obtain a balance of demand and availability of the resource, laying the foundations for an eventual reform of the design and planning of the urban landscape. This reform could include, for example, the option of irrigation with gray water in areas with water stress [93].
Table 6 shows the figures expressed according to the amount of water required by each species. Table 7 shows the amount of rainfall.

4.8. Emissions of Biogenic Volatile Organic Compounds, BVOCs

Chileans do not know about the full extent of the consequences of BVOCs. In the proposed study area, there are no considerations in this regard, revealing the inexistence of public policies and clear proposals on the subject. This is worrisome, since a large percentage of existing trees are potentially BVOC emitters. There are studies [102,103,104,105] that reveal the detrimental effect that this compound has on the health of the population and the environment.
We analyzed the emission potentials (µmol m−2 s−2) of each species to learn the impact that each one has on the environment [66]. The objective of this procedure was to lay the foundations for future projects with trees in the city, and thus, reduce the effects that these emissions have on the population’s health. See Table 8.

5. Results

Chile’s current urban landscape development system has deficiencies throughout the process, which requires us to search for new urban design alternatives that benefit the population and the environment based on their sustainable attributes. In this regard, this study sought to obtain data on the effective performance of the species regarding their maintenance, soil conservation and tree–environment relationship to later be implemented around areas with social housing and all the houses in the Metropolitan Region, studying the percentage and number of species [100,106].

5.1. Cases Proposed for the Study

This section will establish the results of the different tree configurations with respect to the four parameters studied, according to each proposed case. The following interactions will be addressed to do so:
Case 1, or the base case, reflects how the intervened area would change if all the trees in that area were replaced by one of the species proposed in the study, and this will be used to establish a comparison pattern.
Case 2 uses the number of existing social dwellings. It reflects what would happen if an individual of one of the tree species studied was planted for each existing social dwelling, repeating the procedure for each of the other species.
Case 3 follows the same structure as Case 2, but using all the existing dwellings.

5.1.1. Case 1, or Case Base

Table 9 presents the tree simulation according to the four study parameters, assuming that each species is the only one present.

5.1.2. Case 2—Social Housing

In this case, a tree of each species, respectively, was evaluated according to the four parameters investigated, considering that one tree is planted for each of the existing social houses in the research area. The results are shown in Table 10.

5.1.3. Case 3—Total Dwellings

In Case 3, we performed the same process as in Case 2, but using the total number of dwellings in the Metropolitan Region. The results are shown in Table 11.

5.2. Graphs and Results of the Study

The graphs presented below correspond to the comparative analyzes between the tree species.

5.2.1. Results of Case 1 or Case Base

Figure 2 shows the cost of each projected tree species over a 50-year period.
Figure 3 shows the capture of Carbon Dioxide, CO2 (%), according to the estimated average in one year and to the emissions reported for the years 2017, 2018 and 2019.
To know the deposition capacity of PM2.5 material according to the average capacity during a year, Figure 4 is presented.
Figure 5 shows the incidence of Biogenic Volatile Organic Compounds generated during the spring season.

5.2.2. Results Case 2—Social Housing

To find out the cost difference between tree species projected over 50 years, Figure 6 is shown.
Figure 7 identifies the percentage capture of CO2 according to the average obtained by tree species in one year in relation to existing emissions in 2017, 2018 and 2019.
The percentage representation between the average deposition in one year for the species and the quantity of emissions of fine particulate matter, PM2.5, for the years 2017, 2018 and 2019 is shown in Figure 8.
The averages between minimum and maximum emissions allow us to observe the differences between species, as shown in Figure 9.

5.2.3. Results Case 3—Total Dwellings

First of all, Figure 10 shows the projected costs for each of the adult tree species over 50 years.
For the Carbon Dioxide variable, CO2, Figure 11 shows the percentage contribution to the average capture during a year that the species can achieve, with respect to the emissions report for the years 2017, 2018 and 2019.
Figure 12 shows the percentage contribution made by species according to the PM2.5 variable, when the capture is with respect to emissions during the years 2017, 2018 and 2019.
To easily visualize the different emission capacities of tree species, the averages between minimum and maximum are used, expressed in Figure 13.

5.3. Water Analysis

The data used for the analysis will be expressed based on a surface unit (m3/m2/year), so they can be used interchangeably for the three cases (Case 1—base case; Case 2—social housing; Case 3—total number of dwellings). Then, we will show the water requirements of each individual of each species versus the amount of rainfall in the years 2017, 2018 and 2019 to represent both variables (required water versus rainfall).
Figure 14 compares the water consumption required by each adult tree of each species to find out the impact of each one of them in this regard.

5.4. Equivalence between Tree Species according to Various Parameters

Figure 15, Figure 16, Figure 17, Figure 18 and Figure 19 show the different capacities and equivalences, as percentages, that each adult tree species provides compared to the others and with respect to the parameters considered. The one with the greatest impact will be shown as 100% and will be used as a reference for the rest. Figure 15 shows the differences between the costs for the 50-year projected species.
The equivalences between species with respect to the capture of Carbon Dioxide, CO2, on average over a year, will be established in Figure 16.
The differences between species according to the deposition of PM2.5 obtained as an average in one year are proposed in Figure 17.
The influence of each species according to the emission capacity of biogenic volatile organic compounds during the spring season and according to the average between the time of greatest emission and the time of lower emission can be seen in Figure 18.
Figure 19 shows the difference between the water requirements for each species.

6. Discussion

Firstly, it is worth noting that there is not enough literature based on technical manuals, studies or reports that deal with the subject of the native trees studied, although they do exist for other types of trees [77,78,98]. The problem is that there are specific data, but there is no research base that supports decision making to design a city considering issues that improve the socioeconomic, environmental or health aspects linked to urban trees.
Today, with pollution and global warming representing national and global issues, we must increase the sustainability of our urban development [20,82,83]. However, scarce economic resources mean that these projects will always be limited by budgetary constraints [47,56]. In addition, the economic resources available for the addition of urban trees are not homogeneous in the area investigated, as each municipality has a limited amount related to the socioeconomic level of its inhabitants [12,48,49]. Therefore, the way authorities, urban designers and the community as a whole approach development must change.
Trees in cities generate a series of beneficial effects that contribute to social, cultural or health-related well-being. However, there are also some negative aspects that must be taken into account in order to plan appropriately when allocating resources to this type of project and have a good management plan. These factors include BVOCs (addressed in this study), pollen, leaf loss, etc. [66,67,77].
Applying the proposed methodology makes it possible to analyze all the advantages and disadvantages of planting native tree species in urban areas associated with social housing. This is very important due to the current need for constructing this type of housing in Chile and the environmental, social, economic and health benefits that it entails.

7. Conclusions

The tree maintenance costs projected over time reveal that the origin of the species is not decisive. Instead, size plays a preponderant role, since the larger the tree is (roots, trunk, branches, leaves and crown), the greater the amount of money required is to keep it healthy.
Regarding their capacity of absorbing CO2, the origin of the species will have an impact, as the exotic species’ capacity is much lower compared to that of the native ones. It will also depend on factors such as foliage and size, making evergreen species that are larger (roots, trunk, branches, leaves and crown) more impactful in this sense, which makes the Espino species an unwise choice.
Regarding the deposition of PM2.5, the number of particles that the introduced species captures is insignificant compared to that of the native ones. Furthermore, the type of foliage and the volume (trunk, branches, leaves and crown) of the tree is impactful, adding greater importance to evergreen species than to deciduous ones and granting them the ability to capture larger volumes. Therefore, the introduced species falls short in this regard.
The exotic species Ciruelo de Flor (Prunus Cerasifera Ehrh) presented a higher level of water consumption than the native ones did, confirming the idea that introduced trees have a worse performance. This is emphasized in this species by the need to feed their fruits. Furthermore, the current climatic conditions do not favor the use of species that require abundant water due to recent water deficits in the area. Therefore, this species is not recommended, nor are any trees with edible fruits.
The average amount of BVOCs emitted by each species show that species that are dissimilar in size (Quillay and Ciruelo de Flor) have similar amounts of emissions. Moreover, there is no decisive difference between the emissions of the introduced species and the native ones. For the above reasons, the amount of emissions could be due to the leaf density of each tree. This makes the Espino, with less-abundant foliage than those of the other species, the most recommendable in this sense.
In line with the previous points on the variables that represent tree maintenance over time and emissions (CO2, PM2.5 and BVOCs), the results show that the impact will be determined by the size of the tree and its foliage. On the other hand, the origin of the species is only impactful when analyzing the water resource variable.
Therefore, our conclusions are as follows. In small spaces within the city, such as passages or narrow streets, small species such as the Flower Plum (Prunus cerasifera Ehrh) or Hawthorn (Acacia caven) could be used, although the morphological variable must also be considered. In uncultivated areas, such as hills or places where irrigation is difficult, the Espino species (Acacia caven) can be recommended. For places that have larger spaces and are close to industries that work with fossil fuels or roads with heavy traffic, the Quillay species (Quillaja saponaria) will be recommended first, followed by the Peumo species (Cryptocarya alba). To control BVOC emissions in areas with health centers with patients with respiratory problems, we would recommend not planting Peumo species (Quillaja saponaria) and trying to mainly plant Hawthorn trees (Acacia caven).
Analyzing the environmental variables reveals that the contribution of the trees is irrelevant if the evaluation only includes the number of social houses, but this changes when evaluating their number with respect to the total number of houses. However, for CO2, the amount that they capture is still irrelevant, so we would not recommend using these tree species solely to combat the emissions of this gas.
Due to all the above, it will be necessary to create ordinances, statutes, codes, regulations, manuals or information that can be accessed by government agencies, private entities or by the residents themselves to give way to orderly and regulated tree planning, in addition to promoting the proper use of the city tree within communities.

Author Contributions

Conceptualization, D.B.; methodology, P.P.R.; validation, M.B.A.-C. and D.B.; formal analysis, C.T.; investigation, I.H. and I.A.; resources, L.P.; writing—original draft preparation, M.A.D.; writing—review and editing, F.P.; visualization, M.L.; supervision, M.B.A.-C.; project administration, D.B. All authors have read and agreed to the published version of the manuscript.

Funding

This research received no external funding.

Data Availability Statement

The data presented in this study are available on request form the corresponding author.

Conflicts of Interest

The authors declare no conflict of interest.

References

  1. Merlotto, A.; Piccolo, M.C.; Bértola, G.R. Crecimiento urbano y cambios del uso/cobertura del suelo en las ciudades de Necochea y Quequén, Buenos Aires, Argentina. Rev. Geogr. Norte Gd. 2012, 53, 159–176. [Google Scholar] [CrossRef]
  2. Rozas, P.; Figueroa, O. Conectividad, Ámbitos de Impacto y Desarrollo Territorial: Análisis de Experiencias Internacionales: Volumen I, División de Recursos Naturales e Infraestructura Naciones Unidas. CEPAL. 2006. Available online: https://hdl.handle.net/11362/6314 (accessed on 3 August 2023).
  3. Rodríguez, J.; González, D.; Martínez, J.; Páez, K. Población, Territorio y Desarrollo Sostenible. CELADE, CEPAL. 2011. Available online: https://www.cepal.org/sites/default/files/events/files/pyt_celade.pdf (accessed on 3 August 2023).
  4. Comisión Económica para América Latina y el Caribe (CEPAL). Dos Artículos Sobre Población, Medio Ambiente y Desarrollo en América Latina y el Caribe. Canadian International Development Agency. 1995. Available online: https://hdl.handle.net/11362/9575 (accessed on 3 August 2023).
  5. Vicuña, M.; Orellana, A.; Truffello, R.; Moreno, D. Integración urbana y calidad de vida: Disyuntivas en contextos metropolitanos. Rev. INVI 2019, 34, 17–47. [Google Scholar] [CrossRef]
  6. Organización Panamericana de la Salud (OPS). La Salud de las Ciudades Determinará la Salud Futura de la Población, Washington, D.C. 7 April 2010. Available online: https://www.paho.org/es/noticias/7-4-2010-salud-ciudades-determinara-salud-futura-poblacion#:~:text=Adem%C3%A1s%2C%20la%20vida%20urbana%20moderna,menos%20frutas%20y%20verduras%20frescas.%22 (accessed on 3 August 2023).
  7. Cram, S.; Cotler, H.; Morales, L.M.; Sommer, I.; Carmona, E. Identificación de los servicios ambientales potenciales de los suelos en el paisaje urbano del Distrito Federal. Investig. Geogr. 2008, 66, 81–104. Available online: http://www.scielo.org.mx/scielo.php?script=sci_arttext&pid=S0188-46112008000200006&lng=es&tlng=es (accessed on 3 August 2023).
  8. Reyes-Paecke, S. Desde las Áreas Verdes a la Infraestructura Verde. Evolución de un Concepto. Laboratorio de Ecosistemas Urbanos. 2019. Available online: https://www.ecosistemasurbanos.cl/post/desde-las-%C3%A1reas-verdes-a-la-infraestructura-verde-evoluci%C3%B3n-de-un-concepto (accessed on 3 August 2023).
  9. González, P.; Antonio, J.; Patricia, A.S. La Importancia del Higienismo y la Potabilización del Agua en la Ciudad de Valencia (1860–1910), Investigaciones Geográficas (Esp); Instituto Interuniversitario de Geografía: Alicante, España, 2016; pp. 45–55. Available online: https://www.redalyc.org/pdf/176/17646281003.pdf (accessed on 3 August 2023).
  10. Roxanna Ríos Peters. Espacios Abiertos Informales. Factores Condicionantes de Usos y Cualidades Ambientales Informales, Estrategias de Reutilización y Criterios de Diseño Sustentable para la Intervención en Espacios Abiertos Informales. Caso de Estudio: Pudahuel Urbano. 2012. Available online: https://estudiosurbanos.uc.cl/wp-content/uploads/2012/11/TESIS-RRP.pdf. (accessed on 3 August 2023).
  11. Priego González de Canales, C. Beneficios del Arbolado Urbano. 2002. Available online: http://hdl.handle.net/10261/24578. (accessed on 3 August 2023).
  12. Fernández, M. La ciudad y los árboles: Conflicto entre el arbolado urbano y la infraestructura. AyF Agron. For. 2011, 43, 32. Available online: https://www.researchgate.net/publication/278730673_La_ciudad_y_los_arboles_Conflicto_entre_el_arbolado_urbano_y_la_infraestructura (accessed on 3 August 2023).
  13. Fábos, J.G.; Lindhult, M.; Ryan, R.L.; Jacknin, M. (Eds.) Assessing public health benefits through green infrastructure strategies in medium-sized cities in Spain. Case study: La Coruña. In Proceedings of the FábosConference on Landscape and Greenway Planning 2013: Pathways to Sustainability, Amherst, MA, USA, 12–13 April 2013; Full Papers; Department of Landscape Architecture and Regional Planning, University of Massachusetts: Amherst, MA, USA, 2013; Available online: https://www.researchgate.net/publication/280245013_Assessing_public_health_benefits_through_green_infrastructure_strategies_in_medium-sized_cities_in_Spain_Case_study_La_Coruna (accessed on 3 August 2023).
  14. Del Pozo Donoso, S.J. Gesión del Árbol Urbano. Available online: http://arboriculturaurbana.blogspot.com/2011/09/arbolado-urbano-en-la-legislacion.html (accessed on 3 August 2023).
  15. Allende, I.; Órdenes, X.; De Urresti, A.; Durana, R.P.Y.J.M. Comisión de Medio Ambiente del Senado. 28 April 2021. Available online: https://www.senado.cl/appsenado/templates/tramitacion/index.php?boletin_ini=14213-12 (accessed on 3 August 2023).
  16. Reyes Päcke, S.; Figueroa Aldunce, I.M. Distribución, superficie y accesibilidad de las áreas verdes en Santiago de Chile. EURE 2010, 36, 89–110. [Google Scholar] [CrossRef]
  17. Gobierno Regional Metropolitano de Santiago. Política Regional de Áreas Verdes. División de Planificación y Desarrollo, Pulso Consultores S.A., Santiago. 2021. Available online: https://www.gobiernosantiago.cl/wp-content/uploads/2014/doc/estrategia/Politica_Regional_de_Areas_Verdes,_2014.pdf (accessed on 3 August 2023).
  18. Dirección Social Nacional. Medio Ambiente y Pobreza, Construir Resiliencia Frente al Cambio Climático, Subdirección de Desarrollo y Estudios, Fundacion Jesuita Entre Culturas. 2019. Available online: https://www.entreculturas.org/sites/default/files/noticias/documento_medioambiente_y_pobreza.pdf (accessed on 3 August 2023).
  19. Romero Aravena, H.; Fuentes, C.y.S.P. Ecología Política de los Riesgos Naturales y de la Contaminación Ambiental en Santiago de Chile: Necesidad de Justicia Ambiental. 2010. Available online: https://repositorio.uchile.cl/handle/2250/117839 (accessed on 3 August 2023).
  20. Romero, H.; Irarrázaval, F.; Opazo, D.; Salgado, M.; Smith, P. Climas urbanos y contaminación atmosférica en Santiago de Chile. EURE 2010, 36, 35–62. [Google Scholar] [CrossRef]
  21. Saavedra Meléndez, M. Gestión de residuos y segregación urbana: Villa estaciones ferroviarias de Puente Alto, Santiago de Chile (1985–2015). Urbano 2017, 20, 42–53. Available online: https://www.redalyc.org/articulo.oa?id=19853617005 (accessed on 3 August 2023). [CrossRef]
  22. Biblioteca Nacional De Chile. La Contaminación Atmosférica de Santiago. Memoria Chilena. Available online: https://www.memoriachilena.gob.cl/602/w3-article-3507.html#presentacion (accessed on 3 August 2023).
  23. Sociedad Chilena de Ciencias Geográficas. Anales Sociedad Chilena de Ciencias Geográficas 2011. Available online: http://sochigeo.cl/2014/docs/Anales%202011.pdf#page=28 (accessed on 3 August 2023).
  24. Junta de Andalucía, Observatorio de Salud de Medio Ambiente de Andalucía, Unión Europea. Urbanismo, medio ambiente y Salud. Observatorio de Salud de Medio Ambiente de Andalucía. 2011. Available online: https://www.juntadeandalucia.es/organismos/saludyconsumo/areas/entornos-saludables/salud-ambiental/paginas/observatorio-salud-medio-ambiente-andalucia.html (accessed on 3 August 2023).
  25. Cárdenas Triana, G.L.; Muñoz Carrasco, Y.V. Influencia del Crecimiento Urbano Crecimiento Medido Como Poblacional Sobre el Desarrollo del Fenómeno de la Isla de Calor en la Ciudad de Santiago de Cali, Colombia. Thesis of Deggre, Universidad de LaSalle, Bogotá, Colombia, 2014. Available online: https://ciencia.lasalle.edu.co/ing_ambiental_sanitaria/584 (accessed on 3 August 2023).
  26. Wang, L.Y.; Xiao, Y.; Rao, E.M.; Jiang, L.; Xiao, Y.; Ouyang, Z.Y. An Assessment of the Impact of Urbanization on Soil Erosion in Inner Mongolia. Int. J. Environ. Res. Public Health 2018, 15, 550. [Google Scholar] [CrossRef] [PubMed]
  27. Comisión Europea. Construir una Infraestructura Verde para Europa, Dirección General de Medio Ambiente, Oficina de Publicaciones. 2014. Available online: https://data.europa.eu/doi/10.2779/2738 (accessed on 5 October 2023).
  28. Comisión Europea. Comunicación de la Comisión al Parlamento Europeo, al Consejo Europeo, al Consejo, al Comité Económico y Social Europeo y al Comité De Las Regiones: Revisión de los avances en la aplicación de la estrategia sobre la infraestructura verde de la UE, COM(2019) 236 final, Bruselas 24 May 2019. Available online: https://eur-lex.europa.eu/legal-content/ES/TXT/?uri=celex%3A52019DC0640 (accessed on 3 August 2023).
  29. Comisión Europea. Estrategia de la UE sobre la Biodiversidad de aquí a 2030, COM(2020) 380 Final, Bruselas. 20 May 2020. Available online: https://eur-lex.europa.eu/legal-content/ES/TXT/HTML/?uri=CELEX:52020DC0380 (accessed on 3 August 2023).
  30. Comisión Europea. Infraestructura Verde: Mejora del Capital Natural de Europa, COM (2013) 249 Final, Bruselas. 6 May 2013. Available online: https://eur-lex.europa.eu/resource.html?uri=cellar:d41348f2-01d5-4abe-b817-4c73e6f1b2df.0008.05/DOC_1&format=PDF (accessed on 3 August 2023).
  31. Council Regulation (EC) No 1084/2006 of 11 July 2006 Establishing a Cohesion Fund and Repealing Regulation (EC) No 1164/94 (Repealed). Available online: https://www.legislation.gov.uk/eur/2006/1084/contents# (accessed on 3 August 2023).
  32. European Parliament and of the Council Regulation (EC) No 1080/2006 on the European Regional Development Fund and repealing Regulation (EC) No 1783/1999 (Repealed). Available online: https://www.legislation.gov.uk/eur/2006/1080/body/2009-06-10# (accessed on 3 August 2023).
  33. European Investment Bank. EIB Impact Report 2020/Climate Action, Environmental Sustainability and Innovation for Decarbonisation. Available online: https://www.eib.org/en/publications/eib-impact-report-2020 (accessed on 3 August 2023).
  34. European Environment Agency. Interactive Map—Urban Tree Cover Europe 2018. Available online: https://www.eea.europa.eu/data-and-maps/dashboards/urban-tree-cover (accessed on 3 August 2023).
  35. Guidance Urban Forestry, England. The Urban Forest, Forestry Commission. 2018. Available online: https://www.gov.uk/guidance/urban-forestry. (accessed on 3 August 2023).
  36. Ayuntamiento de Madrid. Manual De Plantación para el Arbolado viario de la Ciudad de Madrid, 2011. Área de Gobierno de Medio Ambiente y Movilidad, Dirección General De Patrimonio Verde. Available online: https://www.madrid.es/UnidadesDescentralizadas/ZonasVerdes/TRANSPARENCIA/TransPlanPodaTalas/PlanPlantaciones/ficheros/ManualPlantacionesAyto.pdf (accessed on 3 August 2023).
  37. Ayuntamiento de Valdemorillo, Madrid. Ordenanza de Protección, Conservación y Mejora del Arbolado Urbano en Valdemorillo. 2005. Available online: https://aytovaldemorillo.com/wp-content/uploads/2019/09/Protecci%C3%B3n_Conservaci%C3%B3n_y_Mejora_Arbolado_Urbano.pdf (accessed on 3 August 2023).
  38. Ayuntamiento de Pinto, Madrid. Ordenanza De Proteccion Del Arbolado Urbano de Pinto. 2005. Available online: https://www.ayto-pinto.es/documents/20912/38672599-7043-44b9-8225-5de3766ff176 (accessed on 3 August 2023).
  39. Trinomics, A. Arcadis, Regional Environment Centre, Risk & Policy Analysis, Stella Consulting. In Supporting the Implementation of Green Infrastructure; Final report; European Commission: Rotterdam, The Netherlands, 2016. [Google Scholar]
  40. Berlín, G. Gesetz zum Schutz, zur Pflege und zur Entwicklung. Senatsverwaltung für Justiz, juris GmbH, Vom24. November 1997. Available online: http://gesetze.berlin.de/jportal/?quelle=jlink&query=Gr%C3%BCnAnlG+BE&psml=bsbeprod.psml&max=true&aiz=true (accessed on 3 August 2023).
  41. Berlín, G. Gesetz über Naturschutz und Landschaftspflege von Berlin. Senatsverwaltung für Justiz, juris GmbH, Vom29. Mai 2013. Available online: http://gesetze.berlin.de/jportal/?quelle=jlink&query=NatSchG+BE&psml=bsbeprod.psml&max=true&aiz=true (accessed on 3 August 2023).
  42. Berlín, G. Verordnung zum Schutze des Baumbestandes in Berlin. Senatsverwaltung für Justiz, Juris GmbH, Vom11. Januar 1982. Available online: http://gesetze.berlin.de/jportal/?quelle=jlink&query=BaumSchV+BE&psml=bsbeprod.psml&max=true&aiz=true (accessed on 3 August 2023).
  43. Ministerio de Vivienda y Urbanismo (MINVU) (1992). D.S. N°47—Ordenanza General de Urbanismo y Construcciones, Santiago. Available online: https://www.minvu.gob.cl/elementos-tecnicos/decretos/d-s-n47-1992-ordenanza-general-de-urbanismo-y-construccione/ (accessed on 3 August 2023).
  44. Ministerio del Interior, Subsecretaría de Desarrollo Regional y Administrativo, DFL 1 Fija el Texto Refundido, Coordinado y Sistematizado de la Ley Nº 18.695, Organica Constitucional de Municipalidades «DFL-1_26-Jul-2006», Santiago. Available online: https://www.bcn.cl/leychile/navegar?idnorma=251693&idparte=8402395&id;= (accessed on 3 August 2023).
  45. Alvarado Ojeda, A.; Guajardo Becchi, F.; Devia Cartes, S. Manual de Plantación de Árboles en Áreas Urbanas; Corporación Nacional Forestal: Santiago, Chile, 2014; ISBN 978-956-7669-41-7. Available online: https://www.conaf.cl/cms/editorweb/institucional/Manual_de_Plantacion_de_Arboles_en_Areas_Urbanas.pdf (accessed on 3 August 2023).
  46. Ministerio de Vivienda y Urbanismo (MINVU). Manual de Elementos Urbanos Sustentables, Tomo III Luminarias, Material Vegetal y Sistemas de Riego Eficientes; Ministerio de Vivienda y Urbanismo: Santiago, Chile, 2018; ISBN 978-956-9432-60-6. Available online: https://csustentable.minvu.gob.cl/wp-content/uploads/2018/09/manual-de-elementos-urbanos-sustentables-tomo-iii.pdf (accessed on 3 August 2023).
  47. Nowak, D.; Dwyer, J.; Childs, G. Los beneficios y costos del enverdecimiento urbano. In Areas Verdes Urbanas en Latinoamerica y el Caribe (Proc. of International Seminar on Urban Greening in Latin America and the Caribbean); Krishnamurthy, L., Nascimento, J.R., Eds.; Centro de Agroforesteria para el Desarrollo Sostenible: Chapingo, Mexico, 1998; Available online: https://www.researchgate.net/publication/265540211_Los_beneficios_y_costos_del_enverdecimiento_urbano (accessed on 3 August 2023).
  48. Universidad de Chile, Facultad de Ciencias Foretales y de la Conservación de la Naturaleza, Noticias «El 86% de los Árboles de Santiago Corresponde a Especies Exóticas». Available online: https://forestal.uchile.cl/noticias/141806/el-86-de-los-arboles-de-santiago-corresponde-a-especies-exoticas (accessed on 3 August 2023).
  49. Criollo, C.C.; Assar, C.R.; Cáceres, L.D.; Préndez, B.M. Arbolado urbano, calidad del aire y afecciones respiratorias en seis comunas de la provincia de Santiago, Chile. Rev. Chil. Enfermedades Respir. 2016, 32, 77–86. [Google Scholar] [CrossRef]
  50. Senado de Chile, Noticias «Arbolado Urbano e Infraestructura Verde: ¿en qué Consiste el Proyecto que Busca Garantizar Ciudades Verdes y Sostenibles?». Available online: https://www.senado.cl/noticias/medio-ambiente/arbolado-urbano-e-infraestructura-verde-en-que-consiste-el-proyecto (accessed on 3 August 2023).
  51. Ministerio de Agricultura, Noticias «Ley Arbolito—Ministerio de Agricultura». Available online: https://www.minagri.gob.cl/noticia/en-el-dia-del-arbol-ministro-walker-impulsa-ley-arbolito-para-proteger-especies-urbanas-del-pais/ (accessed on 3 August 2023).
  52. Ilustre Municipalidad de Vitacura, Ordenanza 7, Orden 7-2107, Dicta Ordenanza de Aseo y Ornato «ORZ-7_09-DIC-1996», Santiago. Available online: https://www.bcn.cl/leychile/navegar?idNorma=31021 (accessed on 3 August 2023).
  53. Ilustre Municipalidad de Santiago, Ordenanza 78 Reglamenta Conservacion de Especies Vegetales de Ornato, Mobiliario Urbano y Areas Verdes de la Comuna «ORZ-78_03-AGO-1998», Santiago. Available online: https://www.bcn.cl/leychile/navegar?i=122597&f=1998-08-03 (accessed on 3 August 2023).
  54. Ilustre Municipalidad de La Pintana, Decreto 81 Dicta Ordenanza Local Sobre Derechos Municipales «DTO-81_04-FEB-1987», Santiago. Available online: https://www.bcn.cl/leychile/navegar/imprimir?idNorma=140819&idVersion=1987-02-04 (accessed on 3 August 2023).
  55. Ilustre Municipalidad de El Bosque, Ordenanza 6 Dicta Ordenanza Sobre Derechos Municipales «ORZ-6_21-ENE-1992», Santiago. Available online: https://www.bcn.cl/leychile/navegar?i=96288&f=1998-12-30 (accessed on 3 August 2023).
  56. Covarrubias, S.; López, J. Área de Influencia de Plazas en Barrios de Nivel Socioeconómico D/Comprendiendo el uso de Plazas Barriales Para Orientar la Definición de Estándares de Áreas Verdes; Fundación Mi Parque: Santiago, Chile, 2017; Available online: https://www.miparque.cl/wp-content/uploads/2017/07/Mi-Parque-05-_-Area-de-influencia-de-plazas-en-barrios-de-nivel-socioeconomico-D-2.pdf (accessed on 3 August 2023).
  57. Ministerio de Vivienda y Urbanismo, Noticias «Minvu Revela Mapa que Muestra Barrios con peor Acceso a Áreas Verdes en el Gran Santiago». Available online: https://www.minvu.gob.cl/noticia/noticias/minvu-revela-mapa-que-muestra-barrios-con-peor-acceso-a-areas-verdes-en-el-gran-santiago/ (accessed on 3 August 2023).
  58. Morales-Salinas, L.; Vignolo, J.; Pacheco, P. Evolucion Anual del Material Particulado Fino en la Cuidad de Santiago y El Lugar de Presion Maxima en Chile. Inf. Tecnológica 1997, 8, 41–44. Available online: https://www.researchgate.net/publication/281102771_evolucion_anual_del_material_particulado_fino_en_la_cuidad_de_santiago_y_el_lugar_de_presion_maxima_en_chile (accessed on 3 August 2023).
  59. Muñoz, V.M. La contaminación Atmosférica en Santiago: Impacto Sobre la Salud de su Población; Centro de Estudios Públicos: Santiago, Chile, 1991; Available online: https://bibliotecadigital.uchile.cl/discovery/fulldisplay/alma991005892059703936/56UDC_INST:56UDC_INST (accessed on 3 August 2023).
  60. Universidad Nacional Autonoma de Mexico (UNAM). «El Origen de la Inversión Térmica y su Relación con la Contaminación del Aire. Available online: https://ciencia.unam.mx/leer/1000/el-origen-de-la-inversion-termica-y-su-relacion-con-la-contaminacion-del-aire (accessed on 3 August 2023).
  61. Instituto Nacional de Estadísticas (INE). Síntesis de Resultados Censo 2017. Available online: https://www.ine.gob.cl/estadisticas/sociales/censos-de-poblacion-y-vivienda/censo-de-poblacion-y-vivienda (accessed on 3 August 2023).
  62. Comisión de Estudios Habitacionales y Urbanos, del Ministerio de Vivienda y Urbanismo. Metodología para Medir el Crecimiento Urbano de las Ciudades de Chile; Comisión de Estudios Habitacionales y Urbanos, del Ministerio de Vivienda y Urbanismo: Santiago, Chile, 2018. [Google Scholar]
  63. Corporación Nacional Forestal (CONAF) (Chile). Árboles Urbanos de Chile: Guía de Reconocimiento. 2012. Available online: https://bibliotecadigital.ciren.cl/handle/20.500.13082/29450 (accessed on 3 August 2023).
  64. Hernández Vargas, F. Impactos Físico/Biológicos y Sociales del Parque Padre Hurtado, Comuna de la Reina; Universidad de Chile: Santiago, Chile, 2010; Available online: https://repositorio.uchile.cl/handle/2250/151655 (accessed on 3 August 2023).
  65. Préndez, M.; Peralta, H. Determinación de Factores de Emisión de Compuestos Orgánicos Volátiles de Dos Especies Arbóreas Nativas de La Región Metropolitana, Chile. Inf. Tecnológica 2005, 16, 17–27. [Google Scholar] [CrossRef]
  66. Préndez, M.; Carvajal, V.; Corada, K.; Morales, J.; Alarcón, F.; Peralta, H. Biogenic volatile organic compounds from the urban forest of the Metropolitan Region, Chile. Environ. Pollut. 2013, 183, 143–150. [Google Scholar] [CrossRef] [PubMed]
  67. Préndez, M.; Corada, K.; Morales, J. Emission factors of biogenic volatile organic compounds in various stages of growth present in the urban forest of the Metropolitan Region, Chile. Res. J. Chem. Environ. 2013, 17, 116. Available online: https://www.researchgate.net/publication/286337884_Emission_factors_of_biogenic_volatile_organic_compounds_in_various_stages_of_growth_present_in_the_urban_forest_of_the_Metropolitan_Region_Chile (accessed on 3 August 2023).
  68. Observatorio Urbano, Ministerio de Vivienda y Urbanismo (MINVU). Informe Urbano—Habitacional Período 2006–2009. 2010. Available online: https://observatoriourbano.minvu.cl/Docs/pdf/IHU_2006-2009_%2005-03-10.pdf (accessed on 3 August 2023).
  69. Observatorio Urbano, Ministerio de Vivienda y Urbanismo (MINVU). Metodología Para Medir el Crecimiento Urbano de las Ciudades de Chile. 2017. Available online: https://observatoriourbano.minvu.cl/Docs/pdf/Metodolog%C3%83%C2%ADa%20Crecimiento%20Urbano.pdf (accessed on 3 August 2023).
  70. Ministerio de Vivienda y Urbanismo (MINVU). Decreto Ley 2552, Transfiere al Ministerio de la Vivienda Y Urbanismo los Programas de “Viviendas Sociales”. 1979. Available online: https://www.bcn.cl/leychile/navegar?idNorma=6945&idVersion=1981-03-12&idParte= (accessed on 3 August 2023).
  71. Ministerio de Vivienda y Urbanismo (MINVU). Ley 19537, Sobre Copropiedad Inmobiliaria; Ministerio de Vivienda y Urbanismo: Santiago, Chile, 2015. [Google Scholar]
  72. Gabriel, B.; Pablo, Á. Vivienda Social en Chile Propuestas Concretas para Resolver el Déficit Habitacional y la Segregación en las Ciudades. 2021. Available online: https://horizontalchile.cl/assets/uploads/2022/03/vivienda-social-en-chile-septiembre-2021.pdf (accessed on 3 August 2023).
  73. Ministerio de Vivienda y Urbanismo (MINVU). DS. N° 49. (V. y U.) Reglamento del Programa Fondo Solidario de Elección de Vivienda. 2011. Available online: https://www.minvu.gob.cl/elementos-tecnicos/decretos/ds-n-49-v-y-u-de-2011-act_21-06-2017/ (accessed on 3 August 2023).
  74. Hernandez, Jaime & Villaseñor, Nélida. Twelve-year change in tree diversity and spatial segregation in the Mediterranean city of Santiago, Chile. Urban For. Urban Green. 2017, 29, 10–18. [Google Scholar] [CrossRef]
  75. Intergovernmental Panel on Climate Change (IPCC). Resumen para Responsables de Políticas. En: Calentamiento Global de 1.5 °C, Informe Especial del IPCC Sobre los Impactos del Calentamiento Global de 1.5 °C con Respecto a los Niveles Preindustriales y las Trayectorias Correspondientes que Deberían Seguir las Emisiones Mundiales de Gases de Efecto Invernadero, en el Contexto del Reforzamiento de la Respuesta Mundial a la Amenaza del Cambio Climático, el Desarrollo Sostenible y los Esfuerzos por Erradicar la Pobreza. 2018. Available online: https://www.ipcc.ch/site/assets/uploads/sites/2/2019/09/IPCC-Special-Report-1.5-SPM_es.pdf (accessed on 3 August 2023).
  76. Ministerio del Medio Ambiente (MMA). Plan de Acción Nacional de Cambio Climático 2017–2022; Gobierno de Chile: Santiago, Chile, 2017; Available online: http://biblioteca.digital.gob.cl/handle/123456789/1422 (accessed on 3 August 2023).
  77. Barra López, D. Análisis del Efecto del Arbolado Urbano Sobre la Absorción de Material Particulado Respirable (MP2, 5), Mediante el Software I—Tree Eco al Interior del Parque Ecuador en la Ciudad de Concepción. Thesis of Deggre, Universidad de Chile, Santiago, Chile, 2019. Available online: https://repositorio.uchile.cl/handle/2250/170493 (accessed on 3 August 2023).
  78. Garfias, S.R.; Castillo, S.M.; Vita, A.A.; Bown, I.H.; Zúñiga, N.P.; Ruiz, G.F.; Caldentey, J. Funciones de Biomasa y Estimación de Carbono Fijado por las Principales Especies del Bosque Esclerófilo de las Regiones de O’Higgins y del Maule; Universidad de Chile: Santiago, Chile, 2019; Available online: https://investigacion.conaf.cl/archivos/repositorio_documento/2020/08/RESUMEN.pdf (accessed on 3 August 2023).
  79. Ministerio de Vivienda y Urbanismo (MINVU). Informe Final, Arbolado Urbano como Elemento Estructurante del Paisaje Natural Urbano. 2020. Available online: https://www.minvu.gob.cl/wp-content/uploads/2021/04/Informe-Final-Arbolado-urbano-como-elemento-estructurante-del-paisaje-natural-urbano.pdf (accessed on 3 August 2023).
  80. Instituto Forestal (Chile). Monografía de Espino. Acacia Caven (Mol) Mol; INFOR: Santiago, Chile, 2012. [Google Scholar] [CrossRef]
  81. Alvarado Ojeda, A.; Levet Cuminao, O.; Corporación Nacional Forestal (Chile). Manual de Protocolos de Producción de Especies Utilizadas por el Programa de Arborización. CONAF. 2014. Available online: http://bibliotecadigital.ciren.cl/handle/20.500.13082/29324 (accessed on 3 August 2023).
  82. Ministerio del Medio Ambiente (MMA). Inventarios Regionales de Gases de Efecto Invernadero, Serie 1990–2016, Santiago. 2019. Available online: https://mma.gob.cl/wp-content/uploads/2019/07/Inventarios-regionales-de-gases-de-efecto-invernadero-serie-1990-2016.pdf (accessed on 3 August 2023).
  83. Instituto de Investigaciones Agropecuarias (INIA). Tendencias de las Emisiones y Absorciones de Gases de Efecto Invernadero (GEI) en Chile, Revista Tierra Adentro Edición N° 112. INIA: Preparando la Agricultura Para el Cambio Climático. 2020. Available online: https://biblioteca.inia.cl/handle/20.500.14001/67224 (accessed on 3 August 2023).
  84. Universidad de Chile, Noticias «Principalmente en el Centro y sur del País, Sector Residencial Produce más del 90% de las Emisiones de Material Particulado que contamina el aire de Chile». Available online: https://uchile.cl/u190209 (accessed on 3 August 2023).
  85. Henríquez, G.; Urrea, C. Material particulado y gases contaminantes en la comuna de El Bosque ¿cuánto influye en la cantidad de consultas por enfermedades respiratorias? Rev. Méd. Chile 2017, 145, 1371–1377. [Google Scholar] [CrossRef] [PubMed]
  86. Matus, P.; Oyarzún, M. Impacto del Material Particulado aéreo (MP 2.5) sobre las hospitalizaciones por enfermedades respiratorias en niños: Estudio caso-control alterno. Rev. Chil. Pediatr. 2019, 90, 166–174. [Google Scholar] [CrossRef]
  87. MMA—ONU Medio Ambiente. Determinación del Servicio Ecosistémico de Purificación del Aire en el Área del Proyecto GEF Montaña. Estudio Encargado a Departamento de Ecosistema y Medio Ambiente, Pontificia Universidad Católica de Chile. 2018. Available online: https://gefmontana.mma.gob.cl/wp-content/uploads/2021/02/INFORME-AIRE-GEF-Montana.pdf (accessed on 3 August 2023).
  88. Fundación Newenko. Escasez Hídrica en Chile, Santiago. 2019. Available online: https://www.newenko.org/_files/ugd/235012_d17881c0dd9d435bb995b06dc5b8af1c.pdf (accessed on 3 August 2023).
  89. Instituto Nacional de Estadísticas (INE). Medio Ambiente, Informe Anual 2019, Santiago. 2019. Available online: https://www.ine.gob.cl/estadisticas/economia/energia-y-medioambiente/variables-basicas-ambientales (accessed on 3 August 2023).
  90. Dirección de Estudios Asociación de Municipalidades de Chile (AMUCH). Propuestas para el Fortalecimiento de la Gestión de la Sequía en las Comunas de Chile, Asociación de Municipalidades de Chile. 2020. Available online: https://amuch.cl/estudios/ (accessed on 3 August 2023).
  91. Oppliger, A.; Höhl, J.; Fragkou, M. Escasez de agua: Develando sus orígenes híbridos en la cuenca del Río Bueno, Chile. Rev. Geogr. Norte Gd. 2019, 73, 9–27. [Google Scholar] [CrossRef]
  92. Oficina de Estudios y Políticas Agrarias, ODEPA, «El Cambio Climático y los Recursos Hídricos de Chile» Publicación de la Oficina de Estudios y Políticas Agrarias del Ministerio de Agricultura, Gobierno de Chile. 2016. Available online: https://www.odepa.gob.cl/publicaciones/documentos-e-informes/el-cambio-climatico-y-los-recursos-hidricos-de-chile-diciembre-de-2016 (accessed on 3 August 2023).
  93. Díaz, M.A.; Decinti, A.; Blanco, D.; Vasquez, K. Metodología para la reutilización de aguas grises en viviendas ubicadas en áreas de estrés hídrico y estrés hídrico extremo—Caracterización, calidad y opciones de tratamiento para su reuso en Chile. Inf. Constr. 2021, 73, e408. [Google Scholar] [CrossRef]
  94. Berry, M.; Taylor, C.; King, W.; Chew, Y.; Wenk, J. Modelling of Ozone Mass-Transfer through Non-Porous Membranes for Water Treatment. Water 2017, 9, 452. [Google Scholar] [CrossRef]
  95. Stover, E.; Haas, C.; Rakness, K.; Scheible, O. Design Manual: Municipal Wastewater Disinfection: Vol. Epa/625/1-86/021 (Ntis Pb98-126618); U.S. Environmental Protection Agency: Washington, DC, USA, 2002.
  96. Langlais, B.; Reckhow, D.A.; Brink, D.R. Ozone in Water Treatment: Application and Engineering; Lewis Publishers: Chelsea, MI, USA, 1991. [Google Scholar]
  97. Zúñiga Fuentes, M. Consumo de Agua por la Planta de Siete Especies Frutales Producidas en Chile. Thesis of Deggre, Universidad de Chile, Santiago, Chile, 2013. Available online: https://repositorio.uchile.cl/handle/2250/148777 (accessed on 10 August 2023).
  98. Villarreal, P.; Santagni, A. Pautas Tecnológicas, Frutales de Carozo: Manejo y Análisis Económico Financiero; Instituto Nacional de Tecnología Agropecuaria (INTA): Alto Valle, Argentina, 2005; Available online: http://hdl.handle.net/20.500.12123/14205 (accessed on 3 August 2023).
  99. Instituto Forestal (Chile). Monografía de Peumo Cryptocarya Alba (Mol.) Looser; INFOR: Santiago, Chile, 2012. [Google Scholar] [CrossRef]
  100. Catalina Correa, V.; Amanda Martínez, C. Información Tecnológica de Productos Forestales No Madereros del Bosque Nativo en Chile, Antecedentes Silvícolas y Tecnológicos de Quillaja saponaria Mol, Instituto Foretal INFOR, Santiago. 2013. Available online: http://www.pfnm.cl/paqtecnologicos/quillay/informacion_quillay.pdf (accessed on 3 August 2023).
  101. Dirección General De Aeronáutica Civil (DGAC), Dirección Meteorológica de Chile, «Reporte Climático Año 2017» Dirección Meteorológica de Chile, Subdepartamento de Climatología y Meteorología Aplicada, Santiago. Available online: https://climatologia.meteochile.gob.cl/application/publicaciones/reporteClimatologico (accessed on 3 August 2023).
  102. Corada Pérez, K. Estudio de Compuestos Orgánicos Volátiles Biogénicos de Especies Arbóreas: Crecimiento e Incidencia en la Química Troposférica, Thesis of Deggre, Universidad de Chile, Santiago de Chile, Chile. 2012. Available online: https://repositorio.uchile.cl/handle/2250/111275 (accessed on 3 August 2023).
  103. Guenther, A.B.; Catchpole, D.; Requena-Rojas, E.J.; Vázquez, E.M.; Saldaña, H.E.V.; Ramirez, G.; Patiño, J.A.S.; Gremberg, J.P.; Suarez-Salas, L.; Gómez, M.V.T.; et al. Emisiones de Compuestos Orgánicos Volátiles Biogénicos. 2011. Available online: https://www.researchgate.net/publication/340815683_EMISIONES_DE_COMPUESTOS_ORGANICOS_VOLATILES_BIOGENICOS (accessed on 3 August 2023).
  104. Díaz Poveda, V. Evaluación de los Compuestos Orgánicos Volátiles (COV) Biogénicos y Antropogénicos del Municipio de Manizales. Master’s Thesis, Universidad Nacional de Colombia, Medellín, Colombia, 2019. Available online: https://repositorio.unal.edu.co/handle/unal/76340 (accessed on 3 August 2023).
  105. Queensland Government. Weeds of Australia. Available online: https://keyserver.lucidcentral.org/weeds/data/media/Html/prunus_cerasifera.htm (accessed on 3 August 2023).
  106. Gotor Pedreros, B. Caracterización y Comparación Anatómica de Hojas de Peumo (Cryptocarya Alba (Mol.) Looser) y Quillay (Quillaja Saponaria Mol.) Sometidas a Condiciones de Riego Permanente y de Restricción Hídrica. 2008. Available online: https://repositorio.uchile.cl/handle/2250/105000 (accessed on 3 August 2023).
Figure 1. Graphic references of the area and species being studied.
Buildings 13 03052 g001
Figure 2. Graph of cost results per tree species for a 50-year projection (USD) according to maintenance criteria and assuming that each species of tree investigated replaces all existing trees (source: own).
Buildings 13 03052 g002
Figure 3. Graph of the result of CO2 capture (%) versus emissions (kg) in the years 2017, 2018 and 2019 assuming that each species of tree replaces all the existing trees (source: own).
Buildings 13 03052 g003
Figure 4. Deposition of MP 2.5 material over one year, assuming that each tree of a species replaces the total number of existing trees (source: own).
Buildings 13 03052 g004
Figure 5. Graph of BVOC emissions (µmol m−2 s−2) released by the species, expressed according to the average between their maximum and minimum amounts and assuming that each species of tree replaces all the existing trees (source: own).
Buildings 13 03052 g005
Figure 6. Graph of cost results per tree species for a 50-year projection (USD), according to maintenance criteria and assuming that each species of tree investigated replaces all the existing trees (source: own).
Buildings 13 03052 g006
Figure 7. Graph of the result of CO2 capture (%) versus emissions (kg) in the years 2017, 2018 and 2019, assuming that each tree of a species corresponds to social housing (source: own).
Buildings 13 03052 g007
Figure 8. Graph of the result of the deposition of PM2.5 (%) according to emissions (kg) for the years 2017, 2018 and 2019, assuming that each tree of a species corresponds to social housing (source: own).
Buildings 13 03052 g008
Figure 9. Graph of BVOC emissions (µmol m−2 s−2) released by the species, expressed according to the average between their maximum and minimum amounts and assuming that each tree of a species corresponds to social housing (source: own).
Buildings 13 03052 g009
Figure 10. Graph of cost results per tree species for a 50-year projection (USD), according to maintenance criteria and in accordance with the total dwellings (source: own).
Buildings 13 03052 g010
Figure 11. Graph of the result of CO2 capture (%) versus emissions (kg) in the years 2017, 2018 and 2019, assuming that each tree of a species corresponds to one house out of the total dwellings (source: own).
Buildings 13 03052 g011
Figure 12. Graph of the result of the deposition of PM2.5 (%) according to emissions (kg) for the years 2017, 2018 and 2019, assuming that each tree of a species corresponds to one house out of the total dwellings (source: own).
Buildings 13 03052 g012
Figure 13. Graph of BVOC emissions (µmol m−2 s−2) released by the species expressed according to the average between maximum and minimum quantities (source: own).
Buildings 13 03052 g013
Figure 14. Graphic representation with lines of the annual amount of water required by each tree of each species (m3/m2) versus the representation in bars of the precipitation for the years 2017, 2018 and 2019 (source: own).
Buildings 13 03052 g014
Figure 15. Graph of the economic parameter that shows the cost percentage of each tree species with respect to the most expensive one after 50 years (source: own).
Buildings 13 03052 g015
Figure 16. Graph with the CO2 capture percentage that each tree species would have in a year with respect to the one with the greatest capacity (source: own).
Buildings 13 03052 g016
Figure 17. Graph with the percentage of deposition of PM2.5 that each tree species would have in a year with respect to the one with the greatest capacity (source: own).
Buildings 13 03052 g017
Figure 18. Graph with the average percentage of BVOC emissions that each tree species would have throughout the spring with respect to the one with the highest capacity (source: own).
Buildings 13 03052 g018
Figure 19. Graph with the percentage of water that each tree species would need in a year with respect to the one that requires the most (source: own).
Buildings 13 03052 g019
Table 1. Number of existing homes in the Santiago Metropolitan Region. Source: 1 Urban Observatory, Ministry of Housing and Urbanism [68]; 2 National Institute of Statistics (INE) [61].
Social Dwellings 1Total Dwellings 2
1,219,3116,486,533
Table 2. Total number of trees that exist for each tree species and percentage of representativeness within the Santiago Metropolitan Region. Source: twelve-year change in tree diversity and spatial segregation in the Mediterranean city of Santiago, Chile [74].
Tree SpeciesIndividualsPercentage of
Representativeness (%)
Ciruelo de Flor (Prunus cerasifera Ehrh)465,6087.4
Peumo (Cryptocarya alba)51,5940.82
Espino (Acacia caven)232,1753.69
Quillay (Quillaja saponaria)218,9623.48
Total968,33915.39
Table 3. Capture capacity of CO2 on an individual level and for each species measured over a year (source: own).
Arboreal Species (Individual)Capture of CO2 (kg/Year)
Ciruelo de Flor (Prunus cerasifera Ehrh)0.00478
Peumo (Cryptocarya alba)2.00000
Espino (Acacia caven)0.78995
Quillay (Quillaja saponaria)3.60000
Table 4. Emissions of CO2 in the years 2017, 2018 and 2019 (source: own).
Item201720182019
Emissions of Carbon Dioxide, CO2 (kg)22,243,120,00022,462,520,00023,288,888,888
Table 5. Estimated deposition capacity of PM2.5 on an individual level and according to each species, measured over a year (source: own).
Arboreal Species (Individual)PM2.5 Deposition (kg/Year)
Ciruelo de Flor (Prunus cerasifera Ehrh)0.001
Peumo (Cryptocarya alba)2.054
Espino (Acacia caven)0.736
Quillay (Quillaja saponaria)2.563
Table 6. Average amount of water required by each tree of a species during a year (source: own).
Arboreal Species (Individual)Water Requirement (m³/m²/Year)
Ciruelo de Flor (Prunus cerasifera Ehrh)0.66
Peumo (Cryptocarya alba)0.10
Espino (Acacia caven)0.10
Quillay (Quillaja saponaria)0.15
Table 7. Rainfall in the Santiago Metropolitan Region in the years 2017, 2018 and 2019 (source: Chilean Meteorological Directorate [101]).
Item201720182019
Rainfall (m3/m2/year)0.280.150.08
Table 8. Emissions of Biogenic Volatile Organic Compounds, BVOCs, emitted by a tree of each species measured at two different times on each day of spring (sources: biogenic volatile organic compounds from the urban forest of the Metropolitan Region, Chile [66]; emission factors of biogenic volatile organic compounds in various stages of growth present in the urban forest of the Metropolitan Region, Chile [66]).
Arboreal Species (Individual)BVOC Emissions (µmol m−2 s−2)
Ciruelo de Flor (Prunus cerasifera Ehrh)853 ± 513
Peumo (Cryptocarya alba)1228 ± 720
Espino (Acacia caven)982 ± 228
Quillay (Quillaja saponaria)1308.7 ± 87.8
Table 9. Tree species and the capacities they possess regarding the parameters proposed in the study, assuming that each of them is the only one present. Case 1—base case (source: own).
Tree SpeciesAssumed Quantity (Individuals)CO2 Capture (kg/Year)PM2.5 Deposition (kg/Year)Water Requirement (m3/m2/Year)BVOC Emissions (µmol m−2 s−2/Spring)
MaximumMinimum
Ciruelo de Flor6,292,00030,045.78431.30.665,367,076,0003,227,796,000
Peumo12,584,00012,923,7680.107,726,576,0004,530,240,000
Espino4,970,341.14,628,395.20.106,178,744,0001,434,576,000
Quillay22,651,20016,126,3960.158,234,340,400552,437,600
Table 10. Tree species and their capacities regarding the parameters proposed in the study assuming that there is one tree planted for each existing social dwelling. Case 2—social housing (source: own).
Tree SpeciesAssumed Quantity (Individuals)CO2 Capture (kg/Year)PM2.5 Deposition (kg/Year)Water Requirement (m3/m2/Year)BVOC Emissions (µmol m−2 s−2/Spring)
MaximumMinimum
Ciruelo de Flor1,219,3115822.4791633.870.661,040,072,283625,506,543
Peumo27,556.4282,504,464.790.101,497,313,908877,903,920
Espino1464.560896,925.170.101,197,363,402278,002,908
Quillay49,644.2973,125,094.090.151,595,712,306107,055,505.8
Table 11. Tree species and their capacities regarding the parameters proposed in the study assuming that there is one tree planted for all the dwellings. Case 3—total dwellings (source: own).
Tree SpeciesTotal DwellingsCO2 Capture (kg/Year)PM2.5 Deposition (kg/Year)Water Requirement (m3/m2/Year)BVOC Emissions (µmol m−2 s−2/Spring)
MaximumMinimum
Ciruelo de Flor6,486,53330,974.638691.90.6645,533,012,6493,327,591,429
Peumo146,595.6513,323,338.80.1047,965,462,5244,670,303,760
Espino7791.224,771,493.70.1006,369,775,4061,478,929,524
Quillay264,099.4616,624,984.10.1508,488,925,737569,517,597
Disclaimer/Publisher’s Note: The statements, opinions and data contained in all publications are solely those of the individual author(s) and contributor(s) and not of MDPI and/or the editor(s). MDPI and/or the editor(s) disclaim responsibility for any injury to people or property resulting from any ideas, methods, instructions or products referred to in the content.

