
Evaluation of Mechanical Properties, Corrosion Resistance, and Pore Structure of Stepwise PCM Aggregate Concrete


 and
and
Abstract
:1. Introduction
2. Materials and Experimental Details
2.1. Materials
2.2. Preparation of PCM Aggregate and Stepwise PCM Aggregate Concrete
2.2.1. PCM Aggregate Prepared by Vacuum Impregnation
2.2.2. PCM Aggregate Coated by Double-Layer Material
2.2.3. Stepwise PCM Aggregate Concrete
- (1)
- Cement and sand were mixed together and stirred for 60 s.
- (2)
- Then, water and superplasticizer were added and stirred for 120 s.
- (3)
- Subsequently, the stepwise PCM aggregates were added and stirred for 120 s.
- (4)
- Finally, the mixture was poured into molds and vibrated to compact.
2.3. Experimental Techniques
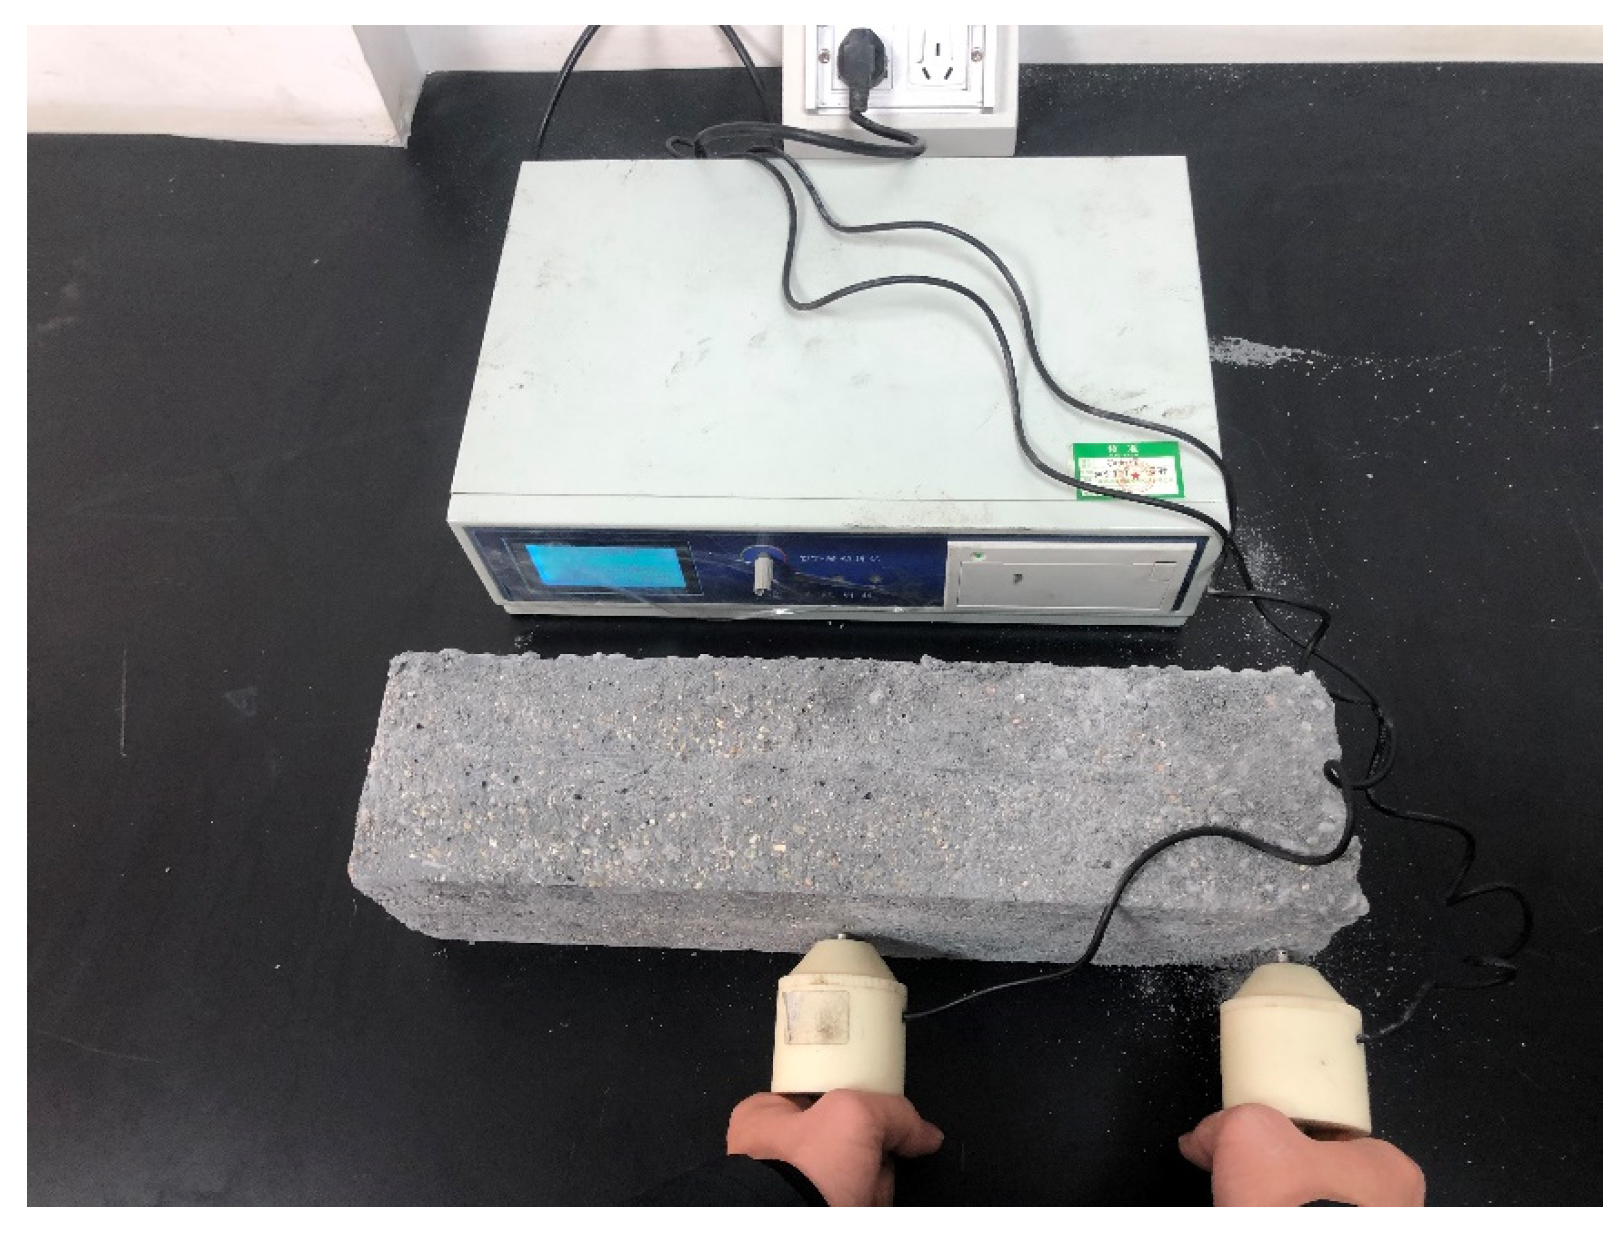
2.3.1. Mechanical Properties
2.3.2. Freeze–Thaw Resistance
2.3.3. NMR Test
3. Results and Discussion
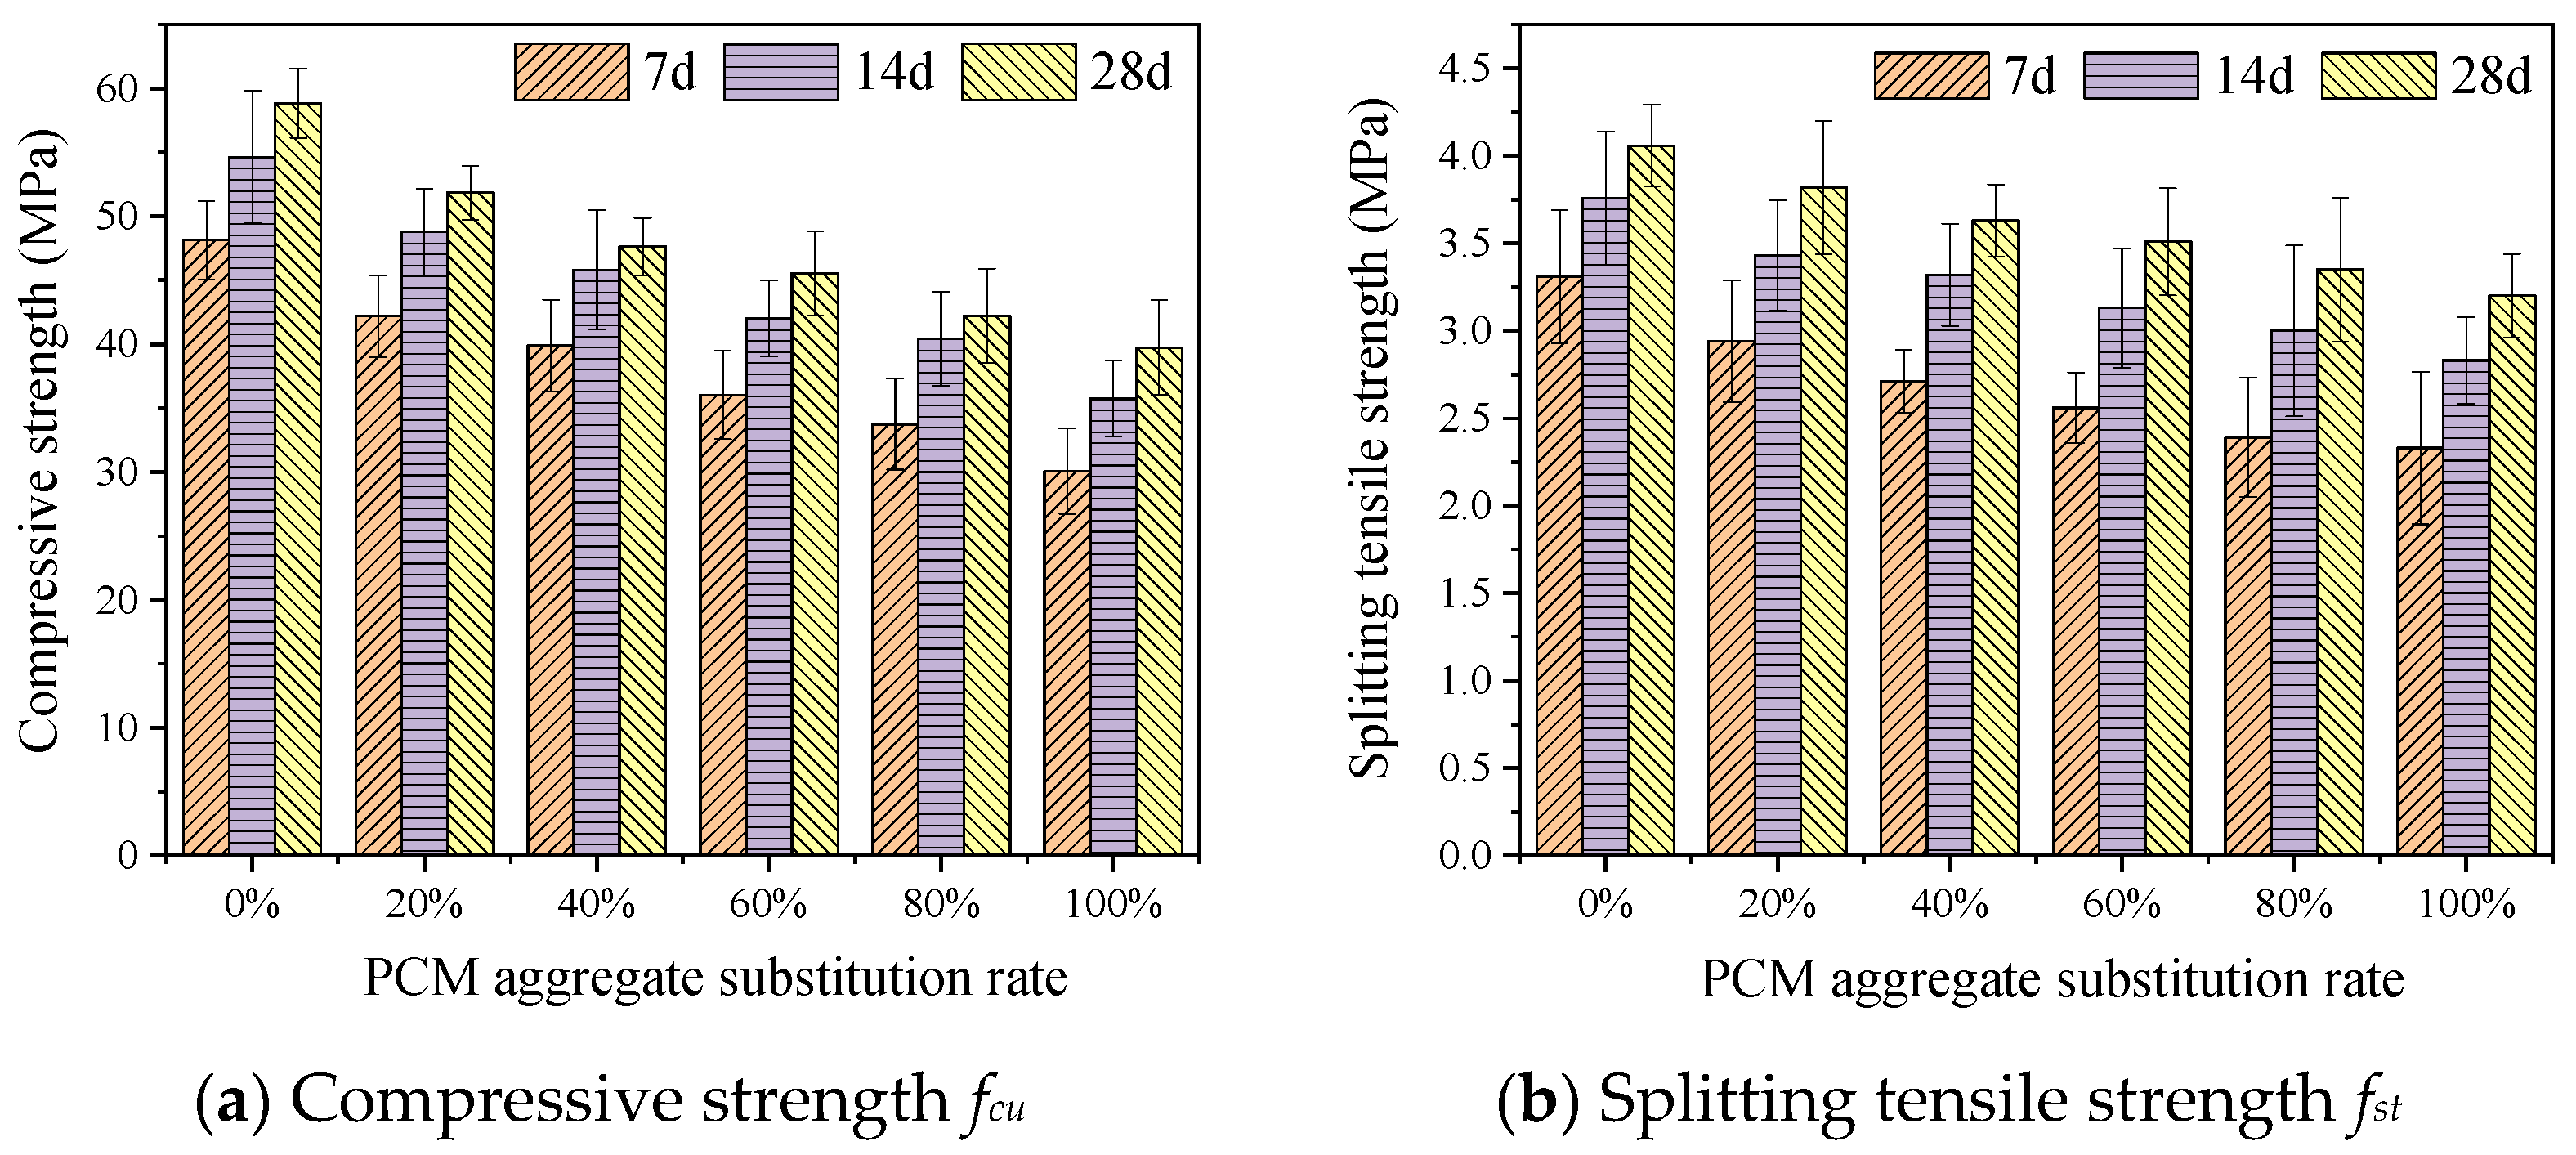
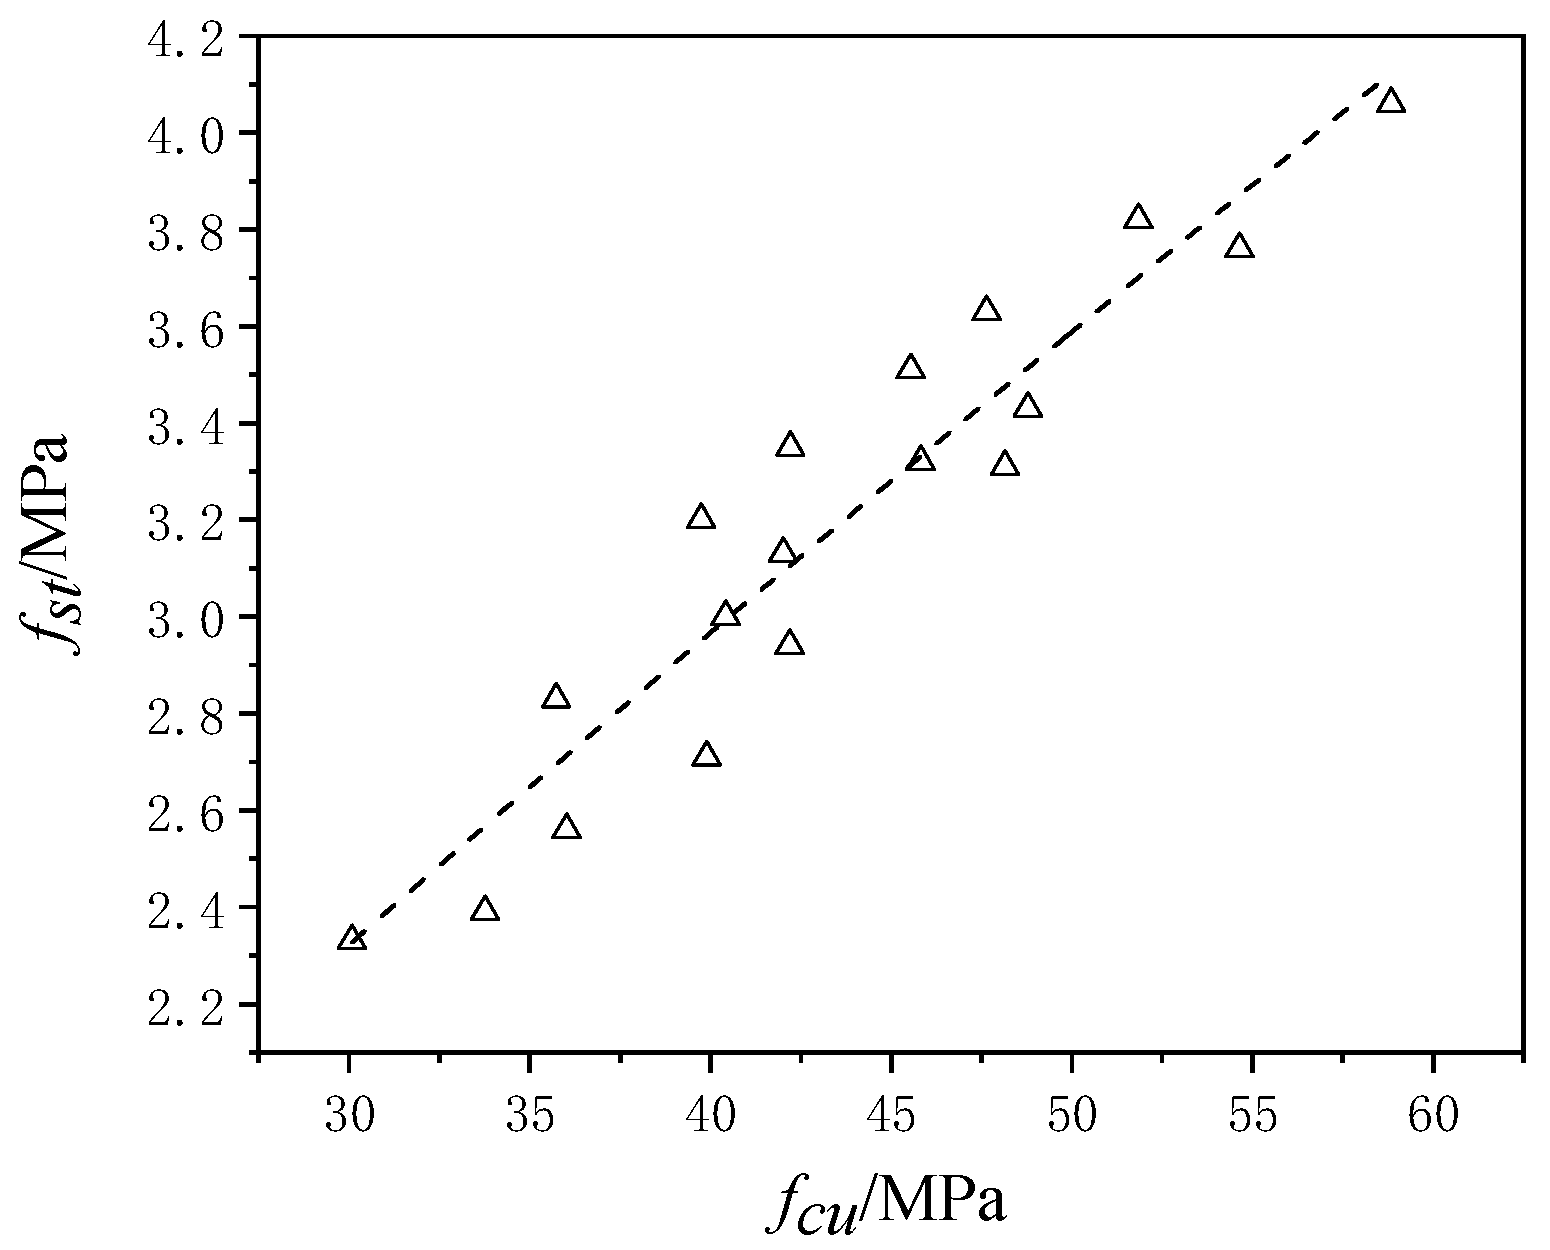
3.1. Mechanical Properties
3.2. Freeze–Thaw Resistance
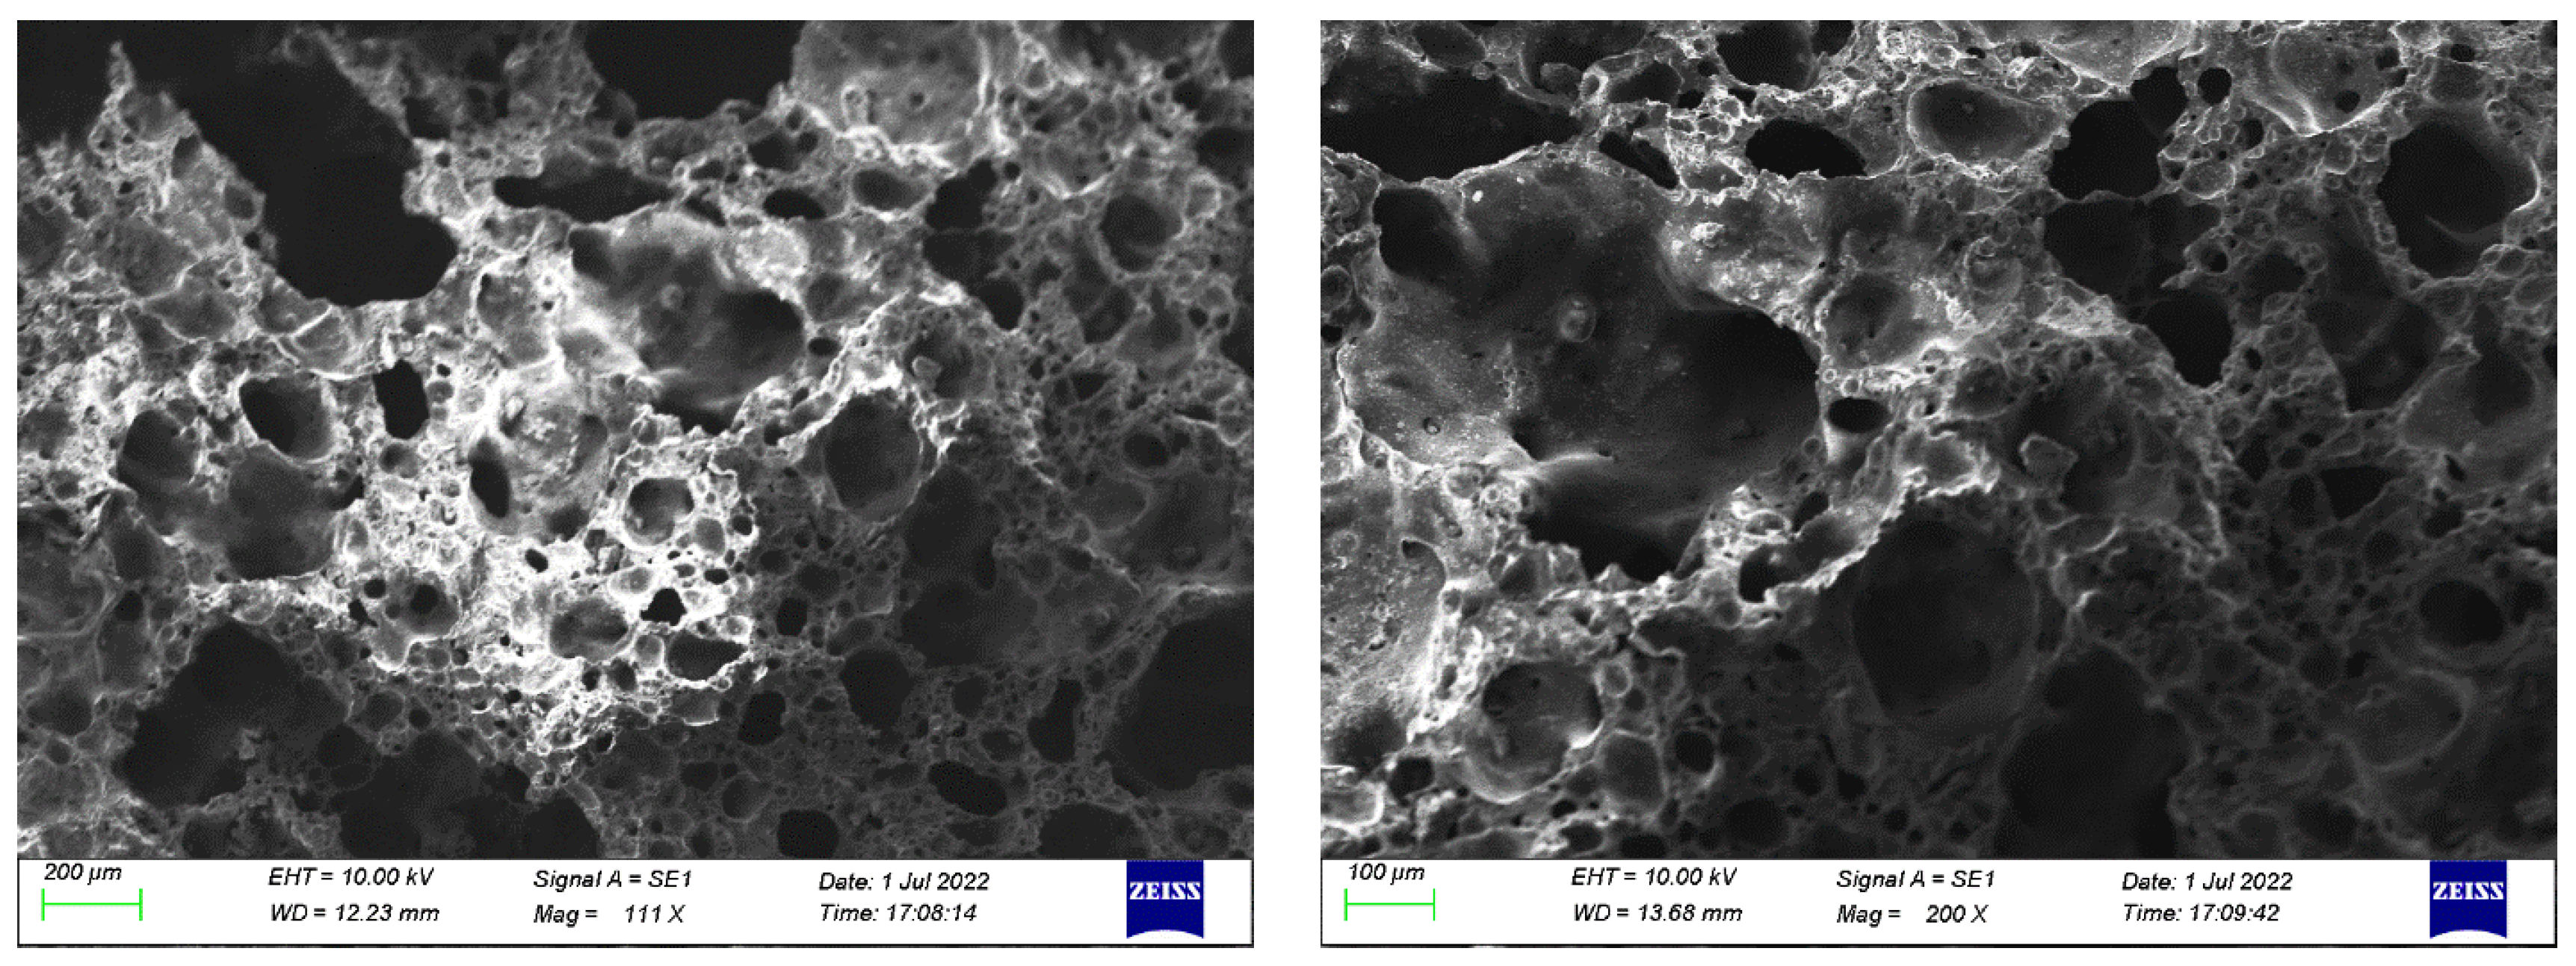
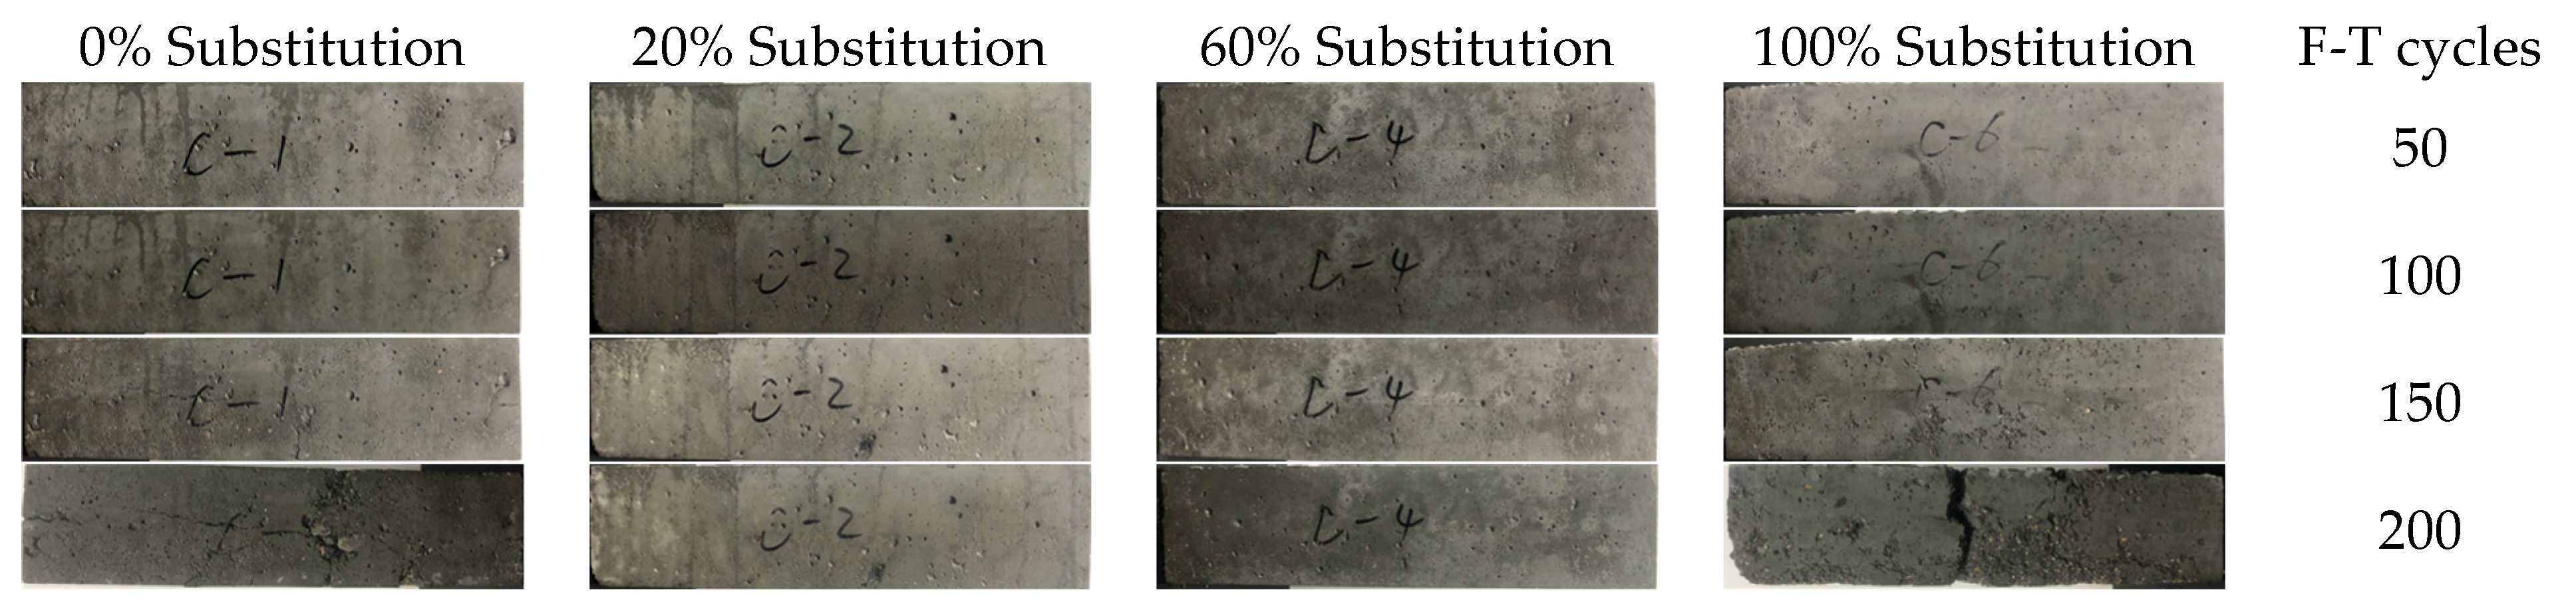
3.2.1. Morphology
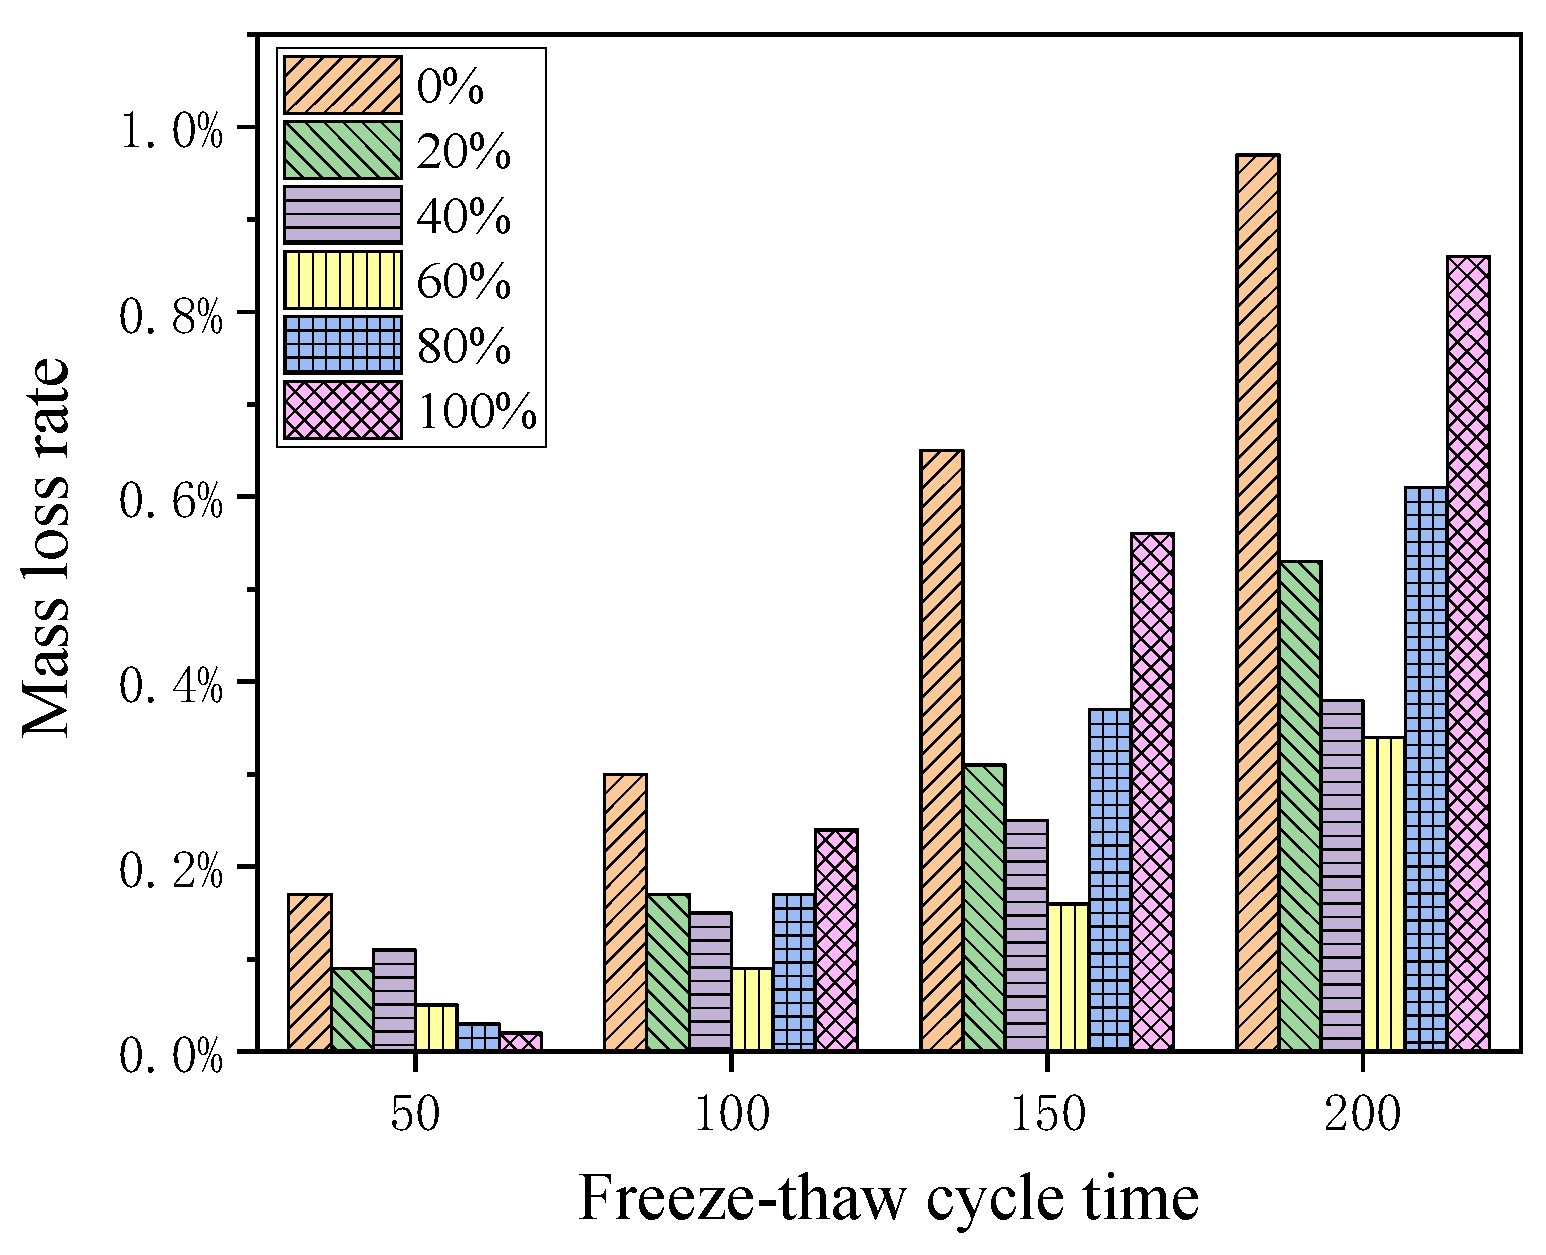
3.2.2. Mass Loss
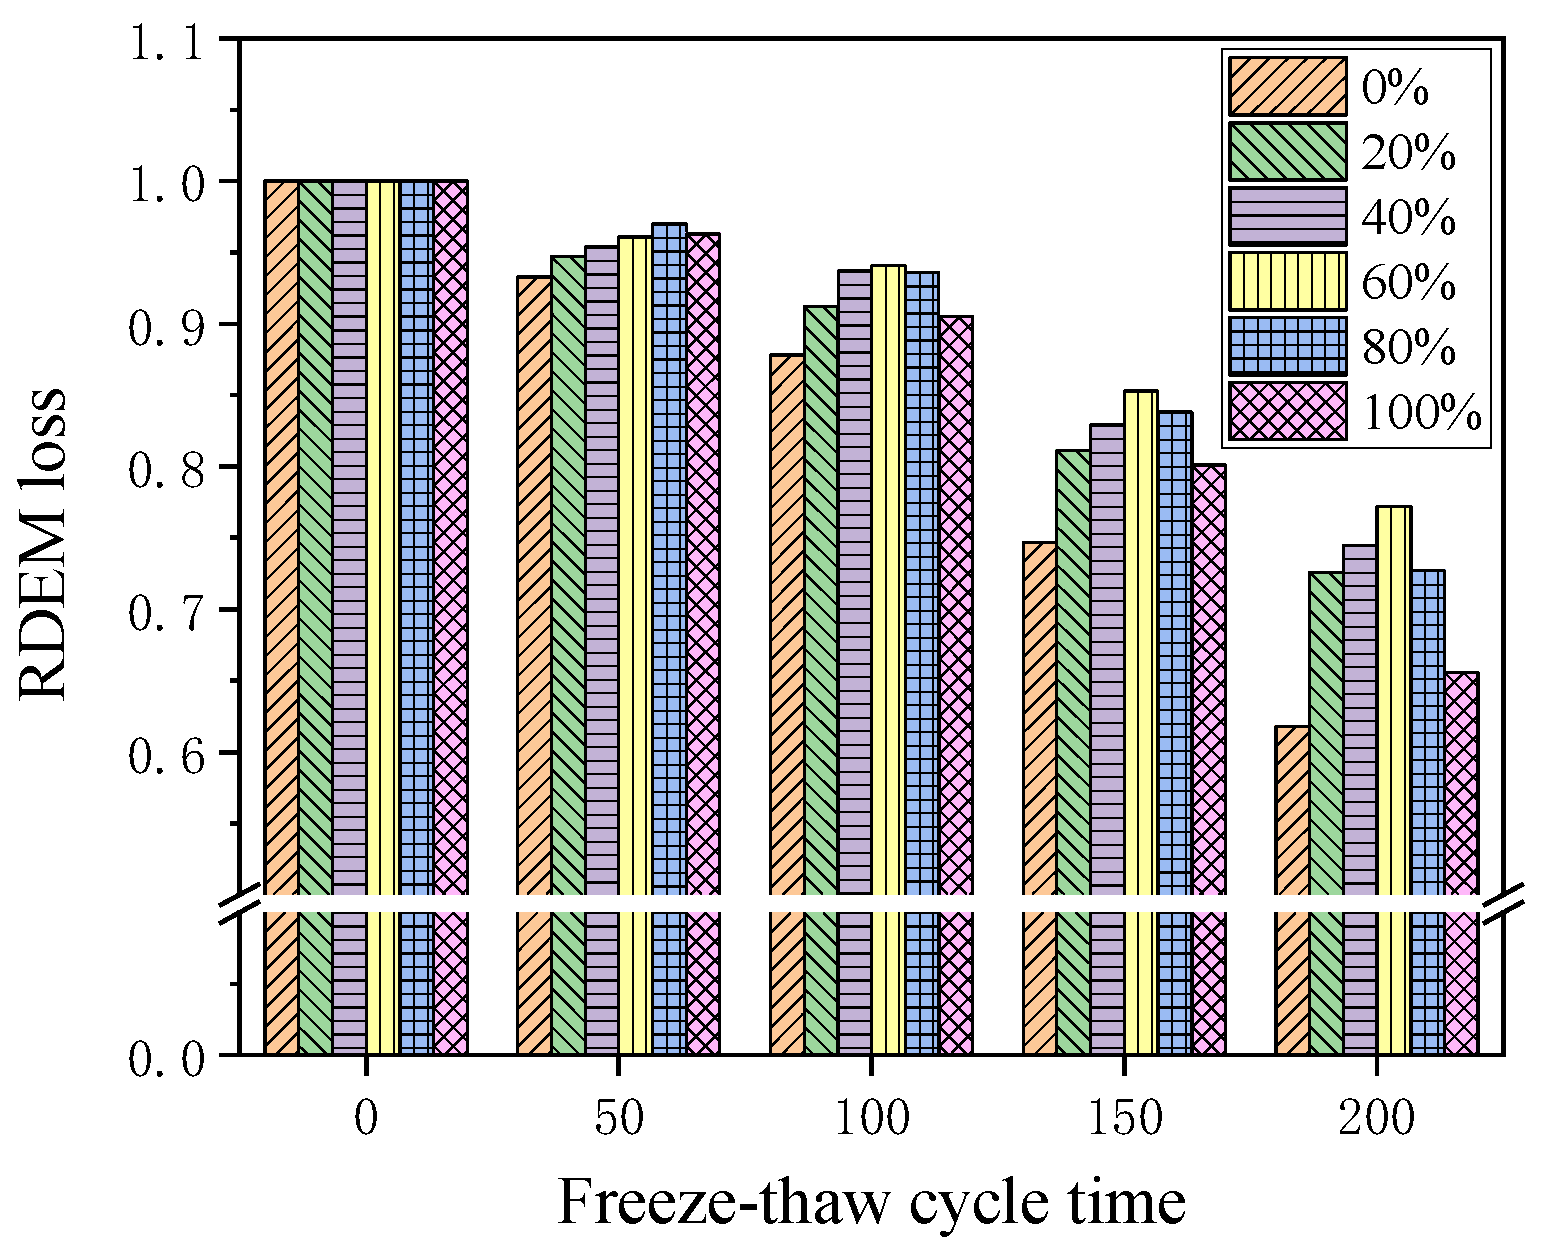
3.2.3. RDEM Loss
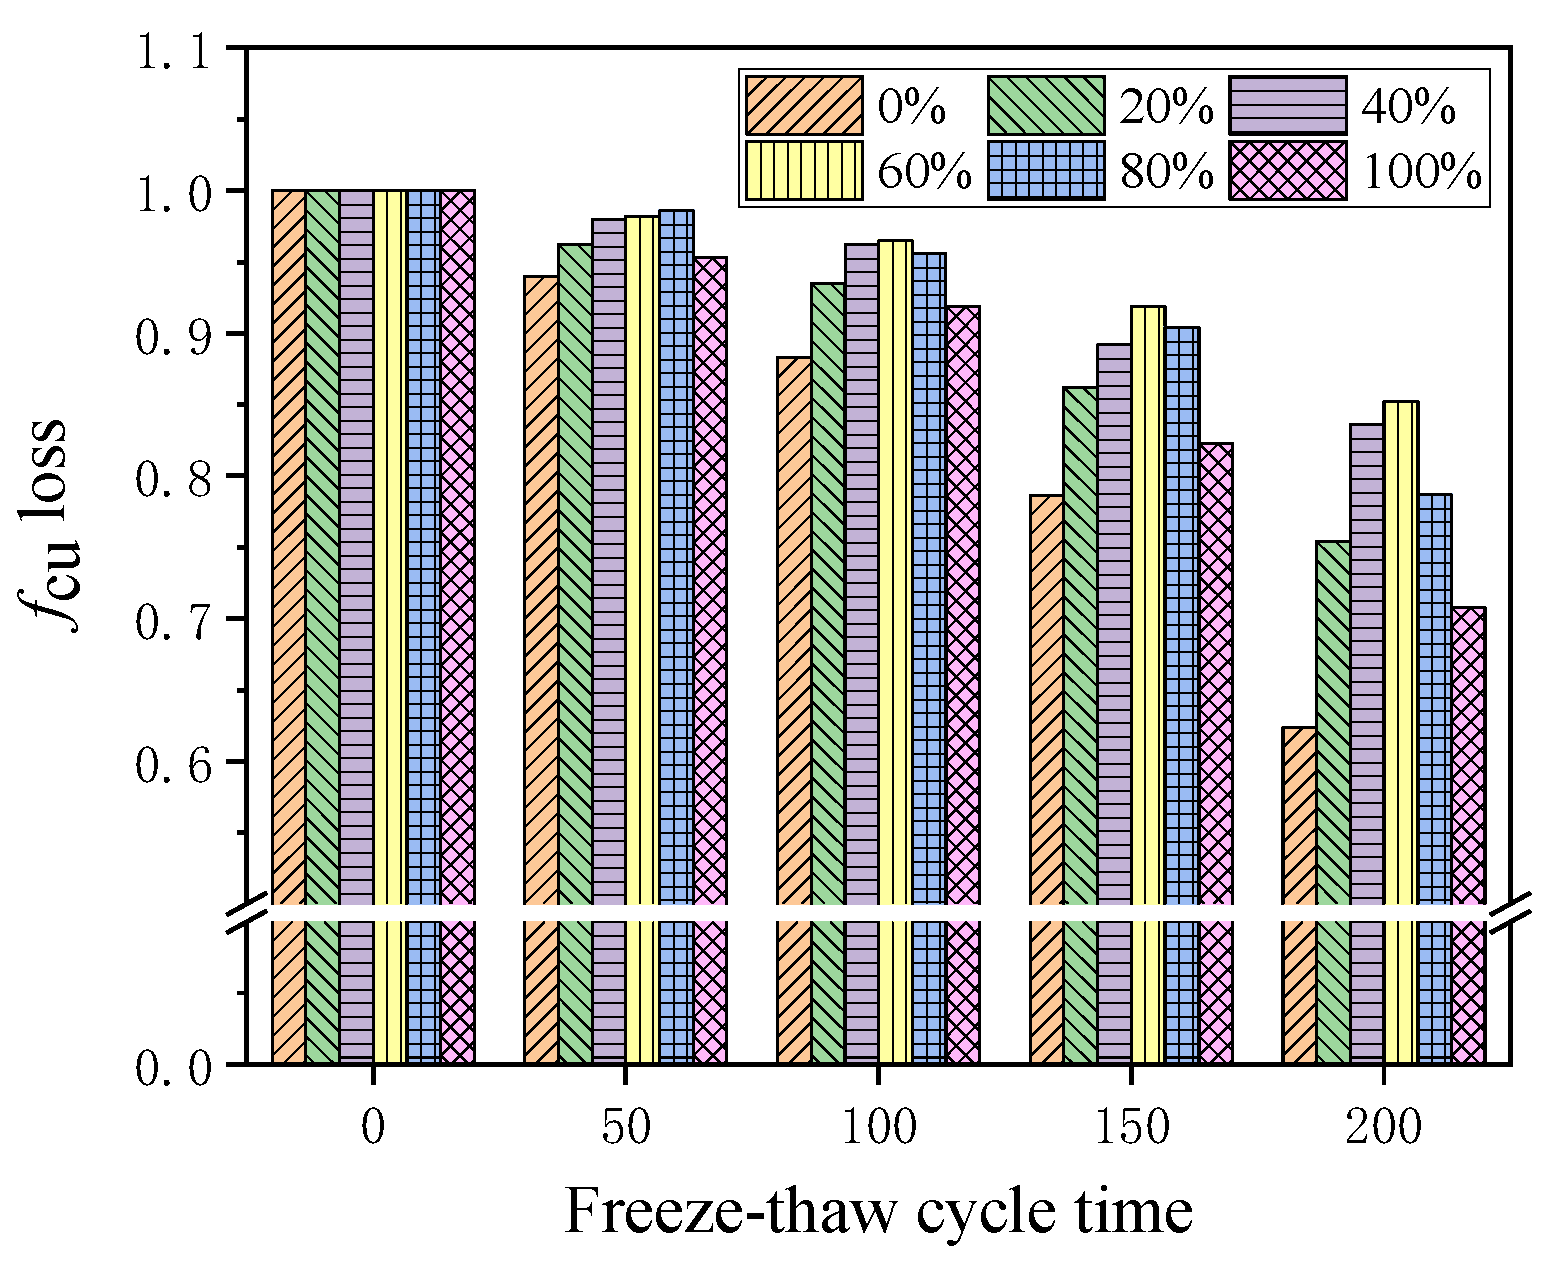
3.2.4. Strength Loss
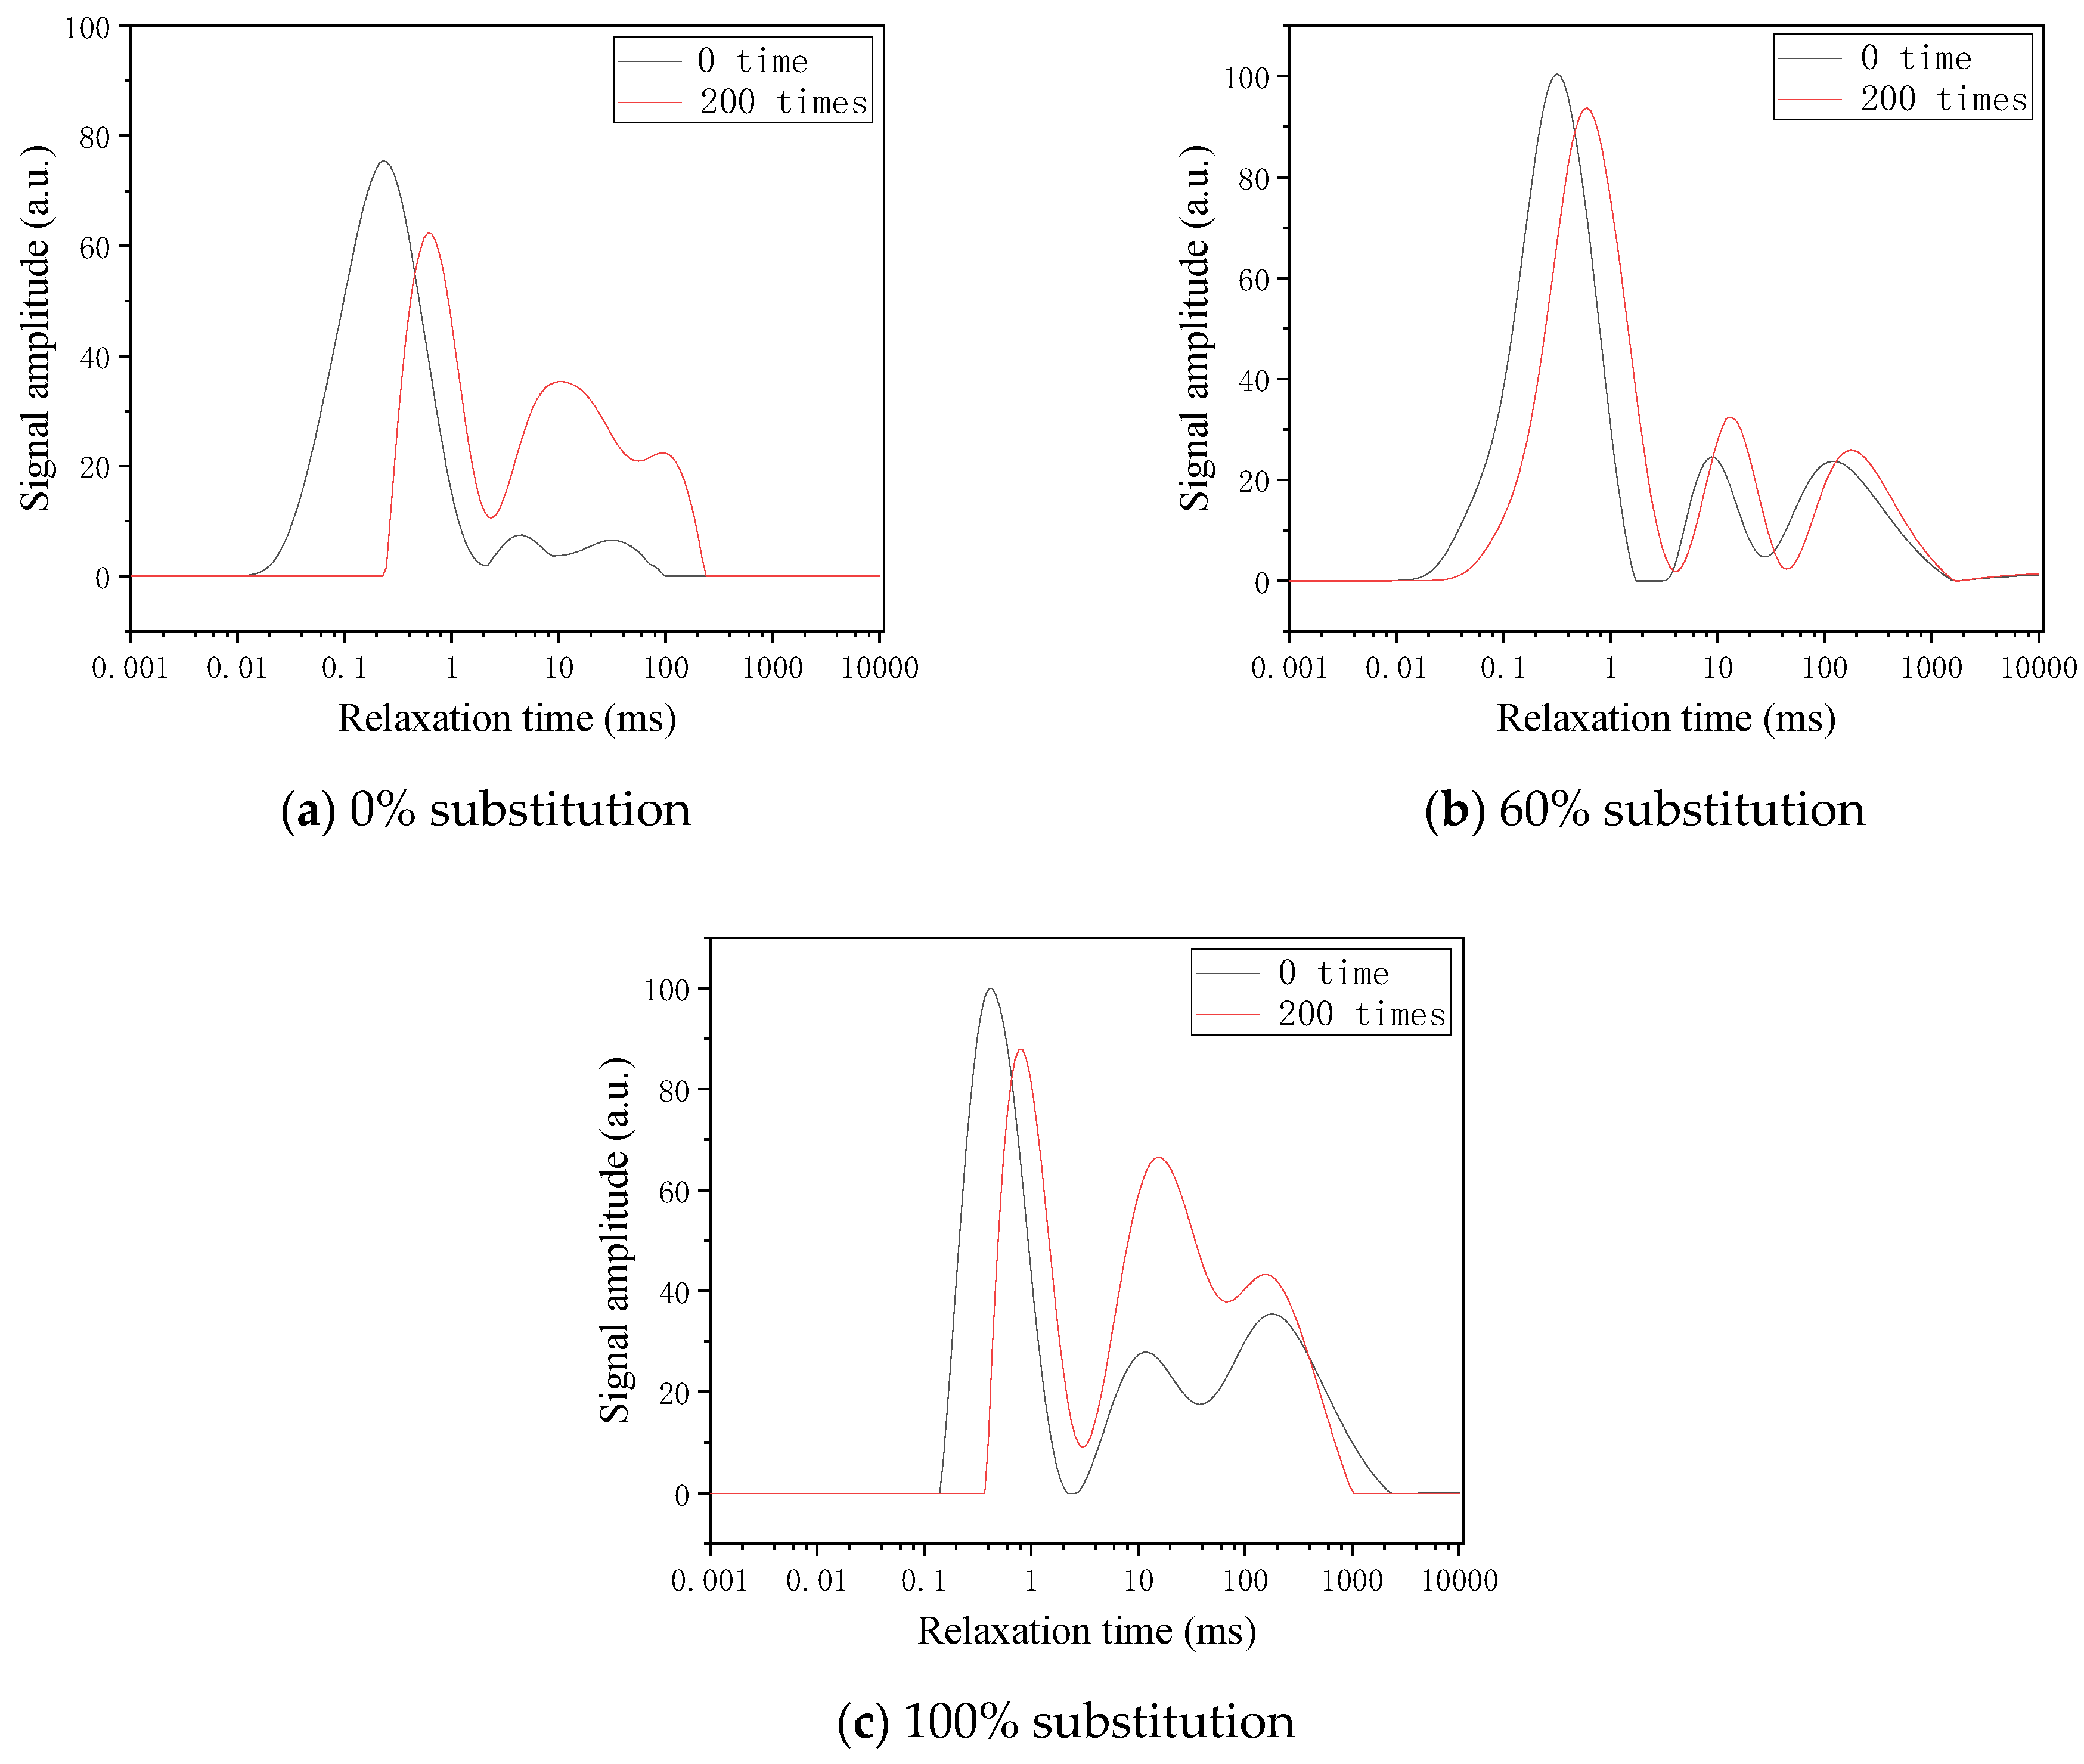
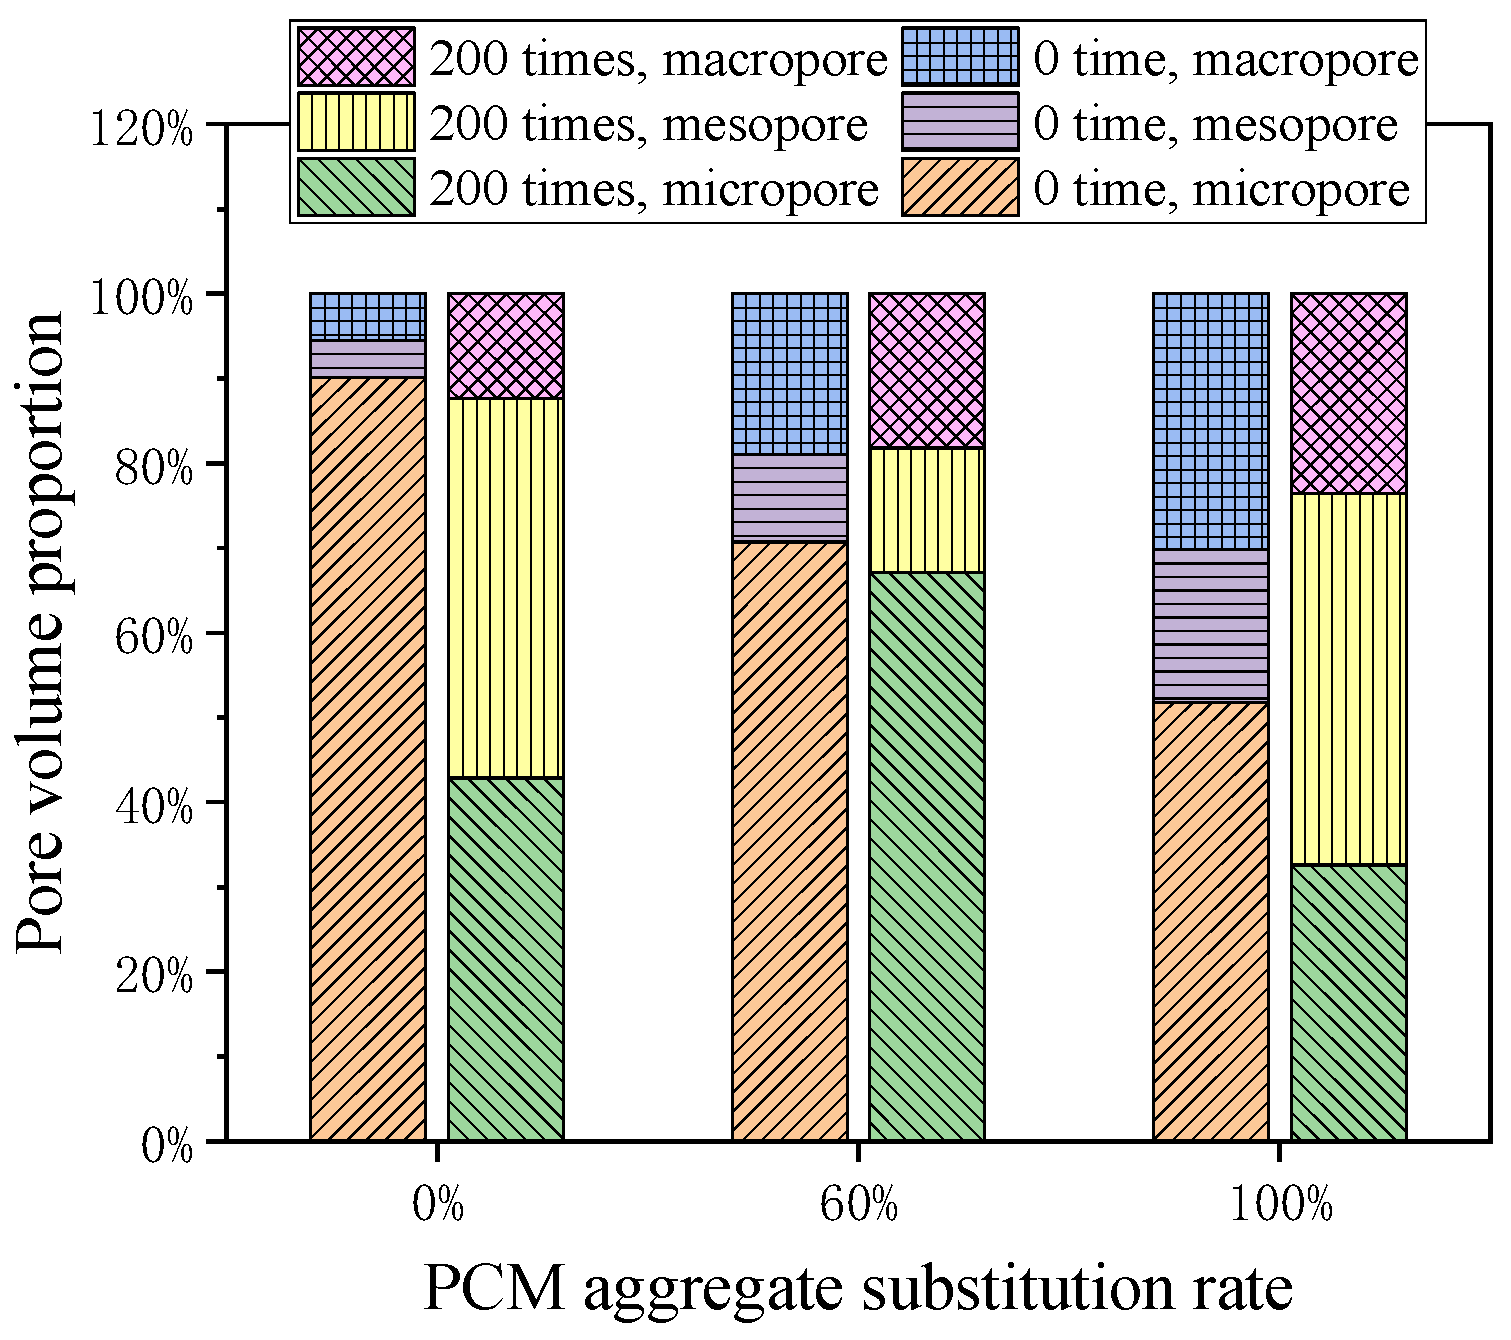
3.3. Pore Evaluation by NMR
4. Conclusions
Author Contributions
Funding
Data Availability Statement
Conflicts of Interest
References
- Tan, Z.; Gou, H.; Li, W.; Bao, Y. Effect of frost heave deformation of bridge foundation on operation safety of high-speed railway. Structures 2023, 47, 2099–2112. [Google Scholar] [CrossRef]
- Yu, F.; Qi, J.; Lai, Y.; Sivasithamparam, N.; Yao, X.; Zhang, M.; Liu, Y.; Wu, G. Typical embankment settlement/heave patterns of the Qinghai–Tibet highway in permafrost regions: Formation and evolution. Eng. Geol. 2016, 214, 147–156. [Google Scholar] [CrossRef]
- Niu, F.J.; Li, A.Y.; Luo, J.; Lin, Z.J.; Yin, G.A.; Liu, M.H.; Zheng, H.; Liu, H. Soil moisture, ground temperatures, and deformation of a high-speed railway embankment in Northeast China. Cold Reg. Sci. Technol. 2017, 133, 7–14. [Google Scholar] [CrossRef]
- Ying, H.; Wang, S.; Lu, Z.; Liu, B.; Cui, L.; Quan, X.; Liu, K.; Zhao, N. Development and thermal response of concrete incorporated with multi-stage phase change materials-aggregates for application in seasonally frozen regions. J. Build. Eng. 2023, 71, 106562. [Google Scholar] [CrossRef]
- Fu, Y.; Cai, L.; Yonggen, W. Freeze–thaw cycle test and damage mechanics models of alkali-activated slag concrete. Constr. Build. Mater. 2011, 25, 3144–3148. [Google Scholar] [CrossRef]
- Ma, H.; Yu, H.; Li, C.; Tan, Y.; Cao, W.; Da, B. Freeze–thaw damage to high-performance concrete with synthetic fibre and fly ash due to ethylene glycol deicer. Constr. Build. Mater. 2018, 187, 197–204. [Google Scholar] [CrossRef]
- Scherer, G.W. Crystallization in pores. Cem. Concr. Res. 1999, 29, 1347–1358. [Google Scholar] [CrossRef]
- Luo, S.; Bai, T.W.; Guo, M.Q.; Wei, Y.; Ma, W.B. Impact of Freeze-Thaw Cycles on the Long-Term Performance of Concrete Pavement and Related Improvement Measures: A Review. Materials 2022, 15, 4568. [Google Scholar] [CrossRef]
- Feng, D.; Yi, J.; Wang, D.; Chen, L. Impact of salt and freeze–thaw cycles on performance of asphalt mixtures in coastal frozen region of China. Cold Reg. Sci. Technol. 2010, 62, 34–41. [Google Scholar] [CrossRef]
- Wang, A.; Zhang, C.; Sun, W. Fly ash effects: II. The active effect of fly ash. Cem. Concr. Res. 2004, 34, 2057–2060. [Google Scholar] [CrossRef]
- Wang, D.; Zhou, X.; Meng, Y.; Chen, Z. Durability of concrete containing fly ash and silica fume against combined freezing-thawing and sulfate attack. Constr. Build. Mater. 2017, 147, 398–406. [Google Scholar] [CrossRef]
- Zheng, D.-D.; Ji, T.; Wang, C.-Q.; Sun, C.-J.; Lin, X.-J.; Hossain, K.M.A. Effect of the combination of fly ash and silica fume on water resistance of Magnesium–Potassium Phosphate Cement. Constr. Build. Mater. 2016, 106, 415–421. [Google Scholar] [CrossRef]
- Zhang, D.; Mao, M.; Zhang, S.; Yang, Q. Influence of stress damage and high temperature on the freeze–thaw resistance of concrete with fly ash as fine aggregate. Constr. Build. Mater. 2019, 229, 116845. [Google Scholar] [CrossRef]
- Sasanipour, H.; Aslani, F.; Taherinezhad, J. Effect of silica fume on durability of self-compacting concrete made with waste recycled concrete aggregates. Constr. Build. Mater. 2019, 227, 116598. [Google Scholar] [CrossRef]
- Kim, H.-S.; Lee, S.-H.; Moon, H.-Y. Strength properties and durability aspects of high strength concrete using Korean metakaolin. Constr. Build. Mater. 2007, 21, 1229–1237. [Google Scholar] [CrossRef]
- Chatveera, B.; Lertwattanaruk, P. Evaluation of sulfate resistance of cement mortars containing black rice husk ash. J. Environ. Manag. 2009, 90, 1435–1441. [Google Scholar] [CrossRef] [PubMed]
- Duan, P.; Shui, Z.; Chen, W.; Shen, C. Enhancing microstructure and durability of concrete from ground granulated blast furnace slag and metakaolin as cement replacement materials. J. Mater. Res. Technol. 2013, 2, 52–59. [Google Scholar] [CrossRef]
- Behfarnia, K.; Salemi, N. The effects of nano-silica and nano-alumina on frost resistance of normal concrete. Constr. Build. Mater. 2013, 48, 580–584. [Google Scholar] [CrossRef]
- Cui, Y.; Chen, Y.; Cen, G.; Peng, G. Comparative Study on the Effect of Organic and Inorganic Fiber on the Anti-wheel Impact Performance of Airport Pavement Concrete under Freeze-thaw Environment. Constr. Build. Mater. 2019, 211, 284–297. [Google Scholar] [CrossRef]
- Mayercsik, N.P.; Vandamme, M.; Kurtis, K.E. Assessing the efficiency of entrained air voids for freeze-thaw durability through modeling. Cem. Concr. Res. 2016, 88, 43–59. [Google Scholar] [CrossRef]
- Mousavi, S.S.; Guizani, L.; Bhojaraju, C.; Ouellet-Plamondon, C. The effect of air-entraining admixture and superabsorbent polymer on bond behaviour of steel rebar in pre-cracked and self-healed concrete. Constr. Build. Mater. 2021, 281, 122568. [Google Scholar] [CrossRef]
- Wang, R.; Hu, Z.; Li, Y.; Wang, K.; Zhang, H. Review on the deterioration and approaches to enhance the durability of concrete in the freeze–thaw environment. Constr. Build. Mater. 2022, 321, 126371. [Google Scholar] [CrossRef]
- Sahin, Y.; Akkaya, Y.; Tasdemir, M.A. Effects of freezing conditions on the frost resistance and microstructure of concrete. Constr. Build. Mater. 2021, 270, 121458. [Google Scholar] [CrossRef]
- Jiang, Z.; He, B.; Zhu, X.; Ren, Q.; Zhang, Y. State-of-the-art review on properties evolution and deterioration mechanism of concrete at cryogenic temperature. Constr. Build. Mater. 2020, 257, 119456. [Google Scholar] [CrossRef]
- Ge, X.; Ke, M.; Liu, W.; Wang, H.; Lu, C.; Mei, G.; Yang, H. Effect of the Internal Humidity of Concrete on Frost Resistance and Air Void Structure under Different Low Temperature Conditions. Materials 2022, 15, 5225. [Google Scholar] [CrossRef]
- Yu, B.; Li, S.; Zhu, H.; Jiang, Q.; Wang, D.; Chen, Y. A composite phase change material for improving the freeze–thaw resistance performance of cement mortars. Constr. Build. Mater. 2023, 387, 131657. [Google Scholar] [CrossRef]
- Tian, Y.; Lai, Y.; Pei, W.; Qin, Z.; Li, H. Study on the physical mechanical properties and freeze-thaw resistance of artificial phase change aggregates. Constr. Build. Mater. 2022, 329, 127225. [Google Scholar] [CrossRef]
- Liu, Z.; Zang, C.; Zhang, Y.; Jiang, J.; Yuan, Z.; Liu, G.; Li, H. Mechanical properties and antifreeze performance of cement-based composites with liquid paraffin/diatomite capsule low-temperature phase change. Constr. Build. Mater. 2022, 341, 127773. [Google Scholar] [CrossRef]
- Li, X.; Chen, H.; Liu, L.; Lu, Z.; Sanjayan, J.G.; Duan, W.H. Development of granular expanded perlite/paraffin phase change material composites and prevention of leakage. Sol. Energy 2016, 137, 179–188. [Google Scholar] [CrossRef]
- Sakulich, A.R.; Bentz, D.P. Incorporation of phase change materials in cementitious systems via fine lightweight aggregate. Constr. Build. Mater. 2012, 35, 483–490. [Google Scholar] [CrossRef]
- Li, W.; Ling, C.; Jiang, Z.; Yu, Q.-Q. Evaluation of the potential use of form-stable phase change materials to improve the freeze-thaw resistance of concrete. Constr. Build. Mater. 2019, 203, 621–632. [Google Scholar] [CrossRef]
- GB/T 50082-2009; Standard for Test Methods of Long-Term Performance and Durability of Ordinary Concrete. Chinese Standard: Beijing, China, 2009.
- Zhang, J.; Bian, F.; Zhang, Y.; Fang, Z.; Fu, C.; Guo, J. Effect of pore structures on gas permeability and chloride diffusivity of concrete. Constr. Build. Mater. 2018, 163, 402–413. [Google Scholar] [CrossRef]
- Liu, J.; Li, Z.; Zhang, W.; Jin, H.; Xing, F.; Tang, L. The impact of cold-bonded artificial lightweight aggregates produced by municipal solid waste incineration bottom ash (MSWIBA) replace natural aggregates on the mechanical, microscopic and environmental properties, durability of sustainable concrete. J. Clean. Prod. 2022, 337, 130479. [Google Scholar] [CrossRef]
- Zhuang, Y.-Z.; Chen, C.-Y.; Ji, T. Effect of shale ceramsite type on the tensile creep of lightweight aggregate concrete. Constr. Build. Mater. 2013, 46, 13–18. [Google Scholar] [CrossRef]


| Aggregate | Apparent Density (kg/m3) | Loose Bulk Density (kg/m3) | Crushing Index (%) | 24 h Water Absorption (%) | Mud Content (%) | Water Content (%) |
|---|---|---|---|---|---|---|
| Shale ceramsite | 1504 | 873 | 28.67 | 10.30 | 0.87 | 0.01 |
| PCM | Density (g/mL) | Solidifying Temperature (°C) | Solidifying Heat Latent (J/g) | Melting Temperature (°C) | Melting Heat Latent (J/g) |
|---|---|---|---|---|---|
| Dodecane | 0.7487 | −12.86 | 200.5 | −10.96 | 199.8 |
| Tridecane | 0.7560 | −7.84 | 142.9 | −7.26 | 139.0 |
| Tetradecane | 0.7628 | 4.26 | 206.3 | 4.85 | 212.4 |
| Shale Ceramsite | PCM | Epoxy Layer | Cement Layer |
|---|---|---|---|
| 59.62% | 10.31% | 9.10% | 20.97% |
| Dodecane Aggregate | Tridecane Aggregate | Tetradecane Aggregate |
|---|---|---|
| 20.67 | 14.73 | 21.67 |
| Mix | Cement | Sand | Gravel | Stepwise PCM Aggregate | Water | SP |
|---|---|---|---|---|---|---|
| C-1 | 550 | 652 | 1080 | 0 | 176 | 5.5 |
| C-2 | 550 | 652 | 864 | 112 | 176 | 5.5 |
| C-3 | 550 | 652 | 648 | 224 | 176 | 5.5 |
| C-4 | 550 | 652 | 432 | 336 | 176 | 5.5 |
| C-5 | 550 | 652 | 216 | 448 | 176 | 5.5 |
| C-6 | 550 | 652 | 0 | 560 | 176 | 5.5 |
| PCM Aggregate Replacement Rate | ACI | CEB | AS |
|---|---|---|---|
| 0% | 10.73% | 12.93% | −24.93% |
| 20% | 15.74% | 15.53% | −21.53% |
| 40% | 19.22% | 17.31% | −19.17% |
| 60% | 21.11% | 18.26% | −17.89% |
| 80% | 24.38% | 19.89% | −15.68% |
| 100% | 27.03% | 21.20% | −13.88% |
Disclaimer/Publisher’s Note: The statements, opinions and data contained in all publications are solely those of the individual author(s) and contributor(s) and not of MDPI and/or the editor(s). MDPI and/or the editor(s) disclaim responsibility for any injury to people or property resulting from any ideas, methods, instructions or products referred to in the content. |
© 2023 by the authors. Licensee MDPI, Basel, Switzerland. This article is an open access article distributed under the terms and conditions of the Creative Commons Attribution (CC BY) license (https://creativecommons.org/licenses/by/4.0/).
Share and Cite
Liu, B.; Wang, S.; Jia, W.; Xie, J.; Zhong, W.; Ying, H.; Lu, Z. Evaluation of Mechanical Properties, Corrosion Resistance, and Pore Structure of Stepwise PCM Aggregate Concrete. Buildings 2023, 13, 3076. https://doi.org/10.3390/buildings13123076
Liu B, Wang S, Jia W, Xie J, Zhong W, Ying H, Lu Z. Evaluation of Mechanical Properties, Corrosion Resistance, and Pore Structure of Stepwise PCM Aggregate Concrete. Buildings. 2023; 13(12):3076. https://doi.org/10.3390/buildings13123076
Chicago/Turabian StyleLiu, Bo, Sheliang Wang, Wurong Jia, Jiangsheng Xie, Weiling Zhong, Honghao Ying, and Zhe Lu. 2023. "Evaluation of Mechanical Properties, Corrosion Resistance, and Pore Structure of Stepwise PCM Aggregate Concrete" Buildings 13, no. 12: 3076. https://doi.org/10.3390/buildings13123076
APA StyleLiu, B., Wang, S., Jia, W., Xie, J., Zhong, W., Ying, H., & Lu, Z. (2023). Evaluation of Mechanical Properties, Corrosion Resistance, and Pore Structure of Stepwise PCM Aggregate Concrete. Buildings, 13(12), 3076. https://doi.org/10.3390/buildings13123076