Abstract
The wind flow patterns and pressure distribution around a plus-shaped building are significantly influenced by re-entrant corner dimensions and building height. The present study aims to find the wind effects and study the pressure distribution with different flow patterns. The building has a plan area of approximately 300 square meters and a height of 50 m, maintaining equal lengths for the re-entrant corners. The research study is performed using the ANSYS CFX academic version. The study employs diverse visualizations, featuring the pressure coefficient (), vertical and specific surface streamlines, and pressure contours. Wind incidence angles for the study are varied from 0° to 90° at an interval of 15°. Building dimensions are scaled down as per the ASCE wind tunnel test manual, and the length scale is kept at 1:100 for CFD investigation. This approach yields crucial insights into the circulation of wind patterns and the distribution of pressure across a wide range of wind incidence angles. The influence of streamlines in the bottom portion of the building model is relatively minimal. In contrast to the upper portion, the bottom exhibits robust vortices, particularly for the wind angles varying from 0° to 30°. Positive pressure is observed on the windward face, and the leeward face and side face exhibit negative pressure. This study furnishes valuable insights into flow patterns and pressure distribution across a wide range of wind incidence angles from 0° to 90° at an interval of 15°. These findings contribute significantly to a thorough comprehension of the wind flow patterns and pressure distribution around the plus-shaped building model.
1. Introduction
The increasing utilization of diverse construction materials and innovative designs in high-rise building construction underscores the necessity for precise insights into wind dynamics and pressure distribution across building facades. The knowledge of wind–structure interaction is essential for achieving a harmonious balance between building design and structural aspects. Extensive research has been conducted on conventionally structured building models, which serves as the foundation for developing and updating the international wind design codes in different countries. Codal values remain a noticeable scarcity in research focused on buildings with irregular plan shapes. This research gap calls for a deeper understanding of the unique challenges posed by irregular building designs and underscores the importance of conducting comprehensive investigations in this domain. A general estimation of the magnitude of wind pressure on the faces of any bluff body is taken as the mean pressure coefficient (). This is a dimensionless measure that largely depends upon the shape and size of the bluff body and surrounding topographical characteristics. The external mean pressure coefficient () is almost independent of the flow velocity. Oblique wind also creates different wind flow patterns around the body and results in varying velocity pressure on the surfaces.
Investigating wind effects through a combined approach of numerical simulations and real-world experiments using wind tunnel testing is a critical endeavor in understanding and mitigating the impact of wind on various high-rise structures across the world. This interdisciplinary approach enables researchers and engineers to gain comprehensive insights into wind behavior, contributing to more effective design and safety measures. The wind effects on a high-rise building model may be explored experimentally (wind tunnel method) and numerically. Various researchers across the globe have conducted studies on high-rise as well as low-rise building models, such as an examination that was conducted on the wind pressure acting on a set of four low-rise rectangular building models [1]. The impact of wind pressure in the case of 0° wind incidence was primarily associated with the curvature of the roof. However, under a wind incidence angle of 90°, the wind pressure was found to be influenced not only by the curvature of the roof but also by the building’s height. A comparative analysis is presented for wind-induced effects, employing both experimental methods in a wind tunnel and Computational Fluid Dynamics (CFD) techniques, across various shapes of tall buildings. In investigating the potential impact of modifying the windward roof corner to a rounded shape, with reference to a flat roof, it is hypothesized that such alterations could lead to a significant increase in wind velocity. The observed discrepancies in the experimental method stem from variations in measuring tools and instrumental errors. In contrast, Computational Fluid Dynamics (CFD) simulations introduce errors primarily associated with the meshing tool [2]. Previous research has delved into the effects of wind on super-tall buildings [3], revealing notable differences in wind pressure coefficients between structures exposed to a twisted wind field and those subject to a conventional wind field. Specifically, a distinct Gaussian distribution of wind pressure along the windward facade was observed at different wind-skewed angles, whereas the leeward and side facades exhibited non-Gaussian distributions. The study further evaluates the mean pressure coefficient for various shapes over which different modifications are applied to a high-rise building model. The findings indicate that compared to a cuboid structure, the modified building structure experiences reduced negative pressure on the side and leeward walls [4]. Wind loads have been calculated after analyzing a wide range of data from studies and international standards [5,6,7,8,9,10,11] (field measurements and experimental studies) in the form of codes/standards. However, due to the scarcity of land in urban and metropolitan cities and the evolution of new construction materials and technologies to accommodate such a huge population within the city, there have been increases in the height of the buildings, along with designs of irregular shapes as building cross-sections. Wind tunnel studies are conducted to investigate the wind-generated effects on high-rise structures, which is time-consuming and cumbersome. Using the latest technology and developments in computational resources, nowadays, numerical simulations are gaining in importance. These provide faster and more economical solutions within the comfort of the office. Full-scale measurements can also be performed in numerical simulations. In prior studies, researchers have explored the examination and validation of wind-generated pressure coefficients through the utilization of various computational tools such as artificial intelligence (AI) and different ML (machine-learning) forecasting network tools [12]. Through the use of machine-learning algorithms, such as K-Nearest Neighbor (KNN), Multiple Imputation by Chained Equations (MICE), and Generative Adversarial Iterative Network (GAIN), it has been identified that GAIN exhibits superior performance in handling missing data. Specifically, GAIN demonstrated notable outcomes, achieving a minimal average mean squared error (AMSE) of 0.01 and a maximal average R-squared error (ARSE) of 0.96 when compared to alternative models. The behavior of irregularly shaped buildings under wind loads has been studied by many researchers using wind tunnels or various numerical techniques. For example, a few researchers have presented ideas such as wind pressure patterns along the perimeter of L- and U-shaped buildings, and the plans of models with similar heights were studied on wind tunnels [13]. Similarly, wind effects as well as interference effects on a model of a tall rectangular building were studied [14] using wind tunnel tests and Computational Fluid Dynamics (CFD). It is observed from the study that the percentage difference between the results from the wind tunnel test and CFD is between 20% and 25%. Field measurement results of two super-tall buildings were compared with wind tunnel data for two different terrain characteristics—open country and urban terrain [15]. The predicted design load value for clad buildings is modified by the wind directionality factor and area averaging factor [5]. Various research works have been undertaken in the field of wind engineering on irregularly shaped buildings. The aerodynamic forces and wind pressure in various unconventionally planned tall buildings were presented [16,17]. For the wind directionality and side ratio of a rectangular building, it is observed that the suction pressure is on side faces and on leeward faces. The pressure enveloped around the faces of a regular E-plan shaped building model for various wind directions was studied [18]. Fluctuating forces and pressure due to wind on a super-tall building model for isolated and surrounding conditions for different wind directions were studied [19]. The wind flow parameters around N-shaped cross-sections of tall buildings were investigated [20]. The surface pressure on the faces of a C-shaped building model with different aspect ratios was investigated [21] using ANSYS (Fluent) by employing the turbulent model for different wind incidence angles, and the results were compared with wind tunnel test results. The effect of wind on the typical plan shape of a “Y” was investigated using CFD [22]. A compression of results obtained from and SST turbulence models as well as experimental data was made. The results obtained from the turbulence model were similar to wind tunnel experimental results. This comparative assessment enhances the insights into the intricate interplay between architectural design features and wind-induced structural responses, contributing to a nuanced understanding of the dynamic interactions within the built environment [23]. Few studies have been performed to evaluate the wind effects on a high-rise building model having the “plus plan shape”. The investigation encompasses a comprehensive analysis of results obtained through both experimental and numerical approaches, focusing particularly on wind angles of 0° and 45° [24]. Through a meticulous comparison of pressure coefficients, it was noted that the variations between the wind tunnel test and the numerical simulations fell within an acceptable range. This alignment between experimental and numerical outcomes underscores the reliability and accuracy of the applied methodologies in capturing the intricate interplay between wind forces and the structural response of the tall building. The congruence of results provides a robust foundation for further exploration and insights into the dynamic behavior of high-rise structures under varying wind incidence conditions. In this study, the main focus was to examine the impact of wind on a distinctive triangular plan-shaped model. It was observed that slight adjustments in the model position from its initial location could lead to variations in the obtained results. The outcomes derived through Computational Fluid Dynamics (CFD) are particularly sensitive to factors such as the surrounding wind environment and the type of meshing employed [25]. Previous research delved into wind pressure analysis using the wind tunnel method applied to various piloti building models [26]. Notably, for the piloti building with an end type, the roof experienced considerably higher pressure compared to other models of piloti buildings. Specifically, the investigation revealed that the maximum wind pressure coefficient occurred at the interior corner of the end-type piloti building, and the minimum peak wind pressure was observed along the outer edge of the roof for this specific building model.
Most of the studies presented in the different international standards are on regular cross-sectional plan shape buildings. Hence, an investigation is undertaken to scrutinize the surface pressure distribution of a distinctive plus-shaped building model. This building is characterized by unique features of re-entrant corner modification, with an area of 300 square meters and a height of 50 m. The primary emphasis of this study revolves around unraveling the wind-generated effects on the re-entrant corners of the tall building model. The numerical simulation uses the k-epsilon turbulence model, and wind velocity is applied employing a power law distribution as per the terrain category-II and as per IS 875 part-3, 2015 [5]. The length–scale ratio is judiciously selected for the building model, adhering to the guidelines stipulated in various international standards to ensure methodological robustness and various guidelines provided in the wind tunnel manual by ASCE report no 67. This research contributes to the literature by presenting a comprehensive analysis through multiple graphical representations. The coefficient of pressure ) is the delineation of streamlines along both the vertical and specific surfaces of re-entrant corners. The pressure distribution across diverse wind incidence angles is depicted for various wind incidence angles varying from 0° to 90° at an interval of 15°. These graphical presentations of various results serve as valuable tools in unraveling the intricate dynamics of wind effects on the re-entrant corners of tall buildings, providing a deeper understanding of their structural response to varying wind conditions for the high-rise building model.
2. Verification and Validation
Prior to simulating any building with an irregular shape, it is imperative to validate the simulation approach using a standard model with past recent experimental studies, various international standards, and past CFD studies. To achieve this, a numerical simulation was conducted on a rectangular cross-sectional plan shape model with comparable height and cross-sectional area parameters. The same is also depicted in Figure 1. The simulation conditions were replicated to ensure a meaningful comparison between the numerical results and different code values. The analysis focused on evaluating the pressure coefficient of the rectangular model, and the results were found to be well within acceptable limits. The mean pressure coefficient () aligns closely with the values stipulated in different international codes, as provided in Table 1. This preliminary validation step serves as a crucial benchmark, emphasizing the reliability and accuracy of the numerical simulation approach before extending it to irregular-shaped building models as presented in Figure 2.
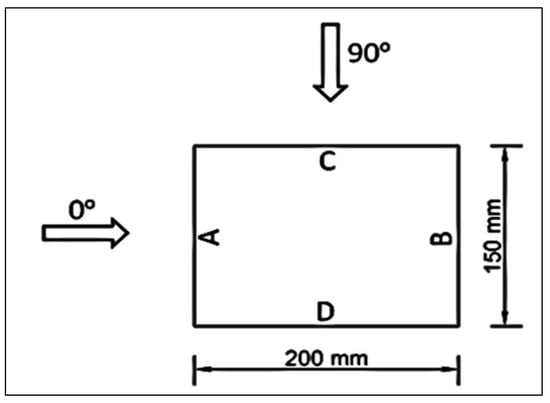
Figure 1.
Rectangular model.

Table 1.
Comparison of area average on faces of rectangular model.
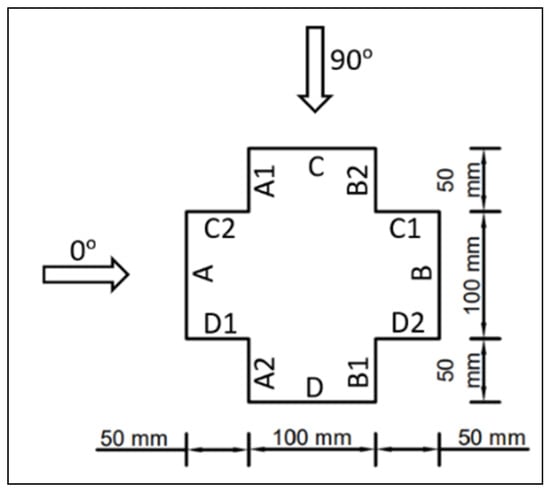
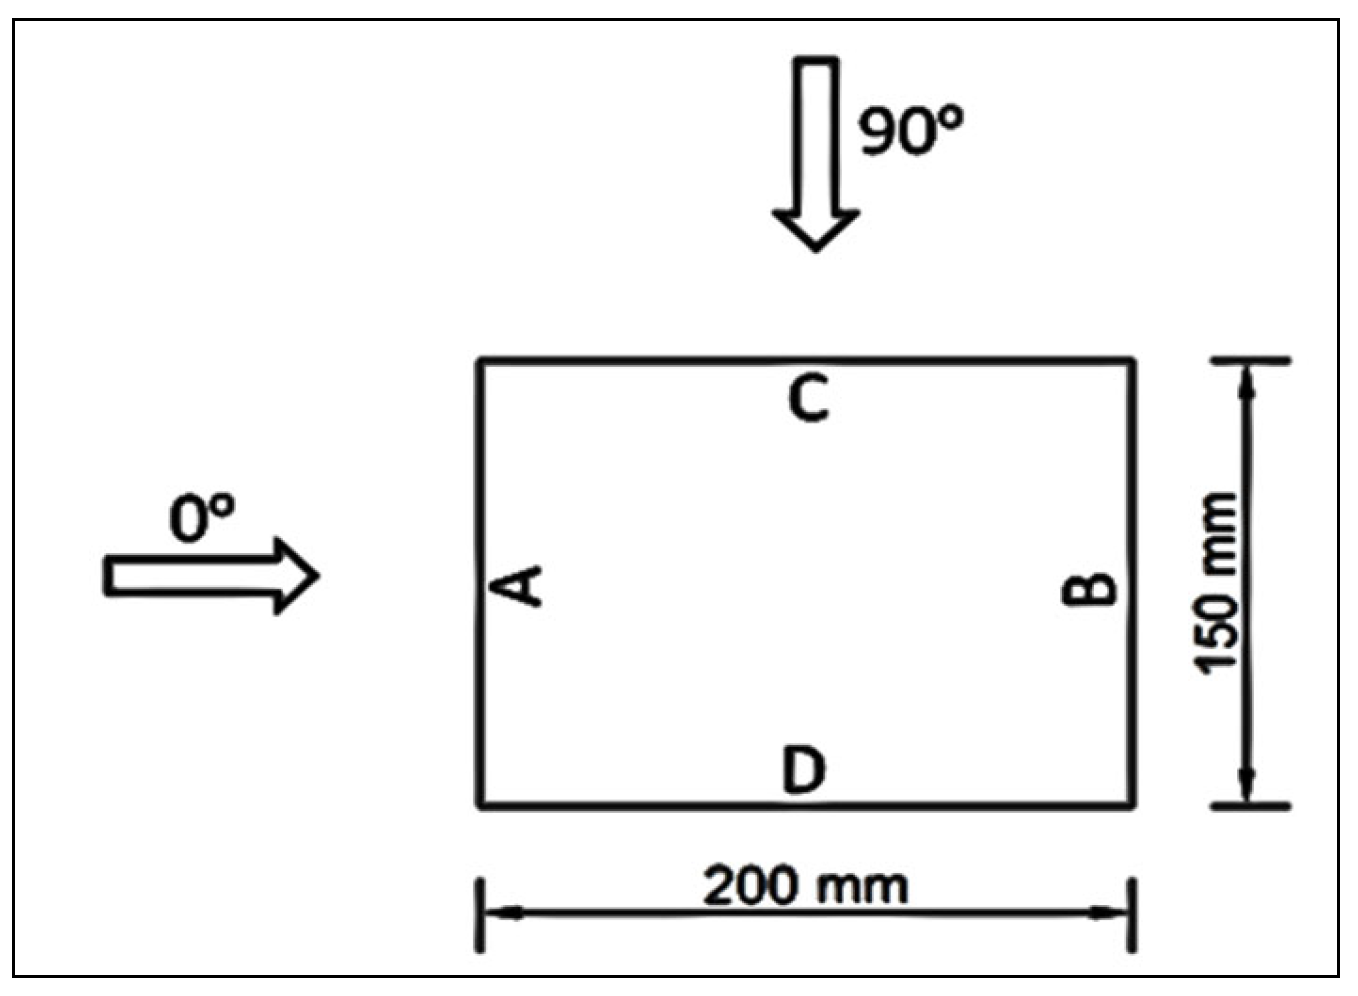
Figure 2.
Plus shape model.
3. Numerical Simulation with Methodology
To investigate the wind effects on tall buildings, we employed a numerical simulation approach by utilizing numerical tools such as the ANSYS CFX academic version. The methodology implemented in this study involved several key aspects to ensure accuracy and reliability in capturing the intricate interactions between the building structure and the surrounding wind flow. This is executed in various steps. Initially, a detailed geometric representation of the tall building and its immediate surroundings was created in the ANSYS CFX environment. The importance of accounting for neighboring buildings should be noted, as they significantly influence the wind flow patterns and, subsequently, the terrain category and the wind effects on the target building. Subsequently, a meticulous meshing strategy was employed to discretize the geometry into computational elements. Fine meshing, especially in the vicinity of the building surfaces, was crucial to capturing the intricate details of the flow patterns and pressure distribution. Mesh refinement techniques were applied on the building surfaces, with specific attention given to critical areas such as corners and edges, where wind-induced effects are more pronounced.
The simulation was carried out using the ANSYS CFX solver, applying appropriate boundary conditions to mimic real-world scenarios. Turbulence models, such as Reynolds-averaged Navier–Stokes (RANS) equations, were selected based on their suitability for simulating wind flow around buildings. Special care was taken to ensure that the selected turbulence model and numerical settings aligned with the objectives of the study. To analyze the results effectively, post-processing involved the generation of flow visualizations, including streamlined plots and contour maps of pressure distribution. These visual representations played a crucial role in deciphering the flow patterns and understanding how wind interacts with the building’s different surfaces at various wind incidence angles. In addition to the flow visualizations, quantitative analyses were conducted to extract relevant data, such as the wind pressure on different building surfaces. This data served as a basis for evaluating the structural response and determining potential areas of vulnerability.
Navier–Stokes equations of fluid flow, known as continuity and momentum equations, are fundamental for defining any fluid flow. Various numerical models have been developed in the form of differential equations based on Navier–Stokes equations to study the turbulent flow circulation around any bluff body. These differential equations are solved at finite grid locations during simulations. The differential equations contain many unknowns and dependent quantitieshence depending upon the expected flow behavior, assumptions have been made to neglect these quantities. One of the most commonly used models for numerical analysis is the standard -epsilon () turbulence model for bluff body wind simulation. In this model, providing initial and boundary conditions is reliable in comparison to the other available turbulence models for the investigation of the wind effects on tall building models. However, this does not perform well for complex flows with a high-pressure gradient separation and considerable streamline curvature. In this model, fluid turbulence is defined by two transport equations. The first is ‘Turbulent Kinetic Energy ()’, and the second is ‘Dissipation of Turbulent Kinetic Energy ()’. The time-averaged fluid velocity in the continuity and momentum equations of Navier–Stokes has been assumed for steady-state wind flow conditions. These equations are termed Reynold’s-averaged Navier–Stokes (RANS) equations. The RANS equations and the additional transport equations are defined in ANSYS (CFX) solver theory guide 2012.1 (2009) on page 57 [27].
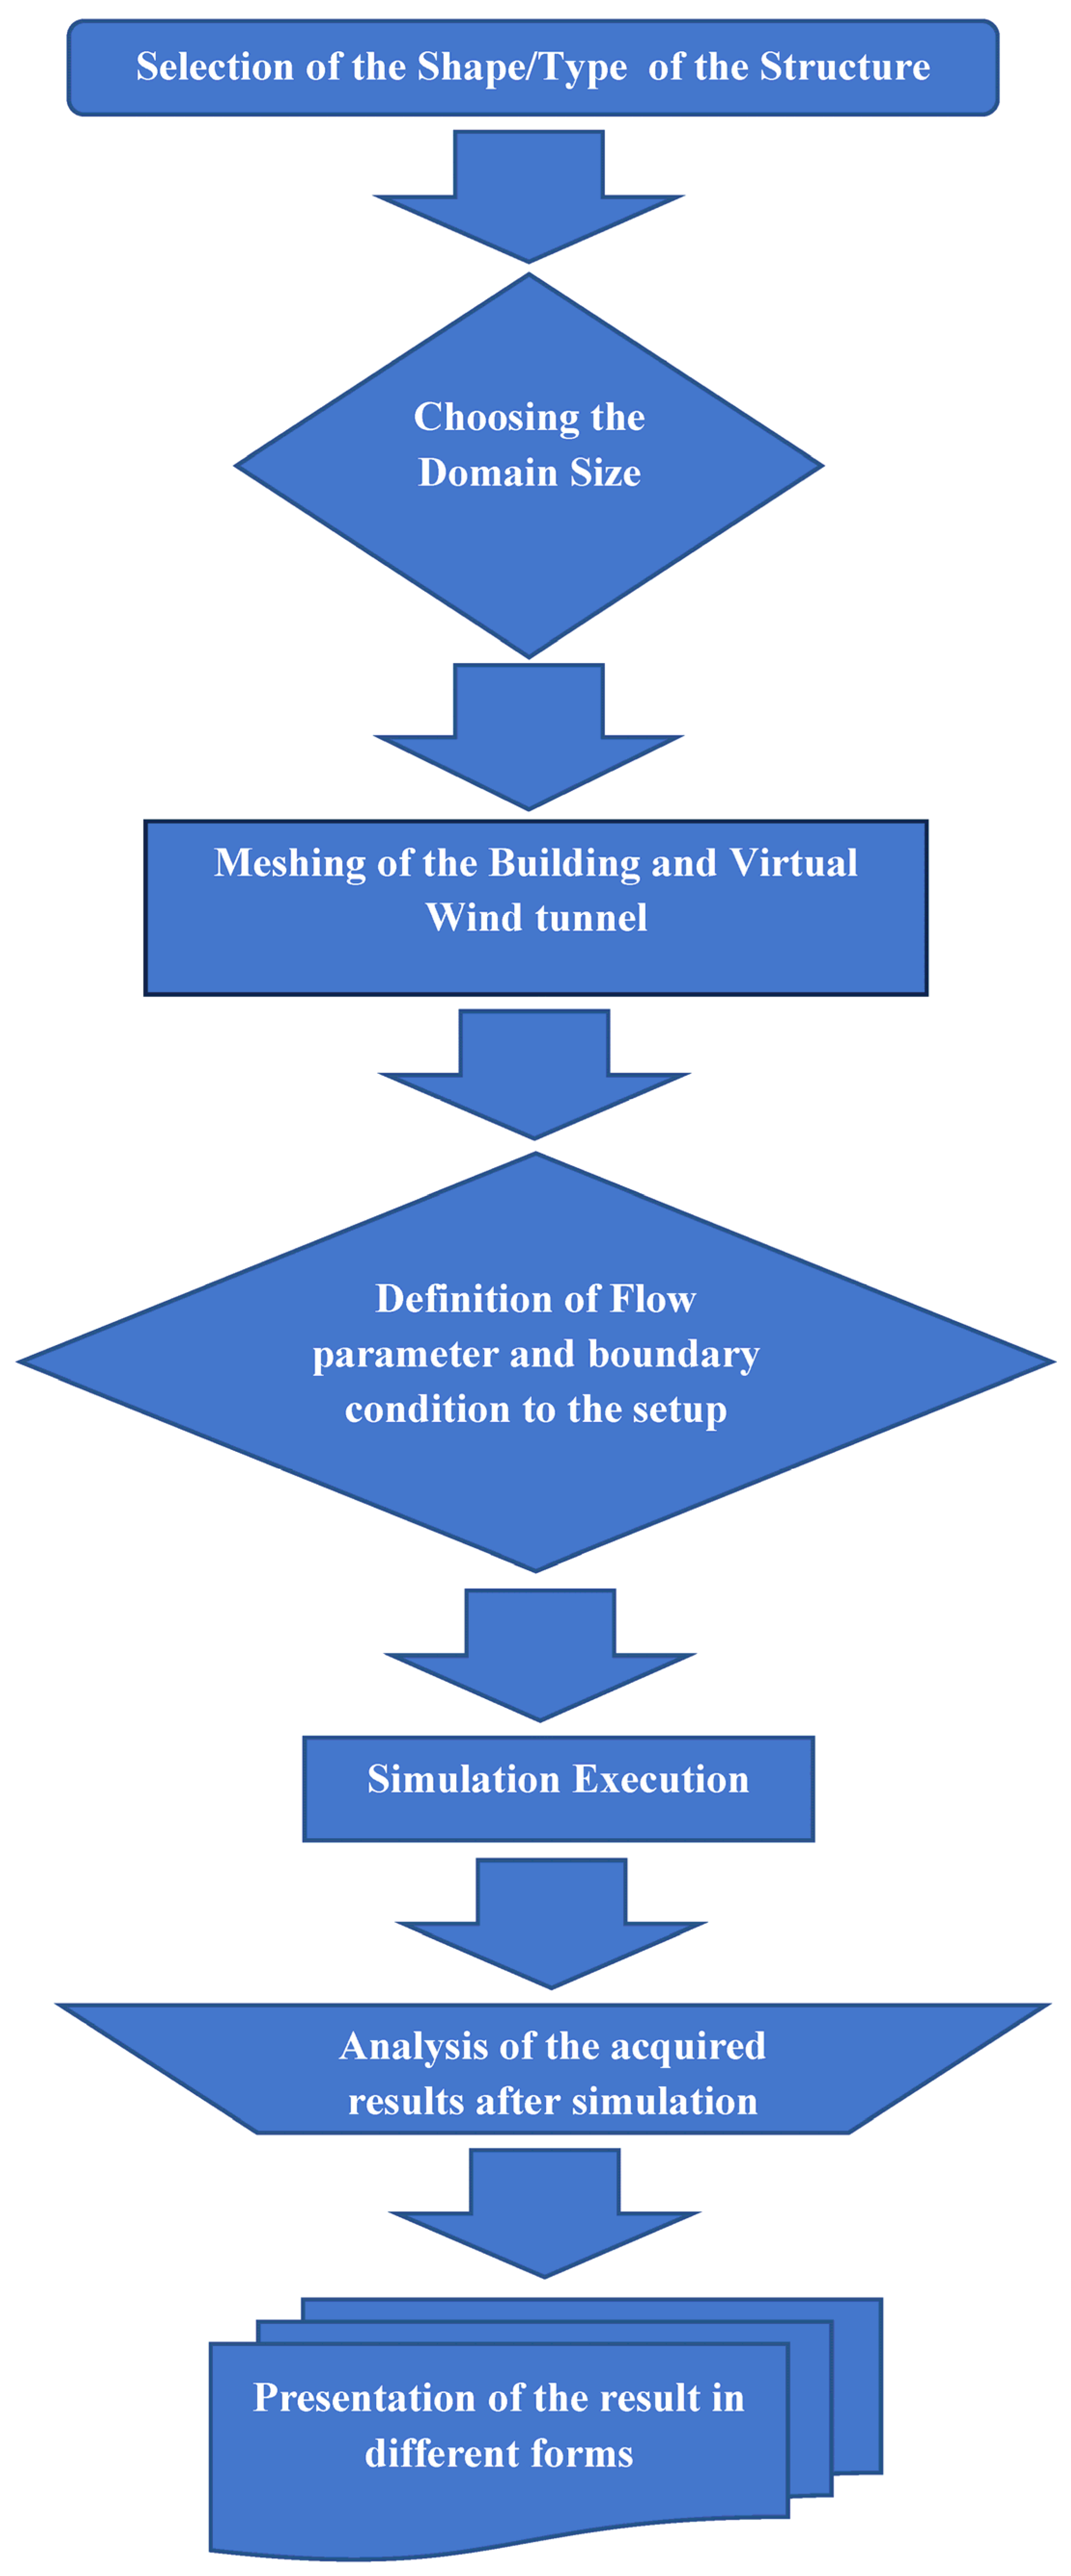
3.1. Flow Chart
In investigating wind effects on tall buildings using ANSYS CFX, integrating a well-structured flow chart proves to be a pivotal component of the methodology. This visual representation serves as a comprehensive guide, delineating the sequential steps involved in the numerical simulation process. The initiation of the flow chart consists of the definition of the geometric model, where the tall building and its surroundings are meticulously represented within the ANSYS CFX environment. This step includes the incorporation of neighboring structures, a critical consideration in simulating realistic urban conditions. The flow chart provides a clear path for model creation, ensuring accuracy in capturing the complex geometrical features. Subsequently, the meshing process is illustrated in the flow chart in Figure 3, highlighting the importance of a refined mesh for precise simulations. Special attention is given to the building surfaces, emphasizing the need for fine meshing in critical areas where wind interactions are most pronounced, such as corners and edges. The flow chart visually guides the user through the mesh generation steps, ensuring a detailed discretization of the geometry.

Figure 3.
Flow chart.
We have integrated a dedicated Methodology section, complete with a comprehensive flow chart. This structured methodology ensures that the numerical simulations are conducted precisely, and that they align with the required standards per ASCE report no 67 [28]. Using ANSYS CFX as the numerical simulation tool provides a robust platform for simulating wind effects on tall buildings, offering valuable insights for structural designers and architects alike.
3.2. Model and Computational Domain
The computational domain acts as a virtual wind tunnel in the numerical simulation. The size of the domain is kept large enough so that the blockage of wind flow remains within 3% due to the presence of the model. The model is placed inside the domain for simulation on isolated conditions as defined in the terrain category-II of IS 875 part 3, 2015, as shown in Figure 4. The distance of domain boundaries from the outer surface of the model in each direction was adopted, as recommended by the COST group [29], to ensure appropriate flow conditions around the model envelope. For steady-state modeling on tall buildings, the recommendation for the size of the domain by past studies [30] is kept similar to those in the COST group and most of the other research performed using numerical simulations.
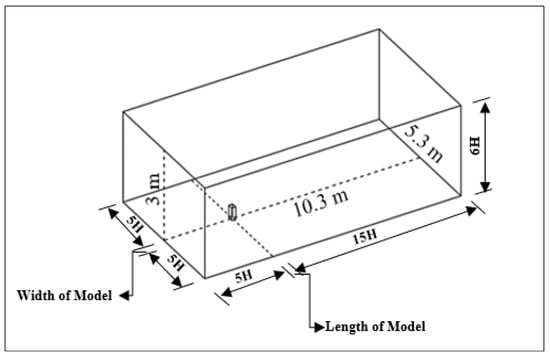
Figure 4.
Computational domain.
4. Mean Velocity Characteristics
The vertical profile of wind in nature increases or varies exponentially within the atmospheric boundary layer (ABL) due to friction from surface vegetation, manmade structures on the earth’s surface, and the earth’s rotation. Hence, the wind load on tall buildings also increases exponentially along the height. It is difficult to mimic the vertical wind profile exactly in order to investigate the wind effects on a high-rise building. However, some formulae are available to reproduce the vertical wind profile within the ABL. One of the most used among these is the power law presented below in Equation (1).
Power Law:
In the above equation:
= Time-averaged wind speed in m/s.
= Height at which the time-averaged wind speed is taken.
= Velocity given by the equation at height above ground.
= Terrain roughness index.
The power law does not provide the correct natural wind velocity up to 10 m from the surface of the earth. But it is simple to use and suitable for tall structures.
5. Grid Independence and Convergence
5.1. Grid Independence
The simulation results are intricately tied to the grid element sizes employed within the domain volume and the model under consideration. Achieving an accurate representation of pressure around the model envelope hinges on the meticulous reproduction of flow parameters, especially in regions characterized by high gradient velocities. To achieve this precision, it is imperative to employ fine meshing elements, particularly on the faces of the model. In the case of simulating a rectangular model, the grid resolution of the domain was set to one-fifth of the building scale, utilizing the global automatic meshing option. To further enhance the accuracy, adjustments were made to the element size on the domain ground surface through local settings, ensuring it was maintained at half the size of the domain volume elements. Moreover, the grid size on the building surface was refined even further, employing the local face-sizing option to reduce it to a quarter of the global mesh size.
A smooth inflation process was applied to the surface elements to ensure a seamless representation of pressure distribution on the model faces. Quality control measures were implemented, with the maximum skewness of elements being strictly maintained below 0.9 and the minimum orthogonal quality set not less than 0.6, ensuring robust and reliable simulation outcomes. Careful consideration was given to preventing substantial variations in result predictions stemming from changes in element size. Rigorous efforts were made to keep the predicted coefficient of pressure values within a specified range, specifically within 20% to 25% of the values stipulated in IS Code 875 (Part 3): 2015. This stringent adherence to standards and mesh refinement techniques was consistently applied during the simulation of the plus-shaped model, maintaining a uniform and meticulous approach for reliable and accurate results.
5.2. Convergence
Convergence of the solution is judged by monitoring the solution variables. The points of mass and momentum and the RMS of dissipation of kinetic energy as well as the turbulent kinetic energy reached at a steady-state condition must be monitored during the simulation. The residual RMS error values were achieved between 10−4 and 10−5 for the momentum in three directions and up to 10−6 for mass, and the domain imbalances were found to be less than 0.001% for the momentum in three directions and zero for total mass.
6. Boundary Conditions and Limitations
6.1. Boundary Conditions as Defined during Numerical Simulation
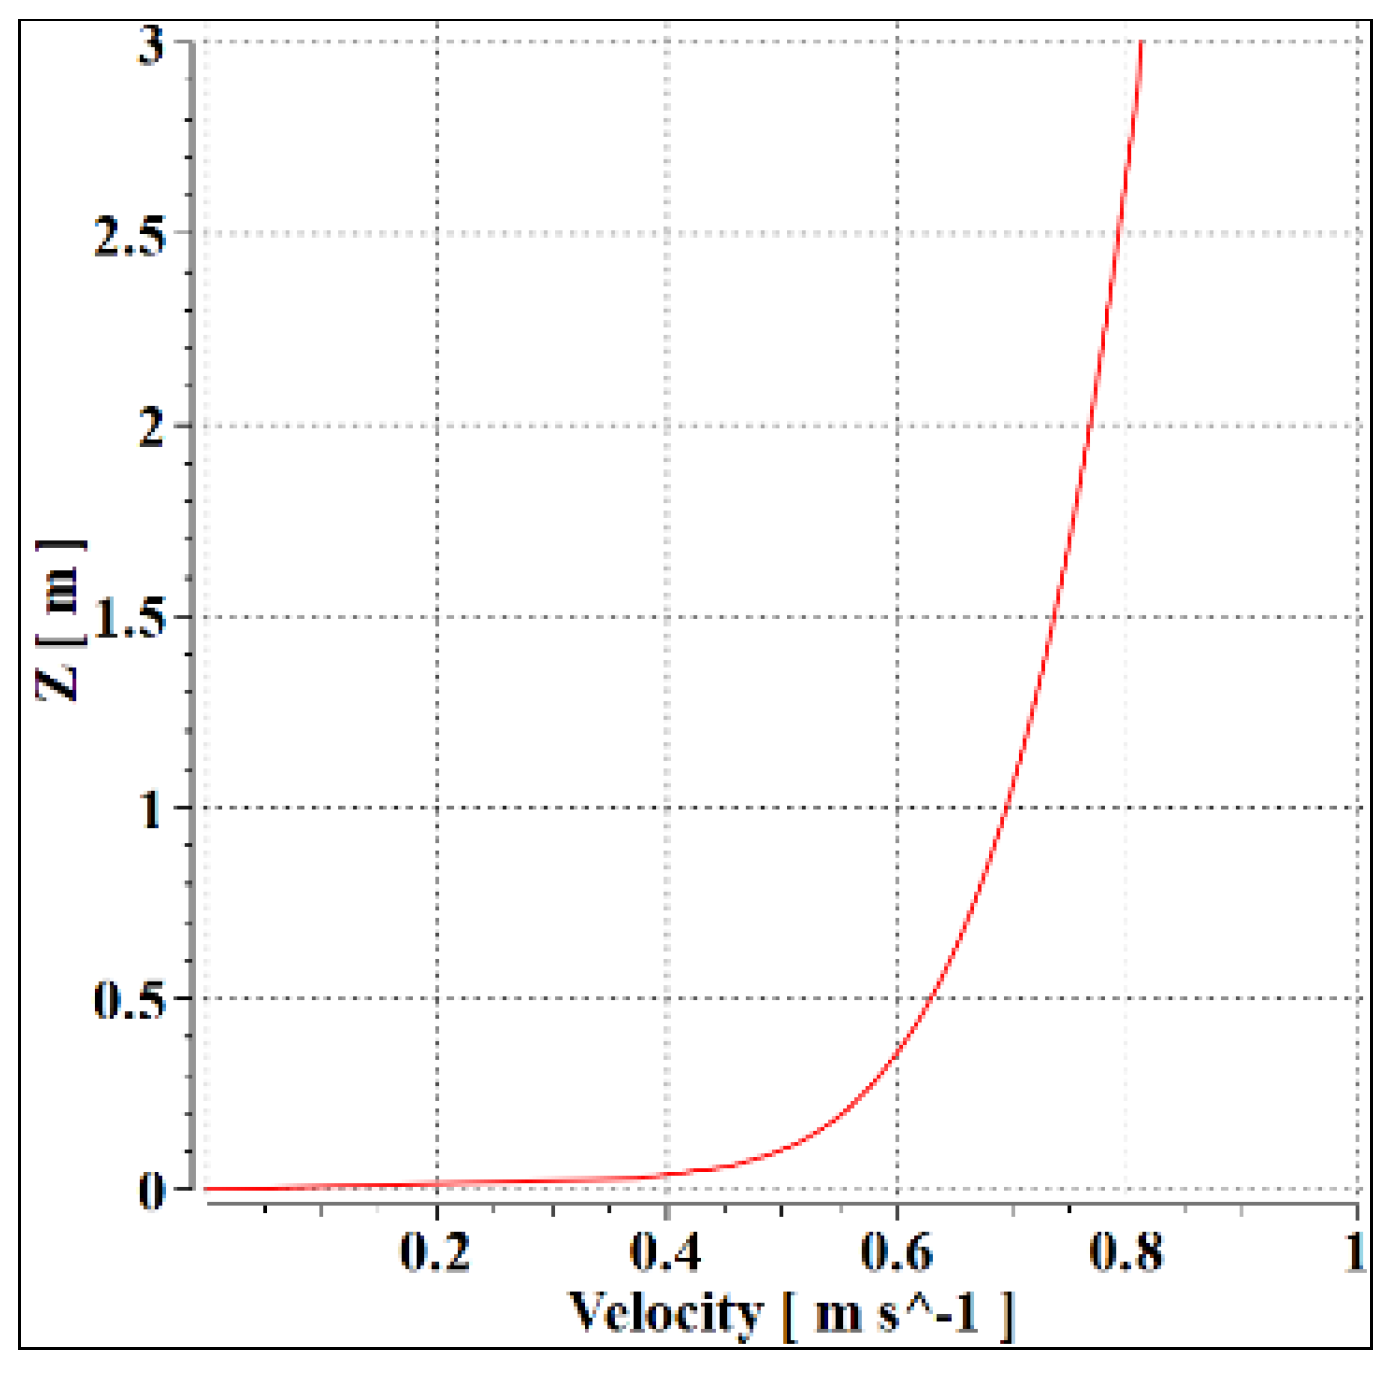
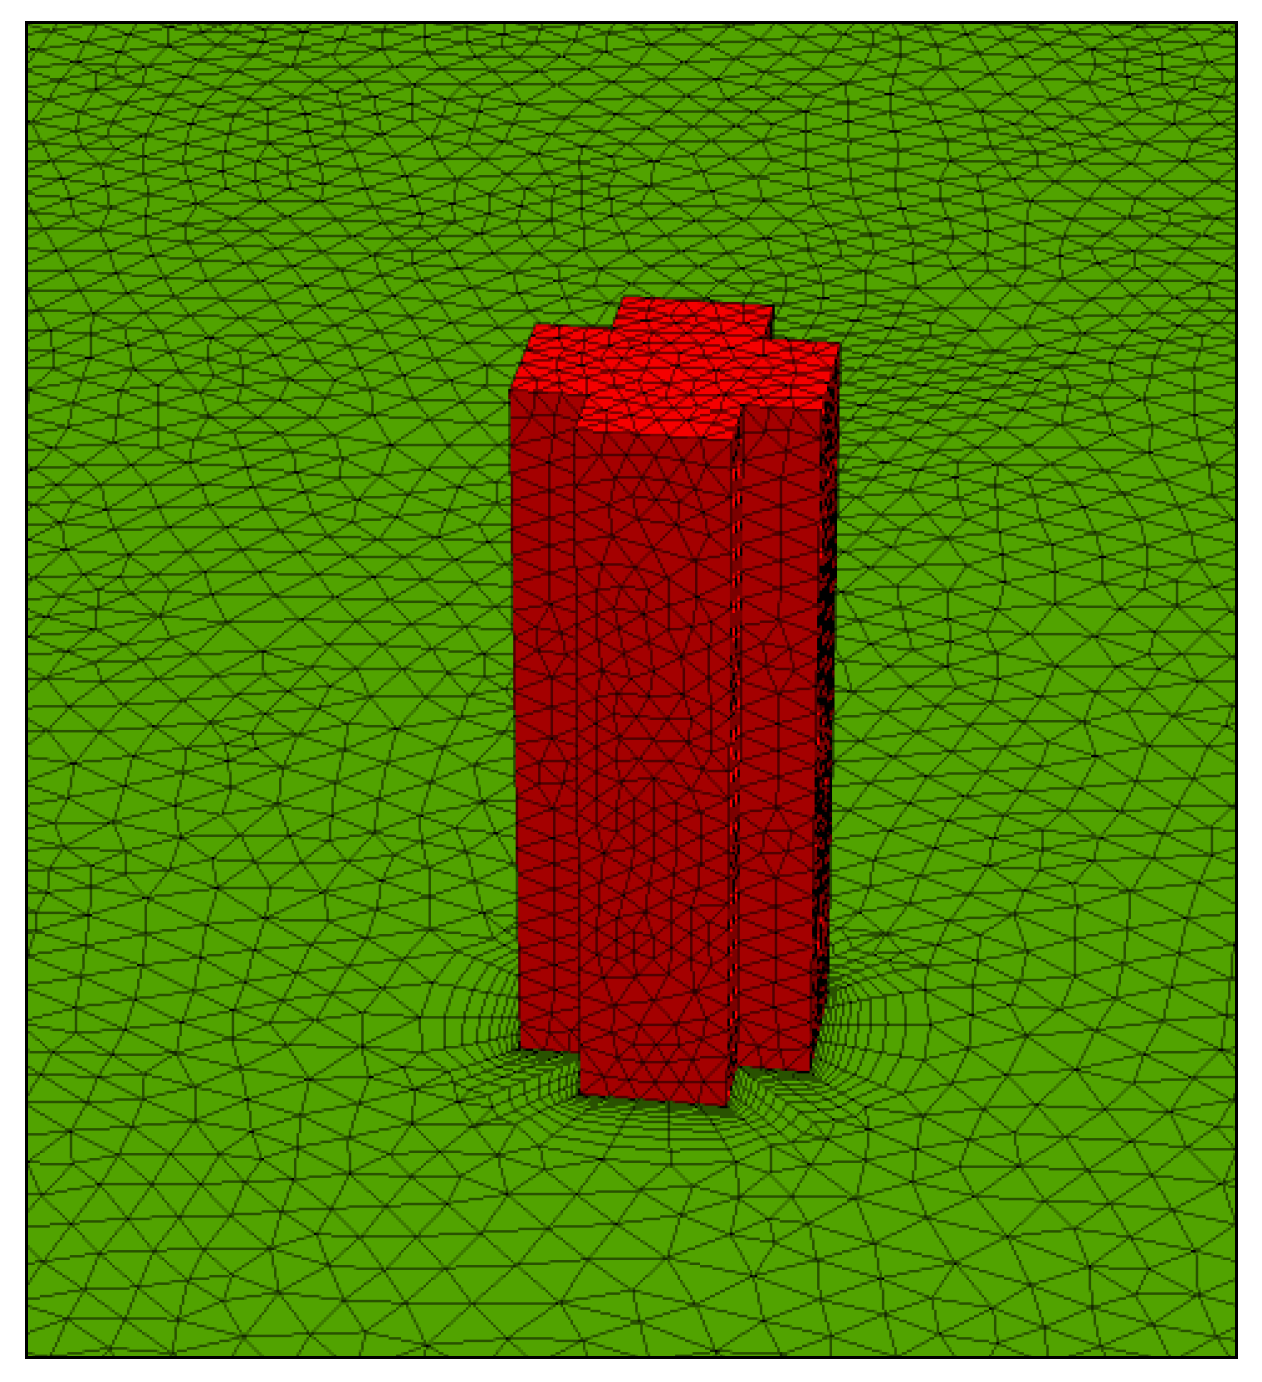
Homogeneous steady-state wind flow under the atmospheric boundary layer for open terrain with well-scattered surface obstructions with a height of 1.5 to 10 m (as per IS: 875 (Part 3): 2015) at the inlet was provided using the terrain roughness index as 0.143. A gustiness effect has been given by giving a turbulence intensity of 5%. The velocity attained at the roof height of the model was found to be 0.63 m/s. This velocity is sufficient to achieve the critical for turbulent flow around sharp-edged models like the present one. The velocity profile is shown in Figure 5. A free slip wall condition was provided on the domain’s side and top walls. The roof surface of the model was also offered with a free slip wall condition. This condition ensured the flow parallel to the walls was free from frictional forces and was computable during the simulation. No slip wall condition was provided on the model surfaces or the ground of the domain to ensure that the velocity at the surface is zero, in order to make the boundary layer flow from the wall surface. To change the direction of the wind in a clockwise direction, the model is rotated in an anticlockwise direction, with the same flow parameters and boundary conditions. The meshing for the building and ground is presented in Figure 6.
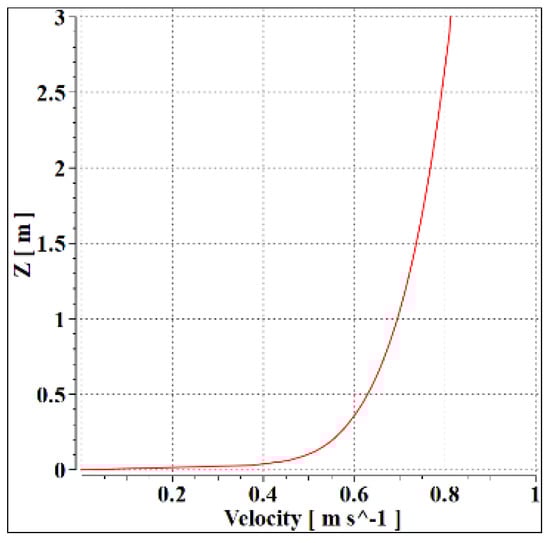
Figure 5.
Velocity profile.
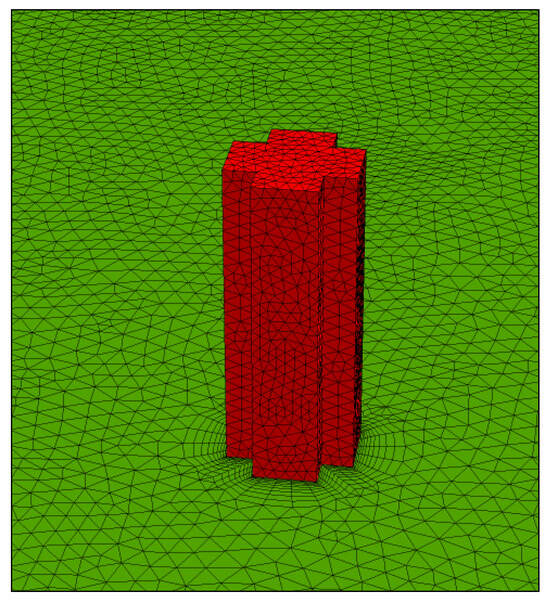
Figure 6.
Building Meshing.
6.2. Limitations of Numerical Simulation
Despite its potency as a piece of Computational Fluid Dynamics (CFD) software, ANSYS CFX has certain limitations, mainly when applied to investigating wind effects on tall buildings. Challenges arise in handling intricate architectural details and highly complex geometries associated with tall structures, requiring meticulous efforts to generate an accurate and high-quality mesh. The computational demands for simulations involving tall buildings and complex flow patterns can be substantial, necessitating careful consideration of the available computing power. Validation poses a significant challenge, emphasizing the importance of rigorously validating simulation results against experimental data to ensure the suitability of the chosen turbulence models and simulation parameters for specific wind scenarios. Though ANSYS CFX is a robust tool, its integration with other software or tools specializing in structural analysis or nuanced wind loading considerations may be beneficial for comprehensively exploring wind effects on tall buildings.
7. Result and Discussion
7.1. Flow Characteristics
In the investigation of flow patterns around tall buildings using ANSYS CFX, various angles of attack reveal distinct characteristics in the flow or streamline behavior. When analyzing the windward side of the tall building, characterized by a head-on wind direction, the flow lines typically exhibit smooth and attached streamlines. These streamlines gracefully envelop the building’s contours, illustrating a relatively undisturbed flow as the wind approaches the structure.
7.1.1. Streamlines on Horizontal Planes
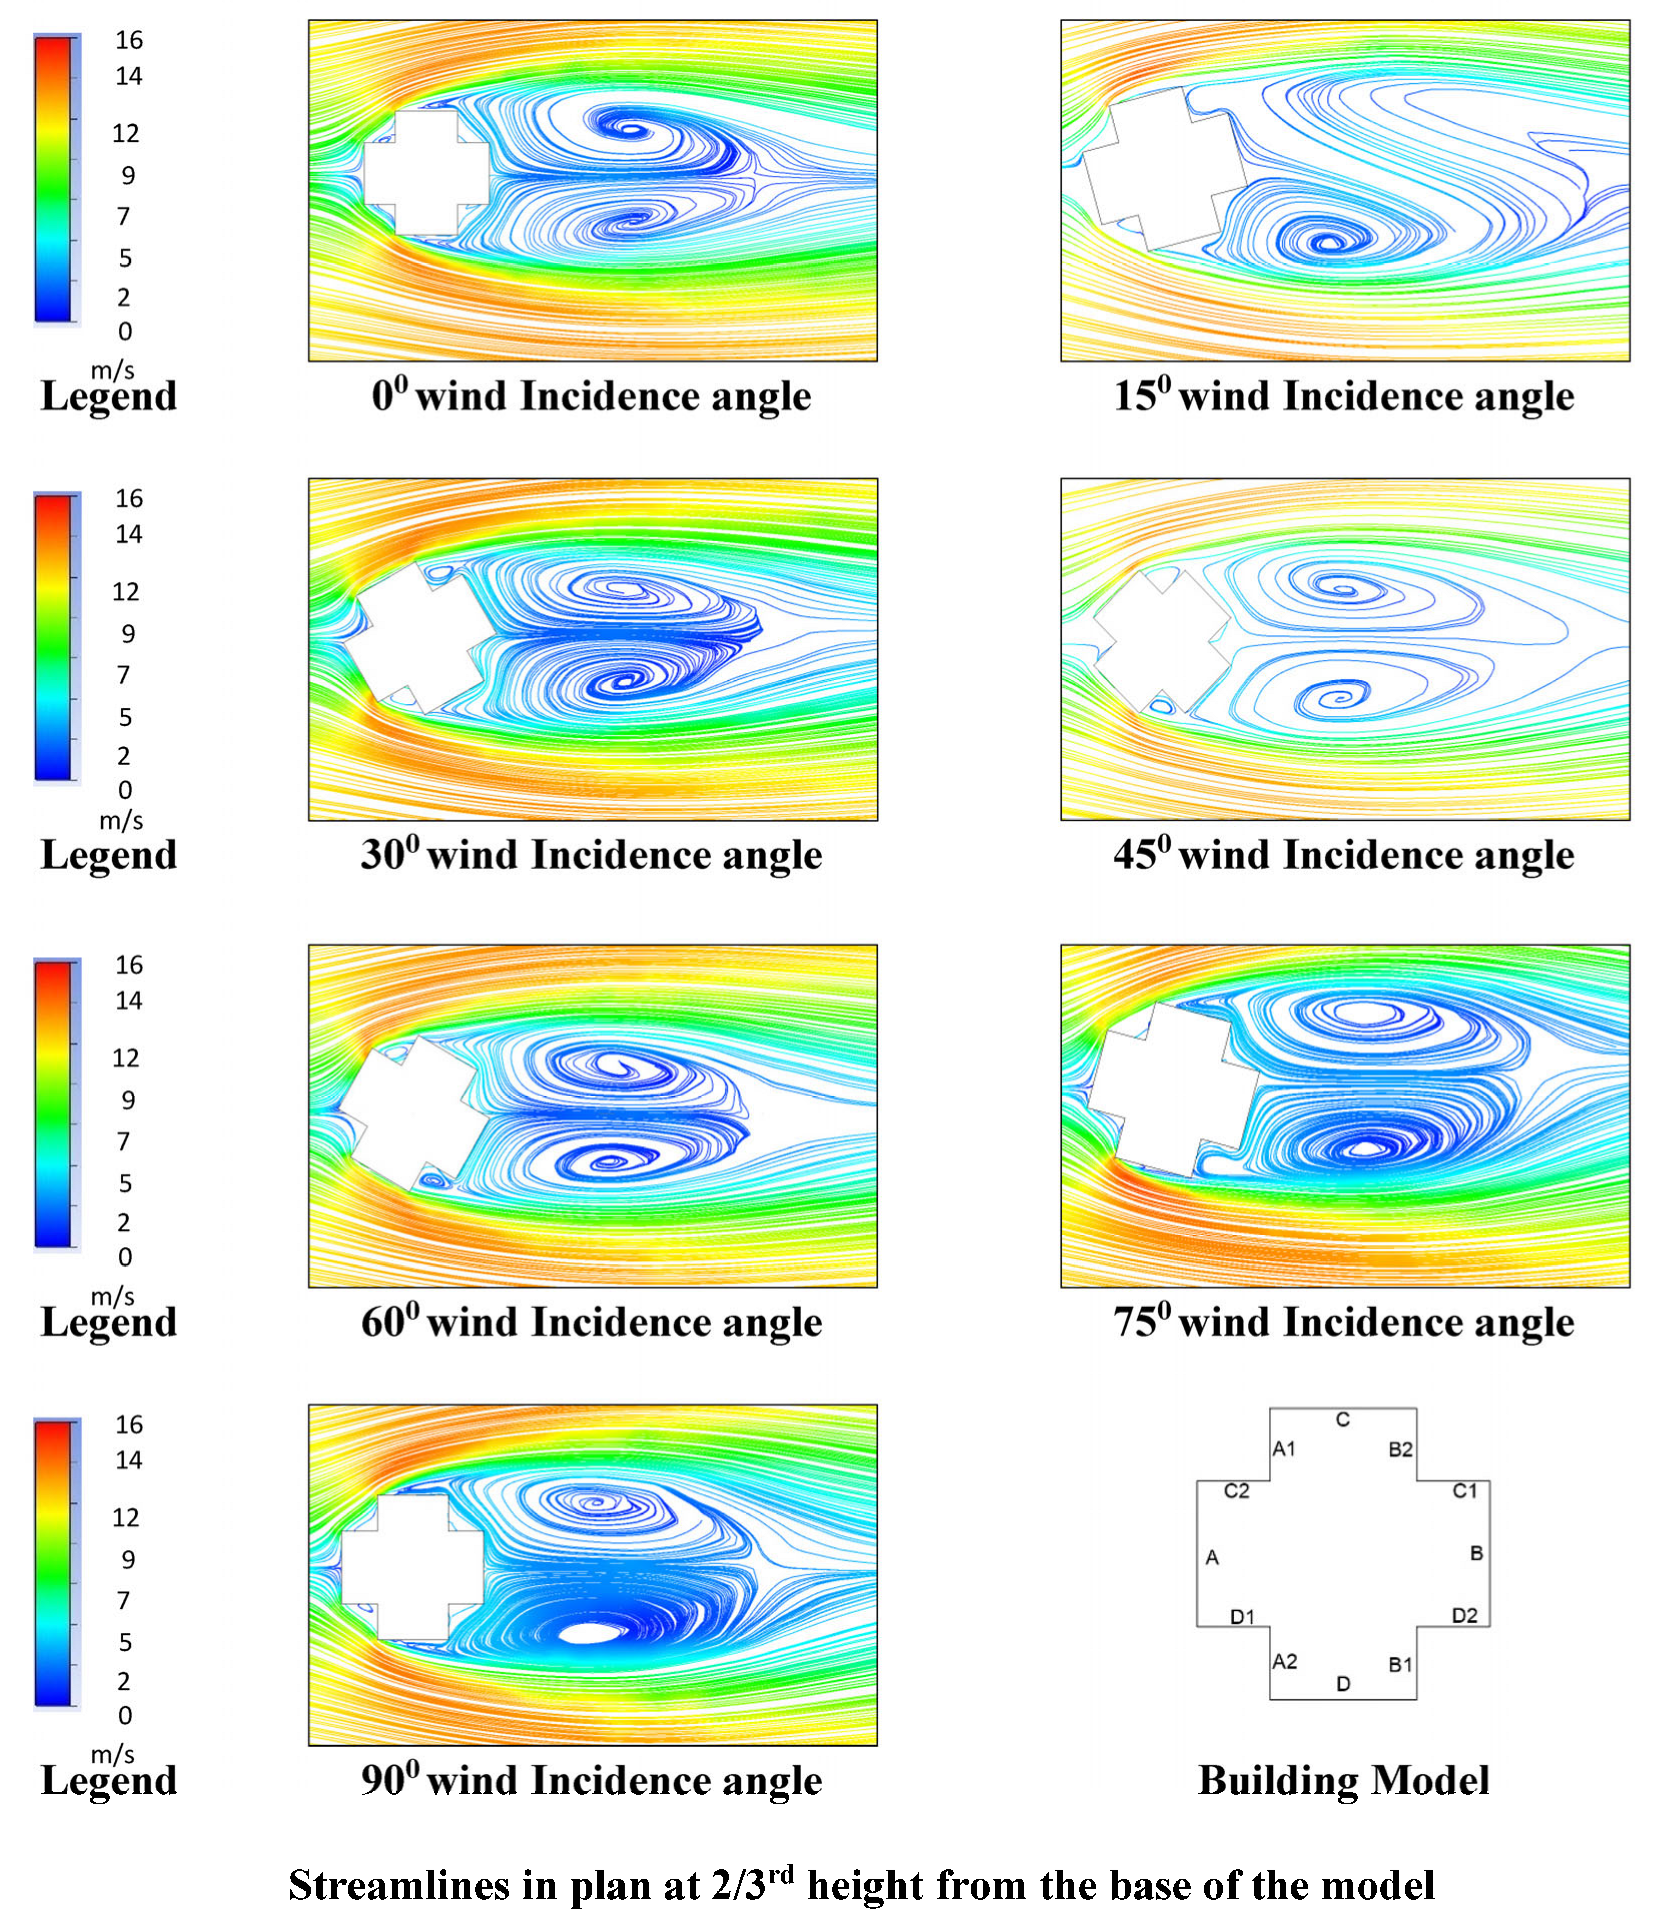
Separation of streamlines takes place before the flow hits the windward face. After hitting the leading edges, where the velocity is at maximum, recirculation zones are created around the building façade and roof. The flow reattaches after the wake region. Flow recirculation is developed in this region, with high turbulence forming two distinct vortices. Due to changes in wind angles, the pattern of formation of these vortices is different. Small vortexes and flow recirculation are created in the re-entrant corners, especially in the high turbulence zones. Eddies created due to these vortices develop suction on the model’s surfaces. Flow streamlines at one-third and two-thirds of the model height for different wind angles are shown in Figure 7 and Figure 8 respectively.
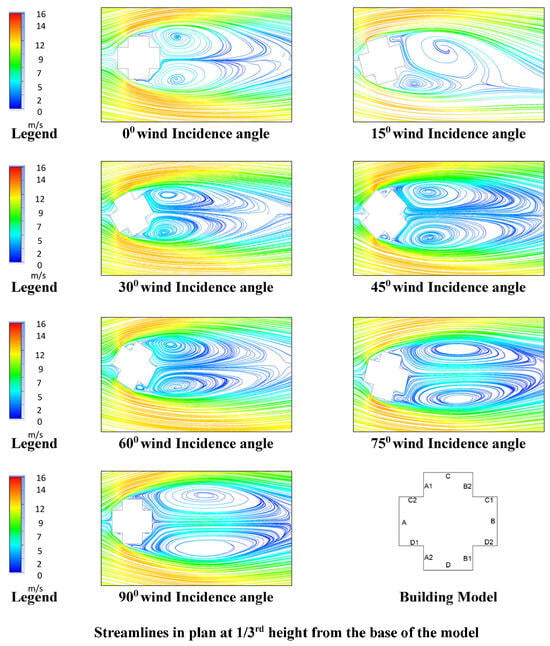
Figure 7.
Streamline pattern at 1/3rd height of model at different wind incidence angles.
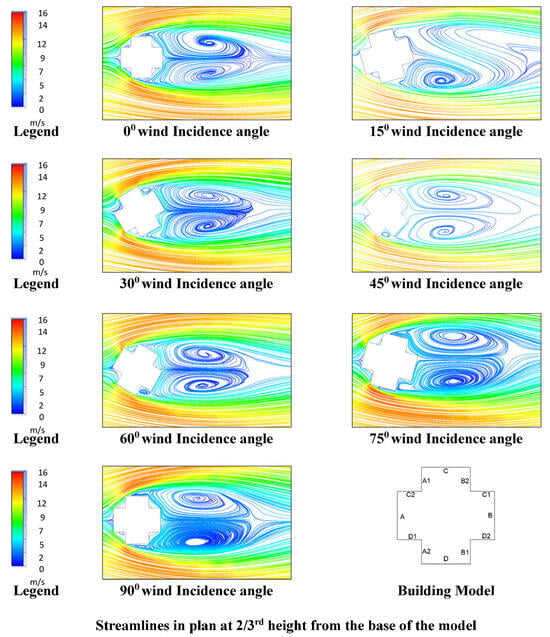
Figure 8.
Streamline pattern at 2/3rd height of model at different wind incidence angles.
7.1.2. Streamlines on Central Vertical Plane
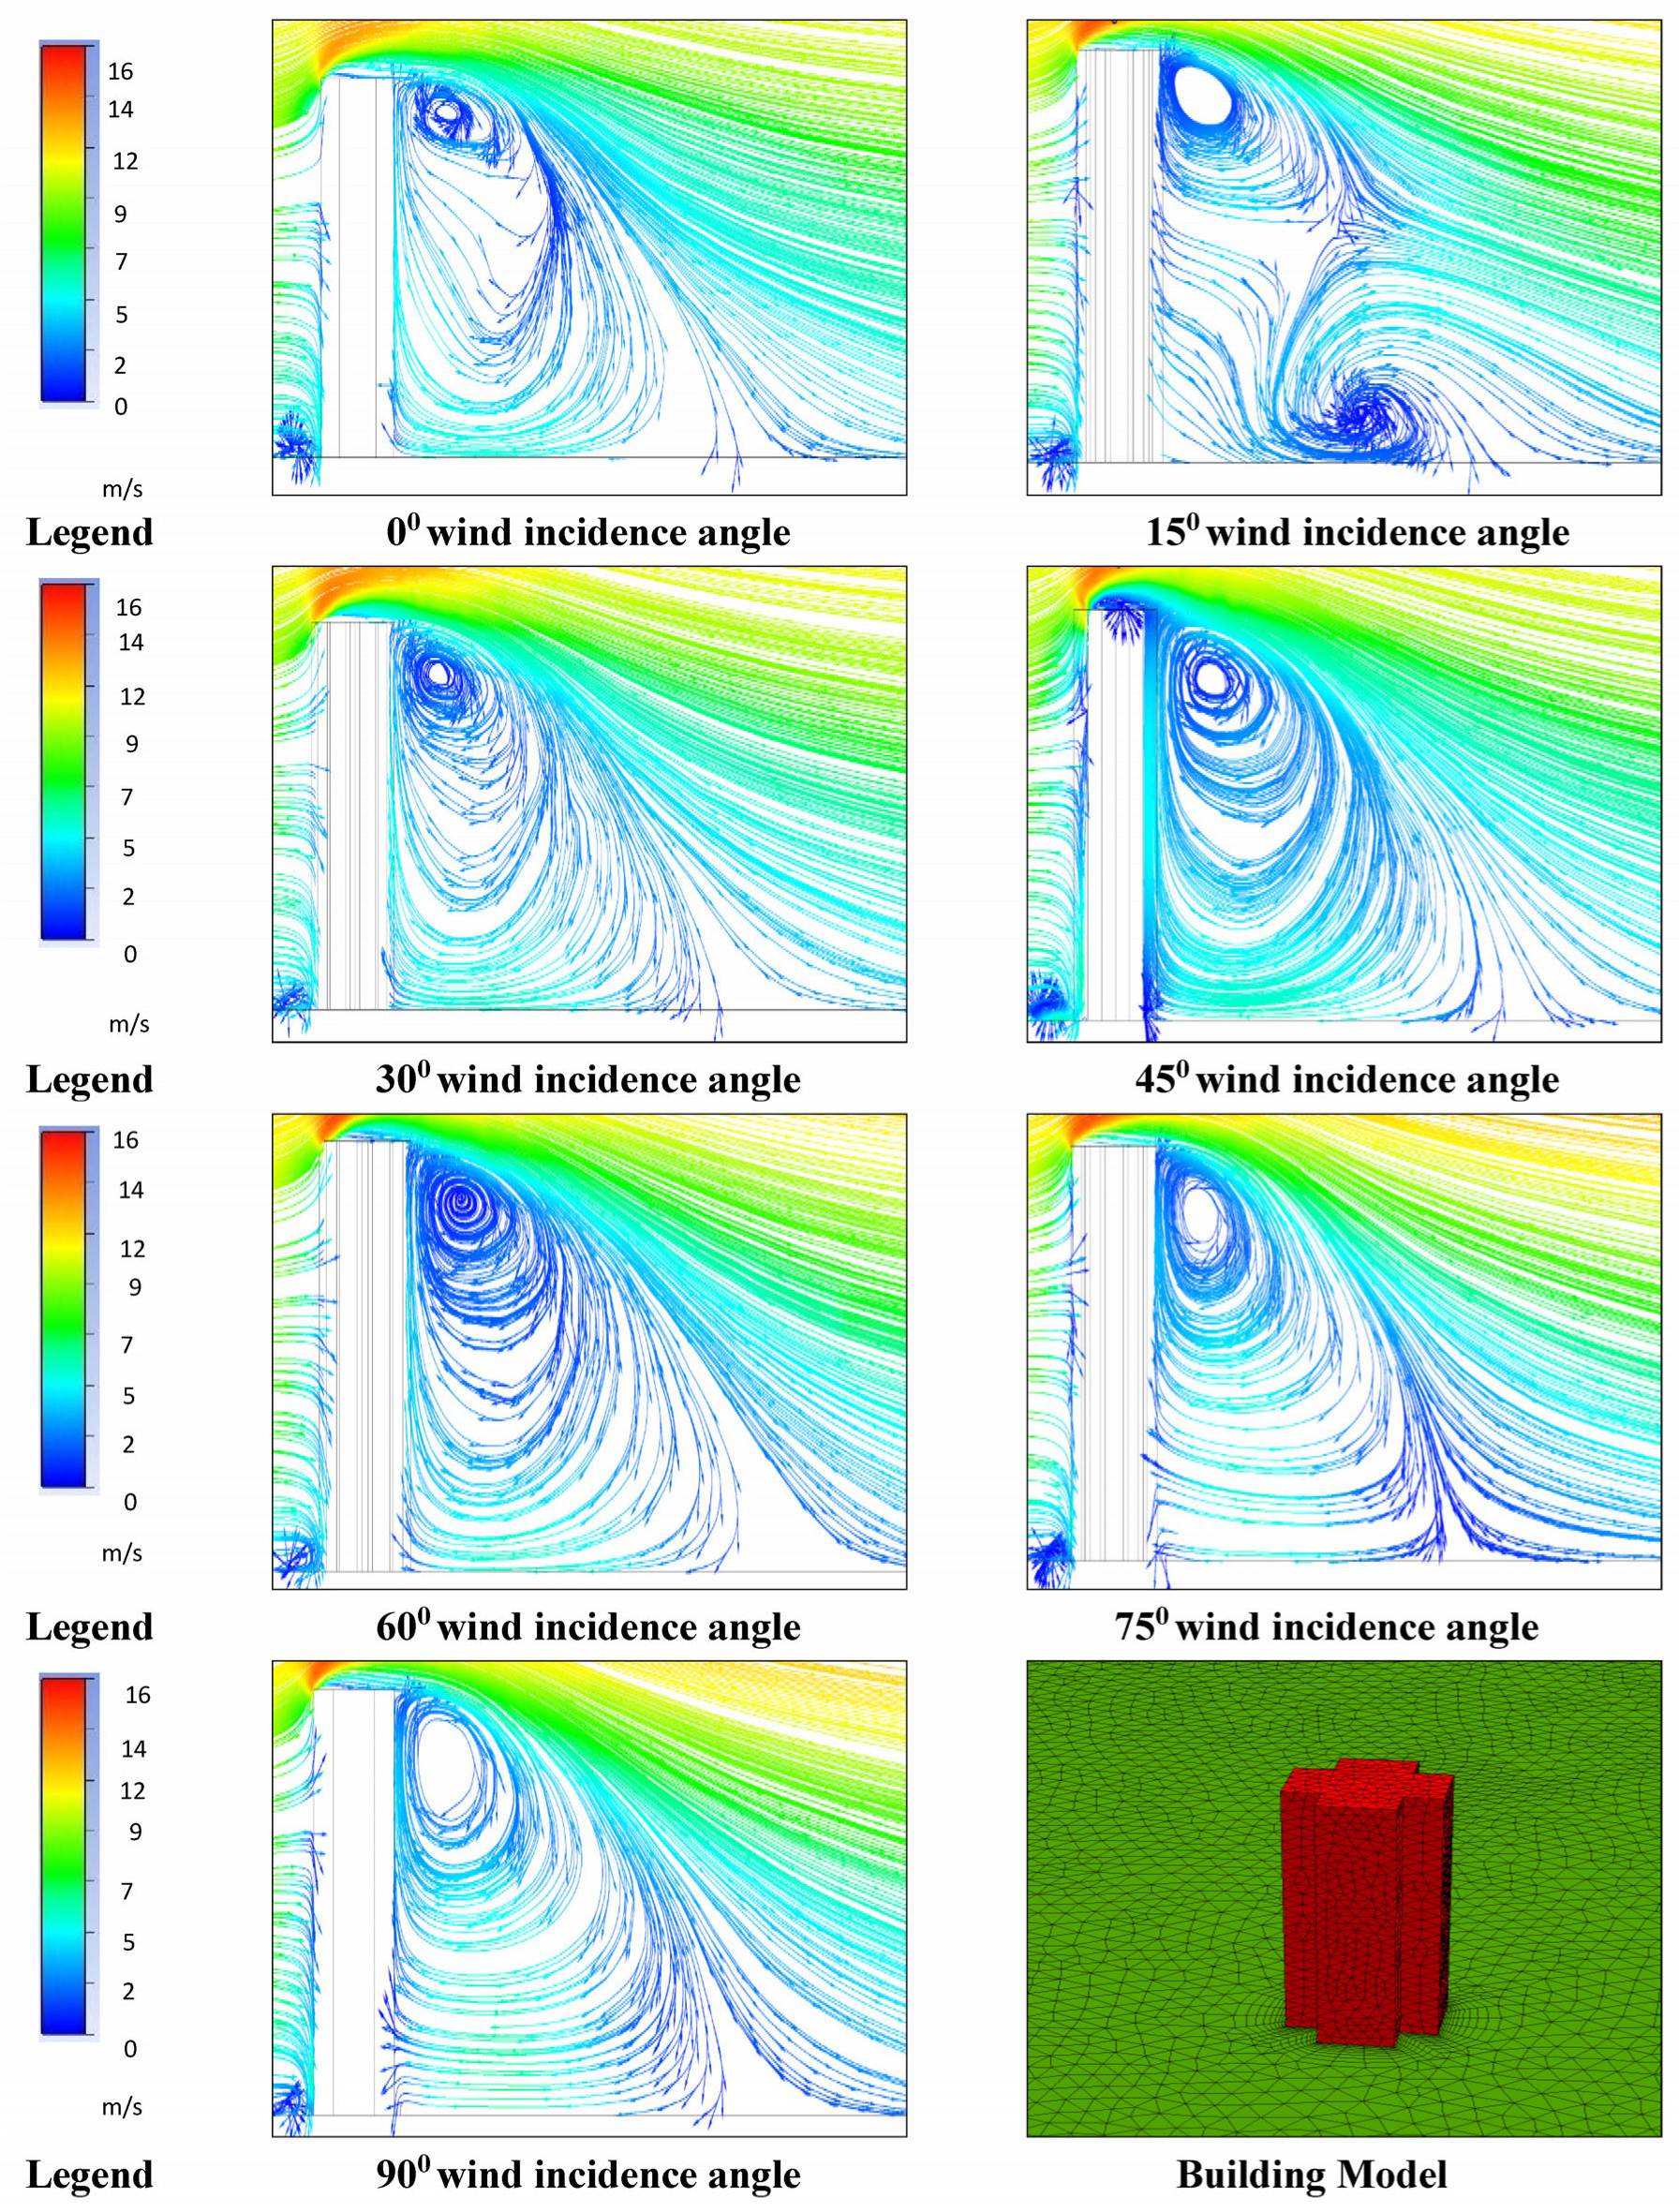
Figure 9 show streamlining along the central vertical plane at varied wind angles of attack. The pattern of downwash, upwash, and stagnation zones can be visualized from these. The upwind ground level vortex, shear layer at the roof, and the pattern of vertical and horizontal recirculation of wind in the wake are clearly seen. It is observed that for a 15° wind angle, the recirculation in the wake is prominent at two heights. At a 45° wind angle, the shear layer formed at the roof is more protruding.
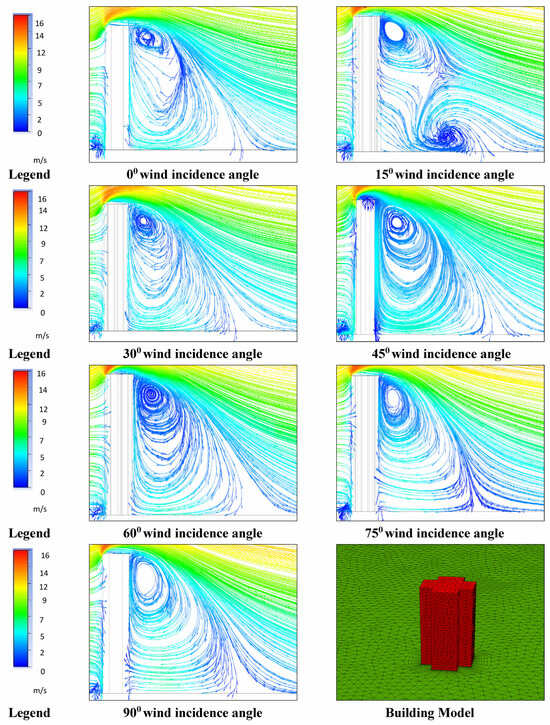
Figure 9.
Streamline along central vertical plane at different wind incidence angles.
7.1.3. Streamlines on Re-Entrant Corner Faces
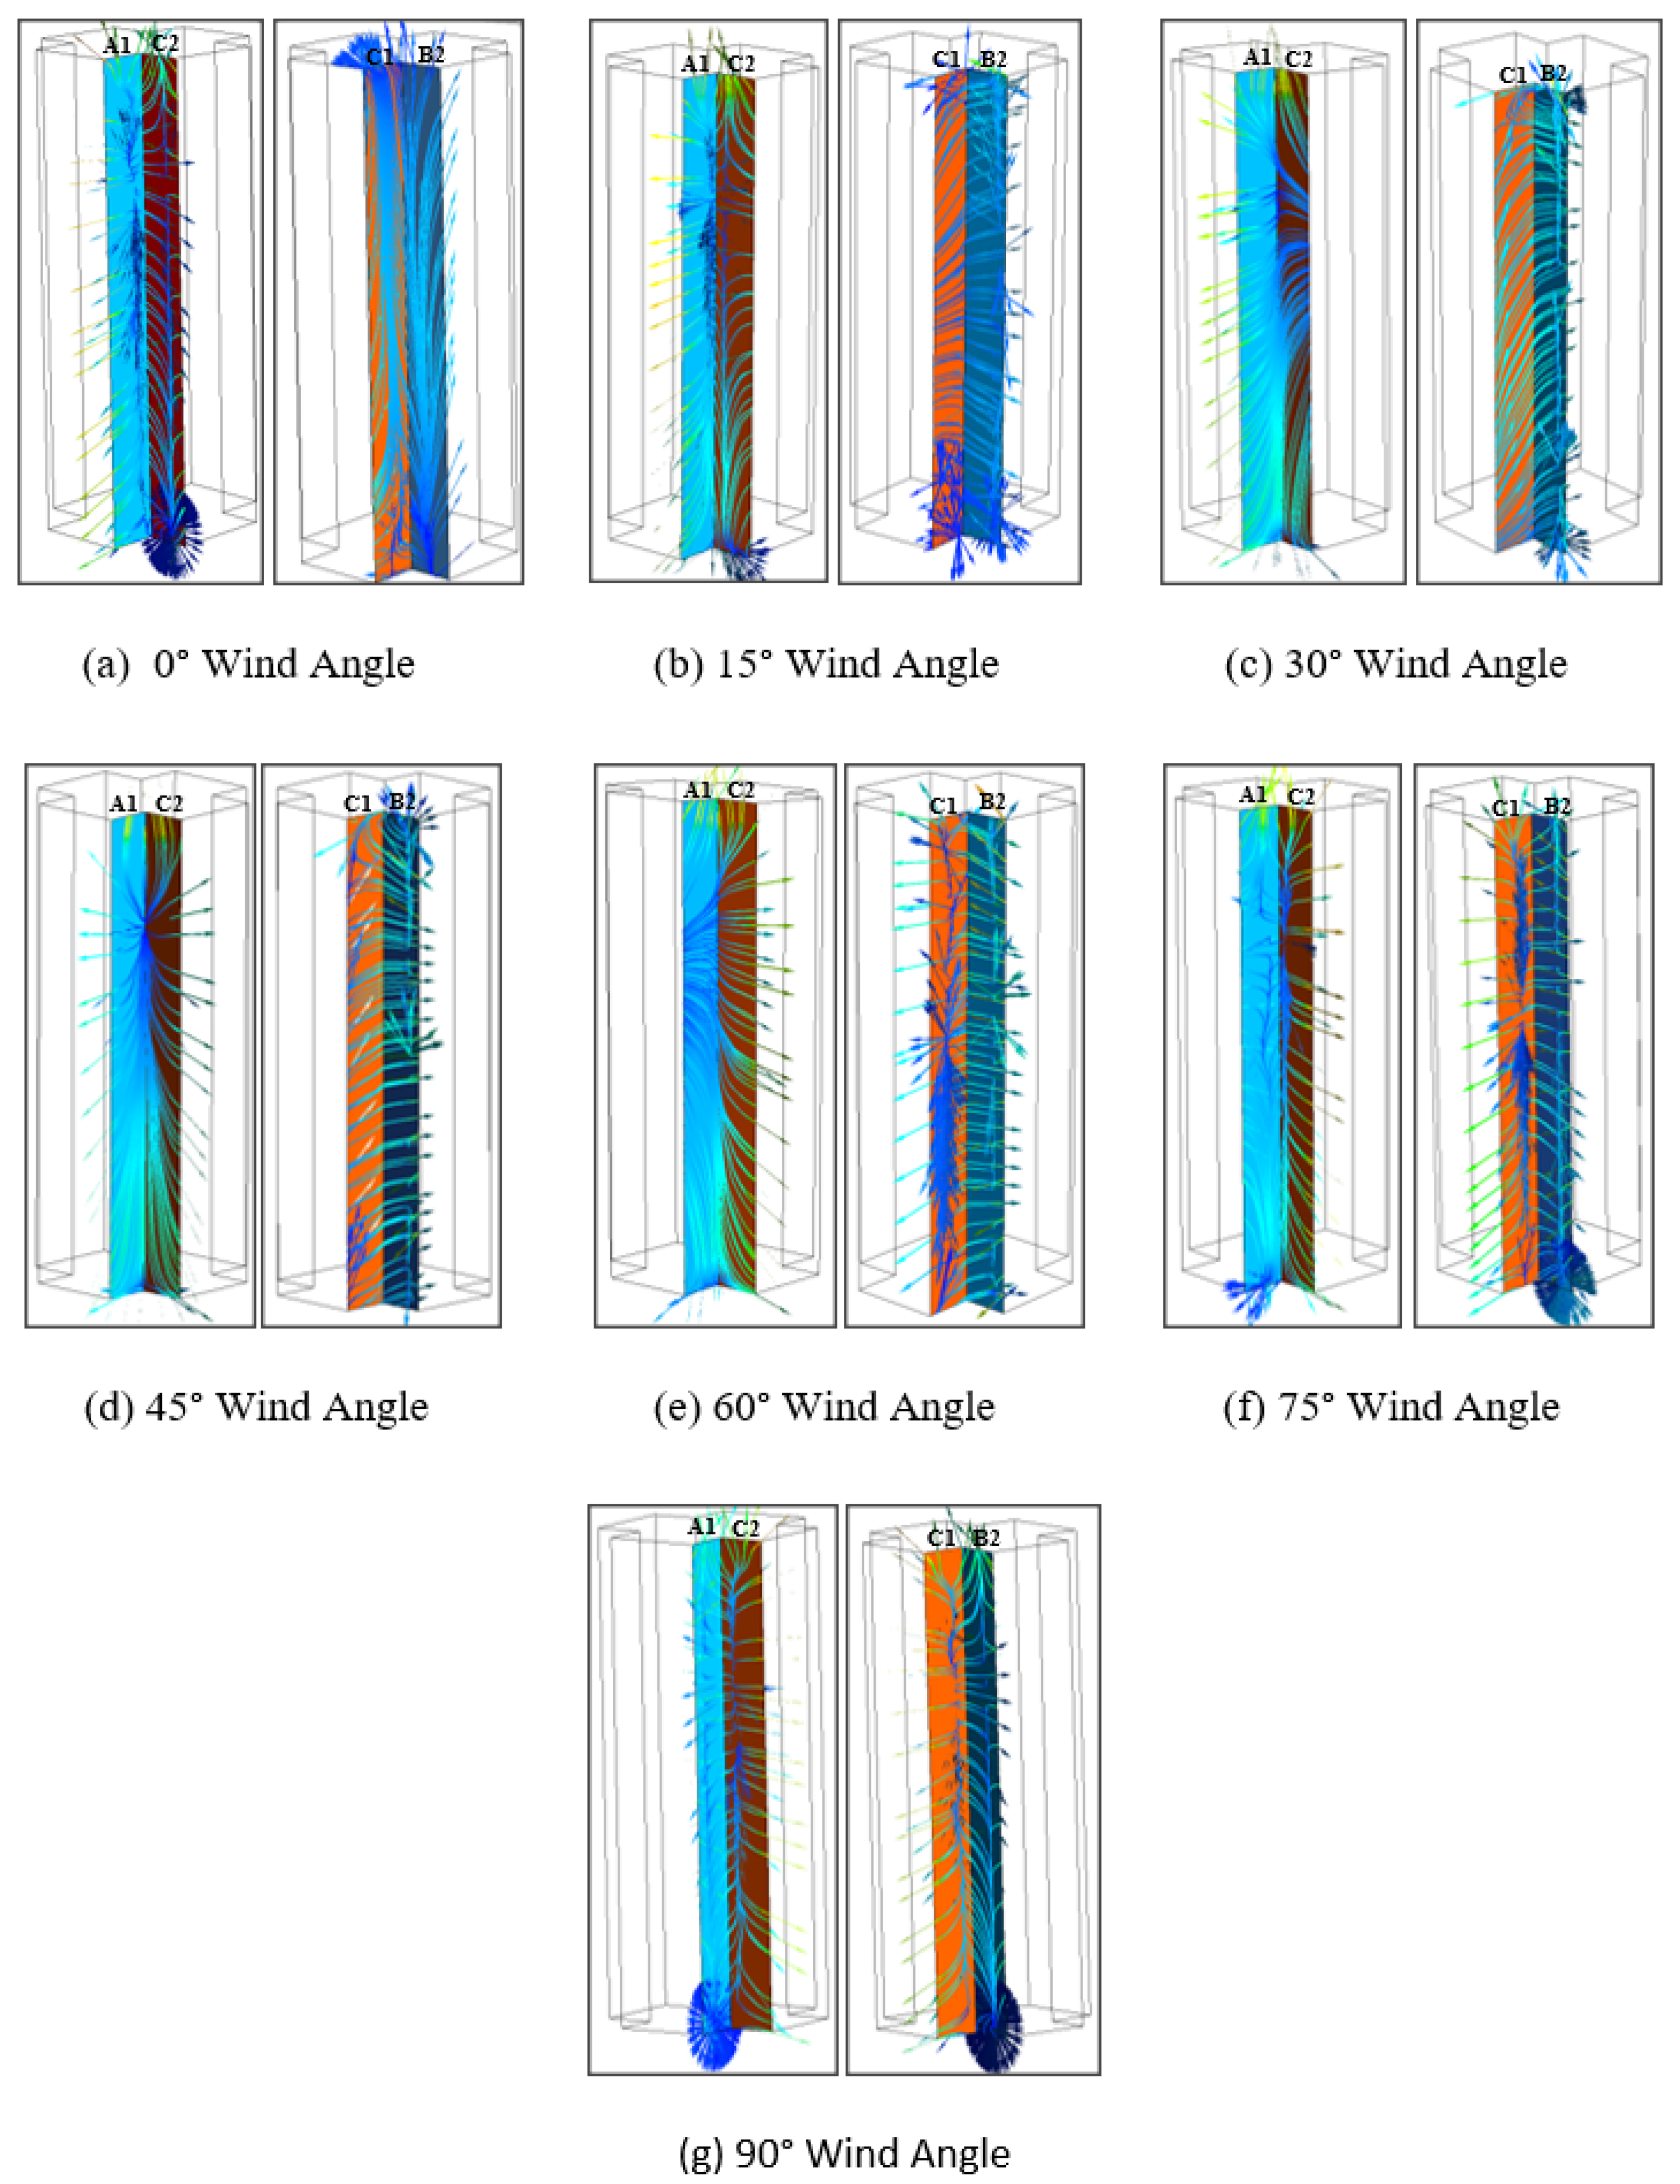
The analysis of wind effects on the model revealed intriguing patterns owing to its inherent symmetry about both axes. A focused examination of corner faces A1–C2 and B2–C1, considering extended wind attack angles ranging from 0° to 90° at intervals of 15°, provided comprehensive insights into the impact of wind incident angles on these faces.
In Figure 10a–g, streamlines have been visually represented to elucidate the flow dynamics on these faces. At a wind angle of 0°, the wind impinges on the near edge of face C2, subsequently striking the outer edge of face A1, which acts as the leading edge facing the wind directly. Simultaneously, face A1 reflects the wind onto side face C2, generating a downwash that gives rise to a small vortex at the bottom of face C2. Notably, backwash effects on both faces B2 and C1 are observable. The streamline originating from face B2 reflects onto face C1, with the predominant flow escaping from the rooftop of face C1.
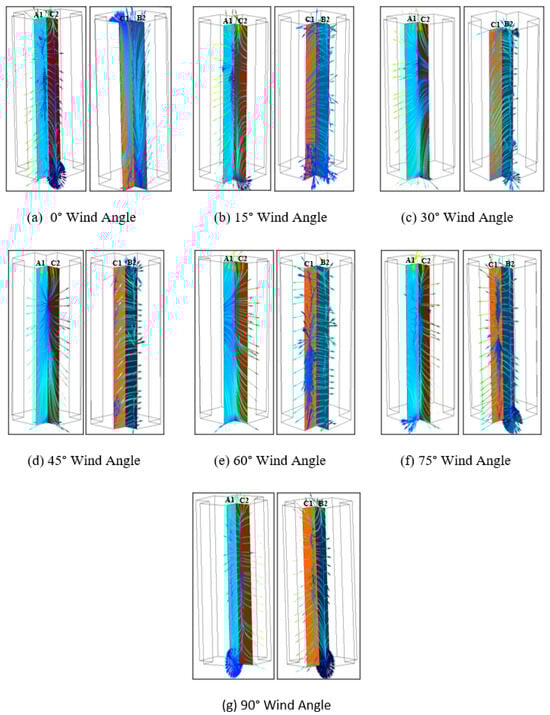
Figure 10.
Streamlines on re-entrant corner faces.
As the wind angle increases to 15°, a distinctive separation of flow occurs from the leading edge of face A1. The stagnation of flow along the height now takes place on face A1, closer to the corner than observed at a 0° wind angle. Additionally, a frail vortex, similar to the one generated at a 0° wind angle, is discernible at the bottom of face C2. These observations underscore the intricate variations in flow patterns and vortices, emphasizing the sensitivity of the model’s response to changes in wind incident angles. Such detailed insights contribute significantly to our understanding of the aerodynamic behavior of the model under varying wind conditions.
The backwash from the wake creates a recirculation cavity after striking face C1. At a 30° wind incidence angle, flow separation occurs from the leading edge of face C2 and reflects on face A1 before the separation occurs at the outer edge of face A1. The stagnation concentration is seen at the middle height. No ground level vortex is seen. In the corner of faces B2 and C1, cavity recirculation is more prominent than at a 15° wind angle with a small vortex at the bottom of face B2. At a 45° wind angle, the flow stagnation is at the corner of faces A1 and C2. The upwash and downwash zones are more prominent, with almost no stagnation zone. No upwind vortex is created at ground level. At the corner of faces B2 and C1, the downwash from the wake is striking both faces. At a 60° wind angle, the flow after striking the near end of face A1 revolves into the corner and leaves from the outer edge of face C2. In the corner of faces B2 and C1, the flow creates a concentration of upwash near the lower part of face C1. The circulation cavity is also seen in this re-entrant corner. At a 75° wind angle, the wind is impinging on face C2 and reflecting on face A1, creating a small vortex at the bottom of face A1. At the corner of faces B2 and C1, wind is striking on face C1 and reflecting on face B2, creating a small vortex at the bottom of face B2. At a 90° wind angle, both the corners are on the windward side. Wind stagnation on faces C1 and C2 takes place, reflecting on faces B2 and A1, respectively, separating from the respective leading edges of their faces.
7.2. Pressure/Pressure Coefficient on Re-Entrant Faces
7.2.1. Minimum, Maximum, and Mean
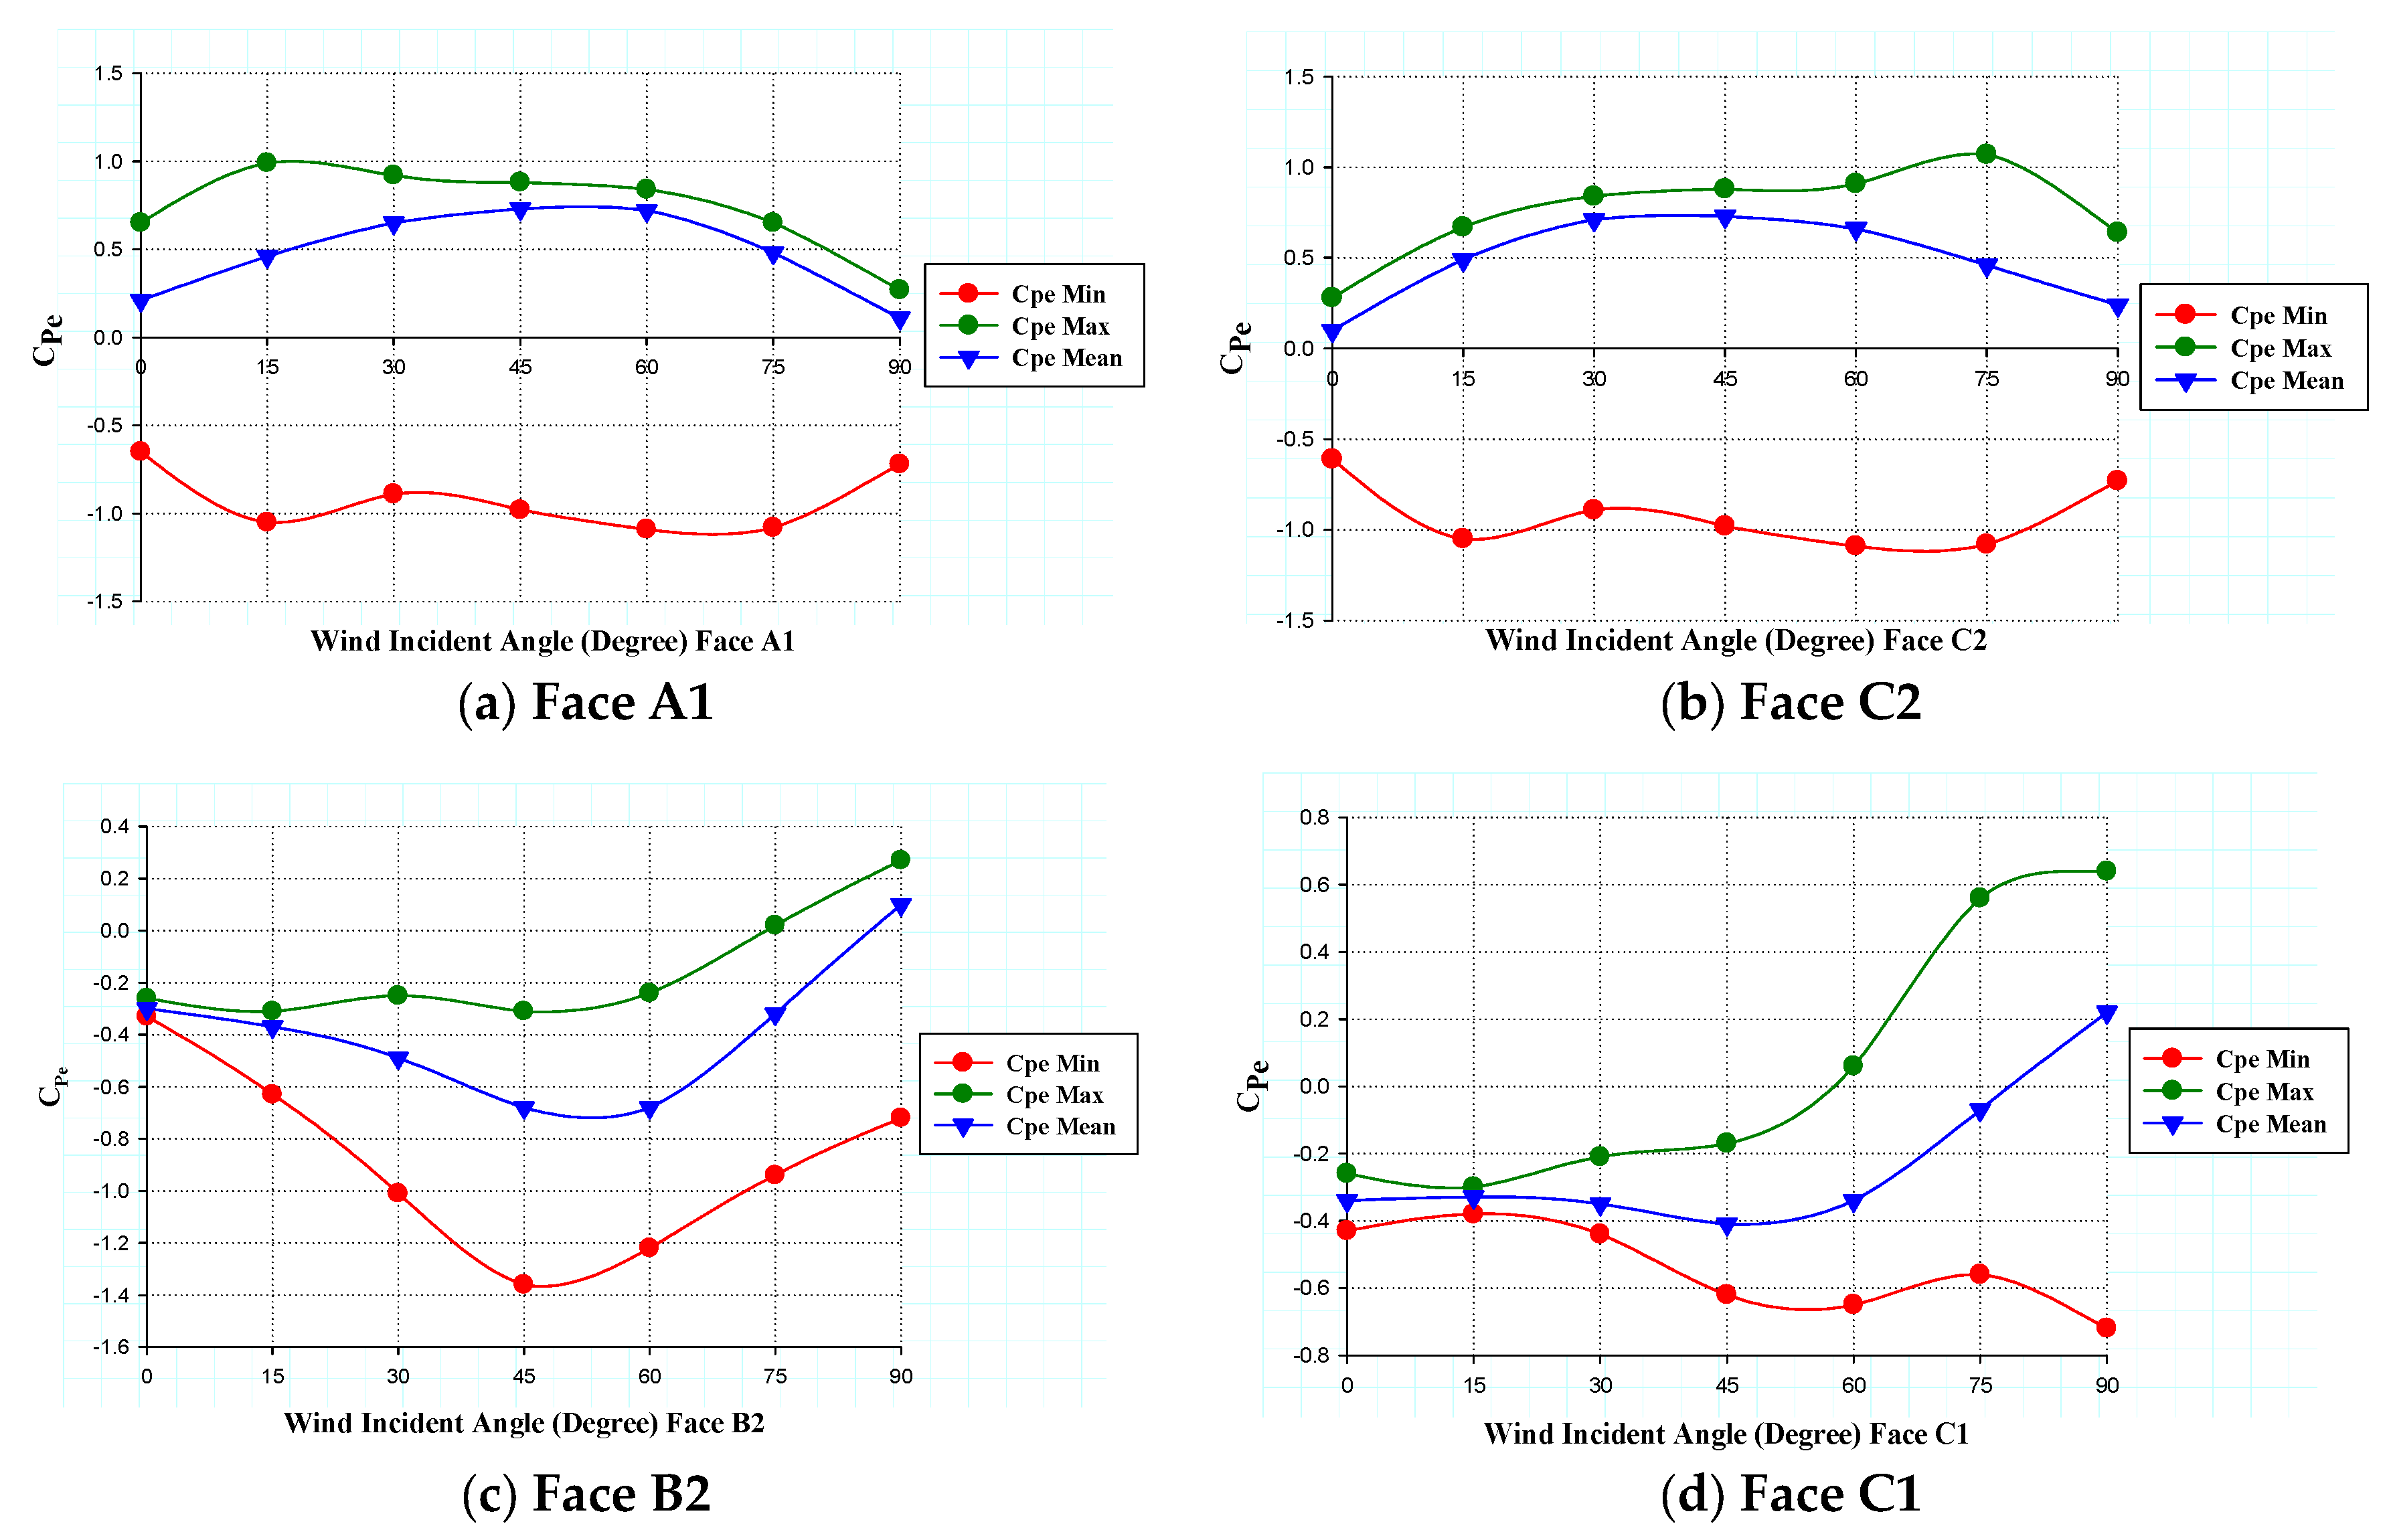
The variation in the minimum, maximum, and area average value of on different re-entrant corner faces (A1, C2, B2 & C1) is shown in Figure 11a–d for 0° to 90° at a 15° wind angle. For faces A1 and C2, the minimum value of ) for all the wind angles is almost the same. The maximum value of ) on these faces varies with the wind angles. The maximum is at a 45° wind angle. For faces B2 and C1, the minimum on face B2 is at 45°, and on face C1, it is at a 90° wind angle. The maximum values on these faces are at a 90° wind incident angle for the respective faces. The maximum face-averaged values are also at 90° for the respective faces.
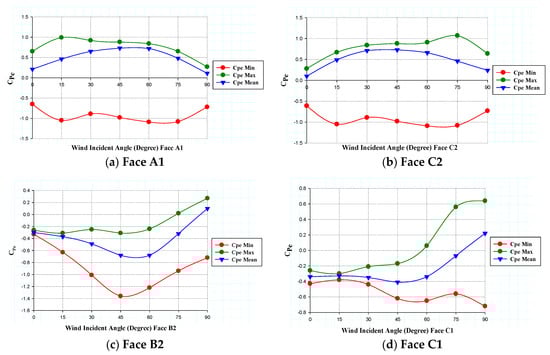
Figure 11.
Variation in on re-entrant faces with wind angle.
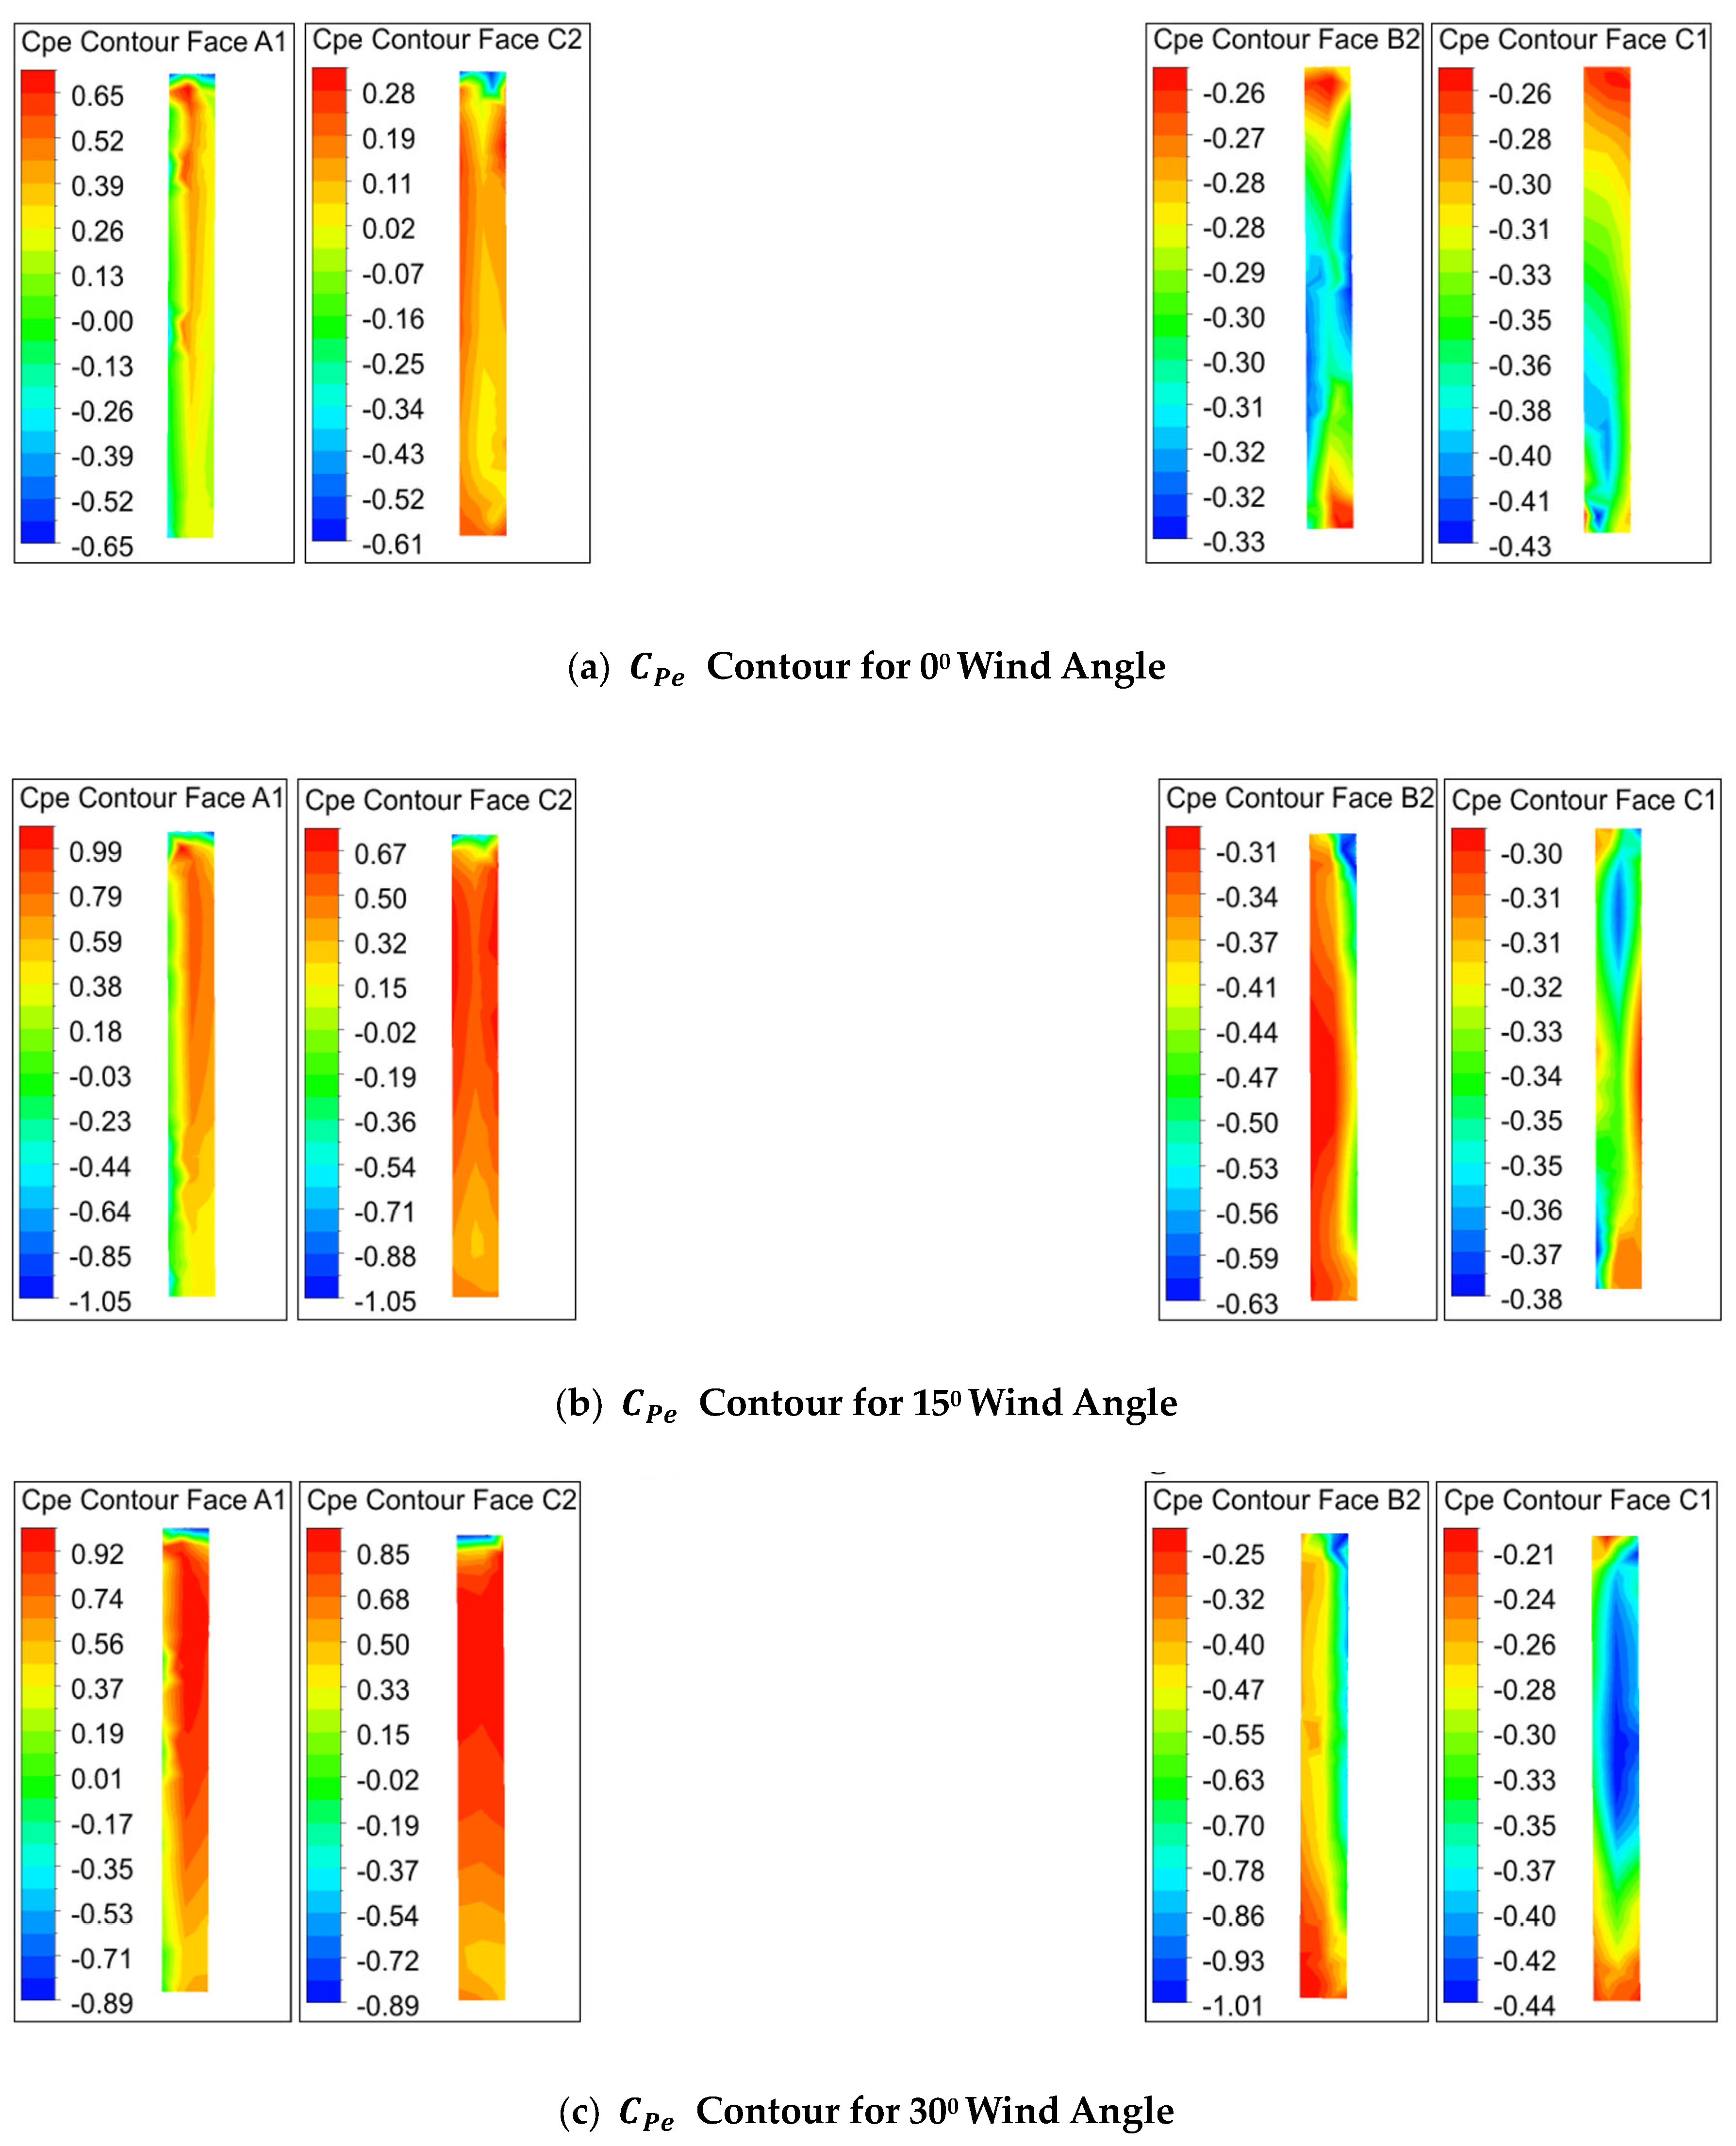
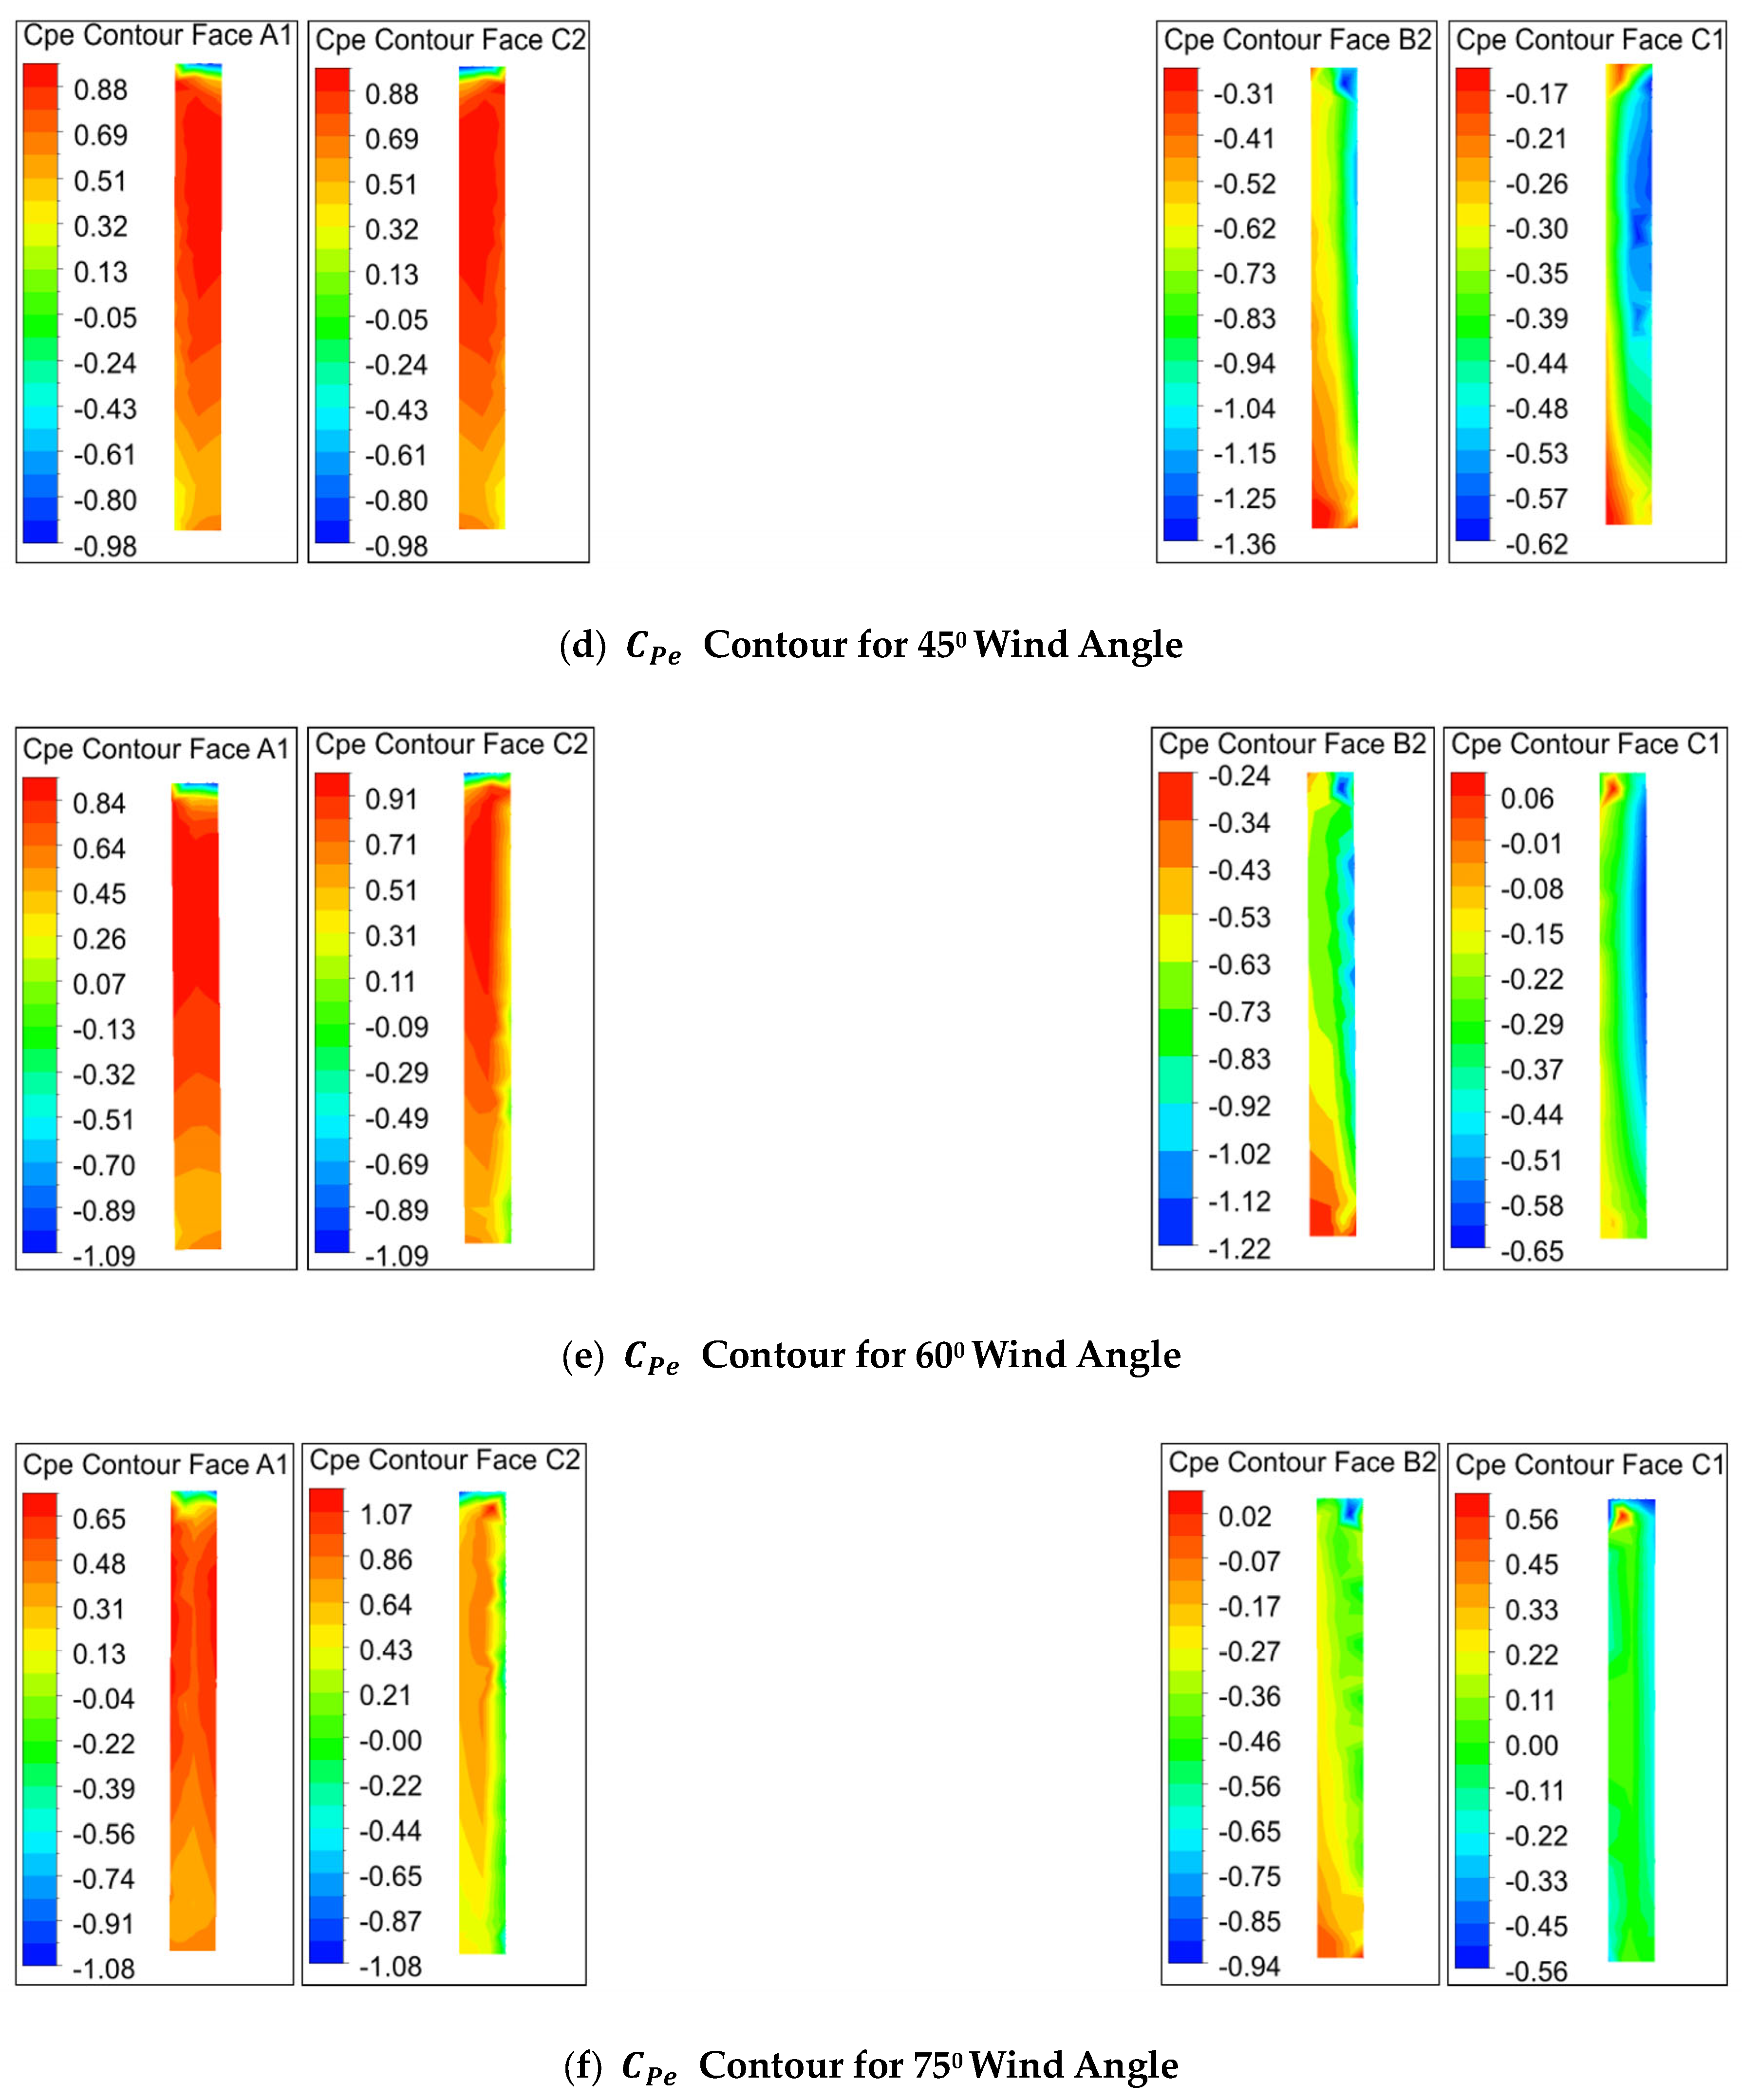
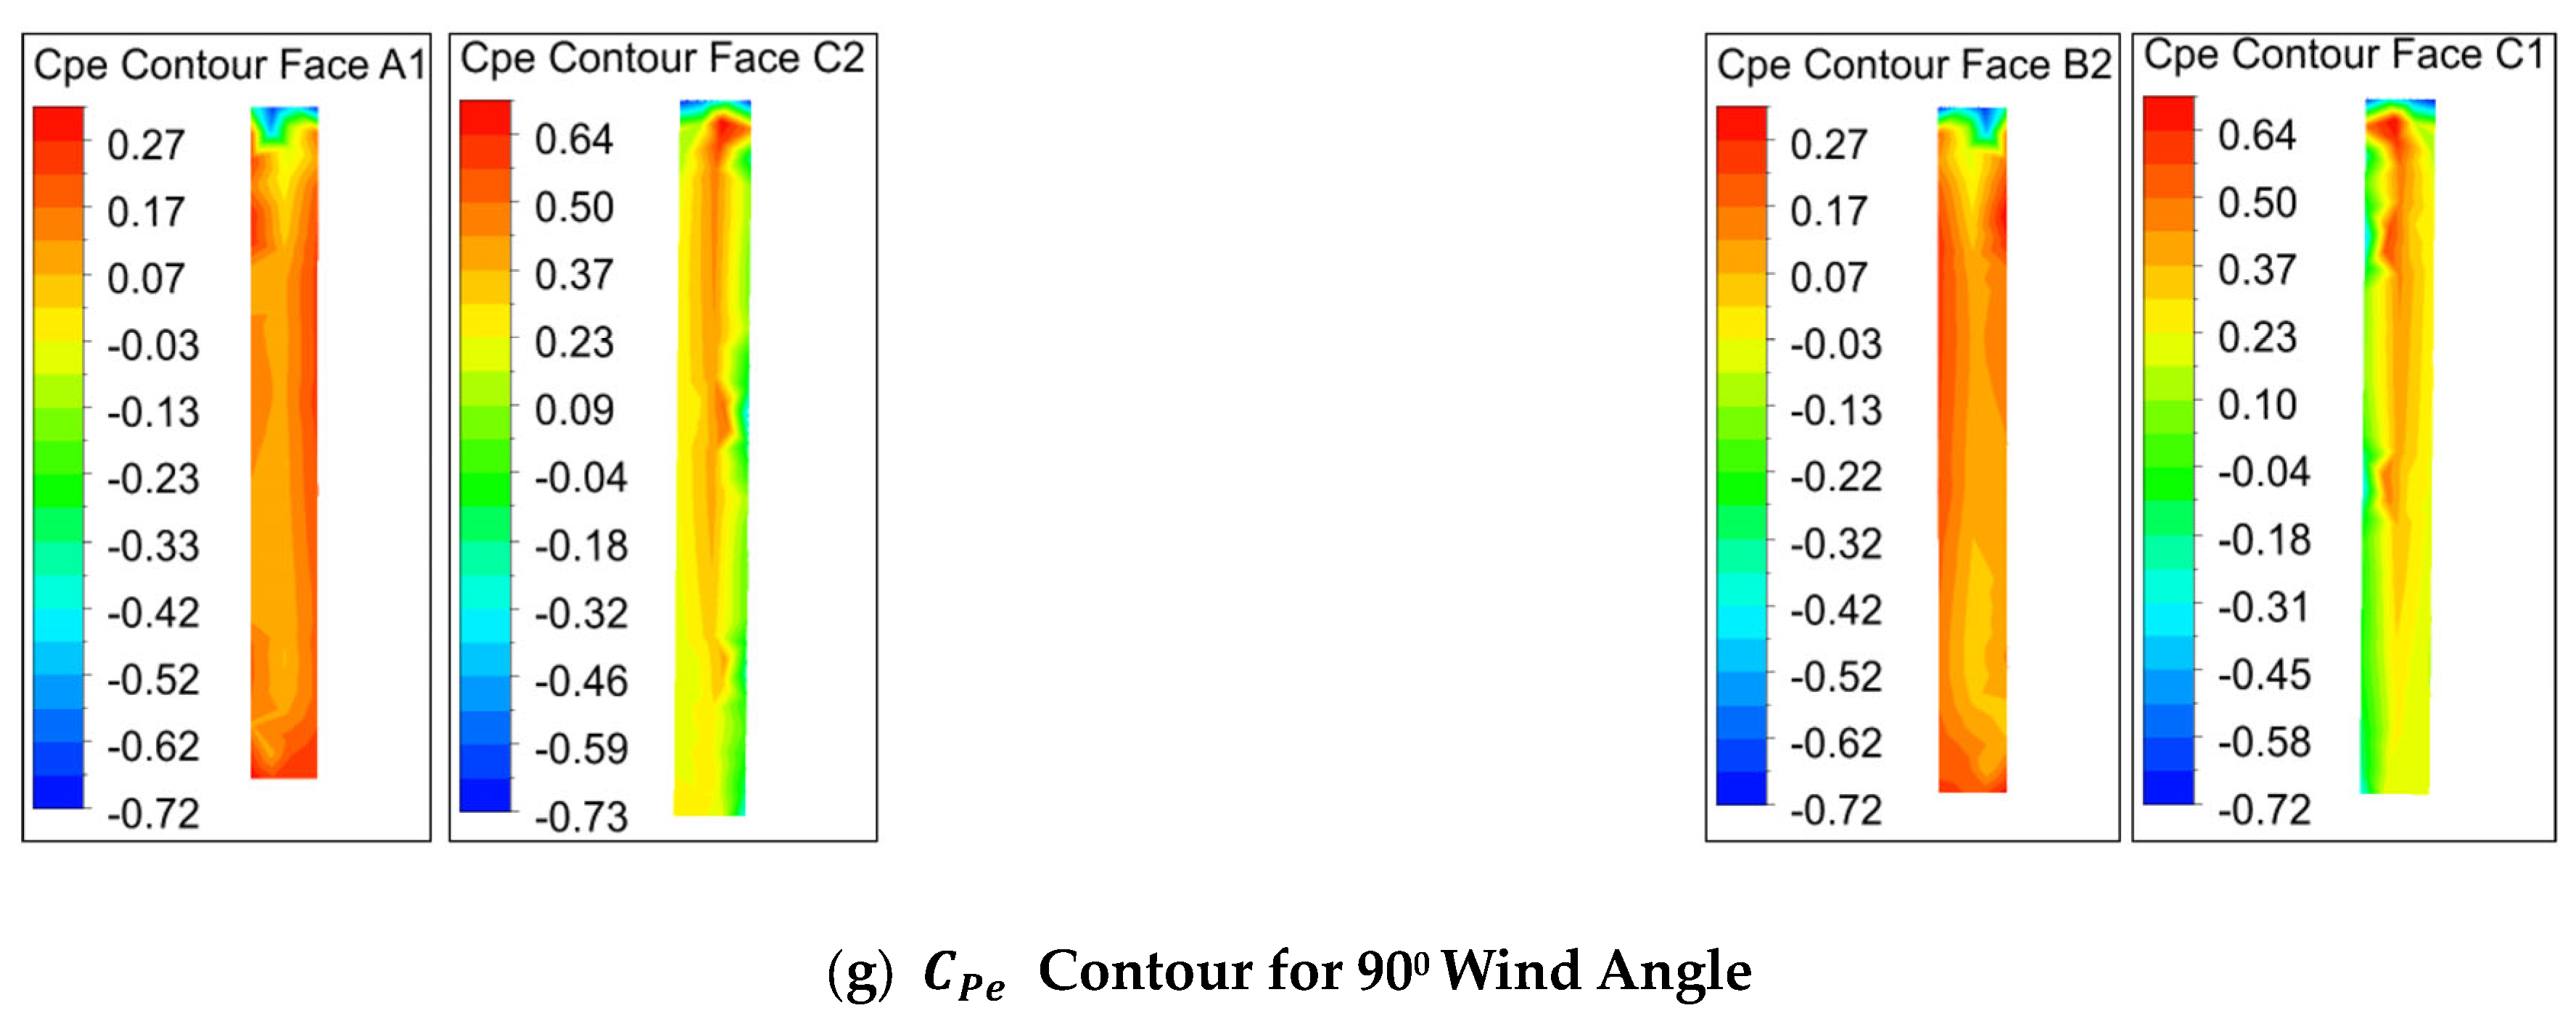
7.2.2. Contours
The contours on these faces are shown in Figure 12a–g. At a 0° wind incident angle, face A1, being in the upwind direction, predominantly faces positive pressure, with negative pressure at the top corners. The positive pressure is predominant towards the outer edge of face A1, with high positive pressure forming near the top. Unlike the rectangular model, where side faces are subjected to negative pressure, face C2 faces positive pressure due to the interference effect from face A1. The pressure is concentrated towards the re-entrant corner.
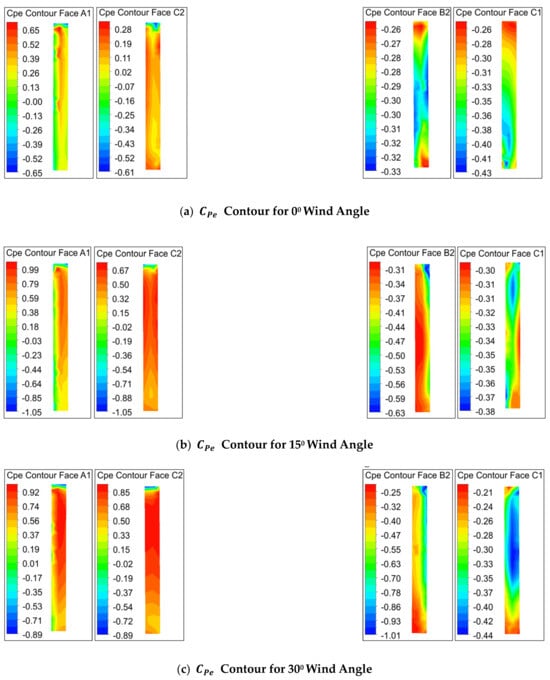
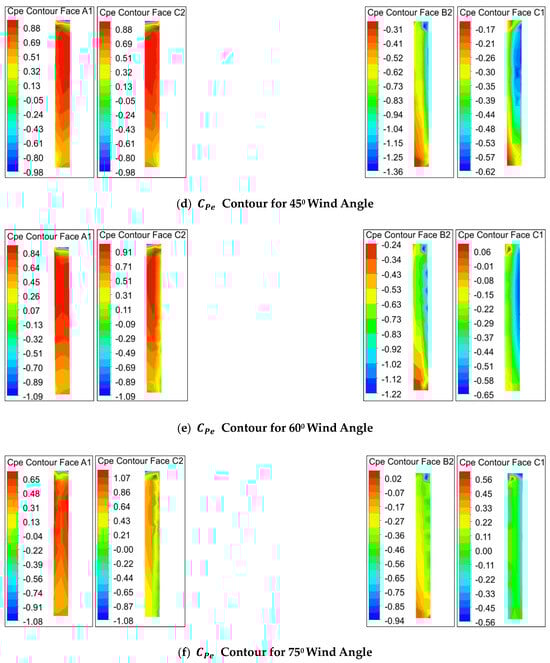

Figure 12.
contour for different wind incidence angles.
Negative pressure is seen in a small zone near the top. From a 0° to 30° wind angle, varies on these faces on the same outline as discussed above. At a 45° wind angle, both the faces facing the direct wind encounter the same pressure pattern on their faces, with a maximum value on the faces. From 60° to 90°, the pressure patterns on these faces are interchanged with each other, as is the case with the wind angle from 30° to 0°. On the downwind side, face B2 is under negative pressure of an almost uniform nature. The concentration of maximum negative pressure is observed at the bottom, near the outer edge of face B2, and at the top, near the re-entrant corner. Pressure on face C1 is concentrated towards the top at the re-entrant corner. Unlike the re-entrant corner faces A1 and C2, which are facing positive pressure from a 0° to 90° wind angle, being on the windward side, the pressure on faces B2 and C1 changes, as the surfaces are facing the wake region. The pressure then changes to the side faces and then to the windward side due to the change in wind direction. The effects of local eddies in the form of a concentration of colors are observed on the faces due to high turbulence and micro-level vortices.
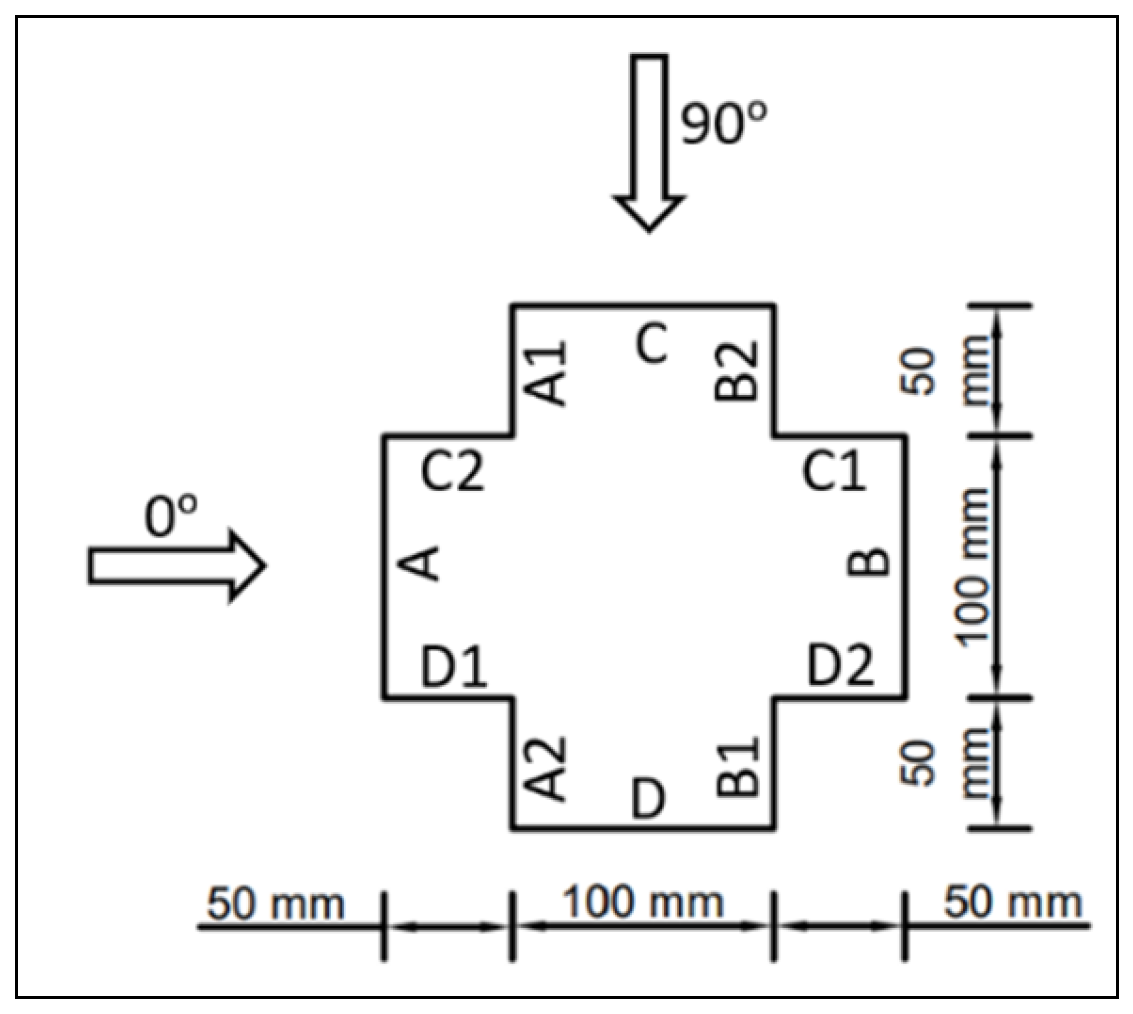
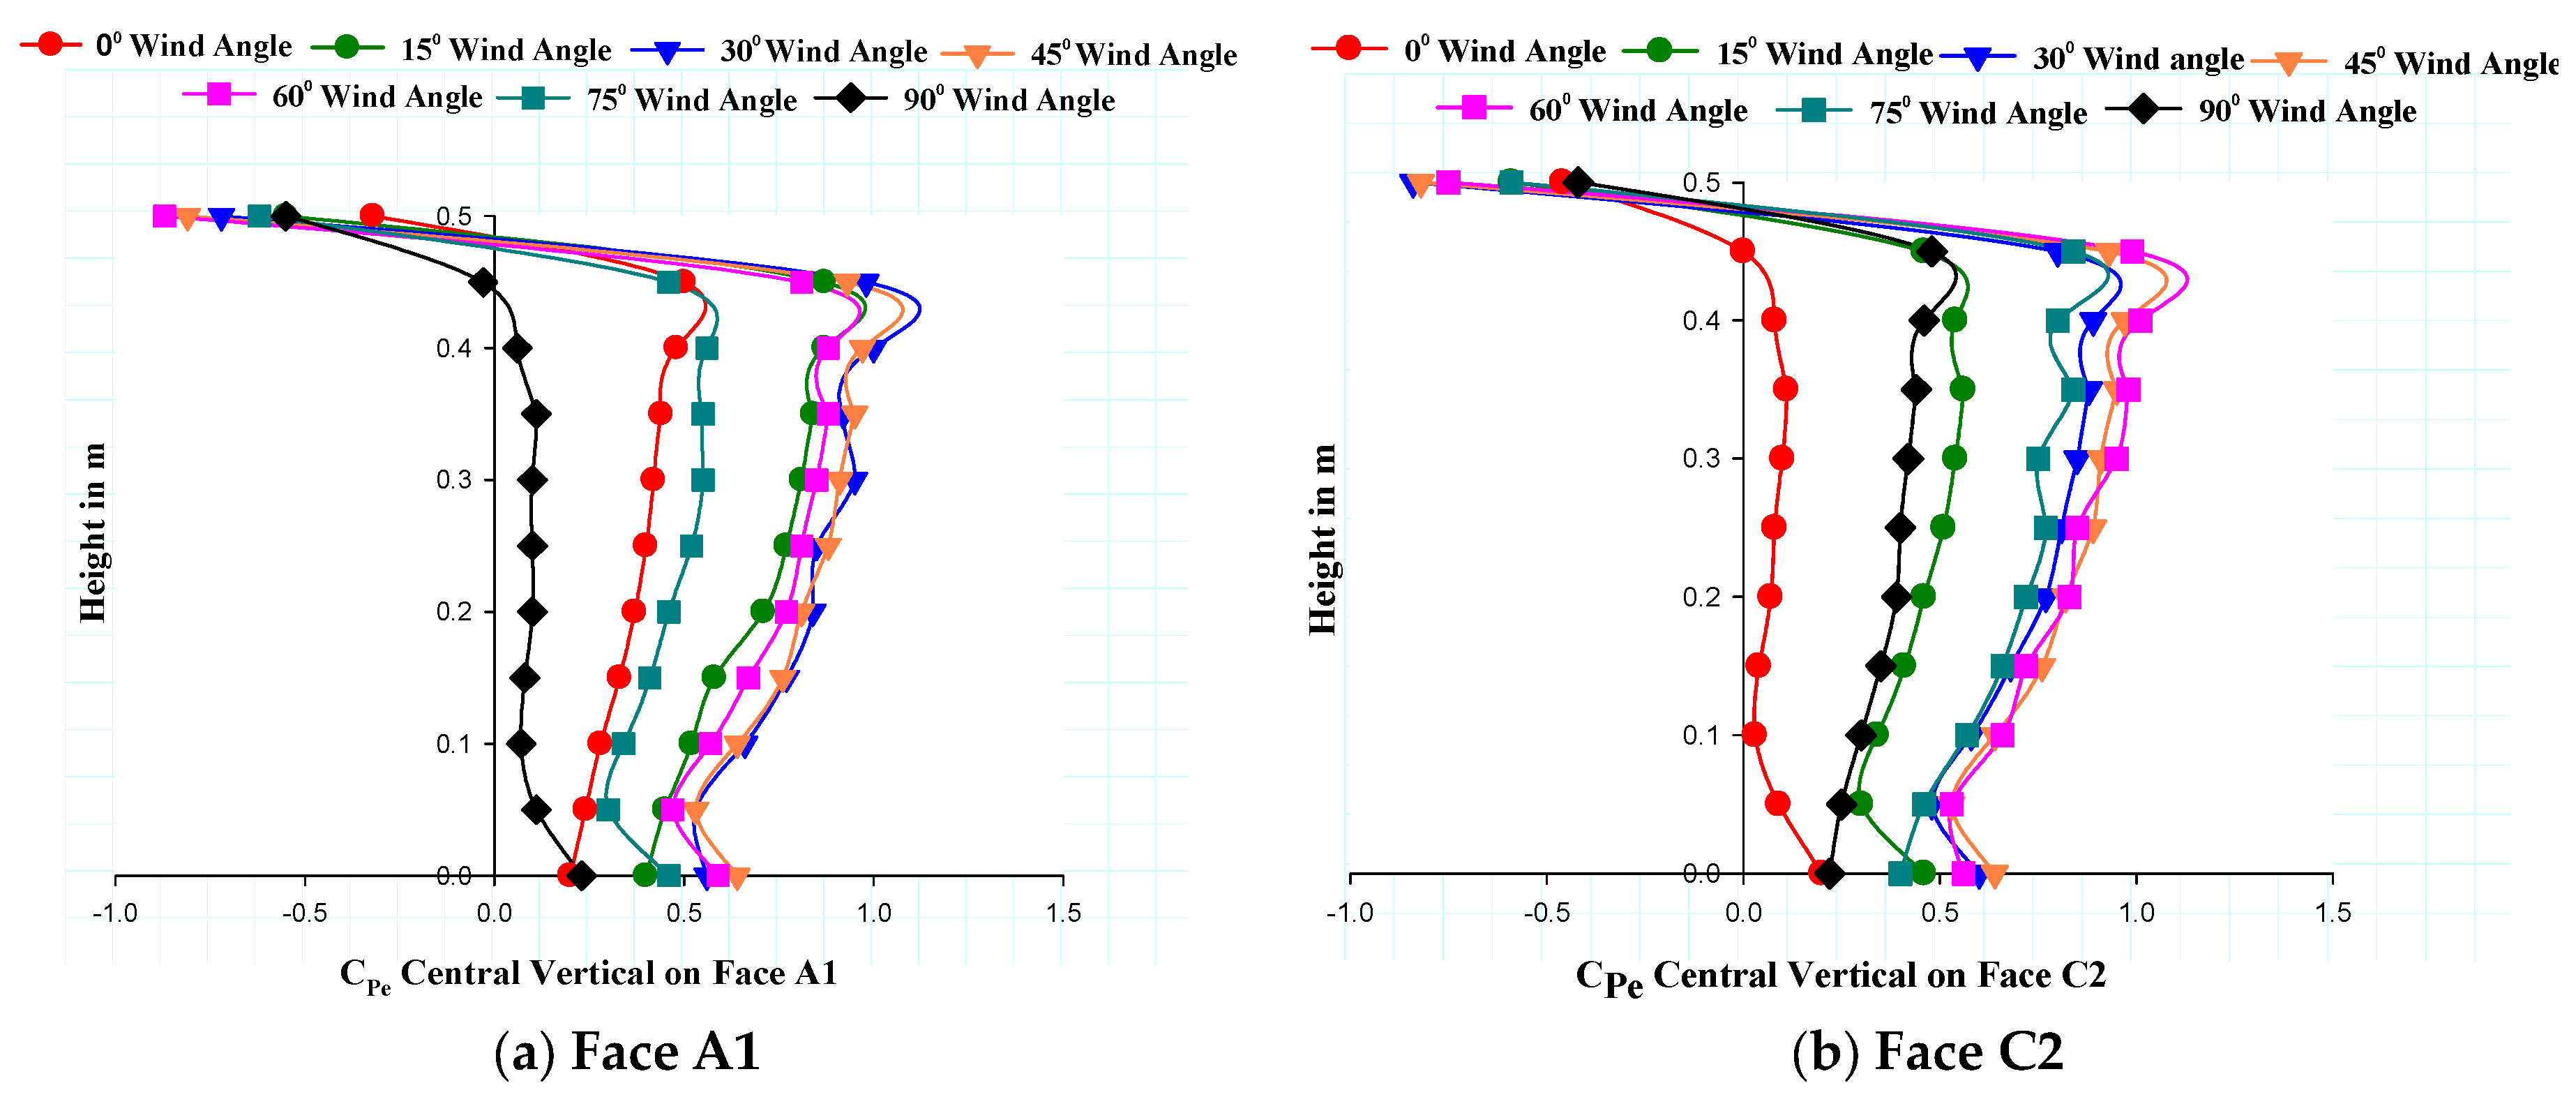
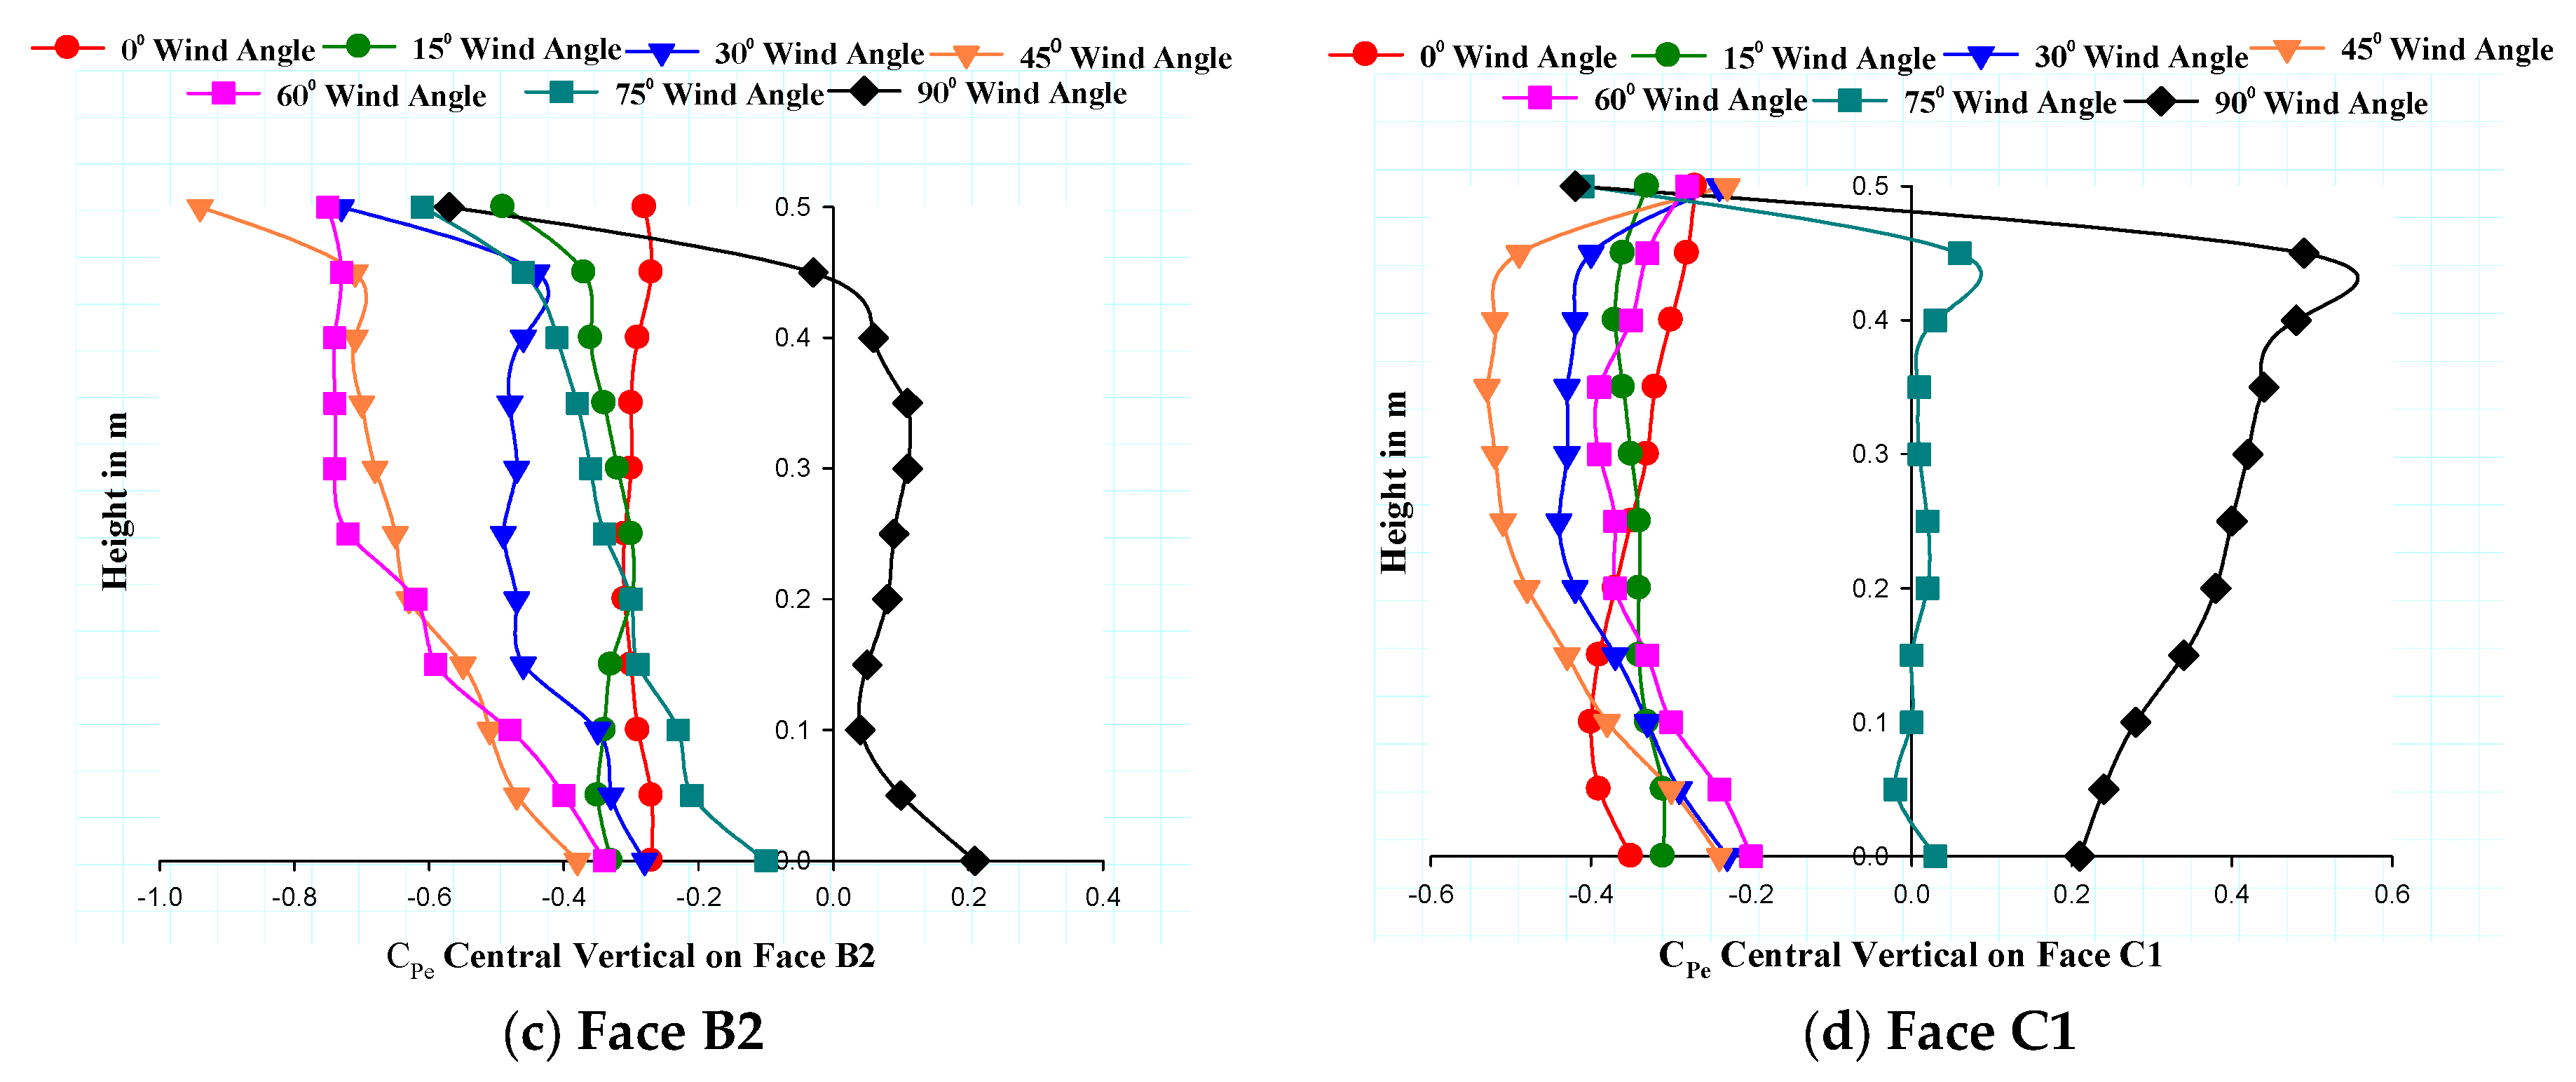
7.2.3. Central Vertical on Faces
Figure 13a–d shows on the central vertical line on faces A1, C2, B2, and C1. Positive pressure exists on the face exposed to direct wind. It can be observed that faces A1 and C2 are experiencing positive pressure for all the wind angles from 0° to 90°. On face A1, very minute variations in values are observed for wind angles of 15°, 30°, 45°, and 60°. However, on face C2, minimum variations are seen at 30°, 45°, 60°, and 75° wind angles. On faces B1 and C2, the central vertical pressure is mostly negative, except at a wind angle of 90°. The same observation is seen on face C1, except that at a wind angle of 75°, it is almost zero throughout the height.
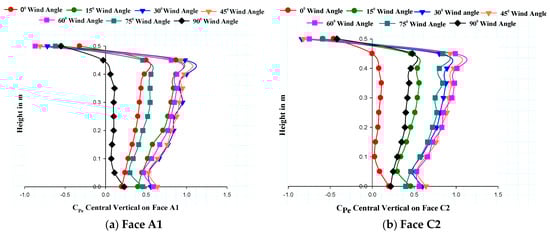
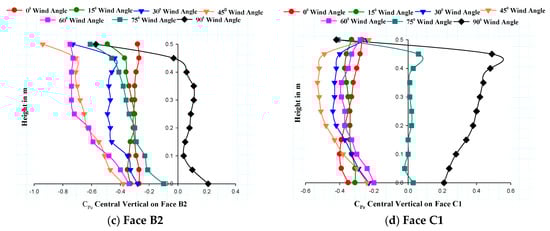
Figure 13.
variation along central vertical line for wind angles.
The study presents the results of detailing pressure distribution and wind flow patterns in both vertical and plan orientations, offering practical insights for architects and structural designers. Various techniques including openings are explored to mitigate wind effects on a large, tall building model with an irregular, plus-shaped cross-sectional plan configuration. Utilizing the numerical method of ANSYS CFX, the investigation spans wind incidence angles from 0° to 90° at an interval of 15°. The various findings reveal valuable insights such as identical pressure on symmetrical faces. Streamlines illustrate vortex sizes, highlighting phenomena like flow reattachment in the building’s plan shape. Vertical pressure distribution along the centerline of faces aids structural designers in re-entrant corner dimension selection. The results are graphically presented for flow lines, vertical pressure distribution, and pressure contours across different wind angles.
8. Conclusions
The present research study is valuable in investigating the effect of wind on plus-shaped buildings, emphasizing the significance of different wind incidence angles that vary from 0° to 90° at an interval of 15°. The present study is performed on a re-entrant corner of a tall building using the numerical technique of ANSYS CFX, and a few of the important outcomes from the study are as follows:
- The study observed a substantial influence of wind incidence angles on the corner faces of plus plan-shaped buildings in terms of the variations in pressure on these faces for different wind incidence angles.
- The height of the building and the relative length of dimensions of the wing faces are crucial factors affecting the pressure distribution on these faces. These factors are significant for designing cladding units and necessitate consideration by design engineers.
- The simulation results demonstrate good agreement, especially for wind directions orthogonal to the building’s faces; some differences are noted for other wind angles due to the wind’s complex, anisotropic, unsteady, three-dimensional flow behavior.
- The influence of streamlines in the bottom portion of the structure is relatively minimal in contrast to the upper portion, which also exhibits robust vortices, particularly noticeable within wind angles varying from 0° to 30°.
- The vortices remain relatively consistent in size and intensity for both the top and bottom portions of the building model in the 45° wind incidence angle.
- In the case of tall buildings featuring re-entrant corners, the investigation uncovered a significant stagnation zone at a wind incidence angle of 30°, located at the mid-height of the building model. Under these conditions, there was observable flow separation emanating from the leading edge.
- At a wind incidence angle of 75°, a re-circulation cavity was noticeable at the re-entrant corner of the building. The vortices’ size on the re-entrant corner was found to be constant for wind angles of 0° and 90°.
- Architects can leverage the observed data for ventilation planning, and structural designers can use them for precise wind load analysis, enhancing the accuracy of engineering calculations and decision making.
Author Contributions
Conceptualization, A.K. and R.K.M.; Methodology, A.K., R.K.M. and R.R.; Software, A.K., R.K.M. and R.R.; Validation, R.R.; Formal analysis, A.K. and R.K.M.; Resources, M.I.K. and J.M.K.; Writing—original draft, A.K. and R.K.M.; Writing—review and editing, R.R., R.K.M., M.I.K. and J.M.K.; Supervision, R.R. All authors have read and agreed to the published version of the manuscript.
Funding
The authors extend their appreciation to the Researcher Supporting Project, number (RSPD2023R692), King Saud University, Riyadh, Kingdom of Saudi Arabia.
Data Availability Statement
Data are contained within the article.
Acknowledgments
The authors extend their appreciation to the Researcher Supporting Project, number (RSPD2023R692), King Saud University, Riyadh, Kingdom of Saudi Arabia.
Conflicts of Interest
The authors declare no conflict of interest.
References
- Rizzo, F.; Sepe, V.; Sabbà, M.F. Investigation of the Pressure Coefficients Correlation Field for Low-Rise Building Roofs. Appl. Sci. 2022, 12, 10790. [Google Scholar] [CrossRef]
- Sari, D.P.; Cho, K.P. Performance Comparison of Different Building Shapes Using a Wind Tunnel and a Computational Model. Buildings 2022, 12, 144. [Google Scholar] [CrossRef]
- Yan, B.; Li, Y.; Li, X.; Zhou, X.; Wei, M.; Yang, Q.; Zhou, X. Wind Tunnel Investigation of Twisted Wind Effect on a Typical super-tall building. Buildings 2022, 12, 2260. [Google Scholar] [CrossRef]
- Ivánková, O.; Hubová, O.; Macák, M.; Vojteková, E.; Konečná, L.B. Wind Pressure Distribution on the Façade of Stand-Alone Atypically Shaped High-Rise Building Determined by CFD Simulation and Wind Tunnel Tests. Designs 2022, 6, 77. [Google Scholar] [CrossRef]
- IS: 875 (2015); Indian Standard Design Loads (other than Earthquake) for Buildings and Structures-Code of Practice, Part 3 (Wind Loads). Bureau of Indian Standards: New Delphi, India, 2015.
- Code of Practice on Wind Effects in Hong King 2019; Building Authority: Hong Kong, China, 2019.
- ASCE: 7-16 (2017); Minimum Design Loads and Associated Criteria for Buildings and Other Structures. Structural Engineering Institute of the American Society of Civil Engineering: Reston, VA, USA, 2017. [CrossRef]
- ASCE: 49-12 (2012); Wind Tunnel Testing for Buildings and Other Structures. Structural Engineering Institute of the American Society of Civil Engineering: Reston, VA, USA, 2012. Available online: www.asce.org/pubs (accessed on 11 December 2023).
- AS/NZS-1170.2 (2002); Structural Design Actions, Part-2: Wind Actions. Standards Australia: Sydney, NSW, Australia; Standards New Zealand: Wellington, New Zealand, 2002.
- ES ISO 4354 (2012); Wind Actions on Structures, vol. 2012. ISO: Geneva, Switzerland, 2012; (English). Available online: http://scholar.google.com/scholar?start=10&q=asi+interface&hl=es&as_sdt=0,5#6 (accessed on 11 December 2023).
- EN: 1991-1-4; Eurocode-1: Actions on Structures-Part 1–4: General Actions-Wind Actions. Management Centre: Brussels, Belgium, 2010.
- Kim, B.; Yuvraj, N.; Preethaa, K.R.S.; Hu, G.; Lee, D.-E. Wind-Induced Pressure Prediction on Tall Buildings Using Generative Adversarial Imputation Network. Sensors 2021, 21, 2515. [Google Scholar] [CrossRef] [PubMed]
- Gomes, M.G.; Rodrigues, A.M.; Mendes, P. Experimental and numerical study of wind pressures on irregular-plan shapes. J. Wind. Eng. Ind. Aerodyn. 2005, 93, 741–756. [Google Scholar] [CrossRef]
- Mendis, P.; Ngo, T.; Haritos, N.; Hira, A.; Samali, B.; Cheung, J. Wind Loading on Tall Buildings. EJSE Load. Struct. 2007, 7, 51–54. [Google Scholar] [CrossRef]
- Fu, J.Y.; Li, Q.S.; Wu, J.R.; Xiao, Y.Q.; Song, L.L. Field measurements of boundary layer wind characteristics and wind-induced responses of super-tall buildings. J. Wind. Eng. Ind. Aerodyn. 2008, 96, 1332–1358. [Google Scholar] [CrossRef]
- Tanaka, H.; Tamura, Y.; Ohtake, K.; Nakai, M.; Kim, Y.C.; Bandi, E.K. Experimental Investigation of Aerodynamic Forces and Wind Pressure Acting on Tall Buildings with Various Unconventional Configuration. J. Wind. Eng. Aerodyn. 2013, 107, 179–191. [Google Scholar] [CrossRef]
- Amin, J.A.; Ahuja, A.K. Effects of Side Ratio on Wind-Induced Pressure Distribution on Rectangular Buildings. J. Struct. 2013, 2013, 1–12. [Google Scholar] [CrossRef]
- Bhattacharyya, B.; Dalui, S.K.; Ahuja, A.K. Wind Induced Pressure on ‘E’ Plan Shaped Tall Buildings. Jordan J. Civ. Eng. 2014, 8, 120–134. Available online: https://www.researchgate.net/publication/264548132 (accessed on 11 December 2023).
- Yi, J.; Li, Q.S. Wind tunnel and full-scale study of wind effects on a super-tall building. J. Fluids Struct. 2015, 58, 236–253. [Google Scholar] [CrossRef]
- Mukherjee, A.; Bairagi, A.K. Wind Pressure and Velocity Pattern Around ‘N’ Plan Shape Tall Building—A Case Study. Asian J. Civil Eng. 2017, 18, 1241–1258. [Google Scholar]
- Mallick, M.; Mohanta, A.; Kumar, A.; Raj, V. Modelling of Wind Pressure Coefficients on C-Shaped Building Models. Model. Simul. Eng. 2018, 2018, 1–13. [Google Scholar] [CrossRef]
- Sanyal, P.; Dalui, S.K. Effects of side ratio for ‘Y’ plan shaped tall building under wind load. Build. Simul. 2021, 14, 1221–1236. [Google Scholar] [CrossRef]
- Mallick, M.; Mohanta, A.; Kumar, A. Multivariate adaptive regression spline approach to the assessment of surface mean pressure coefficient on surfaces of C-shaped building. Sci. Iran. 2020, 27, 2967–2984. [Google Scholar] [CrossRef]
- Chakraborty, S.; Dalui, S.K.; Ahuja, A.K. Experimental Invstigation of Surface Pressure on ‘+’ Plan Shape Tall Building. Jordan J. Civ. Eng. 2014, 8, 251–261. [Google Scholar]
- Jendzelovsky, N.; Antal, R. CFD and experimental study of wind pressure distribution on the high-rise building in the shape of an equilateral acute triangle. Fluids 2021, 6, 81. [Google Scholar] [CrossRef]
- You, J.; Lee, C. Experimental study on the effects of aspect ratio on the wind pressure coefficient of piloti buildings. Sustainability 2021, 13, 5206. [Google Scholar] [CrossRef]
- ANSYS Inc. ANSYS CFX-Solver Theory Guide. 2009. Available online: http://www.ansys.com (accessed on 11 December 2023).
- ASCE. Manuals and Reports on Engineering Practice No. 67. In Wind Tunnel Studies of Buildings and Structures; ASCE: Reston, VA, USA, 1999. [Google Scholar] [CrossRef]
- Franke, J. Impact of Wind and Storm on City Life and Built Environment. Recommendation on the Use of CFD in Wind. Eng. COST Action C14 on the Use of CFD in Predicting Pedestrian Wind Environment. 2004, pp. 1–12. Available online: https://www.jstage.jst.go.jp/article/jawe1982/2006/108/2006_108_529/_pdf (accessed on 11 December 2023).
- Revuz, J.; Hargeaves, D.M.; Owen, J.S. On the Domain Size for the Steady State CFD Modeling of a Tall Building. Wind. Struct. 2012, 15, 313–329. [Google Scholar] [CrossRef]


Disclaimer/Publisher’s Note: The statements, opinions and data contained in all publications are solely those of the individual author(s) and contributor(s) and not of MDPI and/or the editor(s). MDPI and/or the editor(s) disclaim responsibility for any injury to people or property resulting from any ideas, methods, instructions or products referred to in the content. |
© 2023 by the authors. Licensee MDPI, Basel, Switzerland. This article is an open access article distributed under the terms and conditions of the Creative Commons Attribution (CC BY) license (https://creativecommons.org/licenses/by/4.0/).