Article

DNN-Based Estimation of the Maximum Lateral Flange Moments of Horizontally Curved I-Girder Bridges

1
School of Civil, Environmental & Architectural Engineering, Korea University, Seongbuk-gu, Seoul 02481, Republic of Korea
2
Future and Fusion Laboratory of Architectural, Civil and Environmental Engineering, Korea University, Seongbuk-gu, Seoul 02481, Republic of Korea
*
Author to whom correspondence should be addressed.
Buildings 2023, 13(2), 317; https://doi.org/10.3390/buildings13020317
Submission received: 29 November 2022 / Revised: 10 January 2023 / Accepted: 14 January 2023 / Published: 20 January 2023

Abstract

:
Horizontally curved I-girder bridges are known to be complex. Bending and torsion forces are imposed on the bridges owing to their shapes with initial curvatures. This torsion is a combination of pure and warping forces. The horizontally curved I-girder is significantly affected by warping behavior, which decreases the bending rigidity of its member. To investigate the warping behavior of the horizontally curved I-girder bridges a finite element analysis (FEA) must be performed. In this study, an FEA was performed to investigate the warping torsional behavior of a horizontally curved I-girder bridge, and a structural response database was obtained. Based on the database, the least absolute shrinkage and selection operator was employed to select features affecting the warping behavior. Subsequently, deep neural network models were trained with selected features for an input layer and maximum lateral flange moment data for an output layer. Several models were constructed and compared according to the number of hidden layers and neurons, and the model with the highest performance was proposed. Finally, it was confirmed that the estimated lateral flange moments computed by the proposed model showed a good correlation with the FEA results.

1. Introduction

A horizontally curved I-girder bridge can be considered as a complex structure owing to the torsional behavior induced by its initial curvature. The basic difference in the structural behaviors between the horizontally curved and straight girders originates from this initial curvature. Bending and torsion forces act on the horizontally curved I-girder bridge, even when gravitational loading is applied. Torsion in horizontally curved bridges comprises pure torsion and warping torsion. In the case of an open cross-section, e.g., an I-type girder, the torsional rigidity is relatively small compared with that in a closed section. Therefore, the warping torsional behavior causes a decrease in the bending rigidity of the member of the girder. A horizontally curved I-girder bridge comprises two or more girders and a cross-frame that supports the girders considering the low torsional rigidity problem. As the cross-frame transfers the torsion of the girder to the bending of the cross-frame and reinforces the torsional rigidity of the girder, the cross-frame acts as the main load-carrying member in the horizontally curved girder [1]. Therefore, it is important to organize cross-frames to control the effect of warping on the design of horizontally curved bridges. The basic theory of the behavior of curved girders was presented by Venant (1843). Later, Timoshenko (1905) discovered the warping behavior of curved girders, and this theory was generalized and organized by Vlasov (1965). In 1980, AASHTO [2] published the Guide Specification for Horizontally Curved Highway Bridges, the first guideline for the design of horizontally curved bridges. Although the guideline suggests a method for calculating the strength of an I-girder, it was not adopted as an official design specification because the strength calculated with an infinite curvature was different from that of a straight girder. U.S. Steel [3] presented the V-load method, which is an approximate analysis method for horizontally curved I-girders. The V-load method analyzes horizontally curved bridges by applying equivalent loads caused by the curvature effect on the straight girder. This method has been used in the design of horizontally curved I-girder bridges as it includes simple calculations. In 1992, the FHWA initiated the Curved Steel Bridge Project (CSBRP) to study the behavior of horizontally curved flexural members to introduce the LRFD design concept. Various experiments and studies on the actual size of I-girder specimens have been performed; they significantly contributed to the calculation of the load-carrying capacity of horizontally curved girders. Design guidelines such as AASHTO [2] and HEPC Japan [4] suggest a simple upper limit for the stress ratio of warping and bending or the cross-frame spacing based on the V-load method. Davidson [1] proposed an approximate equation to determine appropriate cross-frame spacing based on a finite element analysis (FEA) and regression. However, owing to the limited analysis results, the equation possesses the problems of accuracy and multi-variable consideration. According to Hoffman [5], the V-load method helps designers understand the behavior of diaphragms and flanges; however, it is not suitable for the final design. Subsequently, as various experimental studies were conducted, AASHTO LRFD Design Specification [6], an integrated design standard for straight and curved girders, was published and has been continuously updated.
Meanwhile, various approaches using deep-learning algorithms have been implemented for the performance evaluation and damage detection of structures in the field of civil engineering. Oh et al. [7] researched and proposed an AI model that estimates the maximum stress in pipe design to save engineers’ time and effort by replacing the complicated structural analysis. They compared the estimation performance of several AI algorithms and confirmed that the neural network model had the highest performance. Min et al. [8] conducted a study to detect tendon damage in a submerged floating tunnel based on the dynamic response of a structure by applying a deep learning algorithm. Deep learning algorithms that predict or classify based on generated data exhibit high efficiency. This is because a horizontally curved bridge design is difficult to analyze using closed-form equations and requires a complex structural analysis. Various studies have been conducted on the application of deep learning algorithms to bridge engineering. Traditionally, visual inspection was performed to detect defects. However, this is time-consuming and labor-intensive. To overcome this problem, a structural health monitoring technique using DNN was proposed. DNNs are suitable for complex problems. With these advantages, research on applying DNNs to detect defects in numerical railway bridges was conducted by Shu et al. [9], and research on applying DNN to cable-stayed bridges was conducted by Zhou et al. [10]. In addition, in the field of design, research on the optimal design of reinforced concrete structures by applying deep learning was conducted by Jeong et al. [11].
As indicated in the literature review, FEAs using horizontally curved bridge models must be conducted to appropriately estimate warping torsional behavior. In this study, a model that can estimate the maximum lateral flange moment in horizontally curved bridges was proposed by using a deep neural network algorithm. The maximum lateral flange moment was obtained based on the structural analysis using FEA models designed within the practical design range according to the Korean design standard (2008). Subsequently, the least absolute shrinkage and selection operation (LASSO) regression was performed with design parameters as input data and maximum lateral flange moments as output data to select major features affecting warping torsional behavior. A comparison considering the input data before and after feature selection confirmed that the performance of the DNN models improved after feature selection using LASSO regression. Although there were no considerable differences in model performance, the training time reduced and memory efficiency improved, as the number of independent parameters was reduced. The input data of the neural network model were determined as the features selected by LASSO, and the output data were set as the maximum lateral flange moments. Subsequently, to build an optimal neural network architecture, its performance was evaluated by changing the number of neurons and layers, and the best estimation model was proposed. The best neural network model was compared and analyzed using the lateral flange moment equation proposed by AASHTO C4.6.1.2.4b [6]. The lateral flange moment estimated by the DNN algorithm demonstrated a better performance compared with those estimated by the simplified design equations based on AASHTO.

2. Design Codes for Horizontally Curved I-Girder Bridge

2.1. Limitations of Warping Torsional Behavior and Cross-Frame Spacing

To minimize the warping torsional behavior of horizontally curved I-girder bridges, recent design standards require adequate cross-frame spacing to limit the maximum warping-to-bending stress ratio. According to the AASHTO LRFD Bridge Design Specifications [12], the distance between the intermediate diaphragm and cross-frames of a horizontally curved I-girder bridge must satisfy the following conditions and in no case exceed 30 ft.
L b L r R 10 . L b = Unbraced   length   ( ft ) L r = Limiting   unbraced   length   ( ft ) R = Minimum   girder   radius   ( ft )
According to AASHTO LRFD design specification Section 6.7.4.2 [12], in the preliminary design stage of the curved I-shaped girder, the following formula can be used as a reference for design:
L b = 5 3 r σ R b f . b f = Flange   width   ( ft ) L b = Diaphragm   or   cross-frame   spacing   ( ft ) r σ = Desired   bending   stress   ratio   equal   to   | f l / f b u | R = Girder   radius   ( ft )
In a horizontally curved bridge, the diaphragm and cross-frame should be recognized as load transfer members (primary members) in contrast to the straight girder. According to the USS highway structure design handbook, the analysis of a horizontally curved I-girder bridge requires an approximate analysis technique, i.e., the V-load method.

2.2. V-Load Method

The V-load method is a simplified analysis method for calculating the moment and shear force of a horizontally curved I-shaped non-composite girder. It assumes that the bending moment is resisted by the flanges of the I-girder (Figure 1), and bracing elements act as rigid supports at the bracing point.
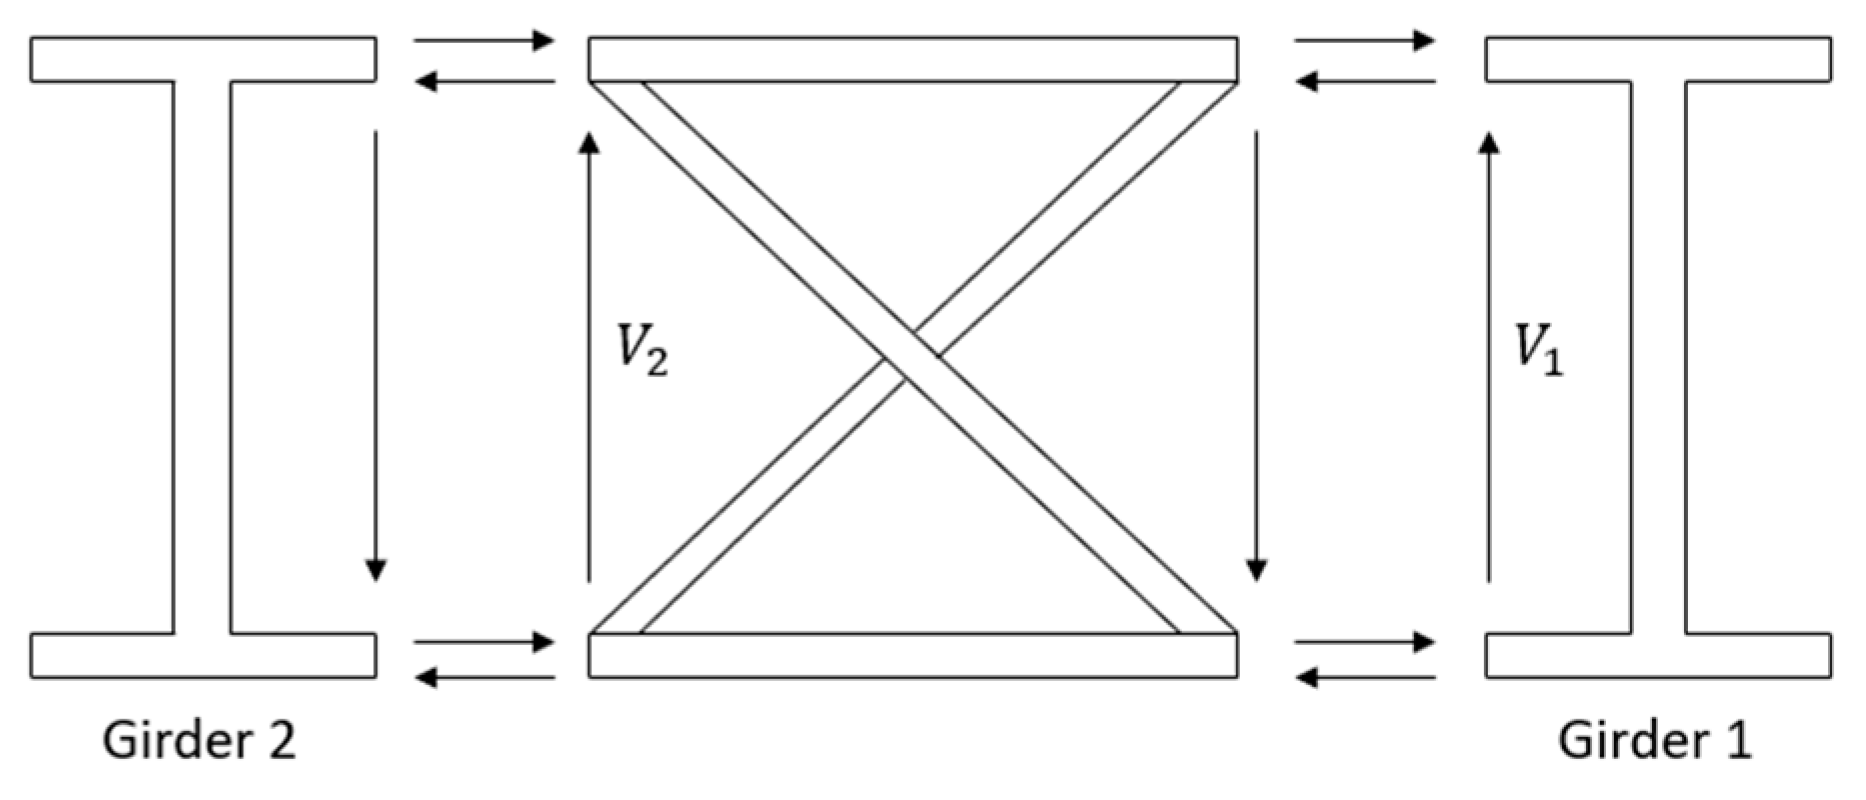
In a horizontally curved I-girder bridge, the normal bending stress of the flanges caused by the bending moment is separated into vertical and horizontal forces according to the curvature (Figure 2). In the case of the horizontal force, it is canceled owing to left–right symmetry; however, the vertical force acts as an additional force ( M h R d t ) on the element (Figure 2). The cross-frame acts as a primary load-transferring member and transfers an additional force from the girder to the adjacent girder.
As shown in Figure 3 and Figure 4, the additional force acting on the flange along the horizontal direction is transferred to the adjacent girder in the form of a shear force to satisfy the moment equilibrium. The shear forces shown in Figure 4 are known as V-loads. If they are applied to an equivalent straight beam, the complicated structural analysis process of the horizontally curved I-girder bridge can be omitted.
The V-load method is widely used as an intuitive approximation method for analyzing horizontally curved I-girder bridges. Based on the V-load method, AASHTO proposed equations to calculate cross-frame spacing and lateral flange moment. According to a 1969 survey, the V-load method was applied to 75% of the designs of horizontally curved I-girder bridges in the United States [3]. However, according to Hoffman (2013), the V-load method can be applied only near to the bracing point to compute the lateral flange moment caused by additional horizontal forces. Although it is useful to understand the basic behavior, it may not be accurate for the final design [5].
In addition, Baar (2007) conducted a study comparing the V-load method and FEM for positive and negative moments. The comparative analysis confirmed that the positive moments of the outer and inner girders demonstrated errors of 6.8% and 8.3%, respectively. Moreover, the negative moments of the outer and inner girders exhibited errors of 16.1% and 12%, respectively. It was suggested that the design of the curved girder should be based on structural analysis instead of a simplified equation [13].

3. Preparation of the Dataset for Horizontally Curved I-Girder Bridges

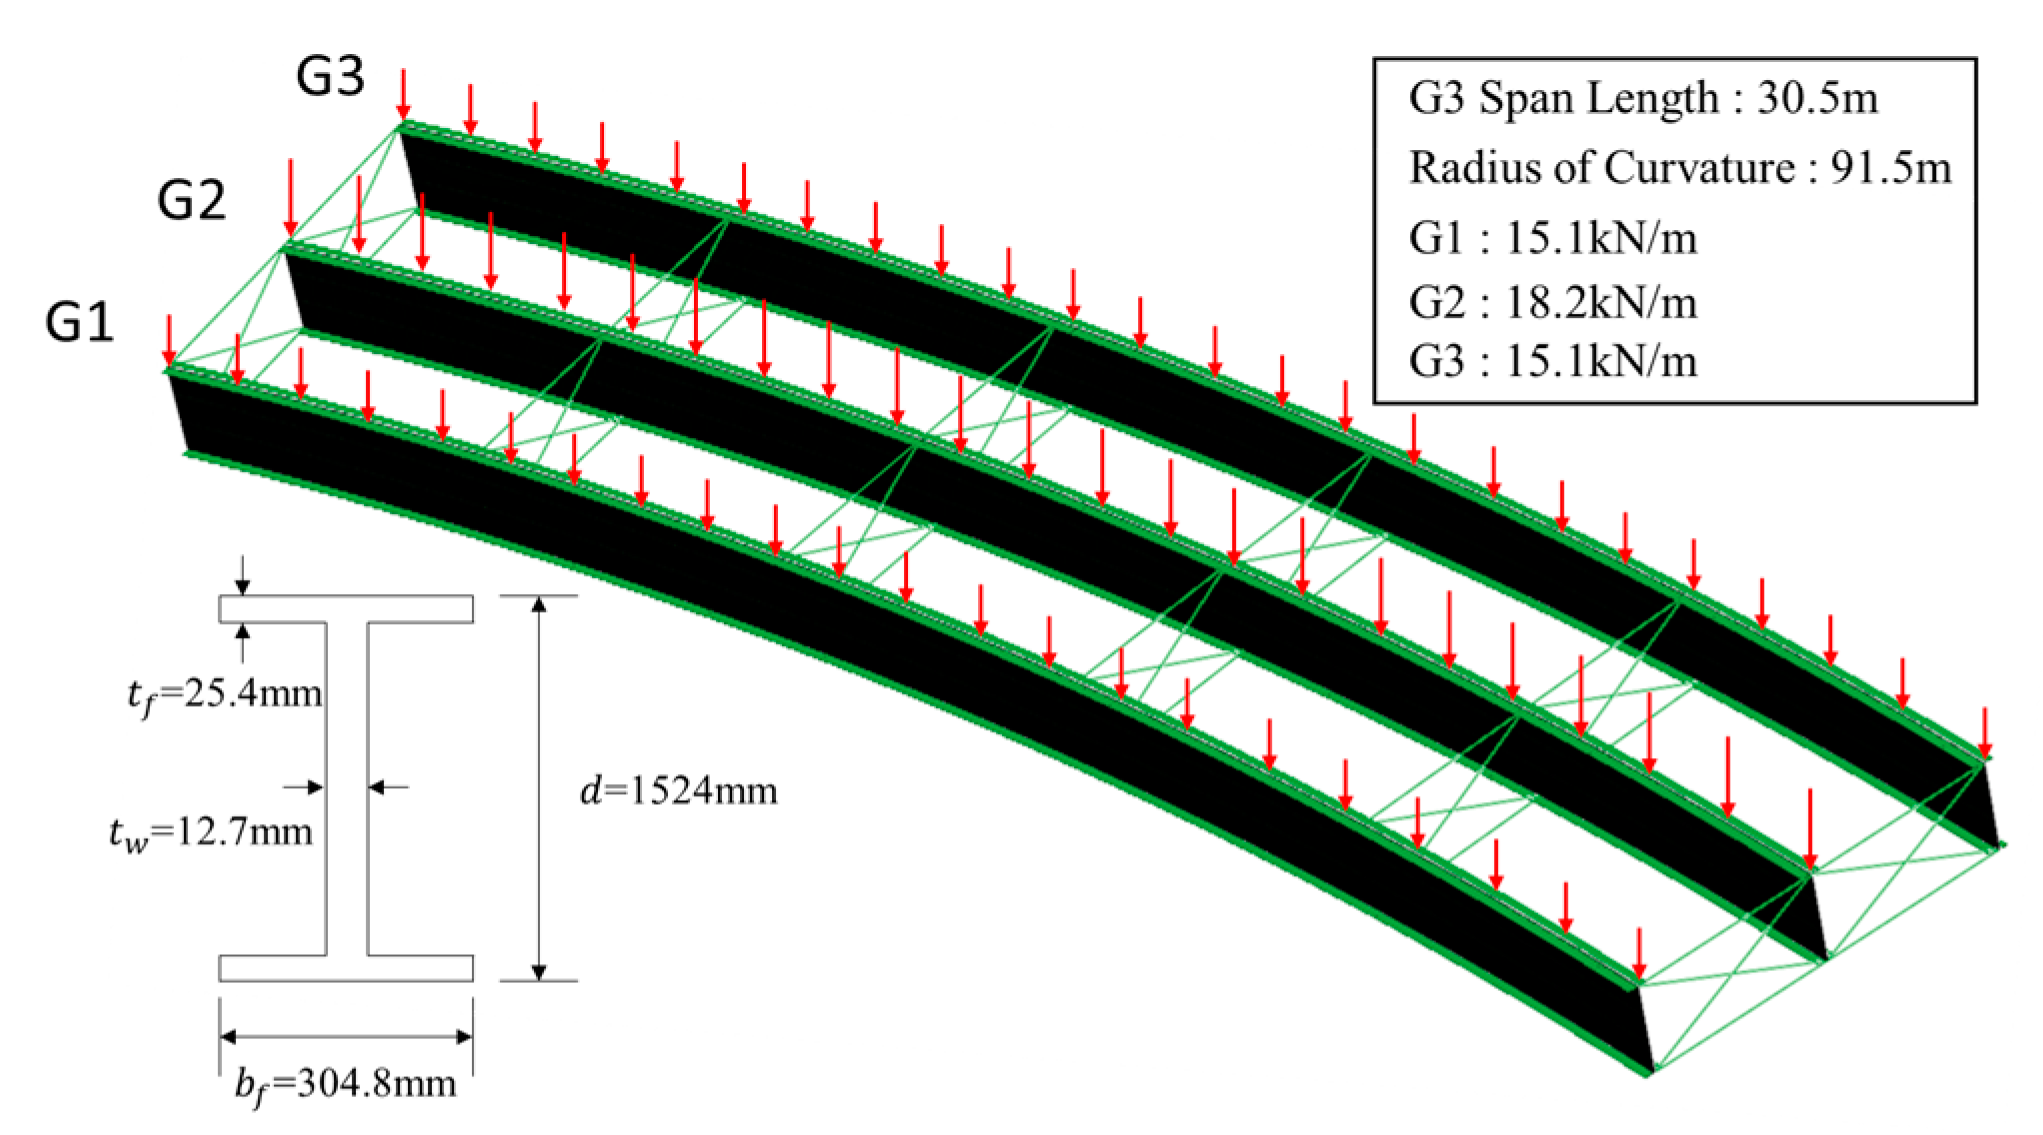
Linear elastic analysis was performed on a horizontally curved I-girder bridge using an FEA program (ABAQUS 2022) [14]. A distributed load due to self-weight was applied to the bridges, and a simply supported condition was adopted. The horizontally curved I-girder bridges were modeled using shell elements (S4R) for the web, truss elements (T3D2) for the cross-frames, and beam elements (B31) for the flanges. The elastic modulus of steel was 200 GPa, the Poisson’s ratio was 0.3, and the geometry, boundary, and load conditions were defined using a cylindrical coordinate system. X-type cross-frames were installed between the adjacent girders to act as load-carrying members. In the case of a composite girder, the effect of warping can be assumed to be insignificant because the concrete deck acts as a continuously supported cross-frame [12]. Therefore, non-composite girders in which warping behavior was dominant were modeled. The FEA models used in this study were verified using those presented in a previous study. Detailed information regarding the structural analysis model is shown in Figure 5.
Davidson et al. [15] conducted a study to investigate the effect of curvature on the elastic local buckling of compression flanges in horizontally curved I-girder bridge models with an overhang length of 914.5 mm, a width of 7925 mm, and a concrete deck thickness of 203.2 mm. In their study, a distributed load of 15.1 kN/m was applied to G1 and G3, and 18.2 kN/m was applied to G2, which were computed from the self-weight of the concrete deck. The detailed FEA model information presented in the previous study is shown in Figure 6. In that study, the internal forces and stress distribution along the span were obtained to explain the behavior of flange lateral bending due to warping torsion [15].
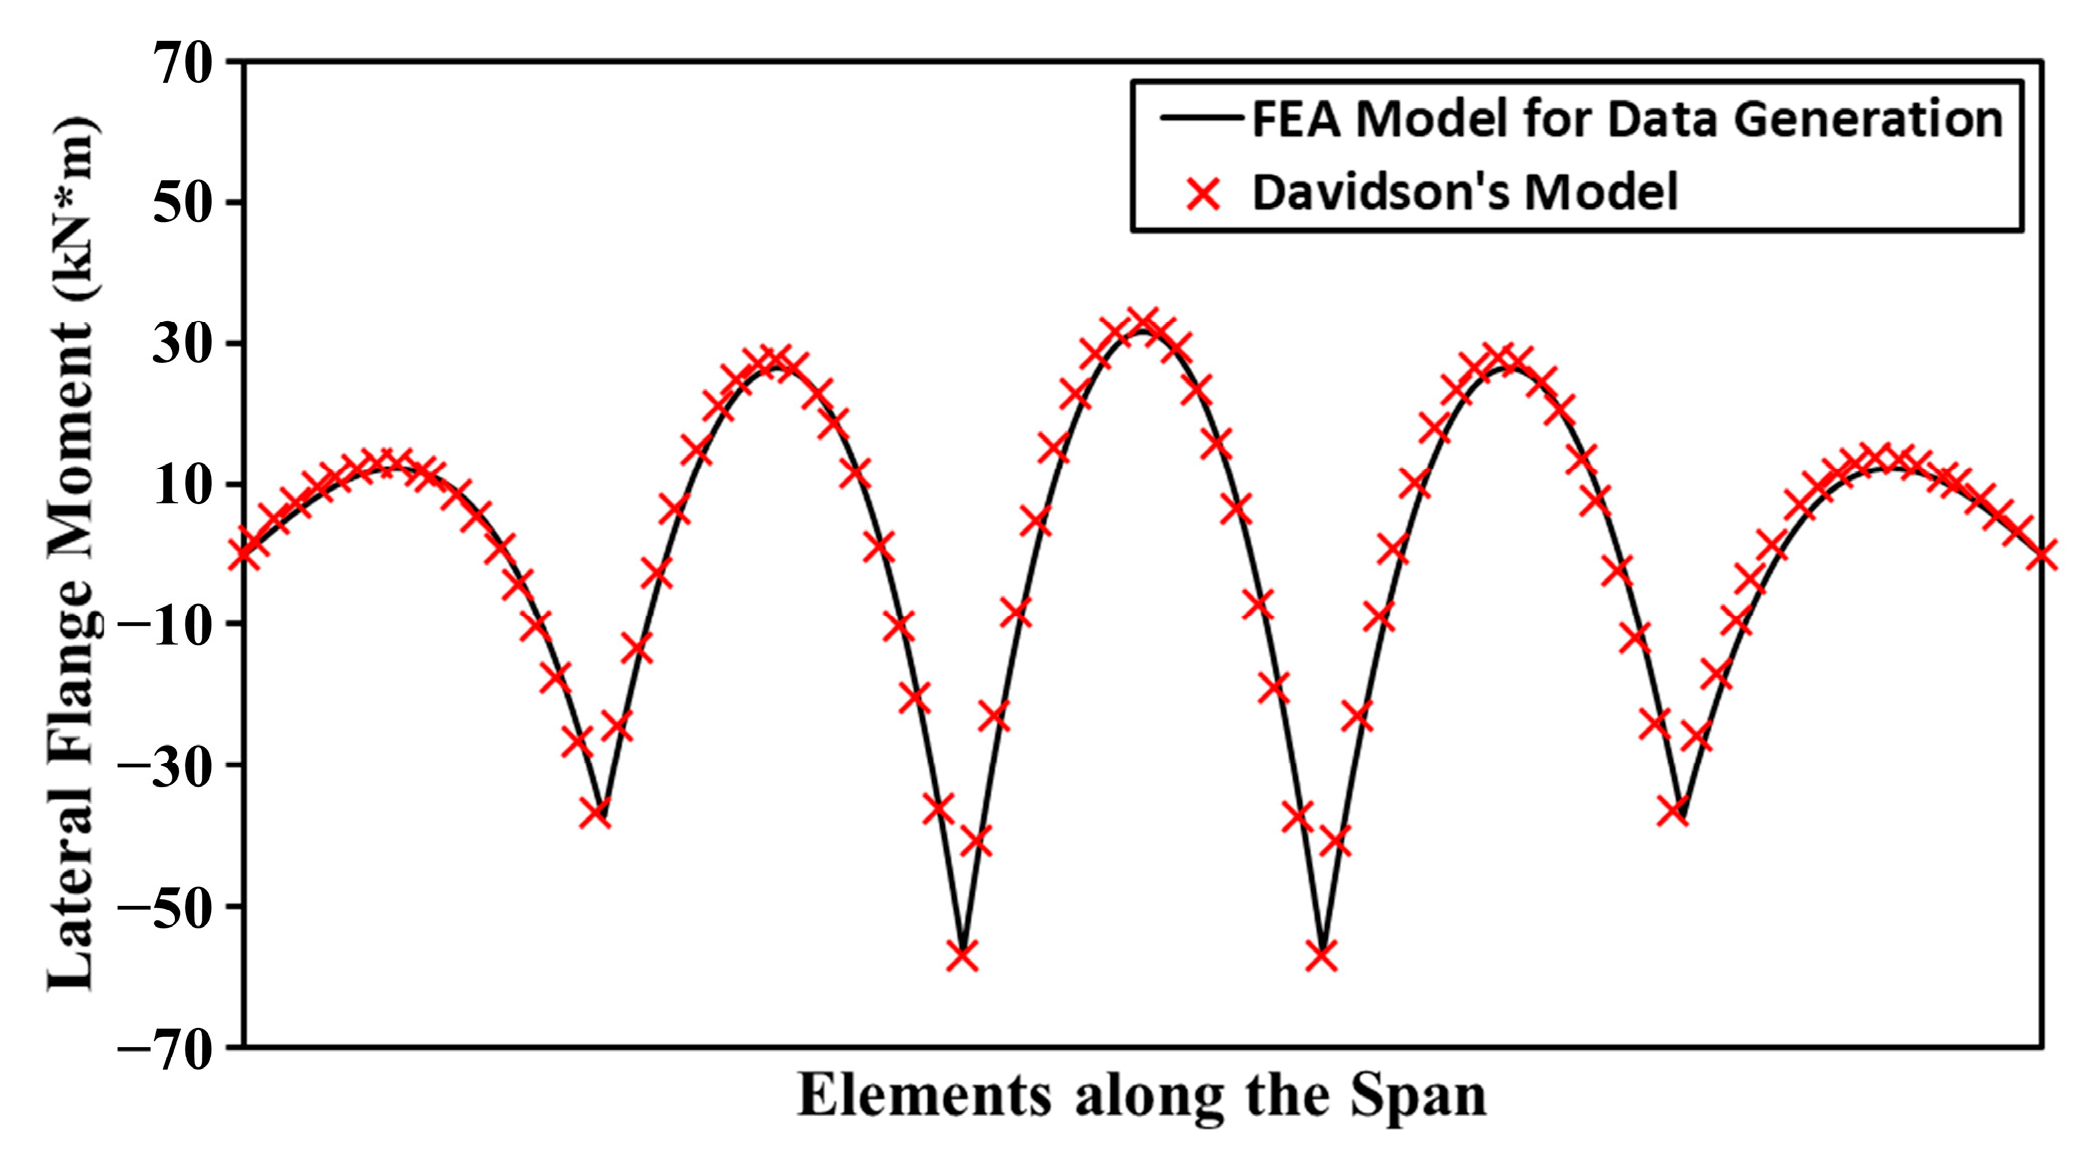
To verify the proposed structural model, FE analysis was performed using the same load and boundary conditions used in the previous study, and the FEA results were compared to the lateral flange moment distribution suggested by Davidson et al. [15]. The comparison confirmed that the moment distributions were similar under the same conditions (Figure 7).
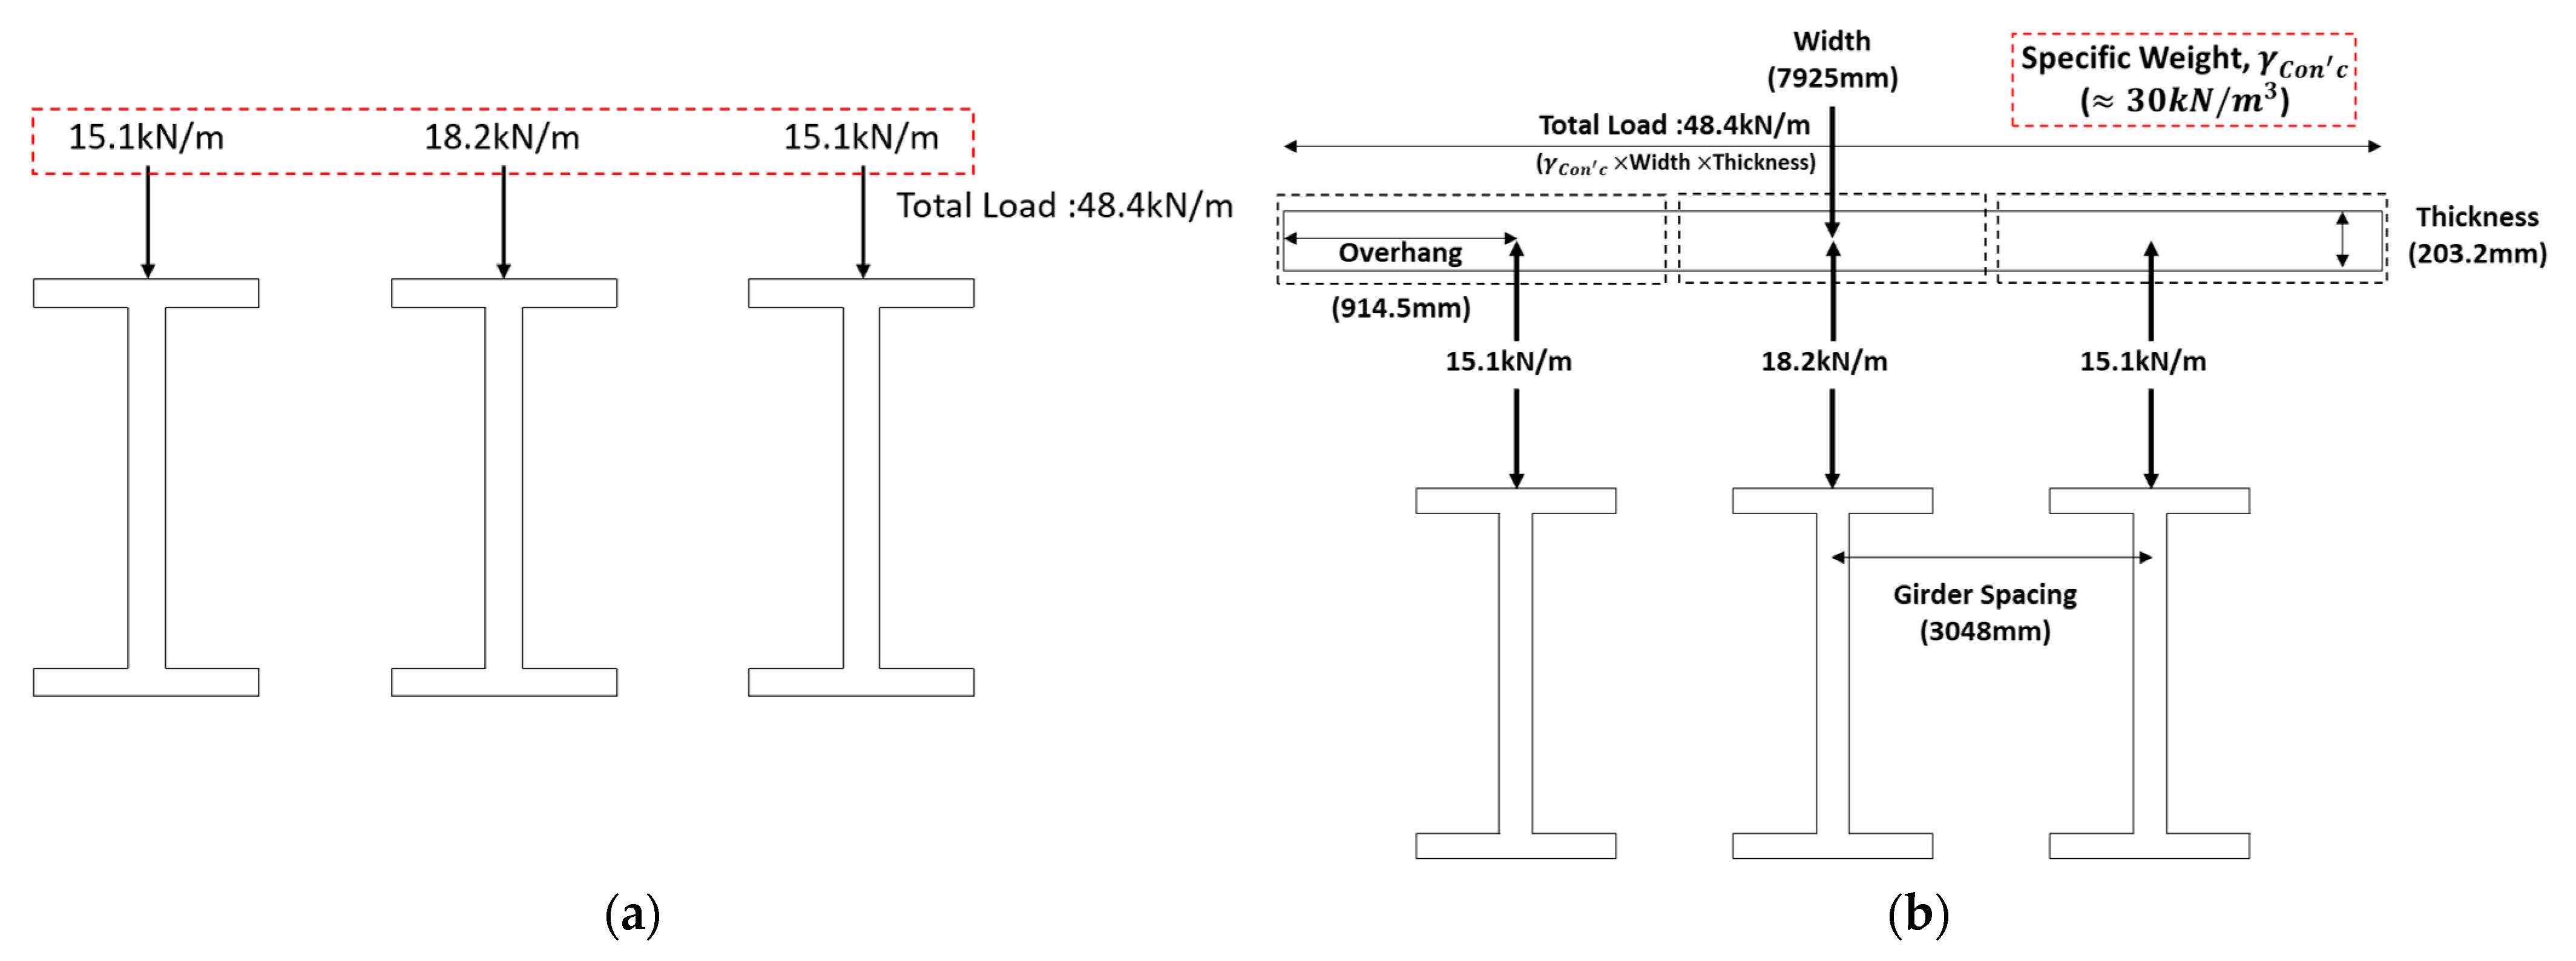
In addition, to calculate the applied loads acting on each girder, the specific weight of the concrete deck was inversely calculated using the size of the concrete deck overhang, as described by Davidson (1996). The specific weight per unit length was ~30 kN/m2 in the previous study. A simple free-body diagram for calculating specific weights is shown in Figure 8. Finally, the load acting on each girder was determined based on the fixed overhang size, thickness of the concrete deck, and inversely calculated specific weight.
To consider various horizontally curved I-girder bridge systems, a reasonable design range was determined by referring to the design manual for highway bridges (2008) [16]. According to Section 506.3.1.1, length (L) for 35–60 m and a height ratio (h/L) of 1/20 for non-composite plate girder continuous beams were proposed. In Section 506.3.1.4, for a general I-girder, the maximum plate thickness was proposed as approximately 40 mm. According to Section 506.3.1, 35–60 m and a height ratio (h/L) of 1/20 for non-composite plate girder continuous beams were proposed. In addition, according to Section 506.3.1.4, the maximum plate thickness was 40 mm and the thickness of the web was proposed to be 10–13 mm when there was no horizontal stiffener up to the second stage. Section 506.3.3.2 describes that the spacing of the girder can be up to 4 m owing to the limitation in the span of the reinforced concrete deck, and mostly it is ~3 m. In the case of bracing, there are no detailed guidelines; however, an L-shaped steel with a cross-sectional area of 75 mm × 75 mm should be used to satisfy rigidity, as mentioned in Section 506.3.3.8. Therefore, in this study, the cross-sectional area ranged from 75 mm × 75 mm to 200 mm × 200 mm. To reflect all design ranges suggested by the aforementioned design standards, several structural analyses were considered. A total of 40,824 finite element analyses were performed by reflecting all variables, and a final database was constructed. The detailed design parameters and analysis ranges applied for database construction are listed in Table 1.

4. DNN Framework

A DNN is an artificial intelligence algorithm that has evolved from an artificial neural network (ANN). The ANN algorithm comprises an input layer, hidden layers, and an output layer, and neurons in the layers are fully connected. To classify or predict target values, input values pass through fully connected layers and derive outputs. Errors in the target values can be calculated using the loss function. As training proceeds, the weight and bias in the neural network are iteratively adjusted to minimize the optimizer error.
The DNN algorithm consists of a deep network constructed by increasing the number of hidden layers to two or more. It demonstrates superior performance in solving complex problems and can be applied to classification and regression. Owing to these characteristics, the algorithm has been applied in various fields, e.g., structural health monitoring [8,9,10,17] and behavior estimation [7,18,19,20].
Conventionally, the maximum flange lateral moments of horizontally curved I-girder bridges are determined by the V-load method. However, the V-load method may have the disadvantage of estimating the maximum lateral moment values when it has wider flange sections of I-girders. If the model is constructed by DNN, we may not spend too much time determining the adequate cross-frame spacings without thorough finite element analysis. In addition, research was conducted to apply DNN in designing pipes by estimating stress. Based on this study, it was confirmed that the neural network model showed excellent estimation performance compared with FEA results [7].
In this study, a DNN-based model for estimating the maximum lateral flange moment of a horizontally curved I-girder bridge was proposed. The model was trained based on the FEA results. The mean squared error (MSE), which is mainly used in regression models, was used as a loss function, and ADAM, which shows a high optimization performance in most models, was applied as an optimizer. To increase the generalization of the model, batch normalization with 32 batch sizes was performed for each layer. A summary of the DNN architecture used in the model and the detailed values of each parameter are presented in Table 2. Python and TensorFlow were used in all preprocessing steps and DNN model development and application.
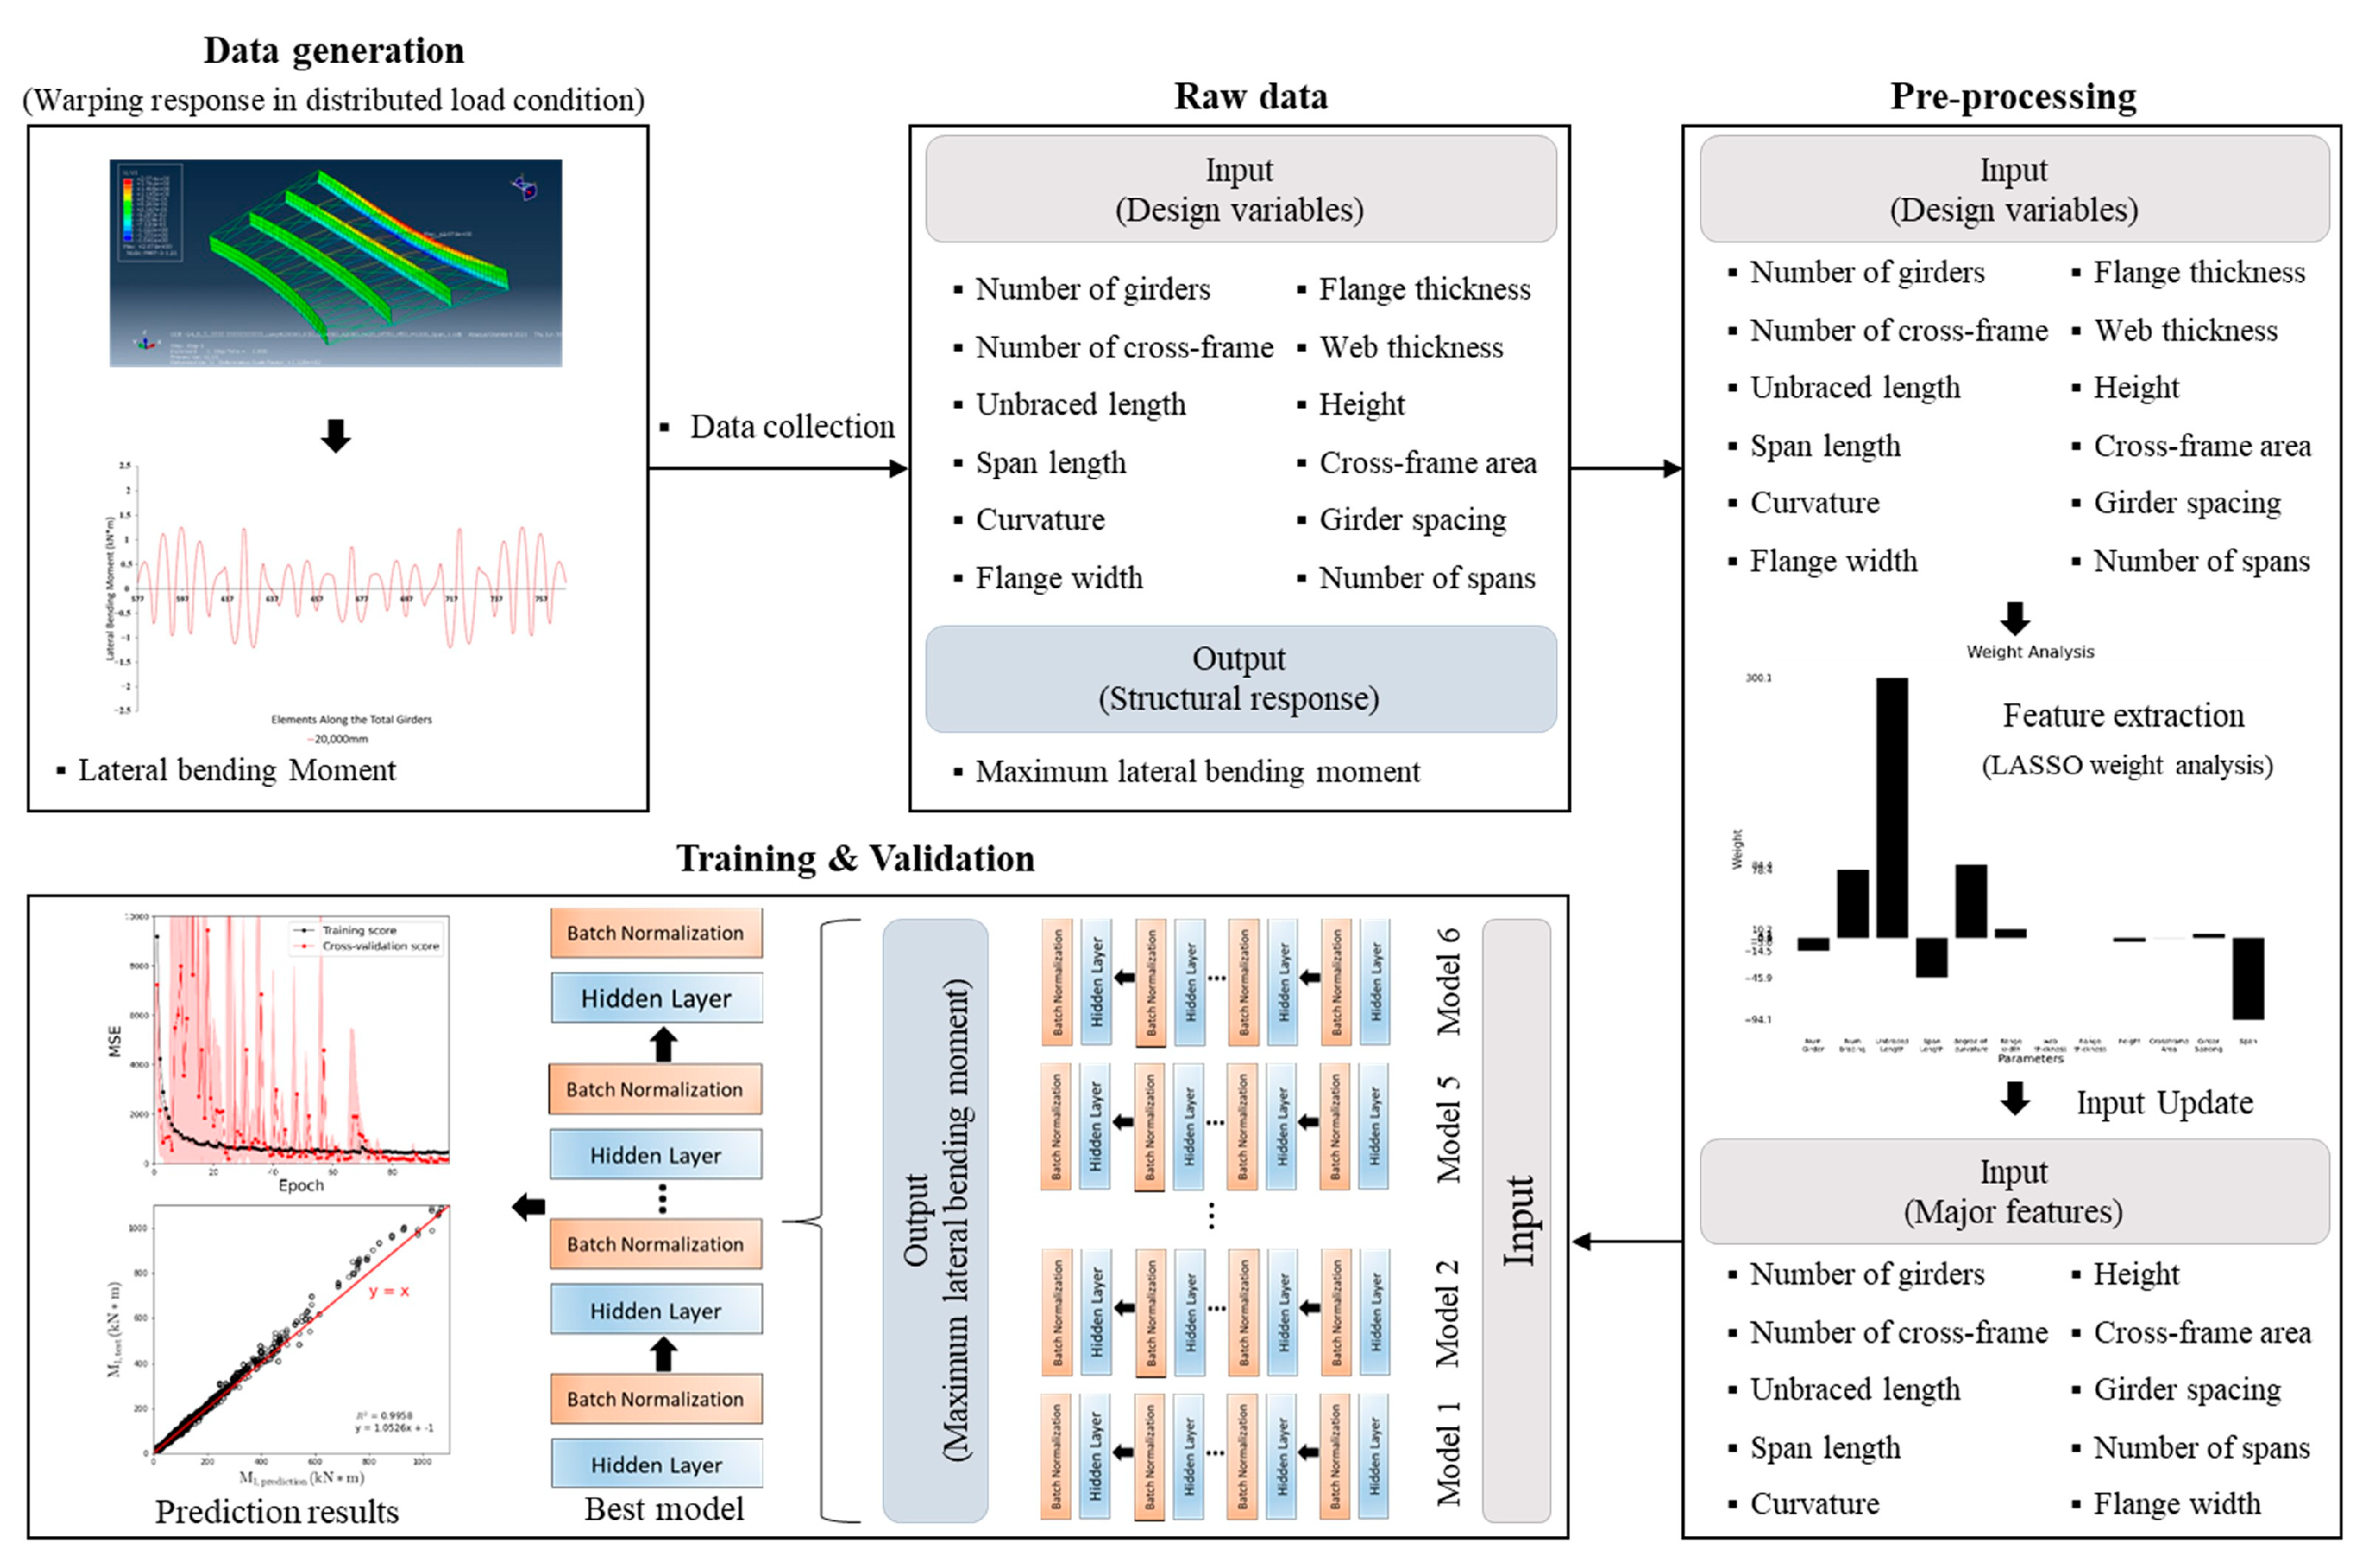
The overall research method is as follows. First, finite element analysis was performed to generate the warping response data of the horizontally curved I-girder bridge under the distributed load conditions. A raw dataset was constructed with the 12 design variables required for finite element analysis as input and the maximum lateral flange moment was the output. Next, preprocessing was performed by LASSO regression, which is a method for selecting major features. A preprocessed dataset was constructed by updating the inputs with major features selected by LASSO regression. The validity of the pre-processed dataset was confirmed by comparing the performance with the raw dataset through a simple neural network. Several models were constructed by training with different numbers of hidden layers and hidden neurons. AI architectures were compared for three regression performance metrics ( R 2 , RMSE, and MAE) and the model with the best performance was proposed as the final model. The overall flow chart of this study is shown in Figure 9.

4.1. Feature Selection through Least Absolute Shrinkage and Selection Operator (LASSO)

The design of horizontally curved I-girder bridges is complex due to the influence of the initial curvature even when vertical loadings without eccentricity are applied. The structural responses in the horizontally curved bridges are remarkably affected by various design variables such as the number of girders, number of cross-frames, unbraced length, span length, degree of curvature, flange width, flange thickness, web thickness, height, cross-frame area, cross-frame spacing, and number of spans. If all the variables of the bridge models are considered, it may result in a very long training time and require inefficient computational memory. In addition, in neural network algorithms, it is well known that considering unnecessary variables, which have no significant effect on the structural behavior, may result in an adverse effect on the accuracy of the presented model, or overfitting can occur, as indicated in the literature [21]. Thus, before training the models with a deep learning algorithm, the feature selection process was considered in this study to improve the prediction performances of the DNN models. To improve the performance of the models, numerous researchers have investigated the selection of major features using various algorithms [21,22]. An effective technique is penalized regression. Penalized regression increases the generalization of the model by reducing the impact of features based on weights. Penalized regressions, which have been widely used in many studies, include ridge, LASSO, and elastic regression.
In this study, LASSO regression was conducted to select the features that significantly influence the model performance. The weight of each design variable was identified by using LASSO. According to the weight result of LASSO regression, major design variables which mainly influence warping behavior were finally selected and applied as input variables for the deep neural network algorithm.
According to the experimental results of Muthukrishnan (2016), the LASSO method demonstrates higher feature selection performance than the ridge method and can be applied as an alternative to the conventional feature selection method [22]. Conventional regression helps determine appropriate weights and biases that minimize the MSE; however, LASSO simultaneously minimizes the sum of the absolute values of the weight as the penalty term is added. To minimize the MSE, appropriate weights and biases are determined using Equation (3), and the sum of the absolute values of the weights is minimized so that the weights of all features are close to 0. Therefore, some features may not be used while training the model. Owing to these characteristics, it is possible to enhance generalization and select features that significantly contribute to the model.
a r g m i n β = [ i = 1 n ( y i β 0 j = 1 p β j x i j ) 2 + α j = 1 p | β j | ] . y i = observed   value x i j = features β j = weight   of   features p = number   of   features α = penalty   control   parameter n = data   size
The number of girders and cross-frames, the unbraced length ( L b ), span length ( L ), curvature ( θ ), flange width ( b f ), flange thickness ( t f ), web thickness ( t w ), height ( h ), cross-frame area ( A c ), girder spacing ( S ), and the number of spans were considered as the design parameters. The weighted results obtained from the LASSO analysis are listed in Table 3. According to the results of LASSO, we confirmed that the geometric and boundary conditions, such as the number of girders and cross-frames, unbraced length ( L b ), curvature ( θ ), and the number of spans, significantly influenced the warping behavior. In the case of the cross-section, the flange width and height had a significant influence. However, the flange thickness ( t f ), cross-frame area ( A c ), and web thickness ( t w ) did not have a relatively large effect compared with the other parameters within the design range, indicating a weight of 0.
DNN models with the same architecture (one layer and 50 neurons) were compared to verify the performance before and after feature selection through LASSO. The compared results are listed in Table 4. Model (1) was trained with all the design parameters, and Model (2) was trained with the features selected using LASSO.
The performance of the model was evaluated using the widely used k-fold cross-validation method. In k-fold cross-validation, the data are divided into k number of folds, k − 1 folds are used as training datasets, and one-fold is used as a validation dataset. This is repeated k times to obtain performance, and the final performance of the model is calculated as the mean of k performances. As this method ensures that the performance of the model does not depend on the splitting of our training and test sets, it demonstrates a generalized performance. Owing to this advantage, cross-validation is considered to be a more stable and superior statistical evaluation method than conventional methods.
In this study, 20% of the overall dataset was used as a test dataset, and the rest was sorted into five subsets. Four subsets were used as the training dataset and one subset was used as the validation dataset. A detailed configuration of the dataset is illustrated in Figure 10.
Table 4 lists the estimation performance of the two DNN models. The model using the main features possessed an MAE of 10.564, an RMSE of 18.86, and an R2 of 0.97, which confirmed that all the three evaluation indicators were superior when all the parameters were used. Although there were no considerable differences in the model performance, the model exhibited several advantages, e.g., reduction in training time and improved memory efficiency, owing to a decrease in the number of independent parameters. Therefore, to propose a DNN-based maximum lateral flange moment estimation model, we considered nine major features as inputs and constructed an architecture.

4.2. Proposed Neural Network Architecture

To propose a reasonable maximum lateral flange moment estimation model of a horizontally curved I-girder bridge that ensures optimal performance, six neural network architectures were constructed based on the number of hidden layers and neurons. The name of the model was defined by using L and N, in this case, L means the number of layers and N represents the number of hidden neurons. For example, the L1N50 model consists of one hidden layer and each layer has 50 neurons. The models were compared using three evaluation indices: MAE, RMSE, and R2; the model with the highest accuracy was proposed from the outcomes of this evaluation.
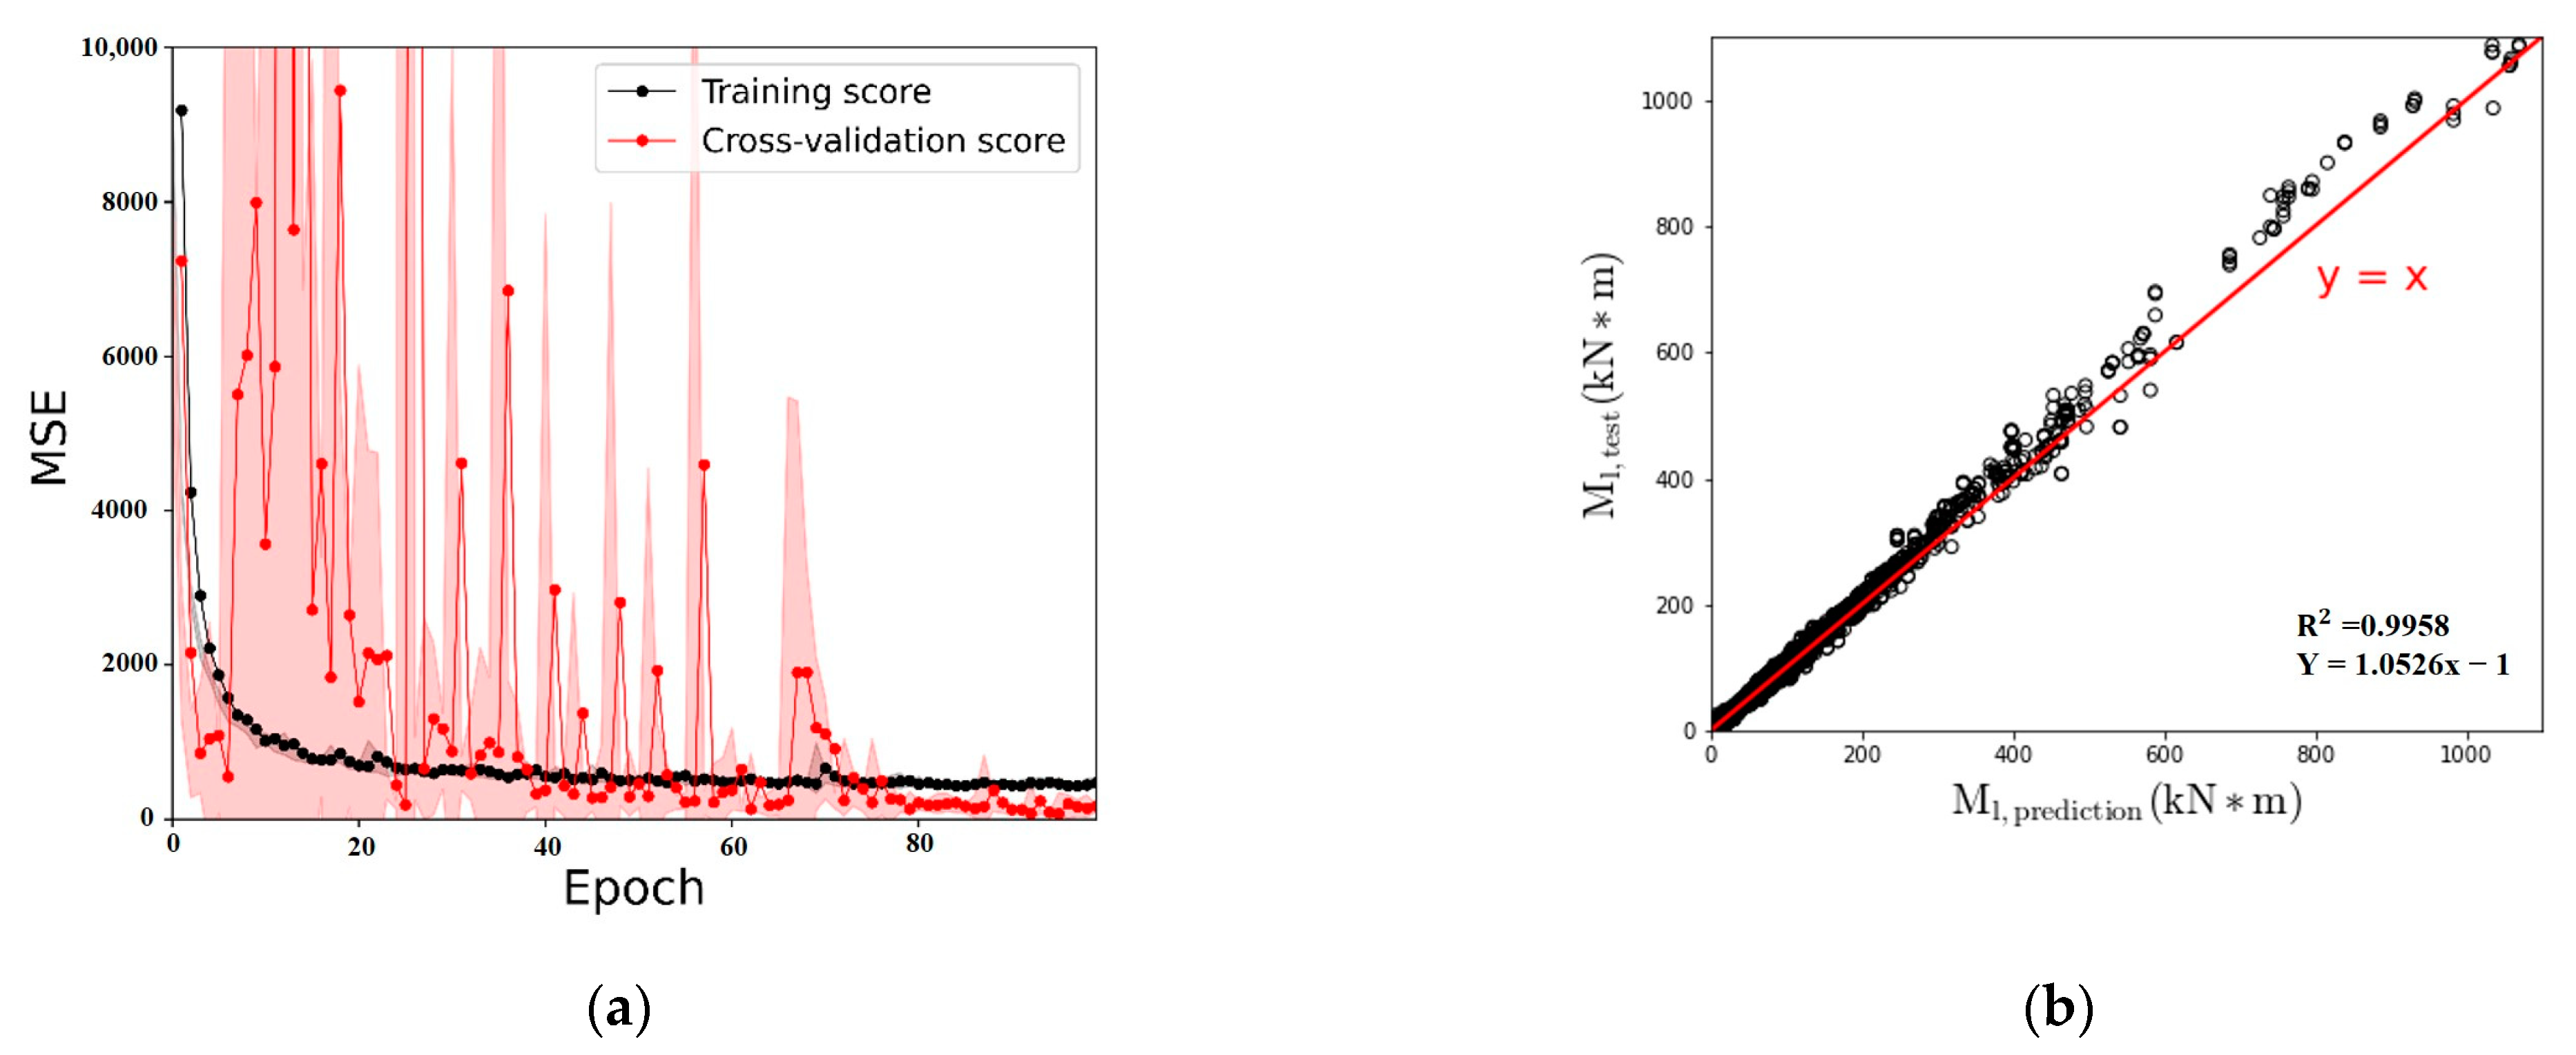
Table 5 summarizes the estimation performance of the six DNN models. Based on the evaluation with k-fold cross-validation, the models exhibited high performance with regard to R2, RMSE, and MAE, except for the case in which there is only one hidden layer. For R2, tL5 N50, L5 N100, and L8 N100 exhibited the highest generalization performance with values of 0.99 or higher. The L5 N100 model exhibited the highest accuracy with regard to RMSE and MAE. Therefore, as the final estimation model of this study, the L5 N100 model was proposed considering generalization performance and accuracy. Figure 11 shows the learning curve of the L5 N100 model, and the estimation result of the k = 2 model, which exhibited the highest performance among the five folds, considering R2 = 1.00, RMSE = 6.56, and MAE = 3.96. The learning curve exhibits the performance of the model as it was trained. The thick line indicates the average error according to the k-fold cross-validation, and the shaded line indicates the standard deviation of the error. It was confirmed that the training and validation loss decreased according to the number of training iterations; thus, overfitting did not occur and sufficient performance was secured. The estimated graph of the k = 2 model indicates that the validation and estimation data are very close to Y = X, and the estimated lateral flange moments computed using the proposed model correlated well with the FEA results.

4.3. Behavior of a Horizontally Curved I-Girder Bridge According to Flange Width and Curvature

The AASHTO Guide Specifications for Horizontally Curved Steel Girder Highway Bridges (2003) stipulated a lateral flange moment equation based on the V-load method. To evaluate the performance of the equation, the lateral flange moment calculated using the equation and structural analysis results were compared based on the curvature and flange width.
M l a t = 6 M l b 2 5 R D . M l a t = lateral   flange   moment M = vertical   bending   moment l = unbraced   length R = radius   of   curvature D = web   height
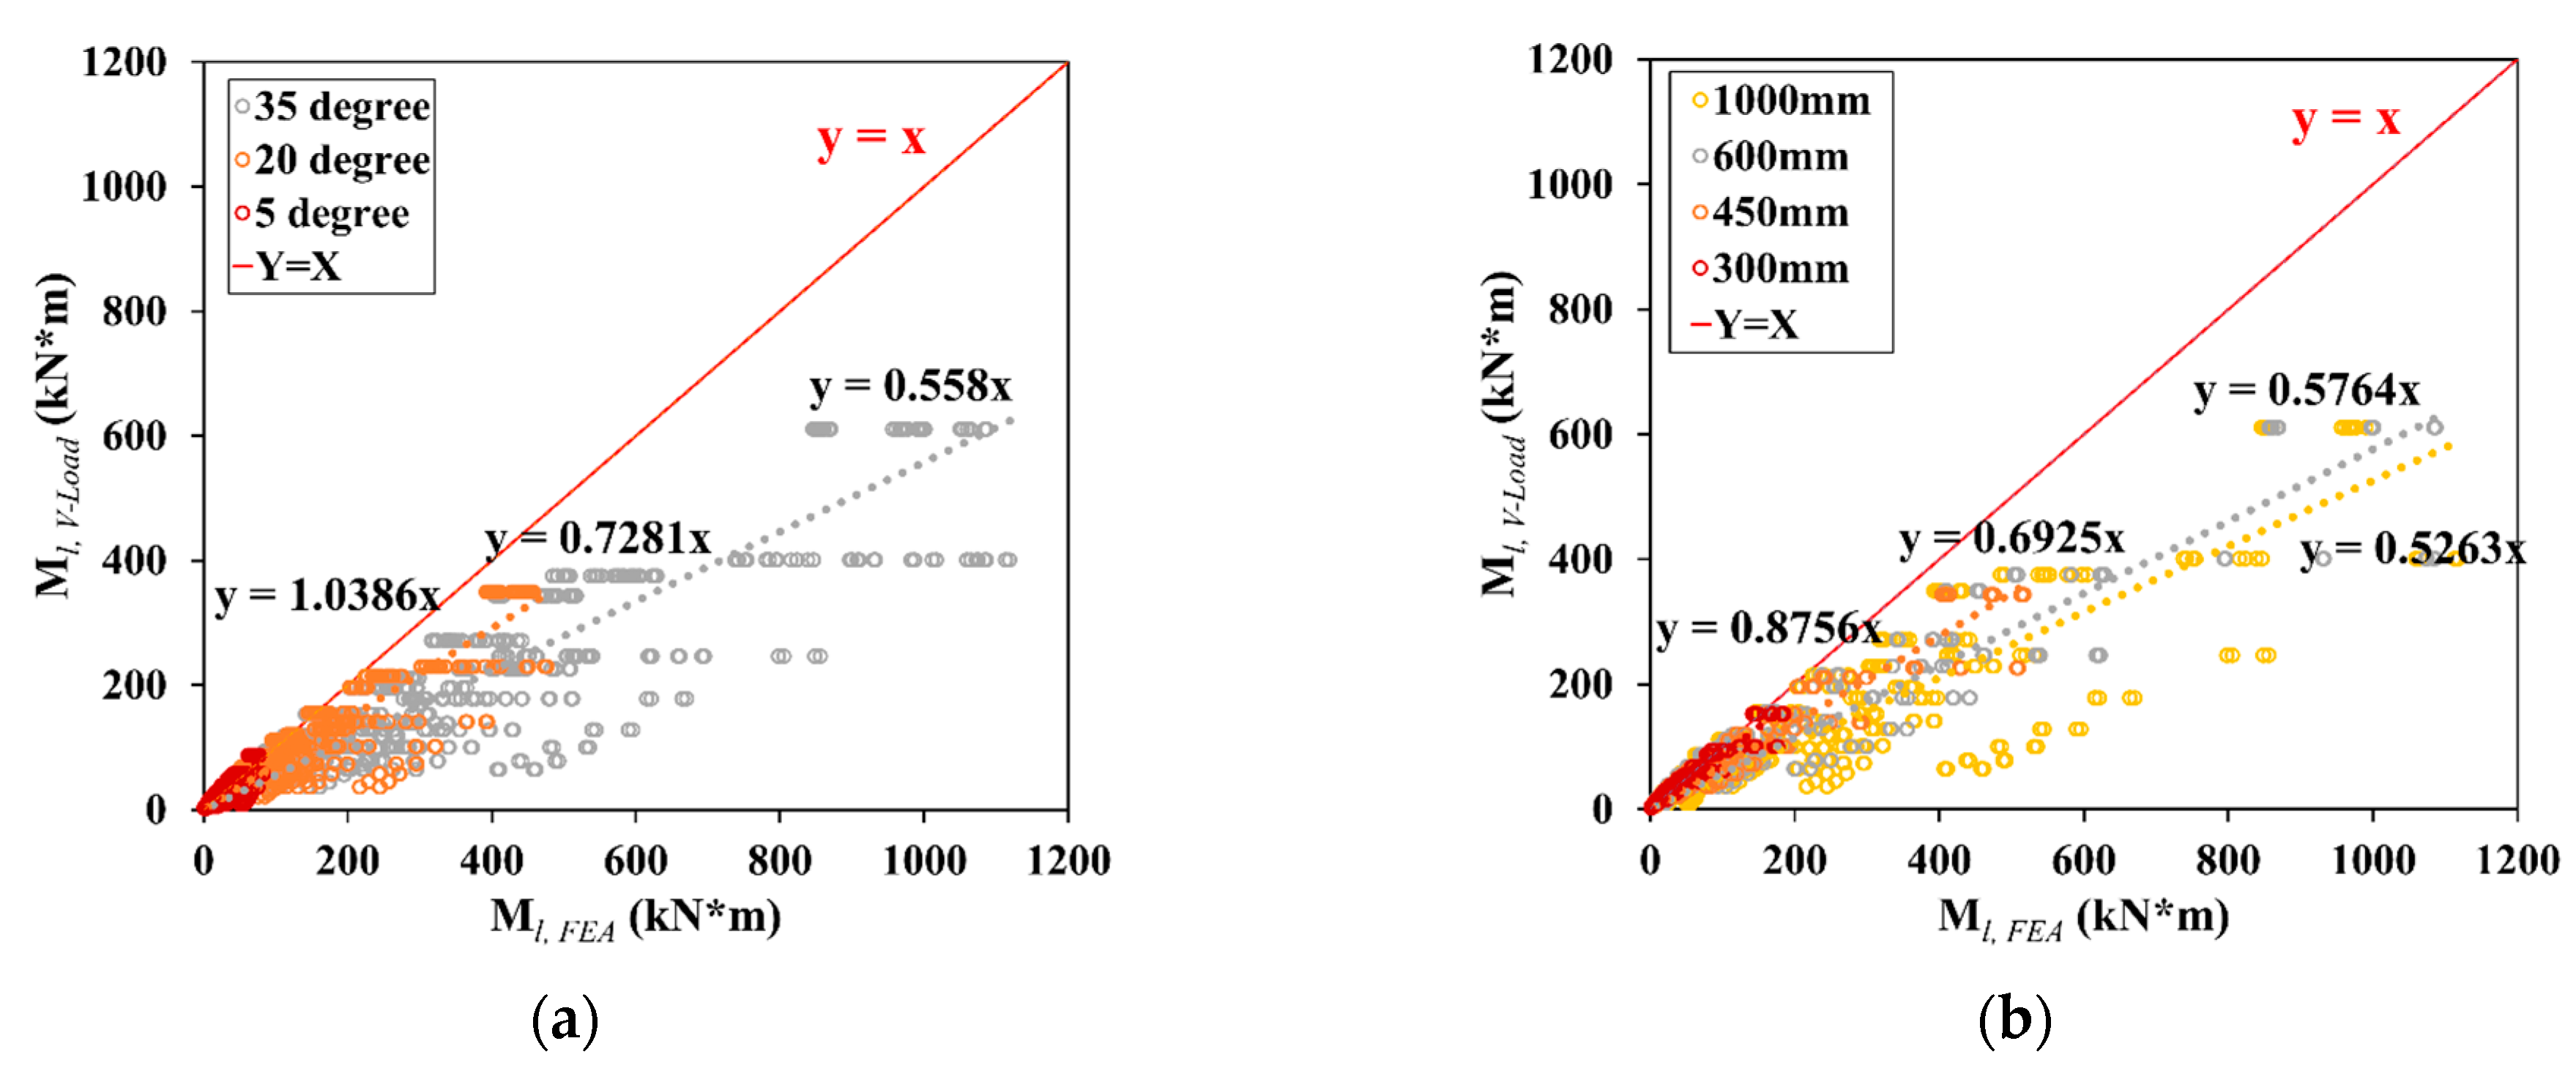
Figure 12 shows the comparison of the results of the FEA and stipulated equation based on the degree of curvature and flange width. The stipulated equation demonstrated reasonable results, as the curvature and flange width were reduced; however, it was confirmed that the error increased as the curvature and flange width increased.
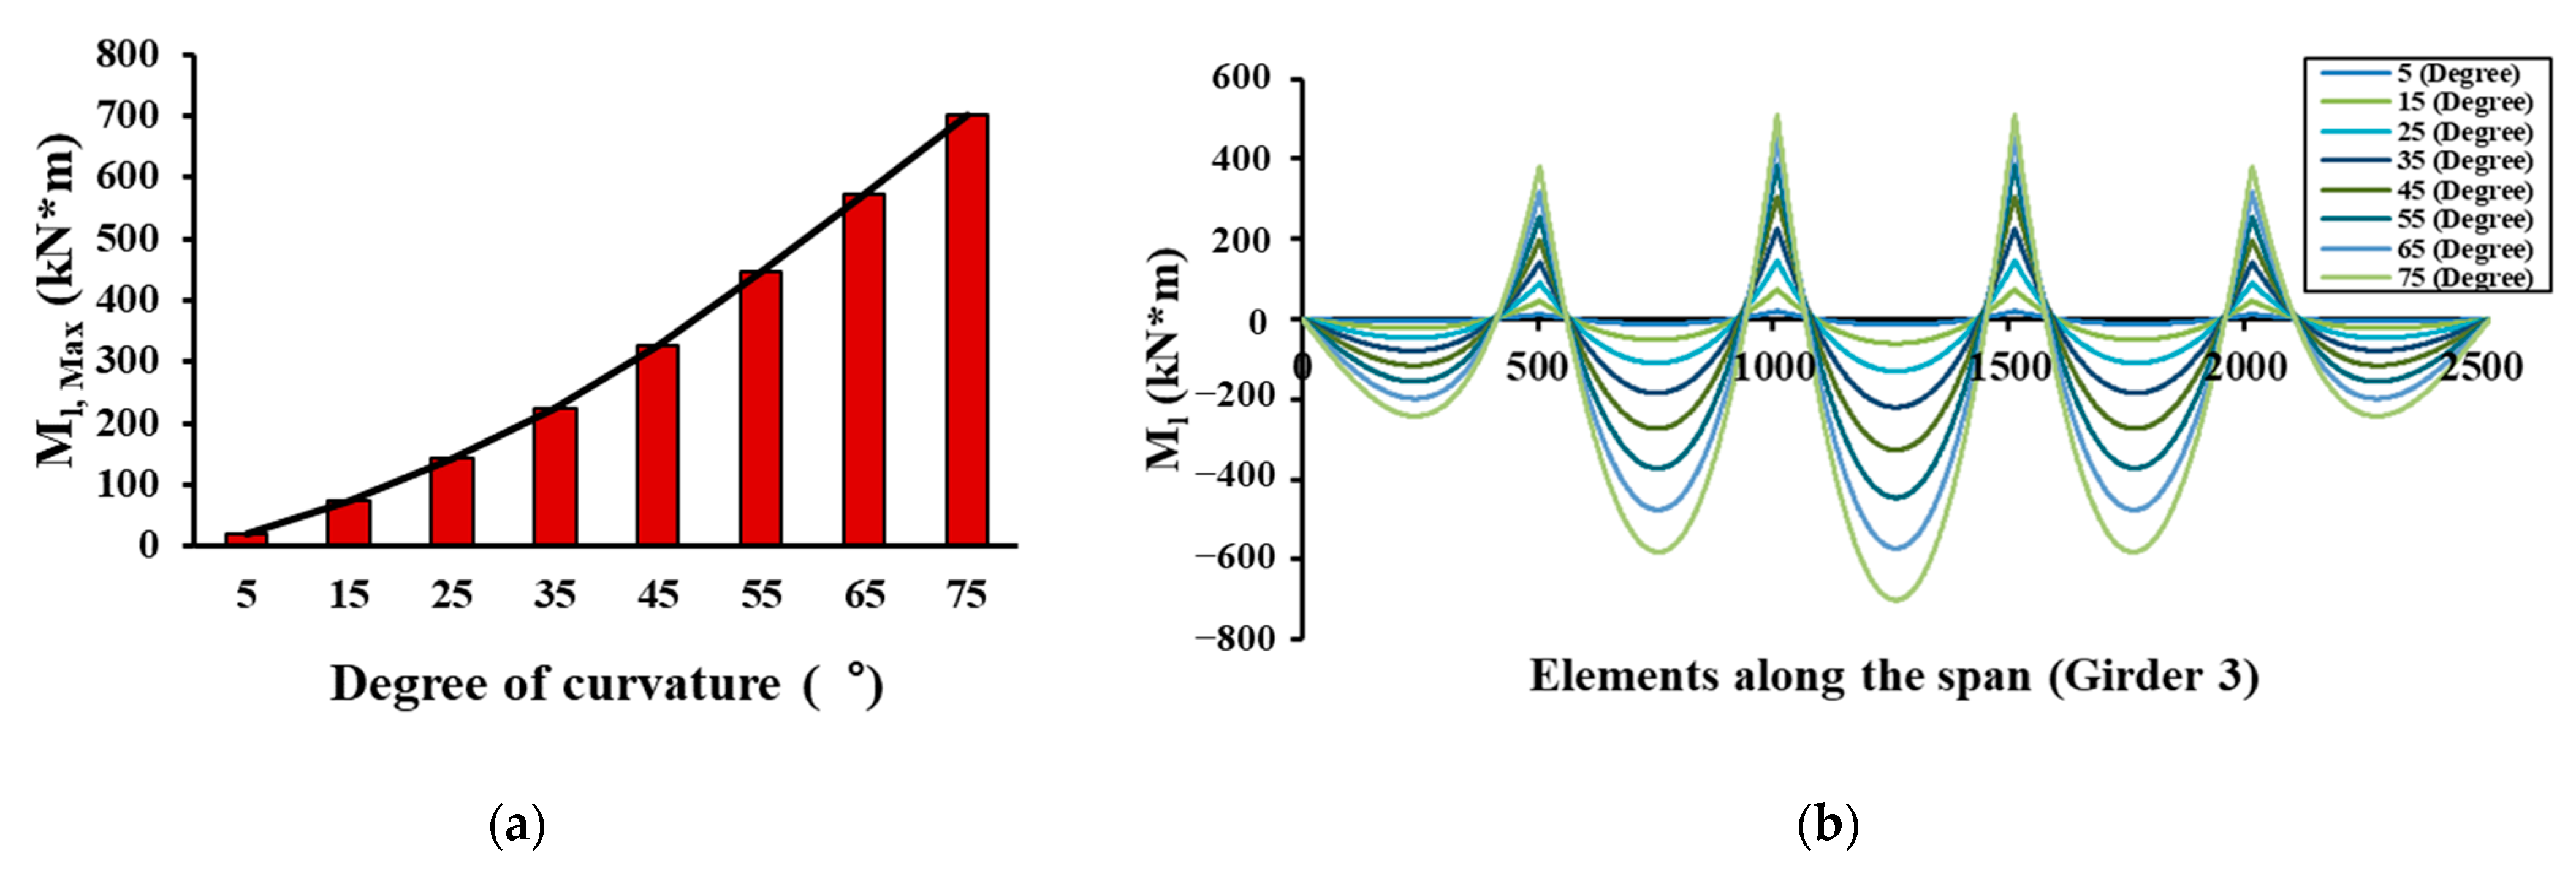
To analyze the cause of the error, all the parameters were evaluated (Figure 6) and fixed, except for the degree of curvature and flange width. The FEA was performed by varying the two parameters, and the maximum lateral flange moment and moment distribution according to each variable are shown in Figure 13 and Figure 14, respectively. As the degree of curvature and flange width increased, the maximum lateral flange moment changed nonlinearly, as shown in Figure 13 and Figure 14. However, the stipulated equation was not reflected. A larger curvature implies a smaller radius of curvature, and Hoffman (2013) reported that a smaller radius of curvature generates imperfect estimations. In particular, the flange width was not considered as a variable in the stipulated equation, and it was confirmed that the moment distribution varied according to the flange width. As the flange width increased, the lateral flange moment gradually increased, resulting in an increase in the maximum lateral flange moment values at the center of the span (Figure 14).
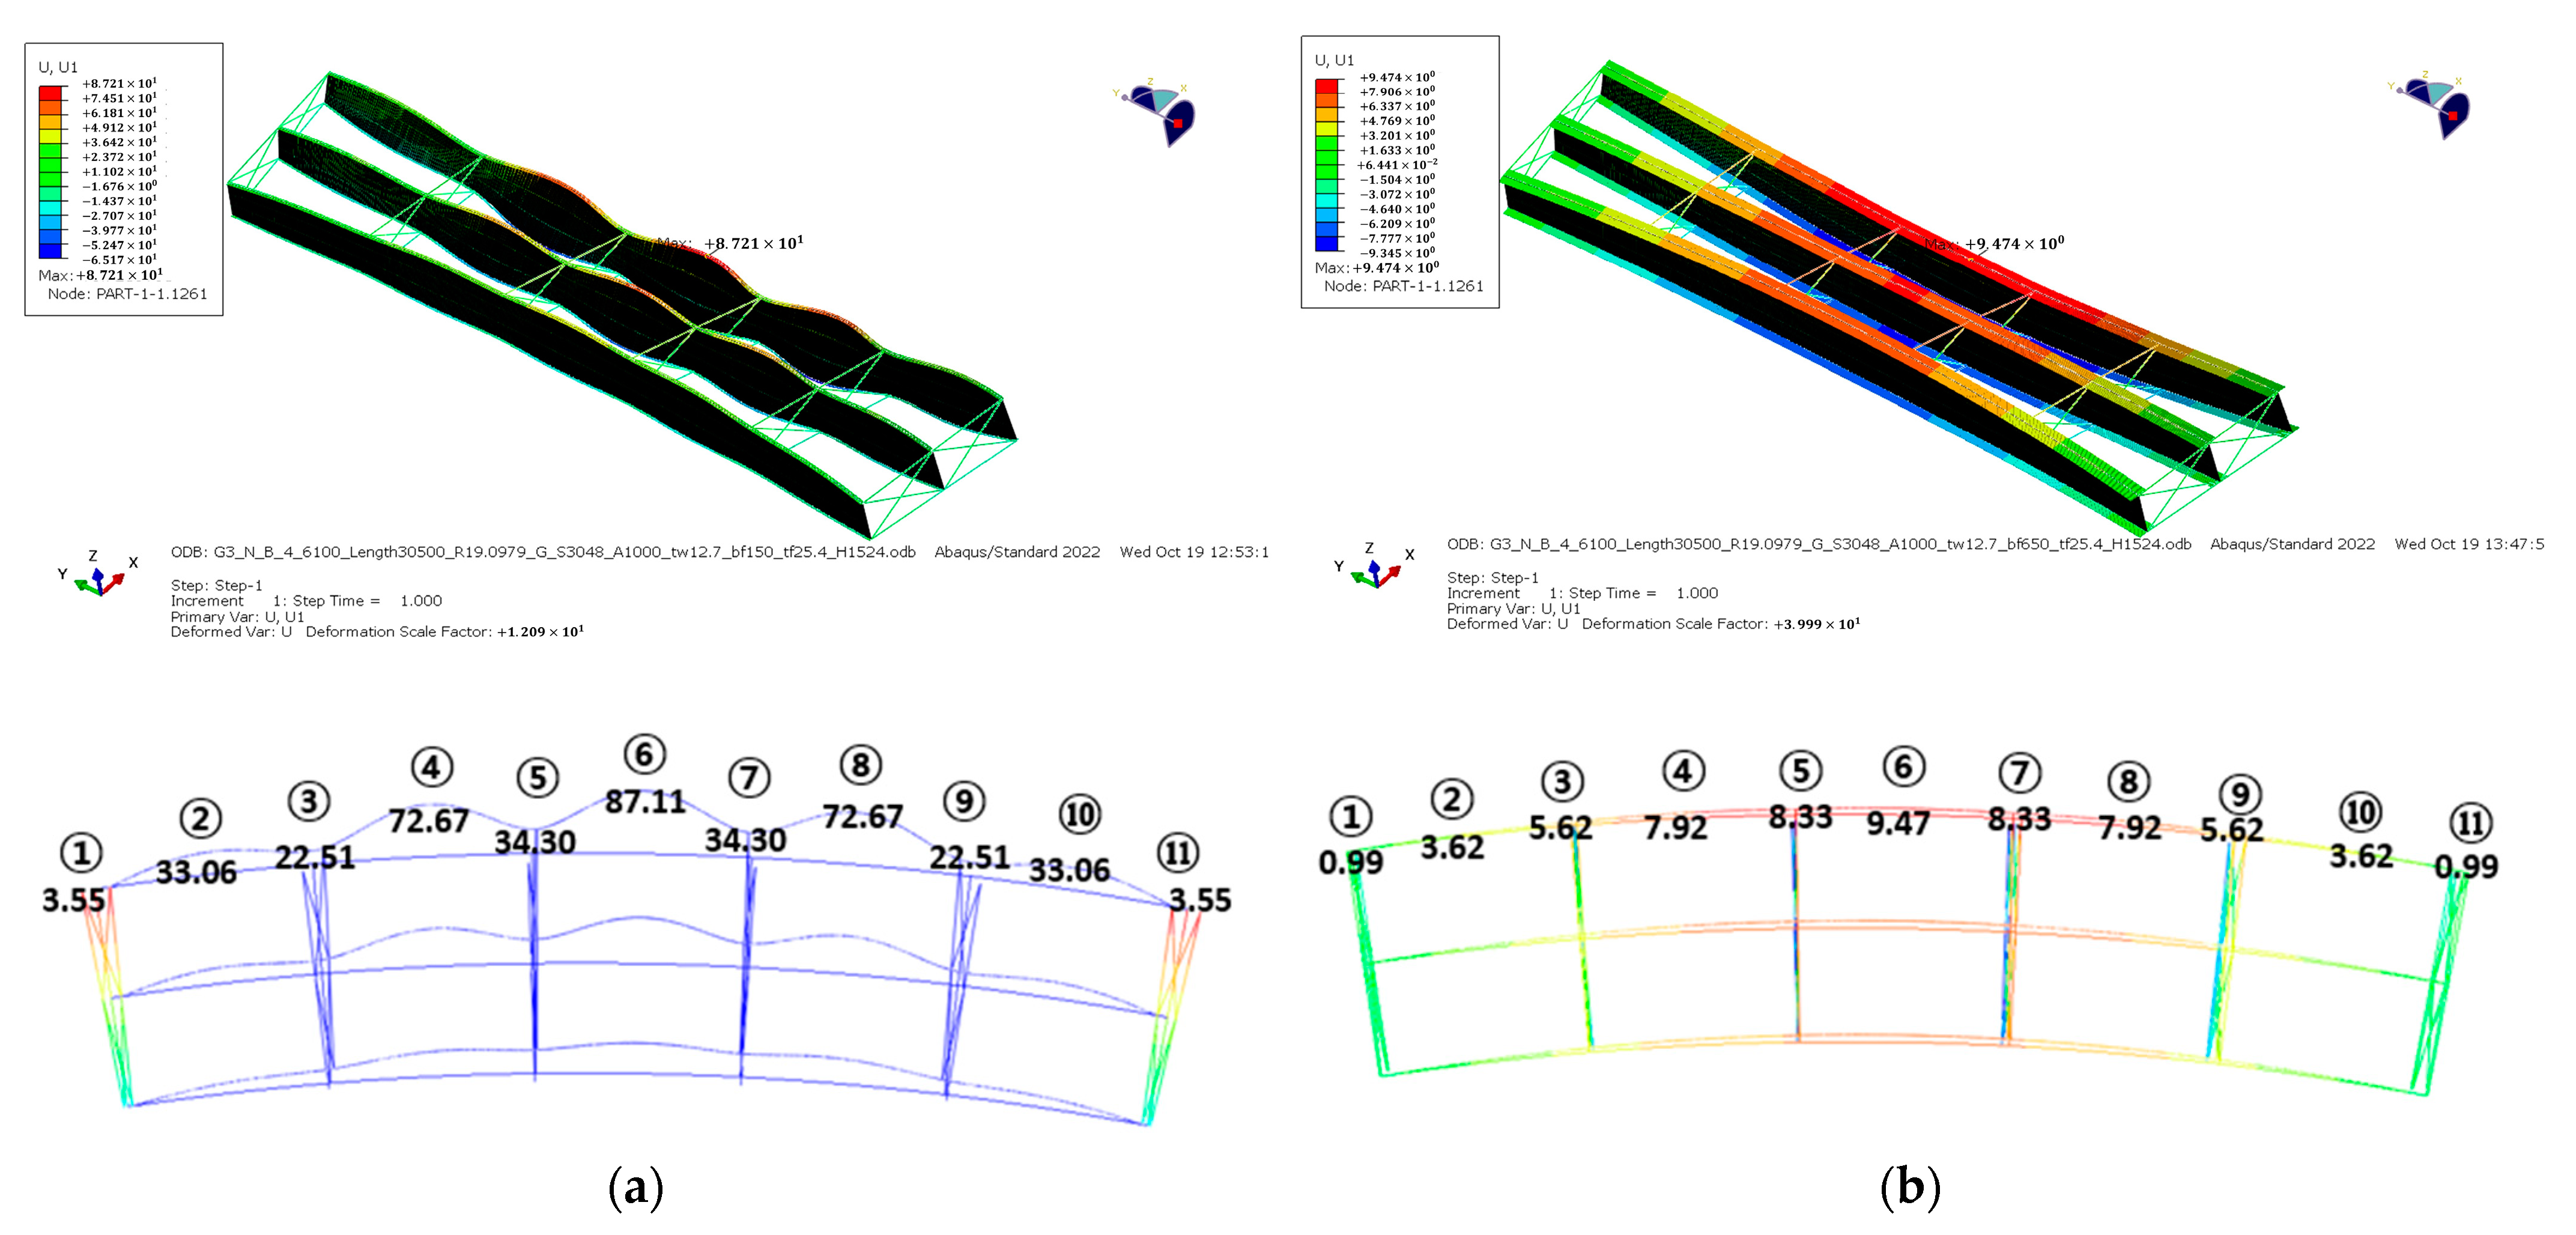
The V-load method assumes that the diaphragm and cross-frame are infinitely rigid and act as rigid supports on the flange. However, this assumption is different from the FEM and its actual behavior. Therefore, under the assumption of the V-Load method, the rotation of the flange is restrained by the connected cross-frame; thus, the lateral flange moment varies dramatically along the span, and peak values occur at the cross-frame location. However, in a real situation, the cross-frame cannot support the rotation of the flange; displacement occurs at the point of the cross-frame, which changes the distribution of the lateral flange moments acting along the span. Figure 15 shows the deformation shape of the horizontally curved I-girder bridge and the lateral displacement of the top flange when the flange widths were 150 and 650 mm. The unit of displacement was millimeters, and the nodal displacements of the bracing point and the center of the bracing point were confirmed. A scale of 20 was used for the deformed shapes.
According to the deformed shape and lateral displacement, the smaller the flange width, the larger the lateral displacement within the unbraced length. As the flange width increased, the lateral displacement within the unbraced length decreased, and global behavior was observed. In addition, unlike the assumption of the V-load method, the cross-frame did not fully support the flange, and lateral displacement occurred at the bracing point. This lateral displacement varied depending on the stiffness of the flange and cross-frame.
When the flange width was 150 mm, the lateral displacement within the unbraced length was evident owing to the difference between the torsional stiffness within the unbraced length and the stiffness at the bracing point. However, when the flange width was 650 mm, the lateral bending stiffness of the flange increased; therefore, the lateral displacement within the unbraced length was not considerable, and global lateral displacement occurred. Therefore, the lateral flange moment caused by this global behavior and the lateral flange moment caused by the cross-frame installation simultaneously occur to demonstrate the moment distribution (Figure 14). Therefore, the V-load method has the advantage of omitting complex structural analysis performed by engineers; however, it was confirmed that there is a limit to the estimation performance under certain conditions.

4.4. Performance Evaluation of the Proposed Model

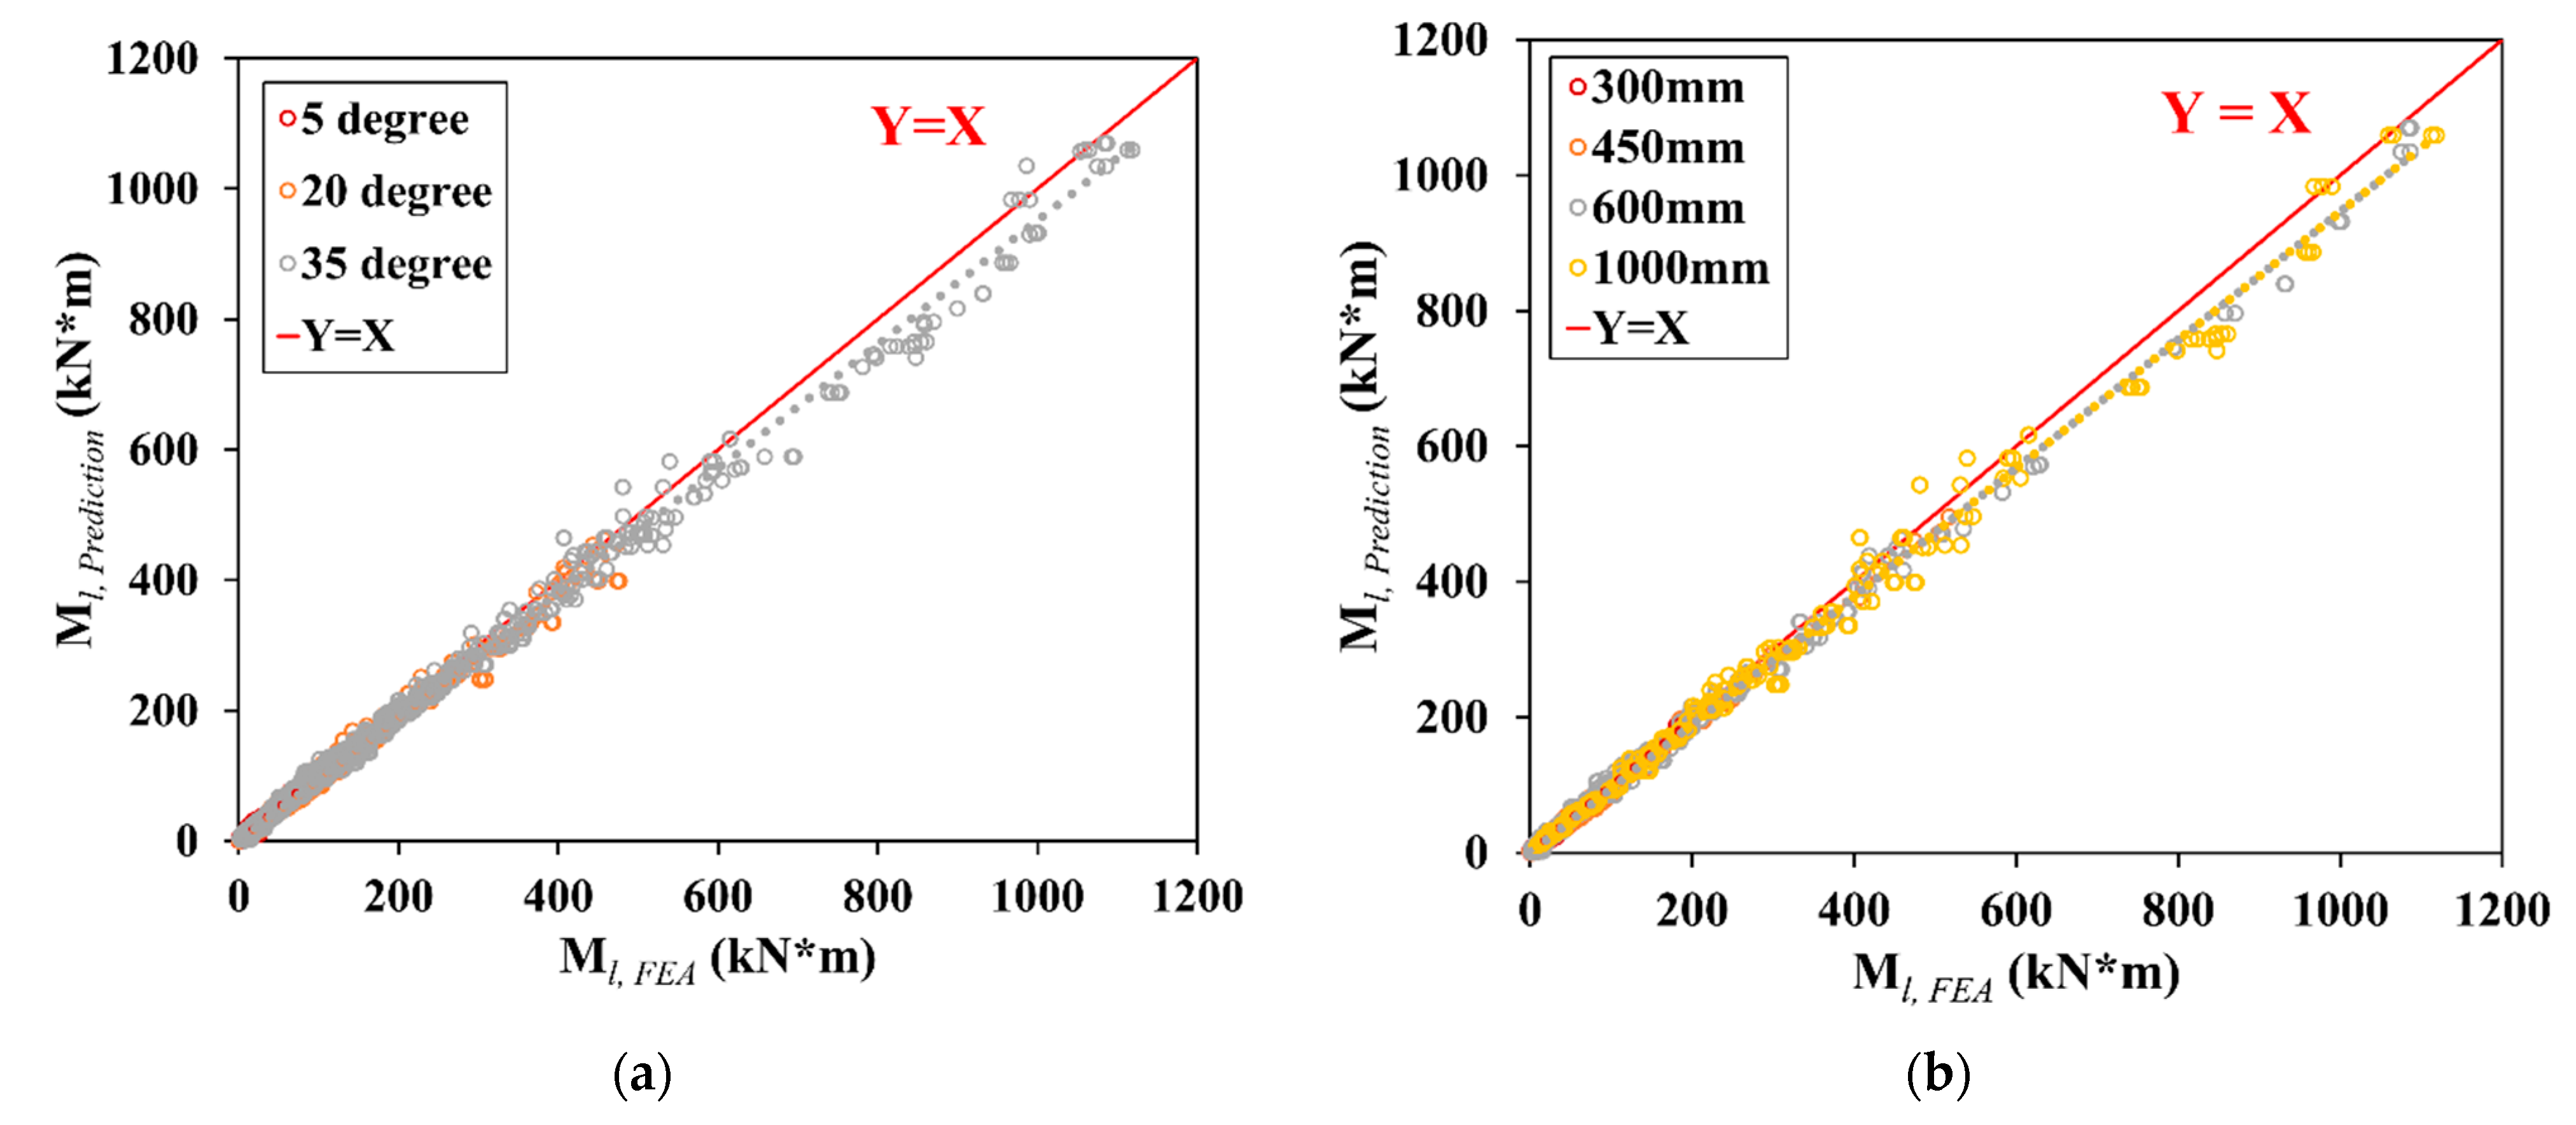
Verification was performed to determine whether the performance degradation problem caused by the parameter, which was a limitation of the proposed equation based on the V-load method, could be resolved using the proposed model. The estimation results and verification data according to the flange width and curvature are plotted in Figure 16. The performance evaluation confirmed that the distribution was very close to the y = x graph and exhibited high accuracy regardless of the parameter. Finally, it was confirmed that the performance degradation problem considering the parameters can be solved using the proposed model.
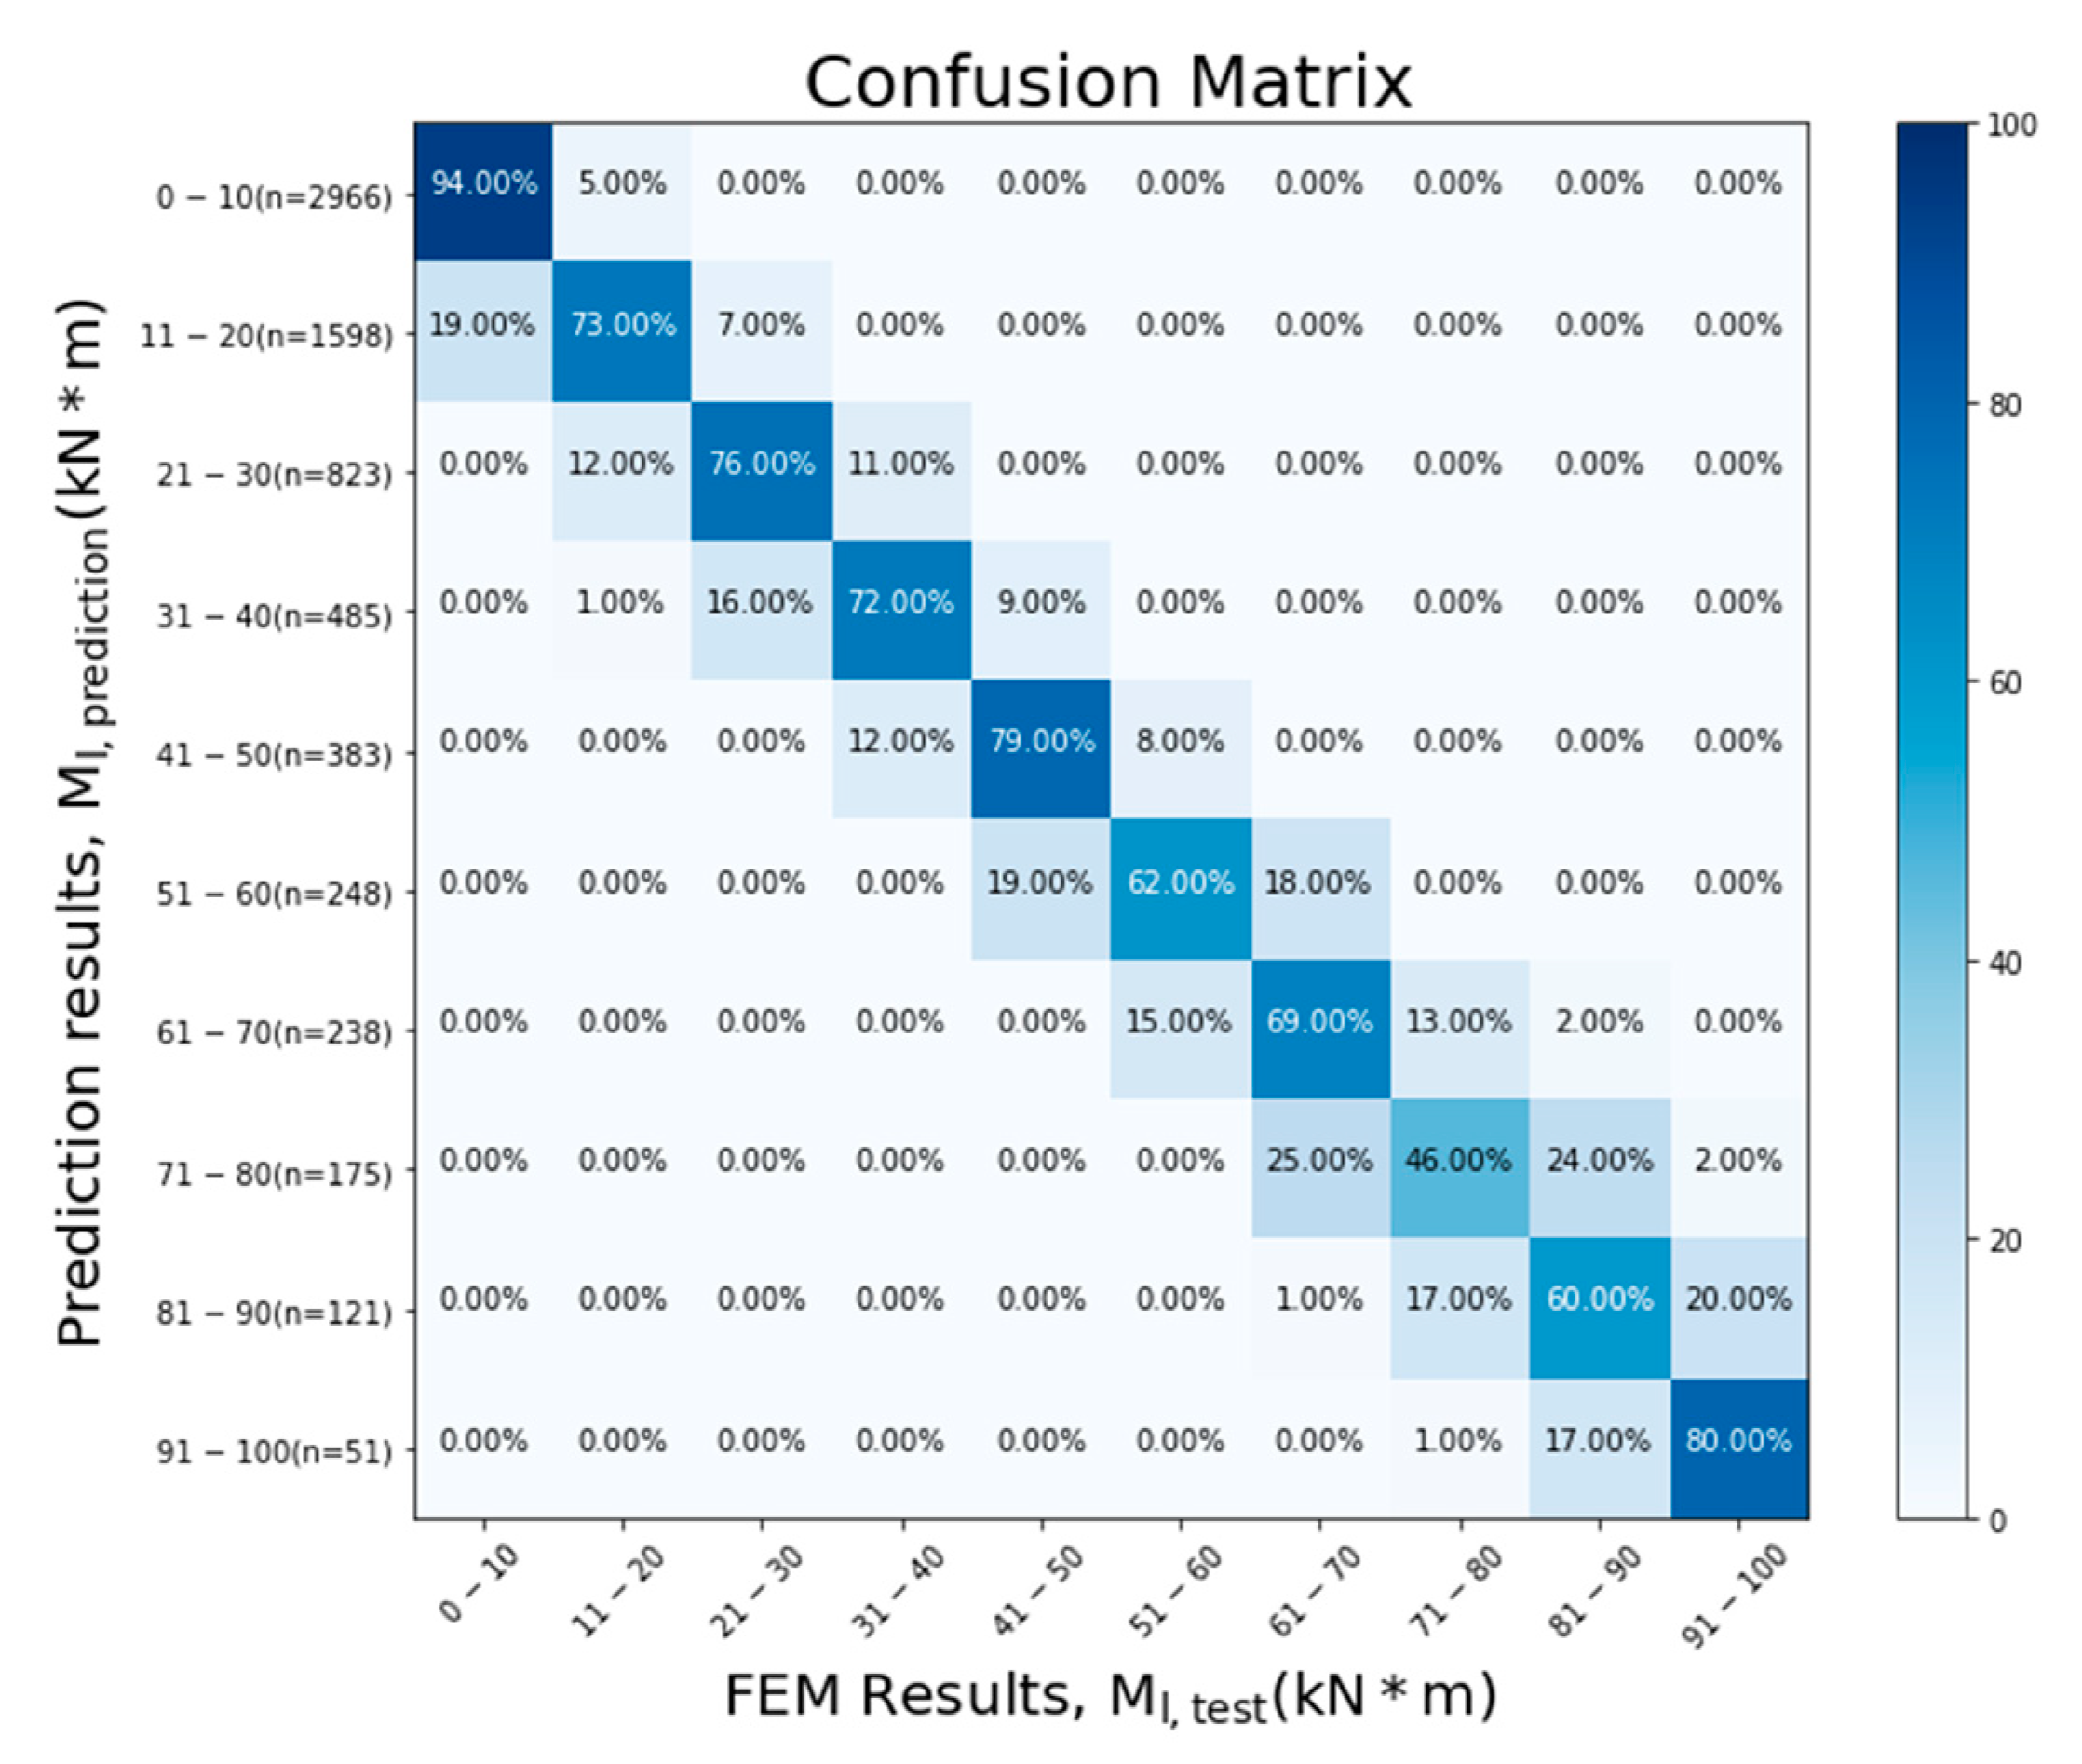
A confusion matrix helps to intuitively understand the data distribution between predicted and actual values. If the maximum lateral flange moments, which is the output of this model, is discretized, it is possible to construct a confusion matrix. The value of the maximum lateral flange moment of the test data set was discretized at intervals of 10 kN*m and a confusion matrix was constructed through predicted and finite element analysis results. The confusion matrix for the proposed model is provided in Figure 17. The percentage of the confusion matrix indicates the estimation accuracy. For each row, the sum of the accuracy is equal to 100%. Most of the predicted results are located within 1 section (±10 kN*m) of the finite element analysis results, and the concentration of values in the diagonal components of the confusion matrix confirms that this model shows high R 2 performance.

5. Conclusions

In this study, we proposed a maximum lateral flange moment estimation model using the DNN algorithm. According to the performance of the model on the test dataset, the proposed model can be effectively applied to the design of horizontally curved I-girder bridges. The approximate maximum lateral flange moment can be quickly and accurately estimated at the initial step, simplifying the design process. The conclusions are summarized as follows:
  • The stipulated equation demonstrated reasonable results as the curvature and flange width were reduced; however, it was confirmed that the error increased as the curvature and flange width increased. As the degree of curvature and flange width increased, the maximum lateral flange moment changed nonlinearly. However, the stipulated equation was not reflected. In particular, the flange width was not considered as a variable in the stipulated equation, and it was confirmed that the moment distribution varied according to the flange width. As the flange width increased, the lateral flange moment gradually increased, resulting in an increase in the maximum lateral flange moment values at the center of the span;
  • LASSO was performed to select the major features of the design parameters. According to the results of LASSO, the geometric conditions and boundary conditions, such as the number of girders, number of cross-frames, unbraced length ( L b ), curvature ( θ ), and number of spans, significantly influenced the warping behavior. In the case of the cross-section, it was confirmed that the flange width and height had a significant influence. However, the flange thickness ( t f ), cross-frame area ( A c ), and web thickness ( t w ) did not have a relatively larger effect compared with the other parameters within the design range, exhibiting a weight of zero;
  • A DNN-based model was proposed to estimate the maximum lateral flange moment of a horizontally curved I-girder bridge. Six neural network architectures were constructed according to the number of hidden layers and neurons. The models were compared using three evaluation indices: MAE, RMSE, and R2. The L5 N100 model, which showed the highest performance in terms of MAE, RMSE, and R2 indicators, was proposed as the final estimation model considering general performance and accuracy;
  • Verification was performed to determine whether the performance degradation problem caused by the parameter, which was a limitation of the proposed equation based on the V-load method, could be resolved using the proposed model. The performance evaluation confirmed that the distribution was very close to the y = x graph and exhibited high accuracy irrespective of the consideration of the parameters. Finally, it was confirmed that the performance degradation problem caused by the parameters can be solved using the proposed model.

Author Contributions

Conceptualization, J.L. and Y.J.K.; methodology, J.L. and S.R.; software, Y.J.K.; validation, S.R. and J.L.; formal analysis, S.R.; investigation, S.R., J.L. and Y.J.K.; resources, Y.J.K.; data curation, S.R.; writing—original draft preparation, S.R. and J.L.; writing—review and editing, S.R., J.L. and Y.J.K.; visualization, S.R.; supervision, Y.J.K.; project administration, J.L. and Y.J.K.; funding acquisition, Y.J.K. All authors have read and agreed to the published version of the manuscript.

Funding

This study was funded by a Korea Agency for Infrastructure Technology Advancement (KAIA) grant funded by the Ministry of Land, Infrastructure, and Transport (Grant 21CTAP-C163783-01).

Data Availability Statement

Not applicable.

Conflicts of Interest

The authors declare no conflict of interest.

References

  1. Davidson, J.S.; Keller, M.A.; Yoo, C.H. Cross-frame spacing and parametric effects in horizontally curved I-girder bridges. J. Struct. Eng. 1996, 122, 1089–1096. [Google Scholar] [CrossRef]
  2. AASHTO. Guide Specifications for Horizontally Curved Highway Bridges; American Association of State Highway Bridges: Washington, DC, USA, 1980. [Google Scholar]
  3. Steel, U.S. V-load analysis, an approximate procedure, simplified and extended for determining moments and shears in designing horizontally curved open framed highway bridges. USS Highw. Struct. Des. Handb. 1984, 1, 1–53. [Google Scholar]
  4. Hanshin. Guidelines for the Design of Horizontally Curved Girder Bridges; Hanshin Expressway Public Corporation: Osaka, Japan, 1988. [Google Scholar]
  5. Hoffman, J.J. Analytical and Field Investigation of Horizontally Curved Girder Bridges. Ph.D. Dissertation, Lowa State University, Ames, IA, USA, 2013. [Google Scholar]
  6. AASHTO. AASHTO LRFD Bridge Design Specifications, 7th ed.; American Association of State Highway and Transportation Officials: Washington, DC, USA, 2014. [Google Scholar]
  7. Oh, S.J.; Lim, C.O.; Park, B.C.; Lee, J.C.; Shin, S.C. Deep neural networks for maximum stress prediction in piping design. Int. J. Fuzz. Logic Intell. Syst. 2019, 19, 140–146. [Google Scholar] [CrossRef]
  8. Min, S.; Jeong, K.; Noh, Y.; Won, D.; Kim, S. Damage detection for tethers of submerged floating tunnels based on convolutional neural networks. Ocean Eng. 2022, 250, 111048. [Google Scholar] [CrossRef]
  9. Shu, J.; Zhang, Z.; Gonzalez, I.; Karoumi, R. The application of a damage detection method using Artificial Neural Network and train-induced vibrations on a simplified railway bridge model. Eng. Struct. 2013, 52, 408–421. [Google Scholar] [CrossRef] [Green Version]
  10. Zhou, Y.; Sun, L.; Peng, Z. Mechanisms of thermally induced deflection of a long-span cable-stayed bridge. Smart Struct. Syst. 2015, 15, 505–522. [Google Scholar] [CrossRef]
  11. Jeong, J.H.; Jo, H. Deep reinforcement learning for automated design of reinforced concrete structures. Comput.-Aided Civ. Infrastruct. Eng. 2021, 36, 1508–1529. [Google Scholar] [CrossRef]
  12. AASHTO. AASHTO LRFD Bridge Design Specifications, 9th ed.; American Association of State Highway and Transportation Officials: Washington, DC, USA, 2020. [Google Scholar]
  13. Barr, P.J.; Yanadori, N.; Halling, M.W.; Womack, K.C. Live-load analysis of a curved I-girder bridge. J. Bridge Eng. 2007, 12, 477–484. [Google Scholar] [CrossRef]
  14. SIMULIA. ABAQUS Manual; Dassault Systèmes Simulia Corp.: Johnston, RI, USA, 2022. [Google Scholar]
  15. Davidson, J.S.; Yoo, C.H. Local buckling of curved I-girder flanges. J. Struct. Eng. 1996, 122, 936–947. [Google Scholar] [CrossRef]
  16. KMCT. Design Manual for Highway Bridges; Ministry of Land, Infrastrucure and Transportation: Sejong, Republic of Korea, 2008.
  17. Lee, S.; Lee, K.; Lee, J. Damage detection in truss structures using deep learning techniques. J. Korean Associat. Spatial Struct. 2019, 19, 93–100. [Google Scholar] [CrossRef]
  18. Yang, Z.; Yu, C.H.; Buehler, M.J. Deep learning model to predict complex stress and strain fields in hierarchical composites. Sci. Adv. 2021, 7, eabd7416. [Google Scholar] [CrossRef] [PubMed]
  19. Wang, T.; Altabey, W.A.; Noori, M.; Ghiasi, R. A deep learning based approach for response prediction of beam-like structures. Struct. Durab. Health Monit. 2020, 14, 315. [Google Scholar] [CrossRef]
  20. Liang, L.; Liu, M.; Martin, C.; Sun, W. A deep learning approach to estimate stress distribution: A fast and accurate surrogate of finite-element analysis. J. R. Soc. Interface 2018, 15, 20170844. [Google Scholar] [CrossRef] [PubMed]
  21. Ramaswami, M.; Bhaskaran, R. A study on feature selection techniques in educational data mining. arXiv 2009, arXiv:0912.3924. [Google Scholar]
  22. Muthukrishnan, R.; Rohini, R. LASSO: A feature selection technique in predictive modeling for machine learning. In Proceedings of the 2016 IEEE International Conference on Advances in Computer Applications (ICACA), Coimbatore, India, 24–24 October 2016. [Google Scholar]
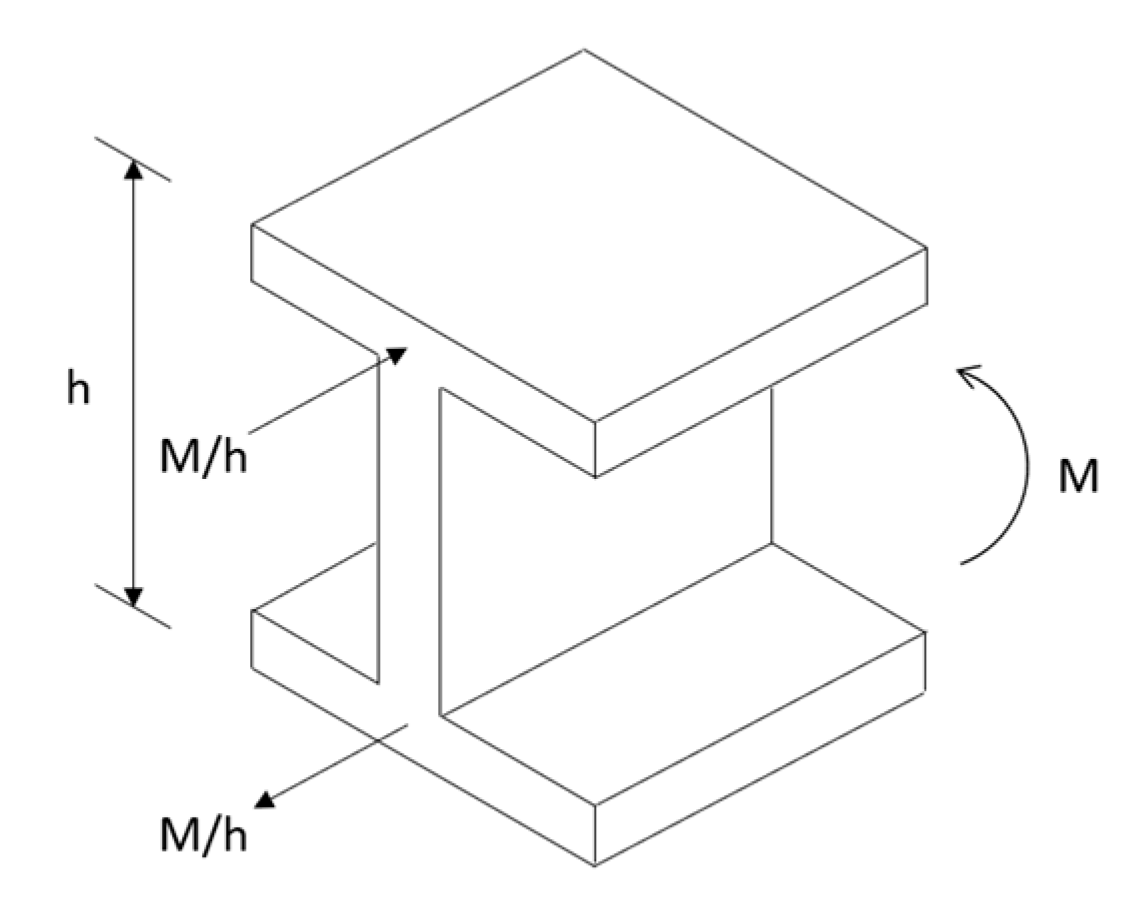
Figure 1. Moment equilibrium of an I-type cross-section.
Buildings 13 00317 g001
Figure 2. Vertical and horizontal components of forces caused by moments.
Buildings 13 00317 g002
Figure 3. Load transfer through a cross-frame.
Buildings 13 00317 g003
Figure 4. Shear force acting on the cross-frame.
Buildings 13 00317 g004
Figure 5. Finite element model. (a) Boundary condition, (b) Finite element representation.
Buildings 13 00317 g005
Figure 6. Analysis conditions applied in previous studies.
Buildings 13 00317 g006
Figure 7. Validation results of the structural analysis model.
Buildings 13 00317 g007
Figure 8. Concrete deck specific weight calculation. (a) Loading condition, (b) Free-body diagram of the girder system.
Buildings 13 00317 g008
Figure 9. Research flow chart.
Buildings 13 00317 g009
Figure 10. k-fold cross-validation and datasets.
Buildings 13 00317 g010
Figure 11. Results of the L5 N100 model (k = 2). (a) Training curve, (b) Accuracy graph.
Buildings 13 00317 g011
Figure 12. Maximum lateral flange moment and moment distribution considering the flange width. (a) Degree of curvature, (b) Flange width.
Buildings 13 00317 g012
Figure 13. Maximum lateral flange moment and moment distribution with the degree of curvature. (a) Maximum lateral flange moment, (b) Lateral flange moment distribution.
Buildings 13 00317 g013
Figure 14. Maximum lateral flange moment and moment distribution with the flange width. (a) Maximum lateral flange moment, (b) Lateral flange moment distribution.
Buildings 13 00317 g014
Figure 15. Lateral displacements and deformation shapes according to the flange width. (a) Flange width: 150 mm, (b) Flange width: 650 mm.
Buildings 13 00317 g015
Figure 16. Estimated maximum lateral flange moment and FEA results according to design parameters. (a) Degree of curvature, (b) Flange width.
Buildings 13 00317 g016
Figure 17. Confusion matrix for the test data set.
Buildings 13 00317 g017
Table 1. Considered design range in finite element analysis.
ParameterMinMaxEA
No. of Cross-frame397
No. of Girder243
Cross-frame Area ( mm 2 )100010,0003
Span Length ( mm )30,00060,0003
Girder Spacing ( mm )200040002
Number of Spans (EA)133
Height and Width Ratio (H/ b f )353
Height and Length Ratio (H/L)1/201
Degree of Curvature (°)5353
Flange Thickness ( mm )10402
Web Thickness ( mm )10152
Total FEA data set40,824
Table 2. Hyperparameters considered in the neural network algorithm.
ParameterValue
Batch size32
Learning rate0.001
Number of neurons
at the output layer
1
Activation functionReLU
Loss functionMSE
OptimizerAdam
Epoch100
Table 3. LASSO weight results.
ParameterNumber of GirdersNumber of Cross-Frames L b L θ b f
Weight−14.49778.375300.136−45.94384.37910.175
Parameter t f t w h A c S Number of Spans
Weight0.2300−5.041−0.3884.216−94.079
Table 4. Comparison of performance before and after applying feature selection using LASSO.
ModelDatasetR2RMSEMAE
K = 1K = 2K = 3K = 4K = 5K = 1K = 2K = 3K = 4K = 5K = 1K = 2K = 3K = 4K = 5
(1)Test0.960.960.960.960.9620.722.220.322.320.09.2413.311.010.412.2
Average0.9621.111.228
(2)Test0.970.970.970.970.9718.919.718.619.018.110.212.110.69.979.95
Average0.9718.8610.564
Table 5. Performance comparison of six deep learning architectures.
ModelDatasetR2RMSEMAE
K = 1K = 2K = 3K = 4K = 5K = 1K = 2K = 3K = 4K = 5K = 1K = 2K = 3K = 4K = 5
L1 N50Test0.970.970.970.970.9718.919.718.619.018.110.212.110.69.979.95
Average0.9718.8610.564
L5 N50Test0.991.00.990.980.9913.17.678.8213.98.877.604.945.205.574.38
Average0.9910.4725.538
L8 N50Test0.980.990.990.990.9816.612.710.38.7516.098.926.604.375.417.72
Average0.98612.8886.604
L1 N100Test0.970.970.970.980.9717.519.619.719.716.569.338.489.4713.49.20
Average0.97218.6129.976
L5 N100Test1.001.001.001.001.008.506.567.317.728.683.753.963.804.203.99
Average1.007.7543.94
L8 N100Test0.990.990.990.990.998.659.497.779.979.085.436.954.284.424.46
Average0.998.9925.108
Disclaimer/Publisher’s Note: The statements, opinions and data contained in all publications are solely those of the individual author(s) and contributor(s) and not of MDPI and/or the editor(s). MDPI and/or the editor(s) disclaim responsibility for any injury to people or property resulting from any ideas, methods, instructions or products referred to in the content.