Article

Study on the Evolution Law of Internal Force and Deformation and Optimized Calculation Method for Internal Force of Cantilever Anti-Slide Pile under Trapezoidal Thrust Load

1
State Key Laboratory of Mountain Bridge and Tunnel Engineering, Chongqing Jiaotong University, Chongqing 400074, China
2
School of Civil Engineering, Chongqing Jiaotong University, Chongqing 400074, China
*
Author to whom correspondence should be addressed.
Buildings 2023, 13(2), 322; https://doi.org/10.3390/buildings13020322
Submission received: 24 December 2022 / Revised: 16 January 2023 / Accepted: 17 January 2023 / Published: 21 January 2023
(This article belongs to the Special Issue Intelligent Building Health Monitoring and Assessment)

Abstract

:
The evolution law of internal force and deformation of an anti-slide pile affects the slope stability and prevention design in a significant way. Based on the similarity theory, a test system for the bearing characteristics of a cantilever anti-slide pile was constructed, and the physical model test for the bearing characteristics of a cantilever anti-slide pile under trapezoidal thrust load was carried out. The distribution laws of internal force and deformation of a cantilever anti-slide pile were revealed, and the optimized calculation method for internal force of a cantilever anti-slide pile was proposed by taking the elastoplastic characteristics of steel bars and concrete into consideration. Furthermore, a numerical model was employed to conduct a parametric analysis of a cantilever anti-slide pile. The results show that the whole process of stress and deformation of a cantilever anti-slide pile can be classified as the uncracked stage, the cracks emerging and developing stage, and the steel bars yielding–failing stage. In the uncracked stage, the bending moment of the cantilever anti-slide pile calculated by the traditional method is smaller than that calculated by the optimized calculation method established in this paper. The traditional calculation method is no longer applicable in the stage of cracks emerging and developing. The lateral displacement and bending moment of the cantilever anti-slide pile are negatively and positively correlated with the strength of the pile material, respectively, and the influence of the deterioration of steel bars’ strength on the ultimate bearing performance of the anti-slide pile is more obvious than that of the deterioration of concrete strength. The bearing capacity of the anti-slide pile could not be significantly improved by increasing the length of the anchored section when the strength of the rock stratum embedded in anchored section was large enough. As the thrust load behind the pile increased, the difference of the bearing performances of the cantilever anti-slide pile under the uniform load and trapezoidal load increased gradually. The research results can provide guidance for the evaluation of the service performance of the cantilever anti-slide pile and the slope stability.

1. Introduction

Due to the advantages of a flexible structure and strong resistance, anti-slide pile has become the most widely used slope prevention technology in the field of geotechnical disaster prevention and mitigation since the 1930s [1]. However, with the anti-slide pile structures gradually entering the middle or even aging stage of their service life, how to evaluate their service status in the whole life cycle has become one of the most important key issues in this field. The service performance of an anti-slide pile depends heavily on its initial design level and service conditions. However, at present, the structural design of the anti-slide pile depends more on engineering experience and the industry standard, and the relevant theoretical system is still far behind the engineering application. There are many cases of economic waste caused by an over-conservative design of anti-slide pile structures, and more and more cases of early instability and failure due to insufficient control of the structure itself and geological environment conditions. With the temporal and spatial evolution of the service environment, the working state of the anti-slide pile will always be in a dynamic process during the service period. It is particularly urgent to strengthen the monitoring of the stress and deformation of the anti-slide pile to obtain the bearing characteristics and then evaluate the preventive effect or service status.
The research methods of internal force and deformation of the anti-slide pile mainly include field monitoring or numerical simulation for outdoor prototype piles and physical model tests or numerical simulations on indoor scale piles. Zhang et al. [2] and Zhou et al. [3] used a vibrating wire reinforcement meter or strain gauges to monitor the stress state of steel bars in anti-slide piles for a long time and obtained the stress characteristics of piles. Zhang et al. [4] and Zhang et al. [5] conducted long-term dynamic monitoring on the target anti-slide pile by laying optical-fiber-sensing equipment and carried out the inverse analysis on the internal force of the pile. However, due to the lack of monitoring equipment at the initial stage of the construction of some in-service prototype piles and the complexity of on-site monitoring, the physical model test or numerical simulation on indoor scaled piles have become a very effective method to analyze the bearing performance of anti-slide piles [6]. Hu et al. [7] and Zhang et al. [8] obtained the distribution law of the bending moment of the test anti-slide pile at the initial stage of loading by monitoring the strain evolution process of the pile concrete. Wei et al. [9] and Xie [10] obtained the internal force distributions at different sections of the large test pile by welding reinforcement meters on the steel bars. Cao [11], Li et al. [12], and Li et al. [13] monitored the evolution law of internal force in the whole loading process of test piles by laying steel strain gauges. As indicated above, all studies deduced the distribution of internal force of the test pile by monitoring the stress and strain states of concrete and steel bars. However, the internal force of the test pile in the linear elastic stage was only analyzed [7,8], and the anti-slide pile was considered as a homogeneous elastomer in the whole calculation process of internal force [9,10,11,12,13]. In fact, the concrete and steel bars of the piles are all elastic-plastic materials, and ignoring the plastic characteristics of the concrete and steel bars will significantly affect the calculation results of the internal force. Moreover, the monitoring methods are only applicable to the stress monitoring of outdoor anti-slide piles due to the large size of reinforcement meter [9,10]. In conclusion, the calculation of internal force of the anti-slide pile in laboratory model test lacks reasonable theoretical analysis, the whole process analysis of internal force and deformation under external load has not been carried out, and the nonlinear characteristics and internal force calculation method of anti-slide piles need to be further studied.
In view of this, based on a cantilever anti-slide pile treatment project in Nan’an District of Chongqing City, China, an indoor physical model test on the bearing performance of the cantilever anti-slide pile under trapezoidal load was carried out in this study. Considering the evolution process of the stress–strain constitutive relationship of the pile materials, the optimized calculation method for internal force of the cantilever anti-slide pile was proposed, and the whole process of the stress and deformation and the nonlinear characteristics of the internal force of the pile was explored. It is expected to provide a reasonable evaluation standard for the working state of cantilever anti-slide piles during the service period, and further optimize the structural design.

2. Model Test

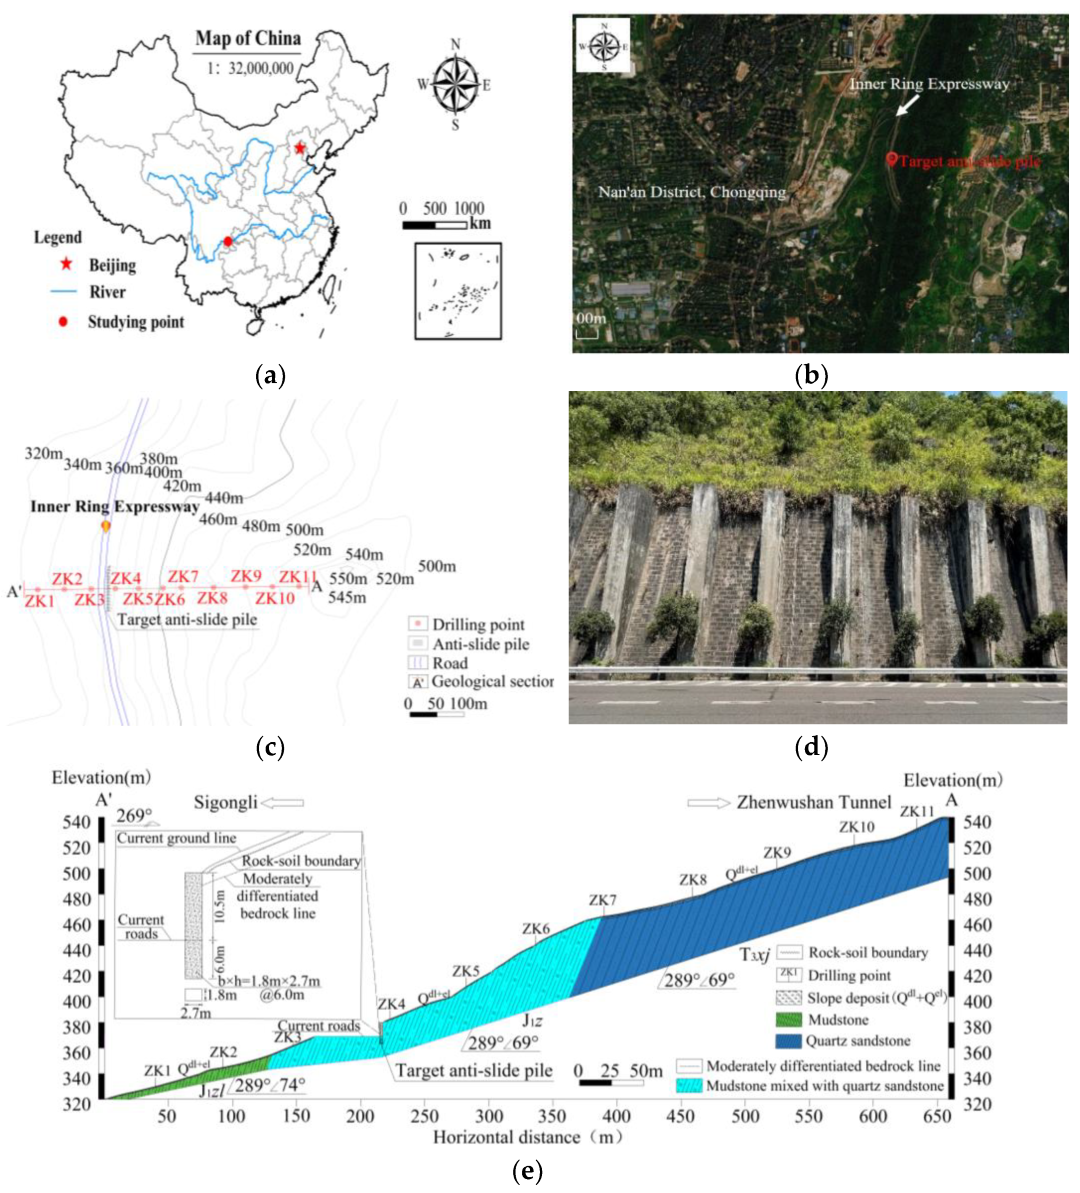
2.1. Engineering Background

The prototype pile of this test is derived from a cantilever anti-slide pile treatment structure located in the inner ring of Nan’an District, Chongqing, China, the upper part of the slope treated by the target anti-slide pile is covered with 0~1 m Quaternary eluvial slope gravelly soil and rock block soil, and the lower bedrock is 56~269 m purple mudstone with quartz sandstone of the Lower Jurassic Zhenzhuchong Formation (J1z). The attitude of the rocks is 289°∠69°, and its strike is roughly the same as that of the slope direction, as shown in Figure 1. A total of about 50 cantilever anti-slide piles were designed for the slope protection project (only 15 are shown in Figure 1c). The sectional width and sectional height of the cantilever anti-slide pile section were 1.8 m and 2.7 m, respectively. The pile length was 16.5 m, of which the loaded section and the anchored section were 10.5 m and 6.0 m, respectively, and the pile spacing was 6.0 m. C30 concrete was adopted for the anti-slide pile, and HRB400 steel bars were used for the steel bars of the pile. The tensile steel bars at the rear side of the pile were 42 Buildings 13 00322 i001 32, and the reinforcement ratio was 0.69%. The structural steel bars at the front side and the steel bars at both sides of the pile were 7 Buildings 13 00322 i001 25, and the stirrup was 1 Buildings 13 00322 i001 14 with a spacing of 100 mm, as described in Table 1.

2.2. Experimental Design

2.2.1. Determination of Model Test Similarity

Relying on the above slope as the prototype and considering the conditions of the indoor model field, the model test on the bearing performance of the cantilever anti-slide pile under lateral load was conducted based on the similarity theory. The geometric dimension and the elastic modulus of the anti-slide pile were selected as the control quantities. The similarity relation of geometric dimensions ( C l ), elastic modulus ( C E ), and the steel ratio ( C ρ ) of the test pile were selected as the basic similarity ratio, and C l , C E , C ρ were defined as 15, 1, and 1, respectively. The dimensional analysis method was used to determine the similarity of other physical quantities, as listed in Table 2.

2.2.2. Geometric Dimensions and Material Properties of the Test Pile

According to the similarity constants of individual physical quantities in Table 2, the dimensions and reinforcement information of the test pile are presented in Figure 2 and Table 3. The concrete grade of the test pile was determined to be C30, and the thickness of concrete cover was 20 mm. The pile length (L) is 1.1 m, in which the loaded section and the anchored section were 70 cm and 40 cm, respectively. The sectional width (b) and the sectional height (h) were 10 cm and 15 cm, respectively. The tensile steel bars at the rear side of the test pile were composed of two steel bars with a diameter of 8 mm (N1), and the steel ratio (ρ) was 0.67%. The structural steel bars at the front side of the test pile were composed of two steel bars with a diameter of 6 mm (N2), and the stirrup was composed of one steel bar with a diameter of 6 mm and a spacing of 106 mm (N3).

2.2.3. Distribution Form of Thrust Load of the Test Pile

(1) Selection of the distribution form of the thrust load
The distribution form of the landslide thrust behind the cantilever anti-slide pile is complex, and it does not change regularly along the pile depth. According to the Chinese specification (GB/T 38509-2020) [14], the distribution of landslide thrust in the loaded section of anti-slide pile can be divided into three forms: triangle, trapezoid, and rectangle, and the specific distribution form should be determined according to the nature and geometric characteristics of the sliding mass. The determination of the actual distribution form of landslide thrust is mostly based on an indoor model test, field test, and numerical simulation. Liu et al. [15] established a function model of the thrust distribution form based on the analysis of field measured data at home and abroad, indicating that the thrust distribution form of a sand and clay sliding mass should be considered as triangular or parabolic, and the distribution form between them should be trapezoidal. In the first section of this article, the rock slope behind the target anti-slide pile was covered with 0~1 m eluvial soil layer and 2~3 m strongly weathered rock layer. Therefore, it is more consistent with the actual working conditions to assume that the thrust distribution form behind the actual anti-slide pile is trapezoidal, as illustrated in Figure 3. The upper load and lower load of trapezoidal load are q1 and q2, respectively, and the length of the loaded section is l.
(2) Application mode of thrust
The distribution form of the trapezoidal thrust load behind the anti-slide pile mentioned above is a theoretical assumption, and the idealized trapezoidal thrust load should be simplified as a concentrated force in the indoor test. According to the mechanical characteristics of a cantilever anti-slide pile, it is regarded as a cantilever beam subjected to trapezoidal load. Based on the principle of equivalence (the same load location, the same total load value, and the economic and reasonable equivalent error), the trapezoidal load of an anti-slide pile is equivalently replaced by the concentrated force. In the process of replacement, the accuracy of the result of load equivalence is directly determined by the number, value, and position of the concentrated force. The existing research on the bearing performance of the anti-slide pile mainly concentrates on the bending moment and deformation, where the maximum bending moment of the pile and the maximum deflection at pile top are the main criteria. Therefore, the cantilever beam structure was taken as an example in this paper, and the maximum bending moment and maximum deflection of the cantilever beam were taken as the indicators to discuss the optimum equivalent scheme, so as to finally obtain the distribution form, number, location, and value of the corresponding concentrated load. The specific equivalent calculation method is as follows.
(1)
According to the distribution of trapezoidal load in Figure 3, the proportion of the upper load and lower load of the trapezoidal load (n) were set as 1:3, 1:4, 1:5, and 1:6, respectively (i.e., if q1 = q, q2 = nq, then n = 3, 4, 5, 6).
(2)
According to the trapezoidal load distribution form in step (1), the centroid position (yc) of different trapezoidal loads was determined by Equation (1), which is the resultant point of the landslide thrust. Then, the total shear force (F) and the maximum bending moment (M) under different trapezoidal loads were calculated, as shown in Equations (2) and (3).
(3)
The arrangement scheme of concentrated force in the process of the loading test was proposed as follows. (Ⅰ) Assuming the number of concentrated forces was m, three layout schemes (m = 3, 4, 5) were calculated in this paper. (Ⅱ) Assuming i was the serial number of the concentrated force (i = 1, 2, m, numbered from top to bottom), then Fi is the size of the i-th concentrated force. The ratio of i:1 was determined to distribute Fi to equal the total shear force (F) of the trapezoidal load. Taking m = 4 as an example, then F2 = 2F1, F3 = 3F1, F4 = 4F1, and F1 + F2 + F3 + F4 = F, and the others are similar. (Ⅲ) Taking m = 3 as an example in the process of solving the concentrated force position, the distance from F1 to the free end and the distance from F3 to the fixed end should be made equal firstly and made to be d1. Then, the distance between F2 and F1 and between F2 and F3 should be guaranteed to be equal and made to be d2, where 2 (d1+ d2) = l. Finally, the location of each concentrated force (xi) was calculated through the principle of M = Mm, and the others are similar. (Ⅳ) The maximum deflections of the cantilever beam under different trapezoidal loads (ω) and different concentrated forces (ωm) were calculated by using Equations (5) and (6), respectively, for deflection comparison. The final calculation results are listed in Table 4.
It can be seen from Table 4 that the greater the proportion of the upper load and lower load of the trapezoidal load (n), and the smaller the number of concentrated forces (m), the smaller the error of equivalent schemes (D), and D3 is the smallest when n = 6 and m = 3. Therefore, three concentrated forces are finally loaded in this study, where F1, F2, and F3 are located at 0.86l, 0.50l, and 0.14l of the loaded section of the test pile, respectively, and F1 = F/6, F2 = F/3, and F3 = F/2, respectively.
y c = n + 2 3 ( n + 1 ) l
F = n + 1 2 q l
M = n + 2 6 q l 2
M m = i = 1 m F i * x i
ω = q l 4 E I ( n 1 30 + 1 8 )
ω m = i = 1 m F i x i 2 6 E I ( 3 l x i )
where q is the size of the upper load, and E and I are the elastic modulus and inertia moment of the cantilever beam, respectively.

2.3. Raw Materials

Ordinary Portland cement, sand, gravel, tap water and admixture were used to prepare concrete. Ordinary Portland cement with the strength grade 42.5 (P.O 42.5) was used to prepare concrete with the strength grade of C30, and its parameters met the requirements of Chinese specification (GB 175-2020) [16]. The fine aggregate was the ordinary river sand produced locally in Chongqing, and the fineness modulus was 2.78. The coarse aggregate was continuous graded limestone gravels, and the particle size range was 5~20 mm. The water was tap water, and GJ-1 superplasticizer with a water reduction of 22% was selected as the additive. The mix proportion of the pile concrete was calculated according to the Chinese specification (JGJ 55-2011) [17], and is listed in Table 5. The measured performances of concrete and steel bars are displayed in Table 6 and Table 7, respectively.

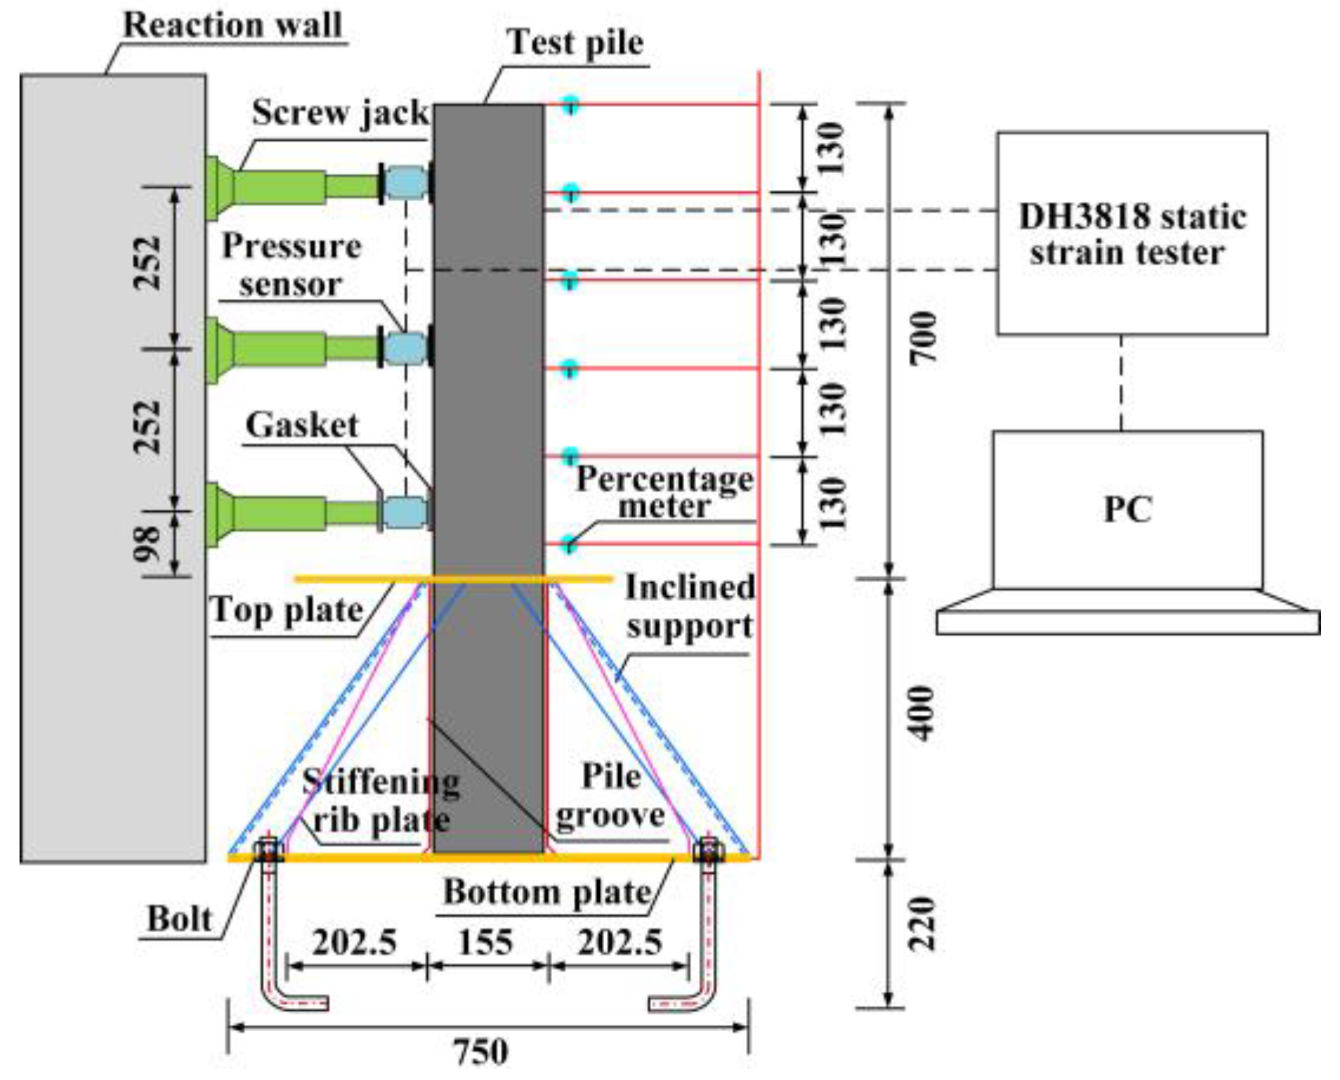
2.4. Device System for the Model Test

In order to simulate the cantilever anti-slide pile subjected to the trapezoidal load, a test system for the bearing performance of the cantilever anti-slide pile under the trapezoidal load was independently developed and fabricated, as shown in Figure 4 and Figure 5. The system is mainly composed of the test pile fixing system, thrust loading system, and data acquisition system. These systems are introduced as follows.

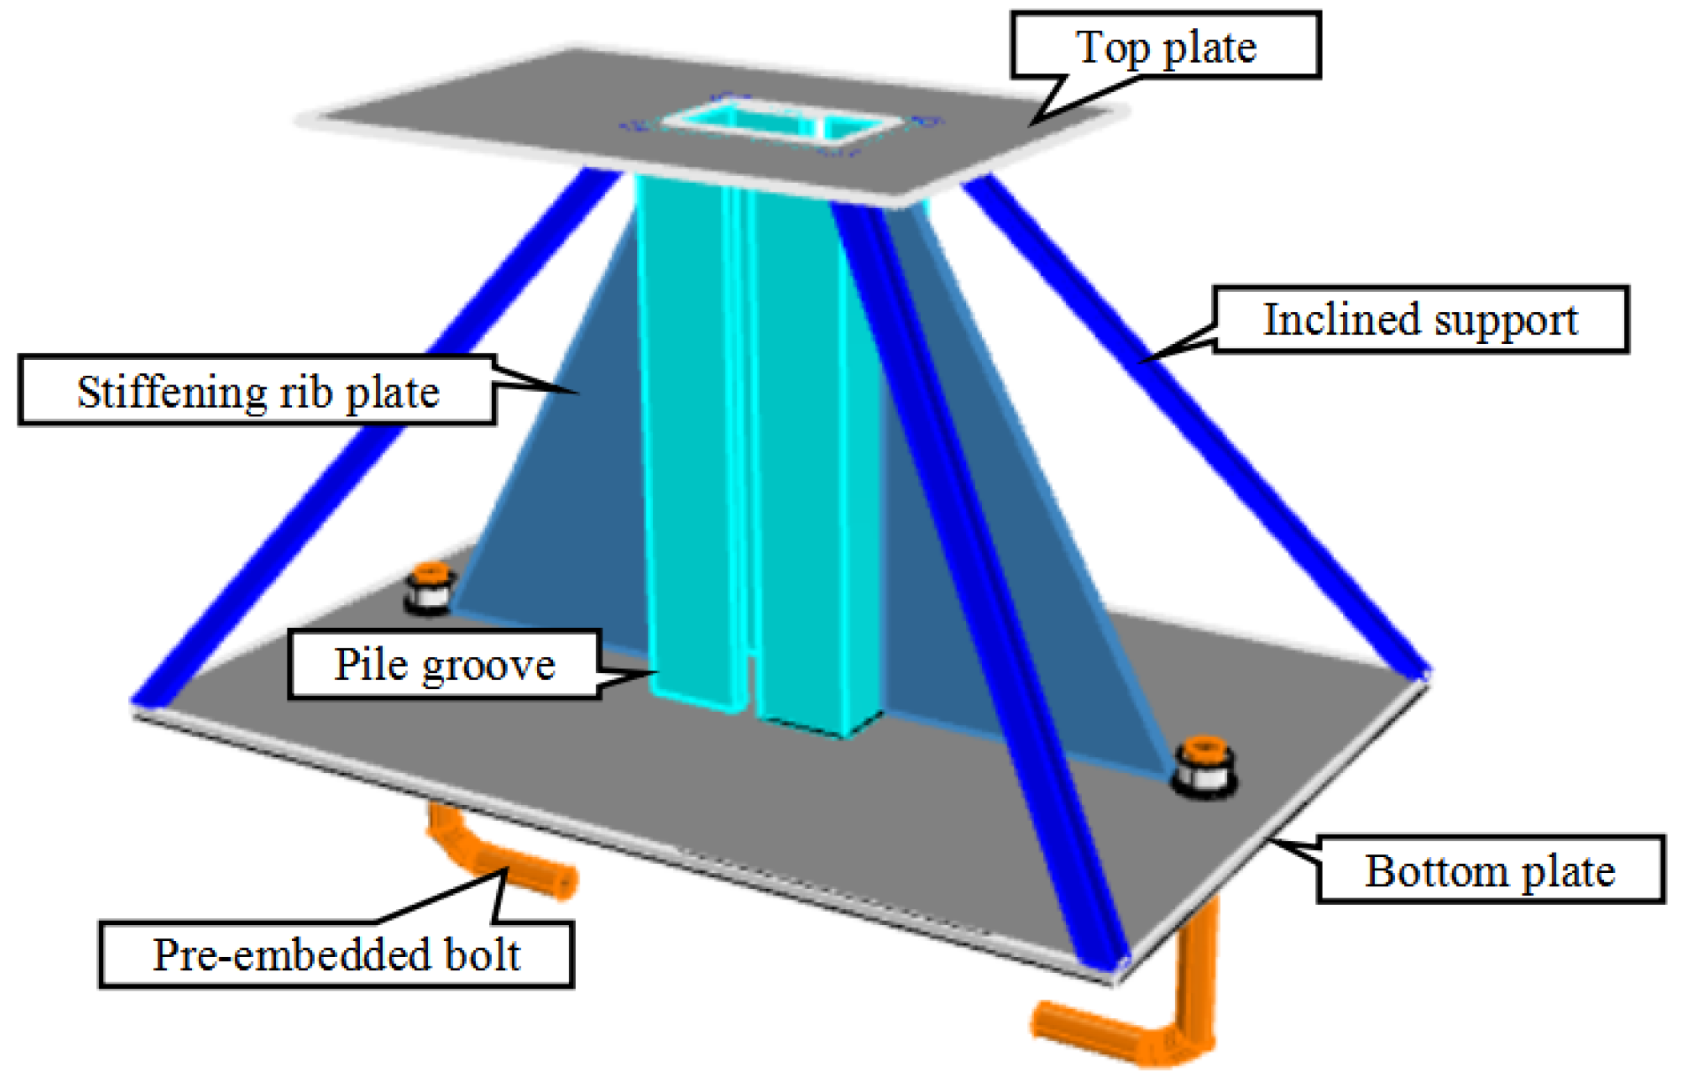
2.4.1. Fixing System

The test pile fixing system was mainly constructed by connecting the high-strength bolt embedded in the rigid foundation (the rigid foundation was mainly made of in-situ cast concrete and steel bars) with the steel support, which was used to fix the test pile to simulate the anchored section of the actual cantilever anti-slide pile. The steel support was welded by channel steel, angle steel, and steel plate, and its grade was Q235. The fixed part of the test pile was the pile groove formed by channel steel. Considering the dimensional error in the pouring process of the test piles, the size of the pile groove should be slightly larger than the section size of the test piles to facilitate the placement of the test piles, the size of the pile groove was designed as 105 mm × 155 mm, and the thickness of the pile groove was 10 mm. The stiffening rib plate was welded on the side of pile groove and the inclined supports (6 mm thick, mainly made of angle steel) were set at the four corners of the bottom plate to stabilize the pile groove. A rectangular working platform (top plate) was installed on the top of the pile groove, and its dimensions and thickness were 455 mm × 305 mm and 6 mm, respectively. The dimensions of the bottom plate were 750 mm × 500 mm, and its thickness was 10 mm. In order to ensure the stability of the steel support, the pre-embedded bolt component was set at the front and rear sides of the bottom plate of the steel support, which were anchored with the rigid foundation, and then the pile groove transmitted the thrust load to the pre-embedded bolt through the stiffened rib plate and inclined support to obtain the reaction force. The pre-embedded bolts adopted M20 bolts (matched with flat washer and nut), and the embedded length was about 230 mm. The three-dimensional concept diagram of the test pile fixing system is illustrated in Figure 6.

2.4.2. Thrust Loading System

The thrust loading system was mainly composed of reaction wall, screw jack, and pressure sensor. The basic principle is that the trapezoidal load is applied by three jacks and reacting on the reaction wall and transferred to the test pile through the pressure sensor, as shown in Figure 5. The jacks were all screw jacks with a maximum lifting capacity of 10 t produced by Shanghai Baoshan Hugong Group, and were arranged at 9.8 cm, 35 cm, and 60.2 cm of the loaded section, as illustrated in Figure 7. The pressure sensor only played the role of load transfer in the thrust loading system, and its parameters are introduced in the following data acquisition system.
The monotonic and graded method was applied in the loading process of the trapezoidal load, and the single-stage loading process mainly includes the loading stage and the holding stage. The loading magnitude (Fl), the loading step length (ΔF), the loading rate (Vl), the loading time (tl) and the holding time (th) should be controlled during the loading process. He et al. [18], Zhou et al. [19] and Chen et al. [20] adopted the same loading method in the loading test of test pile, which kept ΔF, Vl, tl and th constant in the whole loading process. This method is only applicable to a type of test where the test pile does not produce cracks during the whole loading process. Therefore, the bearing characteristics experiments of the test pile were carried out according to Chinese specification (GB/T 50152-2012) [21].
(1) Loading magnitude (Fl)
Before the formal loading of the test pile, it was necessary to conduct a pre-loading experiment on the test pile to examine the stability of the loading system and check whether the various original components can operate normally, and then the formal loading of the test pile could only be carried out after the debugging. According to Chinese specification (GB/T 50152-2012) [21], the load size during the pre-loading was about 10% of the estimated ultimate load (0.1Fu, Fu = 60 kN), and it was loaded three times in stages, and 2 kN in a single stage. The loading experiment was loaded from 0 kN until the test pile was damaged after the pre-loading.
(2) Loading step length (ΔF)
The loading step length (ΔF) in the loading process of the test pile should be determined by the loading magnitude (Fl), ultimate bearing capacity (Fmax), and loading rate (Vl). The loading step lengths of each level before and after the cracking of the test pile should be about 5% Fu and 10% Fu, respectively. When the load reached 90% Fu, the loading step length of each stage was loaded at 5% Fu until the test pile was damaged. Therefore, before the test pile cracked, the loading step length of the jack 1, jack 2, and jack 3 (ΔF1, ΔF2, ΔF3) in the loaded section were designed to be 0.5 kN, 1.0 kN, and 1.5 kN, and increased to 1.0 kN (ΔF1′), 2.0 kN (ΔF2′), and 3.0 kN (ΔF3′) after the cracking of the test pile. When the load reached 90%Fu, ΔF1, ΔF2, and ΔF3 were designed to be 0.5 kN, 1.0 kN, and 1.5 kN until the end of the test.
(3) Loading rate (Vl), loading time (tl), and holding time (th)
Referring to the loading method of indoor concrete members [22,23], it was found that the reasonable loading rate (Vl) in the loading process is 10~30 N/s. In order to avoid possible adverse effects caused by excessive loading rate, the loading rates of jack 1, jack 2, and jack 3 proposed in this paper are 10 N/s, 20 N/s, and 30 N/s, respectively. The loading time (tl) is determined by the loading step length (ΔF) and the loading rate (Vl), and the single-stage loading times before and after cracking was determined to be 50 s and 100 s, respectively. When the load reached 90% Fu, the single-stage loading time was 50 s. After the thrust load was applied, the loading state was maintained for 100 s (th) to ensure that the applied trapezoidal load was fully transferred to the test pile, the data of all monitoring elements were stable, and then the next loading step was performed. The loading method is illustrated in Figure 8.

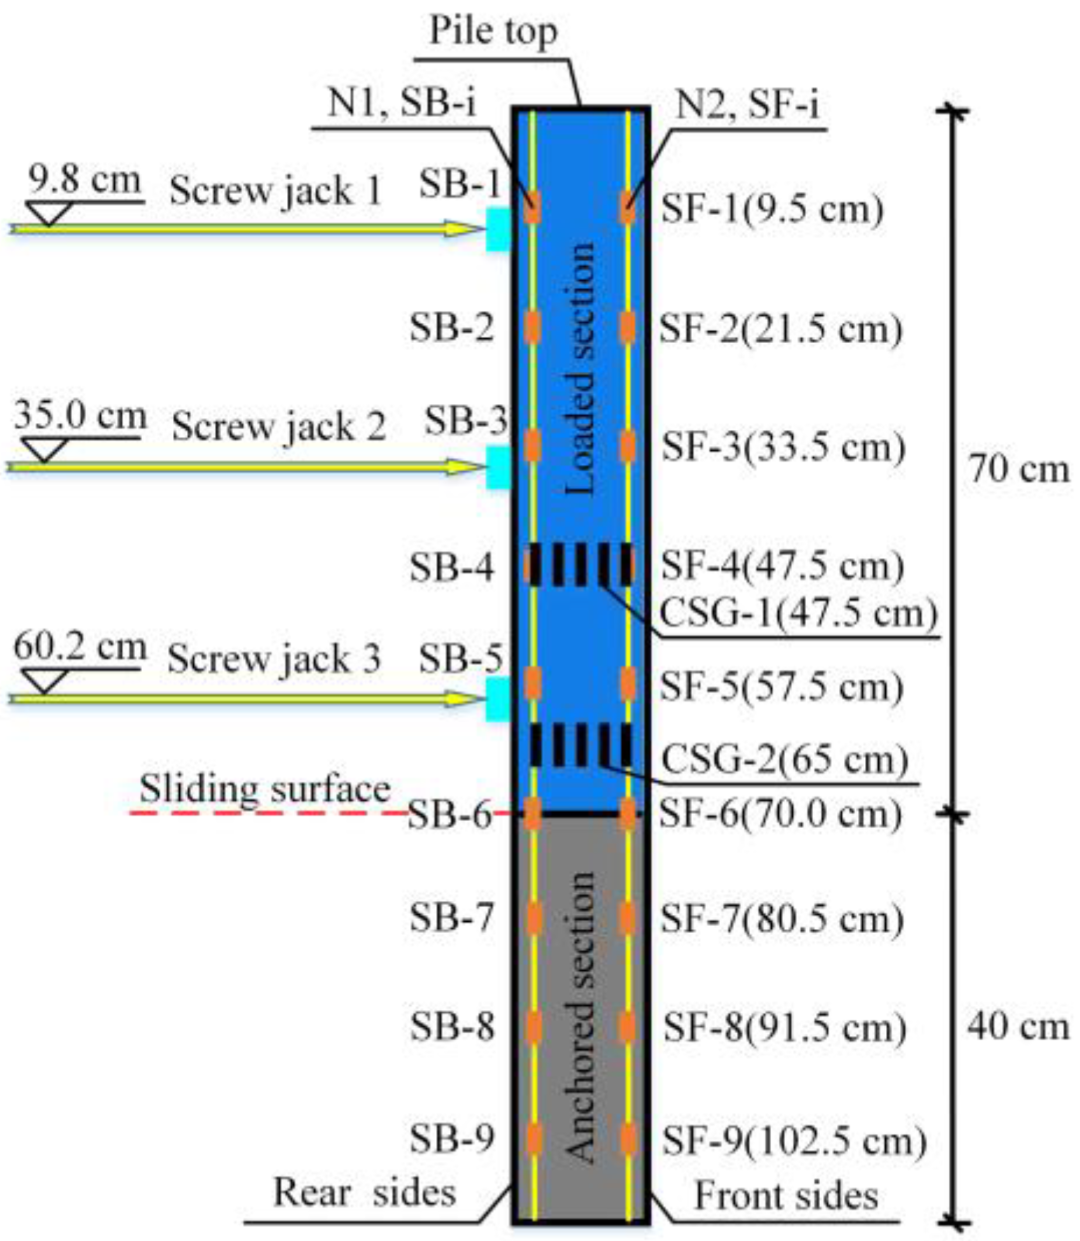
2.4.3. Data Acquisition System

The data acquisition system mainly contains the percentage meter, strain gauge, pressure sensor, DH3818 static strain tester, and a laptop computer equipped with DHDAS dynamic signal acquisition system. The percentage indicator was applied to obtain the lateral displacement of the test pile, and a total of six percentage indicators (DIs) were arranged along the loaded section of the test pile in this experiment, which were 0 cm, 13 cm, 26 cm, 39 cm, 52 cm, and 65 cm from the pile top, respectively, as illustrated in Figure 9. The strain gauges on the steel bars were applied to measure the steel bars’ strains of the test pile and the type was BE120-3AA. It was arranged in two rows of 18 places on the tensile steel bars and the structural steel bars of the test pile, which were 9.5 cm, 21.5 cm, 33.5 cm, 47.5 cm, 57.5 cm, 70.0 cm, 80.5 cm, 91.5 cm, and 102.5 cm from the pile top, respectively. The concrete strain gauges were applied to measure the concrete strains of the test pile and the type was BX120-50AA. It was arranged in two rows of 10 places on Side B of the test pile (CSG-1,CSG-2), which were 47.5 cm and 65.0 cm from the pile top, respectively (Figure 7). The pressure sensors were arranged between the screw jacks and the test pile to obtain the applied loads. The type was CZLYB-1A and the measuring range was 50 kN.

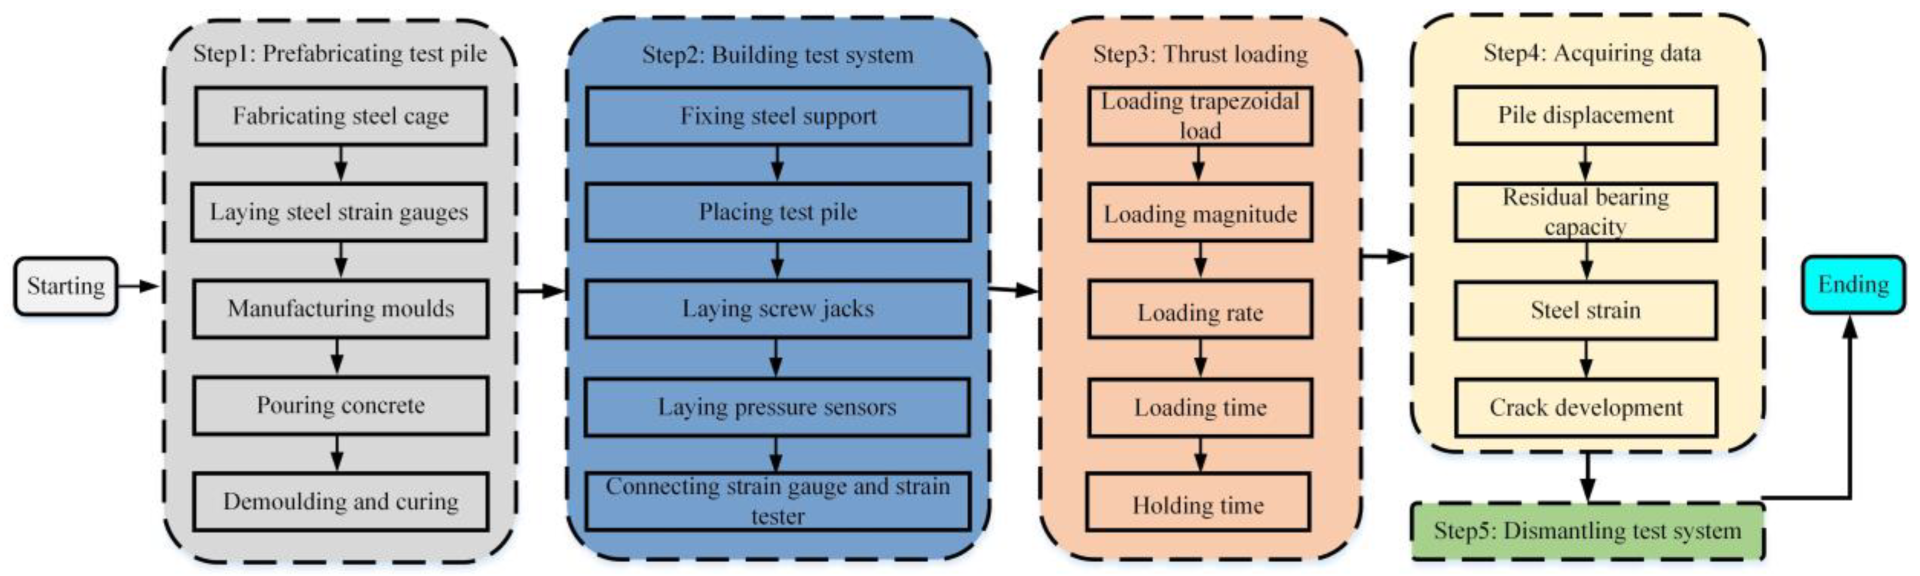
2.5. Experimental Procedures

Figure 10 shows the main steps of this test. In Step 1, the steel strain gauges were posted according to the steel strain gauge arrangement scheme shown in Figure 7. Then the tension steel, structural steel, and the hoop steel were tied into a steel cage according to Figure 2b. The mold was made with wood boards according to the pile size and finally the pile concrete was poured and cured for 28 days. Step 2 was to set up the experimental system, including fixing the steel support, placing the test pile, laying screw jacks and pressure sensors, and connecting strain gauges and strain tester. Step 3 was to load the test pile with trapezoidal load by referring to the loading method in Section 2.4.2. Step 4 was to collect experimental data, including the pile displacement, residual bearing capacity, steel strain and crack development. Step 5 was to dismantle the experimental system and end the experiment.

3. Results and Analysis

3.1. The Whole Measuring Process of Stress and Deformation of the Anti-Slide Pile

Figure 11 illustrates the lateral displacement distribution of the test pile under different trapezoidal load levels, and the ordinate in Figure 12 represents the resultant force (FT) of the concentrated forces F1, F2, F3. The relationship curve between the pile top lateral displacement and the resultant force of trapezoidal load was extracted in Figure 12. It can be seen that the pile lateral displacement increased linearly along the pile length as trapezoidal load increases, and the deformation process of the cantilever anti-slide pile included three stages. In Stage I, the pile lateral displacement increased approximately proportionally with the resultant force of the trapezoidal thrust load (FT), but the rate of increase was relatively slow. In this stage, the cantilever anti-slide pile worked in full section, and the concrete and the steel bars in the tension area bore the tensile force together, both of which were in an elastic stage. When FT increased to 10.2 kN, the maximum lateral displacement at pile top was 1.75 mm, and the tensile area near the sliding surface of side A of the test pile first cracked (Figure 12 and Figure 13a), which was named as the uncracked stage of the cantilever anti-slide pile. In Stage Ⅱ, due to the concrete cracking in the tension area, the tensile force originally born by the concrete was gradually transferred to the tensile steel bars, and the cracks on side A, side B, and side D of the test pile gradually expanded and extended (Figure 12 and Figure 13b,d). As the trapezoidal load increased, the tensile force at the cracking area was basically born by the tensile steel bars. In this stage, the lateral displacement of the pile increases more obviously due to the presence of cracks, and the lateral displacement at pile top increases in a non-proportional manner with FT. When FT increased to 36.6 kN, the maximum lateral displacement at pile top was 17.5 mm, and the tensile steel bars began to yield. Since then, the maximum lateral displacement at the pile top increased sharply, which was named as the crack emerging and developing stage of cantilever anti-slide pile. In Stage III, when FT gradually increased to 40.2 kN, the concrete strain in the compression area reached the ultimate compressive strain, and the concrete in the compression area crushed and bulged (Figure 12 and Figure 13c). The trapezoidal thrust load gradually rebounded, the maximum lateral displacement at pile top was 63.7 mm, and the anti-slide pile subsequently failed (Figure 12 and Figure 13e), which was named as the steel bar yielding-failing stage of cantilever anti-slide pile.
Further investigation on the cracks and failure characteristics of the test pile indicated that the initial crack was located 3 cm above the sliding surface of side A. The crack was a transverse crack parallel to the pile width, and its width was about 0.1 mm. When the anti-slide pile entered Stage Ⅱ, inclined cracks began to appear on side B and side D of the test pile and extended to the compression area (Figure 13b,d). At the same time, the number and width of transverse cracks on side A of the test pile gradually increased, the number of cracks reached 5 and the maximum transverse crack width was about 8 mm (Figure 13a). When the trapezoidal load increased to the ultimate bearing capacity of the test pile, the inclined cracks on side B and side D of the test pile gradually penetrated into the compression area, and the concrete of side C of the test pile showed compression-tension cracks and bulged outward (Figure 13c), resulting in bending failure (Figure 13e). The above phenomena indicate that the cantilever anti-slide pile under trapezoidal load sustains typical plastic failure and ductile failure characteristics, and belongs to under-reinforced beam damage. The cracking load and yield load of the test pile were 25.37% and 91.04% of the failure load, and the cracks were distributed within about 10 cm (0.09 times the pile length) above and below the sliding surface.
Figure 14 illustrates the strain distributions along different heights of concrete in side B of test pile under various loads. Due to the wide crack after the cracking of the anti-slide pile section, some strains on the CSG-2 row could not be accurately collected. The conclusion could be drawn that the concrete strains at different heights of two sections of the test pile were basically proportional to the distances from the points to the neutral axis when the load was fixed, and the concrete strains were linear, which indicated that the plane section assumption was available.

3.2. Calculation Method of Internal Force of Anti-Slide Pile

At present, the internal force calculation of the cantilever anti-slide pile generally adopts the traditional calculation method. This section first introduces its calculation principle, and then proposes the optimized calculation method by analyzing its shortcomings.

3.2.1. Traditional Calculation Method of Internal Force

The traditional method for calculating the bending moment of the cantilever anti-slide pile was mostly based on the Euler–Bernoulli beam theory, which assumed that the elastic assumption and plane section assumption were satisfied in the whole loading process of the cantilever anti-slide pile [24], and the bending moment M(y) can be obtained according to the following Equations (7)–(11).
σ ( x ) = M I x d = E ε
M ( y ) = E Δ ε d I x
d = h ( a s + a s )
I x = b h 3 12
Δ ε = ε s ε s
where σ ( x ) is the section stress of the pile; Ix is the inertia moment of pile section; b and h are the pile sectional width and sectional height, respectively; d is the distance between the tensile steel bars and structural steel bars (i.e., N1 and N2 reinforcement); as and a s are the thickness of concrete cover of reinforcement N1 and N2, respectively; E is the overall elastic modulus of the pile; ε 1 and ε 2 are the strains of reinforcements N1 and N2, respectively.
It can be found that the traditional method always regards the cantilever anti-slide pile as an elastic body in the calculation of the bending moment. However, in the indoor experiment of Section 3.1, the concrete or steel bar exhibited plastic deformation characteristics when the pile reached Stage Ⅱ and Stage Ⅲ, and the pile also presented plastic failure characteristics when destroyed. Therefore, the traditional method is not reasonable when the pile reaches Stage Ⅱ and Stage III. It is imperative to analyze the stress and deformation characteristics of each stage of the pile separately and then establish a reasonable calculation method for the bending moment.

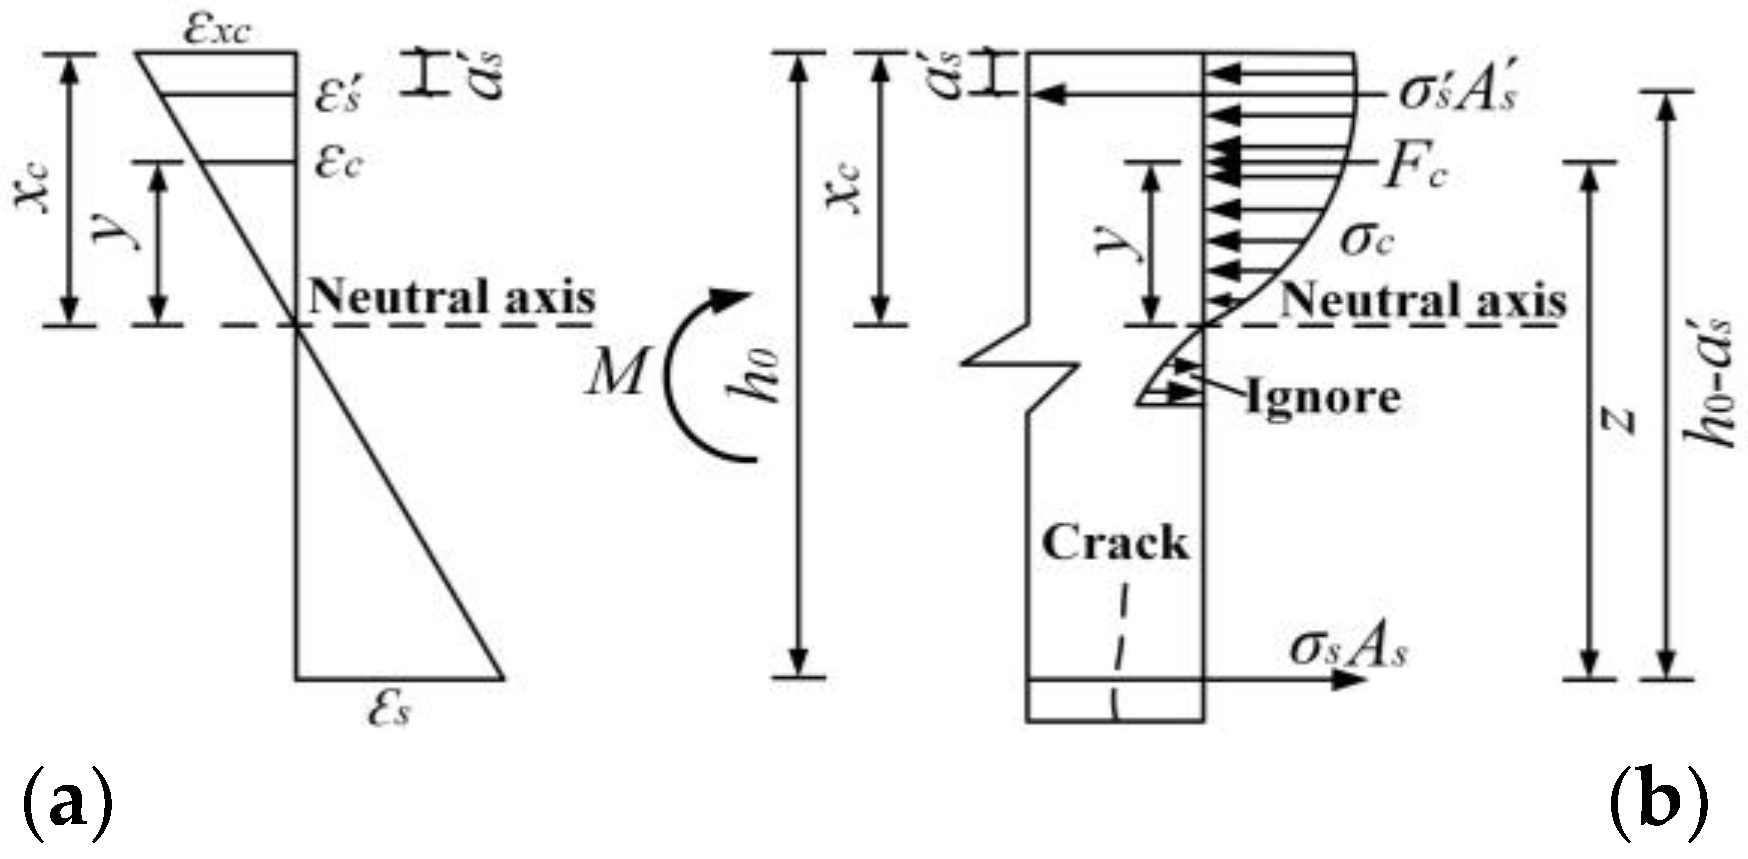
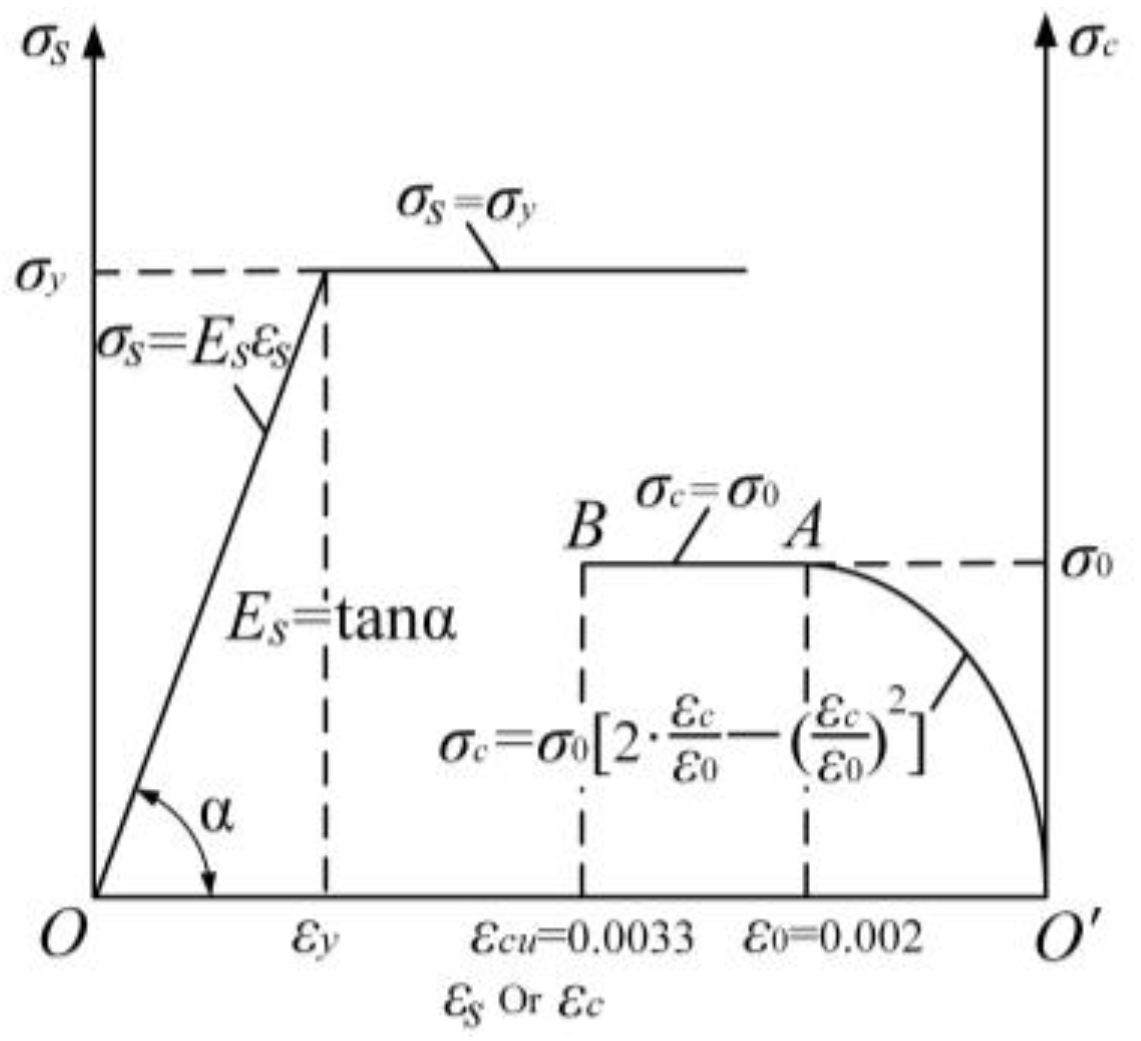
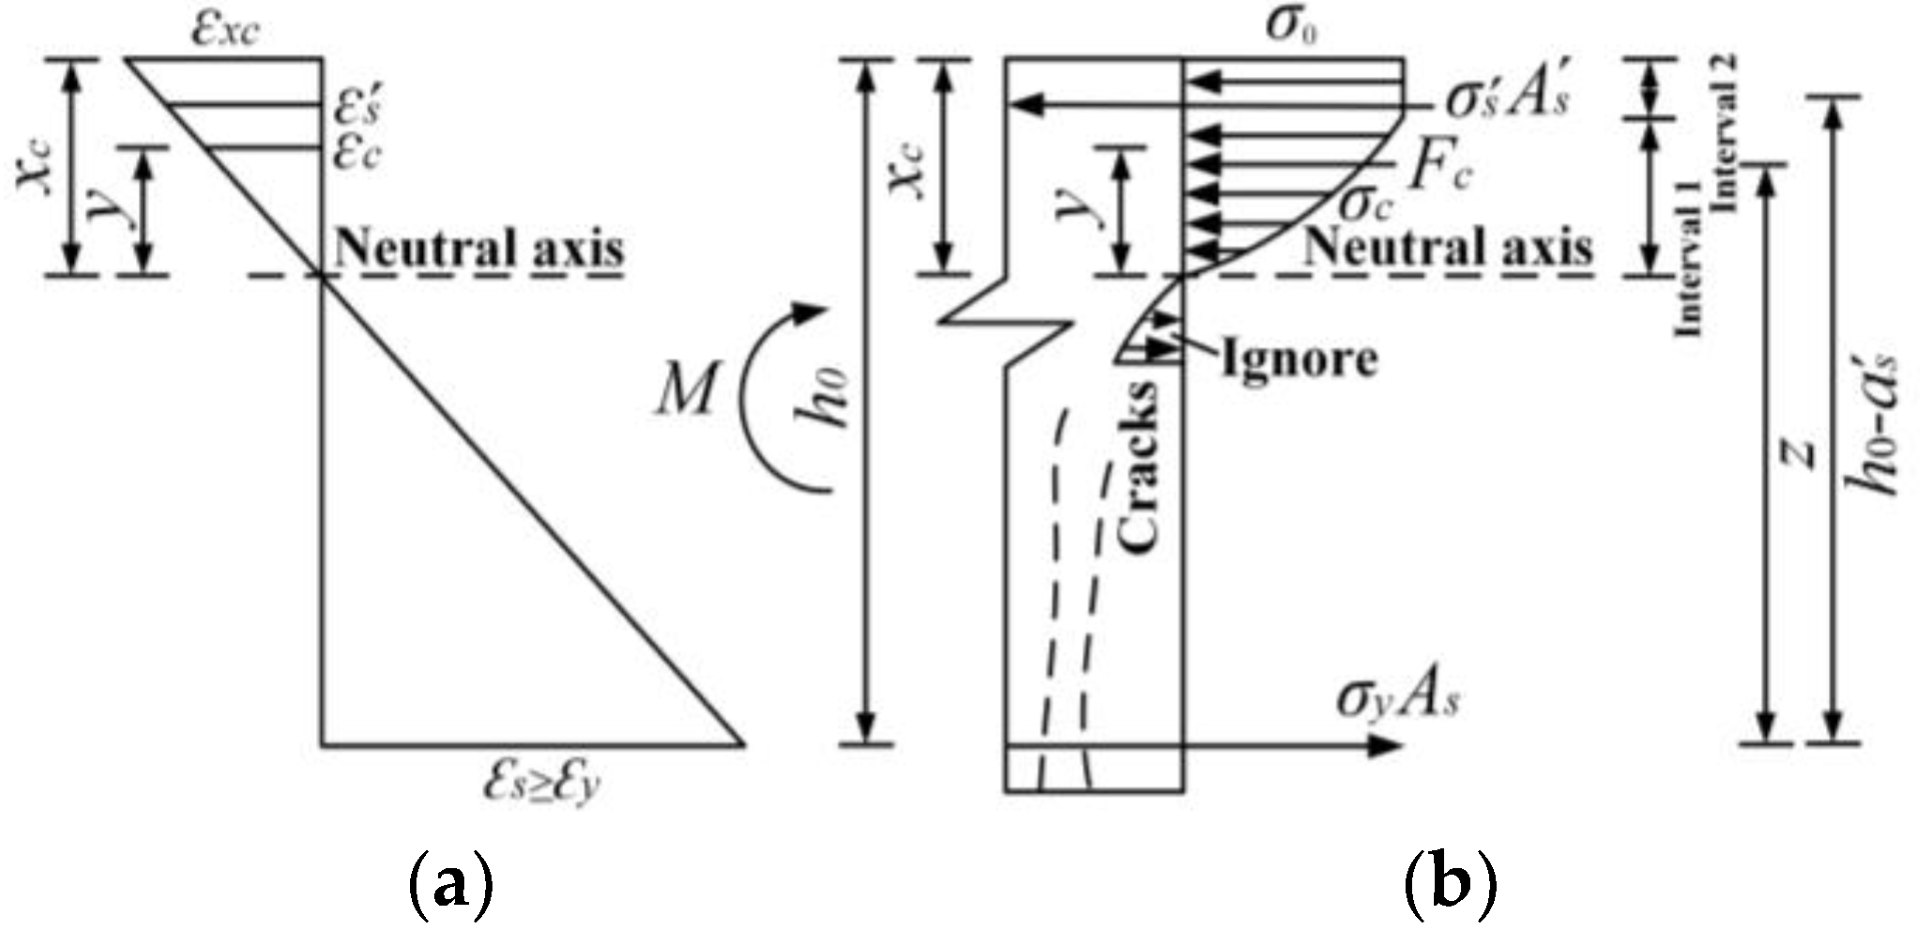
3.2.2. Optimized Calculation Method of Internal Force

(1) Stage I
When the trapezoidal thrust load behind the cantilever anti-slide pile is small, the concrete and steel bars in the tension area bear the tensile force together, and both are in an elastic state. The concrete strain at the edge of the tensile area of the pile is less than the concrete’s ultimate tensile strain, and there are no cracks on the pile. Based on the assumption of elastic body, the cross-sectional stress and strain state in the tensile area of the pile at this stage meets Equation (12), and Figure 15 shows the stress and strain distributions of the pile section.
ε s = ε t ε t u σ s ε t u E s
where ε t u is 0.0001; and σ s and Es are the stress and elastic modulus of the reinforcement N1, respectively.
The height of the compression area ( x c ) is determined using the plane section assumption, and it is given as follows:
x c a s ε s = h 0 a s ε s + ε s
x c = ε s ε s + ε s h 0 + ε s ε s + ε s a s
where h0 is the effective height of the pile section, h0 = h – as.
Making ε s / ε s = ζ and simplifying Equation (14), then x c is:
x c = ζ 1 + ζ h 0 + 1 1 + ζ a s
In Section 3.2.1, the contribution of reinforcements to the inertia moment of the pile (Ic) section was ignored in the traditional calculation method for pile bending moment. In fact, as a composite material, the pile inertia moment (Ic) is larger than that of plain rectangular concrete beam. Therefore, based on the conversion section method, the reinforcements N1 and N2 with the cross-sectional areas of A s and A s were converted into concrete with the areas of n A s and n A s at the same position respectively. Then, Ic is:
I c = ( n 1 ) A s h 0 x c 2 + ( n 1 ) A s x c a s 2 + b h 3 12 + b h x c h / 2 2
where n = Es/Ec, and Ec is the elastic modulus of pile concrete.
At this time, the tensile stress of the concrete at the same level of the reinforcement N1 ( σ t ) is:
σ t = E c ε s = σ s E c E s = M 1 h 0 x c I c
The bending moment of the test pile ( M 1 ) was further obtained as:
M 1 h 0 x c = σ s E c I c E s
Similarly, the stress of the concrete at the same level of the reinforcement N2 ( σ s ) should meet Equation (19), namely
M 1 x c a s = σ s E c I c E s
Combining Equations (18) and (19), and noting σ s = E s ε s and σ s = E s ε s , M 1 in Stage I can be obtained as:
M 1 = E c I c d ε s + ε s
It can be seen that the structure of Equation (20) is similar to that of Equation (8), and the difference between the two is the inertia moment of the pile section. Equation (20) is more objective and reasonable to consider the increasing effect of the steel bars on the inertia moment of the pile section.
(2) Stage Ⅱ
When the concrete stress in the pile tensile area exceeds its tensile strength, cracks will occur and develop. At this moment, the concrete in the tension area basically no longer bears the tensile stress, the steel bar stress increases rapidly, and the concrete stress in the compression area increases statistically, which finally leads to the redistribution of the pile section stress, as shown in Figure 16. At this stage, the concrete in the pile compression area starts to enter the plastic compression stage, and the stress–strain relationship of the concrete changes from linear to nonlinear.
At this stage, the concrete in the pile compression area does not conform to the elastic body assumption, and its stress–strain constitutive relationship should be adopted according to Chinese specification (GB 50010-2019) [25], as shown in Figure 17 and Equation (21).
σ c = σ 0 1 1 ε c / ε 0 2 ,   0 < ε c ε 0 = 0.002 σ c = σ 0 = const , 0.002 ε c ε c u = 0.033
where σ c and ε c are the concrete stress and strain in the pile compression area, respectively; ε c u is the concrete ultimate compressive strain; σ 0 is the concrete peak compressive stress, which is taken as the design value of the axial compressive strength.
Since the reinforcement N1 is still in an elastic state at this stage, the simplified elastoplastic stress–strain expression can be used for its stress–strain relationship, as shown in Equation (22) and Figure 17.
σ s = E s ε s , ε s ε y σ s = σ y , ε s ε y
where ε y and σ y are the yield strain and yield strength of steel bars, respectively.
The stress and strain state characteristics of the compressed concrete and tensile steel bars of the pile at this stage are shown in Equation (23). Combining Equations (12) and (23), it can be seen that the strain ( ε s = ε t u ) or stress ( σ s = ε t u E s ) of the tensile steel bars can be used as the boundary sign between Stage I and Stage II.
ε c ε 0 ,   ε s ε t u σ c σ 0 ,   σ s ε t u E s
The calculation method of the bending moment of the pile in Stage II is introduced as follows. Firstly, based on the plane section assumption, the concrete strain at x c ( ε x c ) and the concrete strain with a distance y from the neutral axis ( ε c y ) are determined as follows:
ε x c = ε s x c x c a s
ε c y = ε s y x c a s
Then, the solution expression for the resultant force of the compressive stress of the pile concrete (Fc) is established by integrating the section stress of compressive concrete, as shown in Equation (26). Substituting Equations (21) and (25) into Equation (26), Fc is obtained as:
F c = 0 x c σ c b d y
F c = b σ 0 x c ε s ε 0 ( 1 a s x c ) ε s 3 ε 0 2 ( 1 a s x c ) 2
Since a s < < x c in stage II, 1 a s x c 1 in Equation (27). Making η = ε s ε 0 and simplifying Equation (27) to get Fc:
F c = σ 0 b x c η 1 3 η 2
Secondly, the bending moment of Fc to the center of tensile steel bars is obtained as follows:
M c = 0 x c σ c b h 0 x c + y d y = F c h 0 1 0.25 η 3 η x c
Thirdly, the bending moment of the compressive steel bars to the center of the tension steel bars is obtained as follows:
M s = E s ε s A s h 0 a s
Finally, the bending moment of the section of the test pile in Stage II (M2) is obtained by combining Equations (29) and (30), as shown in Equation (31).
M 2 = M c + M s = σ 0 b x c η 1 3 η 2 h 0 1 0.25 η 3 η x c + E s ε s A s h 0 a s
(3) Stage Ⅲ
When the thrust load behind the cantilever anti-slide pile is large enough, the tensile steel bars gradually yield, and the strains of the steel bars increase rapidly. The concrete in the tension area will no longer bear the tension, and the cracks on the pile gradually rise and expand. Part of the concrete in the compression area enters the stable plastic stage and tends to fail, as shown in Figure 18. When the strain reaches the ultimate compressive strain, the compressive concrete is crushed, and the test pile can no longer bear the external load, which indicates that the test pile has reached the failure state. The stress–strain state characteristics of the steel bars and concrete in this stage are shown in Equation (32), and it can be seen that the strain ( ε s = ε y ) or stress ( σ s = σ y ) of the tensile steel bars can be used as the boundary sign between Stage II and Stage Ⅲ.
ε x c ε 0 ,   ε s ε y σ c σ 0 ,   σ s σ y
In the process of calculating the resultant force of compressive stress of the test pile concrete (Fc), the stress distribution curve of compressive concrete should be divided into two sections. The first and second sections are respectively the curve and the straight line (Figure 18), where the straight line section indicates that the stress in the concrete has reached σ 0 . Based on the plane section assumption and referring to Equation (25), the height of the boundary point of the concrete stress distribution curve is ε 0 x c / ε x c . Based on Equations (21), (24) and (25), σ c , ε x c and ε c can be further obtained respectively. Substituting σ c , ε x c and ε c into Equation (26) and integrating in sections, Fc at this stage is:
F c = 0 x c σ c b d y = 0 ε 0 x c ε x c σ c b d y + ε 0 x c ε x c x c σ c b d y = σ 0 b x c 1 1 3 η
The bending moment of Fc to the center of the tensile steel bars in this stage is obtained as follows:
M c = 0 x c σ c b h 0 x c + y d y = F c h 0 6 η 2 4 η + 1 12 η 2 4 η x c
The calculation of M s in this stage is the same as Equation (30), so the bending moment of the test pile in Stage III is:
M 3 = M c + M s = σ 0 b x c 1 1 3 η h 0 6 η 2 4 η + 1 12 η 2 4 η x c + E s ε s A s h 0 a s
In summary, the specific calculation steps of internal force or bending moment in each stage during the whole process of stress and deformation of the cantilever anti-slide pile are represented in Figure 19.

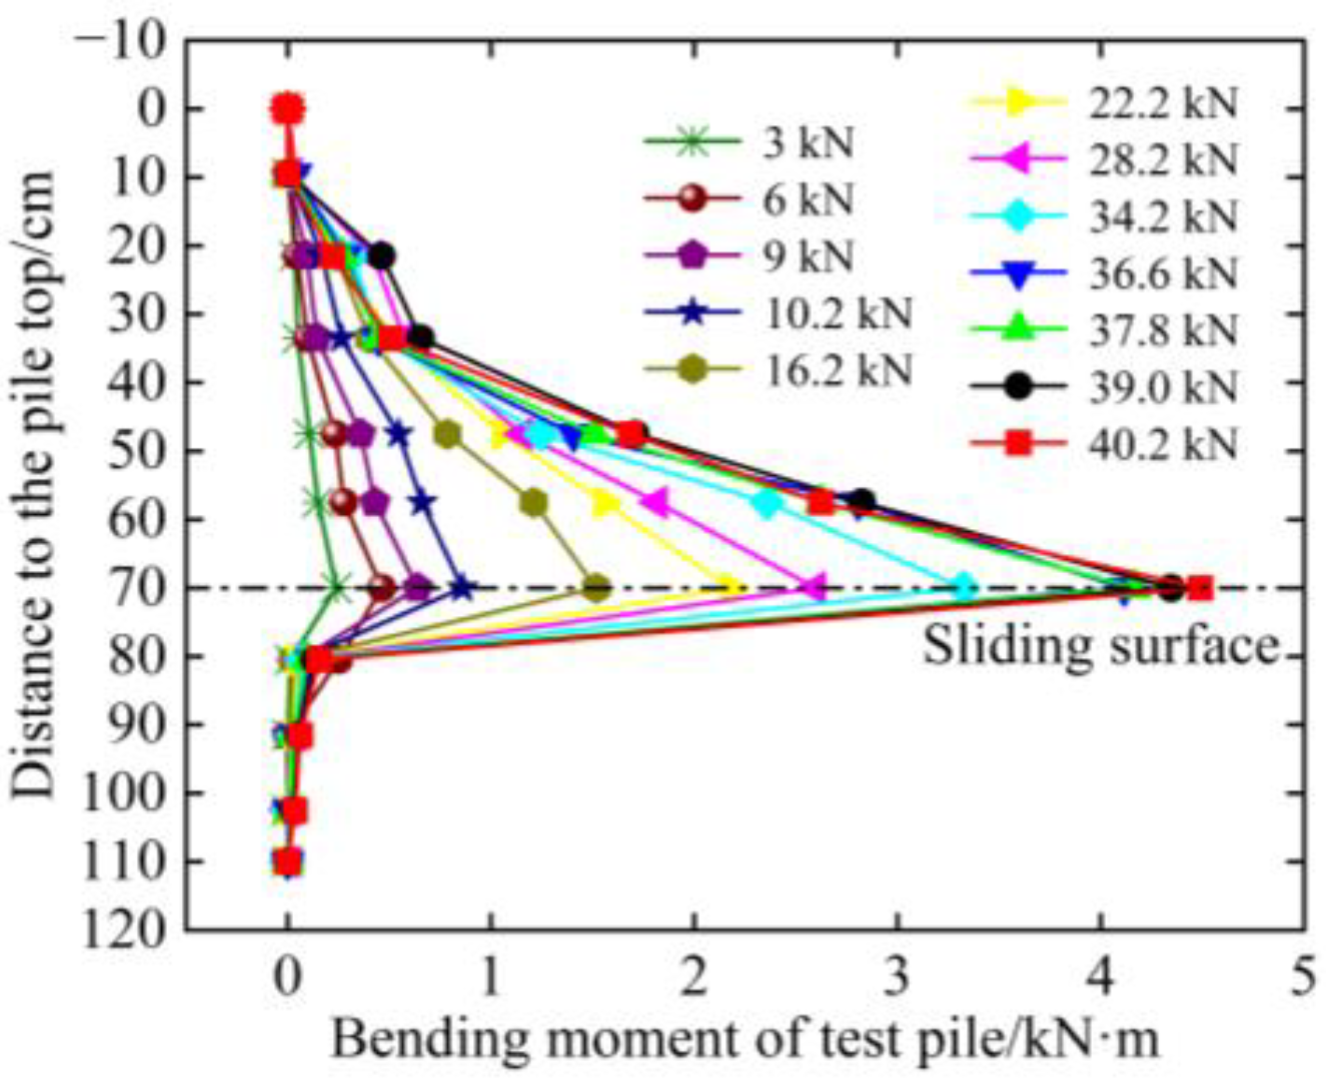
3.3. Bending Moment Distribution of Test Pile

According to the optimized calculation method for the bending moment of the cantilever anti-slide pile proposed in this paper, the bending moment distribution of the test pile in the loading process of the trapezoidal load was obtained, as shown in Figure 20. It is obvious that the pile bending moment increased gradually with the trapezoidal load, increasing first and then decreased gradually along the pile length. The maximum bending moment was located at the sliding surface, and the farther away from the sliding surface, the faster the attenuation. At the same time, the evolution process of the pile bending moment mainly included three stages. When the resultant force of the trapezoidal thrust load (FT) was less than the pile cracking load, the maximum bending moment gradually increased, and increased to 0.86 kN·m. When FT reached 10.2 kN, subsequently, the test pile entered the working stage with cracks, and the pile bending moment increased rapidly. When FT increased to 36.6 kN, the maximum bending moment was about 4.16 kN·m. When the steel bars yielded, the external trapezoidal load behind the test pile remained basically unchanged, the test pile tended to be damaged, and the maximum bending moment increased slowly to 4.49 kN·m when the test pile was destroyed.
Equation (8) in Section 3.2.1 was used to calculate the pile bending moment at the sliding surface, and further compared with the optimized calculation method established in Section 3.2.2, and the comparison results are represented in Figure 21. It can be found that the two are basically the same when the test pile worked in the elastic stage (Stage I). The maximum bending moment at the sliding surface obtained by using the optimized calculation method established in Section 3.2.2 (Equation (20)) is slightly larger. The reason was that the increasing effect of tensile steel bars and compressive steel bars on the inertia moment of pile section was considered in Equation (20), resulting in the calculation result of the inertia moment of pile section larger than that of Equation (8). When the test pile worked in the stage of crack emerging and developing (Stage II), the gap between the two grew gradually with the trapezoidal load. The reason was that the anti-slide pile in stage II was regarded as an elastoplastic body in the optimized calculation method built in this paper (Equation (31)), and the elastoplastic characteristics of compressive concrete were considered. The pile compressive concrete was treated as a linear elastomer during the whole loading process in the traditional method (Equation (8)), resulting in a larger calculation value of bending moment. When the values of FT were 16.2 kN and 36.6 kN, respectively, the bending moments calculated by the traditional method (Equation (8)) were 2.87 times and 5.24 times the bending moment obtained by the optimized calculation method established in Section 3.2.2 (Equation (31)). Moreover, the theoretical ultimate flexural bearing capacity of the test pile(Mu) was 3.93 kN·m according to the flexural strength formula of reinforced concrete beam, which is not much different from the maximum bending moment obtained by the optimized calculation method established in this paper (Equation (35)). The bending moment at the sliding surface of the test pile calculated by the traditional method was as high as 35.37 kN·m, which is obviously inconsistent with the fact.
The above results show that when the cantilever anti-slide piles work in the elastic stage or there are no cracks in the pile during the service life, the errors of the bending moment calculated by the traditional method or the optimized calculation method established in Section 3.2.2 are small, and both methods can be used. However, when the cantilever anti-slide pile cracks in service, the traditional method will produce large errors and mislead the evaluation of the service status of the cantilever anti-slide pile in service and the structural design, resulting in a waste of economy and resources.

4. Numerical Analysis and Discussion

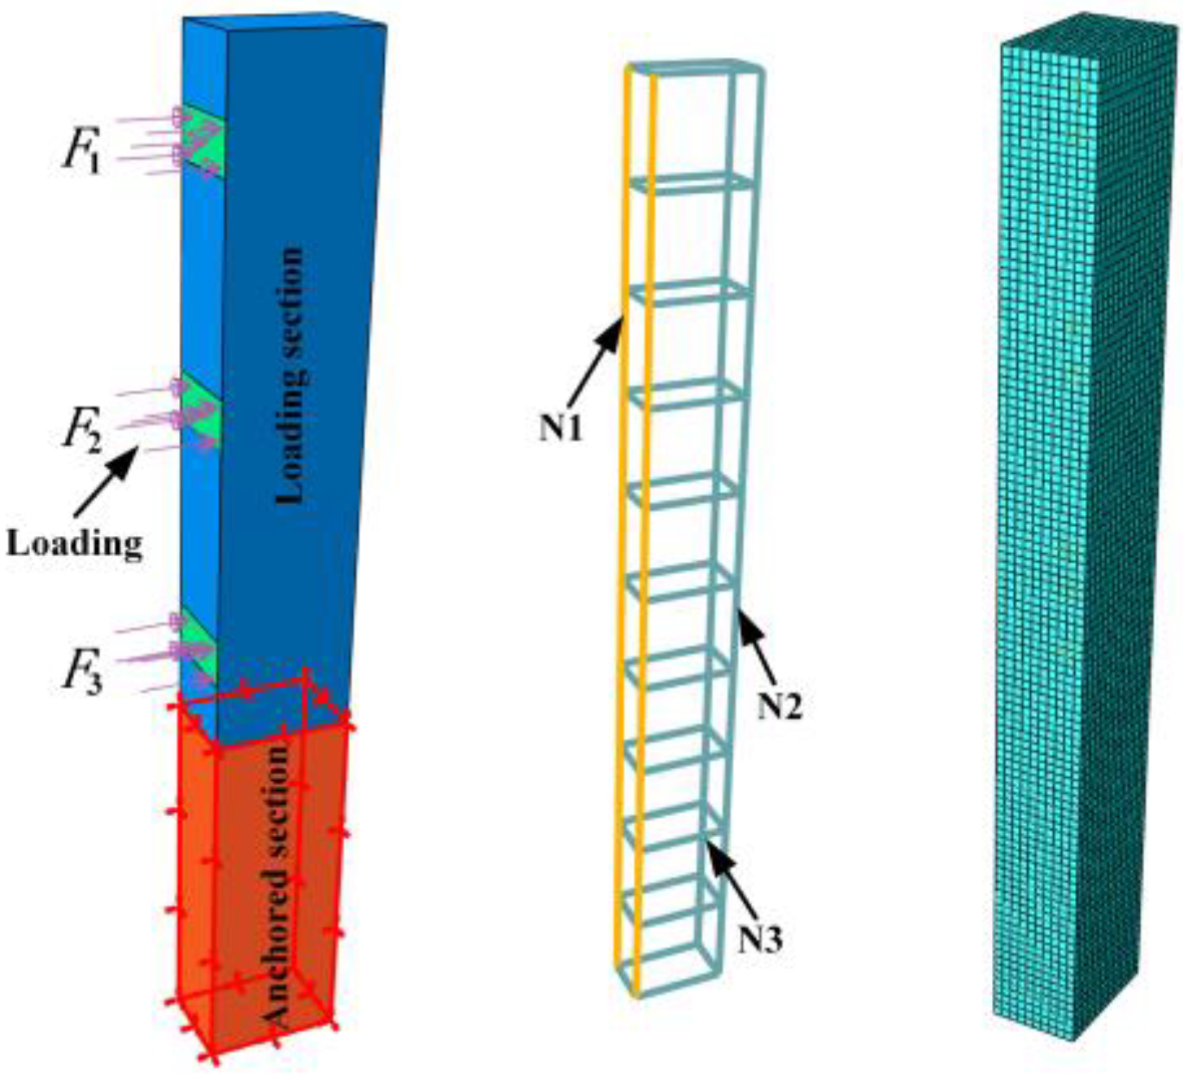
4.1. Establishment of the Numerical Model

Three-dimensional numerical nonlinear analysis and parameter analysis of model anti-slide pile were carried out by using ABAQUS numerical simulation software. The model size, external trapezoidal load, and main parameters of the model pile are the same as those in Section 2. The FE model was constructed by embedded element technology, and the damage plasticity model (CDP model) was adopted for the pile concrete, which are defined according to the plasticity and damage parameters. The double broken line model of isotropic plasticity was applied for the constitutive relation of pile steel bars. The boundary conditions of the numerical model mainly set the anchored section as a fixed constraint and the loaded section as a free boundary. The C3D8R element and the T3D2 element were adopted for the pile concrete and steel bars, respectively, and the numerical model was divided into 17,164 elements and 20,134 nodes, as shown in Figure 22.

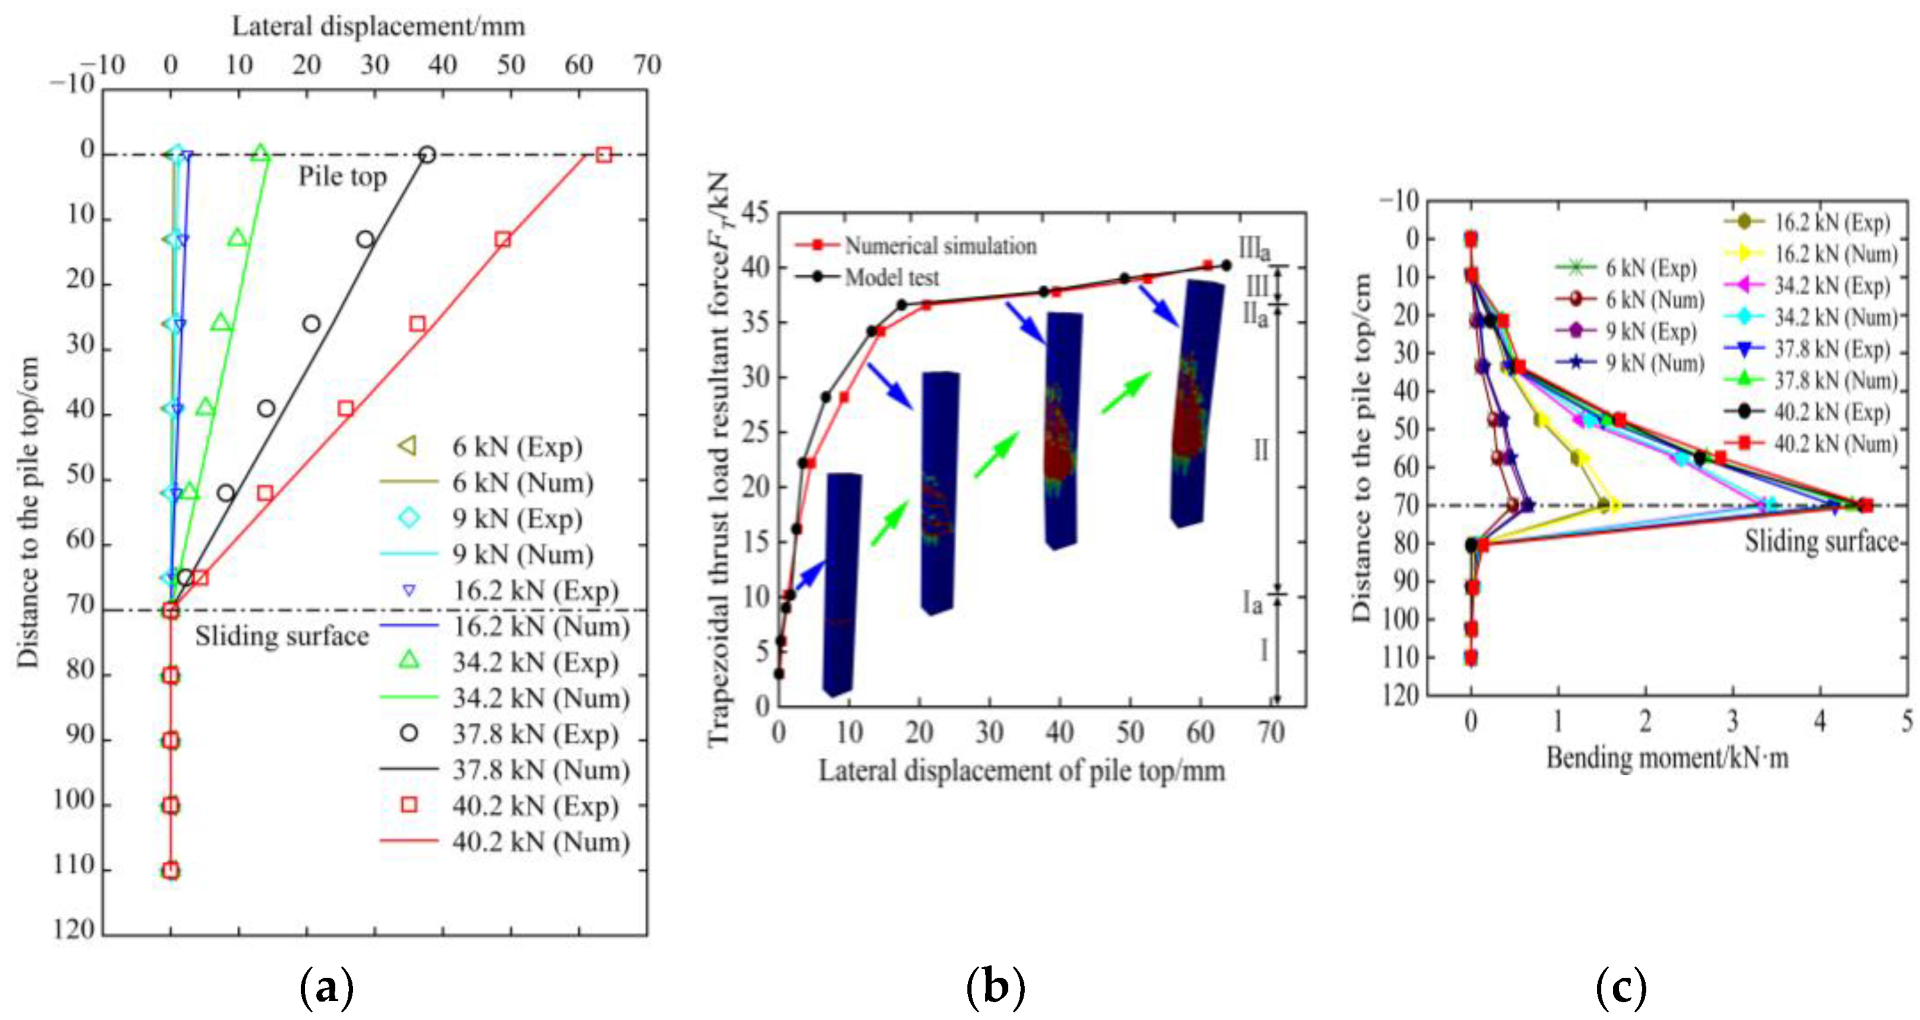
4.2. Model Calibration

The displacement distribution, the trapezoidal thrust load-pile top lateral displacement curve, and the bending moment distribution of the test pile were applied to verify the rationality of the numerical model developed in Section 4.1. The calibrated trapezoidal load was the representative load in the whole loading process of the cantilever anti-slide piles (Stage I~Stage III), which were 6 kN, 9 kN, 16.2 kN, 34.2 kN, 37.8 kN, and 40.2 kN, respectively. Figure 23a,b, respectively, show the pile lateral displacement distribution and the evolution process of the pile top lateral displacement under external trapezoidal load. It is clear that the lateral displacement distribution and the trapezoidal thrust load-pile top lateral displacement curve of the model pile calculated by ABAQUS are in good agreement with the experimental values. It can be concluded from Figure 23b that the crack distribution and failure form of the model pile are basically consistent with those of the test pile. The comparison results of bending moment distribution under trapezoidal load are shown in Figure 23c. It is clear that the bending moment distributions under different levels of trapezoidal thrust load were unimodal, and the evolution process was consistent with the test pile. The above comparison results comprehensively verify the rationality of the numerical model of the cantilever anti-slide pile built in Section 4.1.

4.3. Parametric Study

Based on the above FE model, the critical parameters in the preliminary design and service process of the cantilever anti-slide pile were analyzed, including the material strength and anchored length.

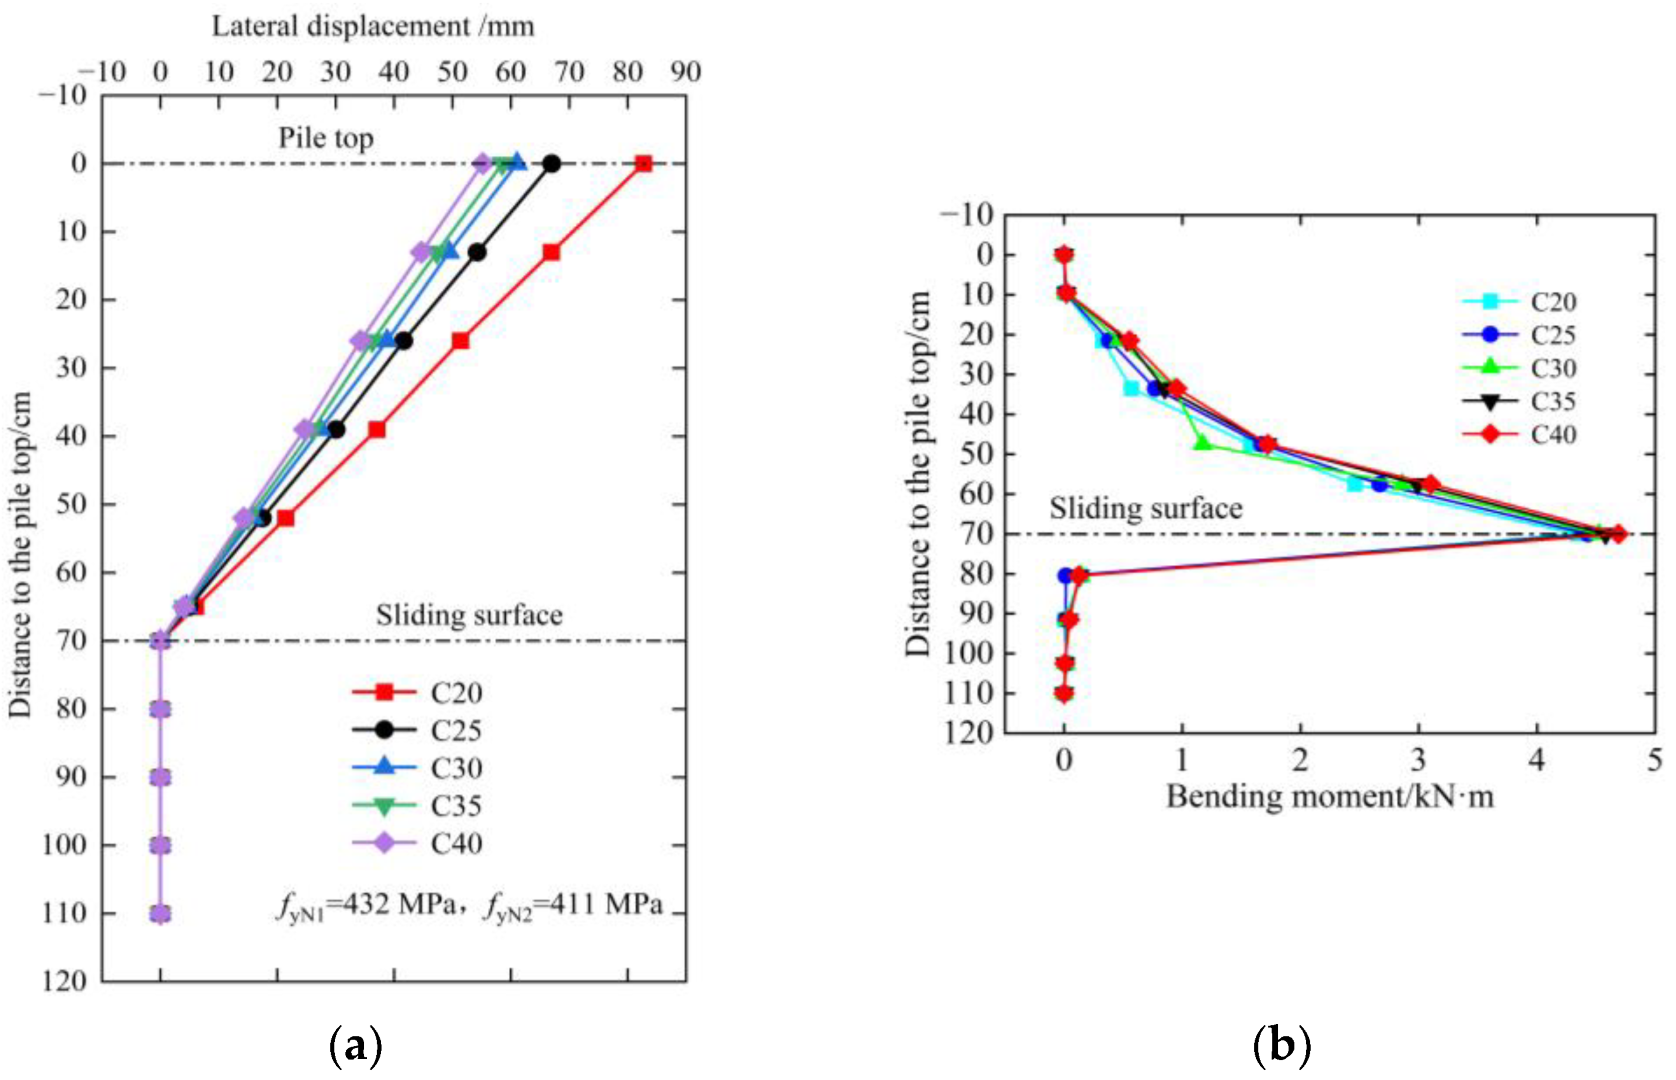
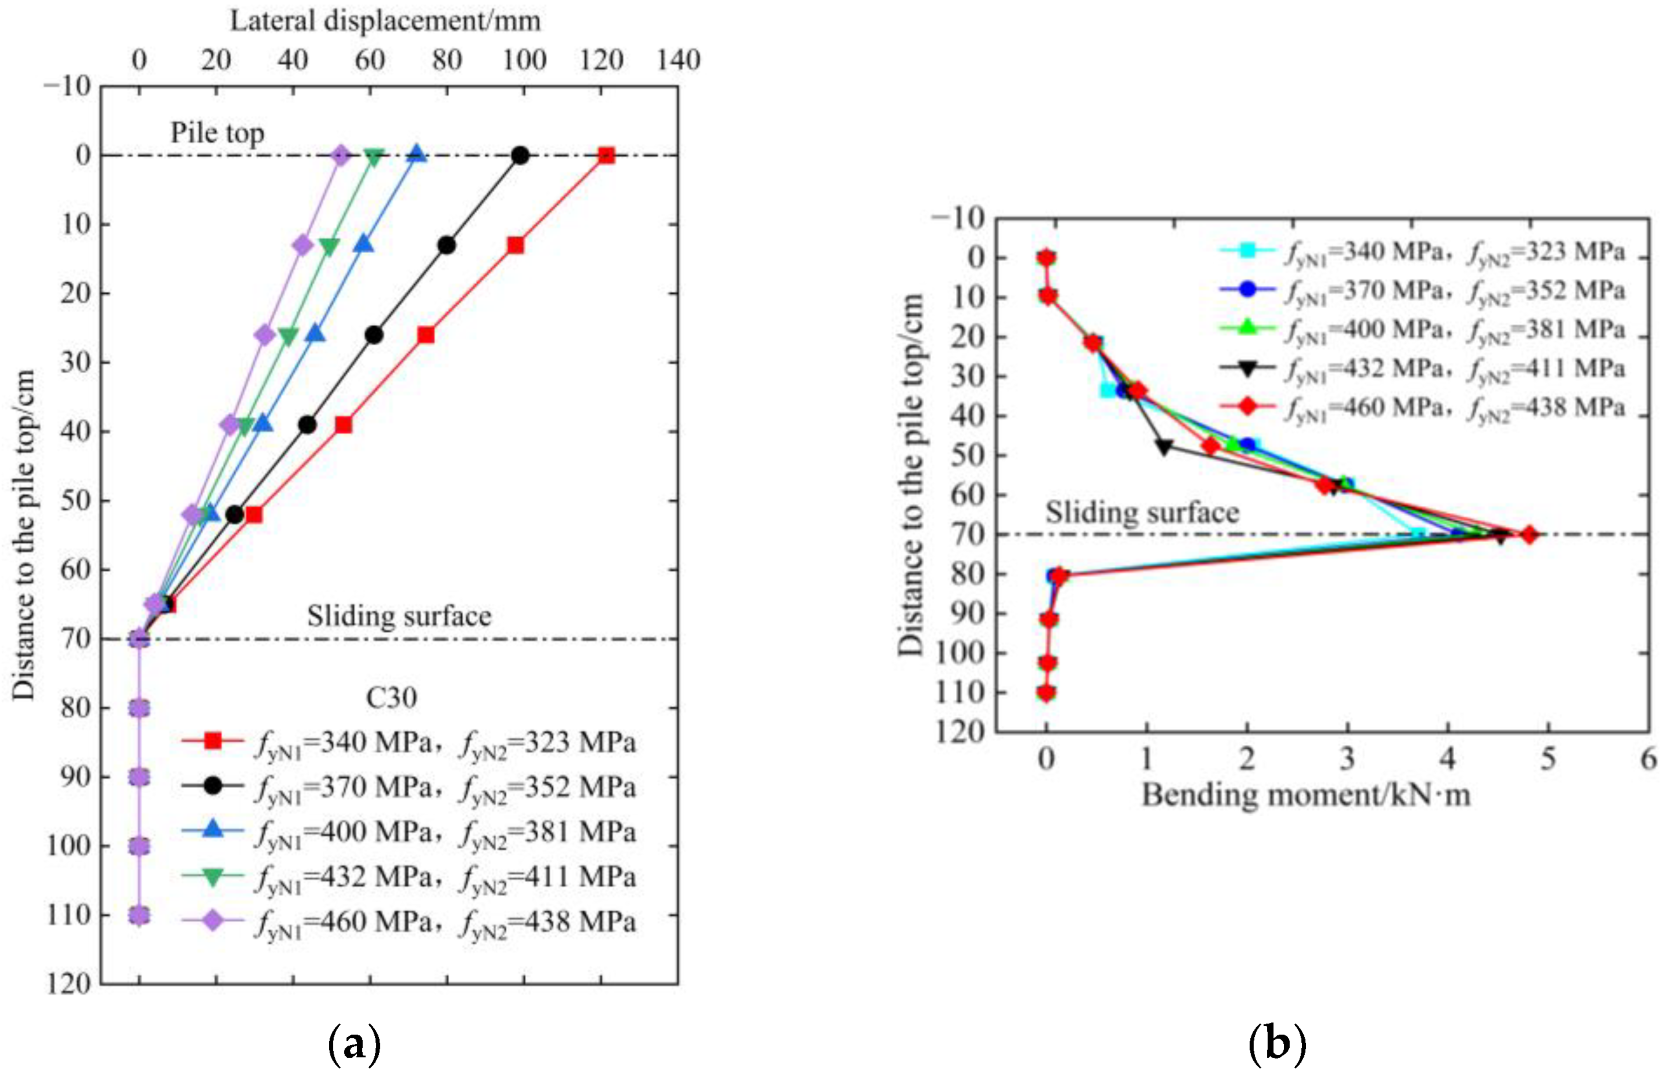
4.3.1. Effect of Concrete Strength and Steel Bars’ Strength

The concrete strength and steel bar strength of the cantilever anti-slide pile were in a time-varying evolution states during the service period. Figure 24 and Figure 25, respectively, show the distributions of pile displacement and bending moment for different concrete strengths (40, 35, 30, 25, and 20 MPa) and reinforcement yield strengths (The yield strengths of reinforcement N1 (fyN1) were 460, 432, 402, 371, and 340 MPa, and the yield strengths of reinforcement N2 (fyN2) were 438, 411, 381, 352, and 323 MPa). It can be obtained that the maximal lateral displacements at the pile top of the cantilever anti-slide pile with different concrete strengths under the same thrust load were 55.20 mm, 58.52 mm, 61.04 mm, 67.54 mm, and 86.02 mm, respectively, and the ultimate bending moments when the pile was destroyed are 4.689, 4.58, 4.524, 4.431, and 4.333 kN·m, respectively, indicating that the pile top lateral displacement was negatively related to the concrete strength, and the smaller the concrete strength, the greater the lateral displacement at pile top. However, the reduction of the ultimate bending capacity of the pile is not obvious. The pile top lateral displacements of cantilever anti-slide pile with different steel bars’ strengths under the same thrust load were 52.48, 61.04, 72.009, 99.02, and 121.42 mm, respectively, and the ultimate bending moments when the pile was destroyed were 4.812, 4.524, 4.287, 4.112, and 3.705 kN·m, respectively, indicating that the pile top lateral displacement was negatively correlated with the steel bars’ strength, and the maximum bending capacity of the pile decreased obviously with the gradual deterioration of steel bars’ strength. It can be concluded that the lateral displacement at pile top can be reduced by improving the concrete or steel bars’ strength during the preliminary design. However, increasing the concrete strength makes no difference to the pile bearing capacity, while increasing the reinforcement strength has obvious effect. In other words, the pile displacement gradually increases with the deterioration of the material strength during the service life, and the deterioration of the steel bar strength has a stronger deterioration effect on the maximum bearing capacity of the pile than concrete strength.

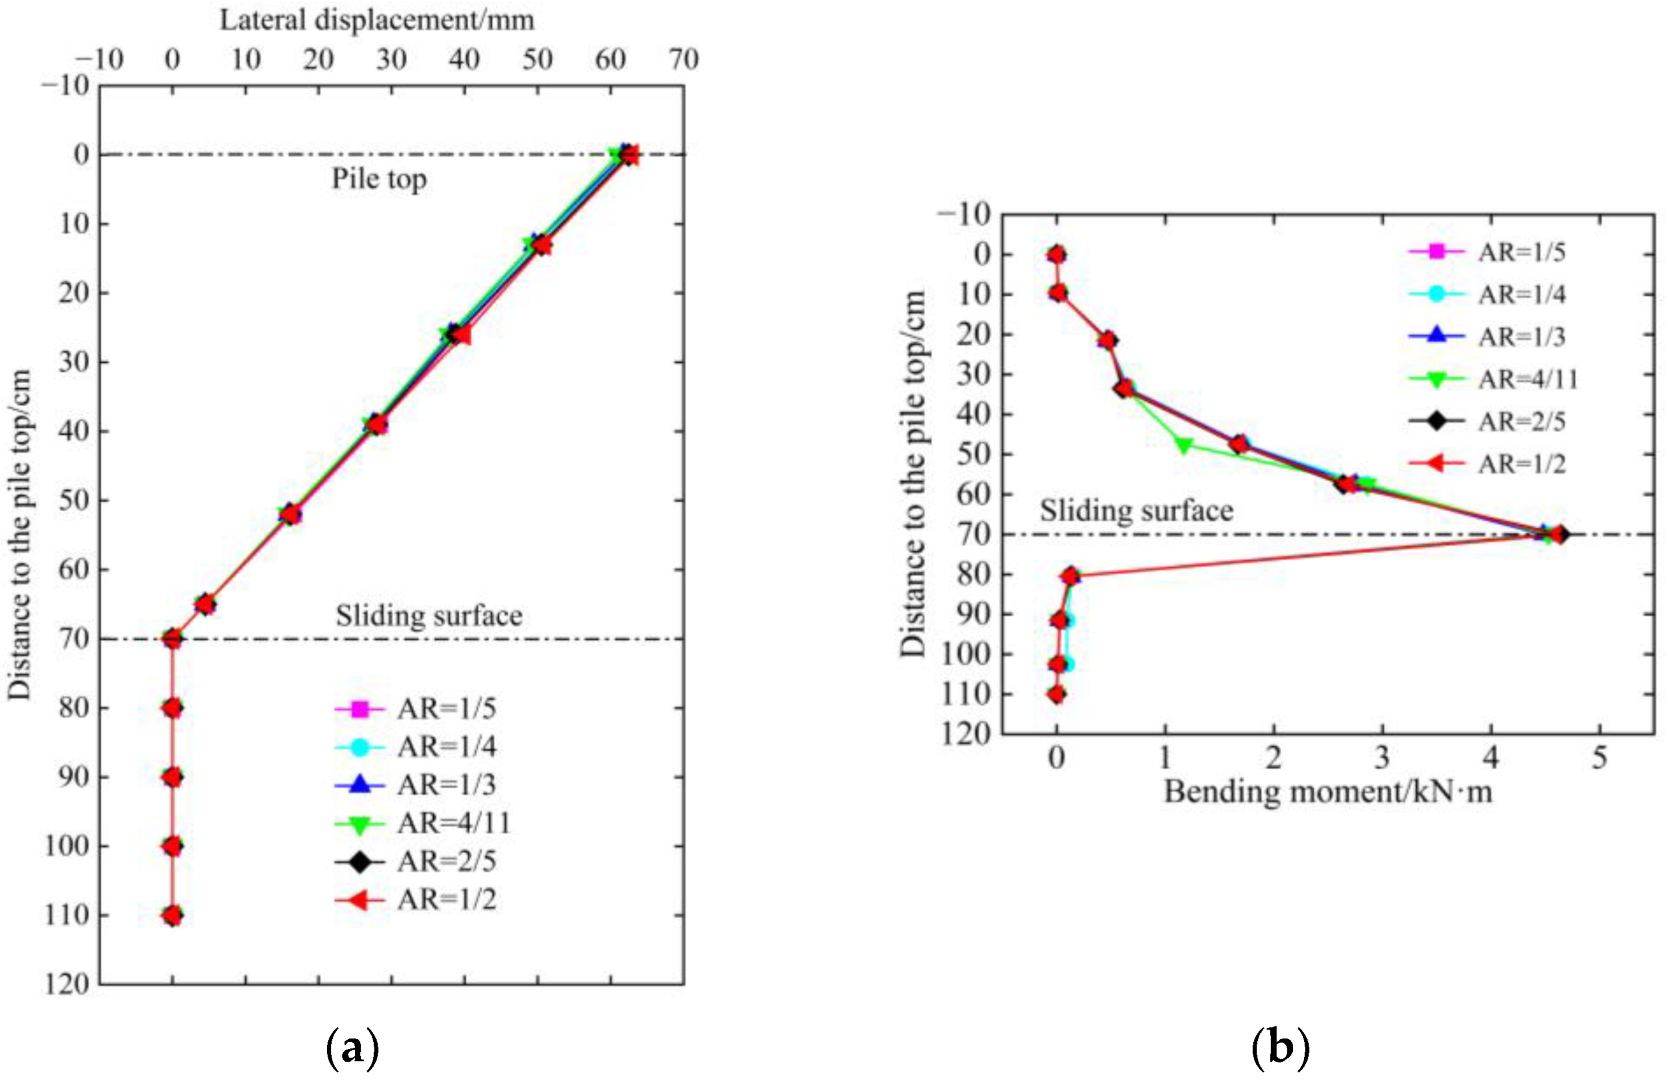
4.3.2. Effect of Anchor Ratio

The anchor ratio (AR) is another crucial parameter for the structural design of a cantilever anti-slide pile. Figure 26 shows the distributions of the pile displacement and bending moment under five anchor ratios (1/5, 1/4, 1/3, 4/11, 2/5, 1/2). It can be concluded that the pile displacement and bending moment under different anchor ratios changed little. The reason is that the anchored section was set as a fixed constraint in the ABAQUS numerical simulation to simulate the anchored section, indicating that when the strength of the rock formation embedded in the pile anchored section is large enough, blindly increasing the length of the pile anchored section cannot significantly improve the bearing capacity, which is in agreement with the results by [26]. In summary, the length of pile anchored section should be designed reasonably by combining economic factors and safety factors in this case.

4.3.3. Discussion

The lateral displacement and bending moment of the cantilever anti-slide pile under the trapezoidal load (TL) and uniform load (UL) were further compared, as shown in Figure 27. When the resultant force of the trapezoidal load (FT) reached 6 kN, the lateral displacements at the pile top under the trapezoidal load and uniform load were 0.47 mm and 0.9 mm, respectively, and the maximum bending moments at the sliding surface were 0.78 kN·m and 0.97 kN·m, respectively. When Fl reached 28.2 kN, the lateral displacements at pile top under the trapezoidal load and uniform load were 9.3 mm and 49.15 mm, respectively, and the maximum bending moments were 3.42 kN·m and 4.21 kN·m, respectively. This shows that the lateral displacement and bending moment of the anti-slide pile under the uniform load and trapezoidal load have little difference when the external thrust load is small. As the external thrust load increases, the lateral displacement and bending moment of the anti-slide pile under the uniform load are gradually larger than those under the trapezoidal load, especially the lateral displacement, and the gaps under the two loads gradually increase with the external thrust load. In summary, the distribution form of the external thrust load behind the cantilever anti-slide pile will significantly affect its stress and deformation. In the process of the structural design of the cantilever anti-slide pile, the distribution form of the external thrust load should be judged as accurately as possible to make it more consistent with the actual stress distribution, so as to make the structural design of the anti-slide pile more reasonable and economical.

5. Conclusions

In this paper, the evolution processes of the internal force and deformation of the cantilever anti-slide pile under trapezoidal thrust load were investigated through experiments and FE methods, and a new method for calculating the internal force of the cantilever anti-slide pile is proposed. The major conclusions are drawn as follows.
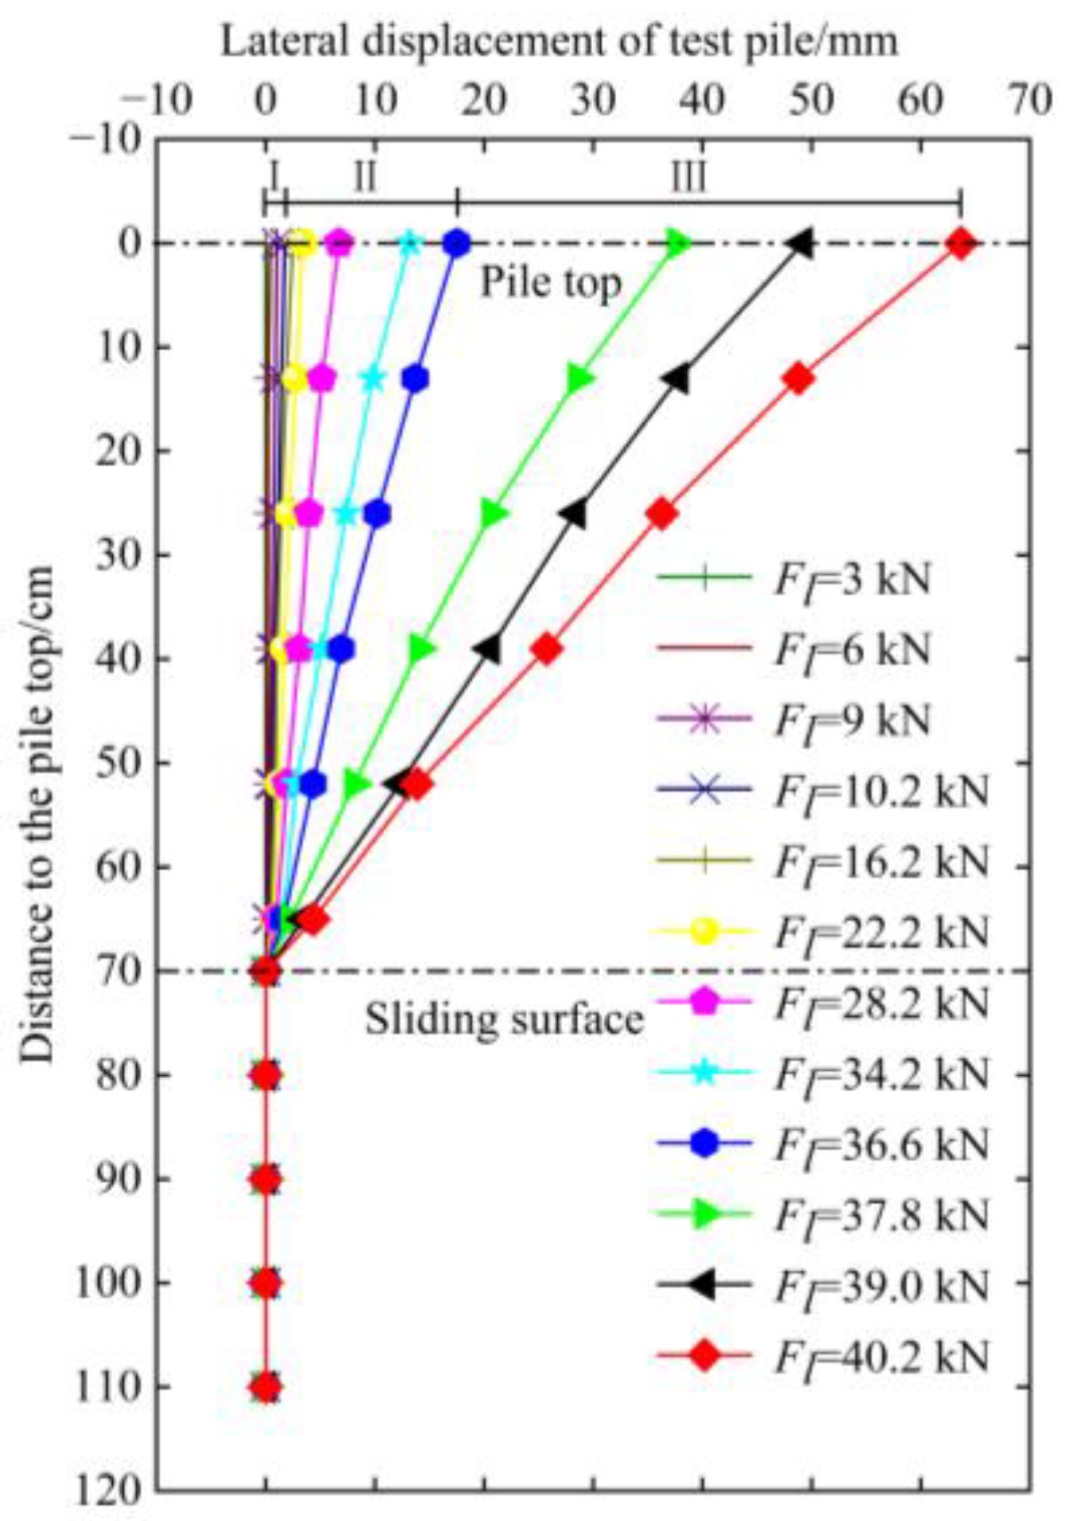
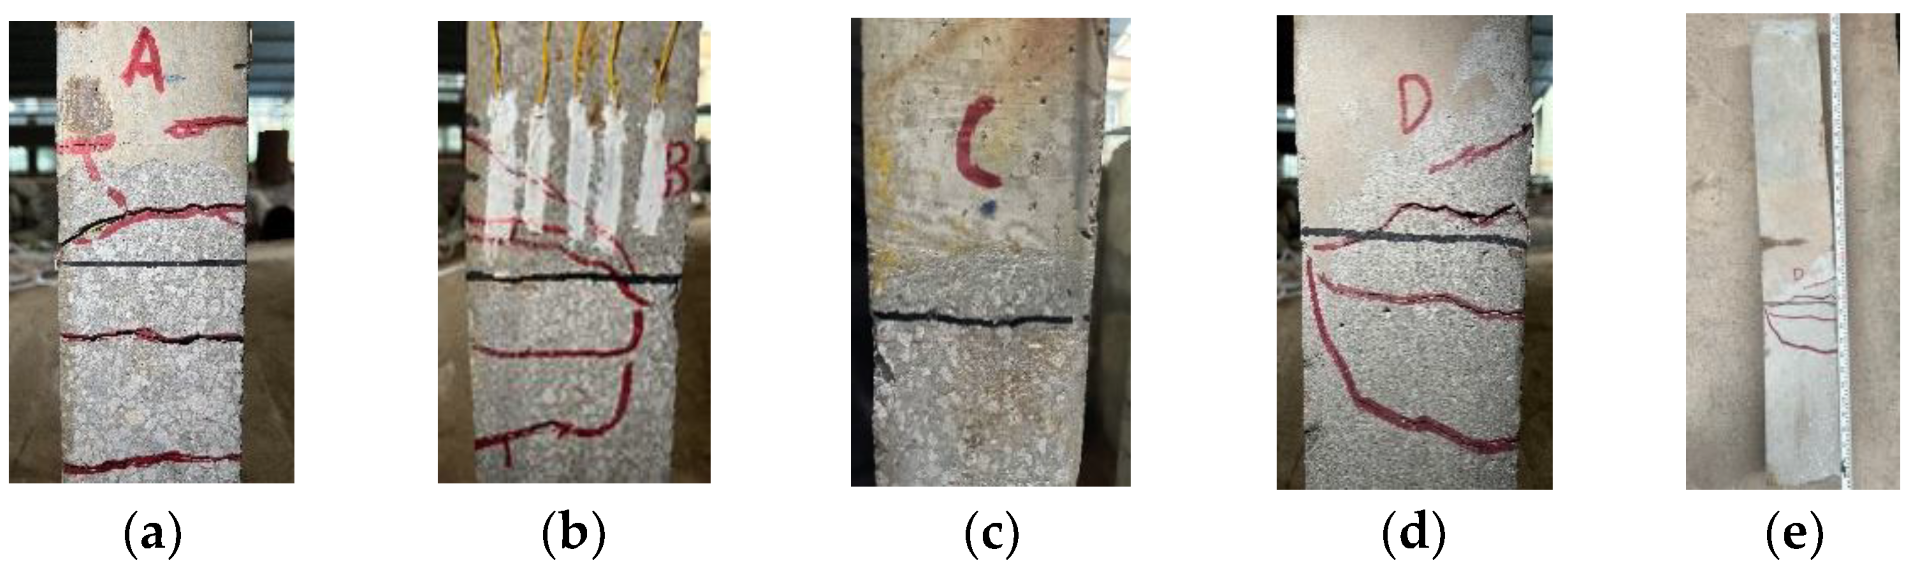
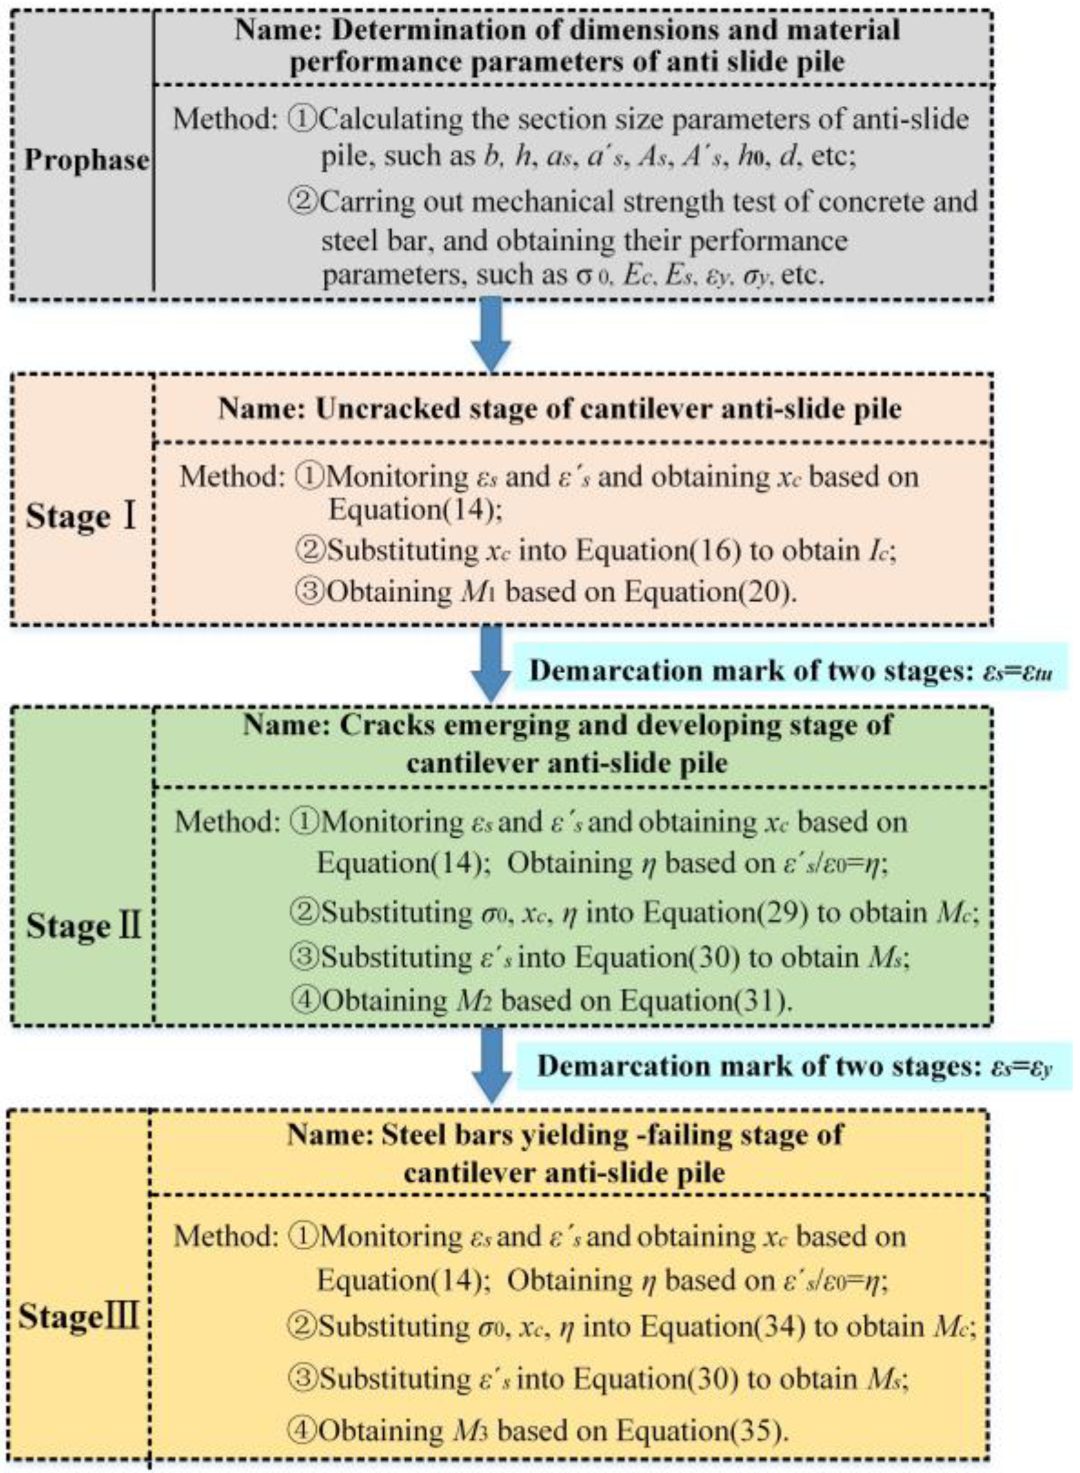
  • The whole development processes of the stress and deformation of the cantilever anti-slide pile under trapezoidal load mainly include three stages: the uncracked stage, the cracks emerging and developing stage, and the steel bar yielding–failing stage. The cracking load and yield load of the pile account for 25.37% and 91.04% of the failure load, and the cracks of the pile are concentrated in the range of 0.09 times the pile length above and below the sliding surface.
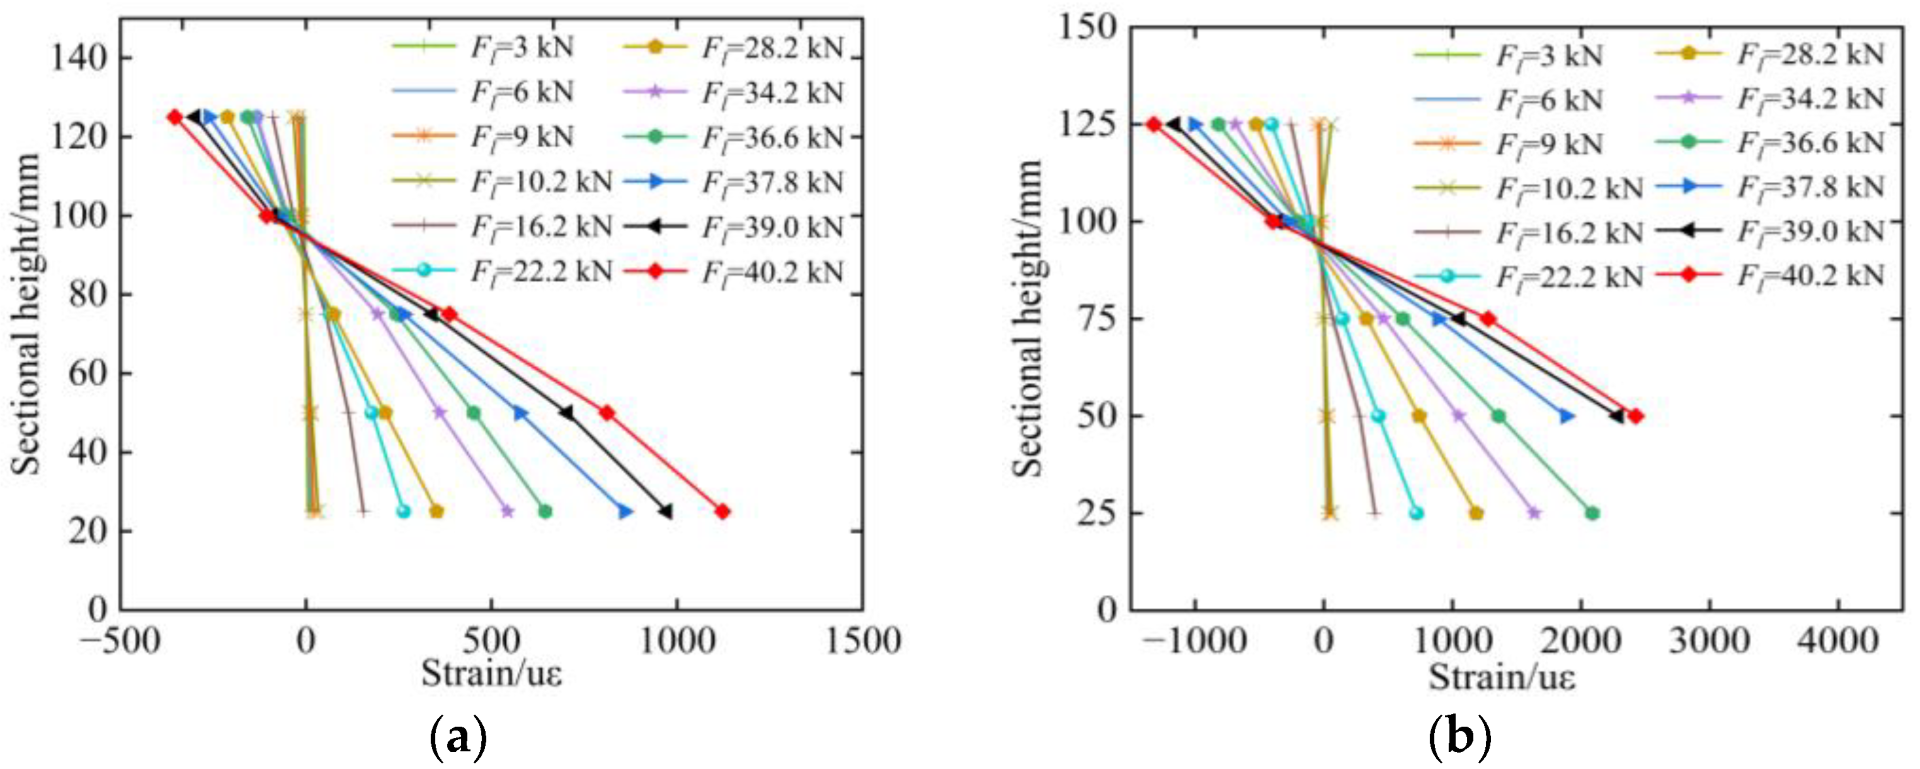
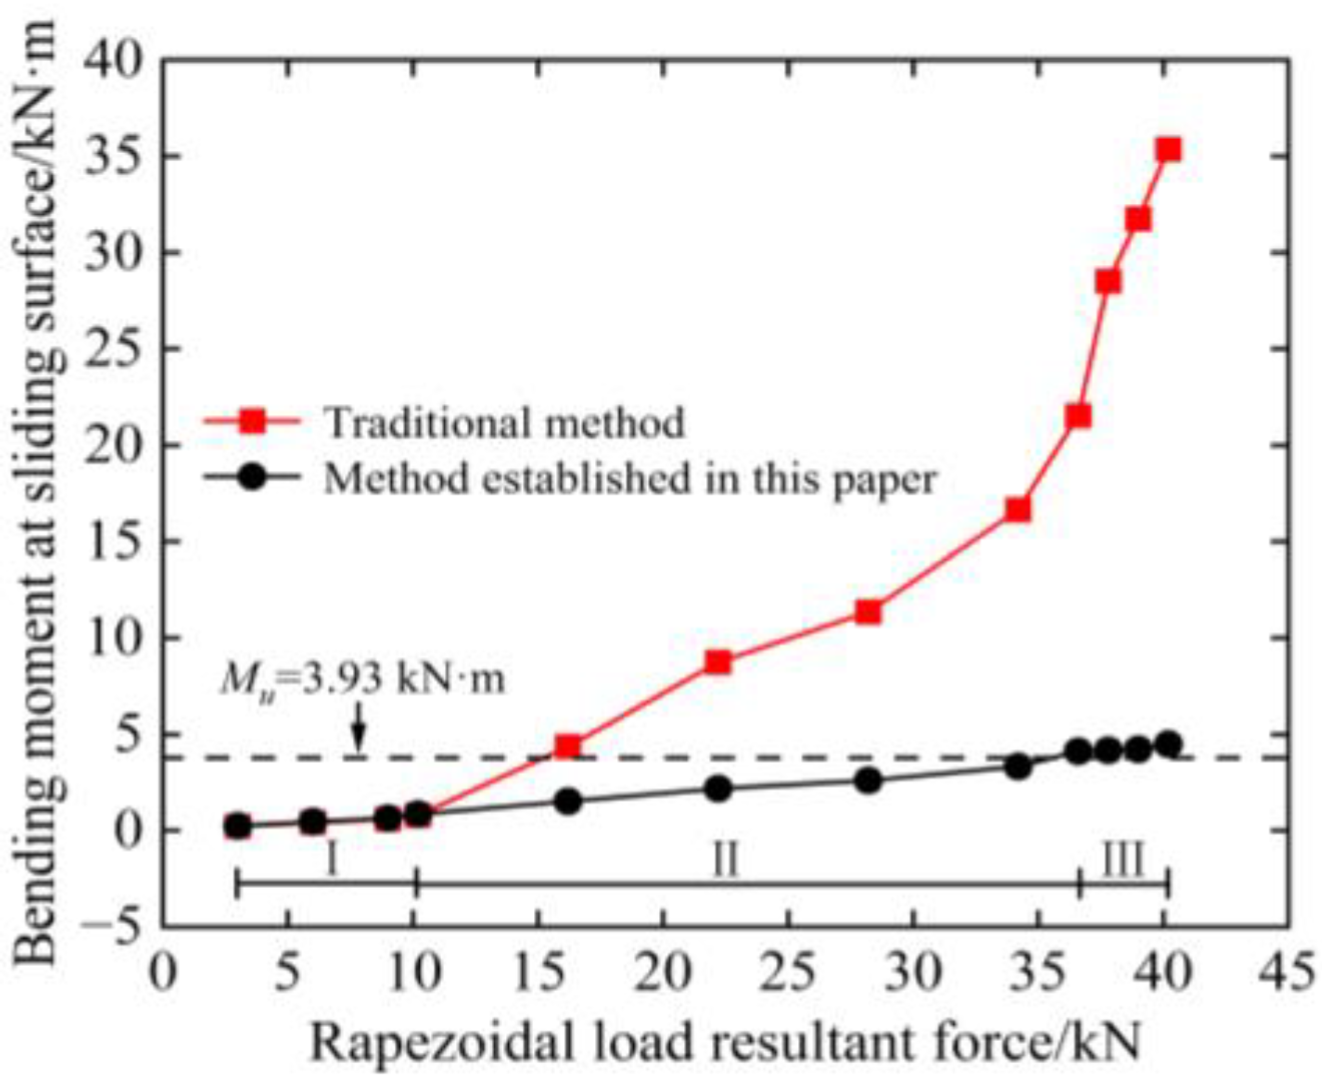
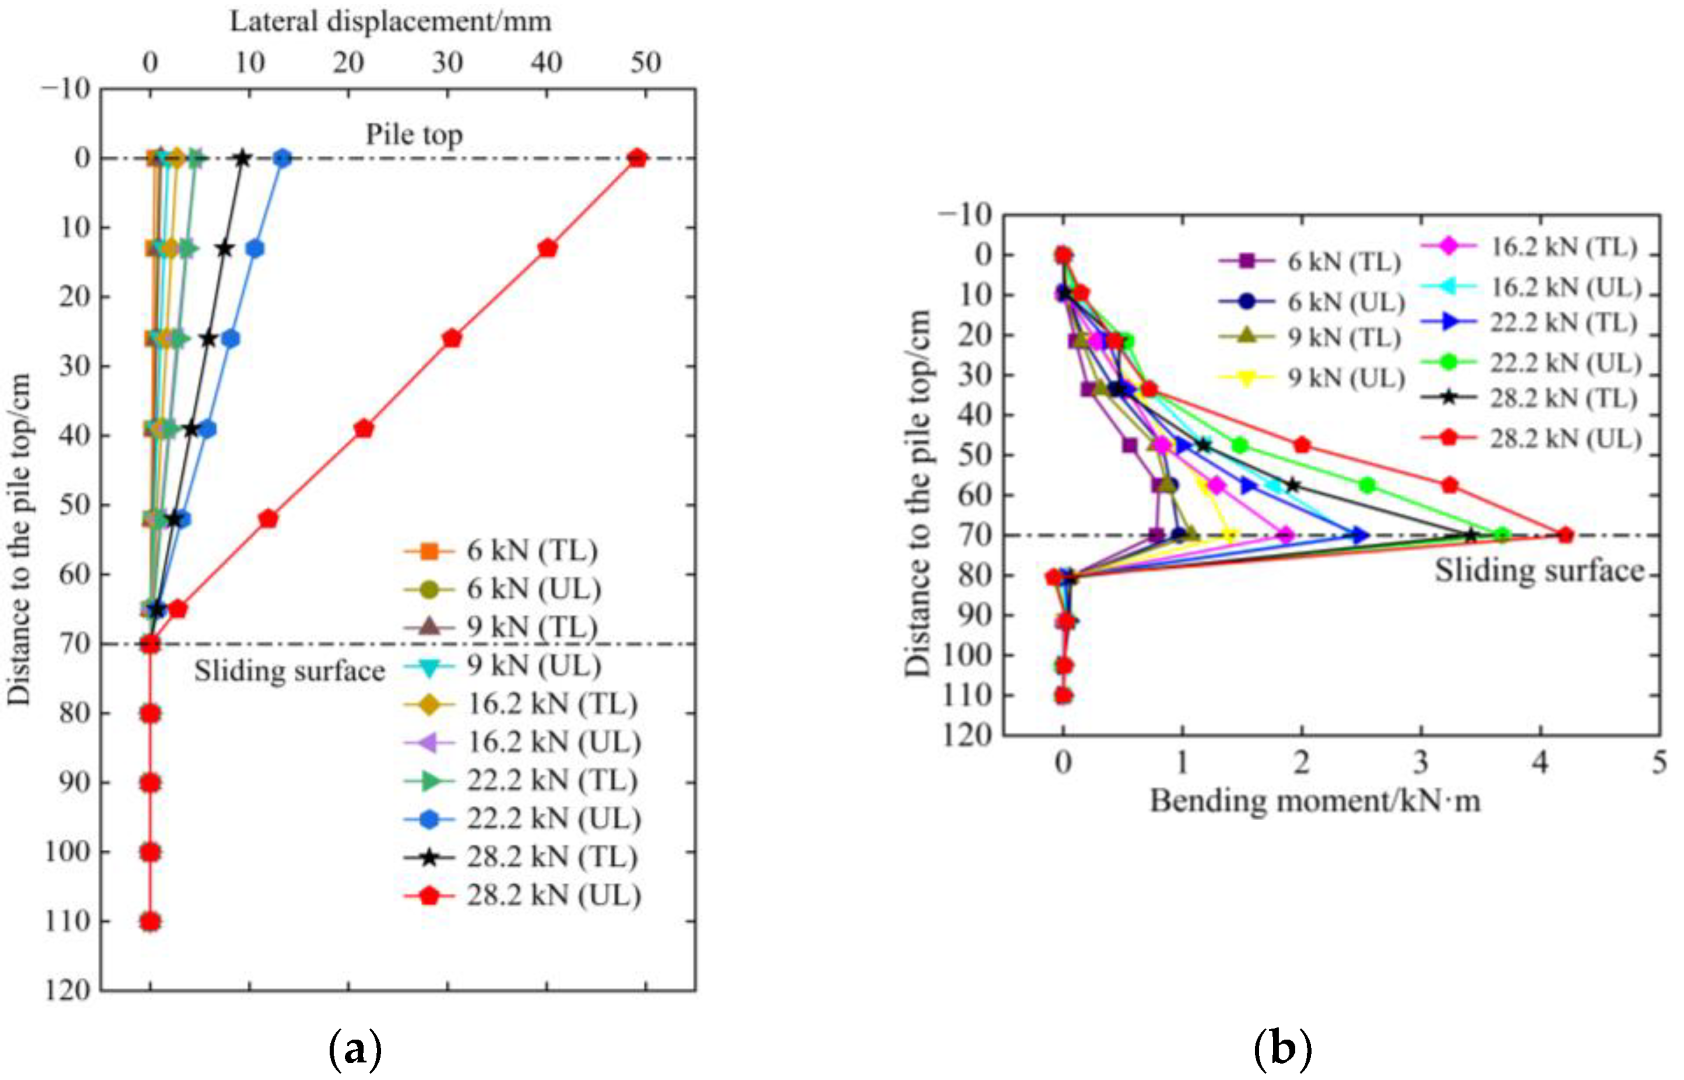
  • The traditional calculation method for the bending moment of an anti-slide pile is unreasonable because the contribution of reinforcement is ignored in the calculation of the section inertia moment, and the calculation result is small when the anti-slide pile works in the uncracked stage. In the crack emerging and developing stage, when the resultant force of the external trapezoidal load reaches 16.2 kN and 36.6 kN, respectively, the bending moments calculated by the traditional method are 2.87 times and 5.24 times that of the optimized calculation method of this study, respectively. The traditional calculation method is no longer applicable. The optimized calculation method for the bending moment of cantilever an anti-slide pile established in this paper is highly feasible when considering the elastoplastic characteristics of reinforcement materials and concrete materials.
  • The pile displacement and bending moment are negatively and positively related to the strength of the pile material, respectively. When the strength of the pile concrete deteriorates from 40 MPa to 20 MPa, the maximum displacement of the pile increases by 55.8% and the bending moment of the pile deteriorates by 7.59%. When the strength of the pile reinforcement deteriorates from 460 MPa to 340 MPa, the maximum displacement of the pile increases by 131.4% and the bending moment of the pile deteriorates by 23%. When the strength of the rock stratum embedded in the pile anchored section is large enough, increasing the length of anchored section cannot significantly improve its bearing capacity. The displacement and bending moment of the anti-slide pile under the uniform load are greater than those under the trapezoidal load. When the thrust loads are 6 kN and 28.2 kN, the maximum displacement of the pile under uniform load increases by 91.5% and 428.5%, respectively, compared with the trapezoidal load, and the maximum bending moment at the sliding surface increases by 24.4% and 23.1%.

Author Contributions

Conceptualization, methodology, data curation, and formal analysis, H.J.; writing—original draft, Q.R.; investigation, S.X. All authors have read and agreed to the published version of the manuscript.

Funding

This work was supported by the National Natural Science Foundation of China (No. U20A20314, 41472262 and 52104184), the Key Projects of Chongqing Natural Science Foundation (No. cstc2020jcyj-zdxmX0012), the Innovation Research Group of Universities in Chongqing (No. CXQT19021), the First Batch of Innovative Leading Talents in Chongqing (No. CQYC201903026), the Chongqing Graduate Research Innovation Project (No. CYB21210) and the Special Support of Chongqing Postdoctoral Research Project (No. 2021XM3038).

Institutional Review Board Statement

Not applicable.

Informed Consent Statement

Not applicable.

Data Availability Statement

No applicable.

Conflicts of Interest

The authors declare no conflict of interest.

References

  1. He, C.C.; Hu, X.L.; Liu, D.Z.; Xu, C.; Wu, S.S.; Wang, X.; Zhang, H. Model tests of the evolutionary process and failure mechanism of a pile-reinforced landslide under two different reservoir conditions. Eng. Geol. 2020, 277, 105811. [Google Scholar] [CrossRef]
  2. Zhang, Y.M.; Hu, X.L.; Tannant, D.D.; Zhang, G.C.; Tan, F.L. Field monitoring and deformation characteristics of a landslide with piles in the Three Gorges Reservoir area. Landslides 2018, 15, 581–592. [Google Scholar] [CrossRef]
  3. Zhou, Y.; Wang, Z.K.; Yang, X.H. Monitoring analysis of anti-slide piles for Jiangdingya landslide in Zhouqu. J. Eng. Geol. 2022, 30, 197–204. [Google Scholar] [CrossRef]
  4. Zhang, H.; Xing, H.F.; Liu, L.L.; Luo, Y. Field test and numerical analysis on deformation response of H-type antislide pile: Case study of Longjiayan landslide, China. Nat. Hazards Rev. 2021, 22, 05021015. [Google Scholar] [CrossRef]
  5. Zhang, L.; Shi, B.; Zhang, D.; Han, H.M.; Wei, G.Q. Evaluation and analysis of working state of anti-slide pile with BOTDR technology. J. Eng. Geol. 2019, 27, 1464–1472. [Google Scholar] [CrossRef]
  6. Wang, C.T.; Wang, H.; Qin, W.N.; Tian, H.N. Experimental and numerical studies on the behavior and retaining mechanism of anchored stabilizing piles in landslides. Bull. Eng. Geol. Environ. 2021, 80, 7507–7524. [Google Scholar] [CrossRef]
  7. Hu, X.L.; Zhou, C.; Xu, C.; Liu, D.G.; Wu, S.S.; Li, L.X. Model tests of the response of landslide-stabilizing piles to piles with different stiffness. Landslides 2019, 16, 2187–2200. [Google Scholar] [CrossRef]
  8. Zhang, J.W.; Wang, X.J.; Wang, H.; Qin, H.Y. Model test and numerical simulation of single pile response under combined loading in slope. Appl. Sci. 2020, 10, 6140. [Google Scholar] [CrossRef]
  9. Wei, S.W.; Sui, Y.Y.; Yang, J.M. Model tests on anti-sliding mechanism of circular and rectangular cross section anti-sliding piles. Rock. Soil. Mech. 2019, 40, 951–961. [Google Scholar] [CrossRef]
  10. Xie, Z.W. Study on Strain Characteristics and Internal Force Nonlinearity of Anti-Slide Pile. Master’s Thesis, China University of Geosciences, Wuhan, China, 2019. [Google Scholar]
  11. Cao, Y. Experimental Study on the Mechanical Behavior of Double-Row Anti-Slide Piles Installed in Parallel. Master’s Thesis, Chang’an University, Xi’an, China, 2019. [Google Scholar]
  12. Li, Z.; Zhu, Z.G.; Zhang, J.; Cao, S.L.; Li, Y.Y. In-situ model test of a cantilever and full-buried single-row double-pile stabilizing system on a loess slope. China J. Highw. Transp. 2020, 33, 14–23. [Google Scholar] [CrossRef]
  13. Li, Y.; Nan, Y.L.; He, H.C.; Zhang, P. Research on model test of double row anti slide piles in loess. J. Safety Environ. 2022, 22, 1314–1321. [Google Scholar] [CrossRef]
  14. GB/T 38509-2020; Code for the Design of Landslide Stabilization. National Standardization Management Committee of the People’s Republic of China: Beijing, China, 2020.
  15. Liu, X.Y.; Cai, G.J.; Liu, L.L.; Zhou, Z.J. Investigation of internal force of ant-slide pile on landslides considering the actual distribution of soil resistance acting on anti-slide piles. Nat. Hazards 2020, 102, 1369–1392. [Google Scholar] [CrossRef]
  16. GB 175-2020; Common Portland Cement. China Architecture Press: Beijing, China, 2020.
  17. JGJ 55-2011; Specification for Mix Proportion Design of Ordinary Concrete. State Administration of Market Supervision and Administration of the People’s Republic of China: Beijing, China, 2011.
  18. He, C.C.; Hu, X.L.; Dwayne, D.; Tannant, T.F.; Zhang, Y.M.; Zhang, H. Response of a landslide to reservoir impoundment in model tests. Eng. Geol. 2018, 247, 84–93. [Google Scholar] [CrossRef]
  19. Zhou, C.; Hu, X.L.; Zheng, W.B.; Xu, C.; Wang, Q. Displacement characteristic of landslides reinforced with flexible piles: Field and physical model test. J. Mt. Sci. 2020, 17, 787–800. [Google Scholar] [CrossRef]
  20. Chen, J.G.; Guo, X.P.; Tian, D.; Yu, S.B. Effect of anti-slide piles anchorage lengths on slip surface and anti-slide capacity of homogeneous slope. J. Tongji Univ. 2022, 50, 42–49. [Google Scholar] [CrossRef]
  21. GB/T 50152-2012; Standard for Test Methods of Concrete Structures. China Architecture Press: Beijing, China, 2012.
  22. Xin, J.Z.; Jiang, Y.; Zhou, J.T.; Peng, L.L.; Liu, S.Y.; Tang, Q.Z. Bridge deformation prediction based on SHM data using improved VMD and conditional KDE. Eng. Struct. 2022, 261, 114285. [Google Scholar] [CrossRef]
  23. Jiang, Y.; Hui, Y.; Wang, Y.; Peng, L.L.; Huang, G.Q.; Liu, S.Y. A novel eigenvalue-based iterative simulation method for multi-dimensional homogeneous non-Gaussian stochastic vector fields. Struct. Saf. 2023, 100, 102290. [Google Scholar] [CrossRef]
  24. Liu, D.Z.; Hu, X.L.; Zhou, C.; Xu, C.; He, C.C.; Zhang, H.; Wang, Q. Deformation mechanisms and evolution of a pile-reinforced landslide under long-term reservoir operation. Eng. Geol. 2020, 275, 105747. [Google Scholar] [CrossRef]
  25. GB 50010-2019; Code for Design of Concrete Structures. China Architecture & Building Press: Beijing, China, 2019.
  26. Qiu, Y.H. Stability Analysis and Anti-Slide Pile Treatment Study of Gaojia Fangji Landslide. Master’s Thesis, Southwest Jiaotong University, Chengdu, China, 2021. [Google Scholar]
Figure 1. Basic information of the target anti-slide pile. (a) Location; (b) geographic location; (c) topographical map; (d) realistic picture; (e) engineering geological profile.
Buildings 13 00322 g001
Figure 2. Diagrammatic sketch of the dimensions and section reinforcement of the test piles (unit: mm). (a) Dimensions; (b) section reinforcement.
Buildings 13 00322 g002
Figure 3. Distribution of trapezoidal thrust load behind an anti-slide pile.
Buildings 13 00322 g003
Figure 4. Diagrammatic sketch of test device (unit: mm).
Buildings 13 00322 g004
Figure 5. Load test on the test pile.
Buildings 13 00322 g005
Figure 6. Three-dimensional model diagram of the fixing system of test pile.
Buildings 13 00322 g006
Figure 7. Layout diagram of screw jacks and steel strain gauges.
Buildings 13 00322 g007
Figure 8. Loading design of the test pile.
Buildings 13 00322 g008
Figure 9. Arrangement of percentage meters.
Buildings 13 00322 g009
Figure 10. Experimental procedures.
Buildings 13 00322 g010
Figure 11. Displacement distributions along the test pile.
Buildings 13 00322 g011
Figure 12. Variation curve of the thrust load with the pile top displacement.
Buildings 13 00322 g012
Figure 13. Crack distributions along the test pile. (a) Side A; (b) Side B; (c) Side C; (d) Side D; (e) Pile.
Buildings 13 00322 g013
Figure 14. Section strain distribution along the test pile. (a) CSG-1; (b) CSG-2.
Buildings 13 00322 g014
Figure 15. Stress and strain diagrams of the pile normal section in stage I. (a) Pile section; (b) transformed section; (c) distribution of average strain; (d) distribution of normal stress.
Buildings 13 00322 g015
Figure 16. Stress and strain diagrams of the anti-slide pile in normal section Stage Ⅱ. (a) Distribution of average strain; (b) distribution of normal stress.
Buildings 13 00322 g016
Figure 17. Typical stress–strain constitutive relationships of reinforcement and concrete.
Buildings 13 00322 g017
Figure 18. Stress and strain diagrams of the anti-slide pile in normal section stage Ⅲ. (a) Distribution of average strain; (b) distribution of normal stress.
Buildings 13 00322 g018
Figure 19. Calculation flow chart of bending moment of anti-slide pile at each stage.
Buildings 13 00322 g019
Figure 20. Bending moment distributions along test pile.
Buildings 13 00322 g020
Figure 21. Comparison of the maximum bending moments of the test pile based on the traditional method and the optimized calculation method.
Buildings 13 00322 g021
Figure 22. Three-dimensional numerical model and loading diagram of model pile.
Buildings 13 00322 g022
Figure 23. Comparison of the experimental and numerical simulation results. (a) Displacement; (b) thrust load-pile top displacement; (c) distribution of bending moment.
Buildings 13 00322 g023
Figure 24. Variations of the pile displacement and bending moment with respect to concrete strength. (a) Pile displacement; (b) pile bending moment.
Buildings 13 00322 g024
Figure 25. Variations of the pile displacement and bending moment with respect to steel bars’ strength. (a) Pile displacement; (b) pile bending moment.
Buildings 13 00322 g025
Figure 26. Variations of the pile displacement and bending moment with respect to anchor ratio. (a) Pile displacement; (b) pile bending moment.
Buildings 13 00322 g026
Figure 27. Displacement and bending moment comparisons for the anti-slide pile under trapezoidal load and uniform load. (a) Displacement; (b) bending moment.
Buildings 13 00322 g027
Table 1. Basic parameters of the actual cantilever anti-slide pile.
Sectional Width (m)Sectional Height (m)Length
(m)
Length of Loaded Section (m)Length of
Anchored Section (m)
Spacing between Piles (m)ConcreteSteel BarsRatio of
Tensile Steel Bars (%)
1.82.716.510.56.06.0C30HRB4000.69
Table 2. Similarity ratio of model test.
Parameter TypePhysical QuantitiesSimilarities RelationshipSimilarity Constants
Geometric parametersLength (L) C l 15
Displacement (y) C y = C l C ε 15
Area (A)CA = Cl2225
Material parametersStrain ( ε ) C ε 1
Modulus of elasticity (E) C E 1
Stress (σ) C σ = C E 1
Poisson’s ratio (μ) C μ 1
Reinforcement rate (ρ) C ρ 1
Table 3. Parameters of the dimensions and reinforcement of the test pile.
Sectional Width (cm)Sectional Height (cm)Length
(cm)
Length of Loaded Section (cm)Length of
Anchored Section (cm)
Thickness of Concrete Cover (cm)ConcreteSteel BarsRatio of
Tensile Steel Bars (%)
1.82.716.510.56.06.0C30HRB4000.69
Table 4. Calculation results of the bending moment and deflection under trapezoidal load and concentrated load.
q:nqFycMω/ω0m = 3m = 4m = 5
ω30D3ω40D4ω50D5
1:32ql5l/125ql2/60.1920.16812.14%0.16514.03%0.16314.99%
1:45ql/22l/5ql20.2250.2087.59%0.20110.52%0.19812.01%
1:53ql7l/187ql2/60.2580.2493.52%0.2397.32%0.2349.26%
1:67ql/28l/214ql2/30.2920.2920.02%0.2784.55%0.2726.86%
Note: ω0 = ql4/(EI).
Table 5. Mix Proportions.
Concrete Strength GradeWater-Binder RatioCement (kg/m3)Water (kg/m3)Gravel (kg/m3)Sand (kg/m3)SP (kg/m3)
C300.57244 (1)139 (0.57)1291 (5.29)726 (2.98)2.44
Table 6. Measured performances of concrete.
GradeDensity
(kg/m3)
Cube Compressive Strength
(MPa)
Axial Compressive Strength
(MPa)
Axial Tensile Strength
(MPa)
Elastic Modulus
(GPa)
C30240035.323.62.2431.6
Table 7. Measured performances of steel bars.
TypeGradeDiameter (mm)Density (kg/m3)Yield Strength (MPa)Tensile Strength (MPa)Elastic Modulus (GPa)Poisson’s RatioElongation
(%)
N1HRB400878504325582010.319.4
N2, N3641152619821.3
Disclaimer/Publisher’s Note: The statements, opinions and data contained in all publications are solely those of the individual author(s) and contributor(s) and not of MDPI and/or the editor(s). MDPI and/or the editor(s) disclaim responsibility for any injury to people or property resulting from any ideas, methods, instructions or products referred to in the content.

