Article

Response Characteristics of Pre-Stressed Strand Cables Subjected to Low-Velocity Impact: Experiment Test

1
Shandong Provincial Key Laboratory of Civil Engineering Disaster Prevention and Mitigation, Shandong University of Science and Technology, Qingdao 266590, China
2
School of Civil Engineering, Southeast University, Nanjing 211189, China
*
Author to whom correspondence should be addressed.
Buildings 2023, 13(2), 330; https://doi.org/10.3390/buildings13020330
Submission received: 22 December 2022 / Revised: 19 January 2023 / Accepted: 20 January 2023 / Published: 22 January 2023
(This article belongs to the Special Issue Damage Detection Based on Smartphones in Buildings)

Abstract

:
This paper introduces some experimental data measured from 63 impact tests of pre−stressed strand cables. The test specimens consist of seven steel wires that have a length equivalent to 100 times the outside diameter. To ensure consistency with the engineering service status, the strand cables are fully installed in a specially designed device and are axially pre−stretched to 0% to 40% of the ultimate bearing capacity before being subjected to lateral impact. The mass of the indenter is 50.34 kg, and the maximum impact velocity reaches 13 m/s. Two dimensionless variables, axial force and input kinetic energy, are used to control the experimental parameters. The recorded test data show that input energy and pre−stress level are the key factors governing the impact behavior, which is mainly characterized by plastic deformation controlled by the combination of tension and flexure, and the dynamic fracture concentrated in the impact zone is controlled by the joint effects of compression, tension and shear. As the impact energy increases, the dynamic mode of the test specimen changes from elastic rebound to plastic deformation, and finally evolves into fracture of some or all steel wires, which correspond to slight, partial and total loss of pre−tension, respectively. An increase in the level of pre−stress will significantly reduce the critical displacement of the structural failure but has little effect on the critical failure energy. The present paper provides a basic experimental data and mechanical analysis framework for the analysis, design and evaluation of the mechanical behavior of strands under accidental lateral impact.

Graphical Abstract

1. Introduction

Strand cables are frequently adopted in various infrastructures, e.g., cable−stayed bridges [1,2], stadium roof systems [3], Ferris wheels and offshore oil platforms to connect main structural components in the whole engineering project and convey axial force over long distances. These cables may be located in any situation that involves a potential hazard, so safety calculations are necessary to assess the hazard associated with the accidental loss of structural integration. During the last two decades, impact loads seem to have become particularly hazardous and urgent, therefore safety assessments are required for the robustness of strand cables to a flying object [4,5,6], which, for instance, as demonstrated in Figure 1a–c, may be deliberately controlled aircraft or an uncontrolled fragment induced from an explosion. As the simplified mechanical diagram illustrated in Figure 1d shows, the current work investigates the extreme events where a rigid indenter strikes a strand cable with sufficient impact energy, causing plastic to have permanent deformations leading to loss of integrity.
The most notable feature of strand cables is that they can withstand large axial loads but have relatively little bending stiffness. Therefore, the vast majority of studies have focused on geometric composition, fabrication process [7,8,9,10,11,12] and mechanical performance when subjected to axial loading, e.g., finite element simulation method [13,14,15,16,17,18], natural vibration characteristics [19,20,21,22,23] and theoretical predications [24,25,26,27,28,29]. In comparison, few scholars have carried out studies of strand cables subjected to lateral loading [30,31,32].
Judge et al. [33] seems to have carried out the only available test on the impact behavior of strand cables by fragment impact. Six 1 m long and 60 mm diameter spiral strand cables which consist of 120 strings were struck by specially designed fragments travelling at an impact velocity of around 200 to 1400 m/s. It was found that with sufficient impact velocity, nearly all damage was localized to the impact zone together with evident wire splay and flattening of strings. Furthermore, a complex numerical model was developed and used to explore the correlation between impact velocity and fragment penetration depth.
Strand cables in engineering service are usually subjected to axial tension before lateral impact. Therefore, it is important to study whether the pre−stress influences its dynamic response process, or if and how the pre−stress changes the critical input energy that fails the cables. As a pioneering work in this research community, despite Judge [33] recognizing the importance of pre−tension loading, due to safety restrictions, the authors did not conduct the related test. This research gap motivated the present work.
In the current study, one series of drop hammer tests are conducted on the strand cables with a range of pre−stress levels. The aim is to produce sufficient data for the actual engineering conditions which have not yet fully been tested in a laboratory or analyzed in simulations. Based on the recorded data, the response process, failure mechanism and influence of pre−stress are quantitatively identified. This paper is organized as follows: an outline of experimental details is presented in Section 2. The associated experimental results are described in Section 3. Discussion comprises Section 4 to demonstrate the response characteristic of the cables, which is followed by Section 5

2. Methods—Description of Experiment

2.1. Test Specimen and Material Properties

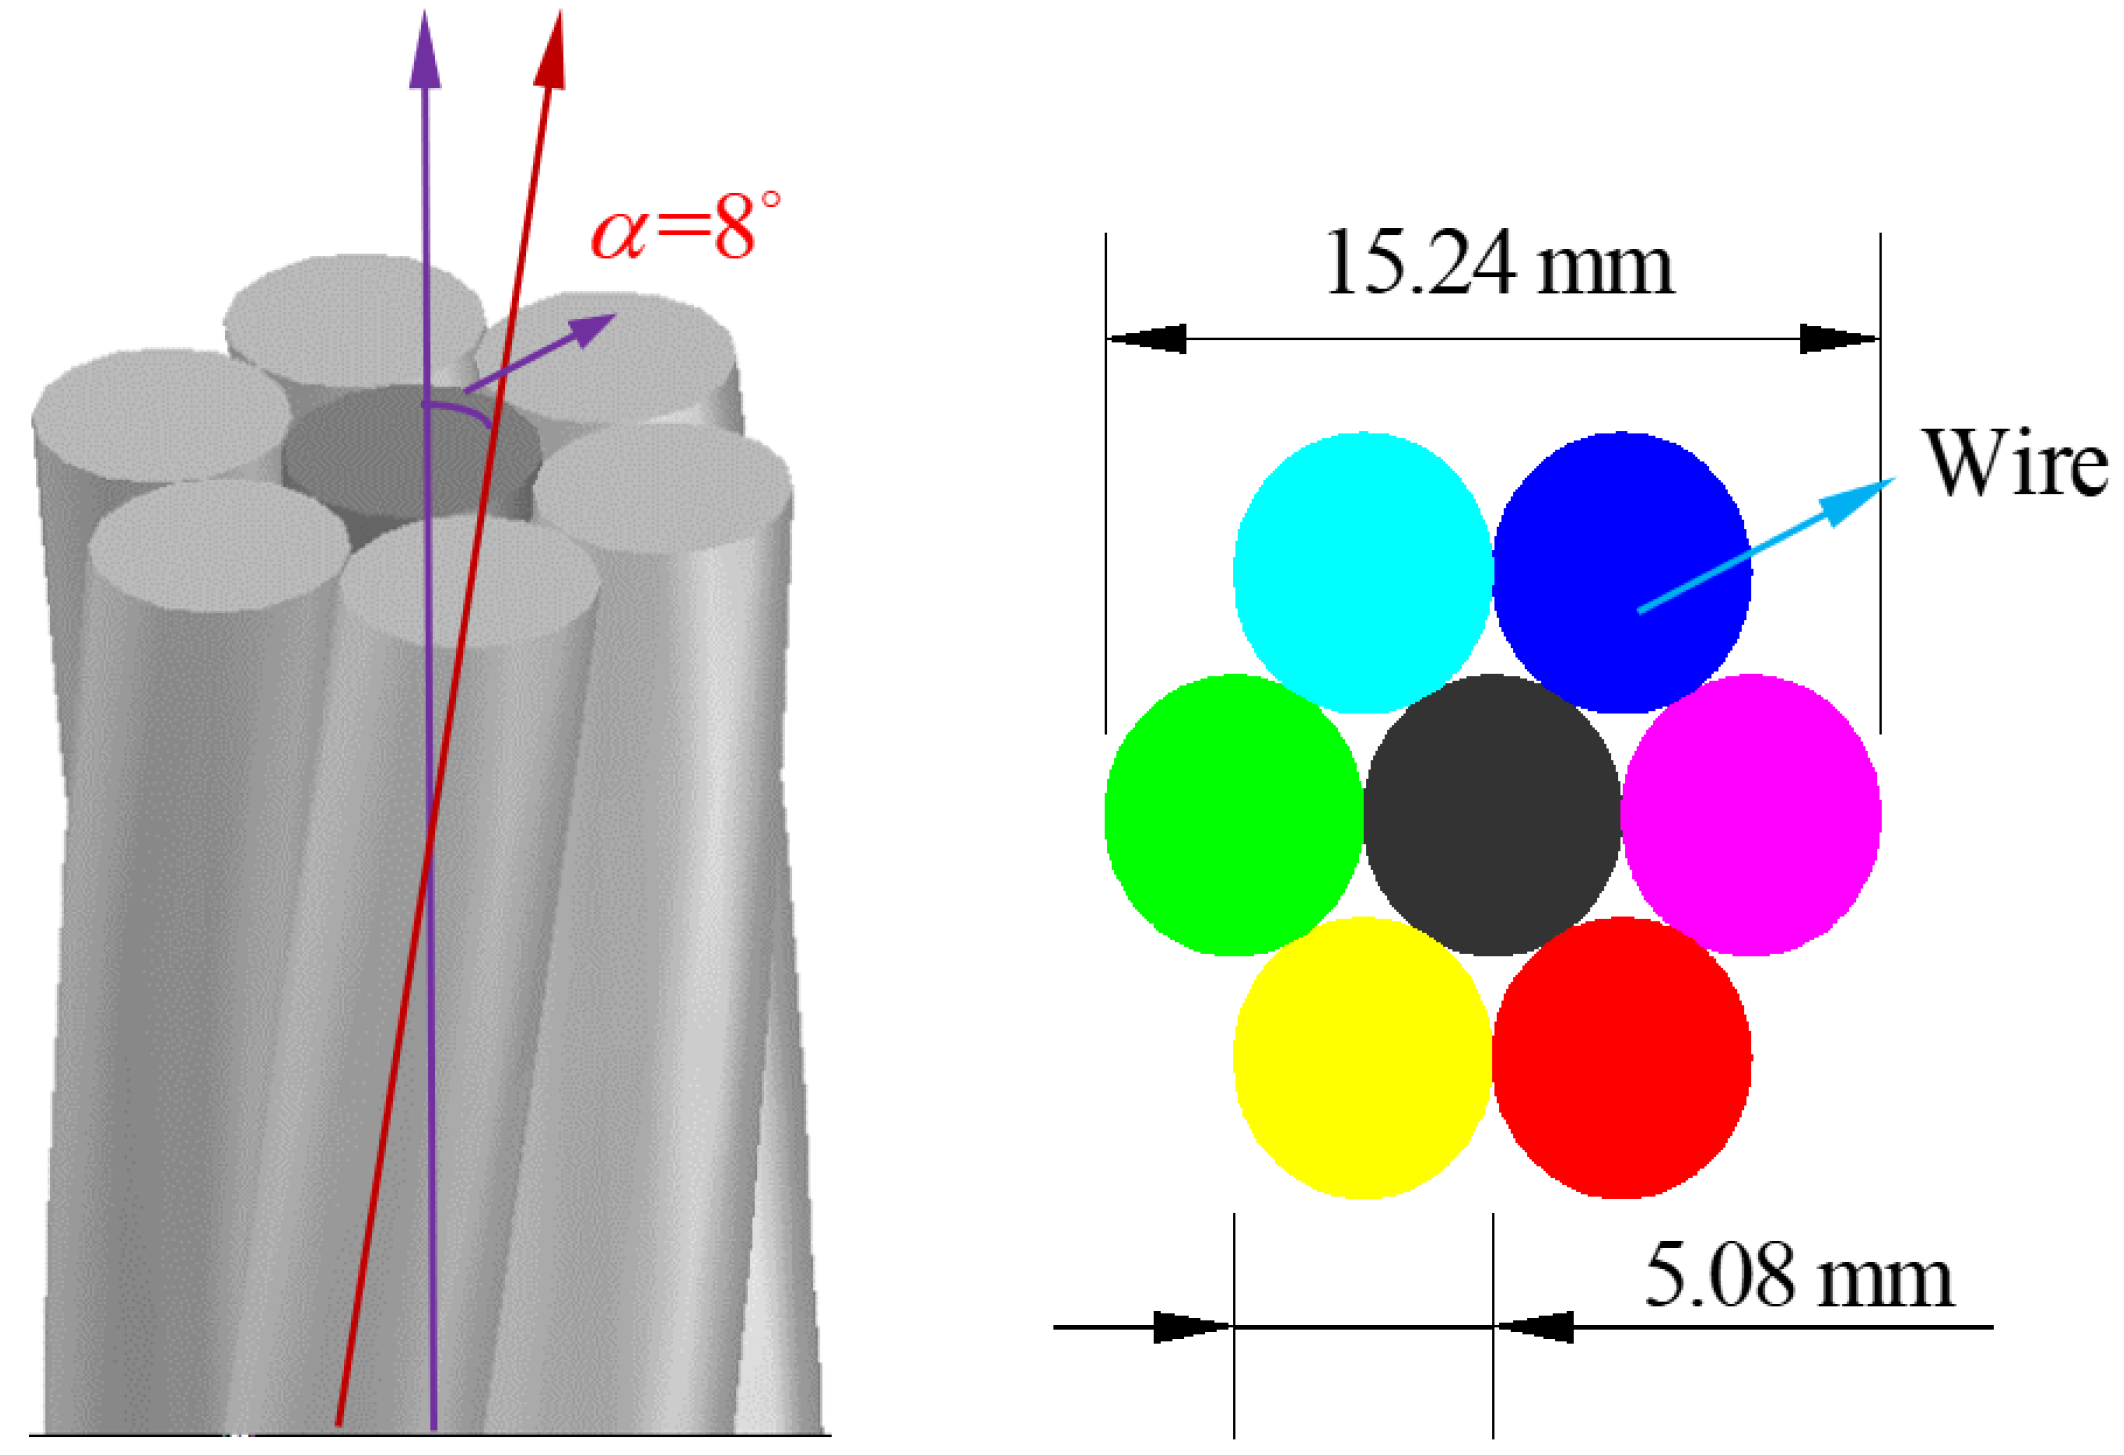
The cable selected for testing in the present study is a 15.24 mm diameter spiral strand which consists of seven wires with diameters of 5.08 mm. The strand has one straight central core wire and six outer wires which are spirally wound in a clockwise direction over the central wire. This type of specimen is frequently referred to as the “ 1 × 7 ” configuration [34].
The geometric details of the cable are demonstrated in Figure 2. The strand lay angle and pitch length are 8 and 226 mm, respectively. The nominal sectional area of the specimen is 140.0 mm2. The material composition of the strand is listed in Table 1.
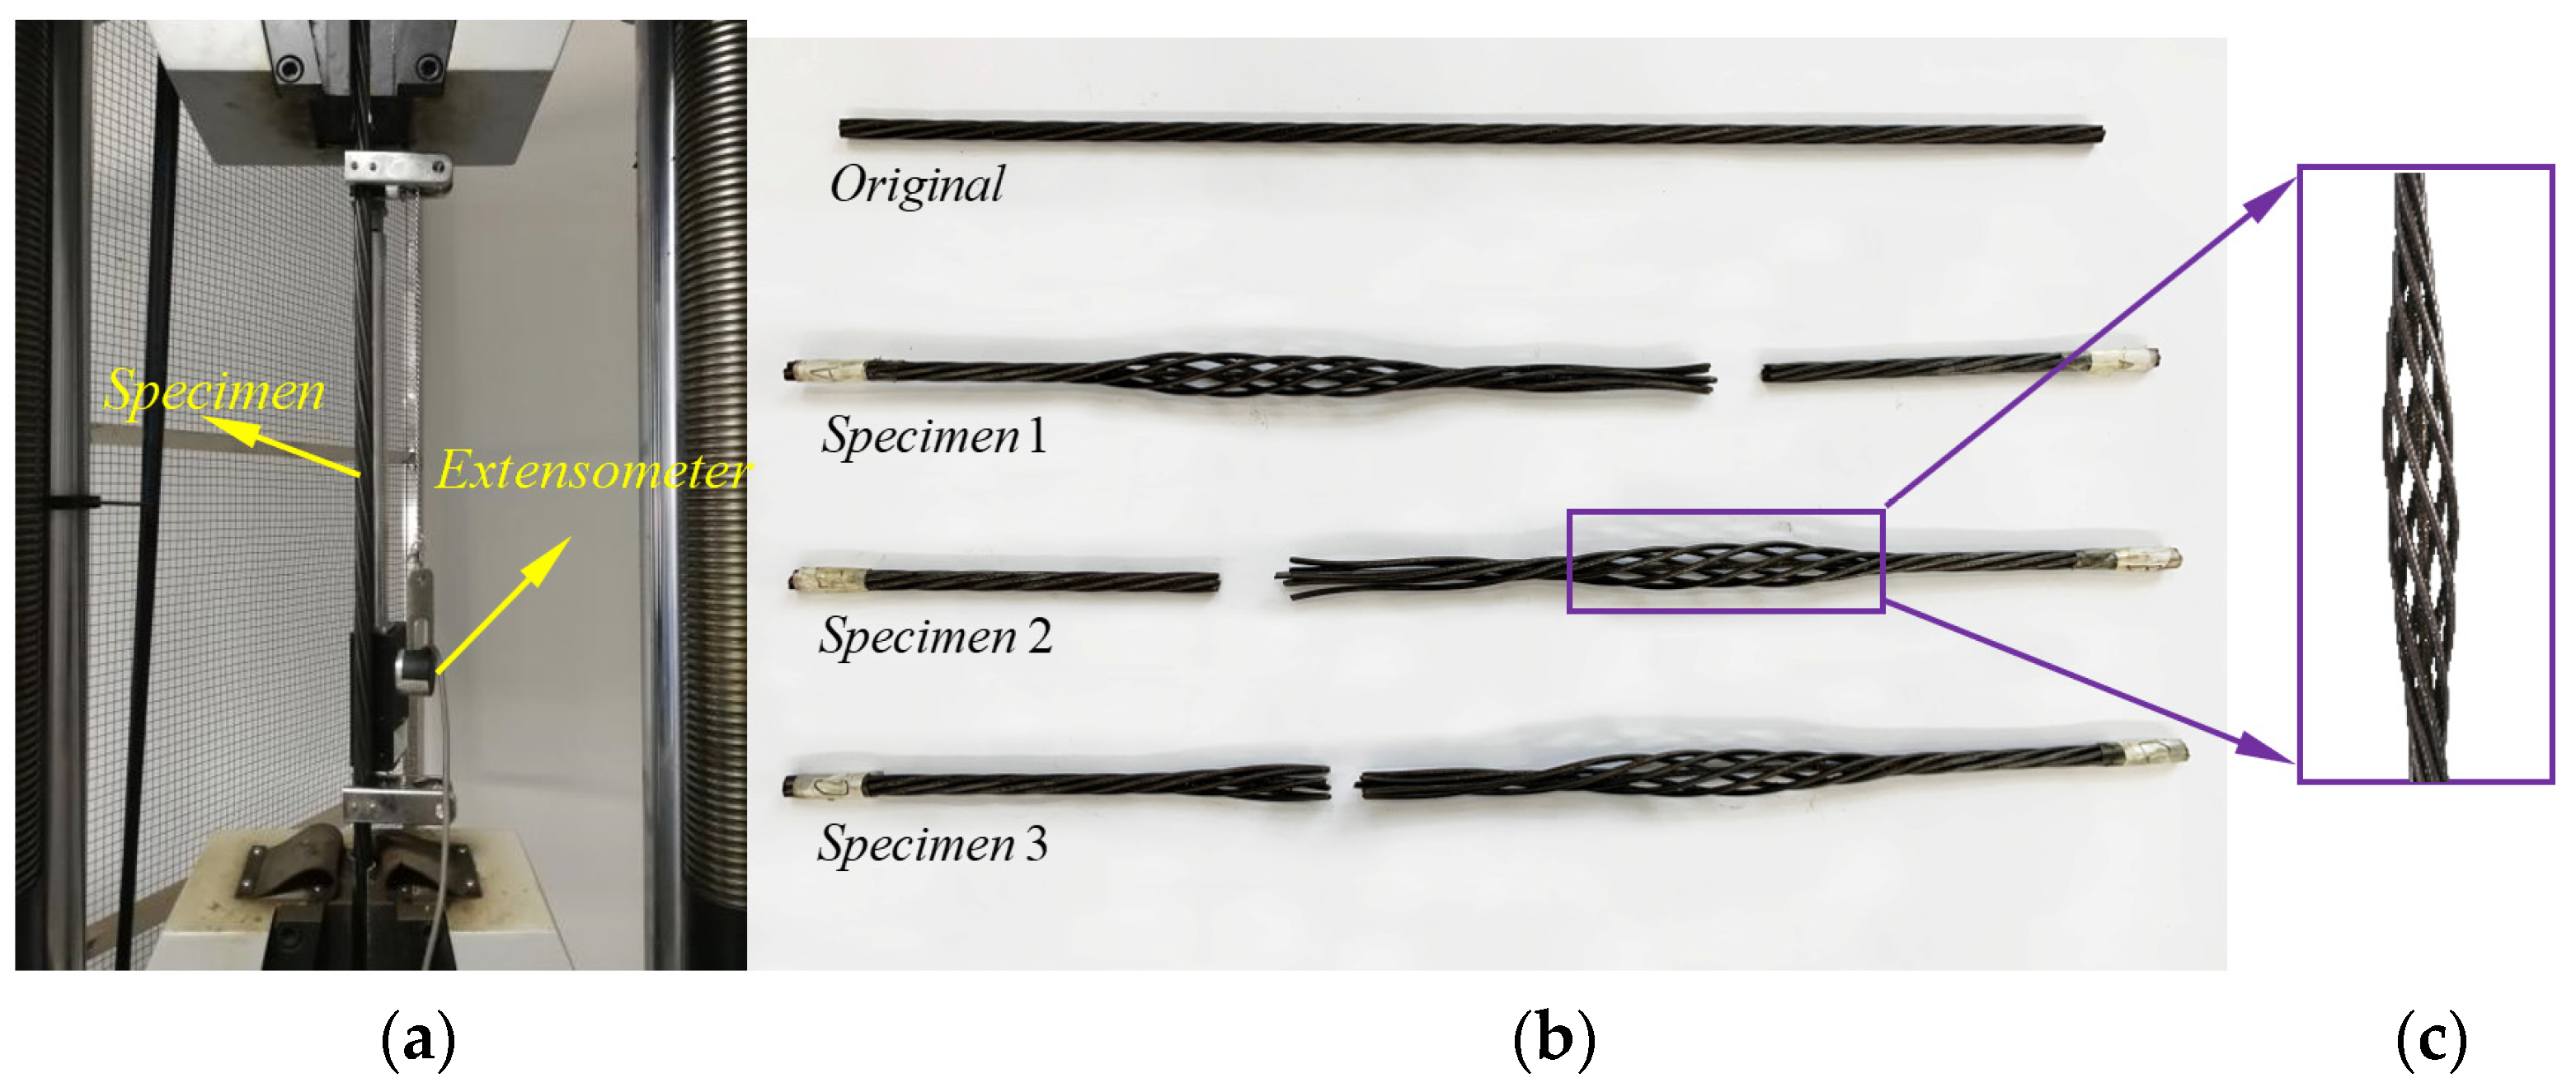
As shown in Figure 3a, static uniaxial tensile tests were conducted on a specific test machine. The tensile test pieces were cut from the strand cable along the longitudinal axial direction. During the test, the stress rate of 30 MPa/s and strain rate of 0.005 s−1 were adopted as the loading strategy in the elastic and plastic stages, respectively, according to the Chinese standard of GB/T 288.1-2021 [35]. The displacement of specimen during the elastic regime was measured by electric−optical extensometer. To ensure the test data are repeatable, three specimens were stretched following the same process. As illustrated in Figure 3b, the failure location is random along the test specimen, but all of them appear with a “birdcaging” like knot near the fracture. This should be attributed to the high−speed retraction of the wires and the interaction among them after the brittle fracture under the high tensile stress.
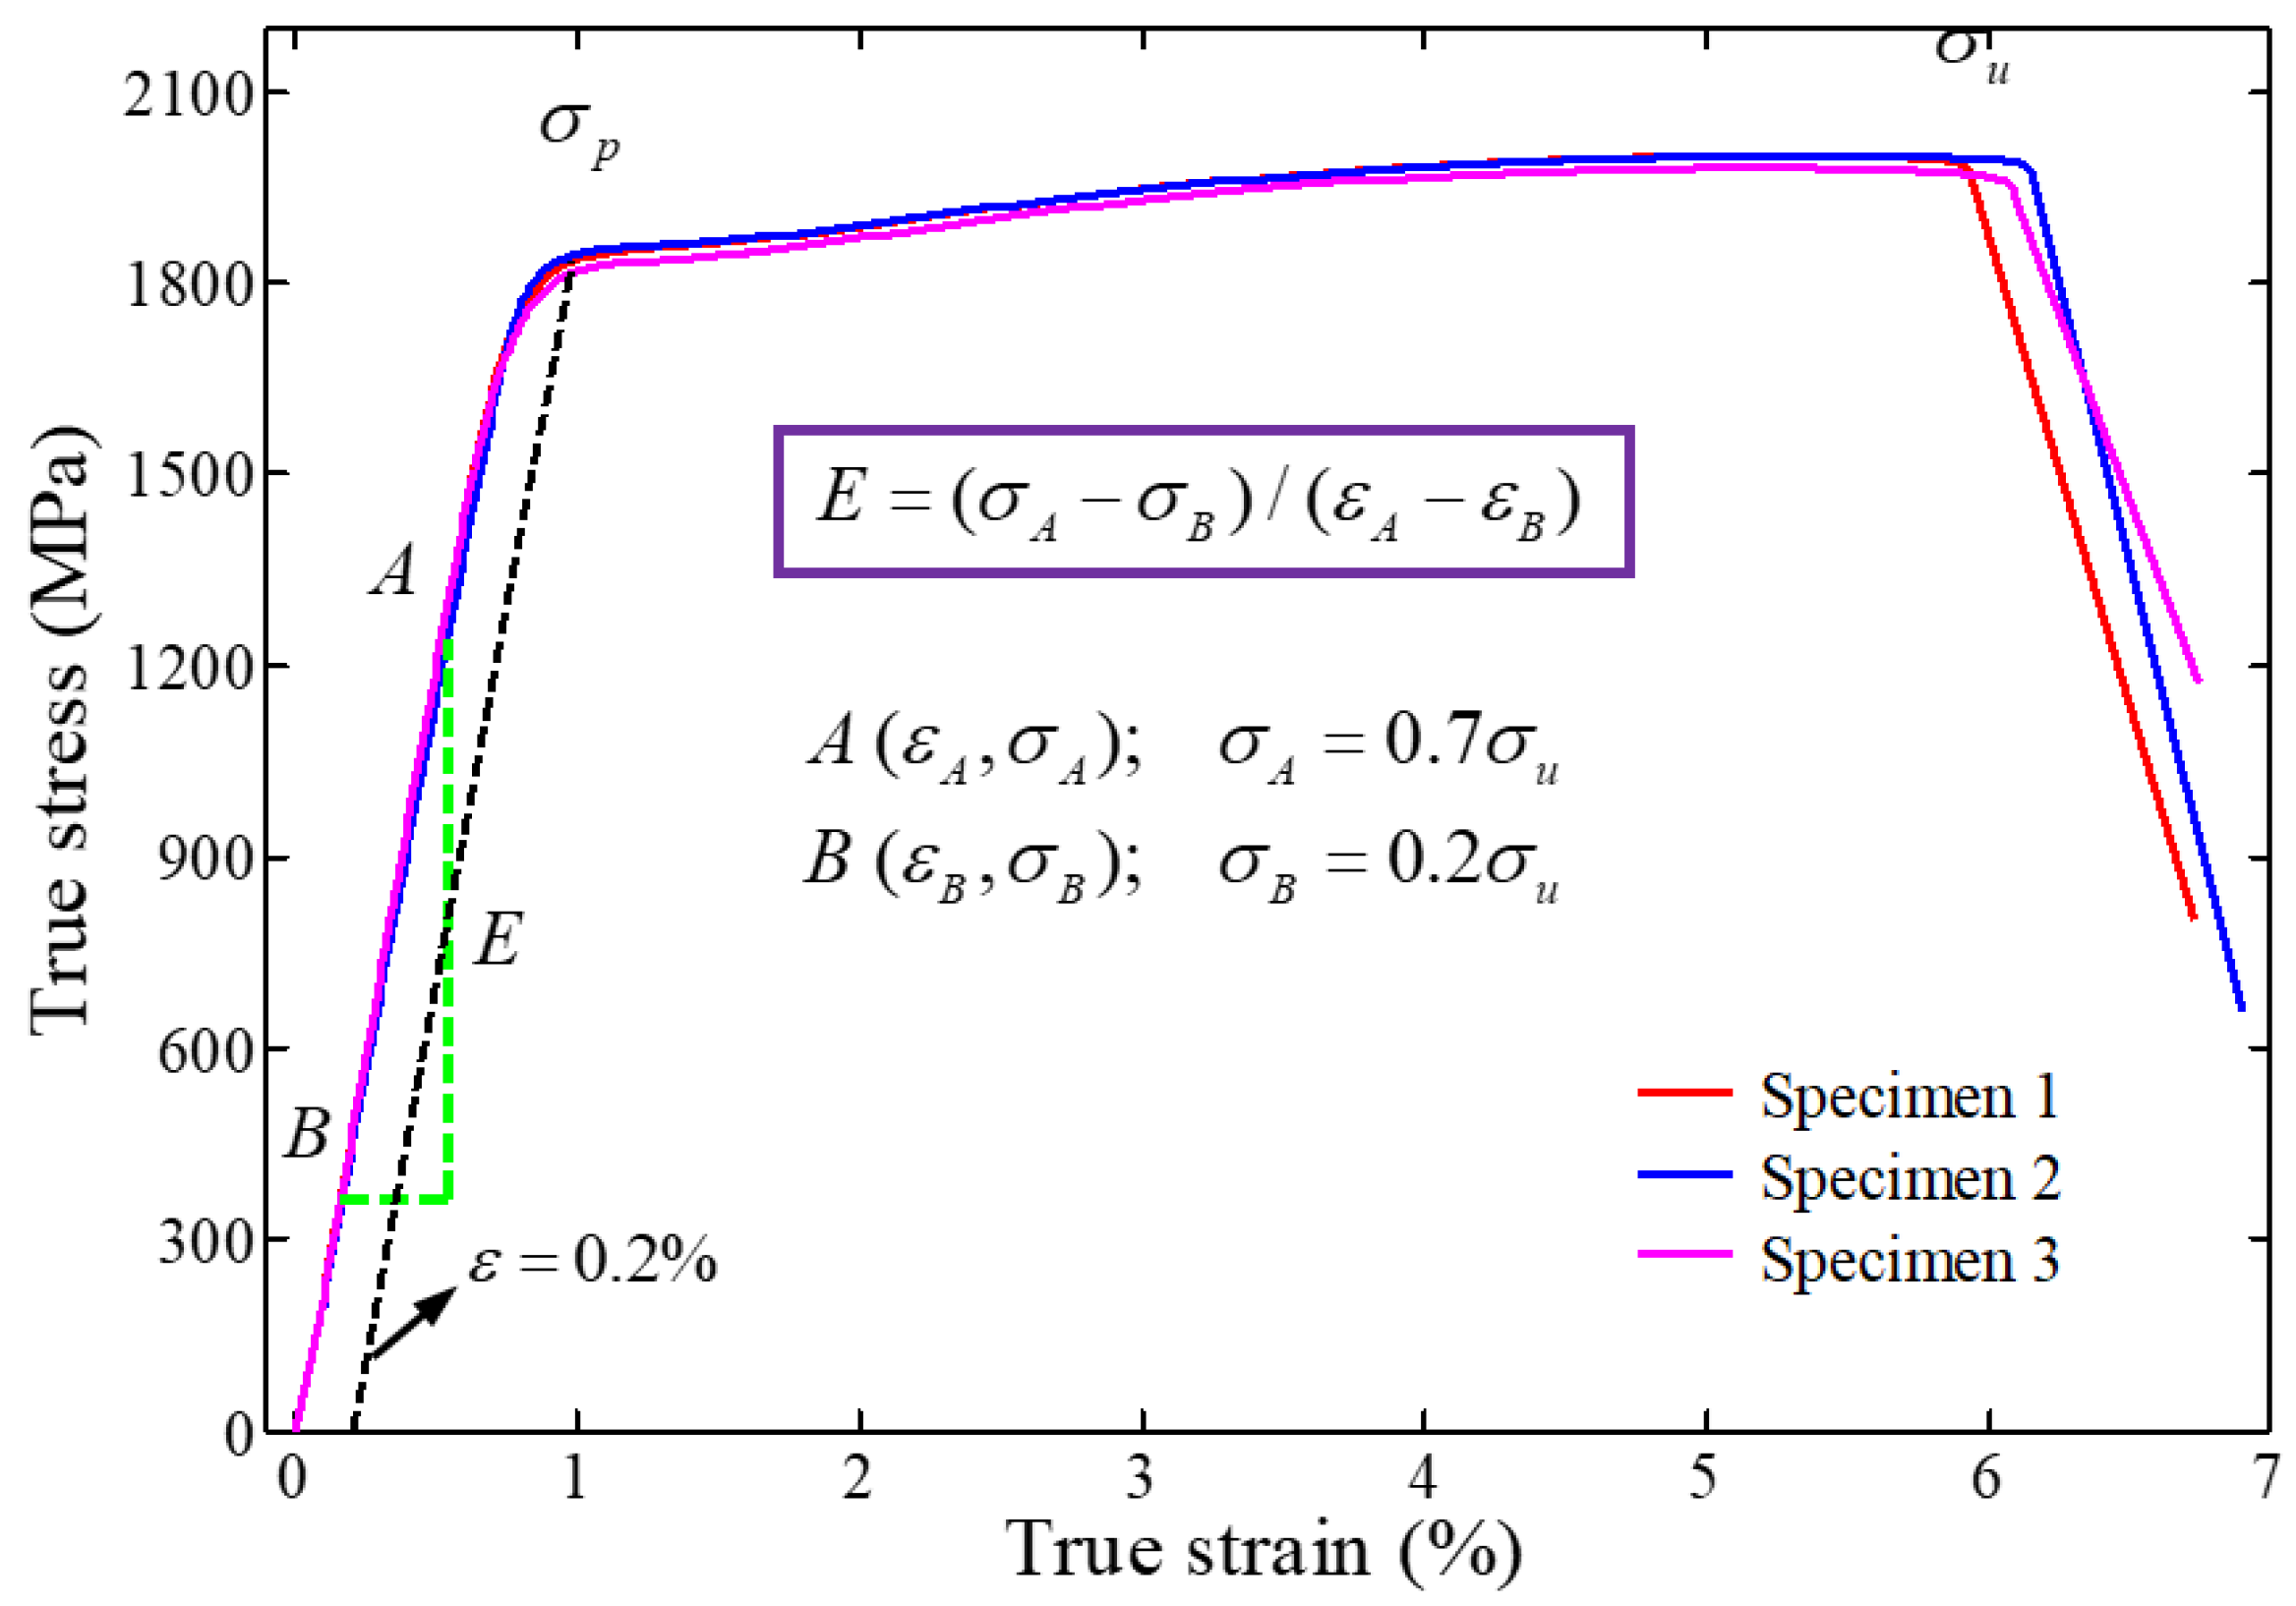
The stress–strain curves calculated from the test data are shown in Figure 4 and the specimen information and main test parameters are summarized in Table 2, where 0.2% proportional stresses are given because it is often difficult to locate the exact stress at which plastic deformation occurs. According to Chinese code about the metallic material tensile testing method (GB/T 228.1−2021) [35], the elastic modulus is identified as the slope of line AB as illustrated in Figure 4. The average mechanical properties of the specimen are elastic modulus (E) of 200 GPa, yield stress ( σ 0.2 ) of 1825 MPa, ultimate stress ( σ u ) of 1986 MPa, and engineering rupture strain ( ε r ) of 6.50%. The maximum tension force is 278.9 kN.
Due to the limitations of the test equipment, the tensile test of the specimen under different strain rates was not carried out. Considering the present paper focuses on the low−velocity impact behavior of strand cables, this effect should not significantly affect the structural response.

2.2. Test Setup

The experimental setup for the current study is demonstrated in Figure 5 and is idealized in Figure 1d. Cable specimens with or without pre−stress were fully clamped across a span of L = 1524 mm and struck by a 50.34 kg spherical shaped indenter. The impact face of the indenter is 30 mm wide with a 15 mm radius and has a 300 mm width orthogonal to the cable axis.
In the present test setup, the clamping device accommodates steel cables of different diameters, and the stiffening framework provides sufficient stiffness in both the preparation and impact stages of the test, which is closer to the actual engineering state.
Prior to the impact test, each specimen was fully clamped in a fitting which is mounted on the anvil of a drop hammer rig, and then pre−tensioned to the required level. Many round holes with different diameters were drilled on these rigs to adapt to various experiments which aim to understand the effect of strand diameters. Since the specimen with given diameter could just pass through a specified hole, the free displacement in its root section along the impact direction can be efficiently avoided.
A hydraulic jack with a capacity of 500 kN is arranged next to the left side of the stiff rig to exert the designed tension force. At the same time, a high−frequency response (20 kHz) piezo−electric loading cell situated immediately to the right side of the stiff rig was used to measure the static and dynamic tensile force during the pre−tensing loading stage and impact process.
The test pieces were connected to the jack and load cell by anchors on both sides, and a specially designed stiff steel framework was mounted on the topside of the clamping rig to prevent potential inward axial displacement of the specimen from the supports due to the sharp increase of axial loading during the impact.
Signals from the transducers were collected using a DH5922 dynamic acquisition recorder with sampling rate of 10,000 Hz. Meanwhile, high speed video Photron SAT1.1 was used to capture the transient response with 4000 fps.

2.3. Test Process and Working Cases

To match the real service status of cables, the present test was carried out in two steps. The first step was static stretching of the cables. The axial force level was applied and detected by the jack and the load cells. The specimen was locked by the anchor after reaching the designed stress level. In this paper, the dimensionless quantity shown in Equation (1) was used to characterize the initial and residual stress before and after impact.
μ p = F p F u
μ R = F R F p
where, F p , F R , F u are initial, residual axial force before and after the impact and the ultimate capacity force under the uniaxial tension, respectively. To simulate engineering practice and cover a wide scope of engineering interests, five initial stress levels of μ p = 0.0 ,    0 . 1 ,    0 . 2 ,    0 . 3 ,    0 . 4 were considered in the present test.
The second step was lateral impact. After the axial force of the cable specimen reached the target level, a transverse drop impact was applied across its mid−span section. The impact velocity range was controlled in the regime of 3.0   m / s V 0 13.0   m / s , to cover the structural response from elastic rebound to partial or whole wire breakage. This test defined a dimensionless energy parameter λ shown in Equation (2) to explore the relationship between input kinetic energy and structural response.
λ = E k P c D
where, P c = 4 σ u D 3 / ( 3 L ) is the classical static collapse load for a circular section beam fixed at both ends under concentrated load at its mid−span. Therefore, the dimensionless energy parameter can be expressed as λ = 3 G V 0 2 L / ( 8 σ u D 4 ) . As described later, λ ranges from 0 to 50 in present study.
After the impact test, the transverse inelastic displacement w f was measured at the indentation point by ruler (with an accuracy of 0.1 mm). Some specimens retain residual axial stress after the impact, removing the specimen in this case would result in release of axial force and increase of the deformation. Therefore, the w f reported in this experiment is one measured for the specimen before unclamping at two ends and removal from the rig.

3. Results

3.1. Response Process

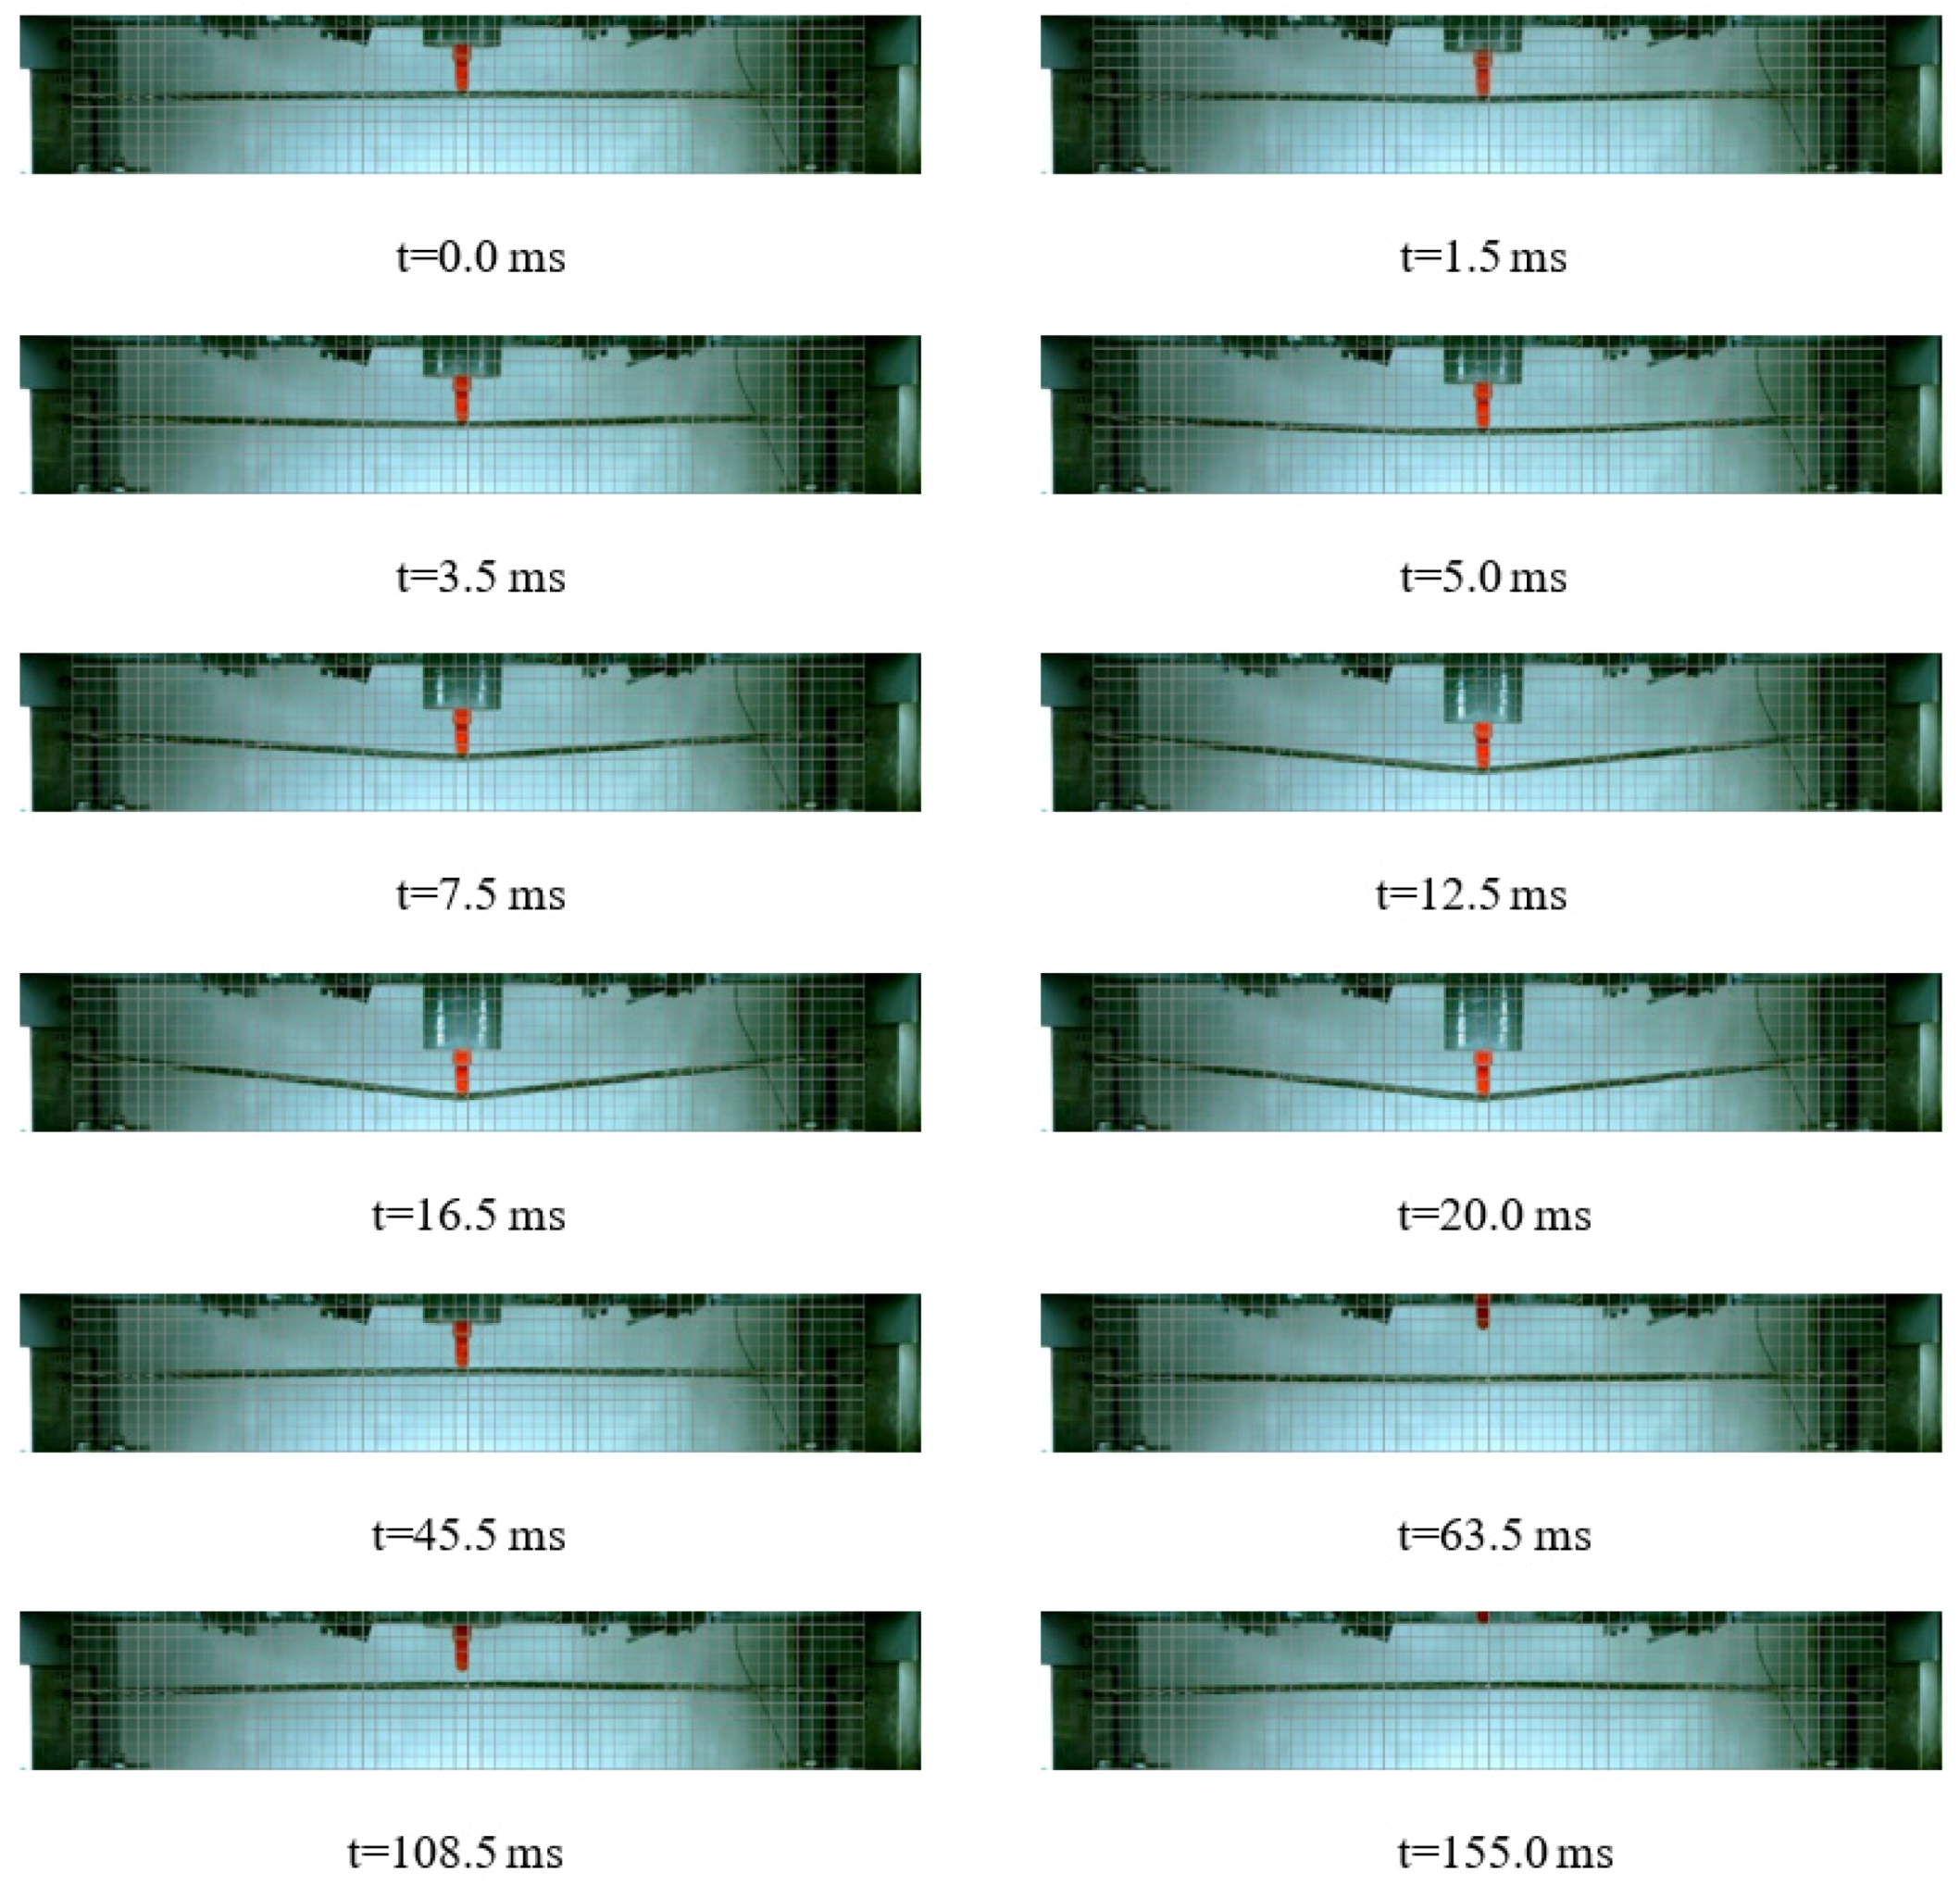
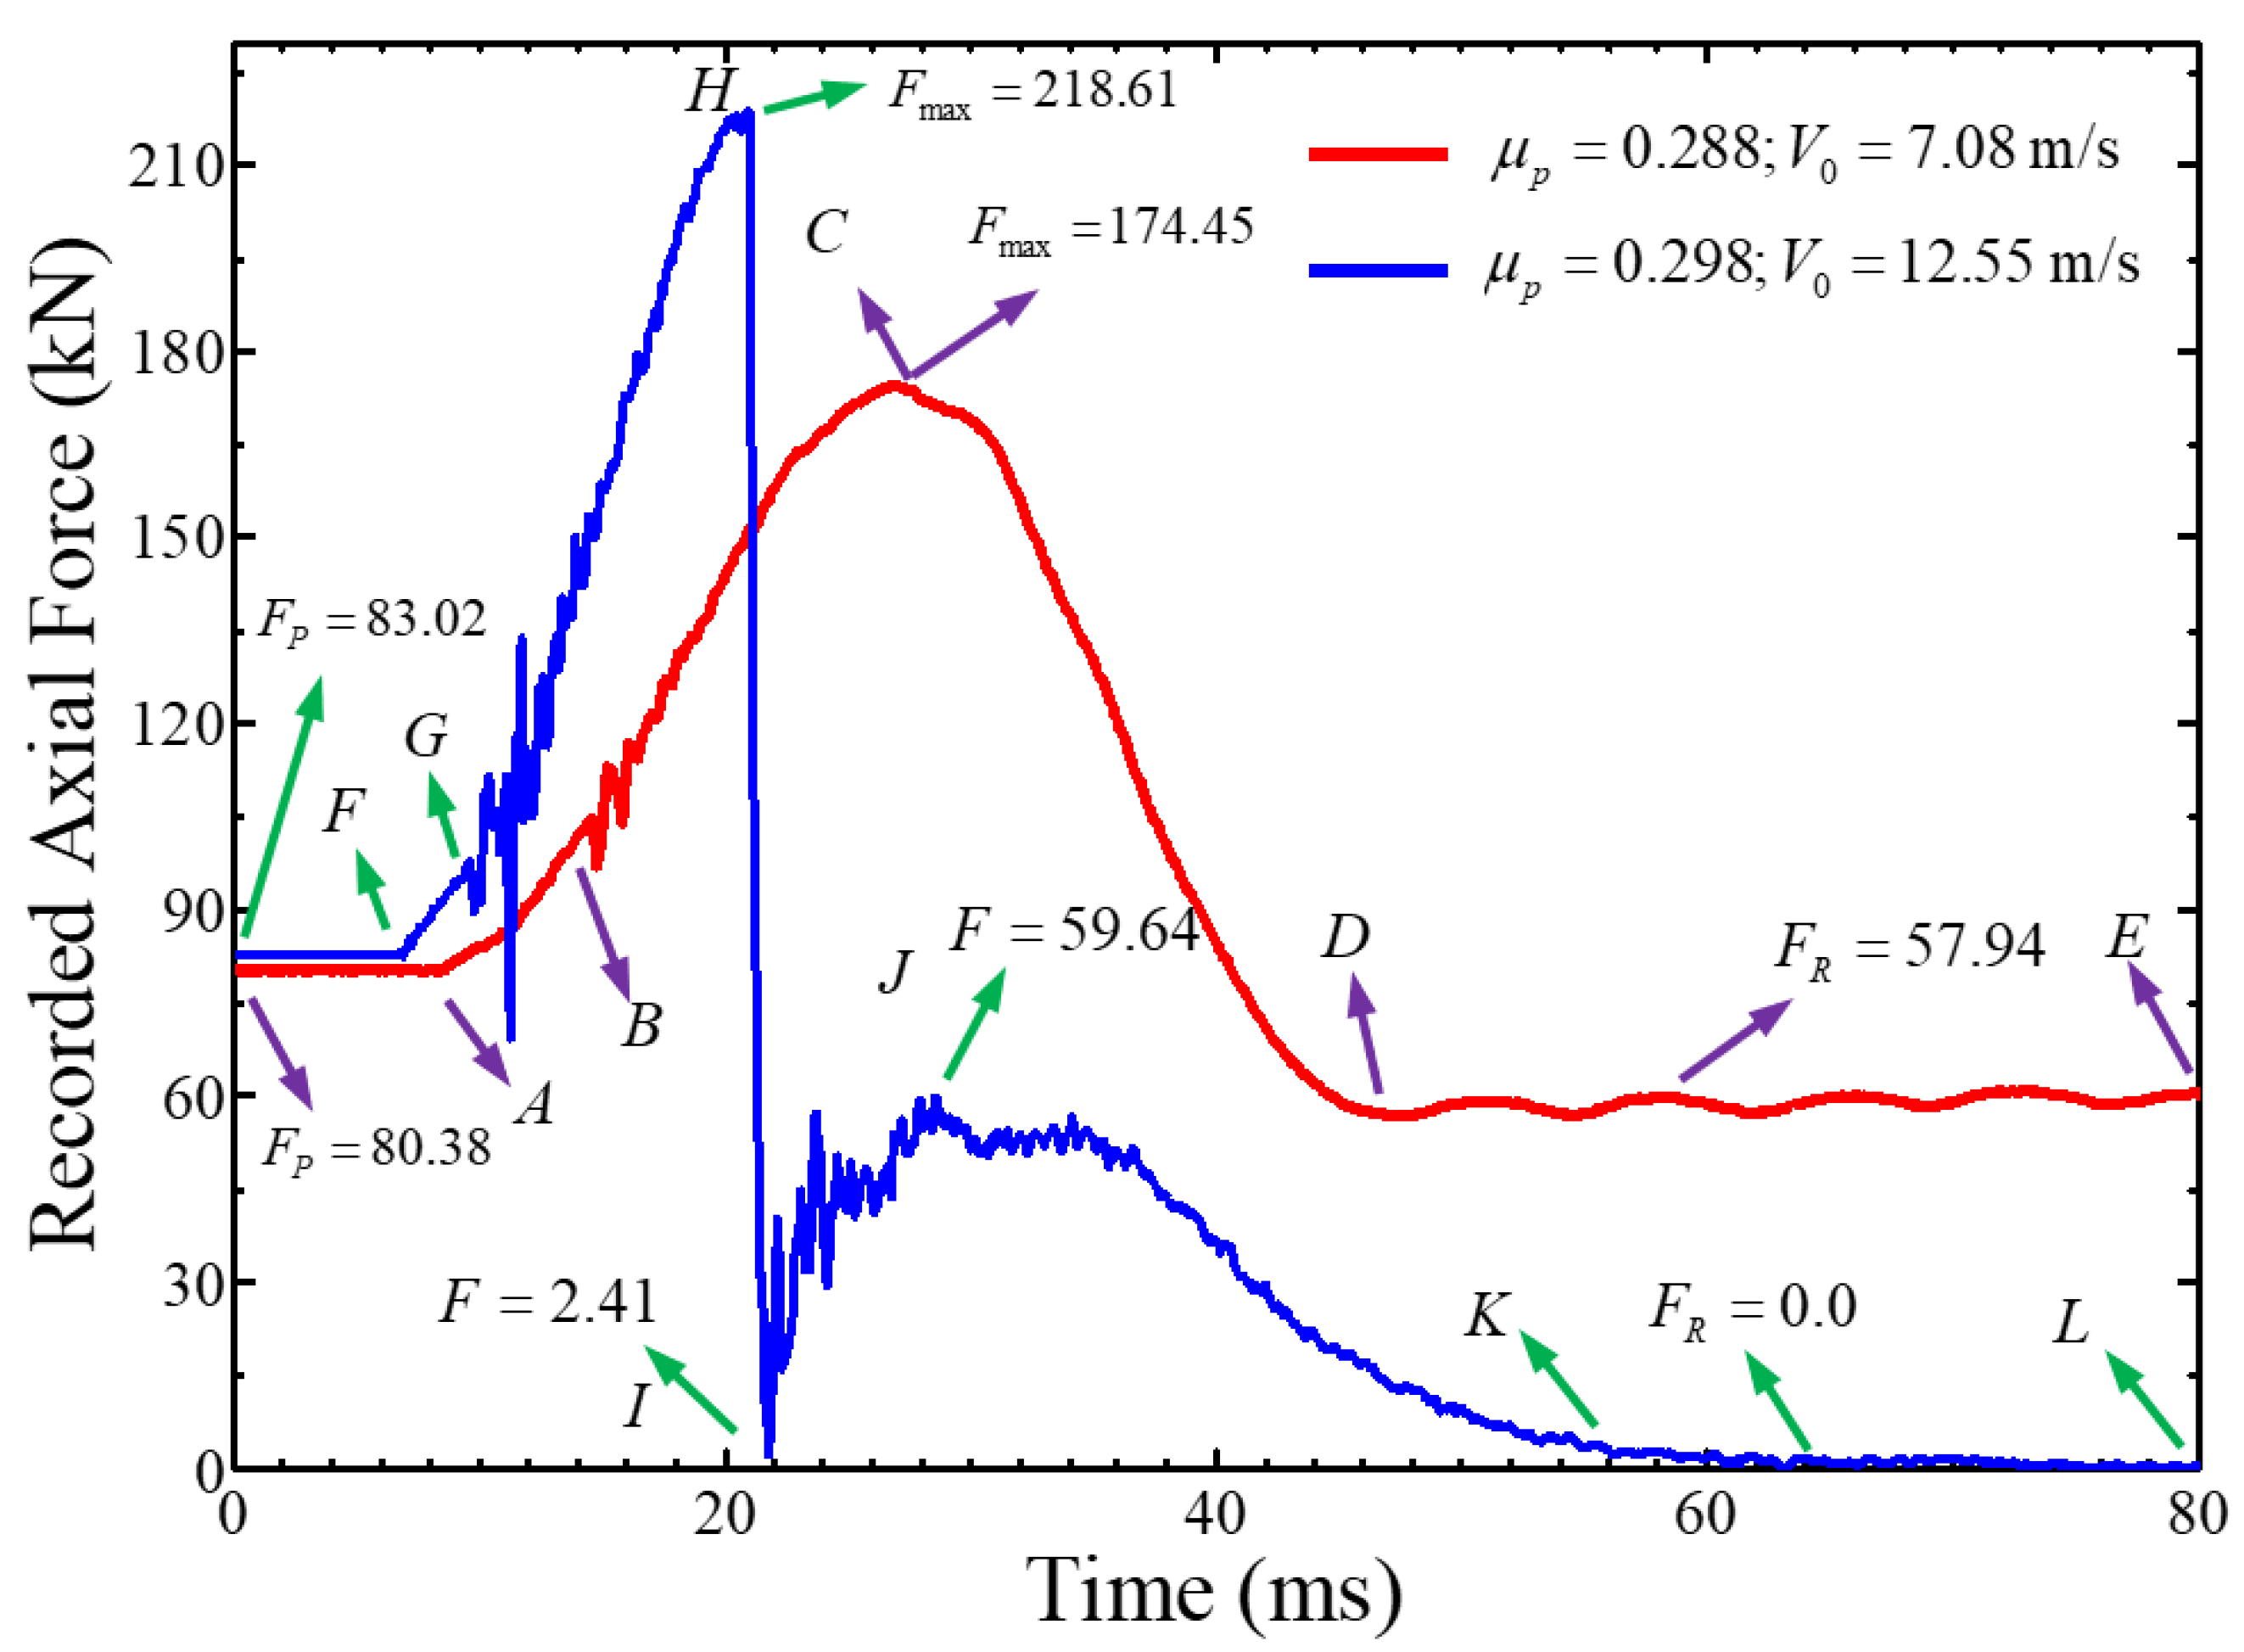
The trial tests indicated that both the input kinematic energy and the level of initial stress exerted previously on the cable specimen play crucial roles on the transient response of cables. In order to understand its response process, Figure 6 presents a series of deformed shapes of cables recorded by high−speed video, where the pre−stress level and velocity of the projectile are F P = 80.32   kN ( μ p = 0.288 ) and V 0 = 7.08   m / s , respectively. Meanwhile, the axial force of the specimen and the deflection on the mid−span recorded during the transient response are depicted in Figure 7 and Figure 8. These graphs suggest the following sequence of events.
Stage 1:
Local disturbance and flexural wave. The sudden impact of the indenter causes a shear loading at the mid−span of the cable which generates a flexural wave. The position of this wave moves along the cable as time progresses and is clearly observed in early times presented in Figure 6. For instance, at t = 1.5 ms, bending deformation was found concentrated around the impact point while no deformation was observed elsewhere. At t = 5.0 ms, however, the flexural fluctuation reaches the root of the cable and then reflects and interacts with the subsequent waves. This behavior is similar to the initial response modes observed by Reid [36], Yu [37] and Xi [38] when investigating the elastic−plastic behavior of beams.
Correspondingly, the configuration of specimen evolves from local disturbance concentrated in mid−span to a triangle−shaped one with the impact point as its apex. Meanwhile, the axial tensile force is produced along the test piece (see Figure 7) and then gradually increase with the increase of the lateral displacement. At t = 5.0 ms, the value of axial force reaches F = 98.22 kN, which is a transition point during the evolution of the axial force, after this, its growth rate (segment BC in Figure 7) is significantly higher than the previous one.
Stage 2:
Axial stretching. The triangle−shaped configuration is continually expanding until at instant t = 20.0 ms when the velocity of the indenter drops to zero and the strand cable reaches the maximum lateral displacement ( w = 88.3   mm ). As shown in Figure 7, the axial force of the test piece increases (segment BC) with rapid rate but significant oscillation and finally reached a maximum value of F = 174.5 kN ( μ p = 0.63 ). The oscillation may be caused by a slight slip between the test piece and the anchor or by interactions between the indenter and the test piece which produce denting or splay of wires limited to the impact zone. Detailed failure patterns are presented in the following sections.
Stage 3:
Rebound and elastic vibration. Starting from t = 20.0 ms, the specimen and the drop hammer generate a reverse motion from the maximum lateral displacement until the instant t = 45.5 ms, from which they are completely separated from each other. As shown in Figure 7, the elastic rebound causes the axial force of the test piece to slowly unload to 57.97 kN ( μ R = 0.21 ). Compared to the initial pre−tensioned force, it can be found that about 27.90% of the axial force is lost during the impact process. On the other hand, after separation from the test specimen, the indenter moves opposite to the impact direction at a speed v = 5 m/s, whose kinetic energy is about 49.87% of the input kinetic energy, which indicates that only a small portion of the energy is dissipated by the inelastic deformation of the strand during the collision of the drop hammer, contrarily, most of it is accumulated as the elastic strain energy of the specimen during the deformation process, and then is retransmitted to the specimen during the rebound process. The key reason for this phenomenon should be attributed to the high strength of the steel strand wires, which makes it difficult for the impact loading to exceed its elastic regime.
Under this working condition, in spite of significant local denting found in the impact region, the overall deformation of the structure is almost negligible. This behavior may result in a small plastic displacement of the structure, but it has great limitations in terms of energy dissipation.
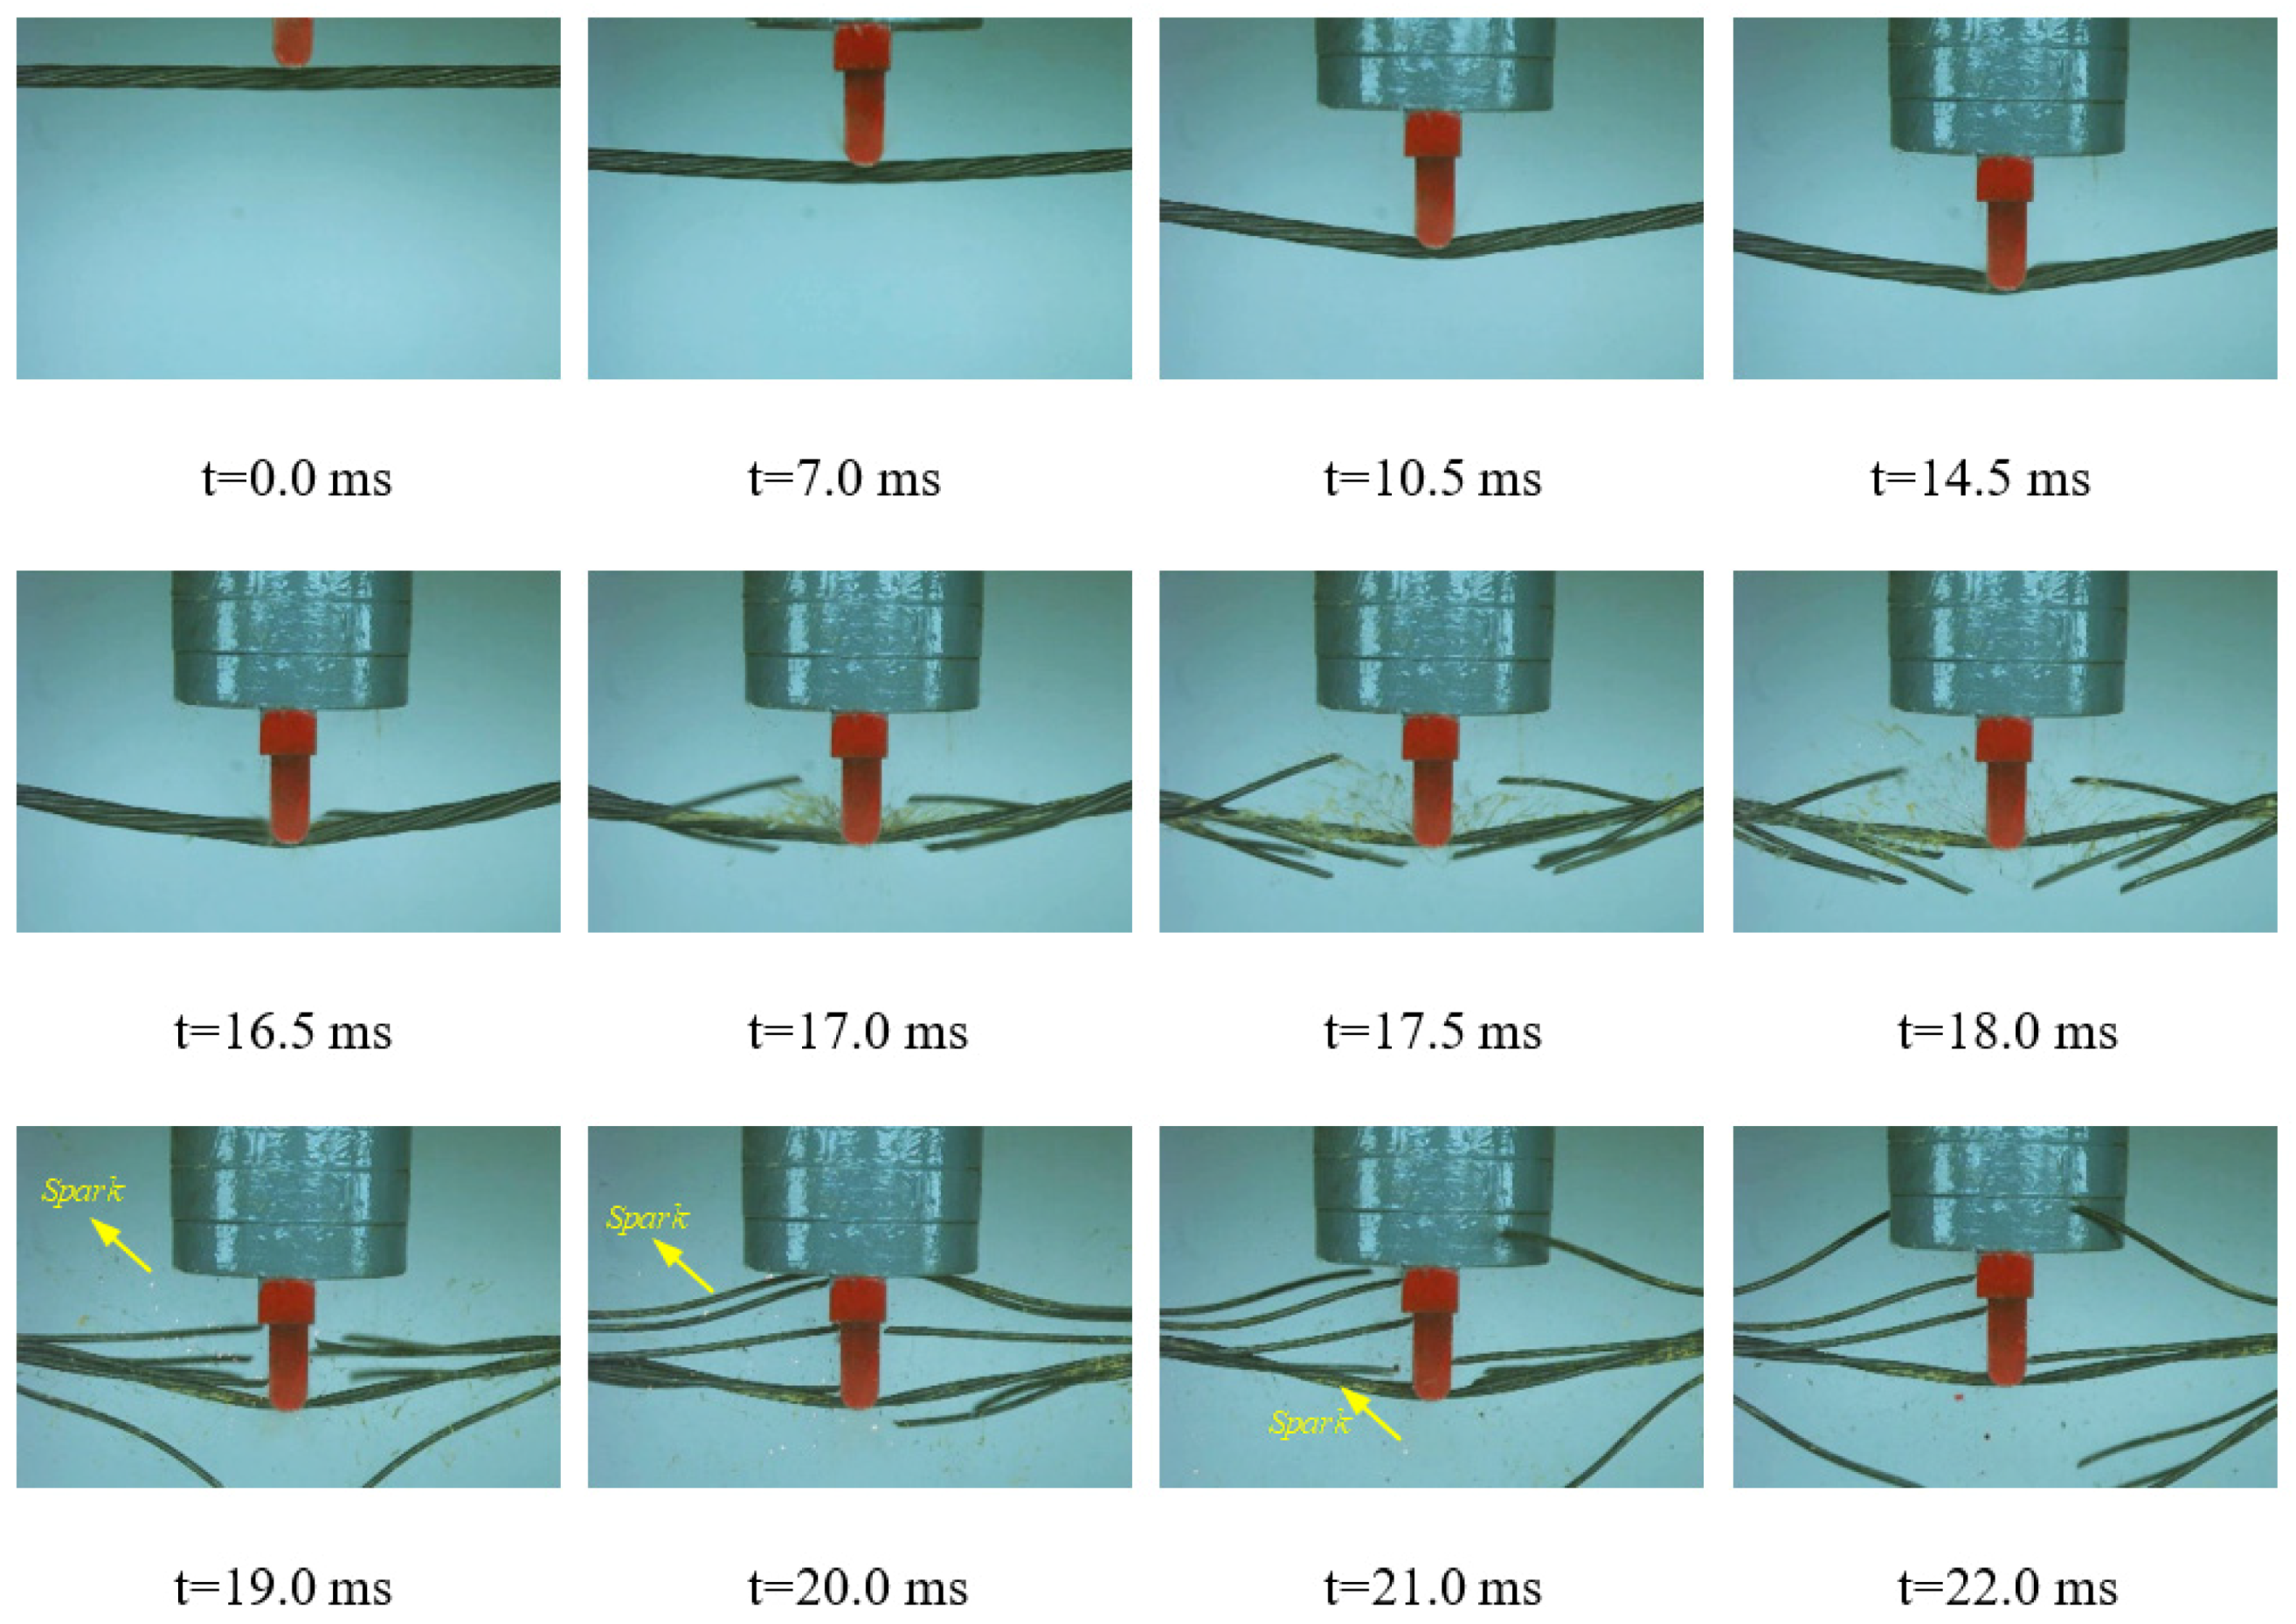
Similarly, Figure 9 shows the deformation of the pre−stressed cable at various instants under combination of F P = 83 . 38   kN ( μ p = 0.298 ) and V 0 = 12.55   m / s . To observe the detailed response feature in the impact zone, a series of local configurations are presented in Figure 10. Meanwhile, the time history of axial force and deflection are also presented in Figure 7 and Figure 8. According to the characteristics of deformation and axial force variation, the response process can still be divided into three stages similar to the above loading case, except that partial wires in the impact area of the test piece fail. The main features can be summarized as following:
Stage 1:
After the end of the local disturbance and flexural wave propagation (t = 0–2.5 ms), the specimen gradually evolve into an expanding triangle−shaped configuration with the impact area as the apex. At t = 14.5 ms, three wires on the upper surface of the cable and right underneath the indenter in the impact zone fractured brittlely without warning. This sudden break accelerates the wires contracting toward the clamp end along the longitudinal axis of the test piece. Meanwhile, the broken wires interact with the others and form a “birdcage” knot beside the support (t = 18.5 ms) due to the winding structure of the wires and the rigid restraint of the clamped end. Furthermore, on the instant that the wire breaks, there is a clearly visible “spark” generated together with a crisp and harsh sound.
The evolution of the axial force depicted in Figure 7 shows that from the start of the impact to t = 14.5 ms, the magnitude of axial force of the test piece increased from F P = 83 . 02   kN ( μ p = 0.298 ) to F max = 218 . 61   kN ( μ p = 0.784 ) (i.e., FGH segment) as the increase of the transverse displacement until the failure of the wires, at which the axial force was sharply unloaded (HI segment) to F = 2 . 41   kN ( μ p = 0.009 ).
Stage 2:
From t = 14.5 ms, the vertical displacement of the strand continues to increase until t = 24.5 ms, reaching the maximum lateral displacement ( w = 141.4   mm ). Subsequently, both the test specimen and the indenter bounce and detach from each other at t = 57.0 ms. Then the test piece enters the stage of elastic free vibration and the rebounding drop hammer moves upward at a speed of 1.6 m/s, which is about 1.63% of the initial input kinetic energy. Obviously, on this loading case, most of the impact energy is dissipated in the plastic deformation and fracture of the steel strands. On the other hand, the elastic rebound causes a complicated interaction between each wire of the test specimen which eliminates the “birdcage” knot formed at the end at the first stage.
Regarding the evolution of the axial force, the continuously increasing lateral displacement causes the axial force to reload (i.e., IJ segment) and reach the second peak F = 59.64 kN ( μ = 0.214 ) at t = 24.5 ms. In the subsequent elastic rebound (i.e., JK segment) and free vibration (i.e., KL segment) stages, the axial force of the test piece is rapidly reduced to the final residual axial force F R 0 . 0   kN . This indicates that all pre−stress is lost due to impact.
In addition, it was interestingly found from the recorded time history of the mid−span displacement (see Figure 8) that the final stage of the specimen is evidently different under the above two working conditions. This indicates that the occurrence of fracture in an indentation region has the effect of reducing of the axial stress and significantly relieving the amount of elastic recovery energy after the impact, which dramatically reduces the stiffness of the test piece and increases the vibration period of the test piece. As the dynamic response of the structure is usually sensitive to the dynamic characteristics of the structure, this phenomenon hints that the stiffness degradation should be reasonably considered for such impact−induced damage.
For other cases with various combinations of pre−stress level and impact energy, the response processes are similar as the above two cases. Under a sufficient impact of kinetic energy, all wires were broken in the second stage (phase of axial stretching) and then cause the test piece to fail immediately.

3.2. Failure Patterns

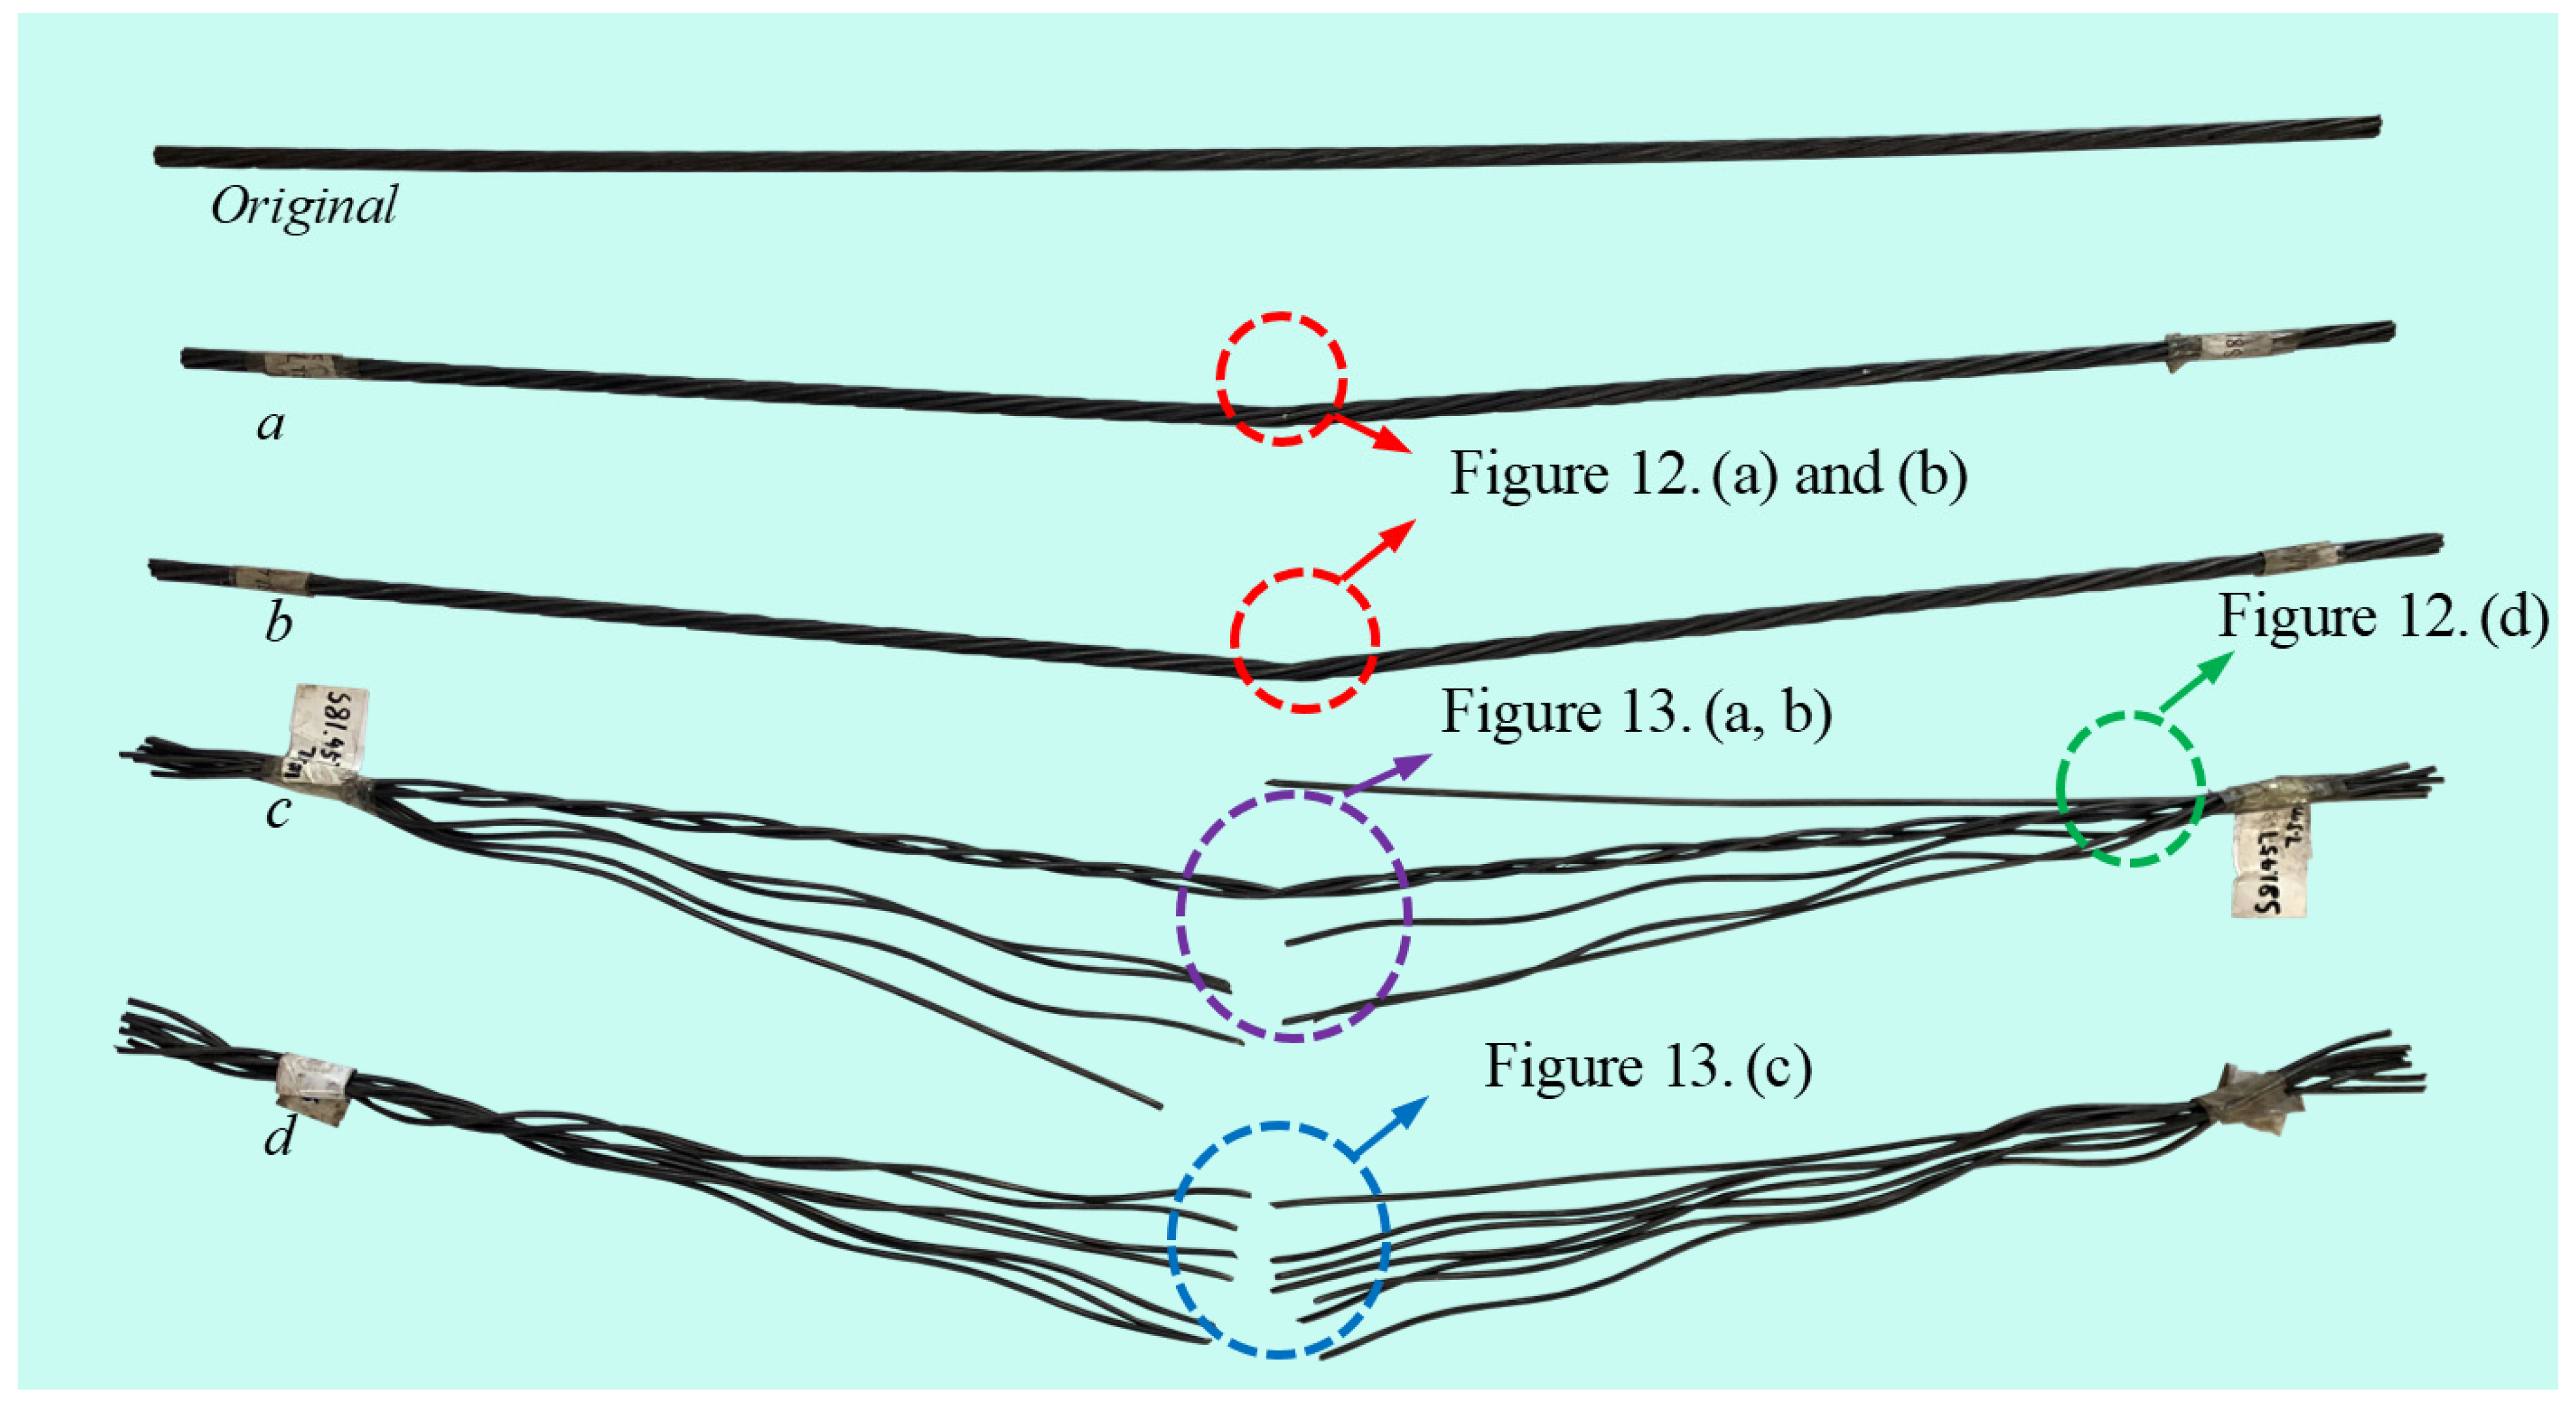
In order to identify the response characteristics of strand cables, Figure 11 shows the final configuration of the test pieces under various combinations of pre−stressing levels and impact energy. Detailed failure patterns are presented in Figure 12 and Figure 13.
A cursory examination of these test specimen confirms the patterns described by Judge et al. [33] that the failure of stand cable is concentrated on the impact zone. Despite this, the main objective in the present work is to explore whether there are any unique features in the present cases which characterize the response mechanism.
At lower impact velocities, the strand cables are dominated by inelastic deformation (see Figure 11a). The upper wire of the impact zone (corresponding to the position immediately underneath the indenter) has an impact−induced indentation (see Figure 12a). The number of such indented wires and their depth usually depends on the relative position of the wires within the impact contact zone and the magnitude of input impact kinetic energy. On the other hand, the section of impact zone exhibited evident lateral deformation (orthogonal to the span direction) induced from the impact extrusion. As discussed in Section 3.1 and illustrated in Figure 7 and Figure 8, the axial force had increased dramatically as the evolution of its transverse displacement, so, this lateral splay is always only concentrated within the impact region and its magnitude is smaller compared to the observation by Judge et al. [33].
With the increase of impact energy, several (see Figure 11b,c) or all wires (see Figure 11d) in the impact zone break. Due to the high strength and brittleness of the material, the rapid retraction of the broken steel wires destroys the integrity of the cable and makes it into a loose state as shown in Figure 12c,d.
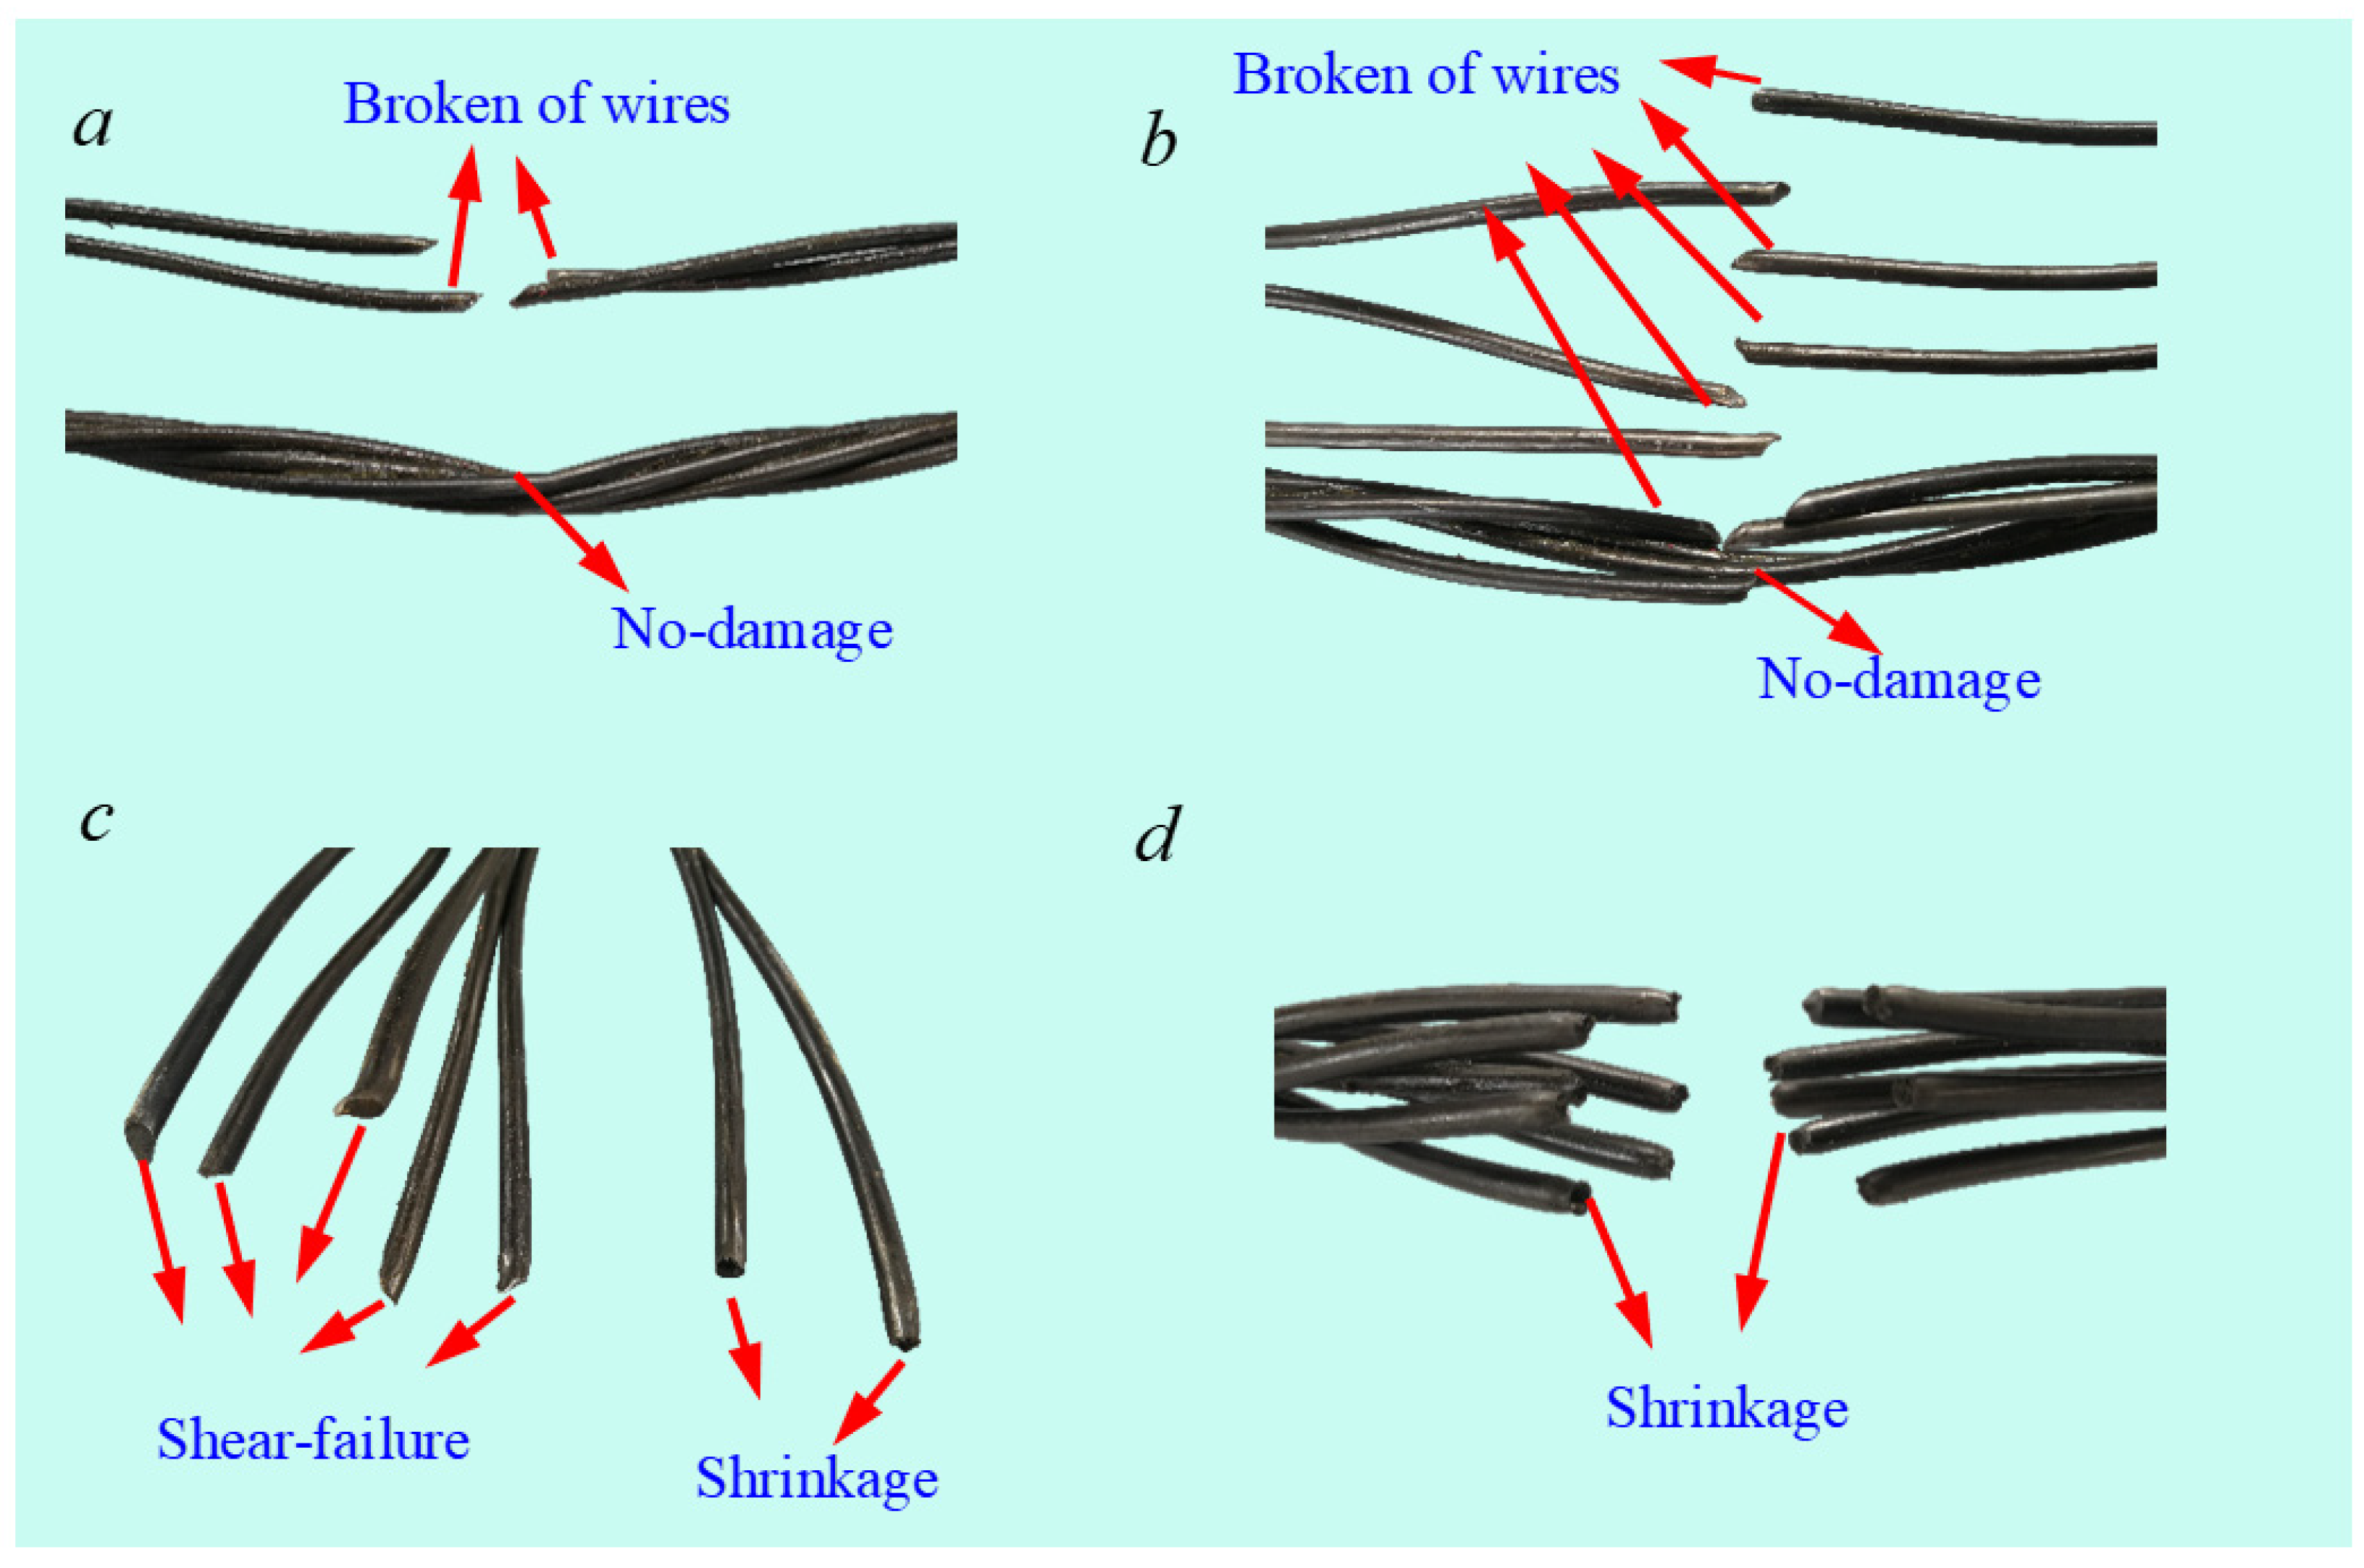
Generally, there are two groups of wire breakage in the impact zone caused by higher impact energy. Firstly, some of wires break in an oblique fracture mode (see Figure 13a,b) and the remaining are kept intact. During the impact process, the steel wires underneath the indenter should be dominated by three stress states: compression by the extrusion and mutual interaction of wires, axial tension by axial stretching and lateral shear by suddenly impact. The observation of the oblique crack should be manifested by the above−mentioned force causing the wires to be in a multi−axial stress state.
The second group of damage is characterized by full fracture of the steel wires. It can also be categorized into the following two failure modes. The first one is frequently linked to the test specimen with a lower initial stress, in this case, all wires are almost obliquely fractured simultaneously, which is similar to the above discussions. The second failure mode corresponds to the strand cables with a higher pre−stress level. In this case, the fracture mode usually corresponds to shear fracture of a plurality of steel wires, and the others, however, exhibit a transverse fracture mode (Figure 13c), which is consistent with the fracture observed under the uniaxial tension of the steel strand (Figure 13d). Reviewing the high−speed photos and time histories of the axial force, it can be inferred that this mode should be a combination of failure modes dominated by the shear and uniaxial tensile failure of wires on the upper and lower side of cables. The transverse impact and high axial force are responsible for the previous and later failure, respectively.
To facilitate the comparison of results, Figure 14 shows the results of high−speed impact experiments conducted by Judge et al. [33] on strand cables. It can be found that failures are concentrated in the impact region in Judge’s experiment, which is consistent with the observations herein. However, in his test, the section located outside of the impact zone remains almost unchanged, which is significantly different from the present observations. Furthermore, the wire failure presented in Figure 14a,b is dominated by the flatten to break mechanism, which is quite different from the observation in the present test, which is characterized by the shear or shear−tension combined modes.
The diversity of global and local patterns indicates the difference in the mechanism between Judge’s work and the present test. Explaining these differences should have a big significance. In Judge’s test [33], the test piece was allowed to move freely along the span axis. In contrast, the present test not only limited the axial displacement of the test piece, but also applied pre−tension before the impact. The axially free boundary conditions allowed the cables to produce only an axial tensile force with negligible amplitude and therefore made the strand wires in the impact region in a stress state dominated by local compression and shear loading. The fixed boundary and pre−tension, however, makes the wires in the impact zone bear a multiple stress state. Immediately after impact, the uniform stress state dominated by axial stress of the cable is modified. Firstly, the indenter produces a shear loading within a highly localized region. Secondly, overall bending will produce superimposed axial stress, which, in the impact zone, is the compression on the upper side and the tension on the lower surface. Thirdly, the contact between the wires generates a complicated interaction. Therefore, a multiple stress state is achieved, and under the pre−tension and impact energy, will fracture at the middle span. Among them, the tensile stress caused by the pre−added axial tension and the increasing lateral displacement would probably account for a large proportion. The occurrence of indentation fracture restores the longitudinal stress. At the same time, the amount of elastic recovery after impact is significantly reduced. Obviously, the triaxiality controls the amount of plastic energy absorbed during the impact. On the other hand, in Judge’s test [33], the broken wires cannot shrink rapidly and interact with the surrounding steel wire due to the lack of axial tension force, which is a good explanation for the deformation and failure of their test specimens concentrated in the impact region.
Apart from the damage in the impact area, the anchoring area of the specimen will also exhibit different characteristics with the increase of the impact speed. Figure 12e,f compares the deformation diagrams of the anchoring end under initial pretension F = 28 kN with impact velocity of V0 = 3.0 m/s and V0 = 12.5 m/s. The anchorage shown in Figure 12e is consistent with the state before impact. However, the clips of the anchorage shown in Figure 12f are almost completely contracted into the rigid ring, and the steel wire in the middle of the test piece is pulled out by the sudden increase of the tension. In this experiment, due to the restraining effect of the rigid anchor, except the central wire being pulled out, the relative positions of the other six wires did not change, which was obviously different from the loose end state observed in the Judge experiment, which was shown in Figure 14c.

4. Discussion

4.1. Response Modes

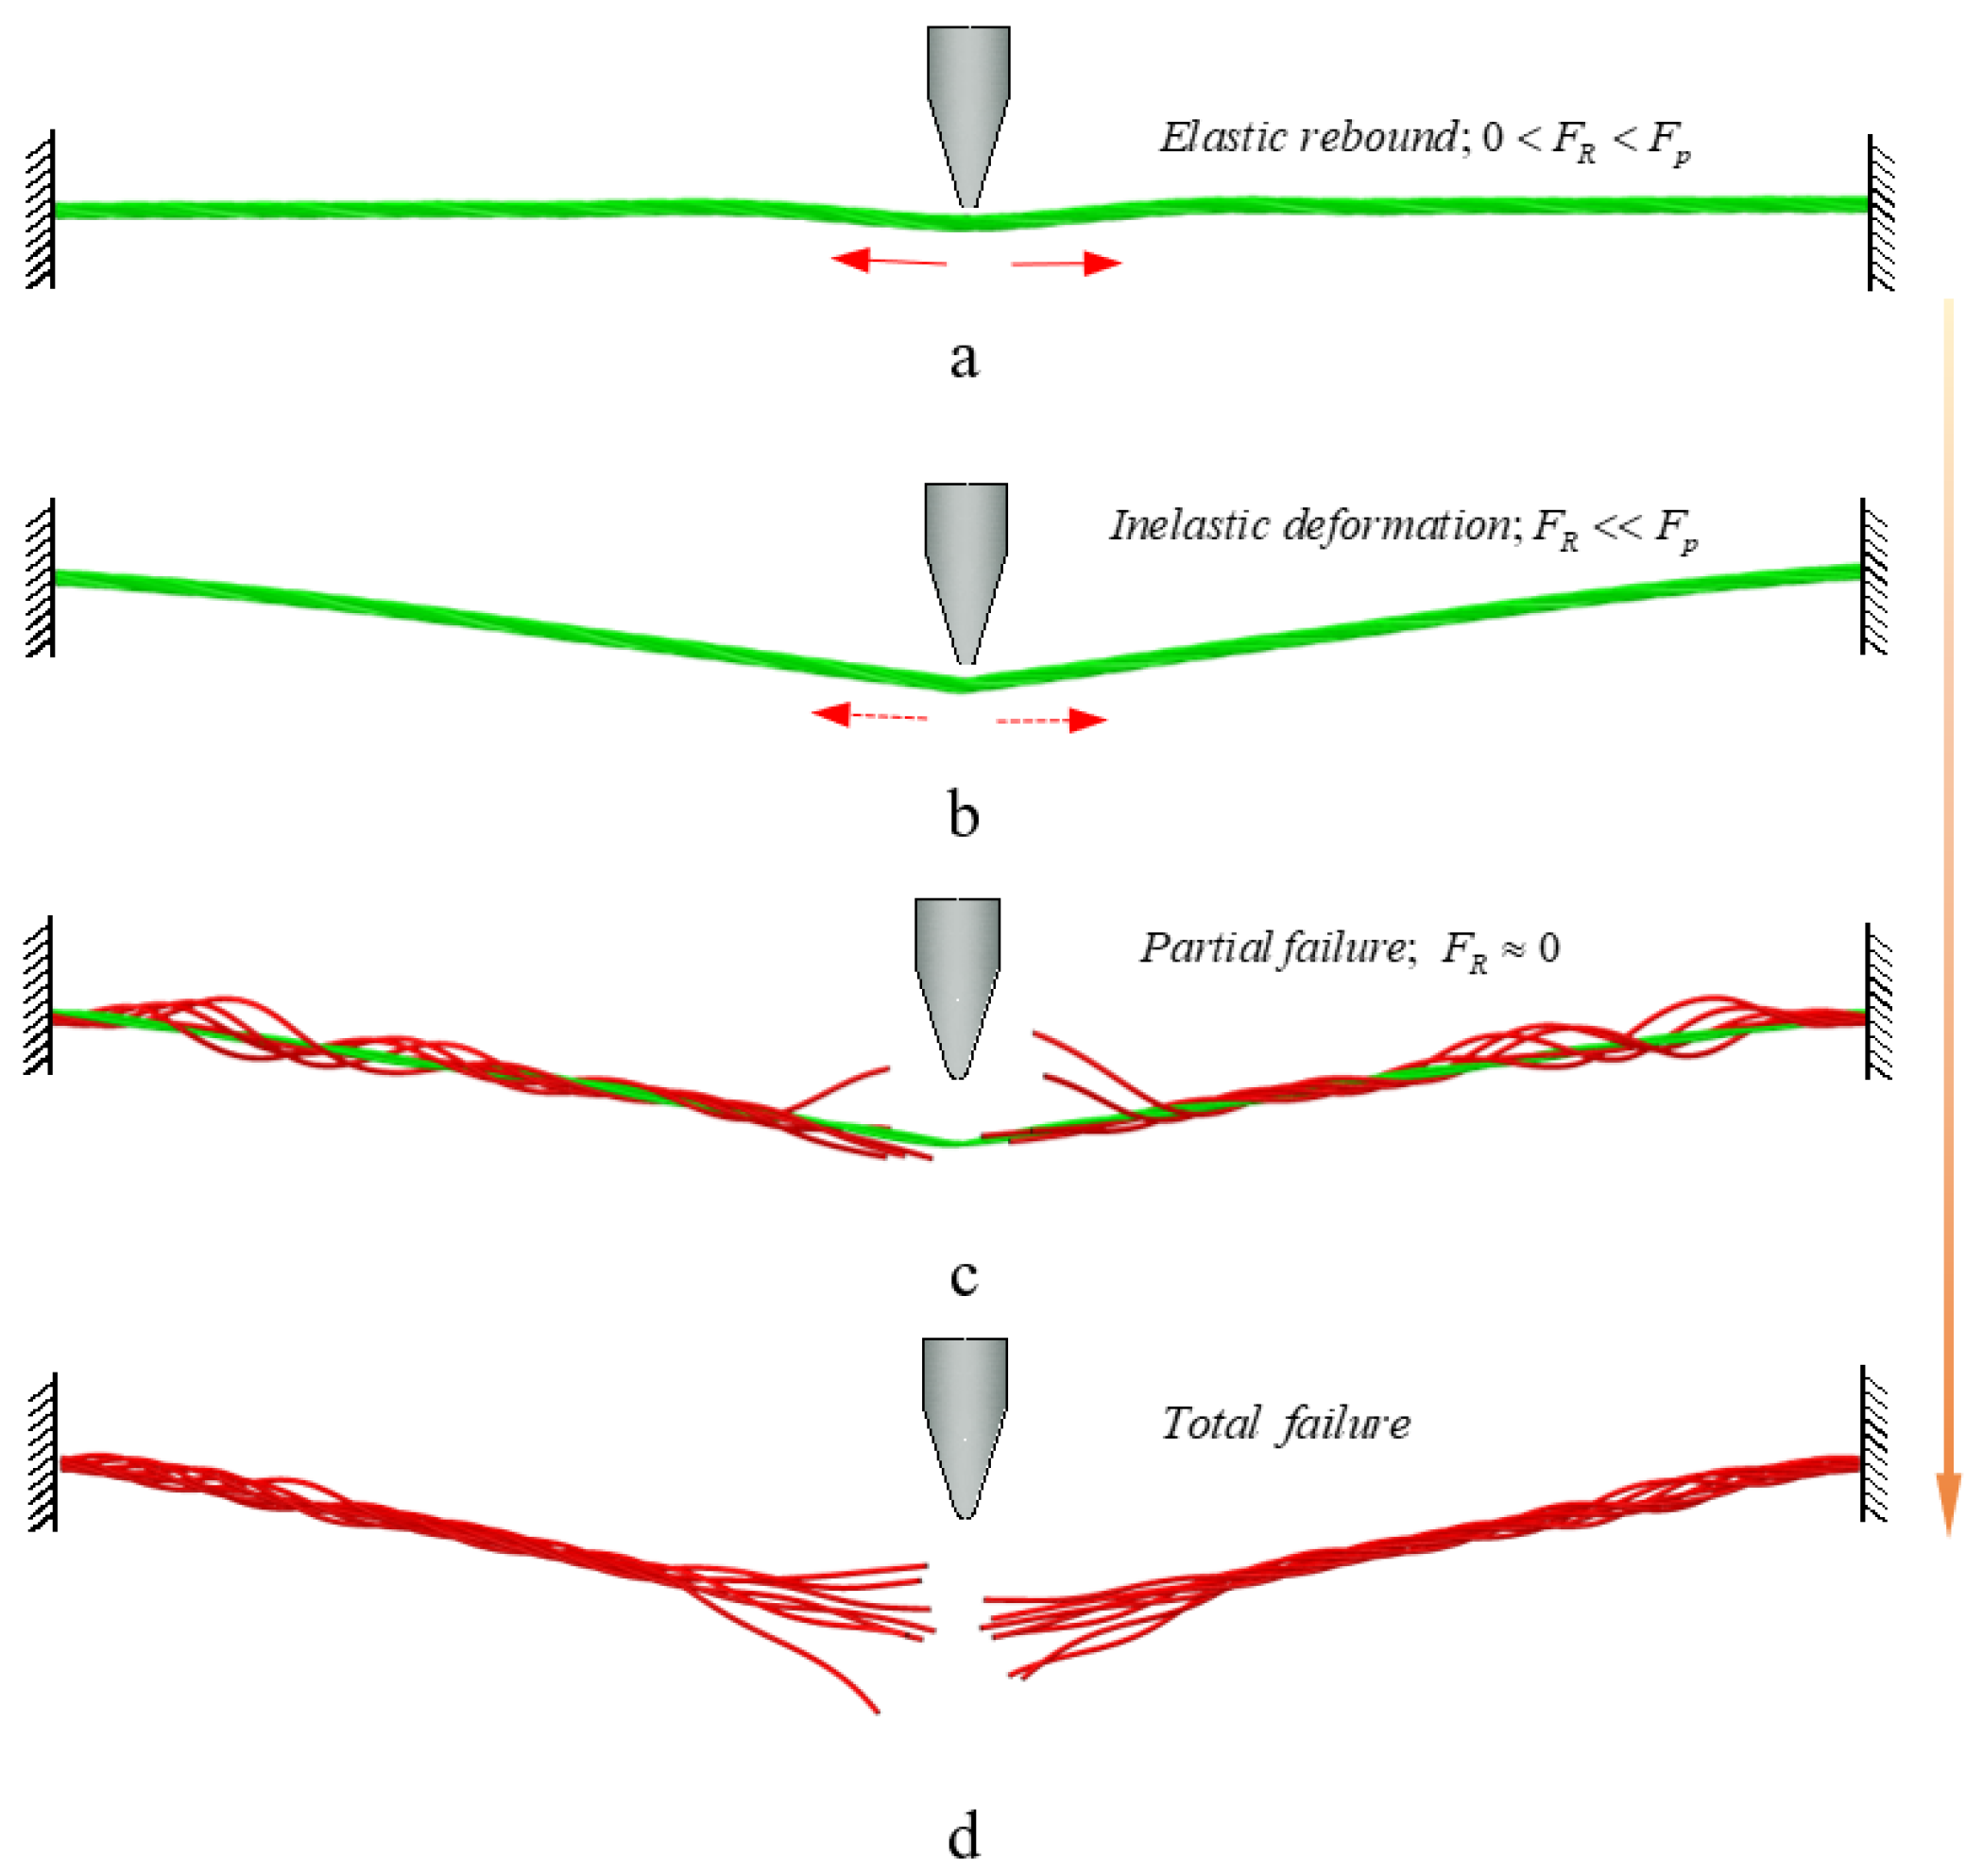
The magnitude of the input kinetic energy affects the plastic displacement of the strand, the degree of pre−stress loss and the fracture of the steel wire. The experimental results give two threshold energies for the three response modes illustrated in Figure 15. A lower input energy is related to the elastic rebound of cables with slight initial stress loss (see Figure 15a). They produce a strong rebound after experiencing a vertical deformation with a small amplitude and produce a plastic deformation with a small amplitude concentrated in the impact region. When the input impact energy is large enough (see Figure 15c,d), the response mode corresponds to Figure 11c,d, in which, after the steel strand undergoes significant plastic tensile deformation, some or all of the steel wire breaks in the impact area, the pre−stress is almost completely lost and the steel strand loses its bearing capacity. When the impact energy is between the above two bounds, the steel strand undergoes elastic rebound after undergoing significant vertical deformation with partial pre−stress loss due to plastic deformation (see Figure 15b).

4.2. Plastic Displacement and Residual Stress

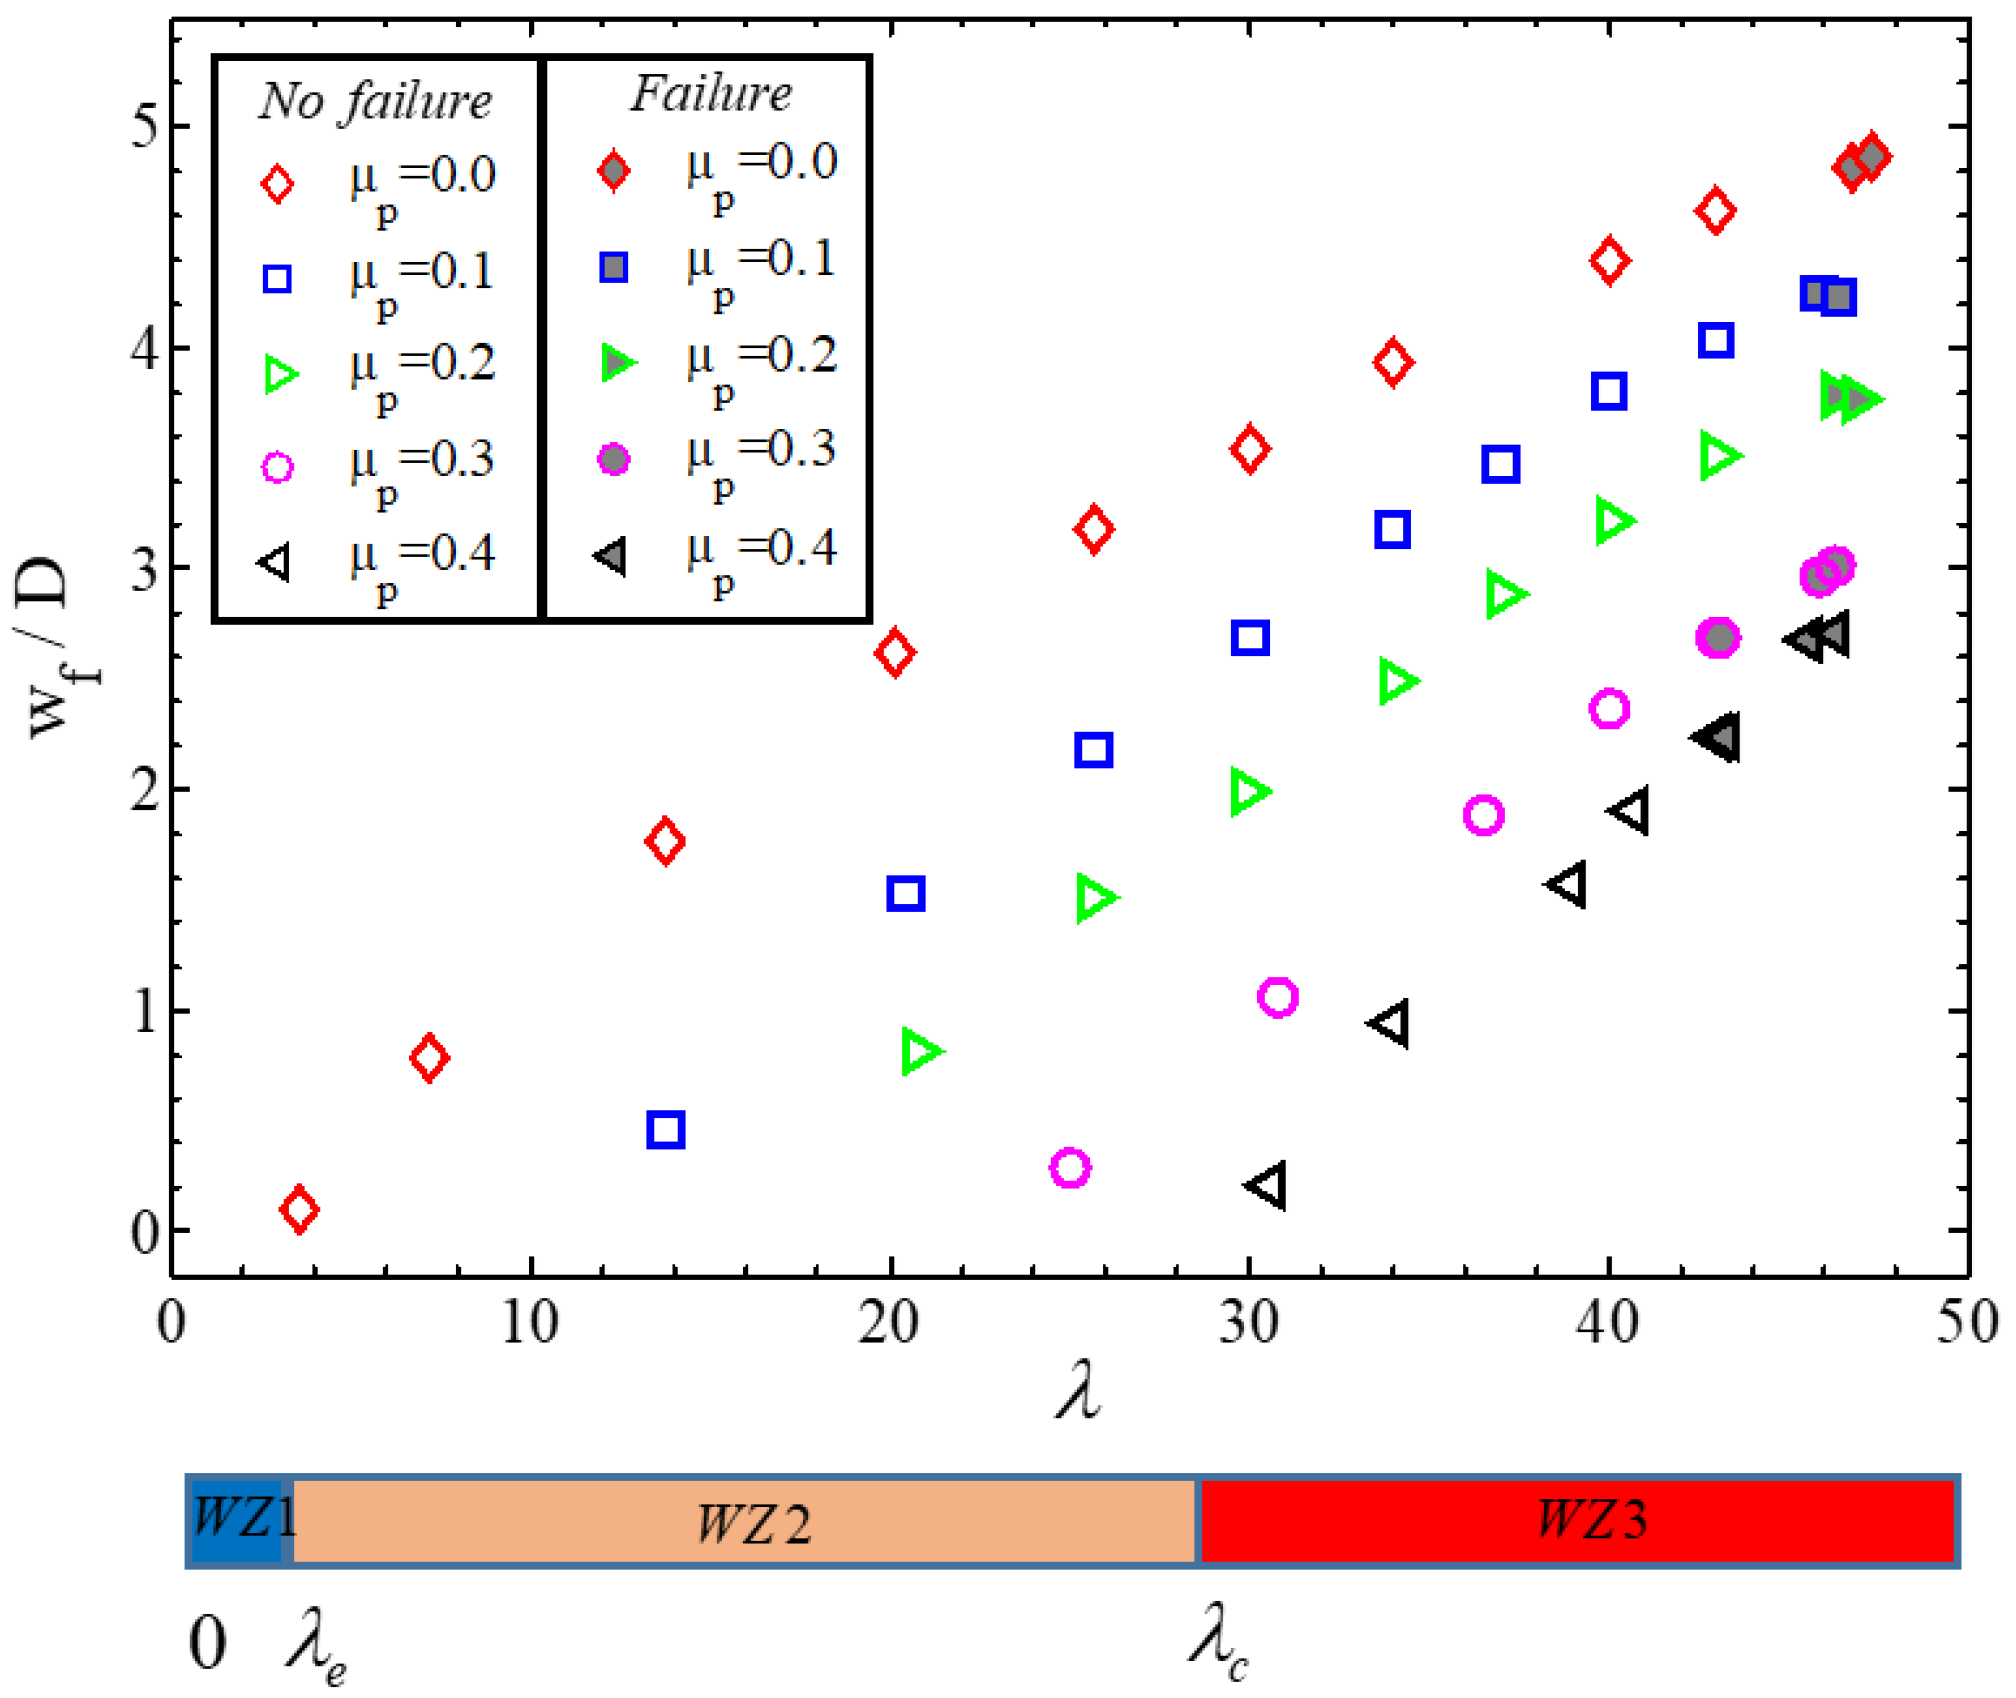
As summarized in Figure 16, the plastic deformation of steel strands is closely related to their initial pre−stress level and input impact energy. Consistent with the previous description of the response mode, steel strands with various initial pre−stress level may fall into three different response regions with increasing impact input energy: elastic deformation (WZ1), plastic deformation (WZ2) and fracture failure (WZ3), which correspond to increasing residual plastic deformation. The observation reveals that input energy threshold for plastic deformation increases significantly as the pre−stress level increases, however, the energy threshold corresponding to wire fracture failure does not change evidently. Furthermore, under the same impact energy, the plastic deformation of the steel strand decreases significantly with the increase of the initial pre−stress level.
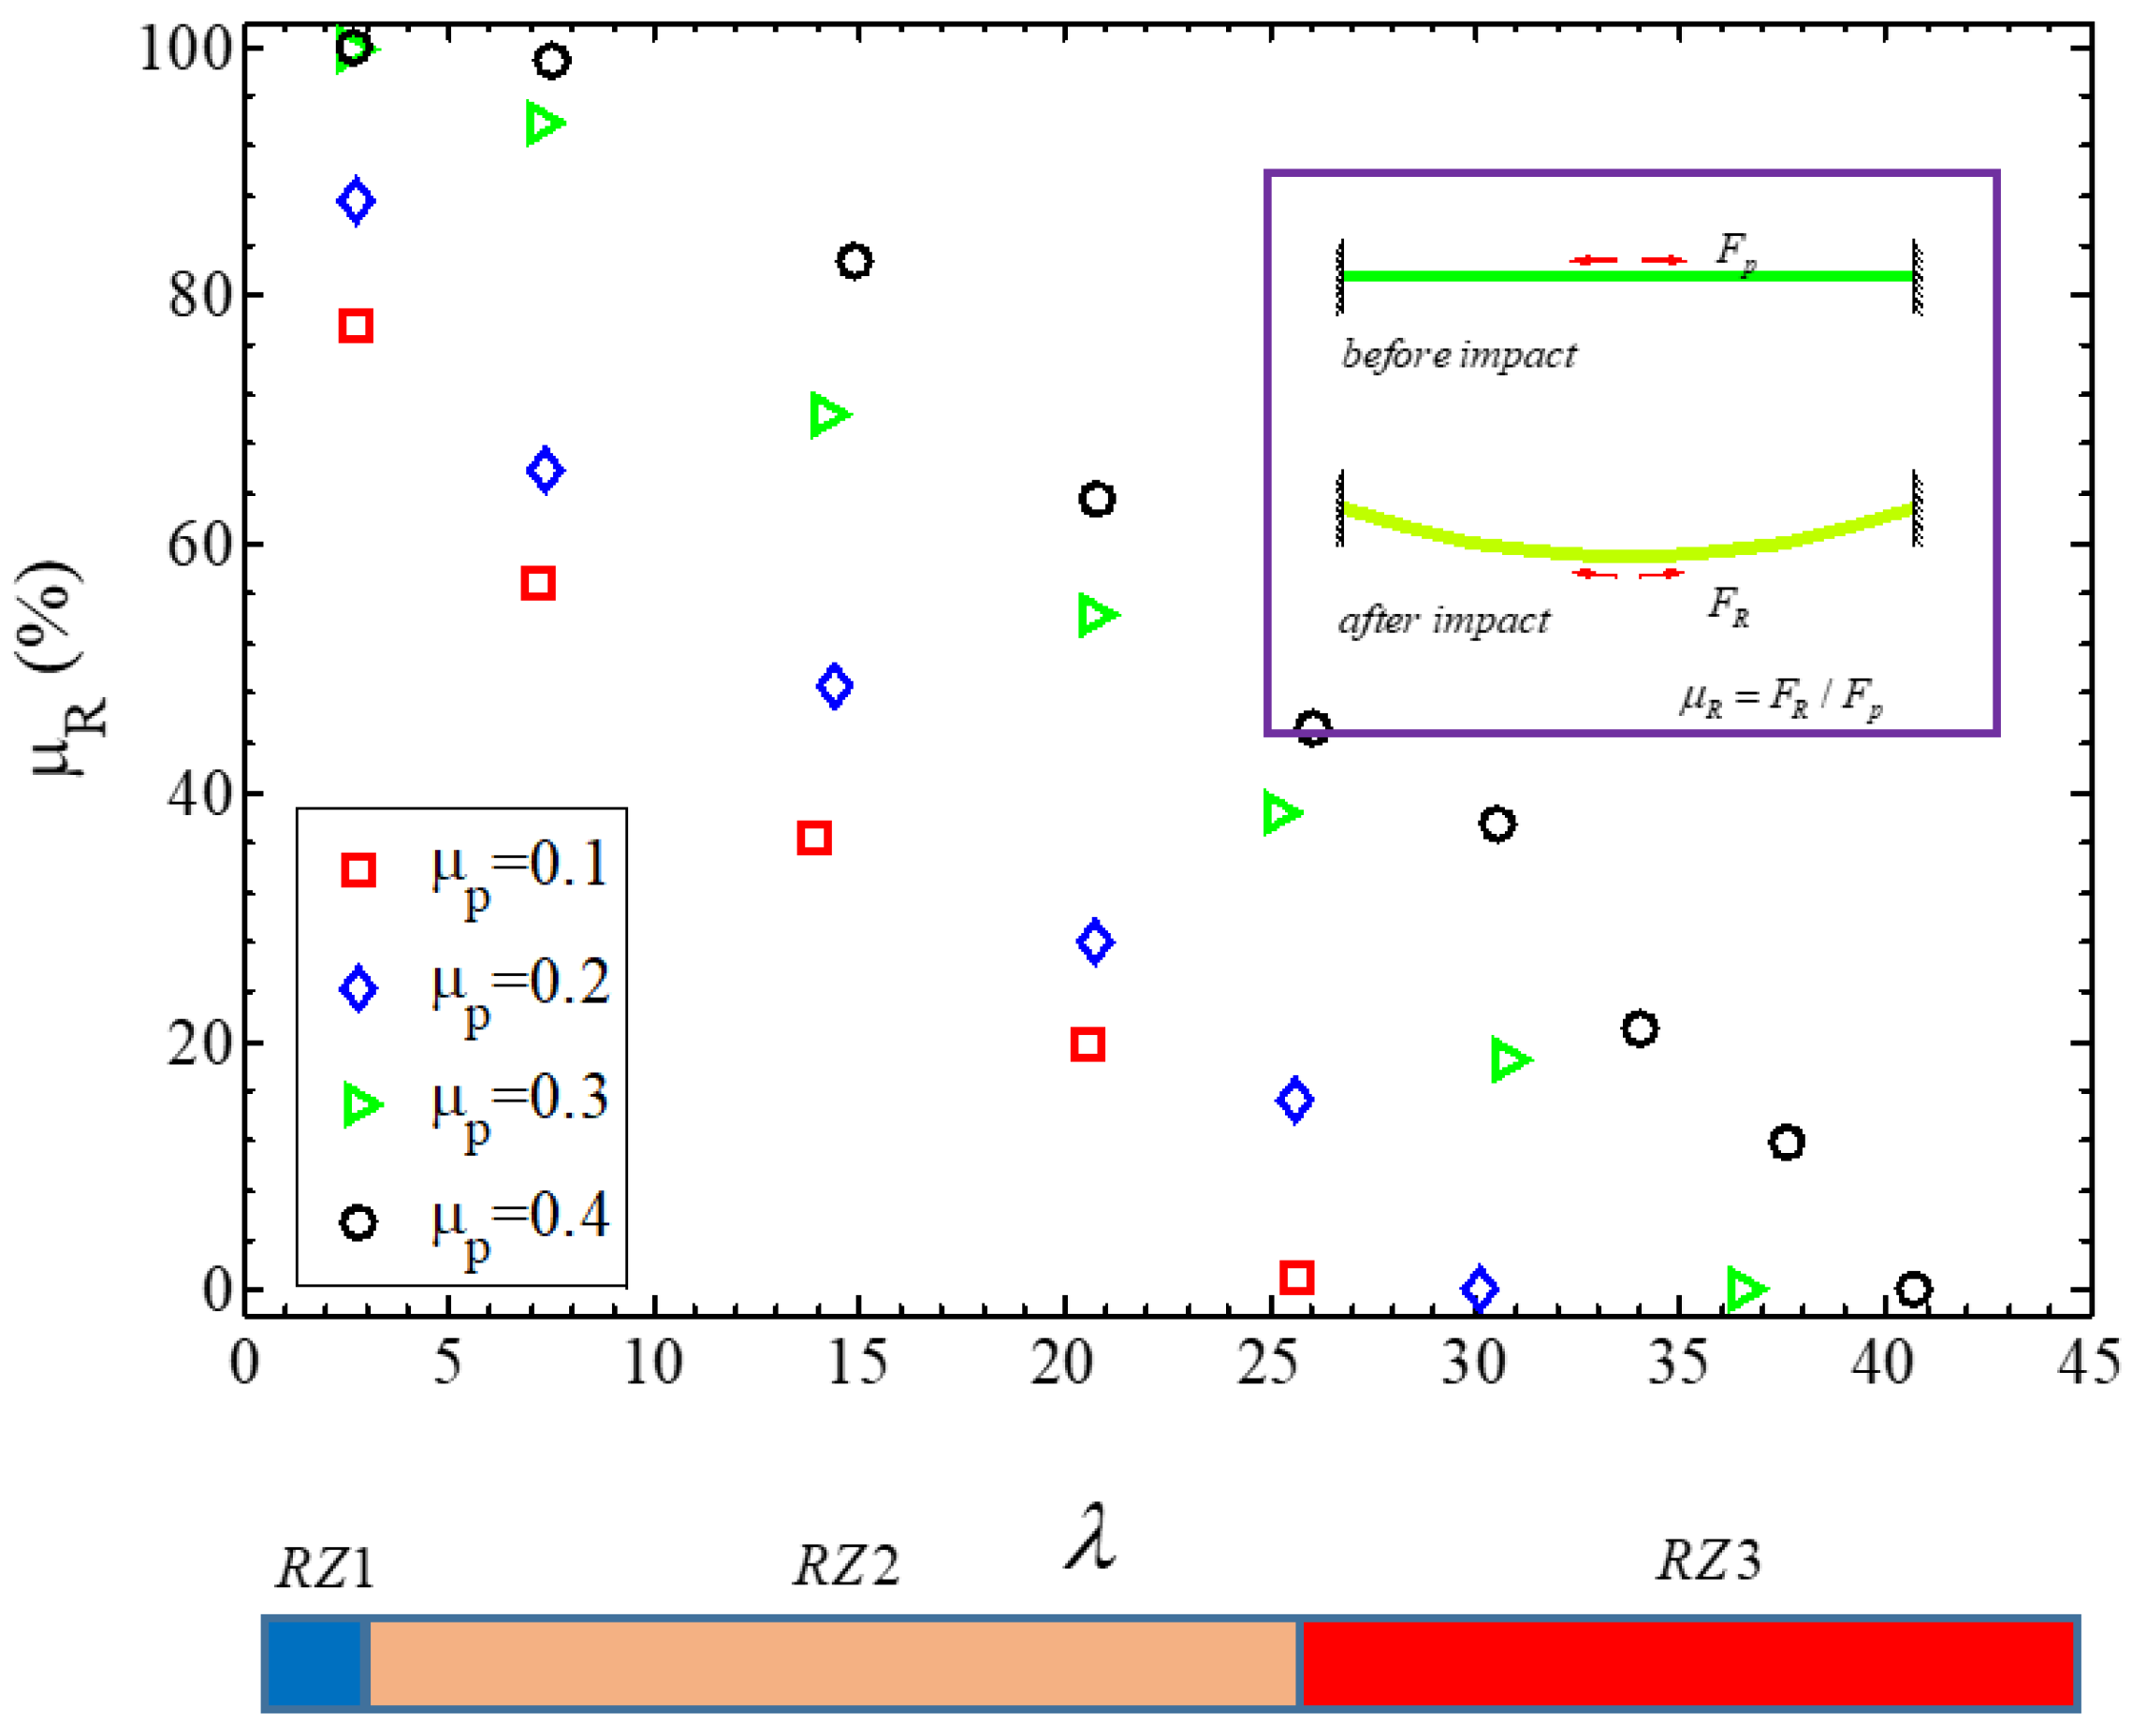
Similar to the above analysis, Figure 17 summarizes the relationship of the residual pre−stress, the initial pre−stretched level and the input impact energy. It can be found that with the increase of the input energy, three areas, namely no loss (RZ1), partial loss (RZ2) and total loss (RZ3) can be categorized according to the residual pre−stress level. Within the input range of engineering kinetic energy of impact, the second level, that is, the area of partial pre−stress loss is the largest, which is the main response state of this type of structure. In addition, with the increase of the initial pre−stress level, the critical impact kinetic energy for initiation and completion of the pre−stress loss is significantly increased. Additionally, with the same impact kinetic energy input, steel strands with higher initial pre−stress levels are more difficult to lose pre−stress due to impact.

4.3. Critical Energy and Displacement

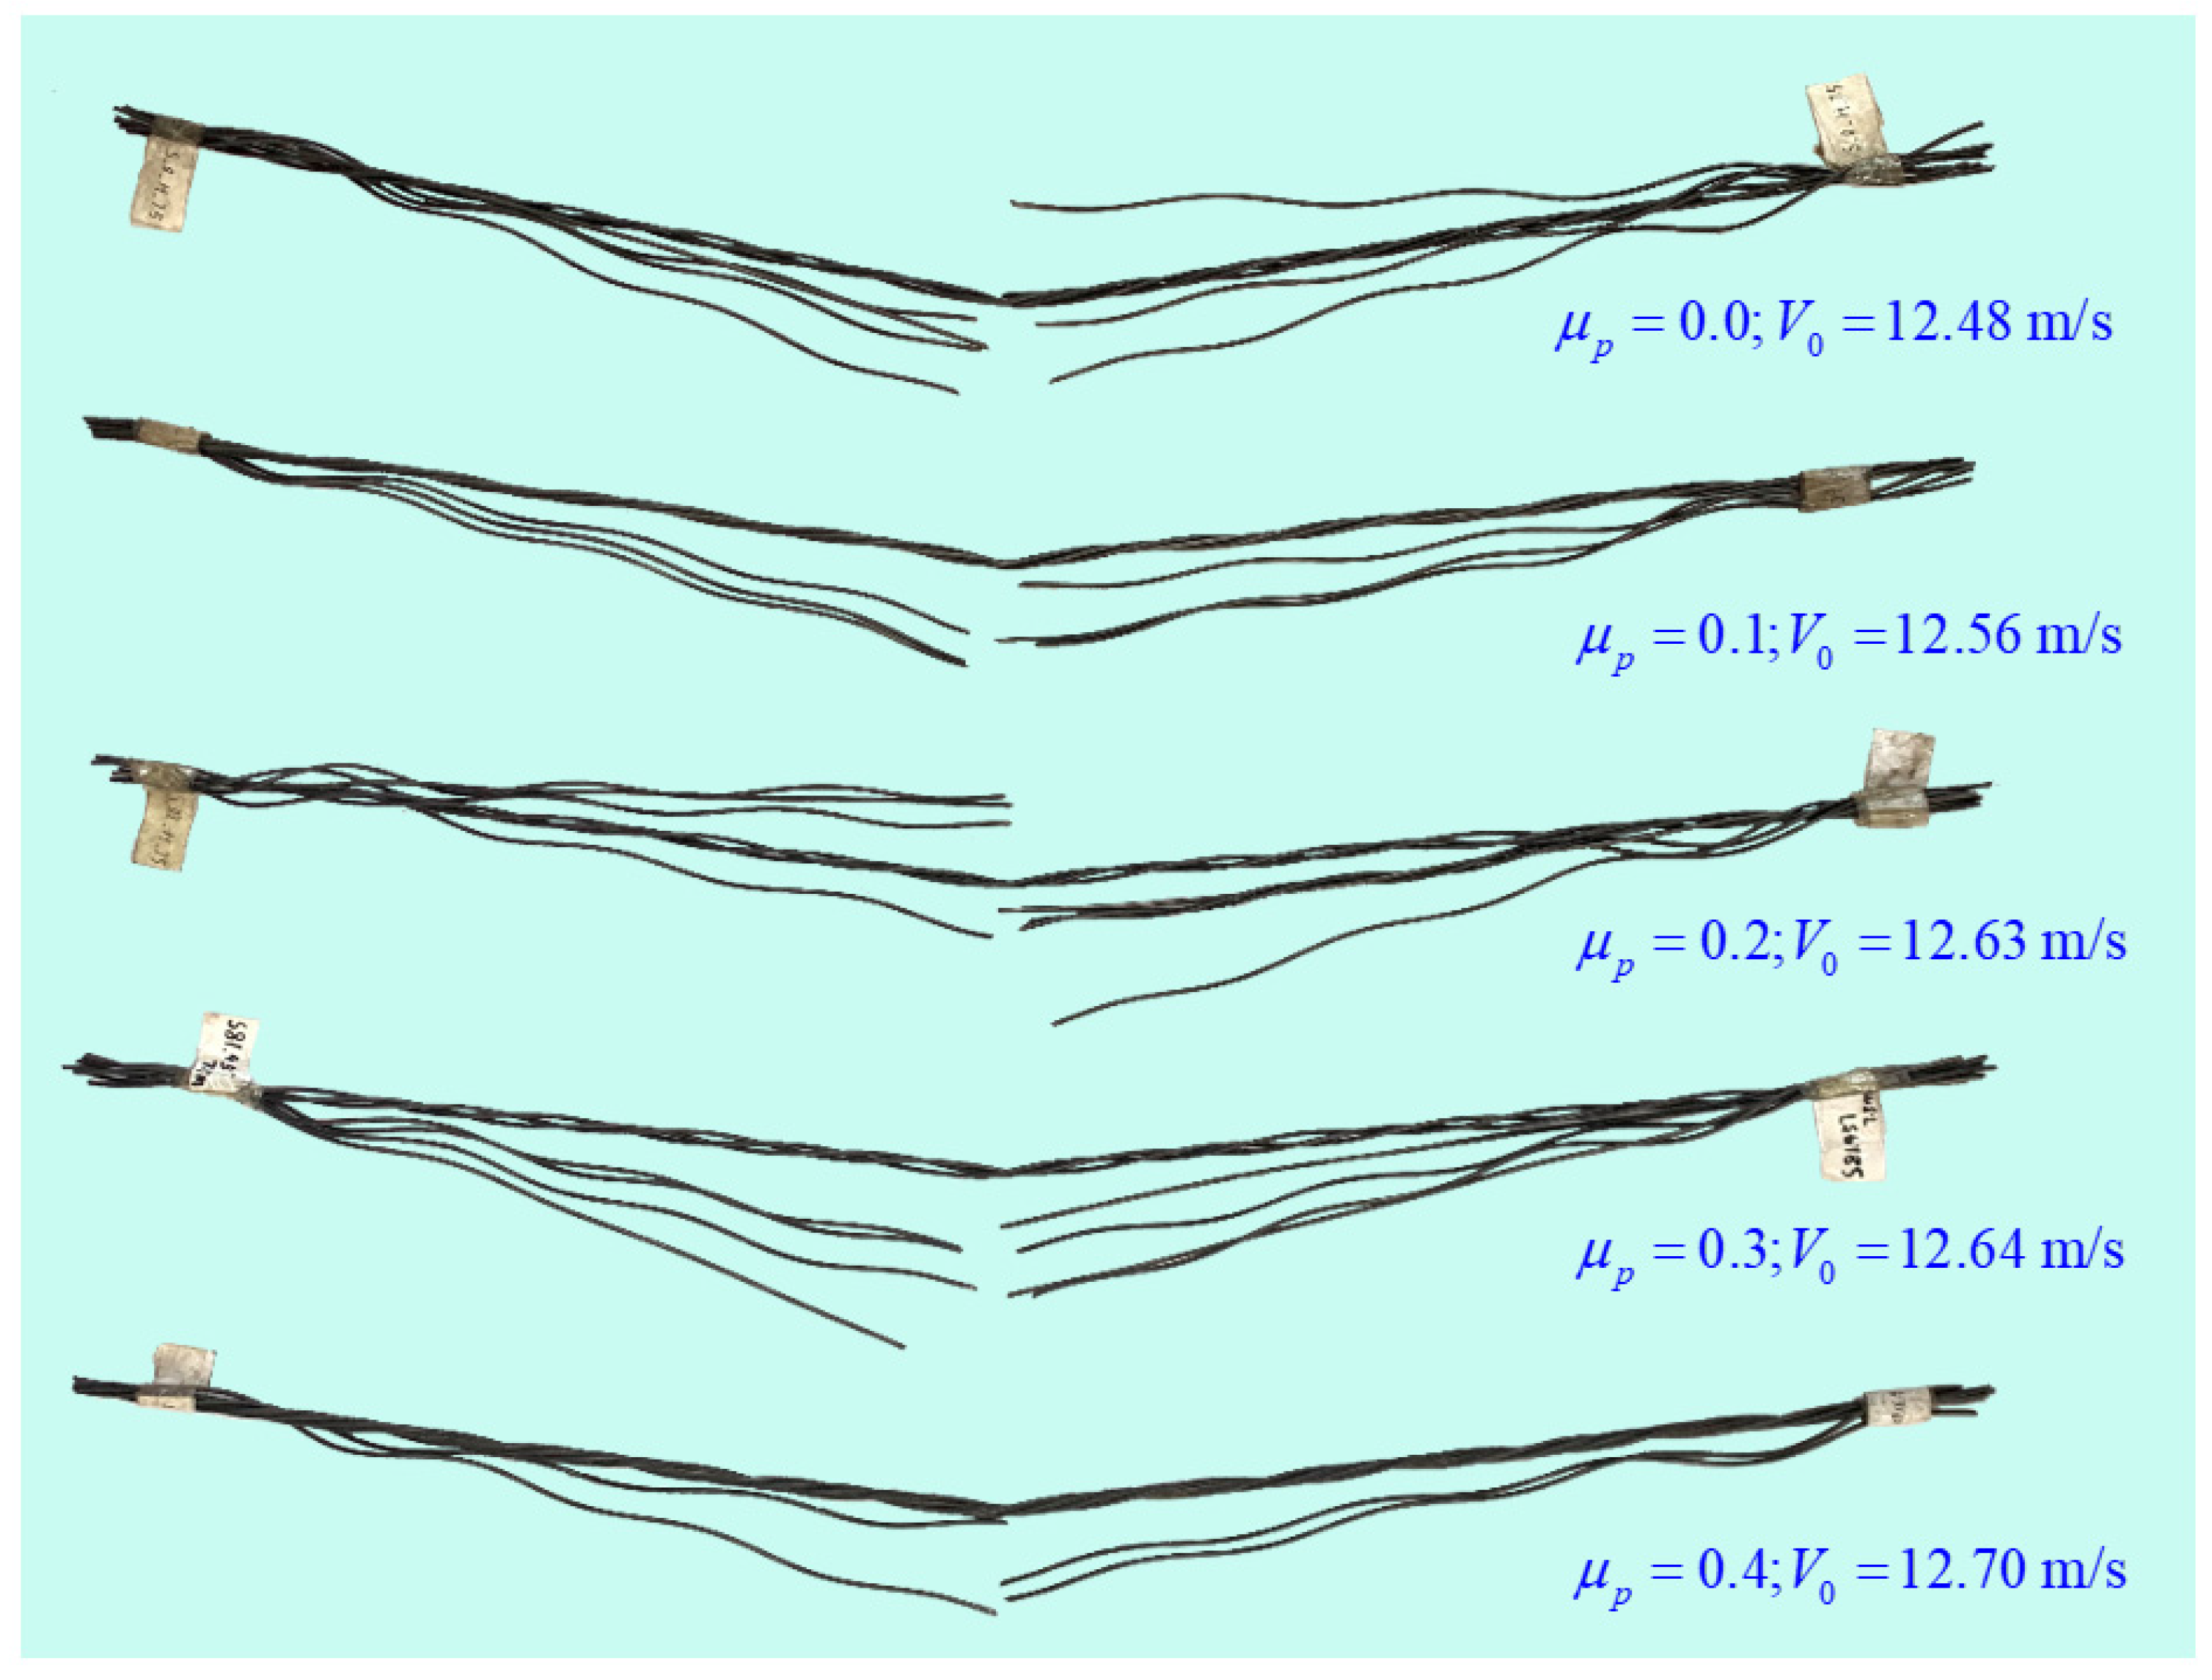
The critical energy and transverse displacement for wire fracture can be used as a control index for designing and evaluating the safety of such structures, and it has important engineering significance for the identification of these data. According to experimental observation, it seems that no significant difference in critical energy corresponds to the number of broken wires (single, multiple or all) in the impact area. For instance, as shown in Figure 18, strand cables with different pre−stress level and about the same impact energy, the number of broken steel wires is four, three, four, four, three, respectively. The reason for this may be related to the winding pattern of the steel strand and the relative position of each steel strand underneath of the drop hammer.
Based on the above discussion, the present test defines the failure energy as the value corresponding to the fracture of at least one steel strand, which is calculated by the following formula.
λ c = ( λ i + λ f ) / 2
In which, λ c ,   λ i ,   λ f are the non−dimensional input energy corresponding to failure energy, no wire fracture, and at least one wire fracture. In the present test, the following formula was adapted to evaluate the accuracy of this value,
δ = 2 ( λ f λ i ) / ( λ i + λ f )
To ensure the results have high accuracy and repeatability, the critical energy determination criterion is set as δ 5 % .
There are big challenges to measuring the critical displacement at the moment of wire fracture. One of the reasons is that the strands will continue to increase in displacement and subsequent rebound after part of the steel wire is broken. The critical displacement at break and the displacement at the stage of elastic vibration are quite different (as shown in Figure 9). On the other hand, the wires appear loose immediately after broken, then the left and right parts of test cable rotate freely around the fixed ends, therefore the final displacement is also quite different from the critical displacement. Based on the above explanations, the displacement was measured by a high−speed camera and laser displacement transducer during the response process. These two sets of data are compared and verified to determine the value of W c r at the time of fracture. In addition, the data discussed in this section are the displacements corresponding to the fracture of the first wire on the upper surface of the strand cable in the impact area.
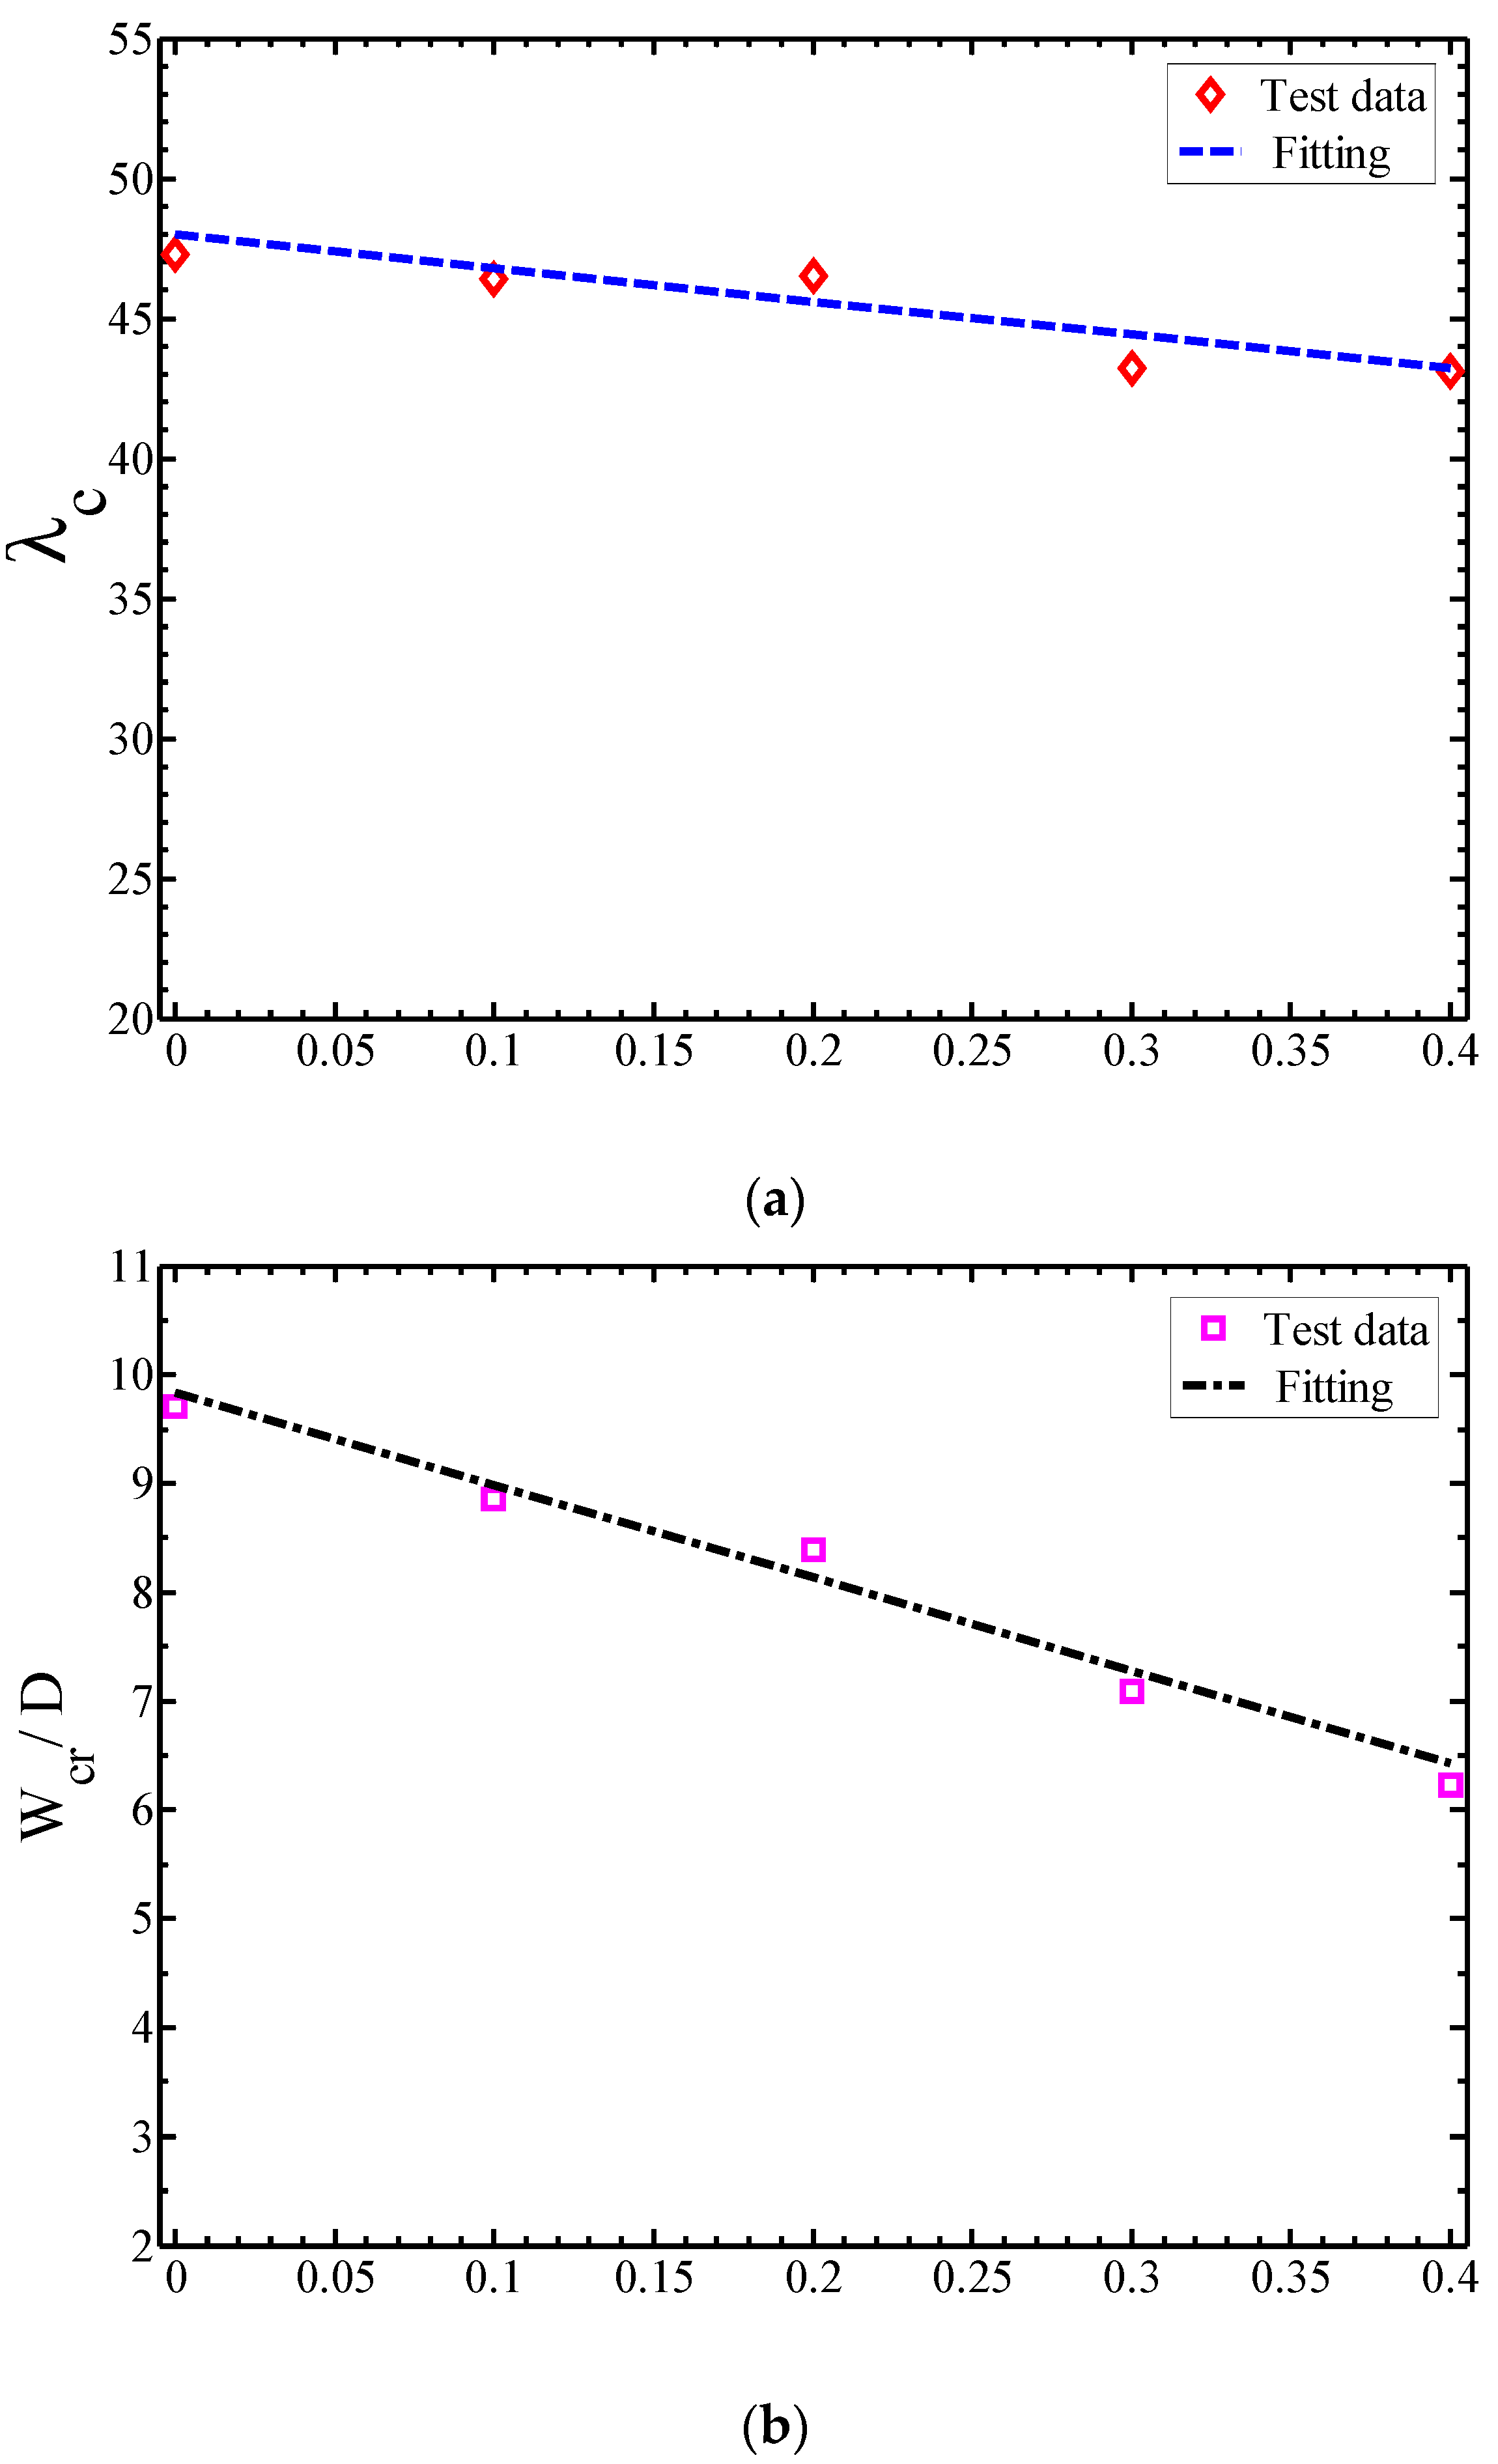
Based on the above discussion, Figure 19 summarizes the trend of the failure energy and displacement of the steel strand with the initial pre−stress level. It is obvious that the failure energy decreases with the increase of the initial pre−stressing level, e.g., λ c r = 47.3 for the case of u p = 0.0 but λ c r = 43.2 for case of u p = 0.4 . However, the reduction magnitude is small (less than 10%) for the whole pre−stress level, which can be considered as λ c r is insensitive to the pre−stress level. In contrast, the failure displacement corresponding to the occurrence of the fracture decreases significantly with the increase of the pre−stressing level, e.g., w c r = 9.62 D for the case of u p = 0.0 but w c r = 6.51 D for the case of u p = 0.4 , which indicates that the value of w c r has a strong sensitivity on the initial pre−stress level.

5. Conclusions

Using the experimental setup described in the present paper, the collision behavior between rigid object and strand cables was experimentally studied. The axial stress generated by pre−tension is within 0–40% of the ultimate stress of the material. According to the impact test results of 63 fully clamped stranded cables, the initial pre−stress level and input kinetic energy are the key factors affecting their impact response mode, plastic deformation and loss of pre−stress. The main conclusions are summarized as follows,
(1)
Under concentrated impact loading, the dynamic response of strands can be categorized into three modes: elastic bounce, plastic deformation and partial or full wire fracture, which corresponding to slight, partial and total loss of pre−tension, respectively.
(2)
The impact failure of steel cable is usually manifested as the unforeseen brittle fracture in the impact zone. The patterns include indentation−like damage of the upper steel wire, fracture of some or all steel wires under the multi−axial stress state which is the combination of compression, shear and tension. Under high−level of pre−tension, some steel wires may break under complicated stress state, and then the remaining steel wires undergo a process of tensile failure. Such failure modes suggest that engineers need to pay attention to at least the following two points in subsequent theoretical analysis: (1) Although the response of the steel strand under the impact load is mainly reflected as the axial tension mode, its failure would be controlled by the complicated stress state in the impact zone; (2) The material properties, especially the plastic behavior and failure criterion, are the key challenges to conquer to deeply understand the dynamic response and energy dissipation mechanism of such components.
(3)
For the same impact energy, the failure displacement decreases significantly with the increase of the pre−stress level. However, the failure energy of the cables is not sensitive to the initial pre−stress level.
As real accidental impact may act on any position of the cables, further studies are required to incorporate the influence of locations, as well as the shape of indenter and different boundary conditions.

Author Contributions

Conceptualization, Z.W. and F.L.; methodology, Z.W. and Y.Y.; validation, Z.W., Y.H.; Data curation, Y.Y. and Y.H.; Writing—original draft, Z.W.; Writing—review & editing, F.L.; Project administration, Z.W. and F.L.; Funding acquisition, F.L. All authors have read and agreed to the published version of the manuscript.

Funding

This research and the APC were funded by the National Natural Science Foundation of China (52078283, 12172198).

Data Availability Statement

The datasets used and/or analyzed during the current study are available from the corresponding author on reasonable request.

Conflicts of Interest

The authors declare no conflict of interest.

Nomenclature

D nominal diameter of strand
L span of strand
E elastic modulus
σ 0.2 proportional limit stress
σ u static ultimate tensile stress
ε r static uniaxial rupture strain
G indenter mass
V 0 impact velocity of indenter
E k initial kinetic energy
F p pretension load
w f maximum total permanent transverse displacement
W c r failure displacement
μ p initial stress level
P c the classical static collapse load
λ the dimensionless energy parameter
λ i no wire fracture energy
λ f the fracture at least one wire energy
λ c failure energy
δ the critical energy

References

  1. Chen, C.; Chen, J.; Zhao, X.; Shi, C. Experimental investigation on combustion characteristics of steel cable for cable-stayed bridge. J. Therm. Anal. Calorim. 2018, 134, 2317–2327. [Google Scholar] [CrossRef]
  2. Iordachescu, M.; Valiente, A.; De Abreu, M. Effect of environmentally assisted damage on fatigue resistance of tie-down cables after 30 years of service in a cable-stayed bridge. Eng. Fail. Anal. 2021, 126, 105455. [Google Scholar] [CrossRef]
  3. Du, Y.; Li, G.-Q. The Role of Tendons for Fire Safety Design of Pre-tensioned Steel Structures. ce/papers 2021, 4, 1488–1498. [Google Scholar] [CrossRef]
  4. Koh, C.H.; Low, K.; Li, L.; Zhao, Y.; Dend, C.; Tan, S.K.; Chen, Y.; Yeap, B.C.; Li, X. Weight threshold estimation of falling UAVs (Unmanned Aerial Vehicles) based on impact energy. Transp. Res. Part C 2018, 93, 228–255. [Google Scholar] [CrossRef]
  5. Lu, X.; Liu, X.; Li, Y.; Zhang, Y.; Zuo, H. Simulations of airborne collisions between drones and an aircraft windshield. Aerosp. Sci. Technol. 2020, 98, 105713. [Google Scholar] [CrossRef]
  6. Zhang, Y.; Huang, Y.; Liang, K.; Cao, K.; Wang, Y.; Liu, X.; Guo, Y.; Wang, J. High-precision modeling and collision simulation of small rotor UAV. Aerosp. Sci. Technol. 2021, 118, 106977. [Google Scholar] [CrossRef]
  7. Utting, W.S.; Jones, N. The response of wire rope strands to axial tensile loads part I: Experimental results and theoretical pre-dictions. Int. J. Mech. Sci. 1987, 29, 605–619. [Google Scholar] [CrossRef]
  8. Ma, J.; Ge, S.; Zhang, D. Load distribution on the unit of the wire rope strand. J. Mech. Eng. 2009, 45, 259–264. [Google Scholar] [CrossRef]
  9. Kim, J.-K.; Yang, J.-M. Effect of design variables on deflected tensile performance of high-strength 7-wire steel strand for stay cable. Constr. Build. Mater. 2018, 188, 40–48. [Google Scholar] [CrossRef]
  10. Xing, X.; Li, Y.; Lei, Z.; Li, Q. Dynamic mechanical tensile properties and constitutive relationship of prestressed steel strand. Sci. Technol. Eng. 2018, 18, 228–233. (In Chinese) [Google Scholar]
  11. Brügger, A.; Lee, S.-Y.; Robinson, J.; Morgantini, M.; Betti, R.; Noyan, I.C. Internal Contact Mechanics of 61-Wire Cable Strands. Exp. Mech. 2022, 62, 1475–1488. [Google Scholar] [CrossRef]
  12. Xu, X.; Gao, H.; Ye, J.; Zhang, F.; Sheng, J. Study on initial tension load and load holding time of prestressed steel strand. J. Basic Sci. Eng. 2022, 30, 1014–1027. (In Chinese) [Google Scholar]
  13. Judge, R.; Yang, Z.; Jones, S.; Beattie, G. Full 3D finite element modelling of spiral strand cables. Constr. Build. Mater. 2012, 35, 452–459. [Google Scholar] [CrossRef]
  14. Chen, C.; Yuan, X.; Jiang, S.; Liang, X. Static model and cross section characteristic analysis of steel strand. J. Huazhong Univ. Sci. Technol. (Nat. Sci. Ed.) 2016, 44, 13–17. (In Chinese) [Google Scholar]
  15. Qian, H.; Zong, Z.; Xie, G.; Liao, J.; Du, M. Refined simulation of elastic-plastic static behavior of grade 1860 strand wires. J. Southeast Univ. (Nat. Sci. Ed.) 2019, 49, 624–630. (In Chinese) [Google Scholar]
  16. Afshan, S.; Theofanous, M.; Wang, J.; Gkantou, M.; Gardner, L. Testing, numerical simulation and design of prestressed high strength steel arched trusses. Eng. Struct. 2019, 183, 510–522. [Google Scholar] [CrossRef]
  17. Minaei, A.; Daneshjoo, F.; Goicolea, J.M. Experimental and numerical study on cable breakage equivalent force in cable-stayed structures consisting of low-relaxation seven-wire steel strands. Structures 2020, 27, 595–606. [Google Scholar] [CrossRef]
  18. Kim, H.-J.; Lee, D.-H.; Yoon, K.; Lee, P.-S. A multi-director continuum beam finite element for efficient analysis of multi-layer strand cables. Comput. Struct. 2021, 256, 106621. [Google Scholar] [CrossRef]
  19. Ahmad, J.; Cheng, S.; Ghrib, F. Combined effect of external damper and cross-tie on the modal response of hybrid two-cable networks. J. Sound Vib. 2018, 417, 132–148. [Google Scholar] [CrossRef]
  20. Zhou, H.J.; Wu, Y.H.; Li, L.X.; Sun, L.M.; Xing, F. Free vibrations of a two-cable network inter-supported by cross-links extended to ground. Smart Struct. Syst. 2019, 23, 653–667. [Google Scholar]
  21. Chen, W.; Wang, R.; Zhou, H.; Zhen, X.; Zhang, Z. Research on natural vibration characteristics of coupling hangers considering bending stiffness. J. South China Univ. Technol. (Nat. Sci. Ed.) 2020, 48, 143–154. (In Chinese) [Google Scholar]
  22. Chen, W.; Zhang, Z.; Zhen, X.; Li, M. Effect of bending stiffness on the in-plane free vibration characteristics of a cable network. J. Mech. Sci. Technol. 2020, 34, 4439–4463. [Google Scholar] [CrossRef]
  23. Chen, C.-C.; Wu, W.-H.; Liu, Y.-T.; Lai, G. A convenient cable tension estimation method simply based on local vibration measurements to fit partial mode shapes. Eng. Struct. 2022, 272, 115008. [Google Scholar] [CrossRef]
  24. Utting, W.S.; Jones, N. The response of wire rope strands to axial tensile loads–part II: Comparison of experimental and theoretical predictions. Int. J. Mech. Sci. 1987, 29, 621–636. [Google Scholar] [CrossRef]
  25. Chen, Y.; Meng, F.; Gong, X. Full contact analysis of wire rope strand subjected to varying loads based on semi-analytical method. Int. J. Solids Struct. 2017, 117, 51–66. [Google Scholar] [CrossRef]
  26. Shi, K.; Wu, X.; Liu, Z.; Dai, S. Coupled calculation model for anchoring force loss in a slope reinforced by a frame beam and anchor cables. Eng. Geol. 2019, 260, 105245. [Google Scholar] [CrossRef]
  27. Shi, K.; Wu, X.; Tian, Y.; Xie, X. Analysis of Re-Tensioning Time of Anchor Cable Based on New Prestress Loss Model. Mathematics 2021, 9, 1094. [Google Scholar] [CrossRef]
  28. Qin, J.; Ju, Z.; Liu, F.; Zhang, Q. Cable Force Identification for Pre-Stressed Steel Structures Based on a Multi-Frequency Fitting Method. Buildings 2022, 12, 1689. [Google Scholar] [CrossRef]
  29. Gao, X.; Jia, J.; Mei, G.; Bao, X.; Zhang, L.; Liao, X. A New Prestress Loss Calculation Model of Anchor Cable in Pile–Anchor Structure. Mathematics 2022, 10, 1260. [Google Scholar] [CrossRef]
  30. Lu, Q.; Sun, Z.; Zhang, W. Nonlinear parametric vibration with different orders of small parameters for stayed cables. Eng. Struct. 2020, 224, 111198. [Google Scholar] [CrossRef]
  31. Xu, B.; Dan, D.; Yu, X. Real-time online intelligent perception of time-varying cable force based on vibration monitoring. Eng. Struct. 2022, 270, 114925. [Google Scholar] [CrossRef]
  32. Sun, Y.; Zhang, M.; Wang, X.; Zhao, L.; Bai, Y. Analytical investigation of the main cable bending stiffness effect on free flexural vibration of suspension bridges with a 3D cable system. Structures 2022, 41, 764–776. [Google Scholar] [CrossRef]
  33. Judge, R.; Yang, Z.; Jones, S.; Beattie, G.; Horsfall, I. Spiral strand cables subjected to high velocity fragment impact. Int. J. Impact Eng. 2017, 107, 58–79. [Google Scholar] [CrossRef] [Green Version]
  34. Wang, L.; Zhang, Y.; Jiang, T.; Li, X.; Mao, A.; Wang, W.; Lin, X.; Yu, J.; Yan, C.; Xie, Z.; et al. GB/T 5224-2014; Steel Strand for Prestressed Concrete. Standards of the People’s Republic of China: Beijing, China, 2014. (In Chinese)
  35. Gao, Y.; Dong, L.; Liu, T.; Huang, X.; Luo, Y.; Long, J.; Wang, L.; Zhang, H.; Xu, L.; Yang, H.; et al. GB/T 228.1-2021; Metallic Materials—Tensile Testing—Part 1: Method of Test at Room Temperature. Standards of the People’s Republic of China: Beijing, China, 2021. (In Chinese)
  36. Reid, S.R.; Gui, X.G. On the elastic-plastic deformation of cantilever beams subjected to tip impact. Int. J. Impact Eng. 1987, 6, 109–127. [Google Scholar] [CrossRef]
  37. Yu, T.; Yang, J.; Reid, S. Interaction between reflected elastic flexural waves and a plastic ‘hinge’ in the dynamic response of pulse loaded beams. Int. J. Impact Eng. 1997, 19, 457–475. [Google Scholar] [CrossRef]
  38. Xi, F.; Liu, F.; Li, Q. Large deflection response of an elastic, perfectly plastic cantilever beam subjected to a step loading. Int. J. Impact Eng. 2012, 48, 33–45. [Google Scholar] [CrossRef]
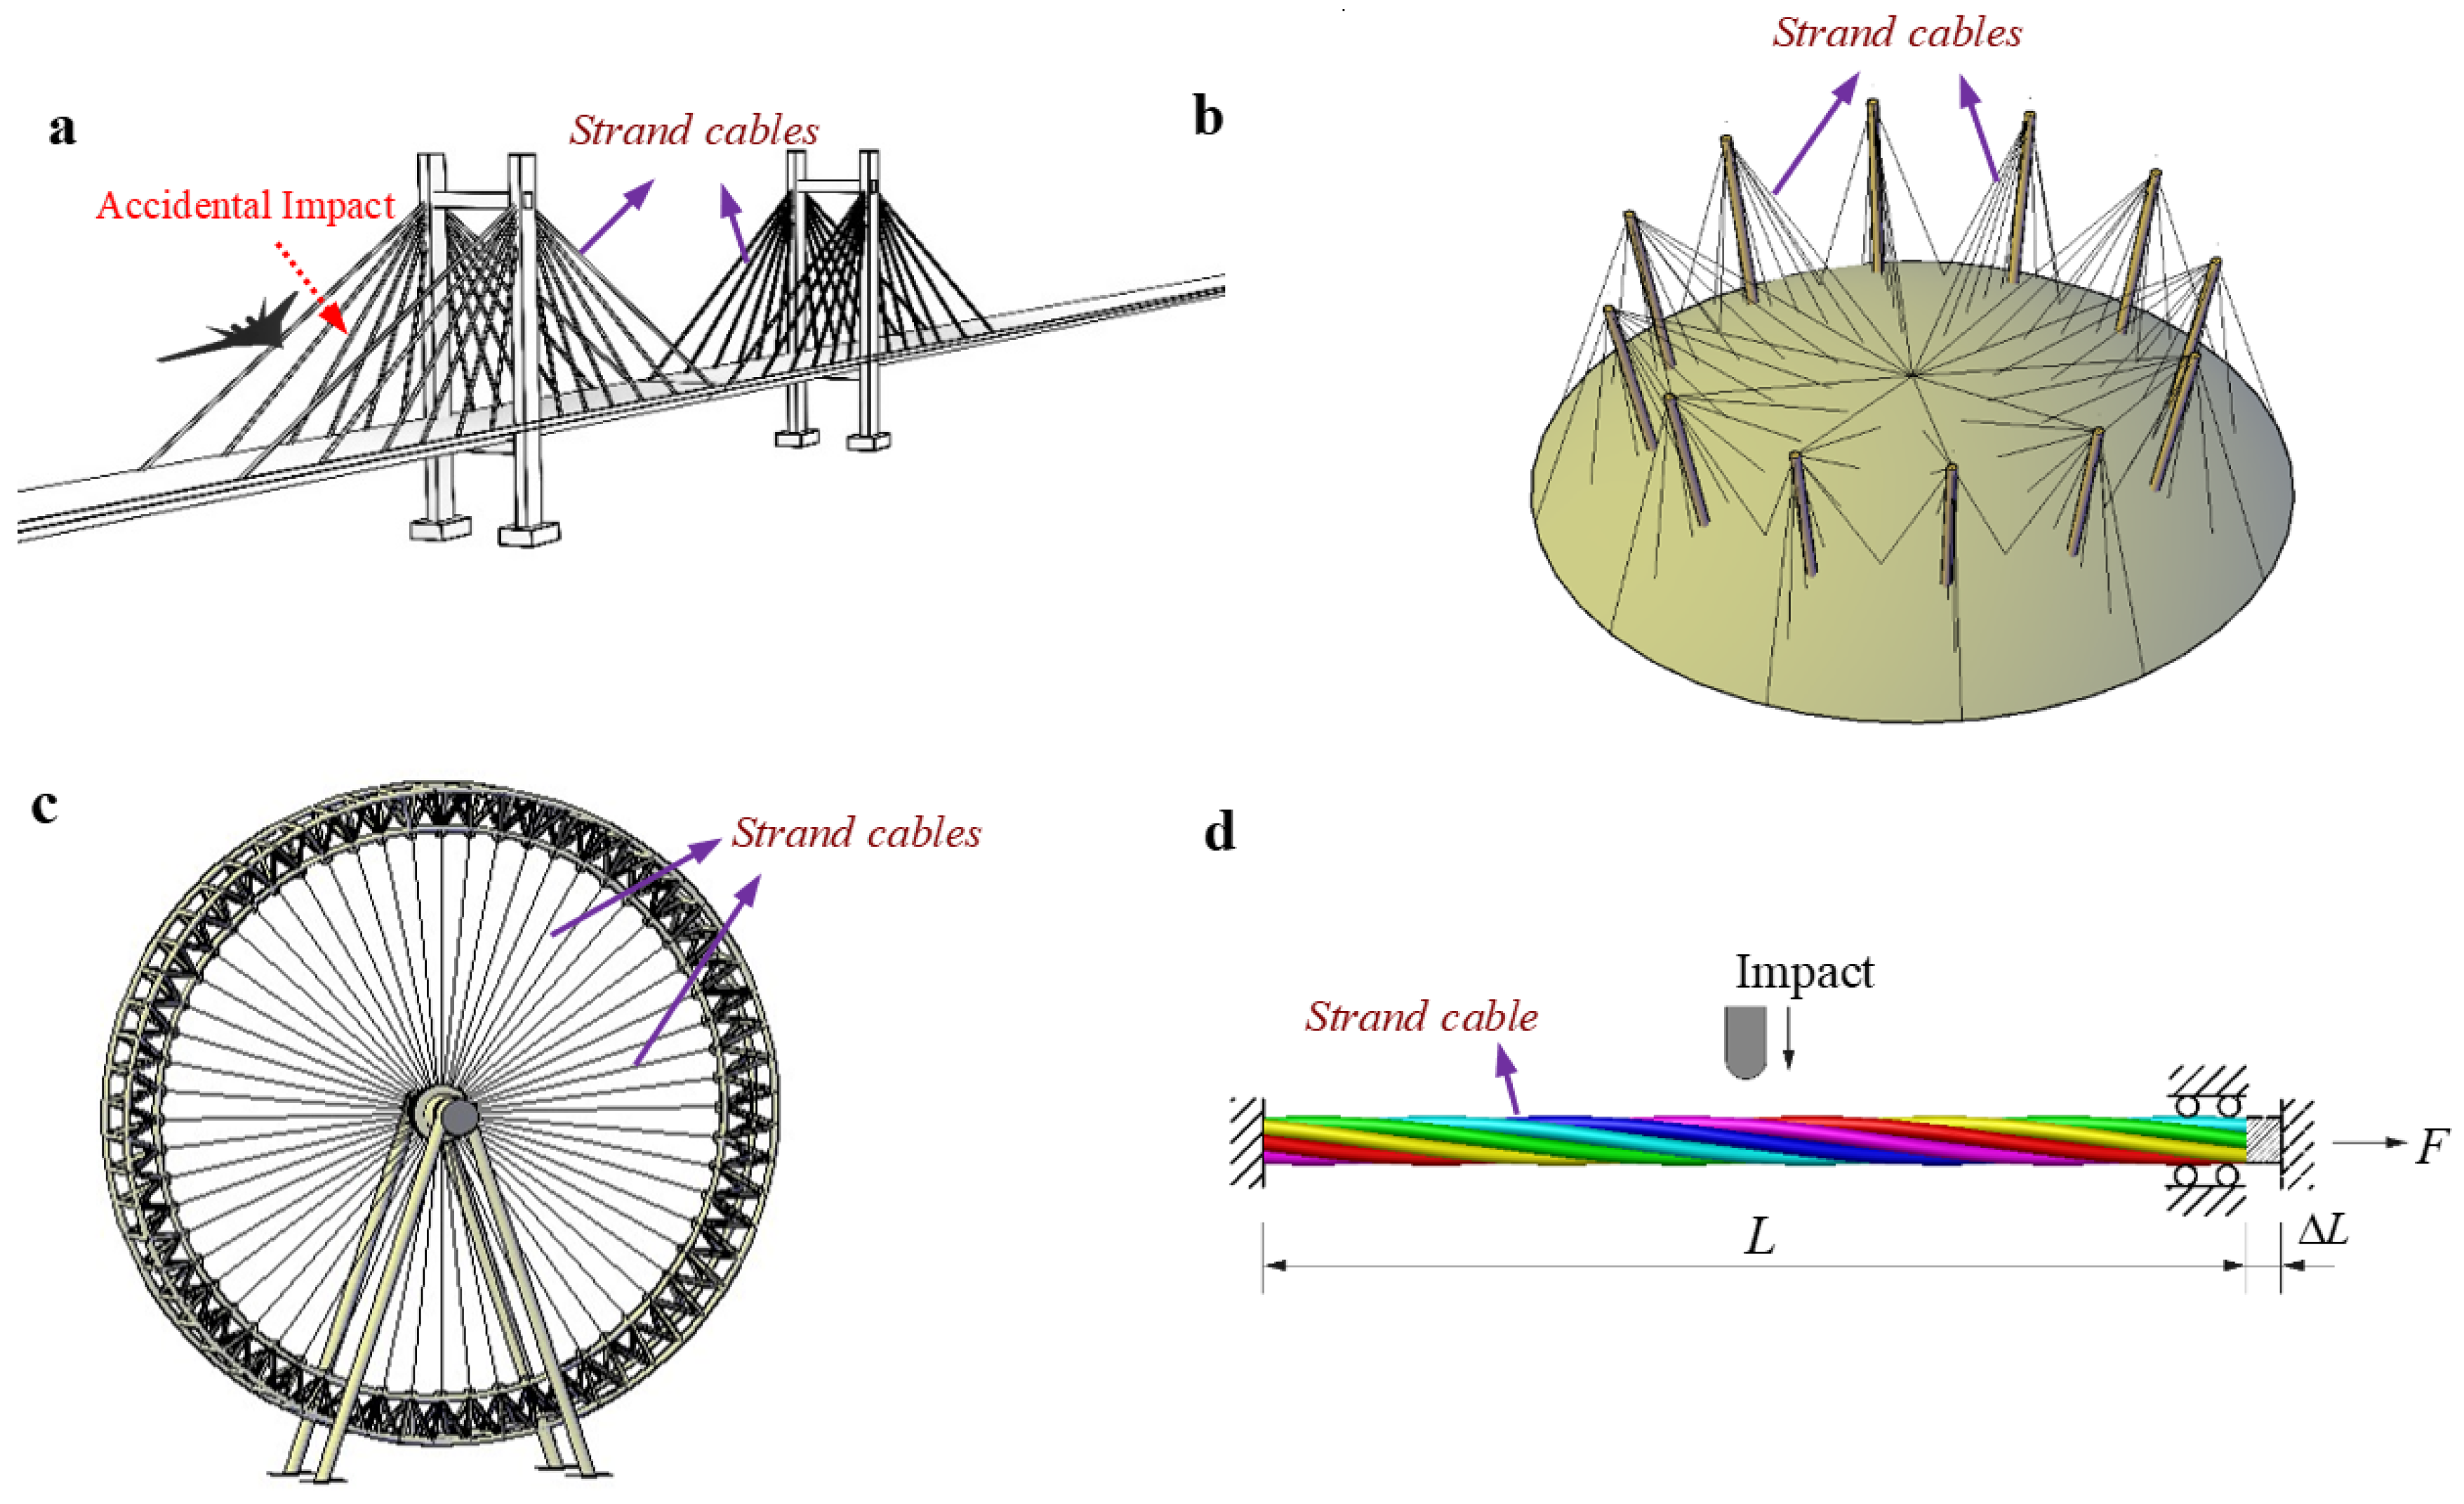
Figure 1. Background and problem schematic: (a) cable−stayed bridge; (b) large−span steel roof; (c) Ferris wheel; (d) mechanical model of strand cables under impact.
Buildings 13 00330 g001
Figure 2. The geometry configuration of strand specimen.
Buildings 13 00330 g002
Figure 3. Standard tension test: (a) test machine; (b) failure pattern; (c) “birdcaging” knot.
Buildings 13 00330 g003
Figure 4. The recorded stress–strain curve of 1 × 7 steel strand according to code GB/T 288.1 B30 [35].
Buildings 13 00330 g004
Figure 5. Schematic arrangement for the impact tests on pre−tensioned strand.
Buildings 13 00330 g005
Figure 6. High−speed photographs of strand collisions for the working cases of μ p = 0.288 and V 0 = 7.08   m / s .
Buildings 13 00330 g006
Figure 7. The recorded axial force of strands before and after being subjected to transverse impact under the loading cases of μ p = 0.288 ; V 0 = 7.8   m / s and μ p = 0.298 ; V 0 = 12.55   m / s .
Buildings 13 00330 g007
Figure 8. The record of deflection on the mid−span of strands with the same pre−stress but different input energy under the loading cases of μ p = 0.288 ; V 0 = 7.8   m / s and μ p = 0.298 ; V 0 = 12.55   m / s .
Buildings 13 00330 g008
Figure 9. High−speed photographs of strand collisions for the working cases of μ p = 0.298 and V 0 = 12.55   m / s .
Buildings 13 00330 g009
Figure 10. Photographs of impact zone for the working condition of μ p = 0.298 and V 0 = 12.55   m / s .
Buildings 13 00330 g010
Figure 11. Deformed profiles and failure modes of strand cables under concentrated impact: (a) μ p = 0.0 , V 0 = 6.85   m / s ; (b) μ p = 0.103 , V 0 = 11.23   m / s ; (c) μ p = 0.196 , V 0 = 12.64   m / s ; (d) μ p = 0.396 , V 0 = 12.72   m / s .
Buildings 13 00330 g011
Figure 12. Local deformation of cable after impact: (a) impact denting on the upper surface of impact zone; (b) transverse splay on the impact zone; (c,d) partial or total loss of integrity near the root; (e,f) squeezing of clips and pulling out of the central wire.
Buildings 13 00330 g012
Figure 13. Details of failure patterns: (a,b) some wires broken; (c) all wires broken; (d) shrinkage of wires under uniaxial tension.
Buildings 13 00330 g013
Figure 14. Fragment penetration of local wires presented and the ends of cable samples observed by Judge et al. [33]: (a,b) wire failure under impact of V0 = 360 m/s, V0 = 501 m/s; (c) the ends of cable samples of V0 = 1320 m/s.
Buildings 13 00330 g014
Figure 15. Failure sequence of strands with the increase of impact energy: (a) elastic rebound with slight pre−stress loss; (b) inelastic displacement with partial loss of pre−stress; (c,d) partial or total failure of wires underneath the indenter with entire pre−stress loss.
Buildings 13 00330 g015
Figure 16. The correlation of the permanent displacement with the input kinematic energy and pre−stressed level (Zone for WZ1, WZ2 and WZ3 represent total elastic recovery, inelastic plastic displacement and partial or total failure, respectively).
Buildings 13 00330 g016
Figure 17. The correlation of the residual stress with the input kinematic energy and pre−stressed level (Zone for RZ1, RZ2 and RZ3 represent none, partial, and total stress loss, respectively).
Buildings 13 00330 g017
Figure 18. Failure patterns for strand cables with about the same input energy but different pre−stress level.
Buildings 13 00330 g018
Figure 19. (a) The failure energy ( λ c ) and (b) failure displacement ( W c r ) for strand cables with various levels of initial stress.
Buildings 13 00330 g019
Table 1. Composition of selected strand specimen.
ComponentFeCSiMnPSCrNiCu
Mass %>98.30.720.190.41<0.025<0.025<0.10<0.10<0.20
Table 2. Test parameters and material properties.
No.Nominal AreaLengthF_maxF_0.2E σ 0.2 σ u Elongation
(mm2)(mm)(kN)(kN)(GPa)(MPa)(MPa)(%)
Specimen 1140.0607279.7254.5202182019986.59
Specimen 2140.0604279.8257.8198184019996.47
Specimen 3140.0611277.3254.1200181519816.42
Disclaimer/Publisher’s Note: The statements, opinions and data contained in all publications are solely those of the individual author(s) and contributor(s) and not of MDPI and/or the editor(s). MDPI and/or the editor(s) disclaim responsibility for any injury to people or property resulting from any ideas, methods, instructions or products referred to in the content.