Article

Flexural Response of Concrete Beams Reinforced with Steel and Fiber Reinforced Polymers

by
Noura Khaled Shawki Ali
*,
Sameh Youssef Mahfouz
and
Nabil Hassan Amer
Construction and Building Engineering Department, College of Engineering and Technology, Arab Academy for Science, Technology and Maritime Transport (AASTMT), B 2401 Smart Village, Giza 12577, Egypt
*
Author to whom correspondence should be addressed.
Buildings 2023, 13(2), 374; https://doi.org/10.3390/buildings13020374
Submission received: 29 December 2022 / Revised: 17 January 2023 / Accepted: 26 January 2023 / Published: 29 January 2023
(This article belongs to the Special Issue Fiber Reinforced Polymer (FRP) Composites for Construction)

Abstract

:
This paper numerically investigates the flexural response of concrete beams reinforced with steel and four types of Fiber-Reinforced Polymers (FRP), i.e., Carbon FRP (CFRP), Glass FRP (GFRP), Aramid FRP (AFRP), and Basalt FRP (BFRP). The flexural responses of forty beams with two boundary conditions (simply supported and over-hanging beams) were determined using ABAQUS. Subsequently, the finite element models were validated using experimental results. Eventually, the impact of the reinforcement ratios ranging between 0.15% and 0.60% on the flexural capacity, crack pattern, and fracture energy were investigated for all beams. The results revealed that, for the low reinforcement ratios, the flexural performance of CFRP significantly surpassed that of steel and other FRP types. As the reinforcement ratio reached 0.60%, the steel bars exhibited the best flexural performance.

1. Introduction

Although steel is the most popular material for reinforcing concrete elements due to its cost and enhanced mechanical features [1,2,3], the corrosion of steel bars reduces the structure’s lifespan and raises maintenance expenses [4,5]. Fiber-Reinforced Polymer (FRP) bars are an appealing option in the reinforcement of concrete elements because they provide excellent levels of durability, corrosion resistance, and fatigue resistance, in addition to having a high strength-to-weight ratio [6,7,8,9,10,11,12,13]. FRP may be used for various purposes, such as reinforcing structures internally or externally by embedding discrete FRP fibers into the concrete, utilizing the near-surface-mounted technique (NSM) for FRP plates and sheets attached to the structure with vinyl-ester glue or epoxy [9,10].
To simulate the behavior of beams, many constitutive numerical models were provided in the existing literature [14,15,16,17]. Tejaswini and Raju [14] studied the flexural response for reinforced concrete beam sections with different failure modes using ABAQUS. The aim was to numerically compare the Finite Element Analysis (FEA) experimental findings. Salih et al. [15] executed seventeen models using ANSYS software of concrete beams reinforced with CFRP and GFRP bars. Various parameters were studied, including the number of bars, size, types, and longitudinal configuration for FRP bars. The outcomes were described in the form of a load–deflection diagram. Al Hasani et al. [16] investigated the crack propagation of RC beams reinforced with steel bars using ABAQUS software to simulate crack propagation. A comparison of numerical and experimental data findings has been established. The results indicated that the cracks were initiated from the tension side at the bottom of the beam. Shirmardi and Mohammadizadeh [17] simulated twenty concrete beams reinforced with GFRP in ABAQUS. The study focused on the span/depth ratio and the reinforcement ratio. The results showed that the rigidity of the beam decreases as the span/depth ration increases.
Many experimental tests were also conducted to compare the flexural behavior of the beams reinforced with GFRP and steel bars [18,19,20,21,22,23]. Shanour et al. [18] investigated seven GFRP and steel beams under four-point loading. The primary studied factors were a concrete compressive strength and reinforcement ratio. The fracture breadth and GFRP reinforcing stresses were measured for the tested beams mid-span deflection. The results showed that increasing the reinforcement ratio reduces the crack widths and mid-span deflection. Krasniqi et al. [19] examined GFRP and steel-reinforced beams under four-point loading. The results showed early crack initiation due to the low elastic modulus of GFRP bars. Sirimontree et al. [20] investigated the flexural behavior of concrete reinforced with GFRP and steel bars. The beam was subjected to four-point loading. The stiffness, flexural capacity, and mode of failure were investigated. The results relieved that the stiffness of GFRP-reinforced beams decreased in comparison to steel-reinforced beams.
Arivalagan [21] examined the beams’ flexural behavior reinforced with GFRP bars and stainless-steel bars (SSRB). The results showed that the beams reinforced with GFRP experience larger deflections, lower stiffness, and lower ultimate loads than the control beam. This was due to a slip between the rebar and the concrete. Saraswathi and Dhanalakshmi [22] studied the behavior of concrete beams reinforced with GFRP and steel bars. Various factors, including the load capability, load deflection, and mechanism of failure were examined. The GFRP bars exhibit higher deflections due to their low elastic modulus. The GFRP bars failed due to the slip between the rebar and the concrete. To improve the FRP bars’ bond behaviors. Murugan and Kumaran [23] studied the flexural tensile behavior of five rectangular concrete beams reinforced with surface-treated GFRP under two-point static loading. The sand-sprinkled and grooved reinforcing bars were used to improve the bond behavior. The investigated parameters were the ultimate load capacity, fracture widths, crack propagation, and beam failure modes. The results showed that the sand-coated GFRP reinforcements had poorer performance than the grooved GFRP beams concerning ultimate load capacity and deflections. To compare the behavior of the beams reinforced with BFRP and steel bars.
Some studies focused on the studying behavior of BFRP and CFRP. Hamdy and Arafa [24] examined six concrete beams reinforced with BFRP bars, dispersed steel fibers and steel tested in four-point bending until failure. The moment carrying capacity and failure loads were calculated and compared with the experimental data. The results showed that the BFRP bar-reinforced beams experienced greater deflection values than steel beams as it has low stiffness of FRP bars. Zhang et al. [25] experimentally studied the flexural deflection of six concrete beams reinforced with BFRP bars and one beam reinforced with steel bars. Additionally, the numerical simulation was performed using FEM. The findings demonstrated that all the BFRP-reinforced concrete beams had either concrete crushing or rupture. Ashour and Habeeb [26] investigated the tensile behavior of the CFRP-reinforced simply supported and continuous beams. It was found that the CFRP beams failed due to the rupture of bars. The use of CFRP bars enhanced the load carrying capacity. Many studies focused on the usage of CFRP in the strengthening of rc beams [27,28,29,30]. All the studies indicated that CFRP increased the load carrying capacity in flexural and shear strengthening.
Despite the efforts of the previously mentioned studies to investigate the flexural behavior of concrete beams reinforced with FRP, the majority of these studies focused on the utilization of GFRP bars, disregarding the other FRP types. Furthermore, most studies focused on the application of CFRP bars to strengthen the concrete beams rather than reinforcing them. Thus, the flexural behavior of most FRP types lacks further investigation. Moreover, the fracture energies of the beams reinforced with FRP were not discussed. Therefore, the current study addresses the literature gap by examining the flexural behavior of four FRP types (CFRP, AFRP, BFRP, and GFRP) to help the structural designers to find an effective alternative to steel bars. To this end, the influence of different reinforcement ratios (0.15%, 0.27%, 0.42%, and 0.60%) on the flexural capacity of forty concrete beams. Moreover, the load–deflection relationships and crack patterns of these beams were discussed. In order to verify the models, the results of FEM were compared with the experimental work performed by Issa and Elzeiny [31]. Section 2 of this study provides an overview of the experimental work, specifics of developing numerical FE models, the behavior of materials, and FE model verification. The parametric study and findings are discussed in Section 3. Finally, a brief discussion of the results, conclusions, and recommended work are presented in Section 4.

2. Model Evolution

2.1. General

The experimental investigation performed by Isa and Elzeiny [31] consisted of six over-hanging concrete beams that were subjected to a three-point load. The beams’ dimensions were 150 × 250 mm; the total length was 2000 mm, including a 600 mm long cantilever. There were three groups, each with varying ratios of GFRP rebars, concrete strength, and rebar types (steel or GFRP). The details of the examined beams are shown in Figure 1.

2.2. Model Loading Boundary Condition and Meshing

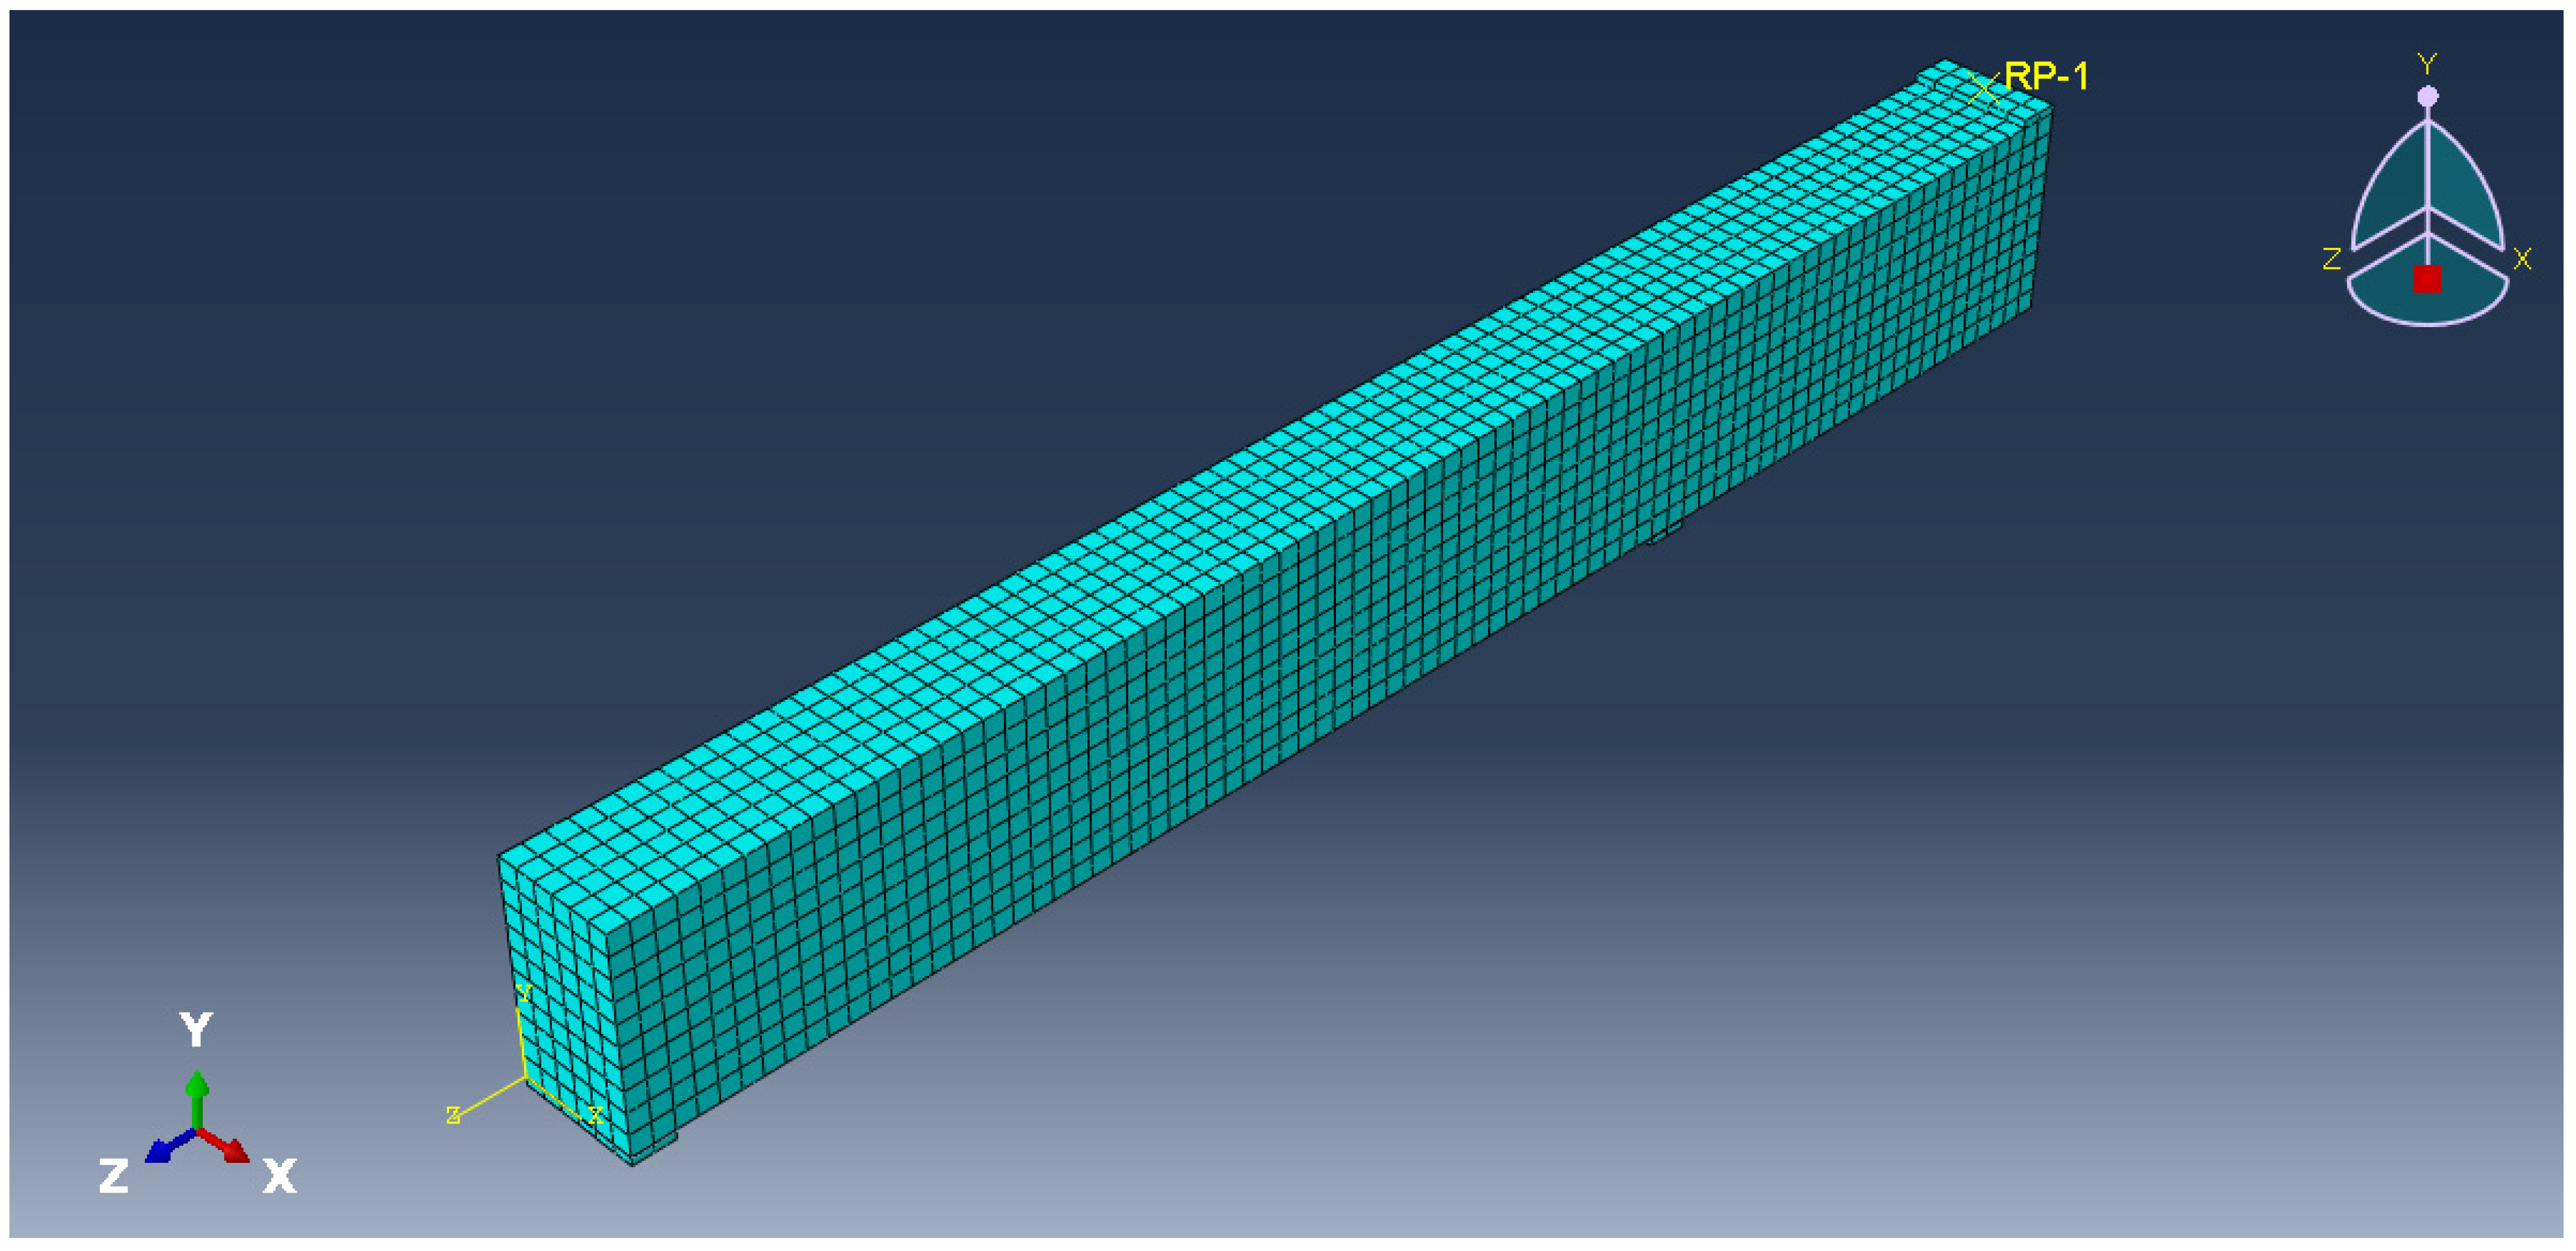
The overhanging beams presented by Isa and Elzeiny [31] were simulated in ABAQUS. In order to simulate the concrete, 3D solid C3D8R element have been used. T3D2 is a 2D truss element used in the modeling of steel and FRP reinforcements. The concrete material was defined according to the damage plasticity models and details of defining steel and FRP materials are discussed in detail in the following section. A static condition of loading was considered. The embedded bar option was used to simulate the bond between FRP and steel reinforcement in concrete. Ties were utilized to simulate the bond between the beams and the plates. A loading point (reference point) at the tip of the cantilever was added at the top of the plate as shown in Figure 2 and the displacement was computed at the node located at the bottom of the beam. The fine mesh size of 20 mm and increment size from 0.01 to 1 to obtain more accurate results. The details of meshing are shown in Figure 2.

2.3. Materials

2.3.1. Damaged Plasticity Model

Three crack models: (i) brittle crack model, (ii) smeared crack model, and (iii) concrete-damaged plasticity (CDP) model in ABAQUS were used to simulate the concrete damage [32]. The CDP model was used to represent the inelastic responses of concrete compression and tension damage characteristics. The models take into account two failure mechanisms, namely tensile cracking and compressive crushing.

2.3.2. Tensile Behavior of Concrete

The tensile strain and cracking stress relationship was used to describe the behavior of concrete under tension. The cracking strain was computed using Equation (1):
ε t ~   ck = ε t ε ot el
where ε t ~   ck is the tensile cracking strain, ε t tensile strain, and ε ot el   is   the   elastic strain of the unaffected material. The model was developed based on the Nayal and Rasheed [33] model of tension-stiffening. Gilbert and Warner [34] created a homogenized stress and strain relationship. The accuracy of the plastic strain values was checked using ABAQUS and are calculated as shown in Equation (2). The inaccurate damage curves result from the tensile plastic strain values that are negative or decreasing.
ε t ~   p = ε t ~   ck d t ( 1   d t )   σ t E 0
where ε t ~   p is the tensile plastic strain,   d t   refers to tensile damage parameter values, σ t   is the concrete tensile stress, and E 0   is the elastic modulus.

2.3.3. Compressive Behavior of Concrete

The relationship between compressive stress and cracking strain was used in defining the nonlinear compression behavior of concrete. Equation (3) was used to convert compressive strain to inelastic strain.
ε c ~   in = ε c ε oc el
where ε c ~   in is the compressive inelastic strain, ε c is compressive strain, and ε oc el is elastic strain corresponding to the unaffected material. The accuracy of the plastic strain values was checked using Equation (4) to ensure there were no negative or decreasing values.
ε c ~   p = ε c ~   in d c ( 1   d c )   σ c E 0
where the symbol ε c ~   p is the compressive plastic strain, d c is the damage parameter values, and   σ c is the compressive strength. In compression, the stress–strain relationship was obtained using a computational model created by Hsu et al. [34]. The concrete materials with compressive strengths of up to 62 MPa can be utilized with this model. The stress–strain of concrete exhibits linear behavior up to 50% of compressive strength in the hardening part. The material was described until the σ c of 30 MPa in the softening part. The model equations are presented in Equations (5)–(8).
σ c   =   ( β   ( ε c ε 0 ) β 1 + ( ε c ε 0   ) β )   σ c u
β   =   1   1 ( σ c u / ( ε 0   E 0 ) )    
ε 0 =     0.000089   σ c u + 0.002114
E 0 = 124.3   σ c u + 32831.2
where ε 0 refers to strain at peak stress and β refers to a variable that depends on the shape of stress–strain diagram.

2.3.4. Concrete Damage Parameters (CDP)

The elastic modulus following tensile and compressive failure can be calculated using Equations (9) and (10). The tensile and compressive failure has a range between 0 and 1, where 0 indicates that the material is in its initial state but 1 indicates that there is a loss in material strength. The compression and tensile damage can be calculated using Equations (11) and (12).
E t = E 0 ( 1 d t )
E c = E 0 ( 1 d c )
d t = 1 (   σ t σ t )
d c = 1 (   σ c σ c )
where E t refer to the tensile damage elastic modulus, E c is elastic modulus of compressive damage, d t is tensile damage, d c is compressive damage, σ c is effective compressive strength, and σ t     is effective tensile strength. The CDP model in ABAQUS is defined by five parameters [35]. Table 1 summarizes the CDP values needed to define the model in ABAQUS [36].

2.3.5. FRP Bars Behaviors

The behavior of the FRP bars was assumed to be isotropic linear elastic up to failure without any damage criteria [37,38]. FRPs were defined by their linearly elastic response in the absence of any visible yield point. The stress–strain equation is presented in Equation (13).
f f   =   E f   ε f           ε f     ε fu
where f f refer to the fiber strength, E f is the elastic modulus, ε f refer to the strain, and ε fu refer to the ultimate strain of FRP bars.

2.3.6. Behavior of Steel

Steel bars used for reinforcement have linearly elastic behavior under low strains. The yield point of steel is used to explain its plastic behavior. When a material’s stress–strain curve reaches a yield point, the elastic behavior changes to a plastic one. The only strains that are produced by the steel’s deformation before it reaches the yield point are elastic strains, which are entirely returned when the load is withdrawn. When the steel reaches its yield stress, permanent (plastic) deformation starts to occur [39]. The stress–strain equation is expressed in Equation (14). Kobraei et al. [37] and Abbood et al. [38] suggested proper values for the yield stress, elastic modulus of steel, and elastic modulus of FRP; these are summarized in Table 2.
f s = { E s   ε s   ε s       ε sy   f sy           ε s   > ε sy  
where f s is stress, E s   is modulus of elasticity, ε s   is strain in the steel bars, f sy is yielding strength, and ε sy   is yielding strain.

2.4. Experimental Program Specimens

The specimens were classified into three groups A, B, and C. Group A consists of three beams reinforced with steel bars (SN8-8, SN10-10, and SN 12-12). The first part of the symbol (SN) reflects the steel reinforcement and the second part 8-8, 10-10, and 12-12 reflects the bar diameter. Group B consists of two beams reinforced with GFRP bars (GN8-8 and GN12-10). Group C represents the beam reinforced with GFRP bars (GM10-10). The   σ c   of concrete for group A and B was 42.25 MPa. The σ c of concrete for group C was 59.26 MPa. The compressive strength of the concrete and the details of reinforcement configuration are summarized in Table 3.

2.5. FE Models Verification and Discussion

Four statistical indicators were utilized to verify the model [35]:
(i)
Nash—Sutcliffe efficiency (NSE) is a statistic indicator that determines the proportionate difference between the observed data variance and residual variance.
(ii)
Coefficient of determination (R2) is the percentage of variance or difference that can be statistically explained by one or more independent variables for a dependent variable.
(iii)
Modified index of agreement (md) calculates the proportional and additive differences between the experimental and numerical in the means and variances.
(iv)
Kling—Gupta efficiency (KGE) evaluates the bias, correlation, and variability between the numerical and experimental data. These indicators are calculated for Equations (15)–(18).
NSE = 1 [ a = 1 N ( x ^ a x a ) 2 a = 1 N ( x a x m e a n ) 2 ]
m d = 1 a = 1 N | x a x ^ a | a = 1 N ( | x ^ a x m e a n | + | x a x m e a n | )
R 2 = ( a = 1 N [ ( x a x m e a n ) ( x ^ a x ^ m e a n ) ] a = 1 N [ x ^ a x ^ m e a n ] 2 a = 1 N [ x a x m e a n ] 2 ) 2
K G E = 1 ( P c 1 ) 2 + ( x ^ m e a n x m e a n 1 ) 2 + ( S . D ^ / x ^ m e a n S . D / x m e a n 1 ) 2
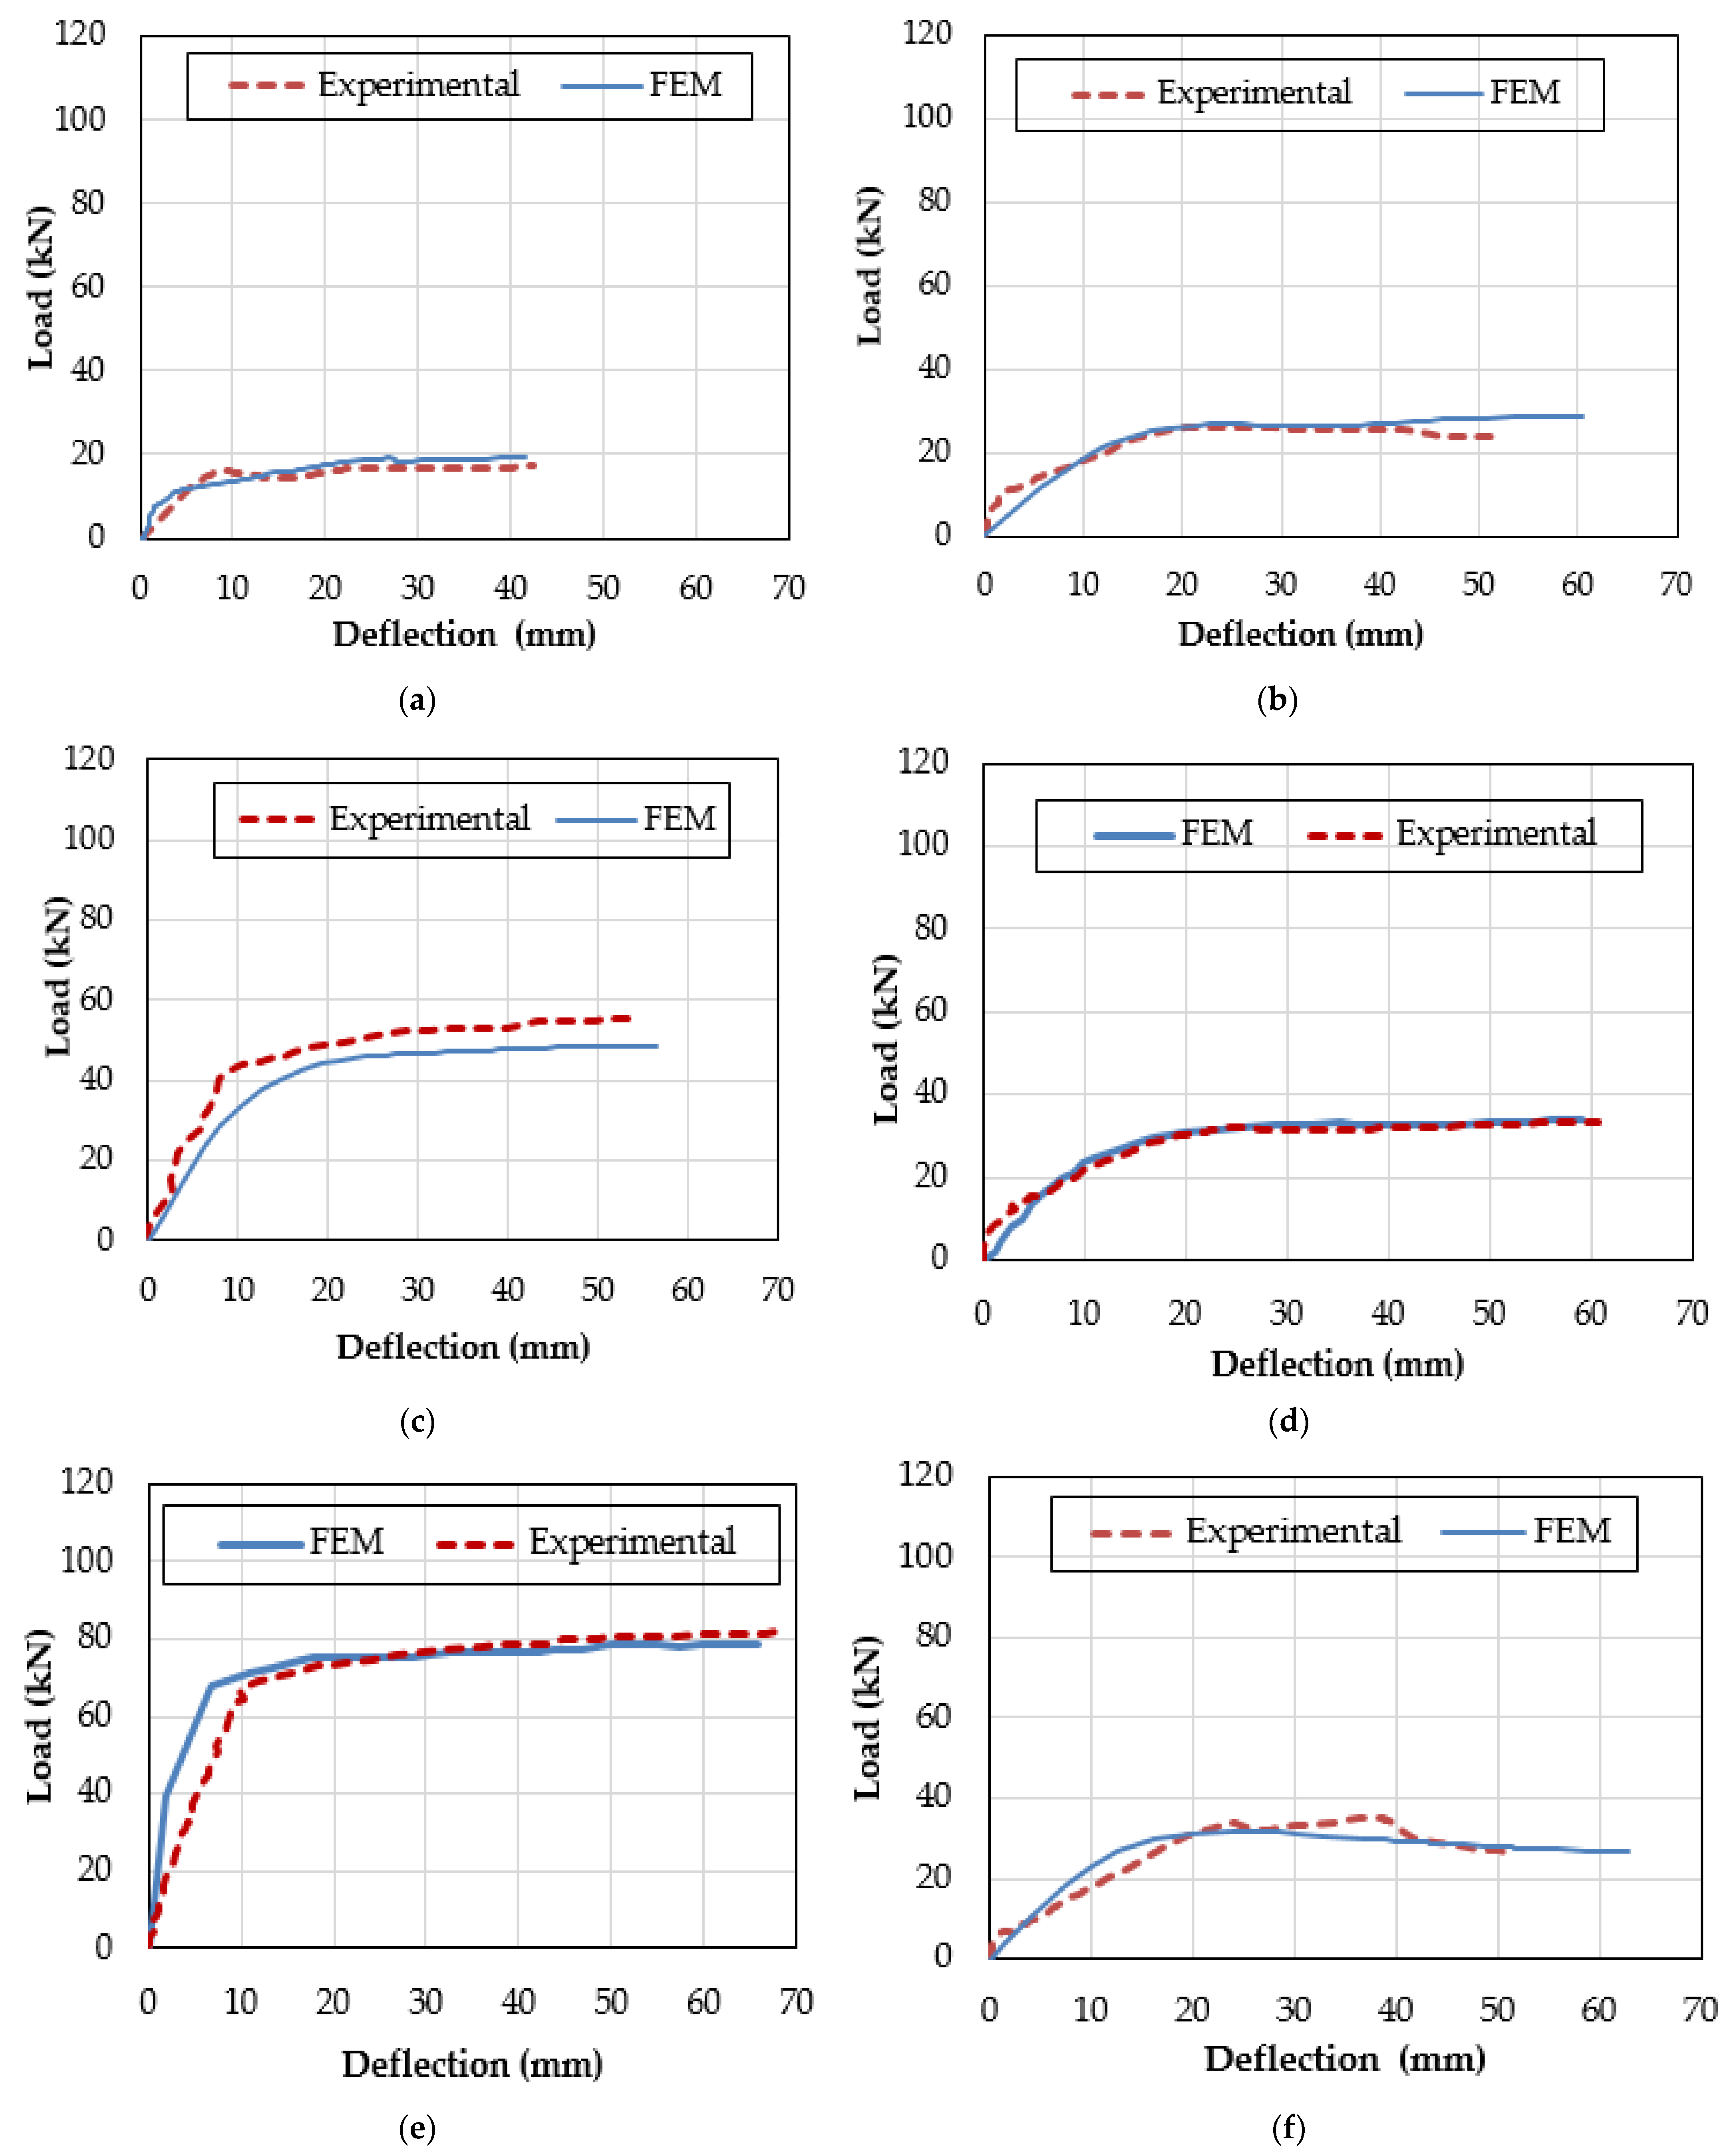
where x ^ a   denotes a numerical value, S.D is the experimental data standard deviation, N denotes the quantity of data values, x a denotes the experimentally acquired data value, P c denotes the Pearson’s correlation coefficient, x m e a n denotes the experimental mean value, and S . D ^   is the standard deviation of numerical data. ABAQUS was used to validate six FEM models for the beam features illustrated in Figure 1. The deflection was measured at the tip of the cantilever. Figure 3 illustrates the outcomes of load deflection curves. The results indicated that steel had a greater load capacity than GFRP except for the diameter size (8 mm), which was attributed to the better bond strength of GFRP bars in small diameters when compared to steel. As the diameter increases the bond strength decreases [40]. Moreover, steel exhibits a greater increase than GFRP as the load increases due to the low stiffness and modulus of elasticity of GFRP. The results of R2, KGE, md, and NSE for all beams are presented in Table 4. The outcomes revealed good concordance between experimental and numerical findings.

3. Parametric Study and Results

The study includes examining the flexural behavior and fracture propagation of beams using various FRP types and comparing them with those of steel. Two parameters were studied: the bar type and the reinforcement ratio. The reinforcement ratio 0.15% refers to bar diameter 6 mm, 0.27% refers to 8 mm, 0.42% refers to 10 mm, and 0.60% refers to 12 mm. These parameters were evaluated for simply supported and over hanging beams. The beam details are shown in Figure 4. The σ c of concrete was 42.5 MPa while E s   for steel reinforcement was 200 GPa. The investigation includes various FRP materials such as glass, aramid, carbon, and basalt. The reinforcement configurations for both groups are shown in Table 5. The displacement was measured at the beams’ midpoint for simple beams and at the cantilever tip for the overhanging beams.

3.1. Results of Simple Beam

The FE models for simple beams were executed. The maximum deflection was measured at the beams’ mid span. The results of the load–deflection curves are depicted in Figure 5. The results show that increasing the reinforcement ratios for FRP bars reduce the load capacity due to the loss of bond strength. This can be attributed to the type of bar surface, the surface treatments, the cross section, position and diameter of the rebar, and the concrete strength. For the steel bars, increasing the reinforcement ratios increases the loading carrying capacity. The relationship between ultimate loads and reinforcement ratio is illustrated in Figure 6. It was observed that CFRP had a higher modulus of elasticity leading to lower deflections and better stiffness of beams. The beams reinforced with AFRP showed better ductility than GFRP and BFRP.
All the beams showed the same trend for fracture behavior. The failure mode was tension failure as shown in Tables S1–S4 in the Supplementary Materials. Figure 7 shows the crack pattern for CFRP and Steel beams at 0.15% reinforcement ratio as a sample. It can be observed that the crack started at the bottom of the beams near to the maximum tension zone. The fracture energy ( G f ) was calculated as follows in Equation (19).
G f = W o A L
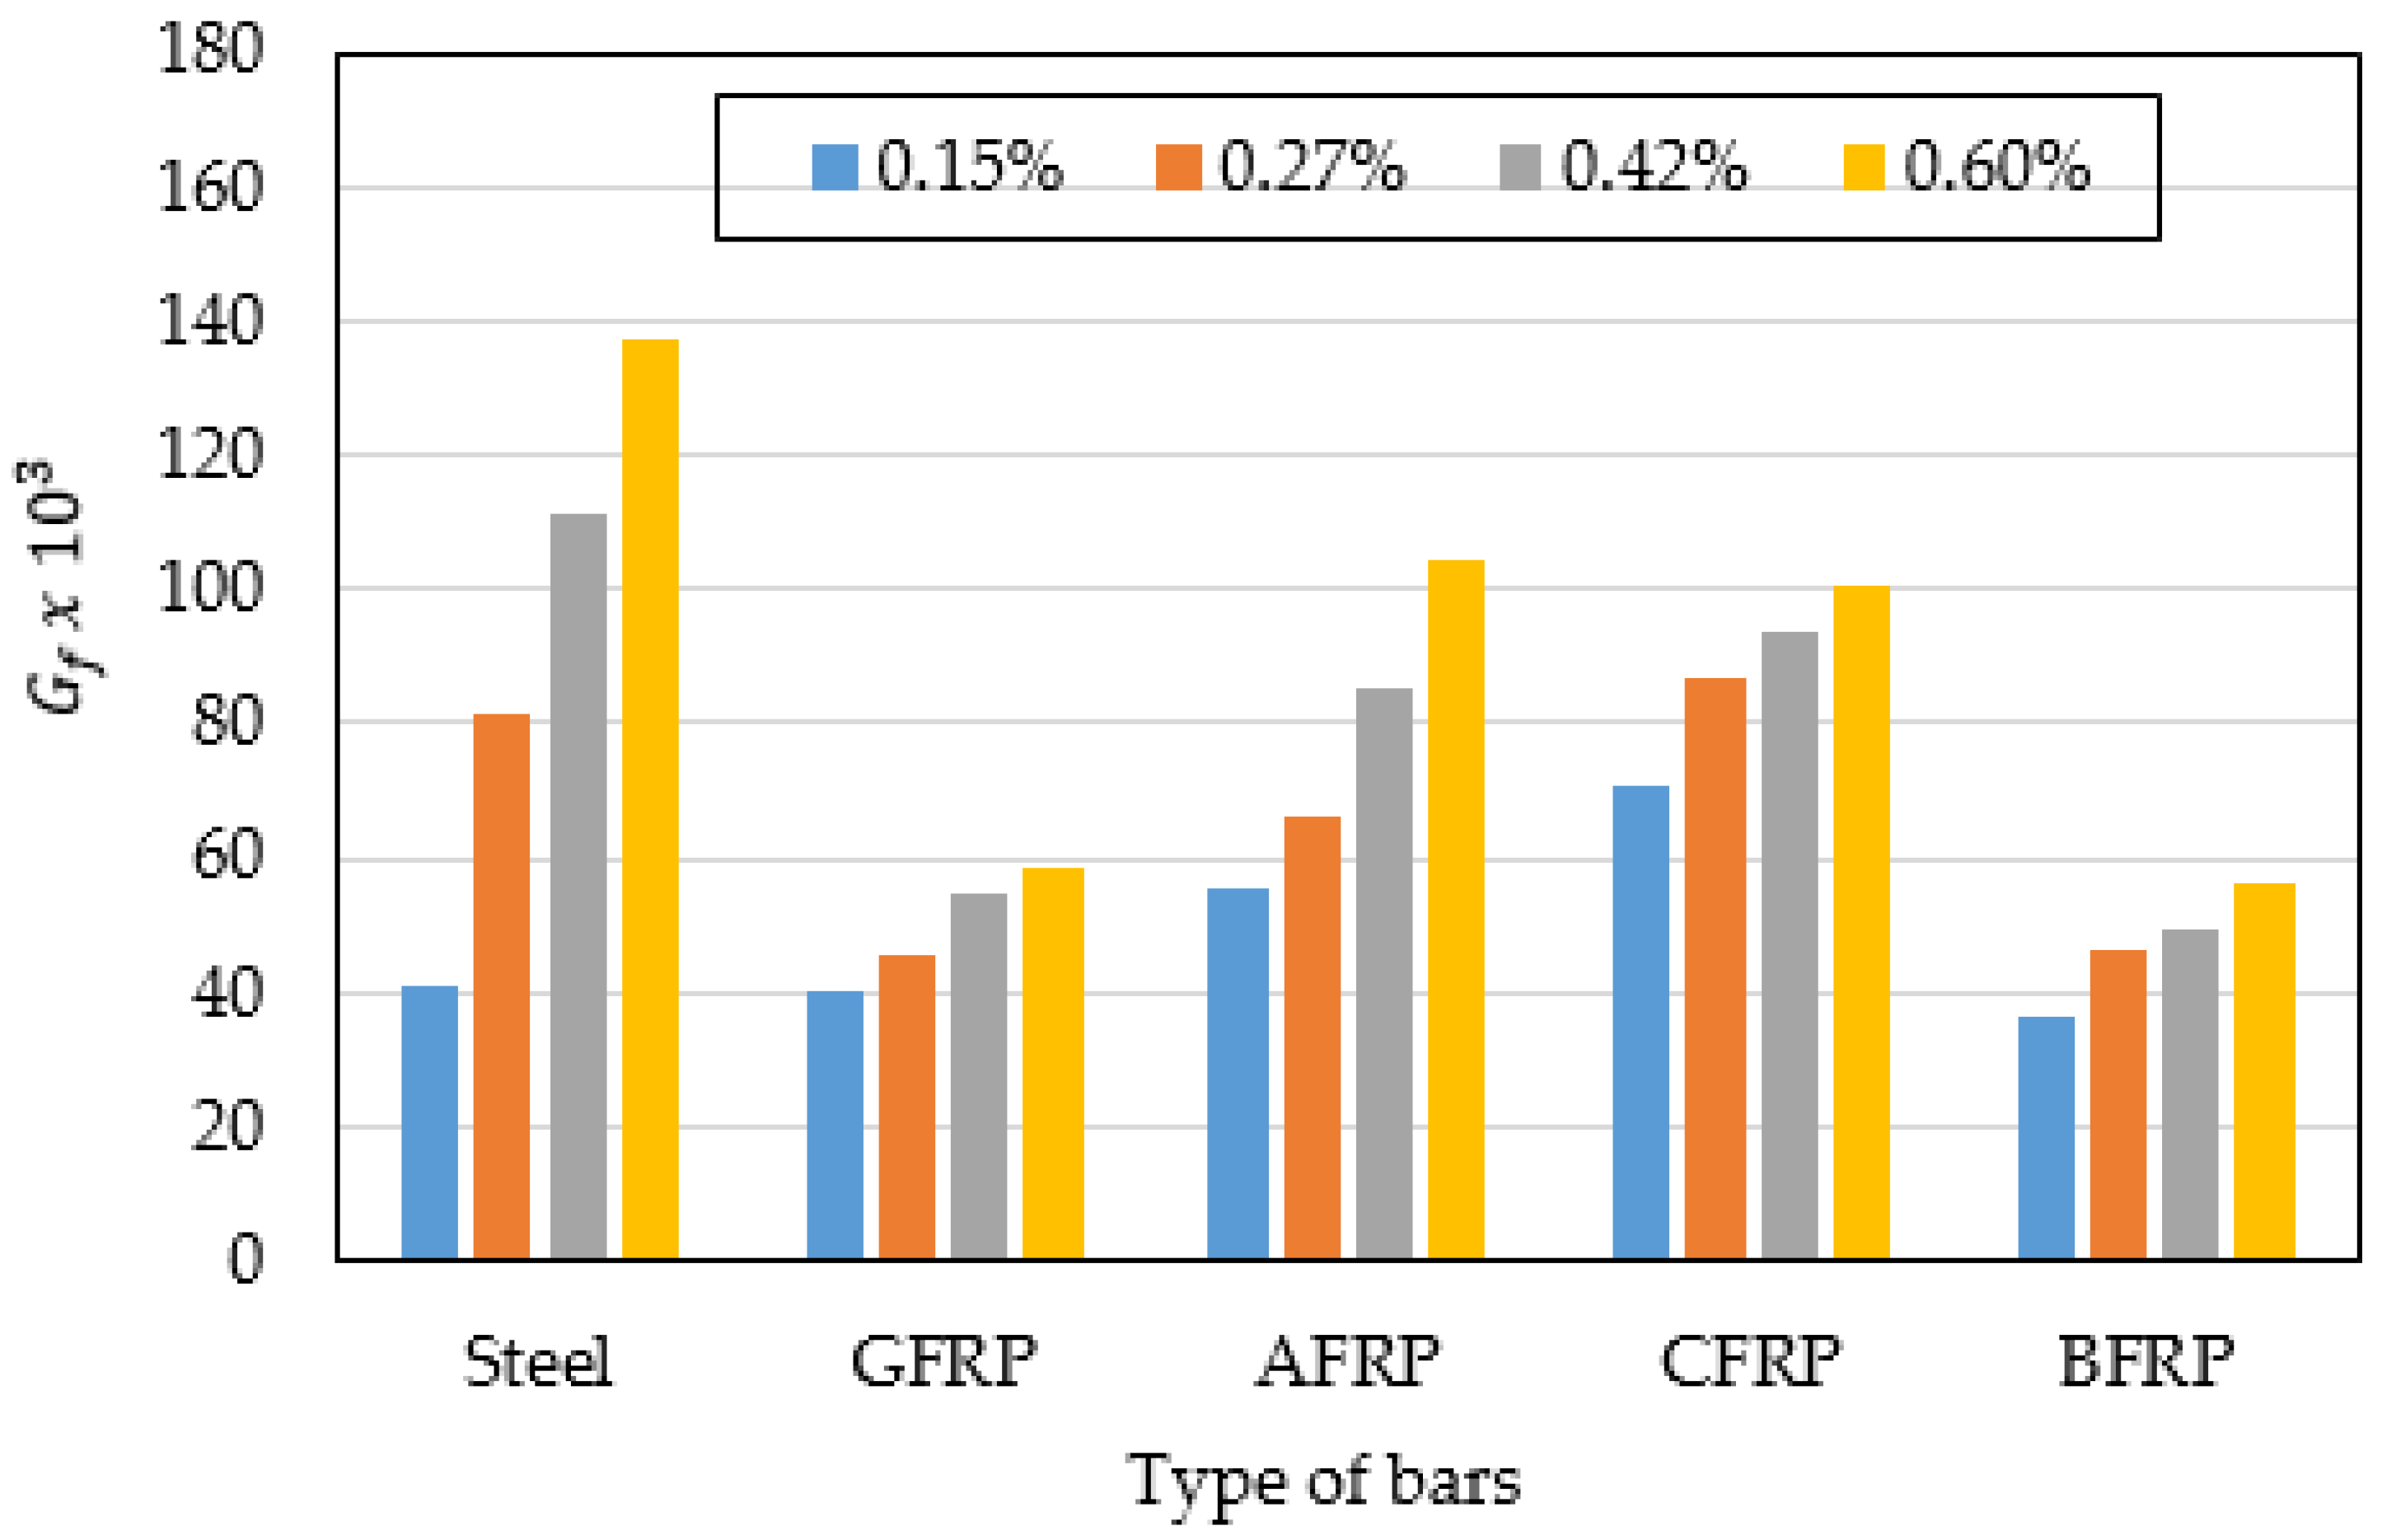
The region under the entire load deflection diagram represents the energy that the beam will absorb during failure [35]. The results of the fracture energy ( G f ) are shown in Tables S1–S4 in the Supplementary Materials. At 0.15%, the results show G f of (70,686.7 N/m) for CFRP and (40,646.7 N/m) for steel and, at 0.60%, G f   was (100,713.3 N/m) for CFRP and (137,260 N/m) for steel as shown in Figure 8. This shows a better ductility of steel bars in higher reinforcement ratios due to the bond strength enhancement.

3.2. Results of Overhanging Beams

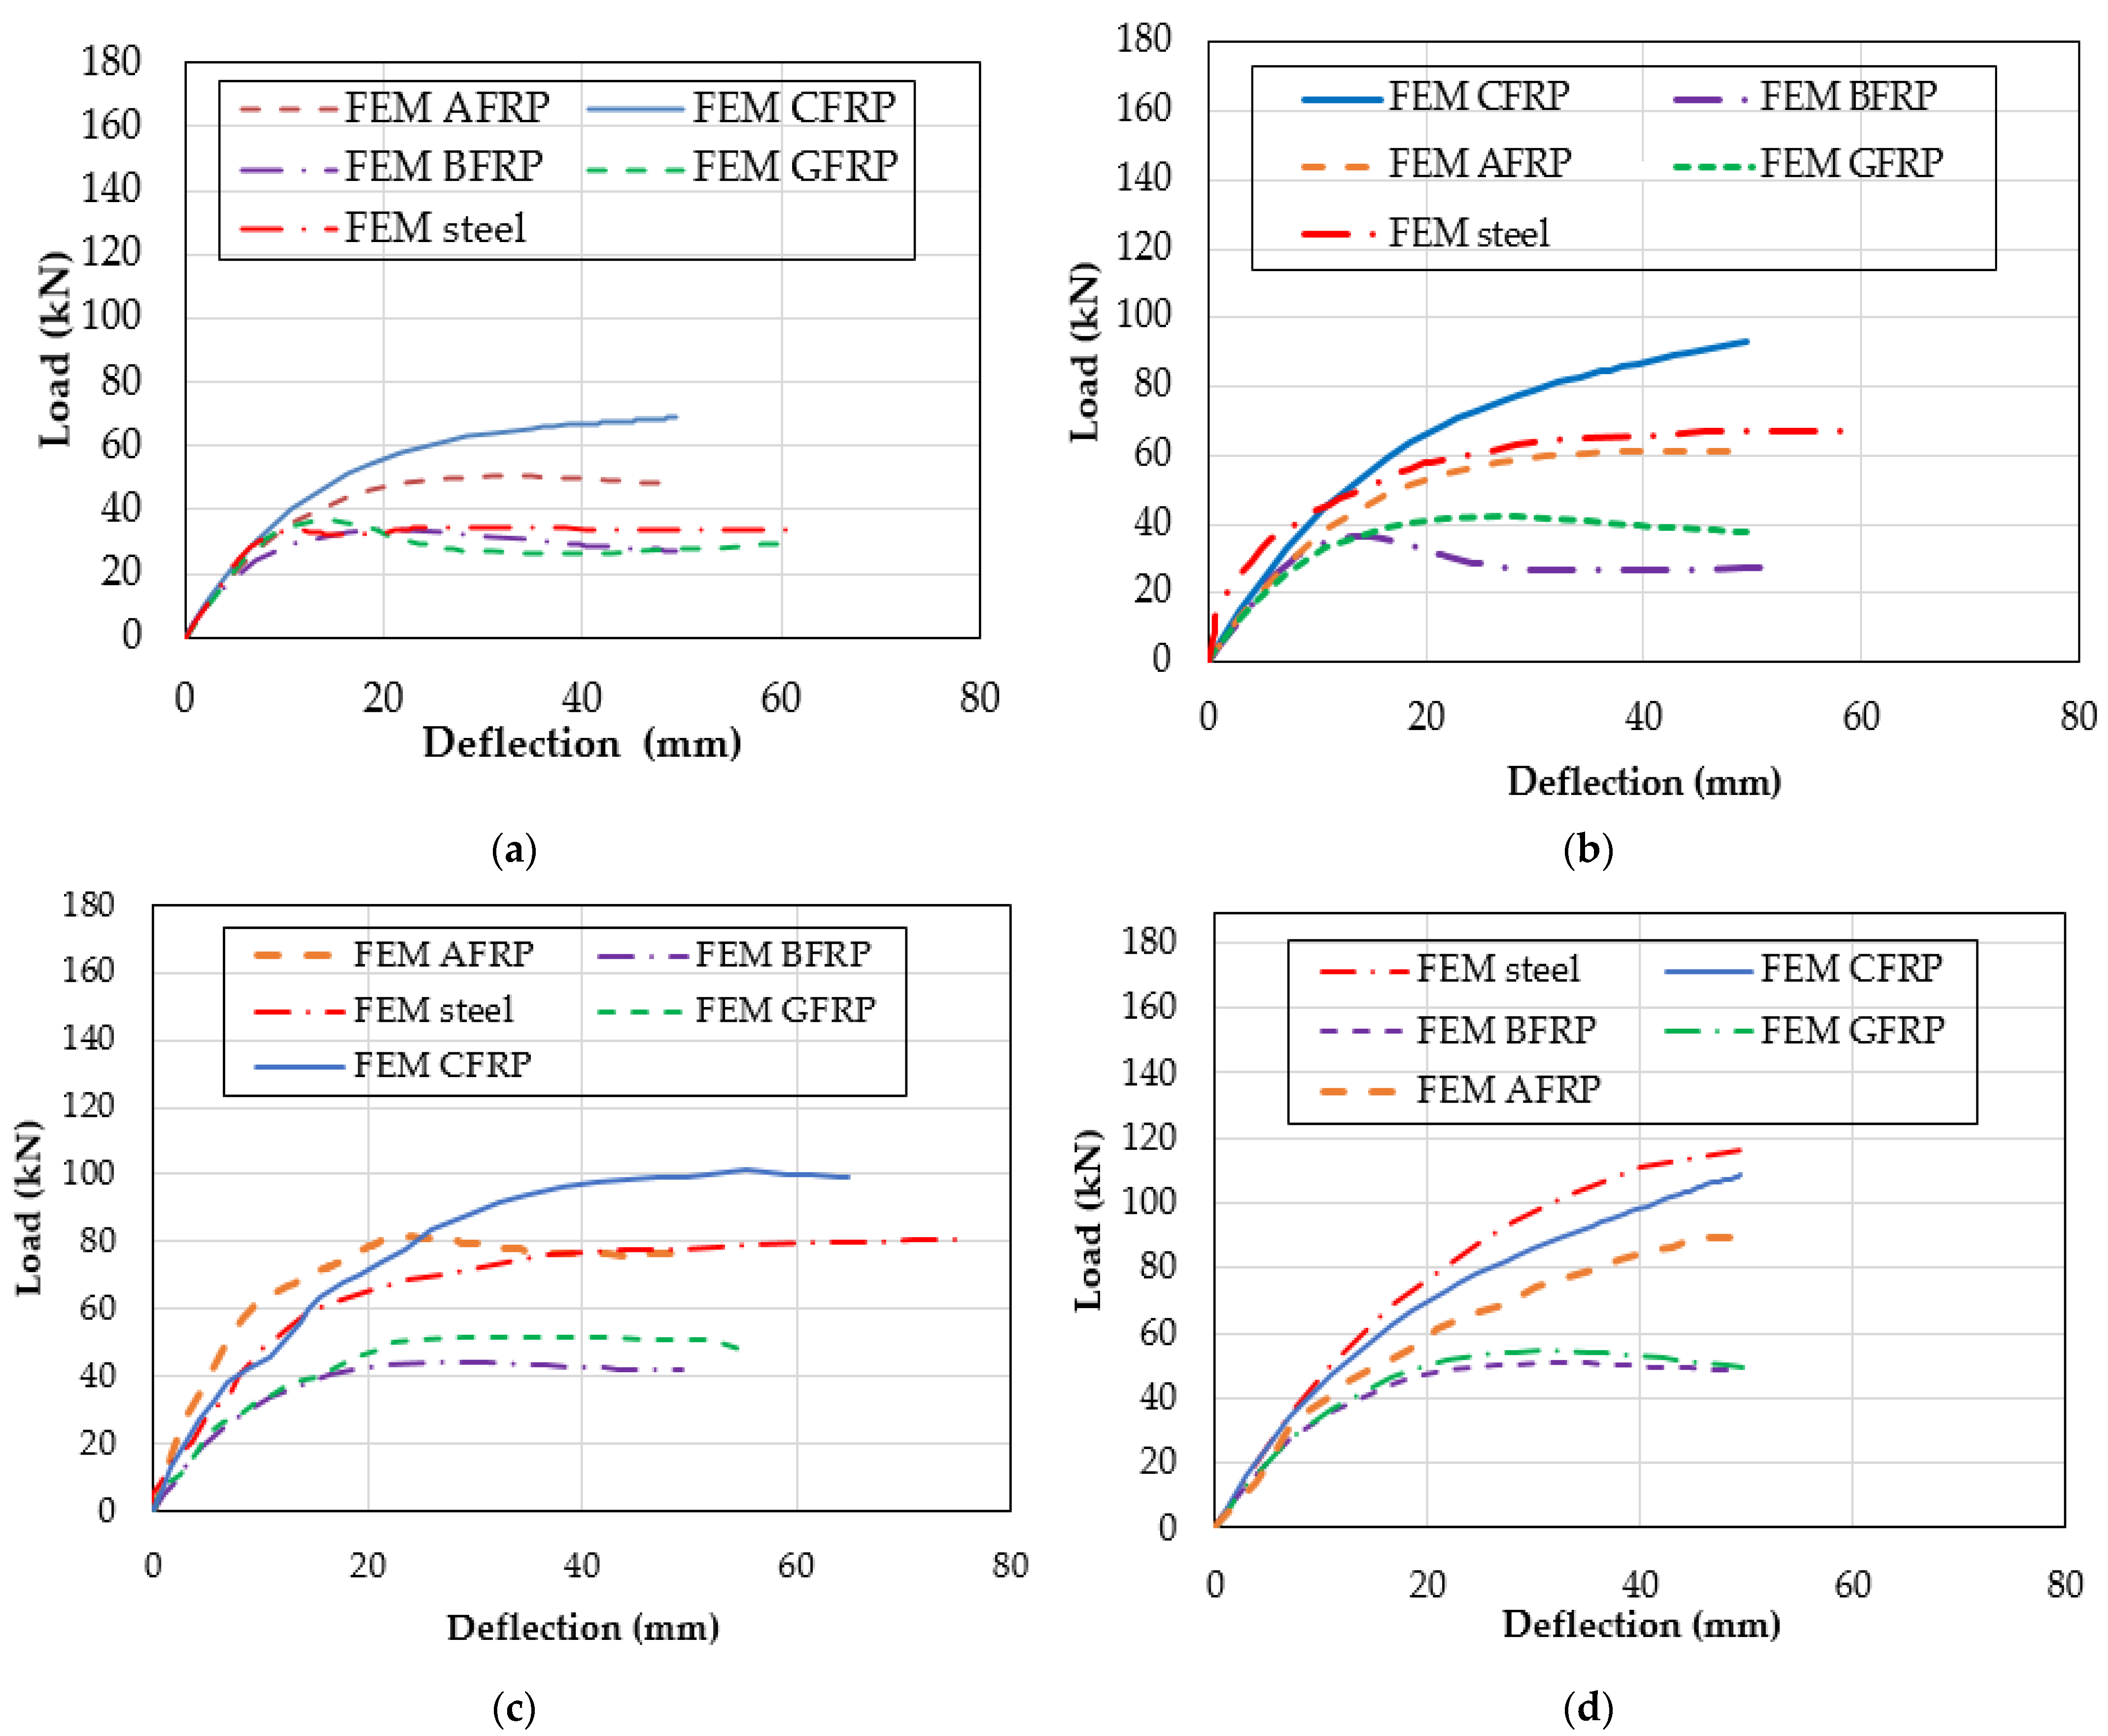
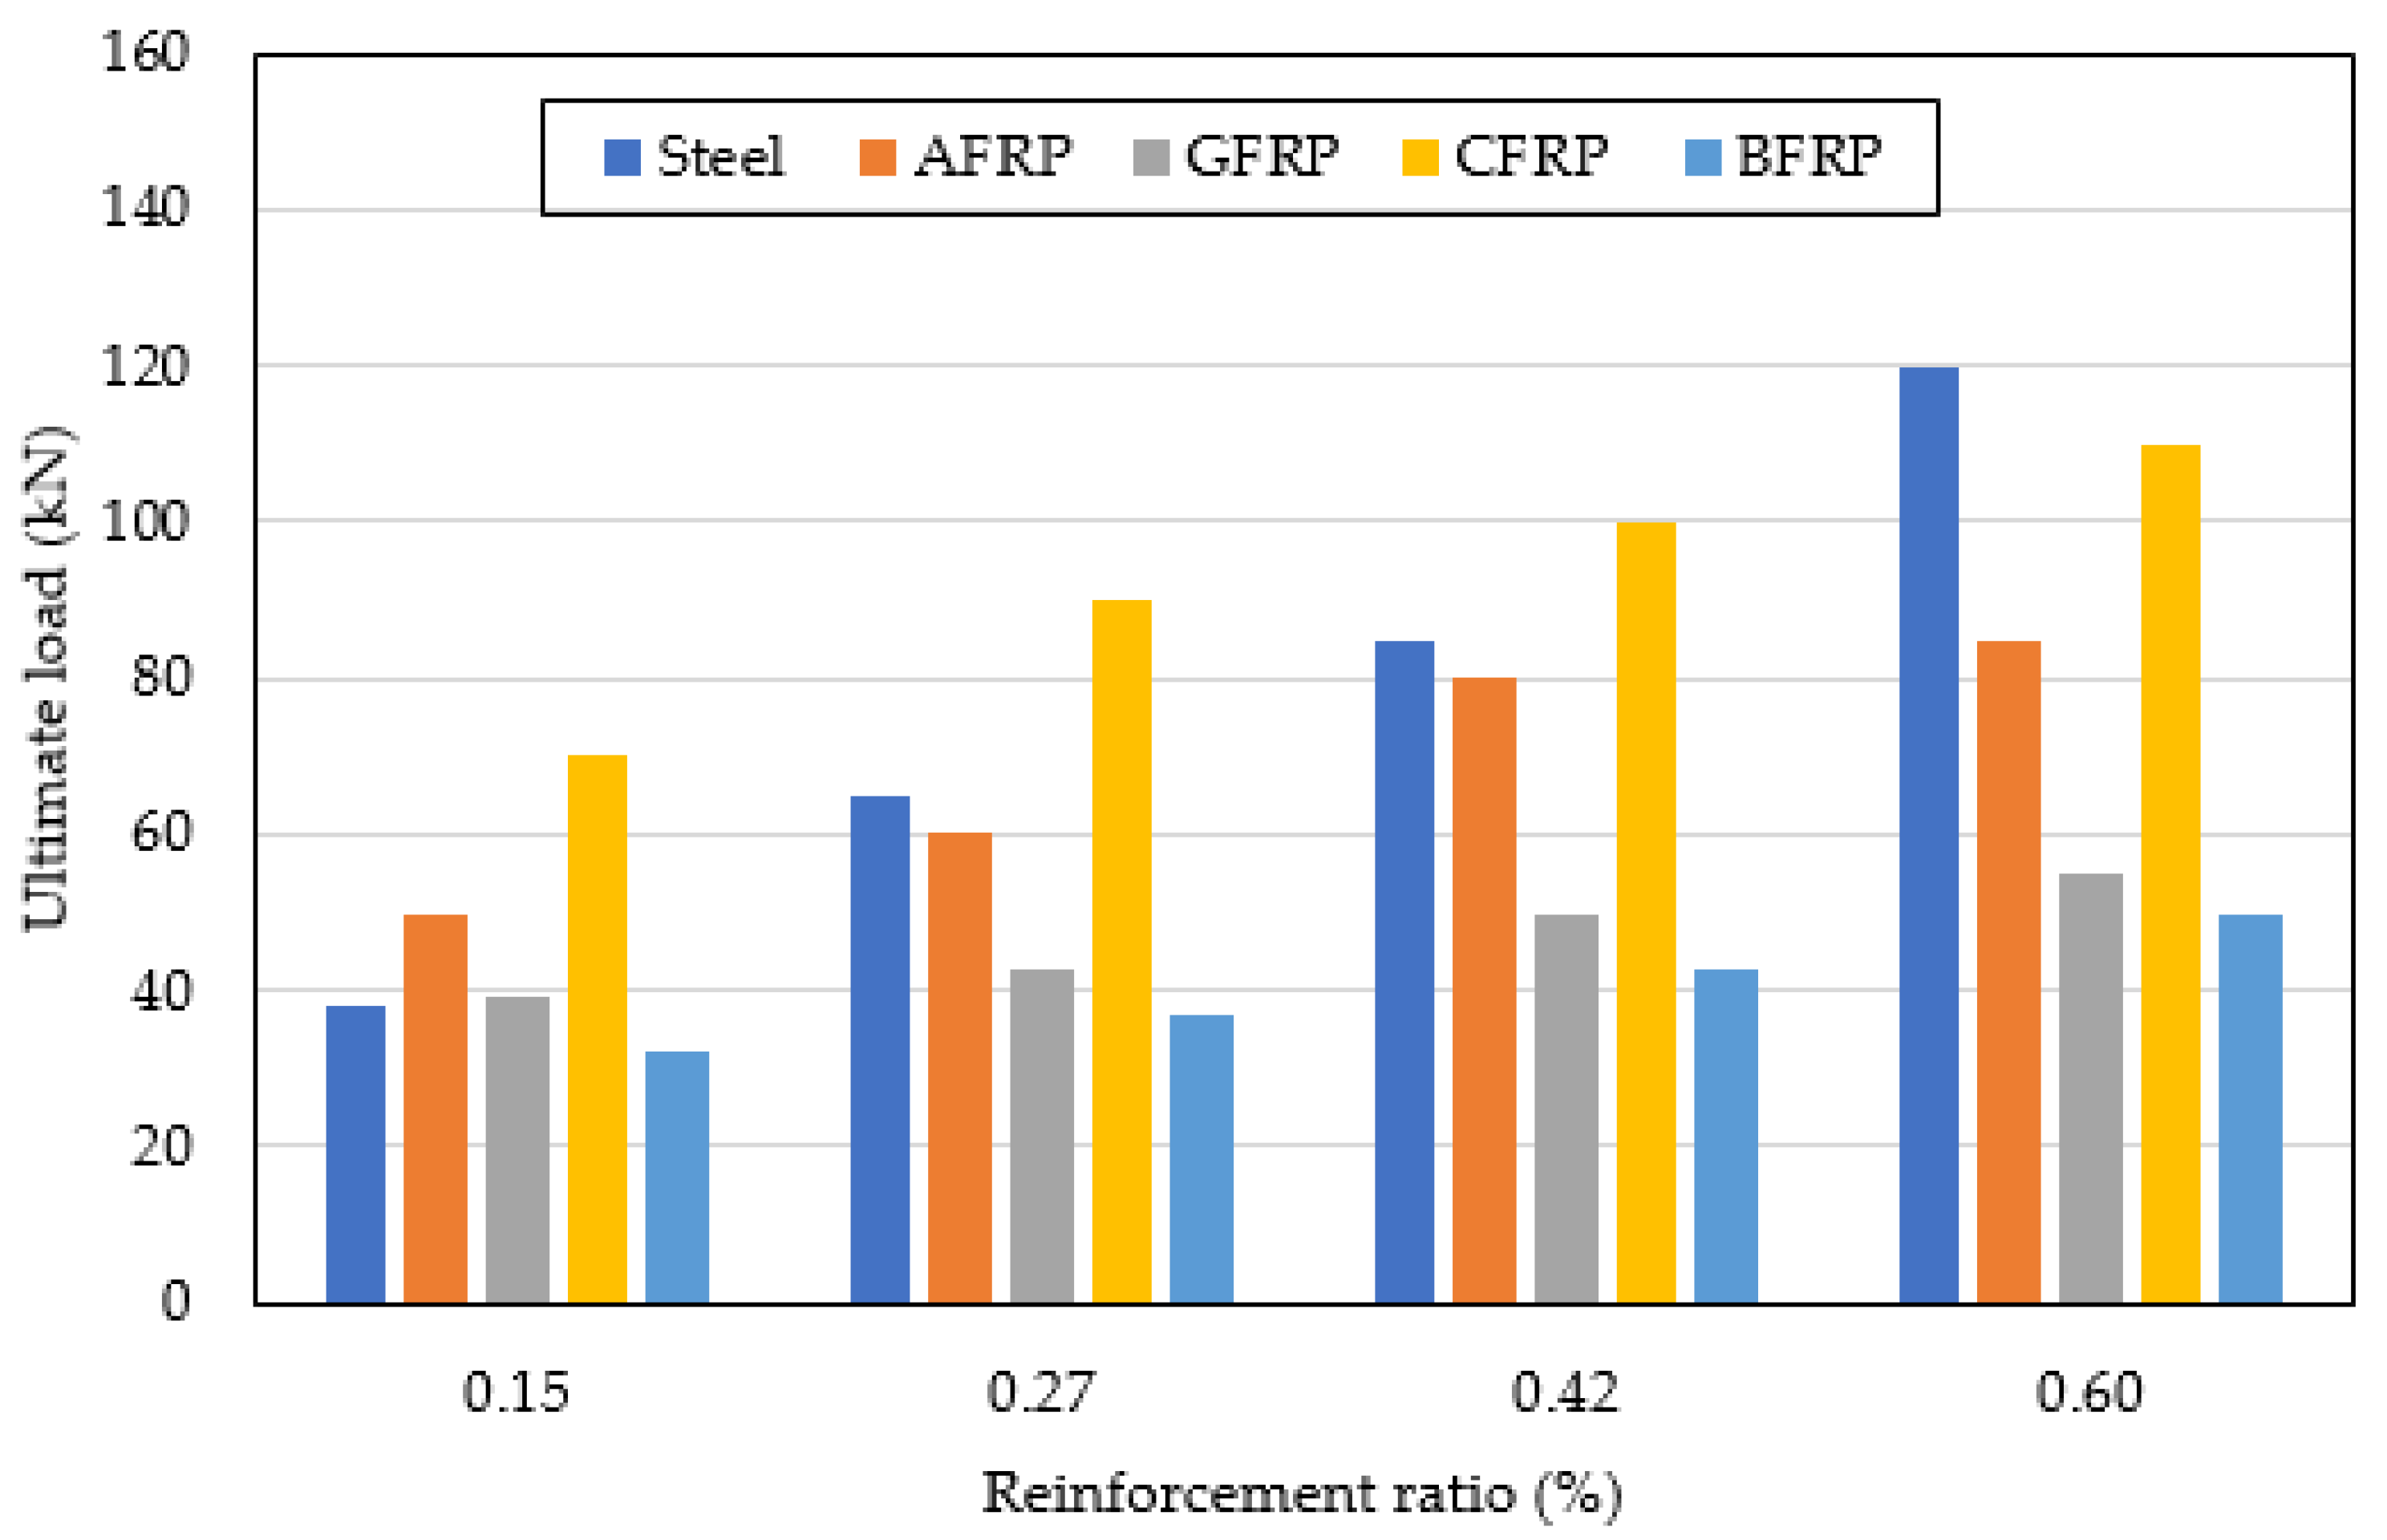
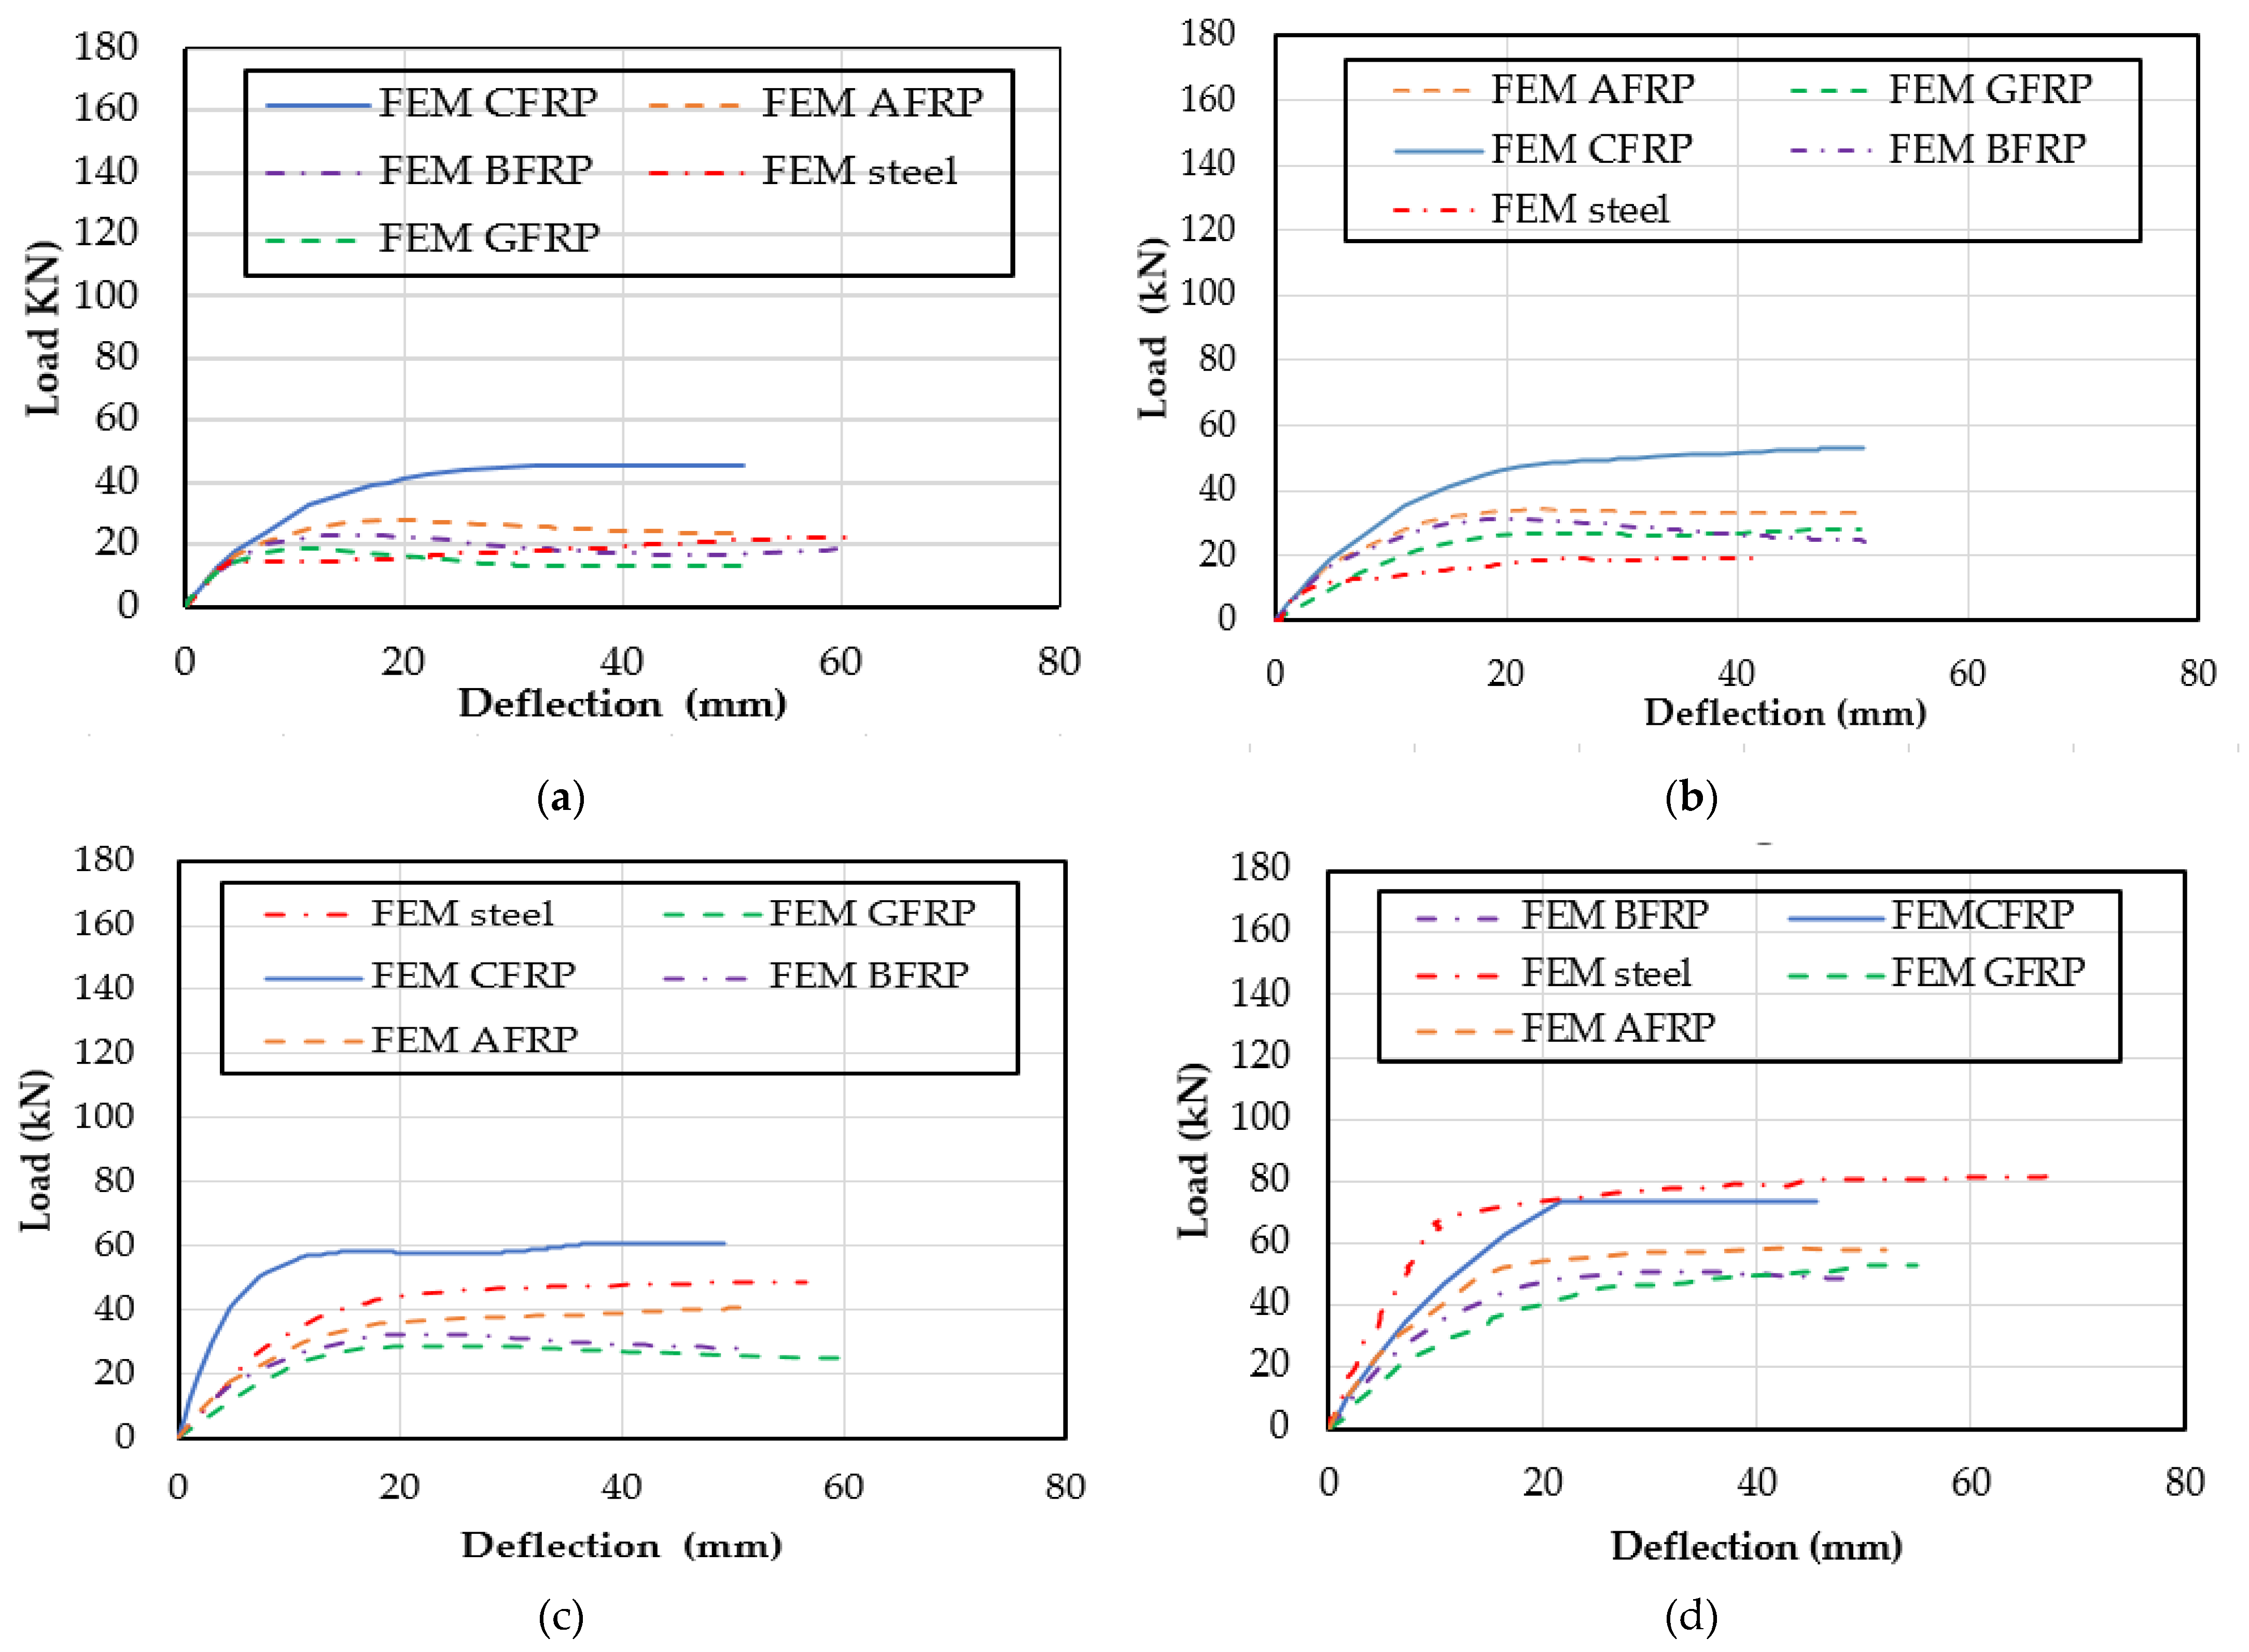
The models were executed and the maximum deflection was measured at the cantilever tip. The results of load deflection are illustrated in Figure 9. The reinforcement ratios had an effect on the stiffness of the beam. As the reinforcement ratio increases, the stiffness of the beam increases. As expected, greater deflections were obtained for the beams with lower reinforcement ratios. Furthermore, the deflections in the concrete beams reinforced with GFRP and BFRP in all the models were greater than those reinforced with steel, CFRP, and AFRP at the same load. This is due to the low stiffness and modulus of elasticity of the BFRP and GFRP bars. As a result, increasing the reinforcement ratio increases the ultimate load capacity and decreased the deflection. The relationship between the ultimate load and reinforcement ratio is illustrated in Figure 10. The figure shows that steel reaches a higher ultimate load in the larger reinforcement ratios than the FRP bar types. Moreover, CFRP shows better ductility than other FRP materials due to higher tensile strength. The beams reinforced with BFRP and GFRP had a low stiffness due to the low modulus of elasticity and, consequently, high deformations were obtained.
For the crack patterns, all the beams showed the same trend for fracture behavior. A tension failure was observed as shown in Table S5–S8 in the Supplementary Materials. At 0.15%, for steel and CFRP beams, the crack appeared at the top of the cantilever as shown in Figure 11 as a sample. The results of the fracture energy are shown in Table S5–S8 in the Supplementary Materials. It was found that the maximum load capacity is directly proportional to G f   . The results of the fracture energy were as shown in Figure 12. At 0.15%, the results of G f were (39,133.3 N/m) for CFRP and (14,666 N/m) for steel and, at 0.60% G f   , were (77,740 N/m) for CFRP and (89,253.3 N/m) for steel. It was observed that, as the reinforcement ratio increases, the fracture energy increases.

4. Conclusions

In this paper, FE models were developed to investigate the flexural behavior of steel- and FRP-reinforced concrete beams. Forty simply supported and overhanging beams were simulated using ABAQUS. CDP was employed to express the inelastic responses of concrete. The load–deflection curves, crack propagations, and fracture energy were attained for each beam. The findings showed that:
The FEM results of overhanging beams were validated using four statistical indicators and they showed good agreement with the experimental results in the literature.
The CFRP bars could withstand higher load than steel bars by 29% and 33% for simple and overhanging beams, respectively. Furthermore, CFRP could absorb greater fracture energy than steel by 22% and 40% for simple overhanging beams, respectively. Hence, CFRP can be an effective alternative to steel.
As the reinforcement ratio increases, CFRP showed greater load carrying capacity than other FRP types. For simple beams, the load capacity for CFRP bars increased by 80% more than GFRP, 37.5% more than AFRP, and 120% more than BFRP. Similarly, for overhanging beams, CFRP had a 130% greater load than GFRP, 50% than AFRP, and 87.5% than BFRP. This enhancement in the load capacity is attributed to higher stiffness, tensile strength, and their modulus of elasticity compared to other FRP types.
As the reinforcement ratio increases, the increase in the ultimate load capacity for GFRP and BFRP bars was insignificant due to the low modulus of elasticity compared to other FRP types.
As the bar diameter increases, the bond strength for FRP bars decreases. Thus, all the FRP types could be considered alternatives to steel when low bars sizes are utilized.
The results obtained from the current study showed that CFRP is an adequate alternative to steel, especially at low reinforcement ratios. Interestingly, the stiffness of beams with CFRP bars was quite near to the reinforced concrete beams. The deflections of BFRP and GFRP beams were typically more significant due to the low elastic modulus and various bond properties. For future research, examining the bond behavior of FRP bars is recommended. Moreover, researchers could explore advanced methods to deal with the brittle behavior of FRP bars and examine the shear behavior of beams using various FRP types. Finally, we recommend including the cost estimation for concrete beams reinforced with FRP bars in future comparative studies.

Supplementary Materials

The following supporting information can be downloaded at: https://www.mdpi.com/article/10.3390/buildings13020374/s1. Table S1. Ultimate load, fracture energy and crack pattern for simple beams with ratio 0.15% reinforcement ratio. Table S2. Ultimate load, fracture energy and crack pattern for simple beams with 0.27% reinforcement ratio. Table S3. Ultimate load, fracture energy and crack pattern for simple beams with 0.42% reinforcement ratio. Table S4. Ultimate load, fracture energy and crack pattern for simple beams with 0.60% reinforcement ratio. Table S5. Ultimate load, fracture energy and crack pattern for overhanging beam with 0.15% reinforcement ratio. Table S6. Ultimate load, fracture energy and crack pattern for overhanging beam with 0.27% reinforcement ratio. Table S7. Ultimate load, fracture energy and crack pattern for overhanging beam with 0.42% reinforcement ratio. Table S8. Ultimate load, fracture energy and crack pattern for overhanging beam with 0.60% reinforcement ratio.

Author Contributions

Conceptualization, N.K.S.A., S.Y.M. and N.H.A.; methodology, N.K.S.A., S.Y.M. and N.H.A.; Software, N.K.S.A. and S.Y.M.; investigation, N.K.S.A., S.Y.M. and N.H.A.; data curation, N.K.S.A. and S.Y.M.; original draft preparation—writing, N.K.S.A., S.Y.M. and N.H.A.; review and editing—writing, N.K.S.A., S.Y.M. and N.H.A.; visualization, N.K.S.A., S.Y.M. and N.H.A.; supervision, N.H.A. and S.Y.M.; project administration, N.H.A. and S.Y.M.; funding acquisition, N.K.S.A. All authors have read and agreed to the published version of the manuscript.

Funding

This research received no external funding.

Institutional Review Board Statement

None applicable.

Informed Consent Statement

None applicable.

Data Availability Statement

Upon reasonable request, the FE data used to support the study’s conclusions are available.

Acknowledgments

We acknowledge the technical support and encouragement of Eng. Ahmed Bahgat Tawfik and Eng. Mohammed Rady Ewis Deif.

Conflicts of Interest

The authors declare no conflict of interest.

References

  1. Rady, M.; Mahfouz, S.Y. Effects of Concrete Grades and Column Spacings on the Optimal Design of Reinforced Concrete Buildings. Materials 2022, 15, 4290. [Google Scholar] [CrossRef] [PubMed]
  2. Rady, M.; Mahfouz, S.Y.; Taher, S.E. Optimal Design of Reinforced Concrete Materials in Construction. Materials 2022, 15, 2625. [Google Scholar] [CrossRef]
  3. Aidy, A.; Rady, M.; Mashhour, I.M.; Mahfouz, S.Y. Structural Design Optimization of Flat Slab Hospital Buildings Using Genetic Algorithms. Buildings 2022, 12, 2195. [Google Scholar] [CrossRef]
  4. Benmokrane, B.; Theriault, M.; Masmoudi, R.; Rizkalla, S. Effect of Reinforcement Ratio on Concrete Members Reinforced with FRP Bars. In Proceedings of the International SAMPE Symposium and Exhibition, Anaheim, CA, USA, 4–8 May 1997; SAMPE: Diamond Bar, CA, USA, 1997; Volume 42, pp. 87–98. [Google Scholar]
  5. Mustafa, S.A.A.; Hassan, H.A. Behavior of Concrete Beams Reinforced with Hybrid Steel and FRP Composites. HBRC J. 2018, 14, 300–308. [Google Scholar] [CrossRef]
  6. Thamrin, R.; Kaku, T. Bond Behavior of CFRP Bars in Simply Supported Reinforced Concrete Beam with Hanging Region. J. Compos. Constr. 2007, 11, 129–137. [Google Scholar] [CrossRef]
  7. Bank, L.C. Composites for Construction: Structural Design with FRP Materials; John Wiley & Sons: Hoboken, NJ, USA, 2006; p. 560. [Google Scholar]
  8. Yue, Q.; Yang, Y. Overview of durability research on fiber reinforced composite strengthened structures. J. Build. Struct. 2009, 30, 8–15. [Google Scholar]
  9. Elgabbas, F.M. Development and Structural Testing of New Basalt Fiber-Reinforced-Polymer (Bfrp) Bars in Rc Beams and Bridge-Deck Slabs. Ph.D. Thesis, Université de Sherbrooke, Sherbrooke, QC, Canada, 2016. [Google Scholar]
  10. Panahi, M.; Izadinia, M. A Parametric Study on the Flexural Strengthening of Reinforced Concrete Beams with Near Surface Mounted FRP Bars. Civ. Eng. J. 2018, 4, 1917. [Google Scholar] [CrossRef] [Green Version]
  11. Sun, W.; Chen, H.; Luo, X.; Qian, H. The effectofhybrid fibers and expansive agent on the shrinkage and permeability ofhigh-performance concrete. Cem. Concr. Res. 2001, 31, 595–601. [Google Scholar] [CrossRef]
  12. Chung, D.D.L. Cement reinforcedwithshort carbonfibers:a multifunctional material. Compos. Part B Eng. 2000, 31, 511–526. [Google Scholar] [CrossRef]
  13. Kwon, H.; Ferron, R.P.; Akkaya, Y.; Shah, S.P. Cracking of fiber-reinforced self-compacting concrete due to restrained shrinkage. Int. J. Concr. Struct. Mater. 2007, 1, 3–9. [Google Scholar]
  14. Tejaswini, T.; Raju, M.V.R. Analysis of RCC Beams Using ABAQUS. Int. J. Innov. Eng. Technol. Anal. 2015, 5, 248–255. [Google Scholar]
  15. Mohammed, R.S.; Fangyuan, Z. Numerical Investigation of the Behavior of Reinforced Concrete Beam Reinforced with FRP Bars11. Civ. Eng. J. 2019, 5, 2296–2308. [Google Scholar] [CrossRef]
  16. Al Hasani, S.; A., N.H.; Abdulraeg, A.A. Numerical Study of Reinforced Concrete Beam by Using ABAQUS Software. Int. J. Innov. Technol. Interdiscip. Sci. 2021, 4, 733–741. [Google Scholar]
  17. Shirmardi, M.; Mohammadizadeh, M. Numerical Study on the Flexural Behavior of Concrete Beams Reinfroced by GFRP Bars. J. Rehabil. Civ. Eng. 2019, 4, 88–99. [Google Scholar] [CrossRef]
  18. Shanour, A.S.; Adam, M.; Mahmoud, A.; Said, M. Experimental Investigation of Concrete Beams Reinforced with Gfrp Bars. Int. J. Civ. Eng. Technol. 2014, 5, 154–164. [Google Scholar]
  19. Krasniqi, C.; Kabashi, N.; Krasniqi, E.; Kaqi, V. Comparison of the Behavior of GFRP Reinforced Concrete Beams with Conventional Steel Bars. Pollack Period. 2018, 13, 141–150. [Google Scholar] [CrossRef]
  20. Sirimontree, S.; Keawsawasvong, S.; Thongchom, C. Flexural Behavior of Concrete Beam Reinforced with GFRP Bars Compared to Concrete Beam Reinforced with Conventional Steel Reinforcements. J. Appl. Sci. Eng. 2021, 24, 883–890. [Google Scholar] [CrossRef]
  21. Arivalagan, S. Engineering Performance of Concrete Beams Reinforced with GFRP Bars and Stainless Steel. Glob. J. Res. Eng. 2012, 12, 35–40. [Google Scholar]
  22. Saraswathy, T.; Dhanalakshmi, K. Investigation of Flexural Behaviour of RCC Beams Using GFRP Bars. Int. J. Sci. Eng. Res. 2014, 5, 333–338. [Google Scholar]
  23. Murugan, R.; Kumaran, G. Experiment on Rc Beams Reinforced with Glass Fibre Reinforced Polymer Reinforcements. Int. J. Innov. Technol. Explor. Eng. 2019, 8, 3541. [Google Scholar] [CrossRef]
  24. Hamdy, G.A.; Arafa, D.F. Experimental Investigation Of Concrete Beams Reinforced With Basalt FRP Bars. J. Eng. 2021, 4, 154–167. [Google Scholar] [CrossRef]
  25. Zhang, L.; Sun, Y.; Xiong, W. Experimental study on the flexural deflections of concrete beam reinforced with Basalt FRP bars. Mater. Struct. Mater. Constr. 2015, 48, 3279–3293. [Google Scholar] [CrossRef]
  26. Ashour, A.F.; Habeeb, M.N. Continuous concrete beams reinforced with CFRP bars. Struct. Build. 2008, 161, 349–357. [Google Scholar] [CrossRef] [Green Version]
  27. Mashrei, M.A.; Makki, J.S.; Sultan, A.A. Flexural Strengthening of Reinforced Concrete Beams Using Carbon Fiber Reinforced Polymer (CFRP) Sheets with Grooves. Lat. Am. J. Solids Struct. 2019, 16, 1–13. [Google Scholar] [CrossRef] [Green Version]
  28. Ahmed, E.; Sobuz, H.R.; Sutan, N.M. Flexural Performance of CFRP Strengthened RC Beams with Different Degrees of Strengthening Schemes. Int. J. Phys. Sci. 2011, 6, 2229–2238. [Google Scholar]
  29. Soudki, K.; El-Salakawy, E.; Craig, B. Behavior of CFRP Strengthened Reinforced Concrete Beams in Corrosive Environment. J. Compos. Constr. 2007, 11, 291–298. [Google Scholar] [CrossRef] [Green Version]
  30. Esfahani, M.R.; Kianoush, M.R.; Tajari, A.R. Flexural behaviour of reinforced concrete beams strengthened by CFRP sheets. Eng. Struct. 2007, 29, 2428–2444. [Google Scholar] [CrossRef]
  31. Issa, M.S.; Elzeiny, S.M. Flexural Behavior of Cantilever Concrete Beams Reinforced with Glass Fiber Reinforced Polymers (GFRP) Bars. J. Civ. Eng. Constr. Technol. 2011, 2, 33–44. [Google Scholar]
  32. Hsu, L.S.; Hsu, C.-T. Complete stress—Strain behavior of high-strength concrete under compression. Mag. Concr. Res. 1994, 46, 301–312. [Google Scholar] [CrossRef]
  33. Nayal, R.; Rasheed, H.A. Tension Stiffening Model for Concrete Beams Reinforced with Steel and FRP Bars. J. Mater. Civ. Eng. 2006, 18, 831–841. [Google Scholar] [CrossRef]
  34. Gilbert, R.; Warner, R. Tension stiffening in reinforced concrete slabs. J. Struct. Div. 1978, 104, 1885–1900. [Google Scholar] [CrossRef]
  35. Tawfik, A.B.; Mahfouz, S.Y.; Taher, S.E.-D.F. Nonlinear ABAQUS Simulations for Notched Concrete Beams. Materials 2021, 14, 7349. [Google Scholar] [CrossRef] [PubMed]
  36. Abdelwahed, B.S.; Kaloop, M.R.; El-Demerdash, W.E.; Parisi, F. Nonlinear Numerical Assessment of Exterior Beam-Column Connections with Low-Strength Concrete. Buildings 2021, 11, 562. [Google Scholar] [CrossRef]
  37. Kobraei, M.; Jumaat, M.Z.; Shafigh, P. An Experimental Study on Shear Reinforcement in RC Beams Using CFRP-Bars. Sci. Res. Essays 2011, 6, 3447–3460. [Google Scholar] [CrossRef] [Green Version]
  38. Abbood, I.S.; Odaa, S.A.; Hasan, K.F.; Jasim, M.A. Properties Evaluation of Fiber Reinforced Polymers and Their Constituent Materials Used in Structures—A Review. Mater. Today Proc. 2021, 43, 1003–1008. [Google Scholar] [CrossRef]
  39. Ahmed, A. Modeling of a Reinforced Concrete Beam Subjected to Impact Vibration Using ABAQUS. Int. J. Civ. Struct. Eng. 2014, 4, 227–236. [Google Scholar] [CrossRef]
  40. Cosenza, E.; Manfredi, G.; Realfonzo, R. Bond characteristics and anchorage length of FRP rebars. In Proceedings of the 2nd International Conference on Advanced Composite Materials in Bridges and Structures (ACMBS-II), Montreal, QC, Canada, 11–14 August 1996. [Google Scholar]
Figure 1. Details of concrete beams: (a) concrete dimensions of tested beam and (b) longitudinal reinforcement configuration.
Buildings 13 00374 g001
Figure 2. Reference point and finite element meshing.
Buildings 13 00374 g002
Figure 3. The load–deflection curves for overhanging beams: (a) SN8-8; (b) GN8-8; (c) SN10-10; (d) GM10-10; (e) SN12-12; and (f) GN12-10.
Buildings 13 00374 g003
Figure 4. Details of concrete beams: (a) concrete dimensions of simple beam and (b) longitudinal reinforcement configuration.
Buildings 13 00374 g004
Figure 5. Load Deflection curves for simple beam with different reinforcement ratios: (a) 0.15%, (b) 0.27%, (c) 0.42%, and (d) 0.60%.
Buildings 13 00374 g005
Figure 6. Ultimate load vs. reinforcement ratio.
Buildings 13 00374 g006
Figure 7. Crack Pattern at 0.15% reinforcement ratio (a) Steel and (b) CFRP beams.
Buildings 13 00374 g007
Figure 8. Fracture energy vs. Type of bars.
Buildings 13 00374 g008
Figure 9. Load–deflection relationship for different reinforcement ratios: (a) 0.15%, (b) 0.27%, (c) 0.42%, and (d) 0.60%.
Buildings 13 00374 g009
Figure 10. Load vs. Reinforcement ratio.
Buildings 13 00374 g010
Figure 11. Crack pattern at 0.15% reinforcement ratio: (a) Steel and (b) CFRP beams.
Buildings 13 00374 g011
Figure 12. Fracture energy vs. Type of bars.
Buildings 13 00374 g012
Table 1. Recommended values for CDP model parameters.
CDP ParametersSymbolRecommended Values
Dilation angleΨFrom 30 ° to 45 °
EccentricityЄ0.1
Viscosity Parameterµ0.0001 to 0.008
Shape Factor K c From 0.667 to 1
Biaxial stress ratio f b o f c o From 1 to 1.16
Table 2. Steel and FRP properties.
Bar TypeYield Stress
(N/ m m 2 )
Tensile Strength
(N/ m m 2 )
Modulus of Elasticity
(kN/ m m 2 )
Allowable RangeChosen ValueAllowable RangeChosen ValueAllowable RangeChosen Value
Steel276–517450483–690500200200
GFRP----483–1600104535–5140
CFRP----600–36902900120–580300
AFRP----1720–2540250041–125100
BFRP----600–1500120050–6555
Table 3. Compressive strength of concrete and reinforcement configuration.
GroupBeamType of Longitudinal ReinforcementTop Longitudinal ReinforcementBottom Longitudinal ReinforcementCompressive Strength (MPa)
ASN 8-8Steel2Ø82Ø8
SN 10-10Steel2Ø102Ø1042.25
SN 12-12Steel2Ø122Ø12
BGN 8-8GFRP2Ø82Ø842.25
GN 12-10GFRP2Ø122Ø10
CGM 10-10GFRP2Ø102Ø1059.26
Table 4. Results of statistical indicator.
Statistical IndicatorsSN8-8SN10-10SN12-12GN8-8GN10-10GN12-10Optimal Value
NSE0.9090.8330.7430.9490.590.8741
md0.9740.9630.9370.9860.9710.9731
R0.9440.9880.7820.9710.8950.9181
KGE0.8670.8280.8620.8850.7370.8311
Table 5. Reinforcement configuration.
Type of Longitudinal BarsBeam No.Top Longitudinal
Reinforcement
Bottom Longitudinal ReinforcementReinforcement Ratio (%)Stirrups
CFRPCFRP 6-62ø62ø60.15ø 8 @ 140 mm (Steel)
CFRP 8-82ø82ø80.27
CFRP 10-102ø102ø100.42
CFRP 12-122ø122ø120.60
BFRFBFRP 6-62ø62ø60.15
BFRP 8-82ø82ø80.27
BFRP10-102ø102ø100.42
BFRP 12-122ø122ø120.60
AFRPAFRP 6-62ø62ø60.15
AFRP 8-82ø82ø80.27
AFRP 10-102ø102ø100.42
AFRP12-122ø122ø120.60
GFRPGFRP 6-62ø62ø60.15
GFRP 8-82ø82ø80.27
GFRP10-102ø102ø100.42
GFRP 12-122ø122ø120.60
SteelSteel 6-62ø62ø60.15
Steel 8-82ø82ø80.27
Steel 10-102ø102ø100.42
Steel 12-122ø122ø120.60
Disclaimer/Publisher’s Note: The statements, opinions and data contained in all publications are solely those of the individual author(s) and contributor(s) and not of MDPI and/or the editor(s). MDPI and/or the editor(s) disclaim responsibility for any injury to people or property resulting from any ideas, methods, instructions or products referred to in the content.