
Overheating Risk Analysis in Long-Term Care Homes—Development of Overheating Limit Criteria


Abstract
:1. Introduction
2. Methodology
2.1. Representative Building Models
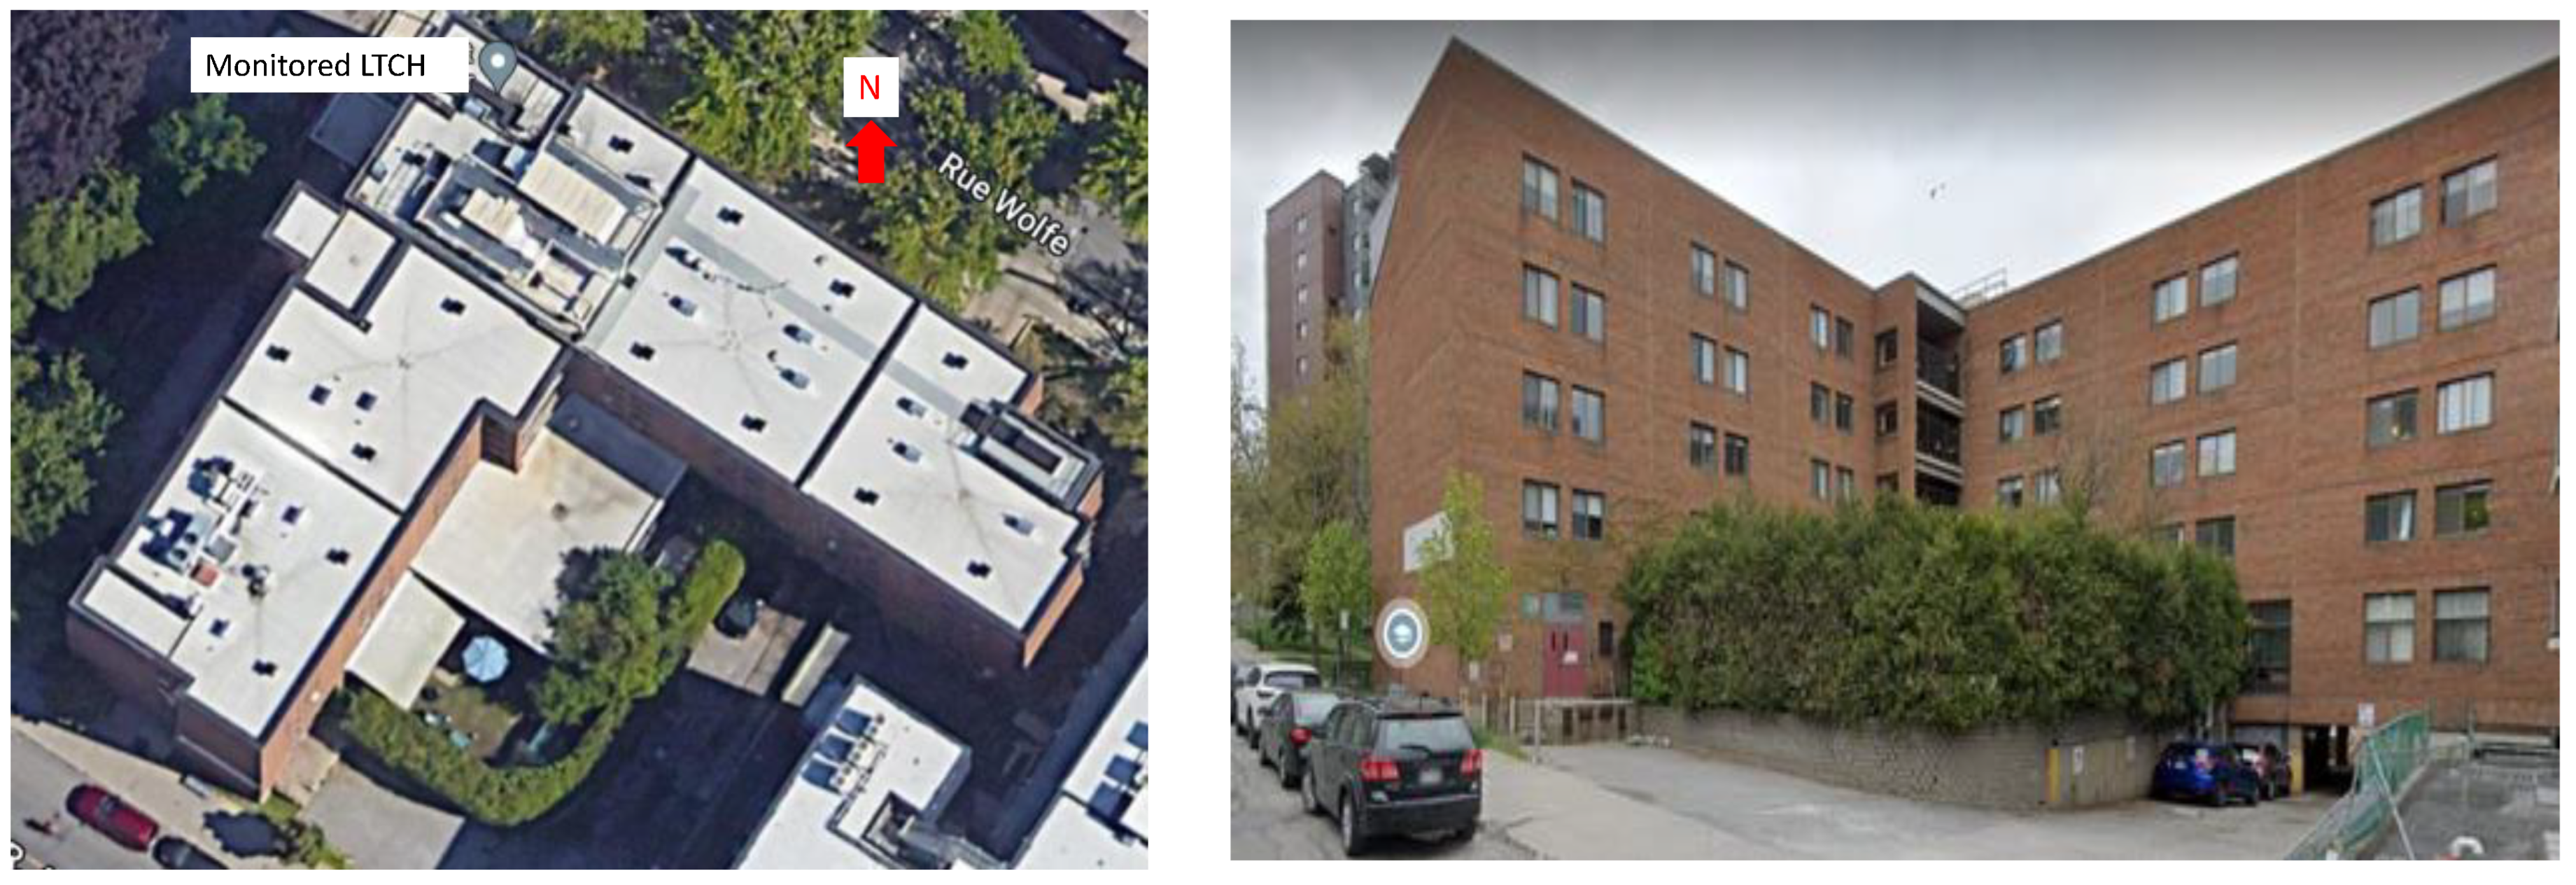
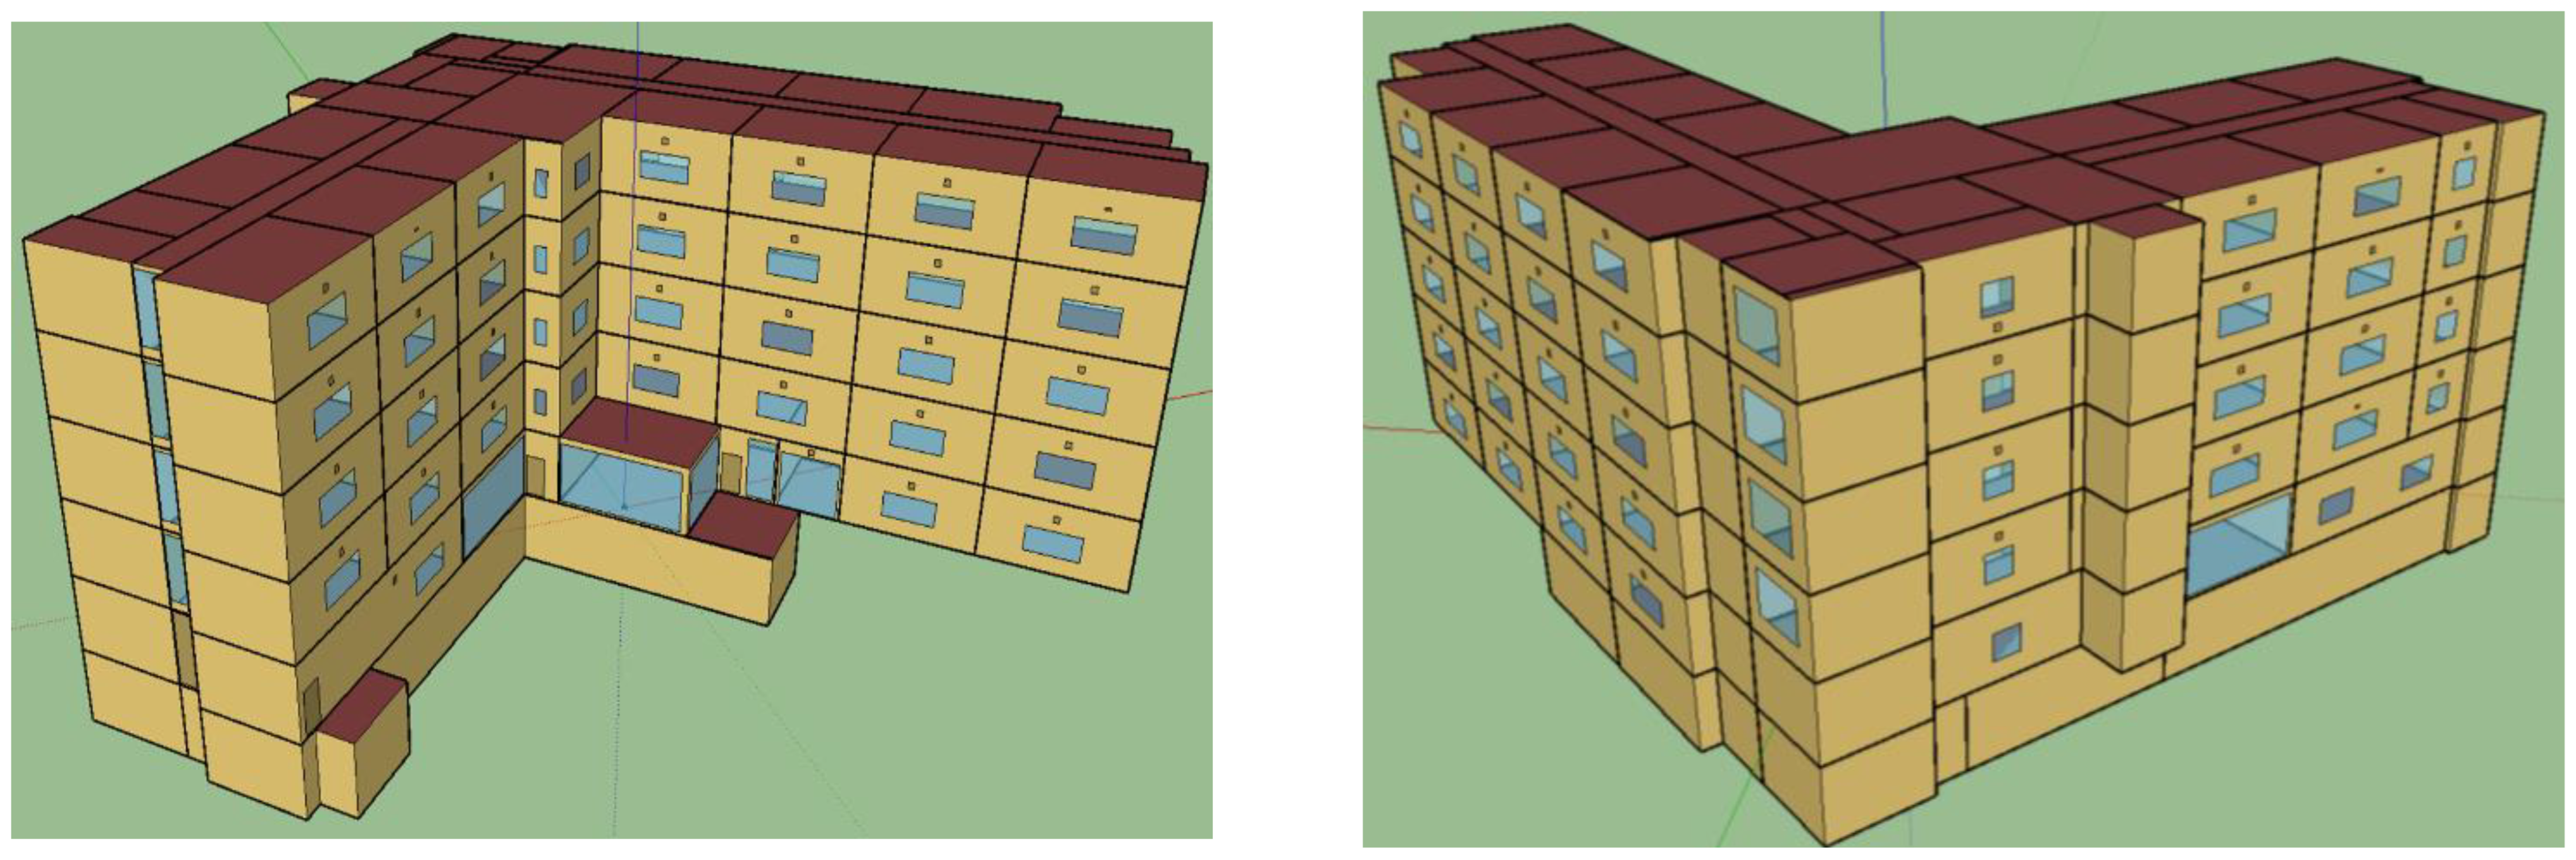
2.1.1. Building Geometry
2.1.2. Building Construction
2.1.3. Internal Casual Heat Gains
2.1.4. Building HVAC System
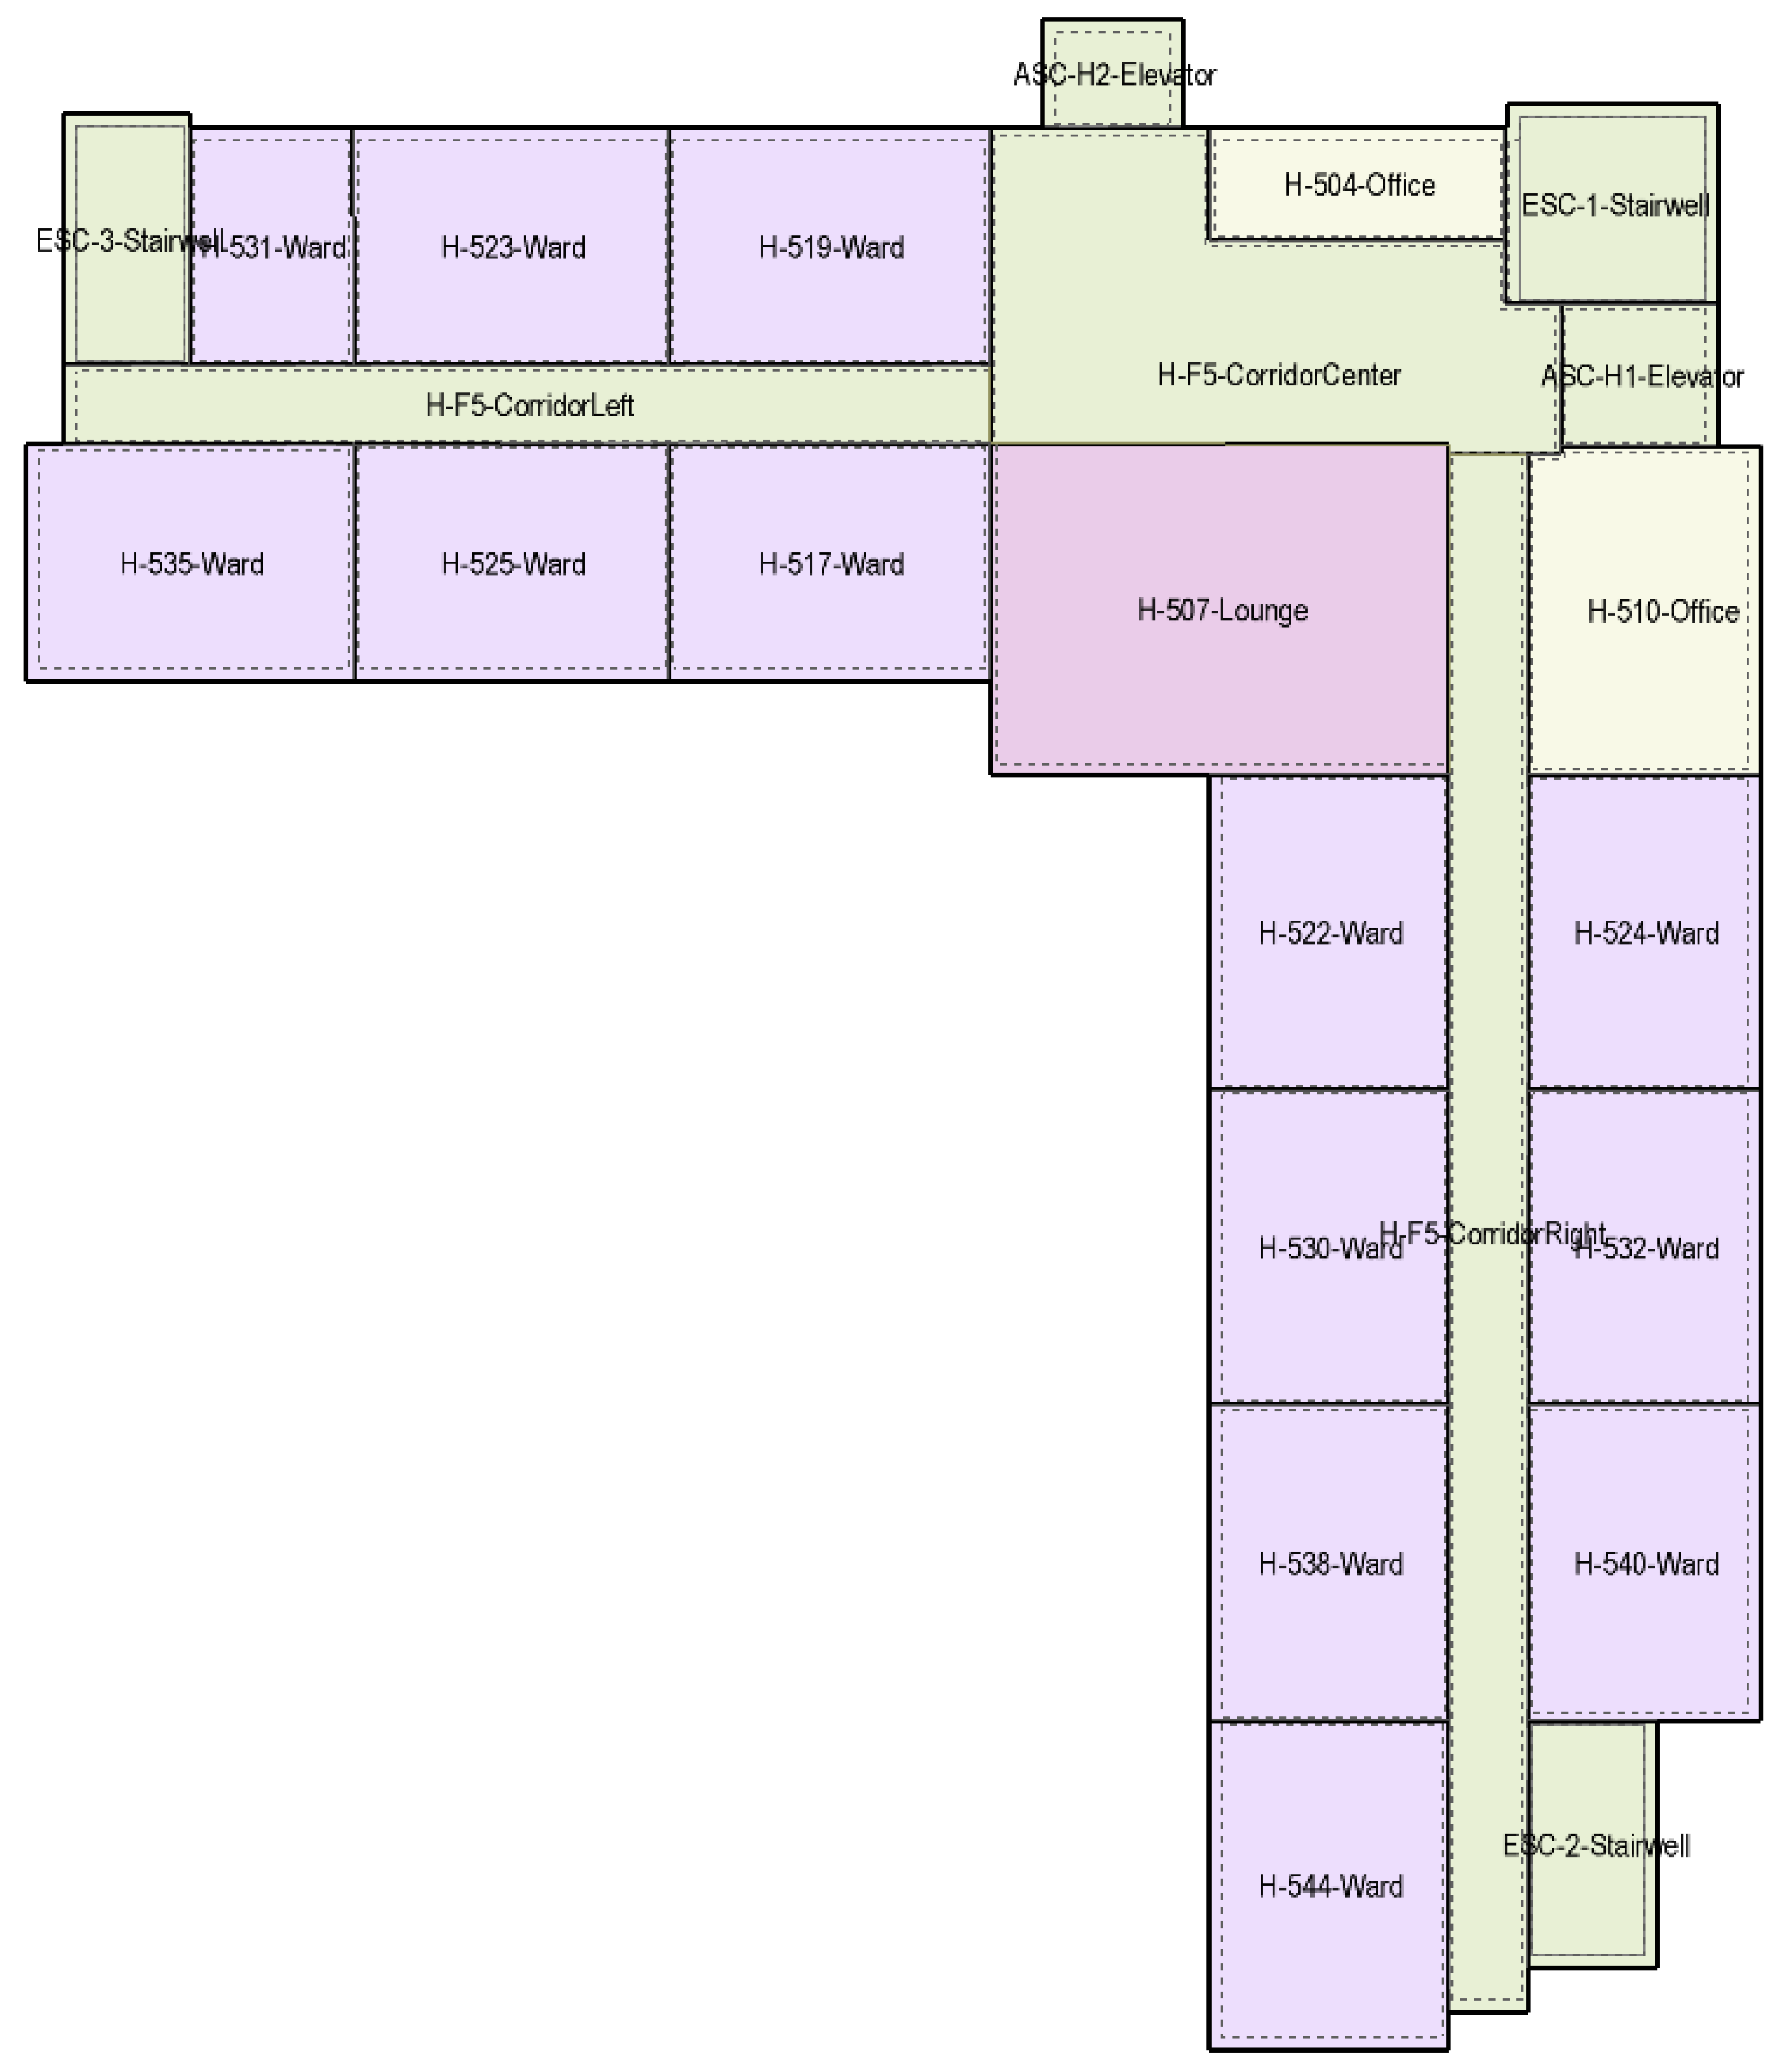
2.1.5. Building Thermal Zoning
2.2. Airflow Network Model
- Under the free running mode, resident bedrooms and offices w naturally ventilated subject to occupant behavior for the opening of operable windows and internal doors. From the site visits of the monitored building, the opening factor of the resident bedroom windows is restricted to 10%. Furthermore, due to the resident-free movement in the common spaces of the building, internal doors of bedrooms leading to the common corridor spaces are assumed to be opened on average by up to 50% (note that opening by more than 25% does not induce any significant changes in indoor temperature). The windows and internal doors of bedrooms and offices are opened if the indoor temperature exceeds the outdoor temperature and occupants start to feel thermal discomfort; otherwise, they are closed. Occupant behavior and thermal discomfort perception to open windows or doors may vary from one occupant to another. However, in this study, the average perception of thermal discomfort from all occupants was used and, therefore, two set point temperatures (for older and young adults) to open windows/doors were applied to all bedrooms and offices. Older (age > 65 years) people usually prefer warmer temperatures to obtain the same comfort level as young (average age) people [38,39]. According to the new comfort model for older people by Laouadi [40], average older people (having a metabolic rate of 20% lower than young adults) in a sedentary position and wearing typical summer clothing (0.5 clo.) in still air (air velocity < 0.1 m/s) with a relative humidity of 45%, the indoor temperature for which older people start to feel thermal discomfort (PMV = 0.5) is 28.8 °C. This is very close to 29 °C, as reported in the field study in [25]. However, the set point for office occupants (young adults) was fixed at 26 °C. If air-conditioning was used in bedrooms and offices, all their windows and internal doors were assumed closed.
- Windows of stairwells, food preparation areas, and lounges were non-operable.
- Internal doors of stairwells and elevators were always closed to comply with the building fire code.
- The air leakage data through the external and internal closed doors were taken as average values from the published study [41].
- Whole building air leakage data were converted to exterior envelope surface leakage data assuming a uniform surface leakage distribution.
- Leakage through the external building surfaces (walls, roofs, exterior doors, and nonoperable windows), which were treated as crack leakages with mass flow coefficients calculated based on the typical whole building air leakage rate (Table 1);
- Leakage through the external operable windows (treated automatically in EnergyPlus).
- Leakage through horizontal openings connecting hollow thermal zones, such as stairwells and elevator shafts (treated automatically).
- Leakage through the internal doors connecting building spaces of bedrooms, offices, food areas, stairwells, elevators, and corridors. The leakage data of these components were taken from the databases in [41].
- Exhaust fans in bedrooms and food areas were linked to the airflow network.
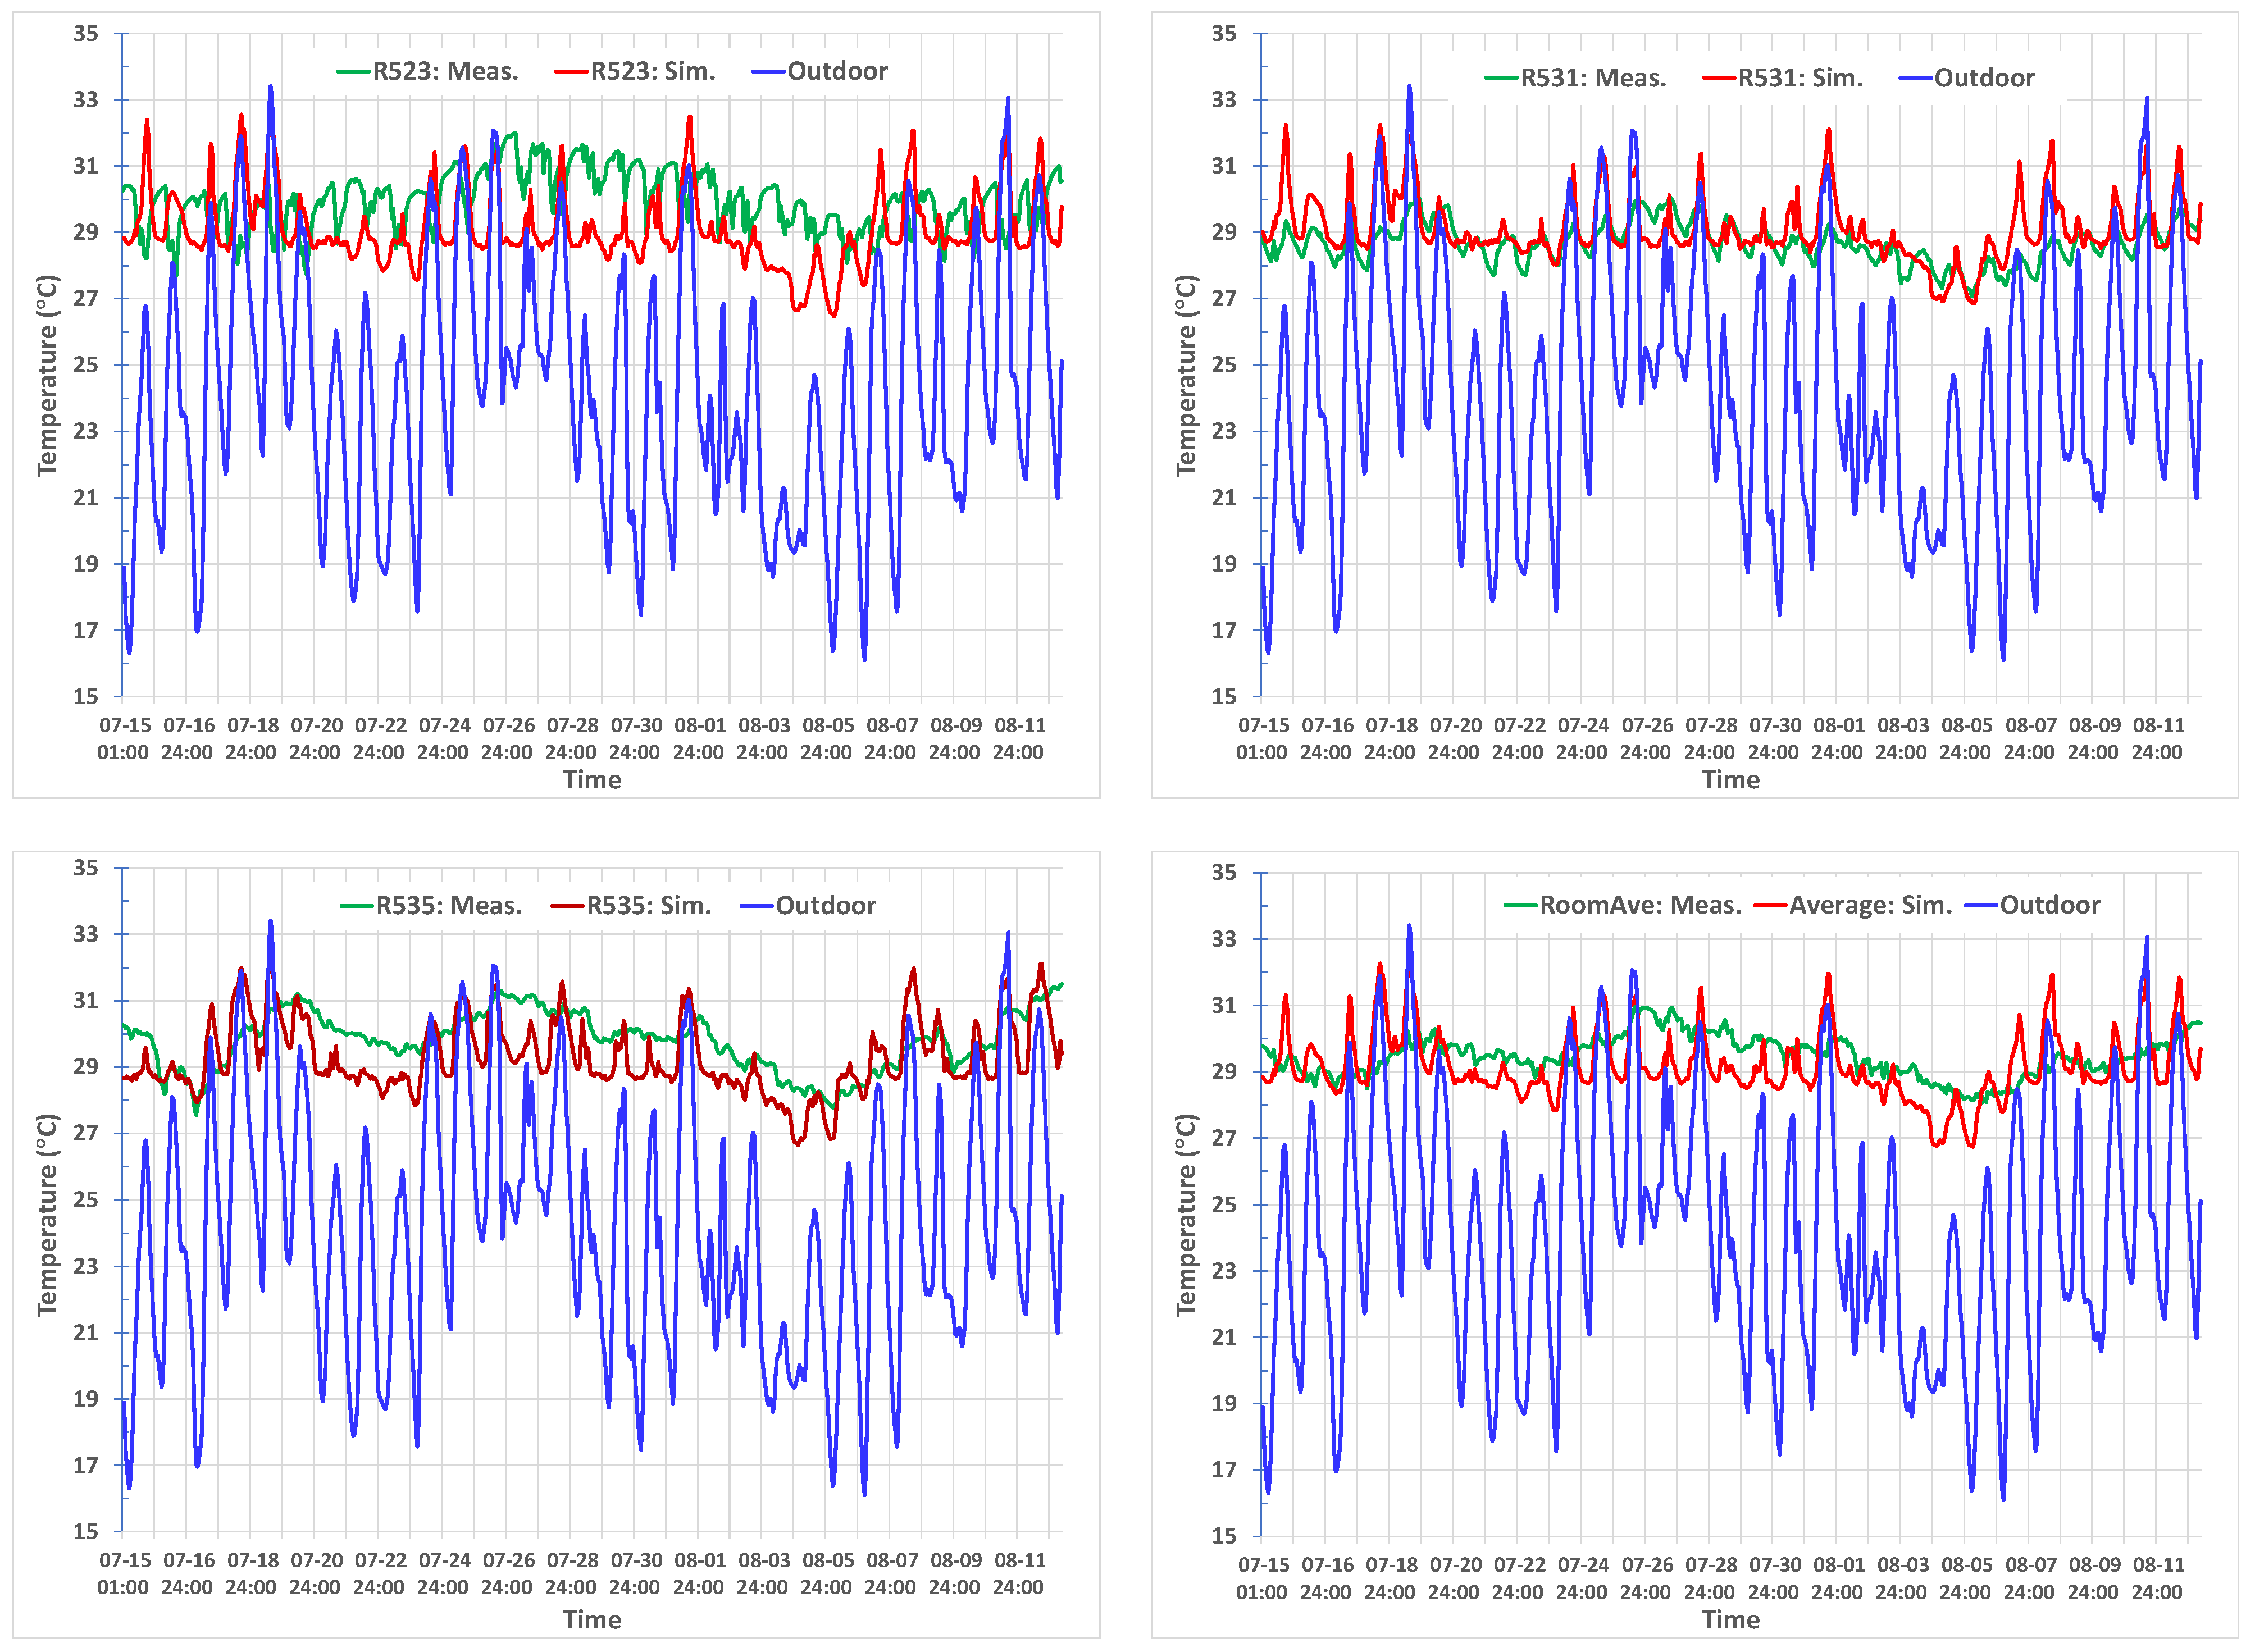
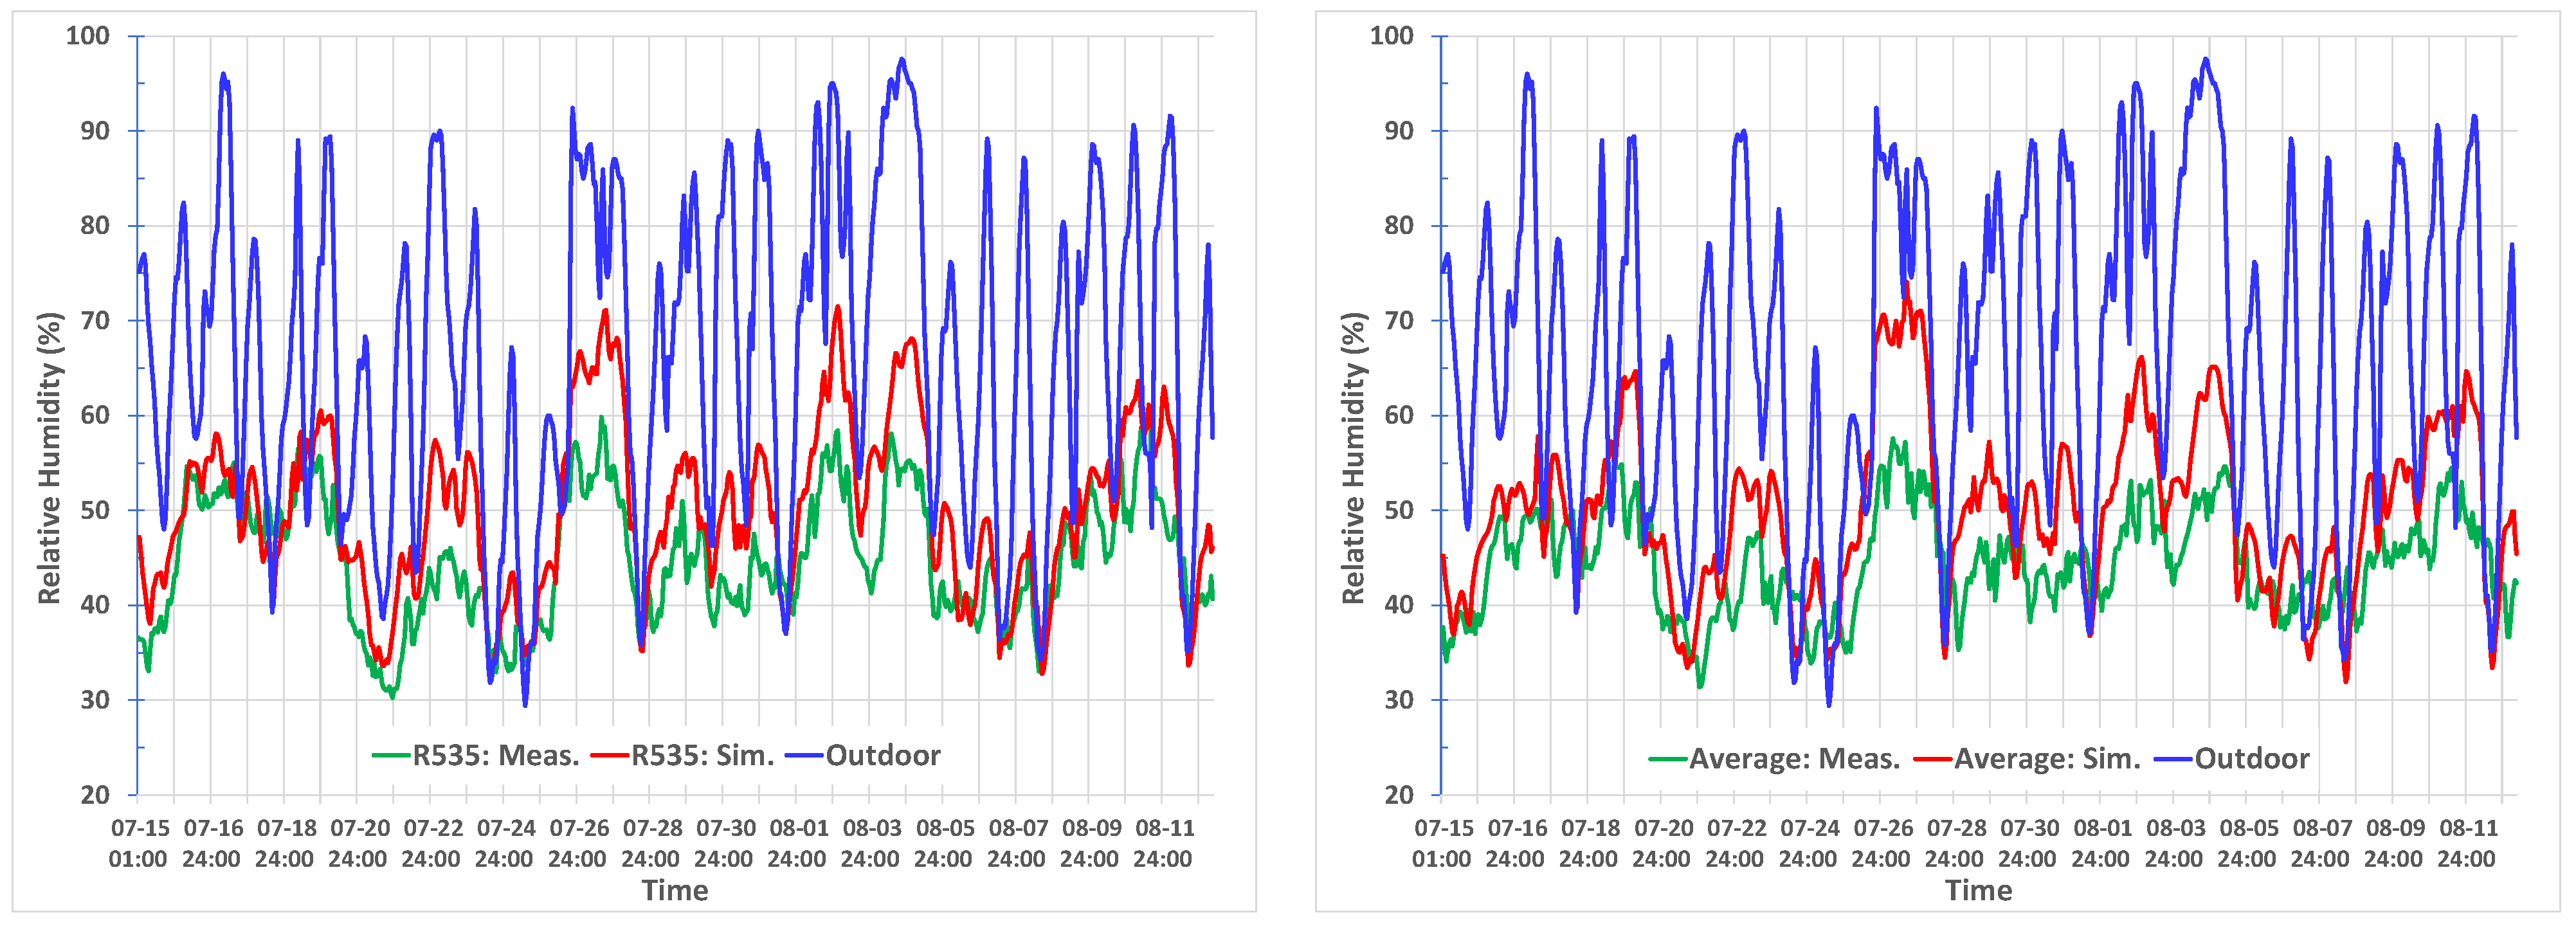
2.3. Calibration of Building Models
2.3.1. Field-Monitored Data
2.3.2. Energy Use Intensity Data
- The service hot water (SHW) energy load was not accounted for in the model prediction but was calculated based on the typical SHW loads of NECB 2017 (500 W/person for bedrooms). Based on the NECB 2017 SHW loads and usage schedule, the calculated annual energy use of SHW was 218,804 kWh;
- The seasonal boiler efficiency for SHW was fixed at 60% for old construction and 75% for new construction [45];
- Natural gas was used for space heating. The electrical energy used for heating in the simulation model was therefore converted to gas furnace heating, assuming a furnace efficiency of 80% for old construction and 90% for new construction;
- For the annual cooling energy use of the building, the COP coefficient was fixed at 2.5 for old construction and 3 for new and retrofit construction;
- The energy use for the kitchen (cooking), exterior lighting, hair salons, exercise rooms, etc., of real buildings, were not accounted for in the model predicted EUI. These diverse energy uses may constitute a significant portion of the total building energy use. The predicted EUI is therefore expected to be significantly lower than that of real similar buildings.
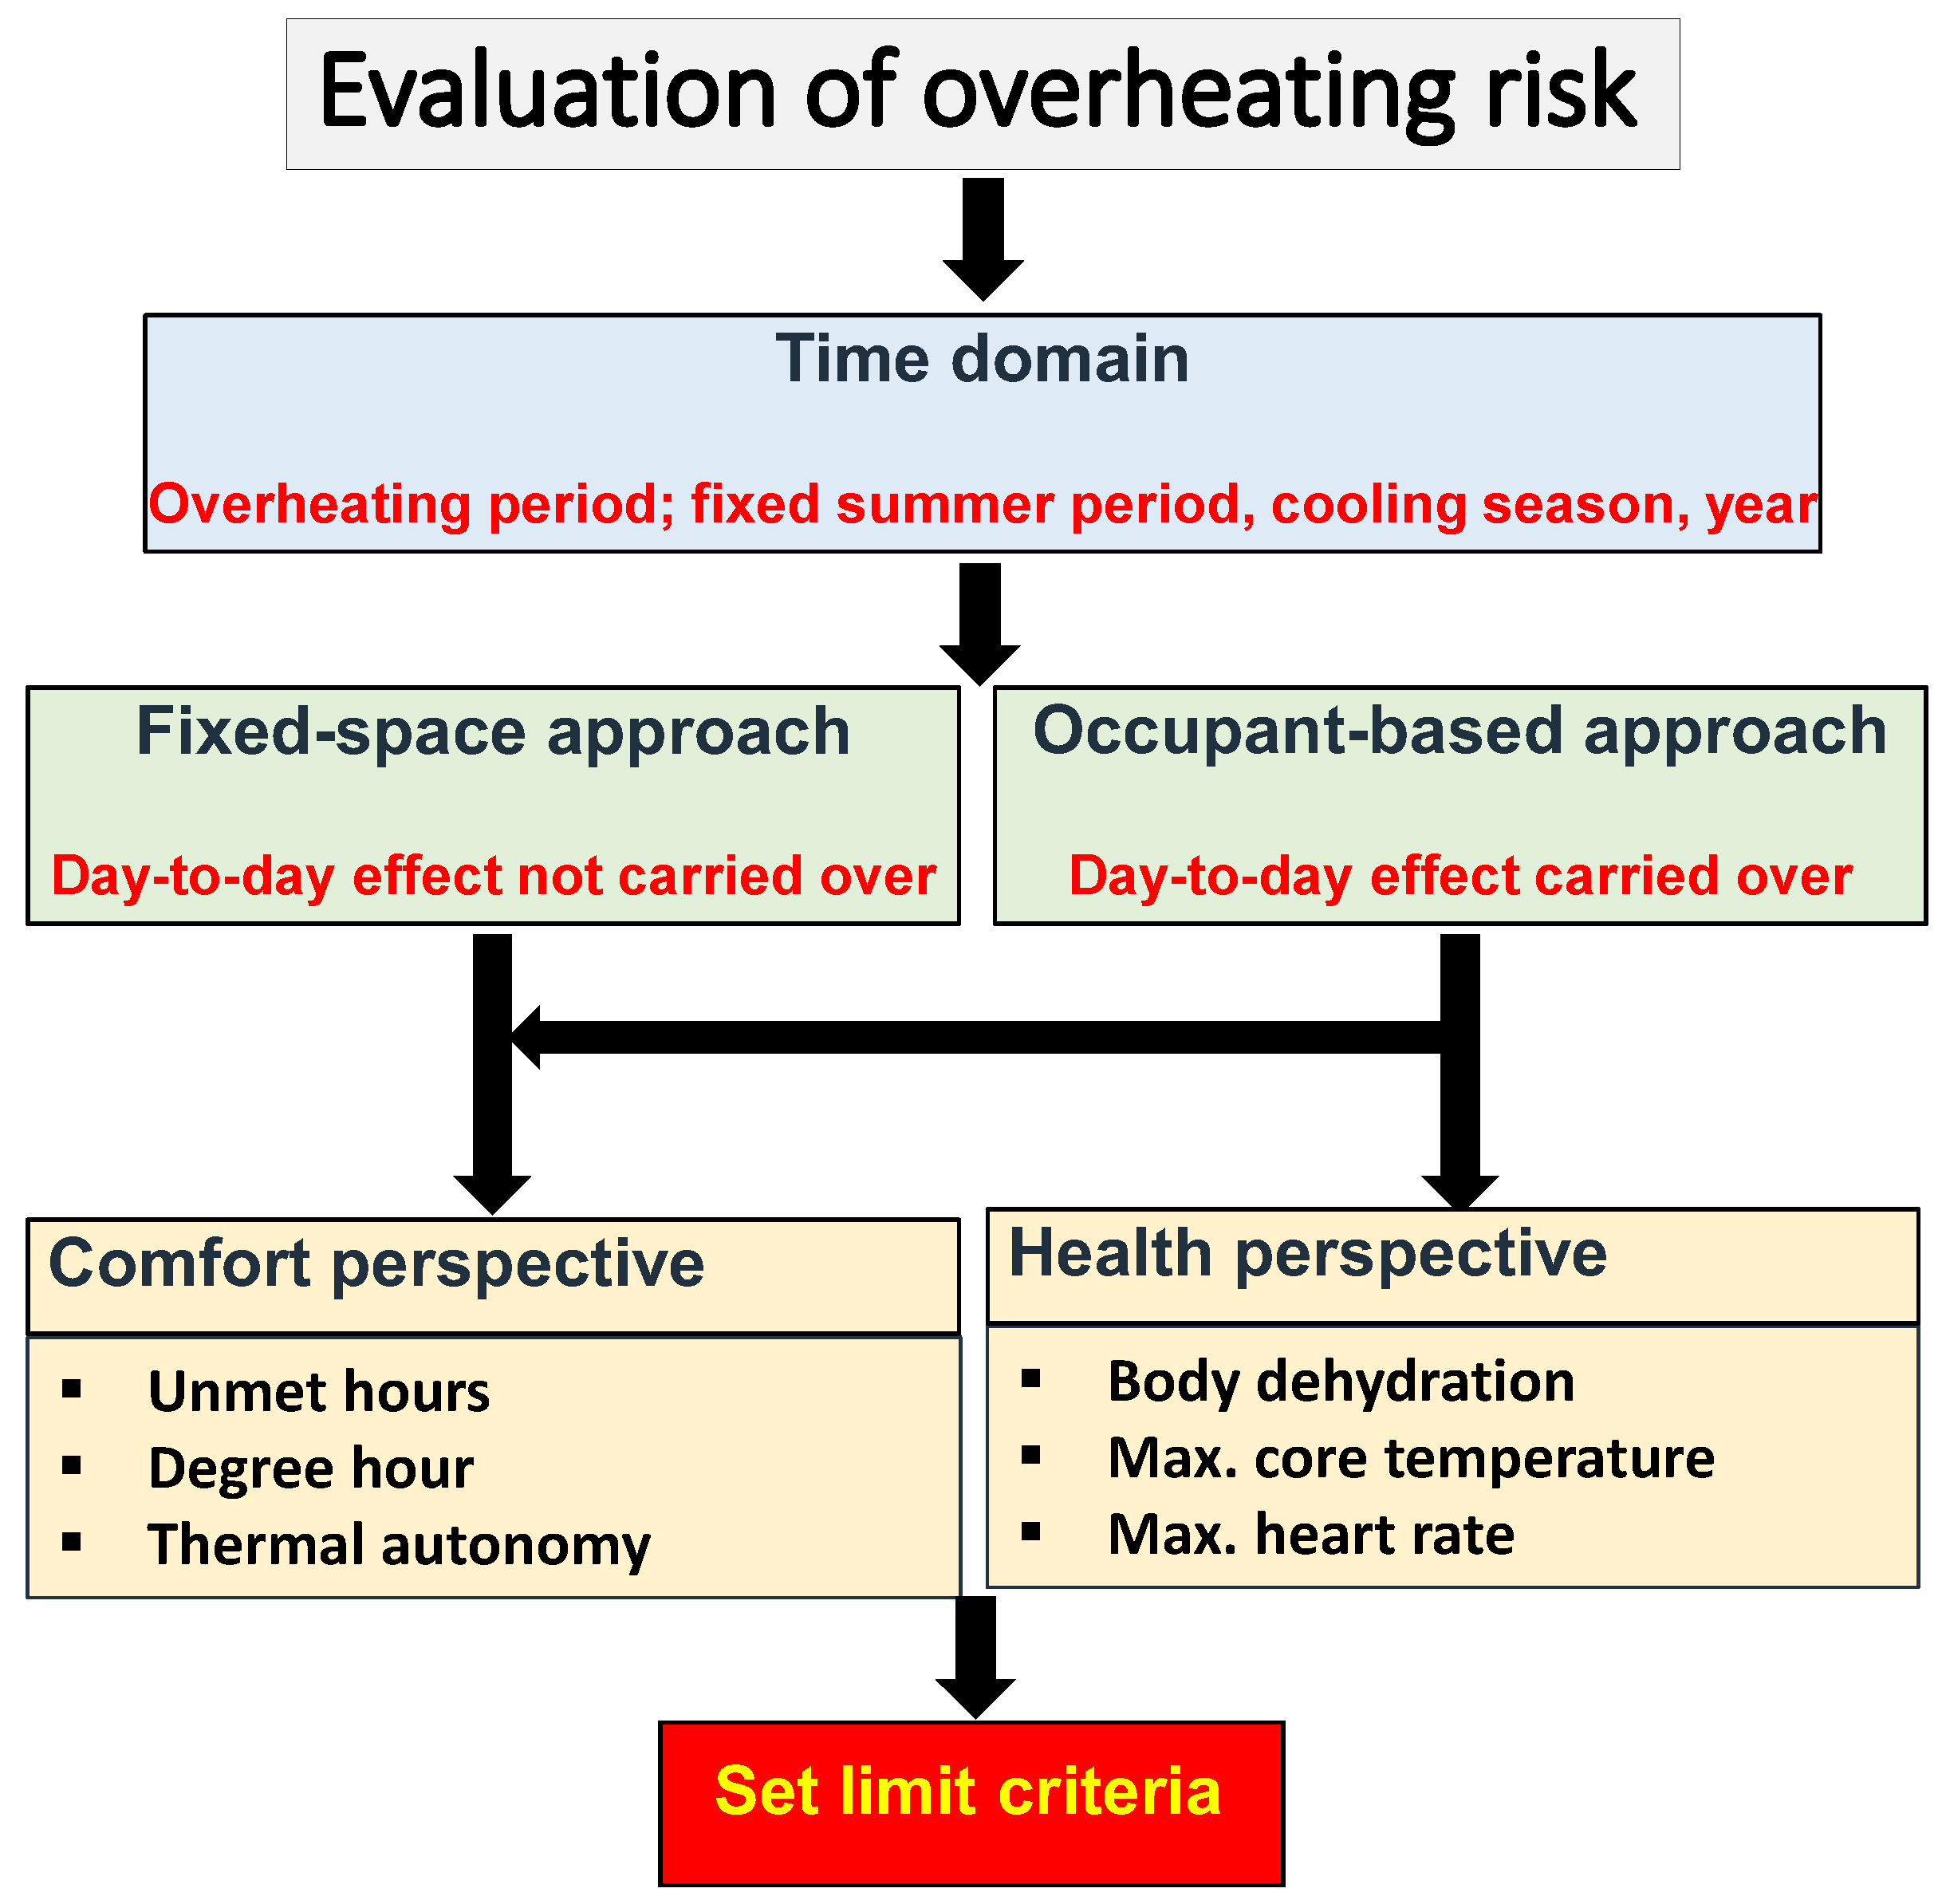
2.4. Procedure to Evaluate Overheating Risk
2.4.1. Identification of Overheating Events
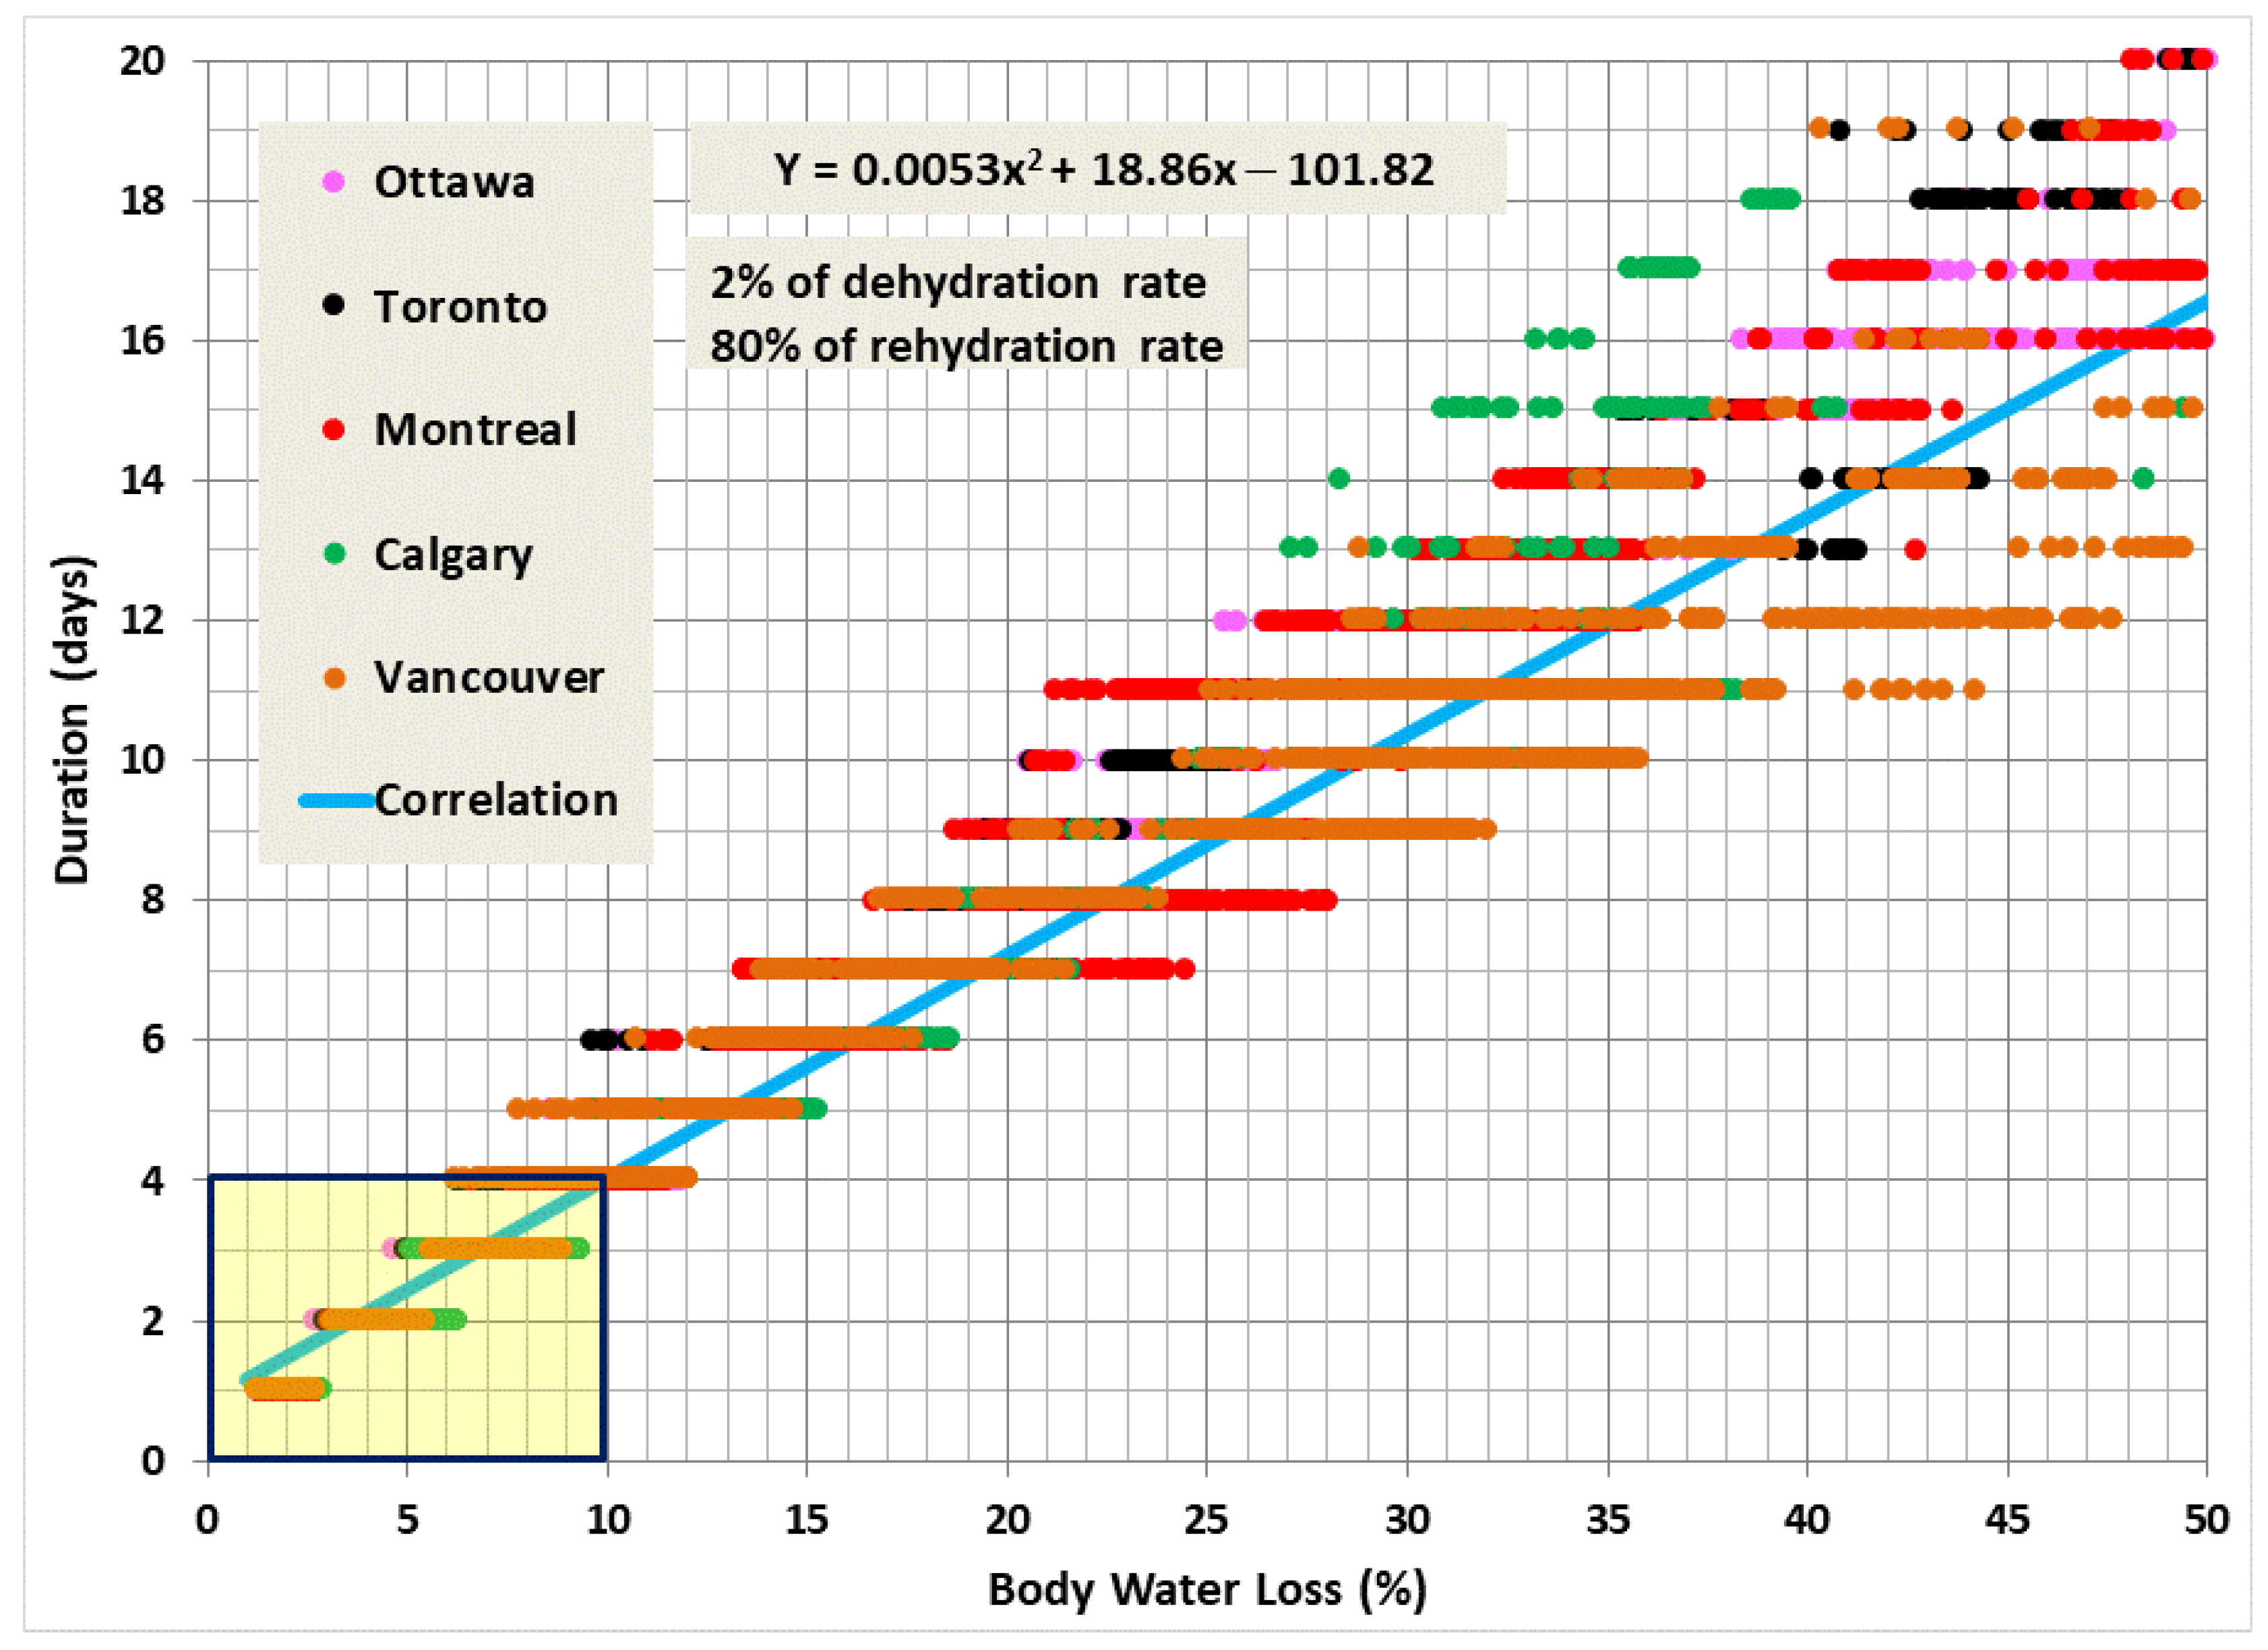
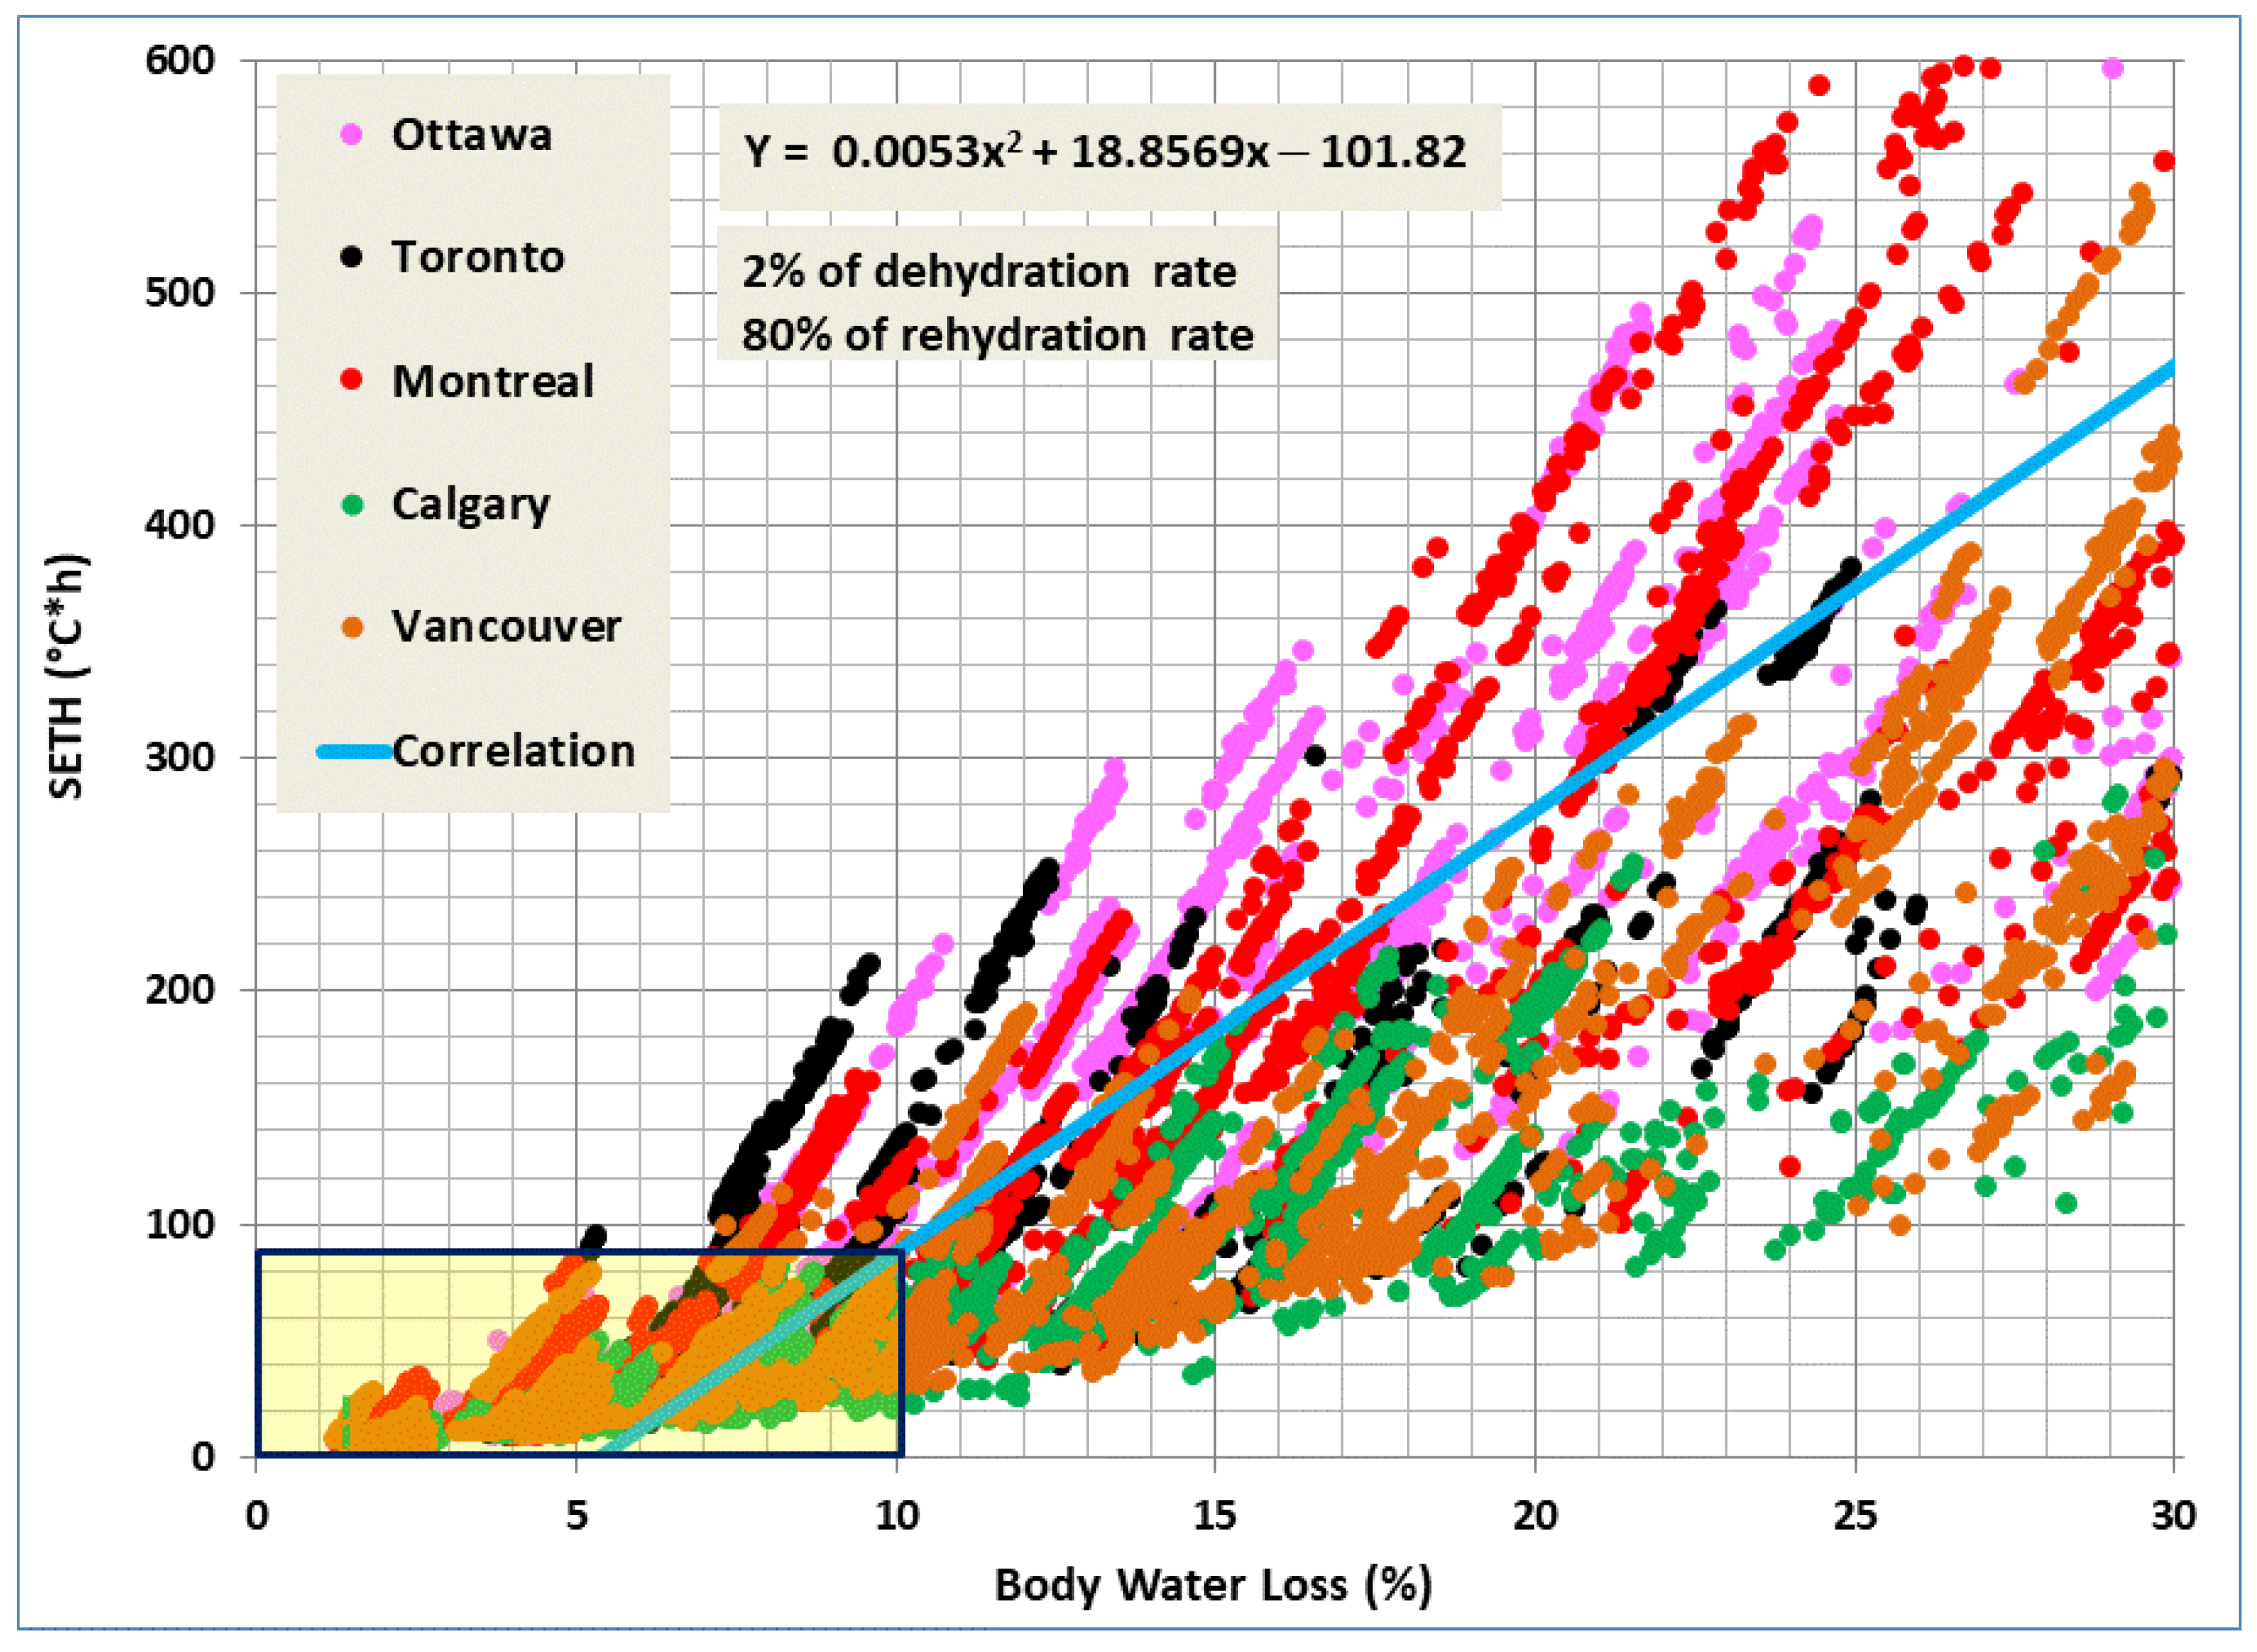
2.4.2. Procedure to Develop Overheating Limit Criteria
3. Results
3.1. Overheating Limit Criteria
3.2. Inter-Comparison of Overheating Criteria
4. Discussion
5. Conclusions
Author Contributions
Funding
Institutional Review Board Statement
Informed Consent Statement
Data Availability Statement
Acknowledgments
Conflicts of Interest
References
- IPCC. Climate Change 2022: Impacts, Adaptation, and Vulnerability. Contribution of Working Group II to the Sixth Assessment Report of the Intergovernmental Panel on Climate Change; Pörtner, H.-O., Roberts, D., Tignor, M., Poloczanska, E., Mintenbeck, K., Alegría, A., Craig, M., Langsdorf, S., Löschke, S., Möller, V., et al., Eds.; Cambridge University Press: Cambridge, UK; New York, NY, USA, 2022; 3056p. [Google Scholar] [CrossRef]
- Mora, C.; Dousset, B.; Caldwell, I.; Powell, F.; Geronimo, R.; Bielecki, C.; Counsell, C.; Deitrich, B.; Johnston, E.; Louis, L.; et al. Global risk of deadly heat. Nat. Clim. Chang. 2017, 7, 501–507. [Google Scholar] [CrossRef]
- Zhao, Q.; Guo, Y.; Ye, T.; Gasparrini, A.; Tong, S.; Overcenco, A.; Urban, A.; Schneider, A.; Entezari, A.; Vicedo-Cabrera, A.M.; et al. Global, regional, and national burden of mortality associated with non-optimal ambient temperatures from 2000 to 2019: A three-stage modelling study. Lancet Planet. Health 2021, 5, e415–e425. [Google Scholar] [CrossRef] [PubMed]
- Lamothe, F.; Roy, M.; Racine-Hamel, S.-É. Enquête Épidémiologique—Vague de Chaleur à l’été 2018 à Montréal. Direction Régionale de Santé Publique du CIUSSS du Centre-Sud-de-l’Île-de-Montréal; Gouvernement du Québec: Québec, QC, Canada, 2019.
- Jay, O.; Capon, A.; Berry, P.; Broderick, C.; de Dear, R.; Havenith, G.; Honda, Y.; Kovats, R.S.; Ma, W.; Malik, A.; et al. Reducing the health effects of hot weather and heat extremes: From personal cooling strategies to green cities. Lancet 2021, 398, 709–724. [Google Scholar] [CrossRef] [PubMed]
- BCCDC. BC Provincial Heat Alert and Response System (BC HARS); BC Centre for Disease Control: Vancouver, BC, Canada, 2022.
- Government of Canada. Government of Canada—Action for Seniors Report. 2016. Available online: https://www.canada.ca/en/employment-social-development/programs/seniors-action-report.html (accessed on 11 November 2022).
- CIHI. Long-Term Care Homes in Canada: How Many and Who Owns Them? Canadian Institute for Health Information. Available online: https://www.cihi.ca/en/long-term-care-homes-in-canada-how-many-and-who-owns-them (accessed on 11 November 2022).
- Benbow, W.A.; Small House Floor Plan Designs for Nursing Homes. Development Consulting Services, Seniors Housing and Care Facilities. Available online: https://wabenbow.com/ (accessed on 11 November 2022).
- OLTCA. 2022. Available online: https://www.oltca.com/oltca/OLTCA/Public/LongTermCare/FactsFigures.aspx (accessed on 20 November 2022).
- Wollschlaeger, S.; Sadhu, A.; Ebrahimi, G.; Woo, A. Investigation of climate change impacts on long-term care facility occupants. City Environ. Interact. 2022, 13, 100077. [Google Scholar] [CrossRef]
- MLTC. 2020. Long-Term Care Staffing Study. Ministry of Long-Term Care, Ontario. Available online: https://files.ontario.ca/mltc-long-term-care-staffing-study-en-2020-07-31.pdf (accessed on 11 November 2022).
- Walker, G.; Brown, S.; Neven, L. Thermal comfort in care homes: Vulnerability, responsibility and thermal care. Build. Res. Inf. 2016, 44, 135–146. [Google Scholar] [CrossRef]
- Guerra, A.; Santin, O.; Tweed, A.C. Summer post occupancy evaluation of a Passivhaus care home in the UK. In Proceedings of the PLEA Sustainable Architecture for a Renewable Future, Munich, Germany, 10–12 September 2013. [Google Scholar]
- Gupta, R.; Barnfield, L.; Gregg, M. Overheating in care settings: Magnitude, causes, preparedness and remedies. Build. Res. Inf. 2017, 45, 83–101. [Google Scholar] [CrossRef]
- Lorente, C.; Serazin, C.; Daube, D.; Tillaut, H.; Salines, G. Risk Factors of Mortality During the Heat Wave of August 2003 in France’s Nursing Homes. Epidemiology 2004, 15, S217. [Google Scholar] [CrossRef]
- Kollanus, V.; Tiittanen, P.; Lanki, T. Mortality risk related to heatwaves in Finland—Factors affecting vulnerability. Environ. Res. 2021, 201, 111503. [Google Scholar] [CrossRef]
- Thompson, R.; Landeg, O.; Kar-Purkayastha, I.; Hajat, S.; Kovats, S.; O’Connell, E. Heatwave Mortality in Summer 2020 in England: An Observational Study. Int. J. Environ. Res. Public Health 2022, 19, 6123. [Google Scholar] [CrossRef]
- Bustinza, R.; Lebel, G.; Gosselin, P.; Bélanger, D.; Chebana, F. Health impacts of the July 2010 heat wave in Québec, Canada. BMC Public Health 2013, 13, 56. [Google Scholar] [CrossRef]
- Roy, L.-A.; Price, K.; Pâquet, M.; Vida, S.; Senécal, G.; Lefebvre, L.; Perron, S.; King, N. Canicule 2010 à Montréal. Rapport du Directeur de Santé Publique; Direction de santé publique de l’Agence de la santé et des Services Sociaux de Montréal: Montréal, QC, Canada, 2011. [Google Scholar]
- CIBSE. Design Methodology for the Assessment of Overheating Risk in Homes—CIBSE TM59: 2017; Chartered Institution of Building Services Engineers: London, UK, 2017. [Google Scholar]
- Wang, Z.; Yu, H.; Jiao, Y.; Wei, Q.; Chu, X. A field study of thermal sensation and neutrality in free-running aged-care homes in Shanghai. Energy Build. 2018, 158, 1523–1532. [Google Scholar] [CrossRef]
- Hughes, C.; Natarajan, S. Summer thermal comfort and overheating in the elderly. Build. Serv. Eng. Res. Technol. 2019, 40, 426–445. [Google Scholar] [CrossRef]
- ISO 15251-2007; Indoor Environmental Input Parameters for Design and Assessment of Energy Performance of Buildings Addressing Indoor Air Quality, Thermal Environment, Lighting and Acoustics. International Standard Organisation: Geneva, Switzerland, 2007.
- Gupta, R.; Howard, A.; Davies, M.; Mavrogianni, A.; Tsoulou, I.; Jain, N.; Oikonomou, E.; Wilkinson, P. Monitoring and modelling the risk of summertime overheating and passive solutions to avoid active cooling in London care homes. Energy Build. 2021, 252, 111418. [Google Scholar] [CrossRef]
- Gupta, R.; Howard, A.; Davies, M.; Mavrogianni, A.; Tsoulou, I.; Oikonomou, E.; Wilkinson, P. Examining the magnitude and perception of summertime overheating in London care homes. Build. Serv. Eng. Res. Technol. 2021, 42, 653–675. [Google Scholar] [CrossRef]
- CIBSE. Environment Design-CIBSE Guide A; The Chartered Institution of Building Services Engineers: London, UK, 2006. [Google Scholar] [CrossRef]
- CIBSE. The Limits of Thermal Comfort: Avoiding Overheating in European Buildings-CIBSE TM52; The Chartered Institution of Building Services Engineers: London, UK, 2013. [Google Scholar] [CrossRef]
- PHE. Heatwave Plan for England: Protecting Health and Reducing Harm from Severe Heat and Heat Waves; Public Health England, Department of Health: London, UK, 2015. [Google Scholar]
- NRC. National Energy Code of Canada for Buildings (NECB-2017); National Research Council Canada: Ottawa, ON, Canada, 2017.
- NRC. National Energy Code of Canada for Buildings (NECB-2011); National Research Council Canada: Ottawa, ON, Canada, 2011.
- RDH. Air Leakage Control in Multi-Unit Residential Buildings. Development of Testing and Measurement Strategies to Quantify Air Leakage in MURBs. Report; RDH Building Engineering Ltd.: Vancouver, BC, Canada, 2013. [Google Scholar]
- Ostrander, C. History of Insulation with Masonry. Mason. Edge 2008, 2, 32–41. [Google Scholar]
- NRC. National Building Code of Canada (NBC-1980); National Research Council Canada: Ottawa, ON, Canada, 1980.
- ANSI/ASHRAE Standard 62.1-2022; Ventilation and Acceptable Indoor Air Quality. American Society of Heating Refrigerating and Air Conditioning Engineers: Atlanta, GA, USA, 2022.
- ANSI/ASHRAE Standard 62.2-2022; Ventilation and Acceptable Indoor Air Quality in Residential Buildings. American Society of Heating Refrigerating and Air Conditioning Engineers: Atlanta, GA, USA, 2022.
- DOE. EnergyPlus, v9.6. US Department of Energy. Available online: https://energyplus.net/ (accessed on 1 February 2022).
- Tsuzuki, K.; Ohfuku, T. Thermal sensation and thermoregulation in elderly compared to young people in Japanese winter season. In Proceedings of the Indoor Air’ 02, Monterey, CA, USA, 30 June–5 July 2002; Volume V, pp. 659–664. [Google Scholar]
- Schellen, L.; van Marken Lichtenbelt, W.D.; Loomans, M.G.L.C.; Toftum, J.; de Wit, M.H. Differences between young adults and elderly in thermal comfort, productivity, and thermal physiology in response to a moderate temperature drift and a steady-state condition. Indoor Air 2010, 20, 273–283. [Google Scholar] [CrossRef] [PubMed]
- Laouadi, A. A New General Formulation for the PMV Thermal Comfort Index. Buildings 2022, 12, 1572. [Google Scholar] [CrossRef]
- Ricketts, L. A Field Study of Airflow in a High-Rise Multi-Unit Residential Building. MASc Thesis, University of Waterloo, Waterloo, ON, Canada, 2014. [Google Scholar]
- Wang, L.; Shu, C.; Ge, H.; Zmeureanu, R.; Lacasse, M.; Leroyer, S. Assessment of summertime overheating conditions in vulnerable buildings in Montréal. In Proceedings of the 2nd International Conference on New Horizons in Green Civil Engineering (NHICE-02), Victoria, BC, Canada, 29 April–1 May 2020; pp. 2–5. [Google Scholar]
- ASHRAE. ASHRAE Guideline 14-2014: Measurement of Energy, Demand, and Water Savings; American Society of Heating Refrigerating and Air Conditioning Engineers: Atlanta, GA, USA, 2014. [Google Scholar]
- Donovan, A.O.; Sullivan, P.D.O.; Murphy, M.D. Predicting air temperatures in a naturally ventilated nearly zero energy building: Calibration, validation, analysis and approaches. Appl. Energy 2019, 250, 991–1010. [Google Scholar] [CrossRef]
- Oliker, I. Assessment of Seasonal Boiler Efficiency in Individual Buildings. 2021. Available online: https://www.esmagazine.com/articles/101464-assessment-of-seasonal-boiler-efficiency-in-individual-buildings (accessed on 11 November 2022).
- Mudie, S.; Essah, E.A.; Grandison, A.; Felgate, R. Electricity use in the commercial kitchen. Int. J. Low-Carbon Technol. 2016, 11, 66–74. [Google Scholar] [CrossRef]
- NRCan. Energy Intensity Data from Survey of Commercial and Institutional Energy Use (SCIEU). 2014. Available online: https://oee.nrcan.gc.ca/corporate/statistics/neud/dpa/menus/scieu/2014/tables.cfm (accessed on 15 November 2022).
- NRCan. Canadian National Median Reference Values for All Property Types. 2018. Available online: https://www.nrcan.gc.ca/sites/www.nrcan.gc.ca/files/energy/pdf/Canadian%20National%20Median%20Tables-EN-Aug2018-7.pdf (accessed on 15 November 2022).
- City of Toronto. Annual Energy Consumption & Greenhouse Gas Emissions Report. 2017. Available online: https://www.toronto.ca/wp-content/uploads/2019/08/9552-2017-Annual-Energy-Consumption-Greenhouse-Gas-Emissions-Report.pdf (accessed on 15 November 2022).
- Laouadi, A.; Bartko, M.; Lacasse, M. A New Methodology of Evaluation of Overheating in Buildings. Energy Build. 2020, 226, 110360. [Google Scholar] [CrossRef]
- Laouadi, A.; Bartko, M.; Gaur, A.; Lacasse, M. Guideline for Management of Overheating Risk in Residential Buildings; Report CRBCPI-Y4-10; National Research Council Canada: Ottawa, ON, Canada, 2022. [CrossRef]
- USGBC. Passive Survivability and Back-up Power During Disruptions. 2022. Available online: https://www.usgbc.org/credits/new-construction-core-and-shell-schools-new-construction-retail-new-construction-data-48?view=resources (accessed on 15 November 2022).
- BC Housing. BC Energy Step Code, Design Guide Supplement S3 on Overheating and Air Quality. Available online: https://www.bchousing.org/publications/BC-Energy-Step-Code-Guide-Supplemental.pdf (accessed on 20 November 2022).
- Hansen, A.; Williamson, T.; Pisaniello, D.; Bennetts, H.; van Hoof, J.; Arakawa Martins, L.; Visvanathan, R.; Zuo, J.; Soebarto, V. The Thermal Environment of Housing and Its Implications for the Health of Older People in South Australia: A Mixed-Methods Study. Atmosphere 2022, 13, 96. [Google Scholar] [CrossRef]
- Fouillet, A.; Rey, G.; Laurent, F.; Pavillon, G.; Bellec, S.; Guihenneuc-Jouyaux, C.; Clavel, J.; Jougla, E.; Hémon, D. Excess mortality related to the August 2003 heat wave in France. Int. Arch. Occup. Environ. Health 2006, 80, 16–24. [Google Scholar] [CrossRef]
- Feliciano, L.; LeBlanc, L.A.; Feeney, B.J. Assessment and management of barriers to fluid intake in community dwelling older adults. J. Behav. Heal. Med. 2010, 1, 3–14. [Google Scholar] [CrossRef]
- Garriguet, D. Impact of identifying plausible respondents on the under-reporting of energy intake in the Canadian Community Health Survey. Health Rep. 2008, 19, 47–55. [Google Scholar] [PubMed]
- Begum, M.N.; Johnson, C.S. A review of the literature on dehydration in the institutionalized elderly. E-SPEN Eur. E-J. Clin. Nutr. Metab. 2010, 5, e47–e53. [Google Scholar] [CrossRef]
- Jimoh, O.F.; Brown, T.J.; Bunn, D.; Hooper, L. Beverage intake and drinking patterns—Clues to support older people living in long-term care to drink well: DRIE and FISE studies. Nutrients 2019, 11, 447. [Google Scholar] [CrossRef]
- ISO 7933:2004; Ergonomics of the Thermal Environment—Analytical Determination and Interpretation of Heat Stress Using Calculation of the Predicted Heat Strain. Second Edition. International Standard Organisation: Geneva, Switzerland, 2004.
- Gopinathan, P.M.; Pichan, G.; Sharma, V.M. Role of dehydration in heat stress-induced variations in mental performance. Arch. Environ. Health Int. J. 1988, 43, 15–17. [Google Scholar] [CrossRef]
- Volkert, D.; Kreuel, K.; Stehle, P. “Ernährung ab 65”—Trinkmenge und trinkmotivation stehen bei selbstständig in privathaushalten lebenden senioren in engem zusammenhang. Z. Gerontol. Geriatr. 2004, 37, 436–443. [Google Scholar] [CrossRef]
- van Loenhout, J.A.F.; le Grand, A.; Duijm, F.; Greven, F.; Vink, N.M.; Hoek, G.; Zuurbier, M. The effect of high indoor temperatures on self-perceived health of elderly persons. Environ. Res. 2016, 146, 27–34. [Google Scholar] [CrossRef]
- Aphamis, G.; Stavrinou, P.S.; Andreou, E.; Giannaki, C.D. Hydration status, total water intake and subjective feelings of adolescents living in a hot environment, during a typical school day. Int. J. Adolesc. Med. Health 2019, 33, 1–7. [Google Scholar] [CrossRef]
- Jones, A.C.; Kirkpatrick, S.I.; Hammond, D. Beverage consumption and energy intake among Canadians: Analyses of 2004 and 2015 national dietary intake data. Nutr. J. 2019, 18, 60. [Google Scholar] [CrossRef] [PubMed]
- CCOHS. Working in Hot Environments: Health and Safety Guide. Canadian Centre for Occupational Health and Safety. Available online: www.ccohs.ca/oshanswers/phys_agents/heat_control.html. (accessed on 9 January 2022).
- ISO 7243:2017(E); Ergonomics of the Thermal Environment—Assessment of Heat Stress Using the WBGT (Wet Bulb Globe Temperature) Index. Third Edition. International Standard Organisation: Geneva, Switzerland, 2017.
- Stephan, F.; Ghiglione, S.; Decailliot, F.; Yakhou, L.; Duvaldestin, P.; Legrand, P. Effect of excessive environmental heat on core temperature in critically ill patients. An observational study during the 2003 European heat wave. Br. J. Anaesth. 2005, 94, 39–45. [Google Scholar] [CrossRef] [PubMed]
- Kuht, J.; Farmery, A.D. Body temperature and its regulation. Anaesth. Intensiv. Care Med. 2018, 19, 507–512. [Google Scholar] [CrossRef]
- Ji, L.; Laouadi, A.; Shu, C.; Wang, L.; Lacasse, M.A. Evaluation and improvement of the thermoregulatory system for the two-node bioheat model. Energy Build. 2021, 249, 111235. [Google Scholar] [CrossRef]
- Ji, L.; Laouadi, A.; Wang, L.; Lacasse, M.A. Development of a bioheat model for older people under hot and cold exposures. Build. Simul. 2022, 15, 1815–1829. [Google Scholar] [CrossRef]
- Laouadi, A.; Gaur, A.; Lacasse, M.A.; Bartko, M.; Armstrong, M. Development of reference summer weather years for analysis of overheating risk in buildings. J. Build. Perform. Simul. 2020, 13, 301–319. [Google Scholar] [CrossRef]
- Passive House Institute. Criteria for the Passive House, EnerPHit and PHI Low Energy Building Standards. Available online: https://www.passivehousecanada.com/wp-content/uploads/2017/02/Passive-House-and-EnerPHit_building_criteria.pdf (accessed on 28 November 2022).
- ANSI/ASHRAE Standard 55-2020; Thermal Environmental Conditions for Human Occupancy. American Society of Heating Refrigerating and Air Conditioning Engineers: Atlanta, GA, USA, 2020.
- Sun, K.; Zhang, W.; Zeng, Z.; Levinson, R.; Wei, M.; Hong, T. Passive cooling designs to improve heat resilience of homes in underserved and vulnerable communities. Energy Build. 2021, 252, 111383. [Google Scholar] [CrossRef]
- Rahif, R.; Amaripadath, D.; Attia, S. Review on Overheating Evaluation Methods in National Building Codes in Western Europe. In Proceedings of the CLIMA 2022: The 14th REHVA HVAC World Congress, Rotterdam, The Netherlands, 22–25 May 2022. [Google Scholar] [CrossRef]
- Pisacane, V.L.; Kuznetz, L.H.; Logan, J.S.; Clark, J.B.; Wissler, E.H. Use of Thermoregulatory Models to Enhance Space Shuttle and Space Station Operations and Review of Human Thermoregulatory Control; NASA 1-17; NASA: Washington, DC, USA, 2007.
- Tham, S.; Thompson, R.; Landeg, O.; Murray, K.A.; Waite, T. Indoor temperature and health: A global systematic review. Public Health 2019, 179, 9–17. [Google Scholar] [CrossRef]


| Construction | Old (1980) with Partial Retrofit | New (2017) |
|---|---|---|
| Air infiltration rate [32] ACH@75Pa (liters/s/m2) | 4.31 (4.35) | 2.16 (2.17) |
| Basement floor | Insulated slab (U-factor = 0.331 W/m2 K): 100 mm foam Insulation (exterior); 100 mm concrete slab; 70 mm screed; 30 mm timber flooring (interior) | |
| Walls | Concrete block (U-factor = 0.557 W/m2 K) [33,34]: 100 mm brick veneer (exterior); 25 mm air space; 38 mm EPS insulation; 100 mm concrete block; 13 mm gypsum board (interior) | Steel stud (EPS insulation thickness varies with location; Table 2) [30]:100 mm brick veneer (exterior); 25 mm air space; EPS insulation; 13 mm OBS; 150 mm batt steel stud; 13 mm gypsum board (interior) |
| Roofs | Concrete deck (XPS insulation thickness varies with location; Table 2): 1 mm membrane (exterior); XPS insulation; 150 mm concrete slab; 13 mm gypsum board (interior) | |
| Windows (WWR = 14.13%) | Double clear glass with aluminum frame (COG U-factor = 2.7 W/ m2 K) | Double clear low-E glass with argon gas fill and aluminum frame (COG U-factor = 1.33 W/ m2 K) |
| Exterior doors | Oak; U-factor = 3 W/m2 K | |
| Solar shading | Internal vertical blinds with manual control applied only to bedrooms and offices | |
| Space | Schedule * | Occupancy Density (m2/Person) | Lighting Power Density (W/m2) | Equipment Power Density (W/m2) |
|---|---|---|---|---|
| Bedrooms | J | 25 | 6.7 | 2.5 |
| Offices | B | 20 | 10 | 7.5 |
| Lounge | B | 10 | 8.4 | 1 |
| Food areas | B | 20 | 11.4 | 10 |
| Corridor | B | 100 | 7.1 | 0 |
| Stairwell | B | 200 | 6.3 | 0 |
| Elevators | B | 0 | 7.3 | 0 |
| Mechanical room | Always-ON | 0 | 4.6 | 1 |
| Error | R521 | R531 | R535 | Room Average |
|---|---|---|---|---|
| RMSE-T (°C) | 1.7 | 0.9 | 1.0 | 1.0 |
| RMSE-RH (%) | 12 | 7 | 7 | 8 |
| MBE-T (%) | −3 | 2 | −2 | −1 |
| MBE-RH (%) | 20 | 7 | 12 | 13 |
| Construction | H + C + L (kWh/m2) | Total (kWh/m2) | EUI (GJ/m2) | Benchmark EUI (GJ/m2) |
|---|---|---|---|---|
| New | 80 | 149 | 0.54 | 0.74 (>2010) [47] |
| Old | 160 | 247 | 0.89 | 1.3 [47]; 1.04 [48]; 1.01 to 1.95 [49] |
| Reference Young Person + | SETd (°C) ++ | SETn (°C) |
|---|---|---|
| Wake: 1 met and 0.5 clo Sleep: 0.7 met and 1.64 clo | 26.8 (May) 28 (June to September) | 32 |
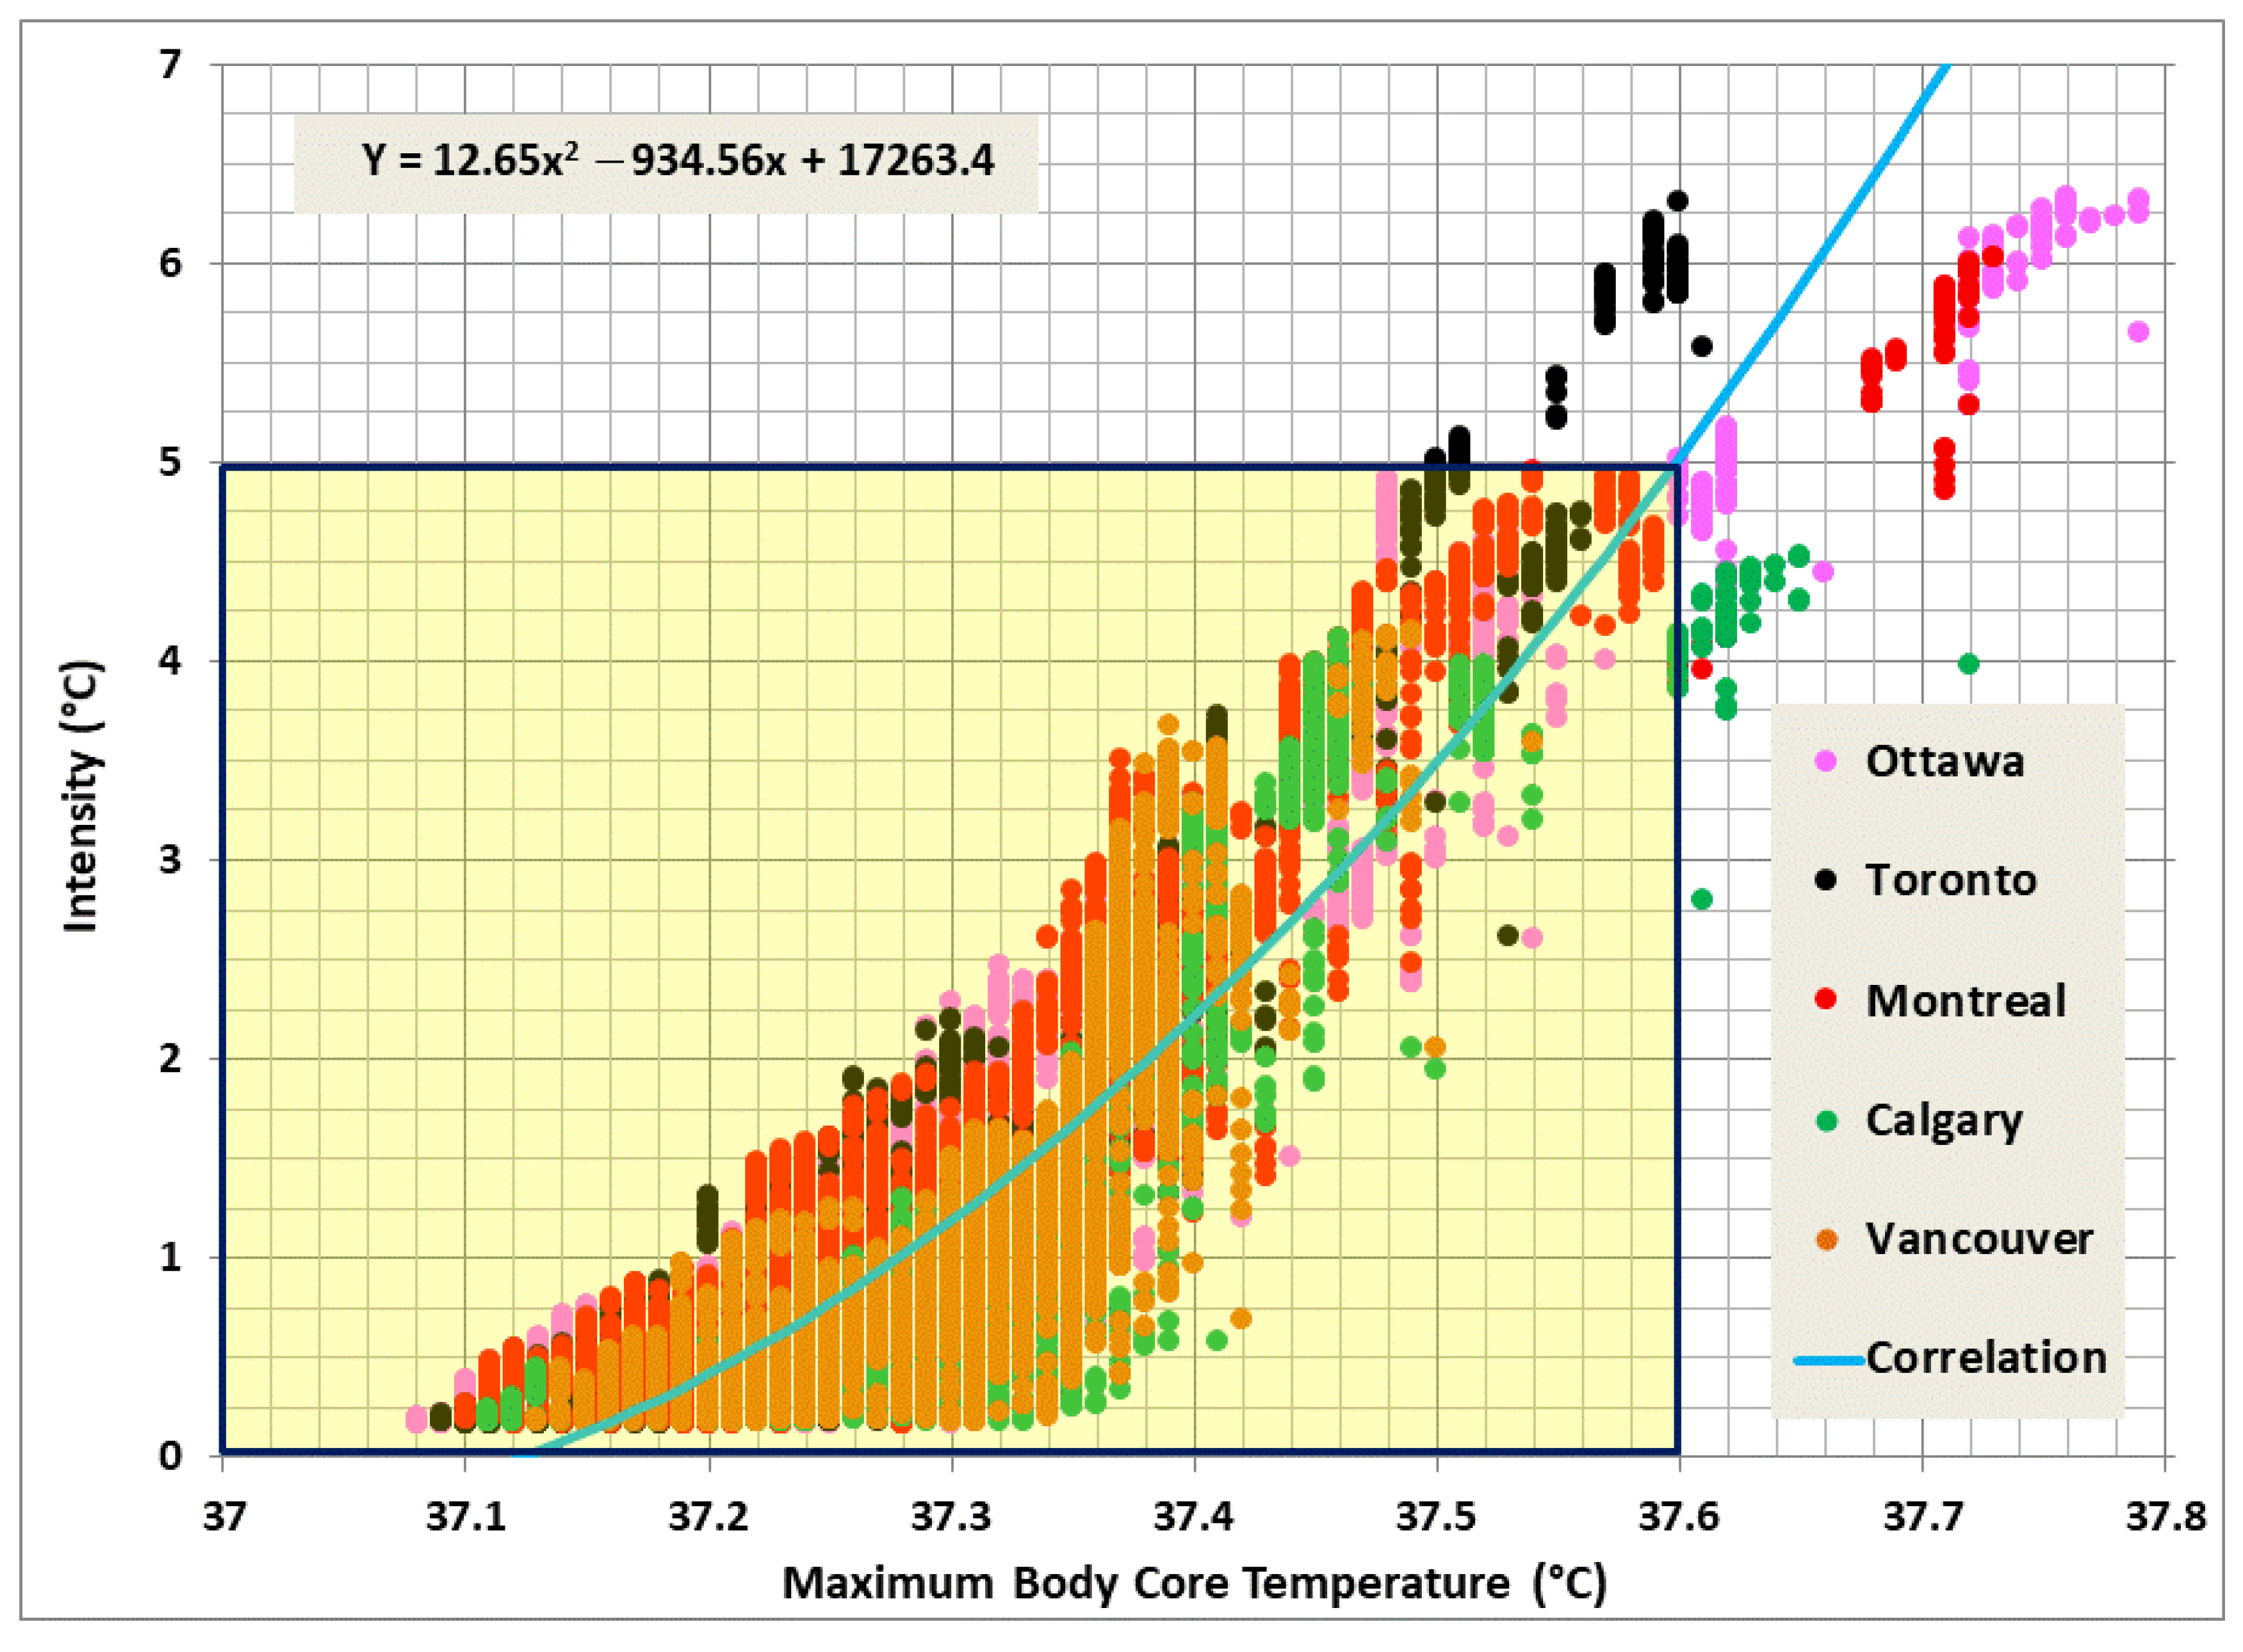
| Rehydration Rate (%) | Dehydration Rate (without Rehydration) (%) | Dehydration Rate (with Rehydration) (%) | Maximum Core Temperature (°C) |
|---|---|---|---|
| 80 | 2 | 10 | 37.6 |
| Period | Montreal | Ottawa | Toronto | Calgary | Vancouver |
|---|---|---|---|---|---|
| Historical | 2010 | 2010 | 2006 | 2007 | 1989 |
| Future | 2047 | 2054 | 2060 | 2052 | 2052 |
| Time (h) | 1–7 | 7–8 | 8–9 | 9–12 | 12–13 | 13–17 | 17–19 | 19–22 | 22–24 |
|---|---|---|---|---|---|---|---|---|---|
| Space | bedroom | bedroom | lounge | bedroom | lounge | bedroom | lounge | bedroom | bedroom |
| Activity | sleep | daytime | breakfast | daytime | lunch | daytime | dinner | daytime | sleep |
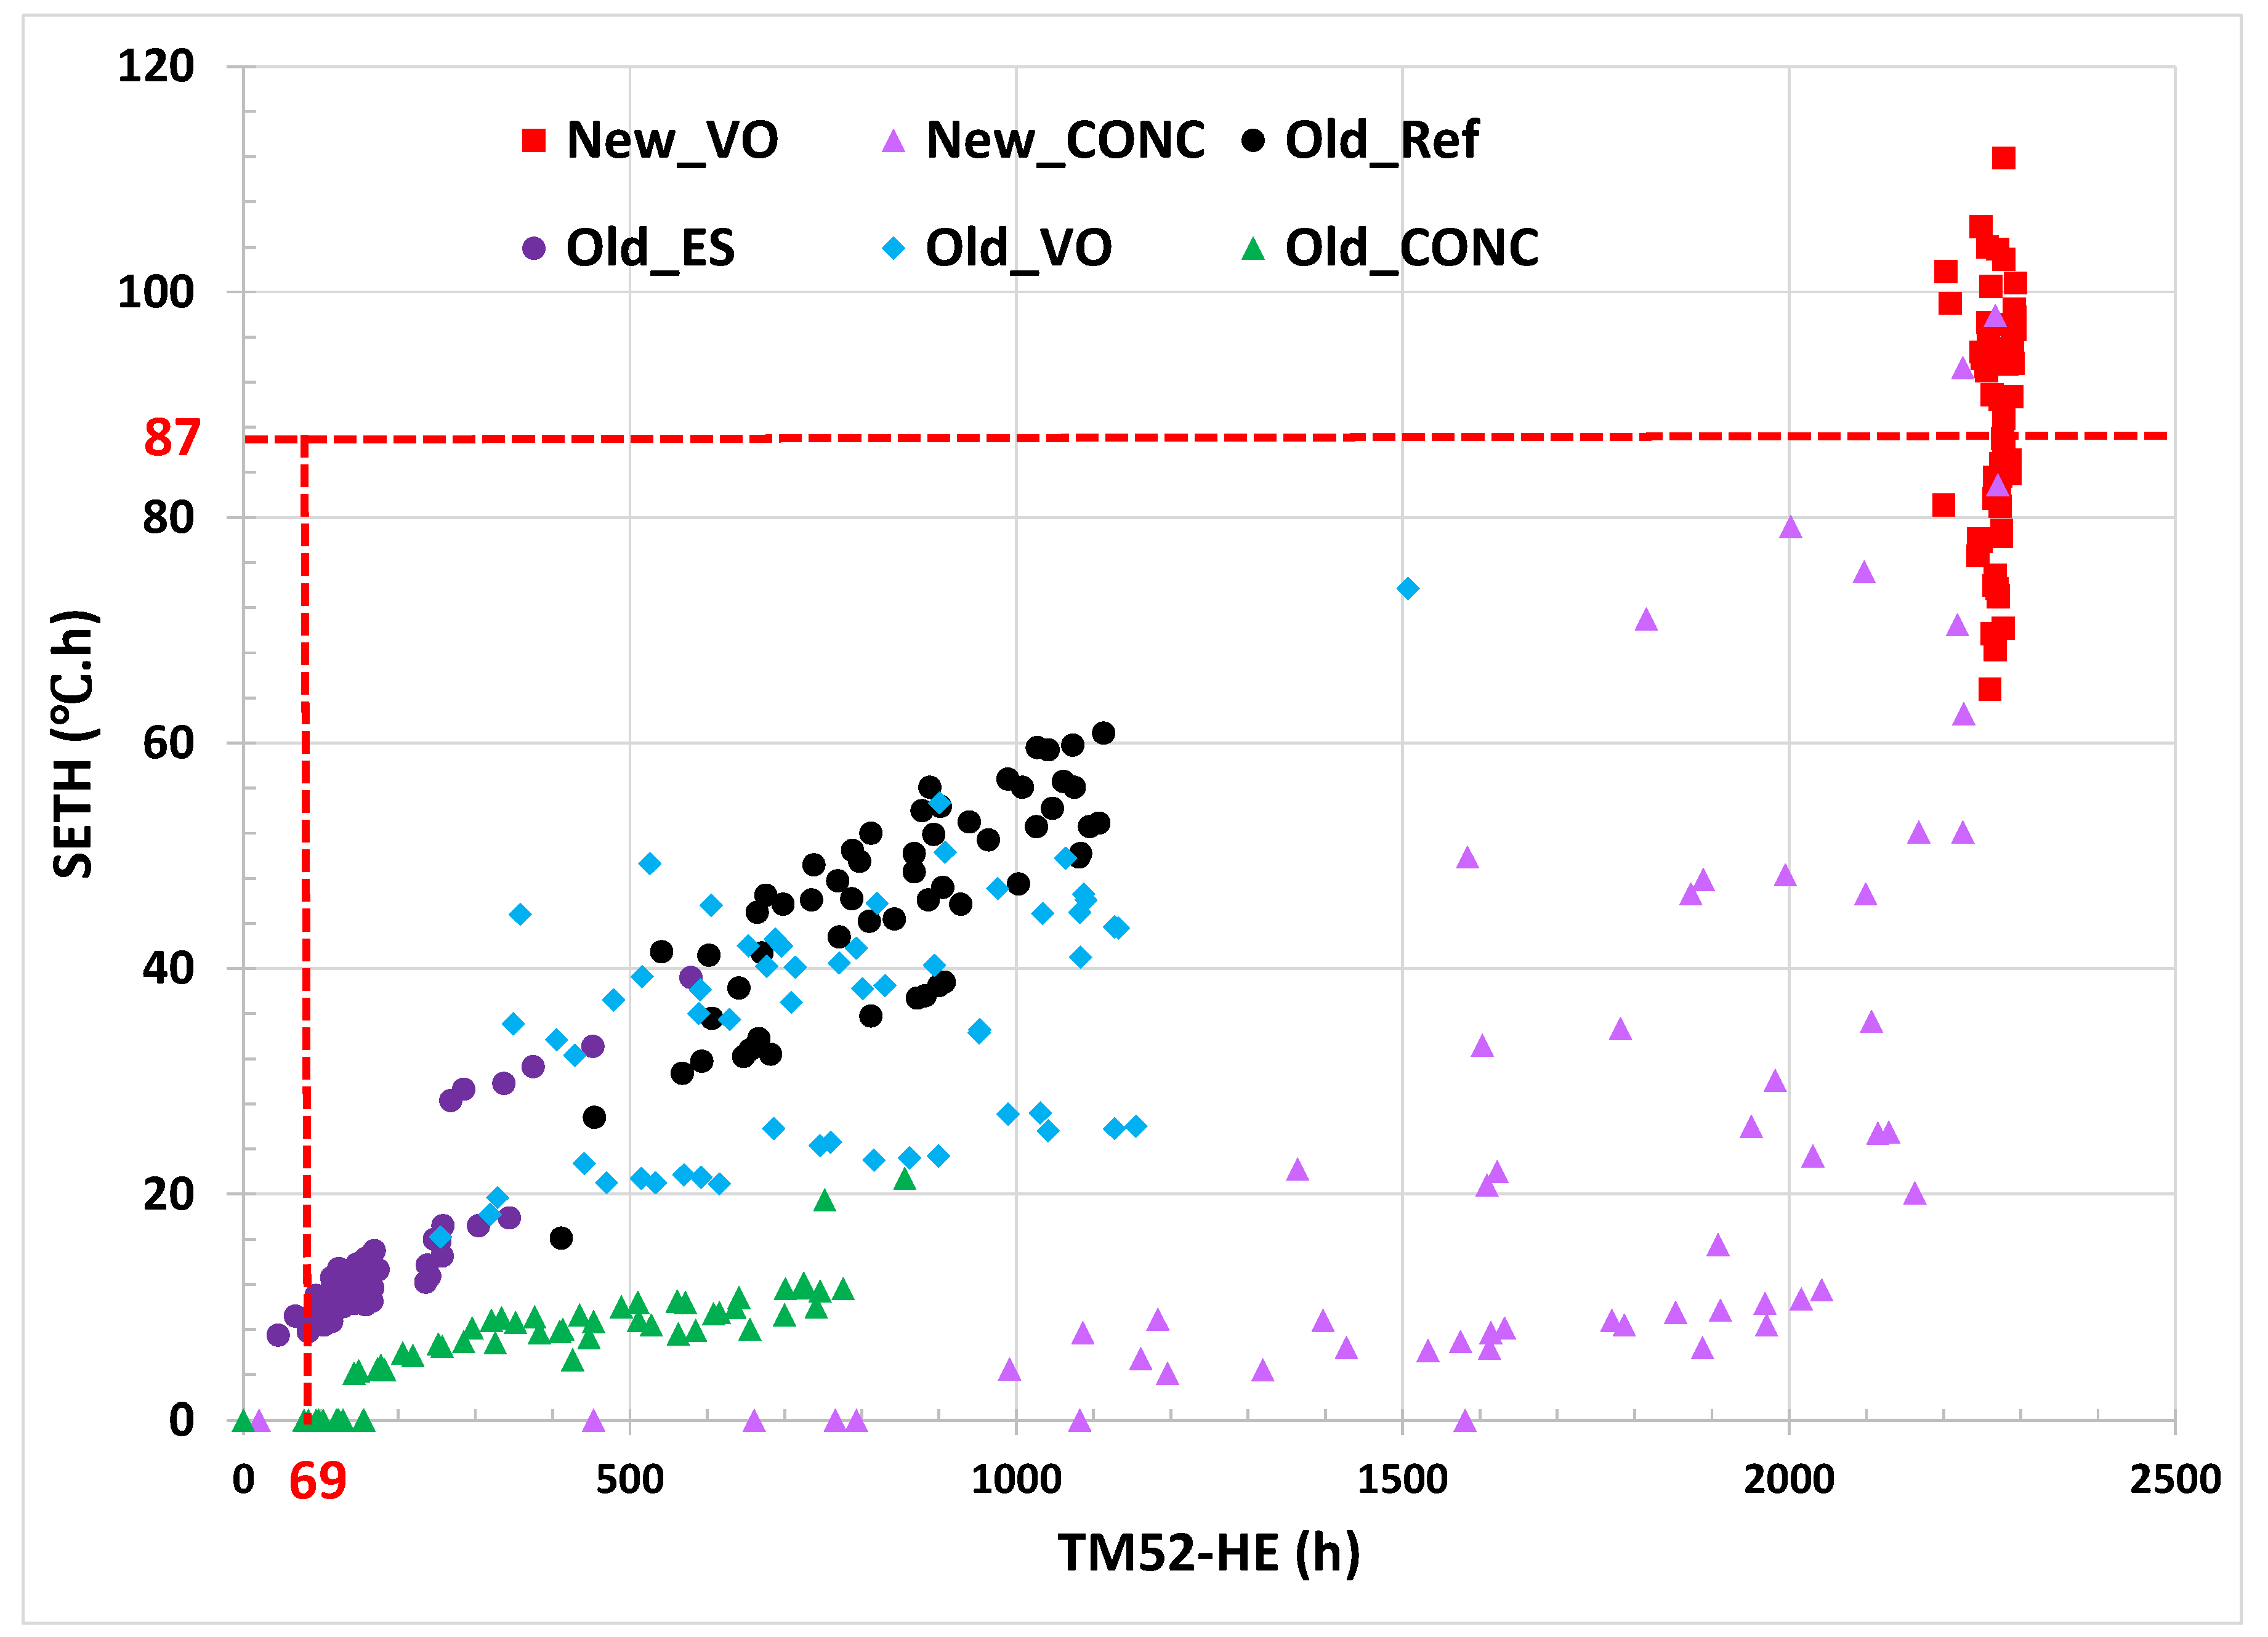
| Criterion | Proposed (Old/New) | TM52 | BC | PHI | ||||||||||
|---|---|---|---|---|---|---|---|---|---|---|---|---|---|---|
| Measure | DUR (d) | SETH (°C⋅h) | HE (%) | WDH (°C⋅h) | ΔTmax (°C) | HE (h) | HE (%) | |||||||
| Ref | 2 | 76 | 33 | 4196 | 29 | 98 | 43 | 124 | 4.2 | 9.2 | 1558 | 3672 | 29 | 42 |
| ES | 1 | 14 | 9 | 371 | 4 | 100 | 18 | 86 | 2.1 | 6.3 | 534 | 3583 | 20 | 41 |
| VO | 1 | 6 | 21 | 69 | 23 | 99 | 32 | 59 | 3.7 | 5.5 | 1393 | 3672 | 28 | 42 |
| CONC | 1 | 1 | 7 | 11 | 12 | 88 | 28 | 51 | 3.4 | 4.2 | 823 | 3394 | 24 | 41 |
Disclaimer/Publisher’s Note: The statements, opinions and data contained in all publications are solely those of the individual author(s) and contributor(s) and not of MDPI and/or the editor(s). MDPI and/or the editor(s) disclaim responsibility for any injury to people or property resulting from any ideas, methods, instructions or products referred to in the content. |
© 2023 by the authors. Licensee MDPI, Basel, Switzerland. This article is an open access article distributed under the terms and conditions of the Creative Commons Attribution (CC BY) license (https://creativecommons.org/licenses/by/4.0/).
Share and Cite
Laouadi, A.; Ji, L.; Shu, C.; Wang, L.; Lacasse, M.A. Overheating Risk Analysis in Long-Term Care Homes—Development of Overheating Limit Criteria. Buildings 2023, 13, 390. https://doi.org/10.3390/buildings13020390
Laouadi A, Ji L, Shu C, Wang L, Lacasse MA. Overheating Risk Analysis in Long-Term Care Homes—Development of Overheating Limit Criteria. Buildings. 2023; 13(2):390. https://doi.org/10.3390/buildings13020390
Chicago/Turabian StyleLaouadi, Abdelaziz, Lili Ji, Chang Shu, Liangzhu (Leon) Wang, and Michael A. Lacasse. 2023. "Overheating Risk Analysis in Long-Term Care Homes—Development of Overheating Limit Criteria" Buildings 13, no. 2: 390. https://doi.org/10.3390/buildings13020390