Article

Energy-Performance Evaluation with Revit Analysis of Mathematical-Model-Based Optimal Insulation Thickness

1
METE Department, Engineering Faculty, Fırat University, Elazığ 23100, Turkey
2
International Trade and Business, İnönü University, Malatya 44100, Turkey
*
Author to whom correspondence should be addressed.
Buildings 2023, 13(2), 408; https://doi.org/10.3390/buildings13020408
Submission received: 28 November 2022 / Revised: 13 January 2023 / Accepted: 30 January 2023 / Published: 2 February 2023
(This article belongs to the Section Building Energy, Physics, Environment, and Systems)

Abstract

:
This study investigates the optimum insulation thickness value using MATLAB Optimization Toolbox based on a mathematical model for sandwich walls that are formed with different insulation-building materials by different fuel types for a particular city located in the second climatic region of Turkey. In the second stage of study, using the BIM-based Revit simulation program, a building was designed with the same building-insulation materials under the same climate conditions. The six different wall performances were compared for the designed building. The study proposes a comprehensive approach by combining technical and economic factors in the sustainable design of buildings. The computational results indicate that using different energy alternatives has a significant impact on the air quality in residential areas. The lowest value is reached when natural gas is used. The energy cost savings change from 7.56 to 14.12 TRY/m2 for external walls. While payback periods vary between 2.15 and 3.76 years for external walls, the lowest period for all wall types is obtained for electricity, which has a high cost. The optimum insulation thickness for 10 years of lifetime varies between 0.02 and 0.16 m. This study reflects that the highest optimal insulating thickness is reached when electricity is utilized as the energy source for all wall types. According to the Revit analysis, the lowest energy consumption of 21,677 kWh during one year using natural gas was obtained for a building material of porous light brick and an insulation material of glass wool.

1. Introduction

The efficient use of energy, as well as conservation of it, is vital in order to avoid economic and environmental problems. Heat insulation is one of the most significant stages towards developing policies related to energy efficiency on a global scale. Residential areas, consuming around 30–35 percent of the total energy in Turkey, possess a significant energy-saving potential, thus drawing an increasing amount of attention [1]. Although insulation is an application that increases the initial investment cost, it contributes to the energy conservation and overall economy depending on the payback period calculated through the initial cost and energy conservation.
Considering that fossil energy sources are quickly depleted, it is vital for a building to provide thermal comfort using the minimum amount of energy. To reduce the heating energy consumption to a minimum level, thermal insulation must be as high as possible. Providing thermal comfort in buildings at optimum conditions is enforced by the standards and regulations related to the construction industry. First, the “Regulation on Heat in Buildings” was put into force by the Ministry of Public Works and Settlement on 8 May 2000 [2]. Later, the “TS 825 Thermal Insulation Standard” [3,4] came into force following a revision since 14 June 2000 [5]. Nowadays, the compulsory criteria are applied for providing thermal comfort in newly built houses by using these standards and regulations. These regulations and standards clearly indicate that reaching thermal comfort in buildings is directly related to the thermal features of the materials utilized as construction elements and/or components at appropriate thickness levels. Similarly, the majority of the research conducted on energy conservation cover the required actions towards conservative consumption of energy sources. Such actions aim for conservation of the energy being spent on the heating and cooling loads of buildings [6]. The economic dimension of the improvement is investigated through research considering parameters such as the life of the building, reduction of energy cost, insulation application, and change of heating systems [7].
To resist heat flow, thermal insulation materials or their combinations are primarily utilized. A heat insulator is a weak thermal-conductive material with a lower thermal conductivity coefficient. Insulation is utilized to prevent thermal loss or promote energy savings in construction and manufacturing operations. Though its main purpose is economic, it also provides a more precise personal conservation and a check of operating temperatures. It prevents condensation on cold superficies and the corrosion that follows. These materials are porous and have a large number of dormant air cells [8,9]. Thermal insulation for building external walls is regarded as one of the more efficient methods of reducing energy usage for heating or cooling in buildings at a time when the demand for electricity is rising because of the increasing human population, sustained demand for comfortable living circumstances, and development and expansion projects. Furthermore, rising energy costs and the negative environmental impact of power plants overall support measures to significantly decrease energy usage. Air pollution such as SO2, CO, CO2, and dust grains are also reduced by insulation systems. Furthermore, insulation improves interior thermal convenience by lowering the thermal losses or savings from buildings to the environment during hot and cold months, respectively [10,11].
The thickness of insulation is determined by a variety of factors, including the building type, function, orientation, shape, insulation-building materials, cost, fuel type, climatic circumstances, and performance of air conditioning [12]. Thermal insulation in building exterior envelopes affects energy consumption, methodologies for choosing the optimal insulating thickness for diverse wall styles, thermal insulation materials, and their implementation in building external walls. The exterior walls account for 50 percent of heat loss in buildings, followed by doors and windows (20 percent), roofs (20 percent), and the foundation walls and basement (10 percent). The electricity and heating bills can be cut in half with energy savings provided by a building’s thermal insulation, ensuring more effective utilization of energy sources [13]. Though the thermal savings and losses diminish as the insulation thickness increases, the total insulation cost, including installation and material expenses, increases as well. As a result, most investigators have defined the optimal insulating thickness in relation to expenses [14,15,16].
Many studies have been reported in the literature about the optimal insulation thickness depending on the degree-day methodology to predict the conduction loads under constant circumstances. Alsayed et al. computed the optimum insulating thickness in building external walls based on a life-cycle cost investigation with diverse degree-days. The conclusions showed that for all occasions, the optimum thickness changed from 0.4 to 9 cm [17]. Accordingly, Hasan applied the optimal thickness for a Palestine city. It was calculated to result in savings of up to USD21/m2 of wall field for polystyrene and rock wool. Payback durations changed from 1.3 to 2.3 years for polystyrene and from 1 to 1.7 years for rock wool [18]. In Sudan, Khalid et al. modelled diverse climatic regions; they defined optimal thickness changes from 0.041 to 0.006 mm for different kinds of wall and diverse insulating materials. The annual mean energy conservation varied from USD13.1 to 0.4/m2 [19]. For Athens in Greece, Axaopoulos et al. performed a study and mentioned that the optimal thickness changed between 0.234 and 0.112 m. Furthermore, for their results, the CO2 rate declined by 72.2–63.2 percent depending on the location and structure of the wall [20]. Yu et al. analyzed a few diverse insulation materials’ cost efficiency in China’s moist sub-tropical climatic region to obtain the optimal thickness. Payback periods changed between 4.7 and 1.9 years throughout a 20-year period while the optimal thickness of foamed polyurethane, expanded polystyrene, and extruded polystyrene changed between 0.236 and 0.053 m [21]. In Iran, Ziapour et al. conducted research on a novel external envelope for buildings in provinces in three diverse climatic zones. The payback time and optimal thickness were analyzed from the findings for the chosen provinces. The payback duration was reported to be 0.33, 0.49, and 0.57 years, respectively, while the optimal thickness was 16.35, 11.95, and 10.6 cm, respectively [22]. By utilizing P1P2 financial methodology, Vincelas et al. evaluated seven common insulating materials applied in five different wall structures for buildings situated in Cameroon. The most appropriate wall was found to be 9 cm extruded polystyrene. Depending on the type of wall, the payback period, optimum thickness, and the energy savings were reported to be between 0.91–2.21 years, 8.2–10 cm, and USD44–50 /m2, respectively [23]. In Malaysia, Shekarchian et al. computed some common insulation materials’ optimum thickness values [24]. As the most efficient insulation material, fiberglass urethane having an optimal thickness (2.2 cm) could obtain an energy conservation of USD1.8 /m2. In Greece, Kontoleon and Tzoulis calculated optimal thicknesses by taking the primary directions into account. The findings displayed that the extruded polystyrene’s optimal thickness ranged from 7.5 to 10 cm depending on the external wall directions [25]. Other studies on the assessment of optimal insulating thickness on the external walls depending on the degree-day analysis and life-cycle cost concept with the inclusion of the effect of different energy resources, diverse insulation materials, and climate zones have been performed by references [26,27,28]. For China’s moist sub-tropical climate zone, Huang et al. investigated a novel improved aerogel super-insulating material to maintain financial advantages and energy conservation in thermal insulating implementations. The super-aerogel insulating material was tested against the four most-commonly used insulating materials in implementations. For the zone researched, the aerogel’s optimal thickness was determined to be 3.70 mm. Additionally, the greenhouse gas emission degradation potency was greater than that of the four diverse insulating materials when the novel material’s thickness was increased [29]. For a characteristic wall structure, Daouas computed the optimal insulating thickness, payback period, and energy savings depending on both heating and cooling loads. The author computed the optimal insulating thickness to be 0.1 m, the payback period to be 3.29 years, and the energy savings to be 71.33 percent. It was discovered that the wall direction had little impact on the optimal insulating thickness, but a larger impact on energy savings, which could reach a maximal of TND23.78 per m2 in east-oriented walls [30]. In Qatar, Al-Khawaja calculated the energy costs for insulating materials, solar irradiation, and optimal insulation thickness [31]. Akash and Mohsen investigated energy savings by insulating with polystyrene, rock wool, and air gaps. Air gap, rock wool, and polystyrene were found to save 5.4, 34, and 36 percent of energy, respectively [32]. In Saint Petersburg, Murgul and Pukhkal investigated the insulation of historical buildings. It was remarked that isolation should be applied from the inside in order to preserve the historical buildings’ exterior structure and appearance. As a result, the authors discovered that using extruded polystyrene prevents condensation in buildings. They reported insulating materials with a water-vapor permeability of at minimum 12 m2 hPamg1 prevent condensation [33]. In southern Sweden, Tettey et al. investigated the impact of various external wall insulation mechanisms on primary energy use in a building. As insulation, they utilized glass wool, rock wool, and expanded polystyrene. According to their calculations, rock wool performs 17 percent better than expanded polystyrene, and there is no important variance between glass wool and the other materials [34]. In China’s five diverse climatic zones, thermal insulation materials’ optimal thicknesses for extruded polystyrene and expanded polystyrene were investigated in research led by Zhu et al. [35]. The cooling and heating times were noted at the same time. When the annual energy cost of two different insulating materials of identical thickness was compared, it was determined that XPS is more advantageous than EPS [35]. Nyers et al. investigated the optimal energy-financial thickness of heat insulation layers for a building envelope. The financial modelling is divided into two sections: energy and economic. The model’s economic component contains algebraic formulas, investment, usage periods, and savings [36]. In Cameroonian buildings, Ghislain and Cyrille Vincelas presented comparative research for calculating the most cost-effective integration of building envelope and optimal insulating material thickness for energy conservation. The degree-day notion was utilized to calculate the building’s transmission loads for annual cooling. Furthermore, in economic analysis, the P1P2 methodology was utilized to identify the optimal insulating material thickness, payback period, and energy savings for buildings [23]. Singh et al. computed the optimal insulating thickness, payback periods, and life-cycle savings in India’s composite climatic zone using life-cycle cost analysis [37].
Depending on the top cooling loads for a present residence in the Lahore region of Pakistan, Siddique et al. identified the optimal insulating thickness on roofs and exterior walls [38]. For a residence in the Amman region of Jordan, Malek and Hamdan utilized MATLAB simulation to compute the optimal insulating thicknesses in order to decrease the expense of the consumed heating load [39]. In Cameroon’s hot and cold tropical climates, Nematchoua et al. presented the most cost-effective and optimal thermal insulation thickness for buildings. Economic modelling was utilized to compute the optimal insulating thickness, payback period, and energy savings over the building’s lifetime of 22 years [40]. Jraida et al. performed research to identify the optimal insulating thickness in six provinces in six diverse climatic zones of Morocco. Optimum insulation thicknesses for extruded polystyrene were determined as 5.7 cm, 2.3 cm, 4.1 cm, 7.7 cm, 5.2 cm, and 3.7 cm for Errachidia, Marrakech, Ifran, Fez, Agadir, and Tangier, respectively [41]. Baniassadi et al. determined the optimal insulating thickness for diverse climatic regions of Iran. The optimal thickness was found to be greater than 6.0 cm in cold regions [42]. Changsha, Chengdu, and Shaoguan were the three provinces in China’s cold winter and hot summer zones where Liu et al. (2015) determined the ideal insulating thicknesses. The ideal insulation thicknesses for extruded polystyrene ranged from 5.3 cm to 6.9 cm, whereas those for expanded polystyrene varied between 8.1 cm and 10.5 cm [43]. Barrau et al. computed the optimal insulating material thickness considering a diverse lifespan of the insulation and building materials. The conclusions of this research display that varying the building’s lifetime from twenty to fifty years raises the optimal insulating material thickness. Additionally, varying the optimization attributes from financial to ecological priorities greatly affects the conclusions [44]. Derradji et al. carried out research to examine a model structure’s optimal insulating material thickness both experimentally and numerically. Different characteristics such as the building envelope structure, fuel kind, and window field were studied [45]. In the Tripoli region of Libya, Alghoul et al. examined the effect of electrical prices on building cooling and heating energy usage, as well as insulating material thickness [46]. In Algeria’s south, Marif et al. investigated the thermal efficiency of external and internal wall insulation for buildings. The authors came to the conclusion that there was no variation between external and internal wall insulation, except that the internal superficies’ temperature decreased much more quickly when internal insulation material was used [47]. Sagbansua et al. researched the insulation optimization of energy-efficient building envelope alternatives for sustainable cities [48]. Some studies have also introduced the concept of insulation thickness optimization, as well as multi-objective optimization [49,50,51].
Heat loss from the building envelope is significant, so thermal insulation material on the building envelope is also critical. An optimal level of insulation thickness applied on the building envelope results in a much lesser thermal load transmission. In Turkey, a brief summary of the studies pertaining to optimum insulation thickness utilizing diverse insulating materials is given in Table 1. In this table, the total expense is the sum of the insulation and energy expenses. The insulation material’s cost increases linearly with the insulation material’s thickness. The insulating material thickness with the minimum total expense is taken as the optimal insulating thickness. In these studies, optimal insulation thicknesses were investigated by considering the climatic information of a certain region and using diverse energy sources. Depending on whether the region is warmer or colder, the climate data directly affects the amount of energy usage and thus the amount of detrimental gas emissions spread to the environment [52].
When the literature is examined in detail, different methods have been used to determine and evaluate the optimum insulation thickness [63,64,65]. However, in order to evaluate the efficiency of optimum insulation thickness in terms of energy consumption, the combination of the P1P2 method and Revit was used for the first time in the literature in this study. In this respect, an original study was carried out to guide the applicability of the results obtained in this study in real designs with the support of Revit, a simulation that gives highly accurate results. Revit analysis was supported with different side simulations. The building renders were obtained using Lumion software. The sample building model was made in the Autodesk Revit 2021 program. Then, a building energy model was created over the alternatives. Sample building analyses were conducted via Autodesk Green Building Studio. Modeling was carried out with BIM-based design tools and energy analyses were performed with Green Building Studio and Revit. Optimum designs were determined by comparing the different alternatives created. The effect of the created wall layers on the energy loads of the building was investigated. In this way, the most effective wall combinations were determined using simulations when the optimum insulation thickness was used for the study region.
The first part of this study provides economic and environmental analysis through mathematical-model-based calculations. In these analyses, the payback period and optimal insulating thickness are computed for four energy resources (fuel oil, coal, natural gas, and electricity). XPS and glass wool are used as insulation materials in a building envelope designed as a sandwich wall. Porous light brick, gas concrete, and bims are used as construction materials. In a city with the hottest climatic conditions located in the second climatic region of Turkey, analyses were applied considering the degree-day region value. In the second part, a building with sandwich walls was designed in the climate conditions of the second region with Revit simulation. When natural gas is utilized as an energy source, the energy consumption amounts of the building were investigated using the optimum thicknesses of insulation materials calculated according to the second region. The energy performances of the building designed without insulation and with optimum insulation thickness were compared.

2. Materials and Methods

A systematic framework for optimization of insulating material thickness is improved from Hasan [18] and then performed for a city. The optimization depends on the life-cycle cost evaluation. Life-cycle savings of the buildings insulated are calculated for different regions in this study. Generalized formulas for choosing the optimum insulating material thickness as a function of thermal wall resistance and degree-days are produced. In this study, the analysis method in Hassan’s study was applied to a different region and then supported with Revit analysis.

2.1. Calculations for Building Performance with Sandwich Design

In this study, a building with sandwich external walls is designed in the second climatic region according to TS 825 of Turkey. The TS 825 standard defines the calculation rules for determining the heating energy need in buildings and comparing them with the allowable limit values. The U-value determined for the building’s shell is an important parameter describing the energy need of the building. TS 825 describes the minimum requirements for U-values for the roof, facade, windows, and base plate of new buildings and buildings to be renovated. The climatic regions and location of the analyzed building according to TS 825 of Turkey are displayed in Figure 1.

2.1.1. Calculating Heat Loss

Heat loss in buildings occurs, in the majority of cases, through the building’s external walls, ceiling, windows, and basement. In this study, heat loss calculations are made assuming heat loss occurs through the external walls. The thermal loss per unit field of external walls is
q = U · T b T 0
The yearly thermal loss per unit field ( q A ) can be calculated utilizing the formula [32,66,67,68];
q A = 86 , 400 × D D · U
where D D = degree-day (°C day).
The yearly energy amount ( E A ) required for heating is calculated approximately by dividing the yearly thermal loss by the performance of the combustion system due to the thermal loss through a unit area of the external wall. The efficiency of the distribution system as well as that of the combustion system also affects the amount of annual energy.
E A = 86 , 400 × D D · U η
For a typical wall, the total thermal transmittance (the amount of heat passing per unit time from 1 m2 of the building element consisting of different material layers) can be calculated by
U = 1 R i n t + R w + R i n s + R e x t
where R i n t and R e x t are the thermal resistances of the internal and external surfaces, respectively. R w is the total thermal resistance of the non-insulated wall layers. R i n s is the insulation material’s thermal resistance:
R i n s = x k
where k and x are the thermal conductivity and insulation materials’ thickness, respectively.
U = 1 R t w + R i n s
where R t w is the total of R i , R w , and R d thermal resistances. The amount of yearly energy needed for heating can be computed through the formula below:
E A = 86 , 400 × D D R t w + x k η
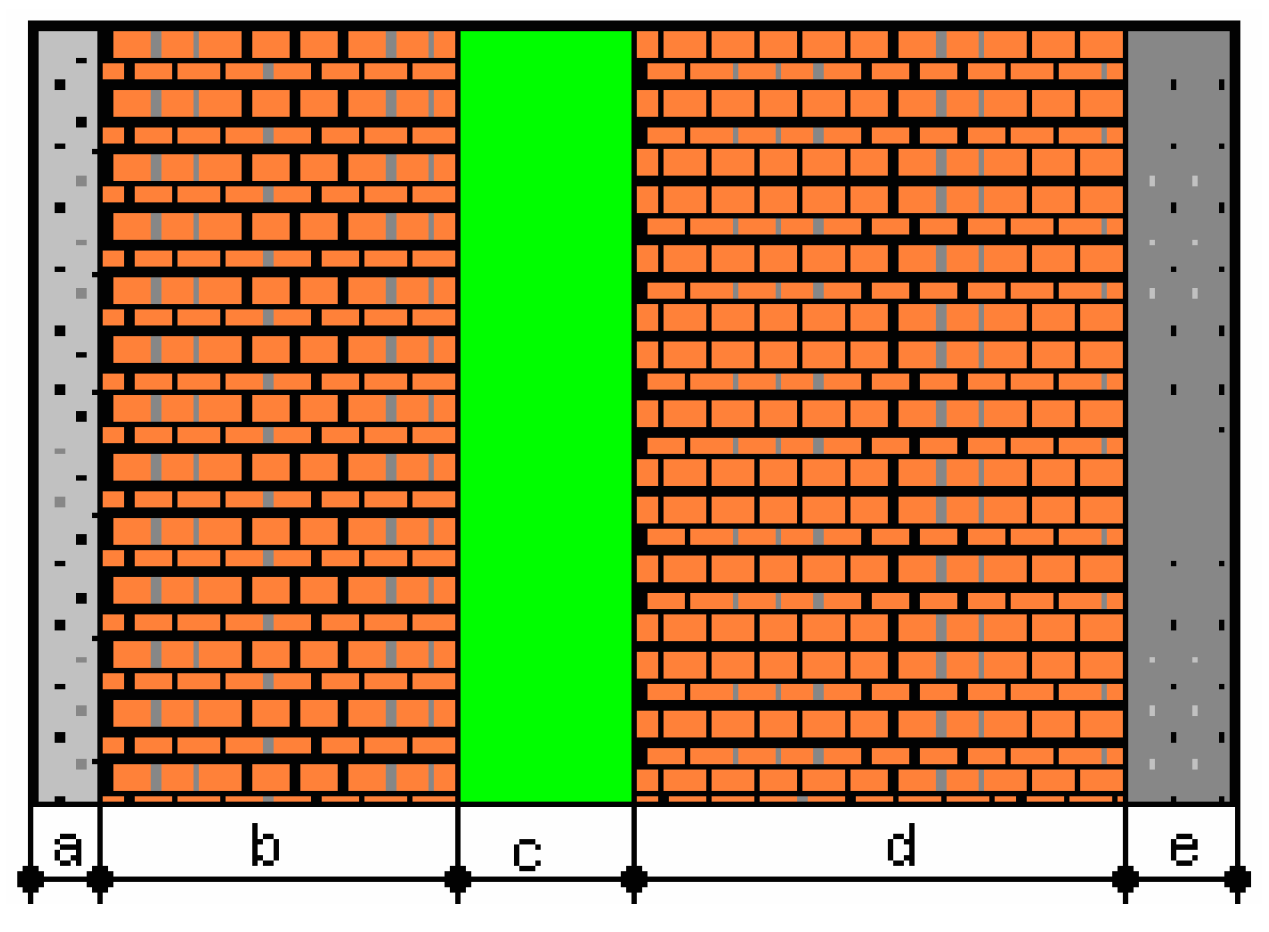
A typical representation of the external wall utilized in this paper is provided in Figure 2. Physical features of the materials utilized in such walls can be found in Table 2.
There are several methodologies for decreasing this air-conditioning load, but one stands out: designing and selecting the proper building external wall and its elements. The thermal properties of the building external wall, particularly the heat resistance of the insulating material utilized, influence the energy and thermal efficiency of buildings. The main factor influencing the efficiency of a thermal insulating material is the thermal conductivity coefficient, which displays the capability of heat to move through a given material because of a temperature variation. Thermal insulating material utilized in building envelopes aids to decrease the building’s energy need. It develops thermal comfort and, when utilized correctly, lowers the building’s operating expenses.
Using an appropriately constructed external wall and its elements stands out among the many options to lower the air-conditioning load. The energy and thermal efficiency of buildings is influenced by the thermal properties of the building envelope, especially the utilized insulation’s heat resistance [66,67,68,69]. Buildings with thermal insulation in their walls and roofs consume less energy overall. When used properly, it enhances thermal comfort and decreases the building’s running costs.

2.1.2. Annual Energy Cost

Yearly energy expense of heating per unit field can be calculated through the formula below [70,71,72,73,74]:
m f A = 86 , 400 × D D · m y R t w + x k H U · η
where H U (J/kg) is the base thermal value of the fuel type determined while my (TRY/kg) is its price.

2.1.3. Optimization of Insulation Thickness

Life-cycle cost analysis is utilized to calculate the optimal insulating thickness. The total heating cost needs to be evaluated along with the lifetime period (N) and present-value factor (PWF). PWF depends on the interest (i) and inflation (g) rates. Considering the inflation and interest rates, the real interest rate (r) and PWF values can be calculated as below [70,71,72,73,74]:
if   i   >   g ,   r = i g 1 + g
if   i   <   g ,   r = g i 1 + g
P W = 1 + r N 1 r 1 + r N
The lifetime period of N is considered to be ten years. The Turkish lira was used in the calculation as the monetary unit. For an insulating cost Cins (TRY/m2), insulation material cost Cy (TRY/m3), and insulation thickness x,
C i n s = C y · x
Consequently, the total heating expense of an insulated building can be calculated using the LCCA method composed of the total of all expenses related to the system as below [70,71,72,73,74]:
C t = C A P 1 + C y x
or
C t = 86400 · D D · C f · P 1 R t w + x k · H U · η + C y · x
The net energy savings for heating (S) can be computed utilizing the formula below:
S = C A P 1 P 2 C i n s
or
S = 86400 D D C f R t w + x k H U η P 1 P 2 C y x
The total heating cost over an N-year period is converted to present value by multiplying it by P1. The P1 factor is defined as the ratio of lifetime fuel savings to first-year fuel savings. P1 is impacted by the inflation rate “d” in addition to the interest rate “I”. The P2 factor is defined as the ratio of the additional capital investment’s life-cycle expenses to the initial capital investment [71]. The equations for P1 and P2 are as follows:
P 1 = [ ( 1 + g ) / ( g i ) ] [ 1 ( 1 + i / 1 + g ) N ]
P 2 = 1 + P 1 M R v ( 1 + g ) N
The optimum net energy savings can be calculated by maximizing Equation (14). Thus, the optimal insulating thickness is calculated by treating Equation (14) as the objective function and utilizing MATLAB Optimization Toolbox. The payback period Np can be calculated through the formula below [70,71,72,73,74]:
N p = ln [ 1 P 2 C y H u η R w t + R w t 2 k g i 86400 D D C f 1 + g ] ln 1 + i / 1 + g

2.1.4. Calculation of the Fuel Consumption Process

Burning fossil fuels such as natural gas, petroleum, and coal causes a massive amount of hazardous gases such as CO2 and SO2 resulting in environmental problems. Such gases (CO2 in particular) cause an increase in the earth’s temperature by holding the solar rays that are reflected back by the earth. Consequently, climatic changes throughout the world occur in the long run. Sulfur-based chimney-gas emission joins with water particles in the air to form sulfuric acid, which causes acidic rain. Such rain destroys plants and structures. Taking necessary insulation precautions reduces the heating demand of buildings and hence reduces the amount of chimney gas that would in turn be released to the environment. The general chemical function for burning fuels is provided below [70,71,72,73,74]:
C a H b O d S e N f + α A O 2 + 3.76 N 2 a C O 2 + b 2 H 2 O + B O 2 + e S O 2 + D N 2
where A, B, and D are constants calculated through the functions below:
A = a + b 4 + e d 2
B = α 1 a + b 4 + e d 2
D = 3.76 α a + b 4 + e d 2 + f 2
The emission rate caused by burning 1 kg of fuel is
M C O 2 = a C O 2 M = kg   CO 2 / kg   fuel
M S O 2 = e S O 2 M = kg   SO 2 / kg   fuel
Stating the right-hand side of the functions above in terms of annual fuel consumption, the total emission amounts of CO2 and SO2 can be computed utilizing the below functions:
M C O 2 = 44 a M m y
M S O 2 = 44 e M m y
where M is the molecular weight of the fuel computed by the function below:
M = 12a + b + 16d + 32e + 14f
Prices, heat values, and performances of the fuels utilized in the computations are provided in Table 3.

2.2. Revit Analysis

One of the cloud-based services is Green Building Studio. It allows building performance simulations to be conducted for improving energy efficiency and for working earlier in the design process towards carbon neutrality. It helps to expand the potential of traditional methods to construct high-efficiency buildings at a fraction of the time and expense. To perform energy simulation for comprehensive architectural models and conceptual forms generated in Revit, Energy Analysis for Autodesk Revit is utilized. Revit is a simulation program that calculates and analyzes U-values in its interface. The outcome of the simulation is used to consider the usage and consumption of building resources and then to iterate the designs to boost their sustainability ratings. In Revit, the energy model developed from the Revit building model can be shown, so the energy model used for analysis can be validated and viewed.
Lumion is a 3D rendering simulation program. It is completely compatible with most CAD and 3D programs. In this study, a building is designed in the second climatic region according to TS 825 of Turkey. The designed building is created in six types using the material properties defined in Table 4. Natural gas is selected as an energy source. The building renders obtained using Lumion software and the building’s 3D view obtained using Revit are displayed in Figure 3. The designed building types according to different building and insulation materials are listed in Table 5.

3. Results and Discussion

3.1. LCCA (Life-Cycle Cost Analysis)

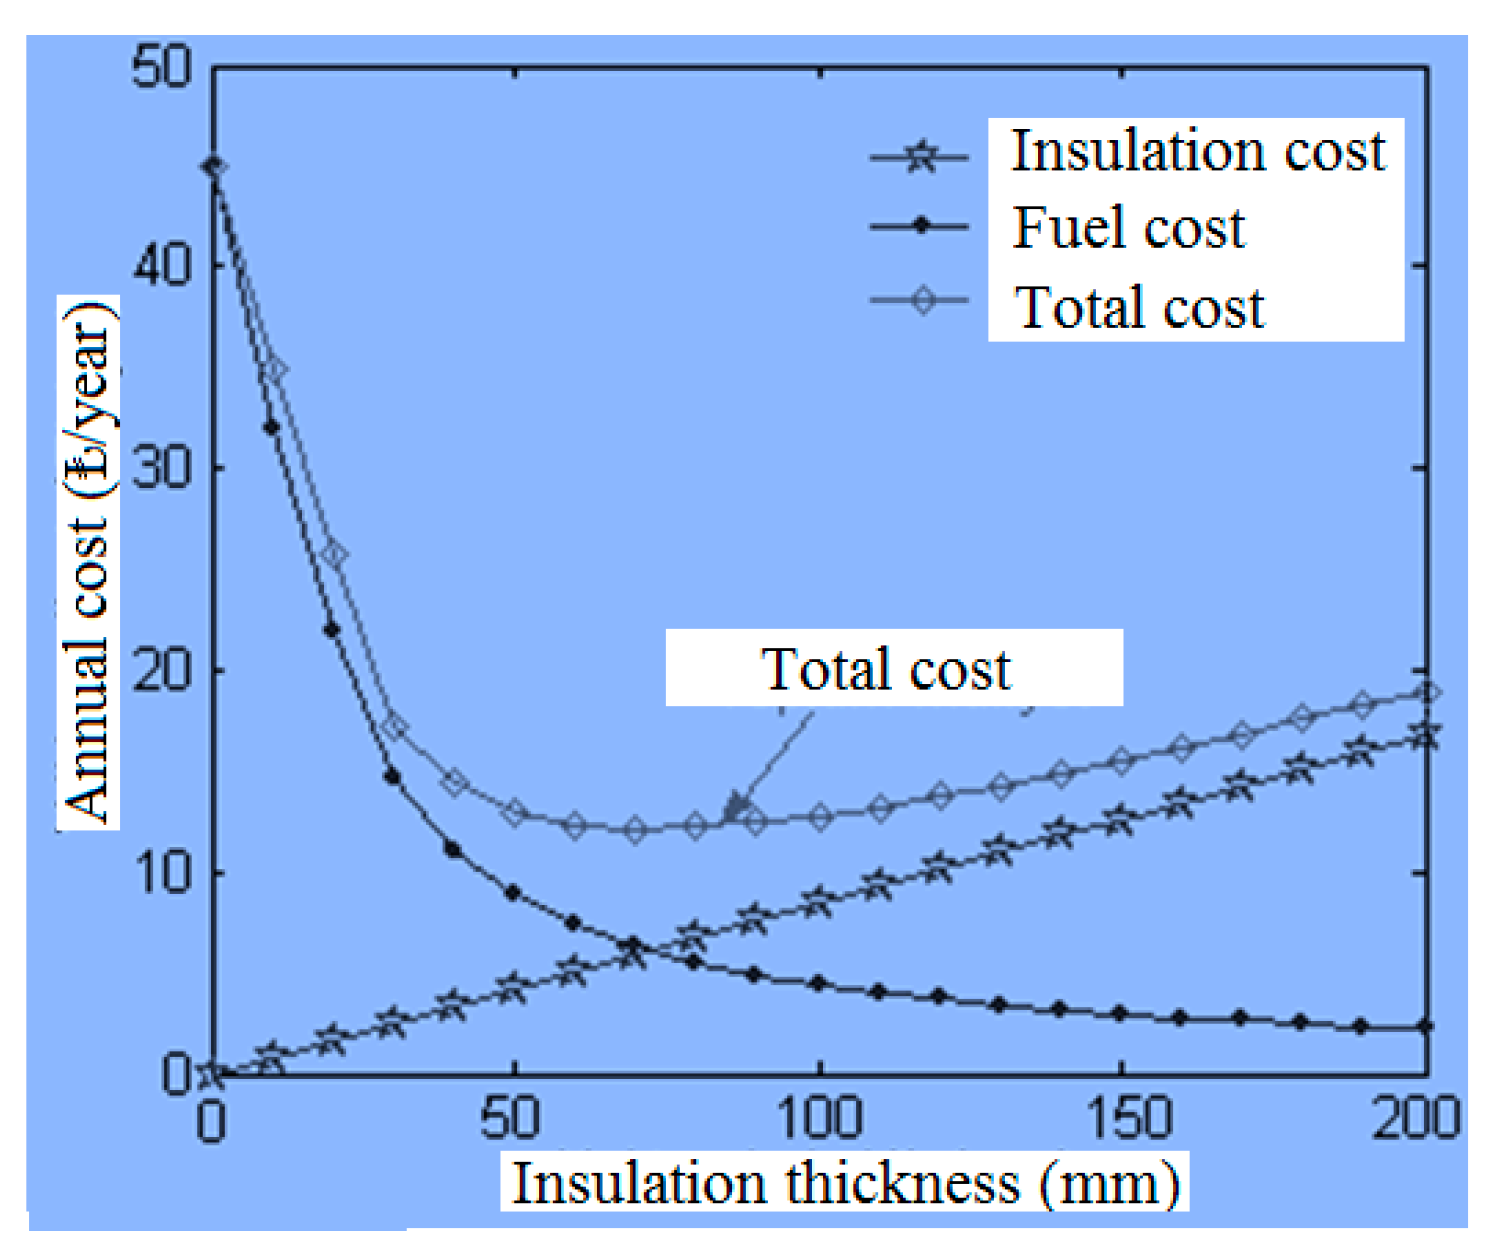
It should be noted that insulation does not eradicate thermal transfer; rather, it reduces it. The thicker the insulating material, the slower the thermal transfer, but the higher the insulation cost. As a result, an optimal thickness of insulation is required, which corresponds to the lowest integrated cost of insulation and thermal loss. Insulation costs increase linearly with thickness, whereas thermal loss costs decrease exponentially. The total expense, which is the insulation’s sum and lost-heat costs, reduces first, reaches a minimal value, and then begins to rise. The insulation material’s optimal thickness is the thickness that corresponds to the lowest total cost, and this is the recommended insulation thickness to be installed. When the insulation material is selected, and the only factor to be identified is the most cost-effective thickness, the debate about the optimal thickness is viable. However, there are several alternatives, and selection can be somewhat complicated because each insulation material has a different thermal conductivity, service life, and installation cost [53,73].
This study covers the determination of the optimal insulating thickness for building performance designed with sandwich walls in the second climatic region. The thickness values are calculated for four types of energy source used in heating and two insulating materials. Life-cycle cost analysis is utilized in the calculations. The optimal insulating thickness values for external walls and the resulting amount of annual savings along with payback durations are computed for buildings located in the second climatic region when XPS and glass wool are used as the insulating material. Since the most widely used thermal insulation materials in the insulation of buildings in Turkey are XPS and glass wool, they were preferred in this study. The optimal insulating thickness is computed by considering inflation and interest ratios using life-cycle cost analysis. Life-cycle cost analysis is the operation of compiling all expenses that the producer or owner of an object will incur over its lifespan. The impact of insulation thickness on the total energy expense over a 10-year lifetime is displayed in Figure 4. The heating savings were taken into account in calculating the optimum insulation thickness, since the analyzed region is more exposed to cold climate conditions throughout the year. Increasing the insulating thickness applied on the buildings’ external walls decreases the heating load and heat loss as a result. Consequently, the fuel cost decreases as well. On the other hand, increasing the insulation thickness results in higher insulating costs. However, increasing the thickness causes a decrease in the total cost composed of the heating and insulating cost up to a certain point where the optimum insulation thickness is reached. After this point, further increasing the thickness starts to increase the total cost along with the unnecessary increase in insulating expense.
The optimal insulation thicknesses computed for the wall types utilized in this paper are provided in Table 6 for diverse energy sources. The payback durations and energy cost savings calculated depending on fuel and insulating materials for wall types are provided in Table 7 and Table 8, respectively. Table 8 indicates the energy cost savings depending on the energy source and insulating material. The optimum insulation thickness for a 10-year lifetime varies between 0.02 and 0.16 m (for XPS, between 0.02 and 0.11 m; for glass wool, between 0.04 and 0.16 m) while the annual heating cost savings lie within a range of 7.56 to 14.12 TRY/m2 (for XPS, between 7.56 and 12.84 TRY/m2; for glass wool, between 7.57 and 14.12 TRY/m2) depending on different wall types. The payback period is determined to be between 2.15 and 3.76 years (for XPS, between 2.15 and 3.38 years; for glass wool, between 2.27 and 3.76 years). The highest energy savings for the sandwich building performance is realized when electricity is used as the energy source and glass wool as the insulating material. Moreover, CO2 emission levels in the four cities investigated in this study are computed for four fuel types (coal, fuel oil, natural gas, electricity). The lowest energy savings from external walls are obtained when natural gas is utilized as an energy source and extruded polystyrene is utilized as insulating material in a bims wall.
The impact of insulation thickness on annual savings for diverse wall and energy source types is presented in Figure 5. Annual savings are directly proportional to the fuel cost. The increasing cost of fuel results in increases in the amount of savings. The figure indicates that the highest savings are obtained in cases where electricity is used while the minimum savings are obtained when natural gas is utilized.
Figure 6 shows the impact of insulation thickness on the payback period for diverse external walls and fuel kinds. The payback period for 10 years of lifetime varies between 2.15 and 3.06 years for a porous light brick wall and between 2.75 and 3.76 years for a bims wall depending on the insulating material and wall types.
The correlation of SO2 and CO2 emission rates with the insulation thickness for external wall and fuel types are presented in Figure 7 and Figure 8, respectively. CO2 emission declines when the insulation thickness is increased. When 70 mm of insulating is implemented in the wall and coal is utilized as the energy source, CO2 emission decreases by approximately 60% in a bims wall and by 73% in a porous light brick wall. The maximum CO2 emission is reached when coal is the energy source. Figure 8 indicates that the highest SO2 emission occurs as a result of coal, while natural gas does not result in any SO2 emission at all. When 70 mm of insulation is implemented in the wall, 0.0183 and 0.0151 kg/m2 of SO2 emission occurs in porous light brick and bims walls, respectively. The figure shows that SO2 emission decreases when the insulation thickness is increased.

3.2. Energy Consumption Analysis with Revit Simulation during One Year

In this phase of the study, natural gas was taken into account as the energy source with the lowest emissions according to the first analysis. Later, when natural gas is used as an energy source for XPS and glass wool, the optimum insulation thicknesses obtained through mathematical modeling were selected as the applied thicknesses of the insulation materials. For other materials, the values used in the first analysis were taken into account. A building with sandwich exterior walls was modeled under regional conditions. Using meaningful combinations of building and insulation materials selected for the study, six different types were created. The Revit program was used for evaluation. The energy usage and energy usage intensity values of the six building types modeled according to the optimal insulation thickness were analyzed. The total energy usage is the amount of energy consumed in a year.
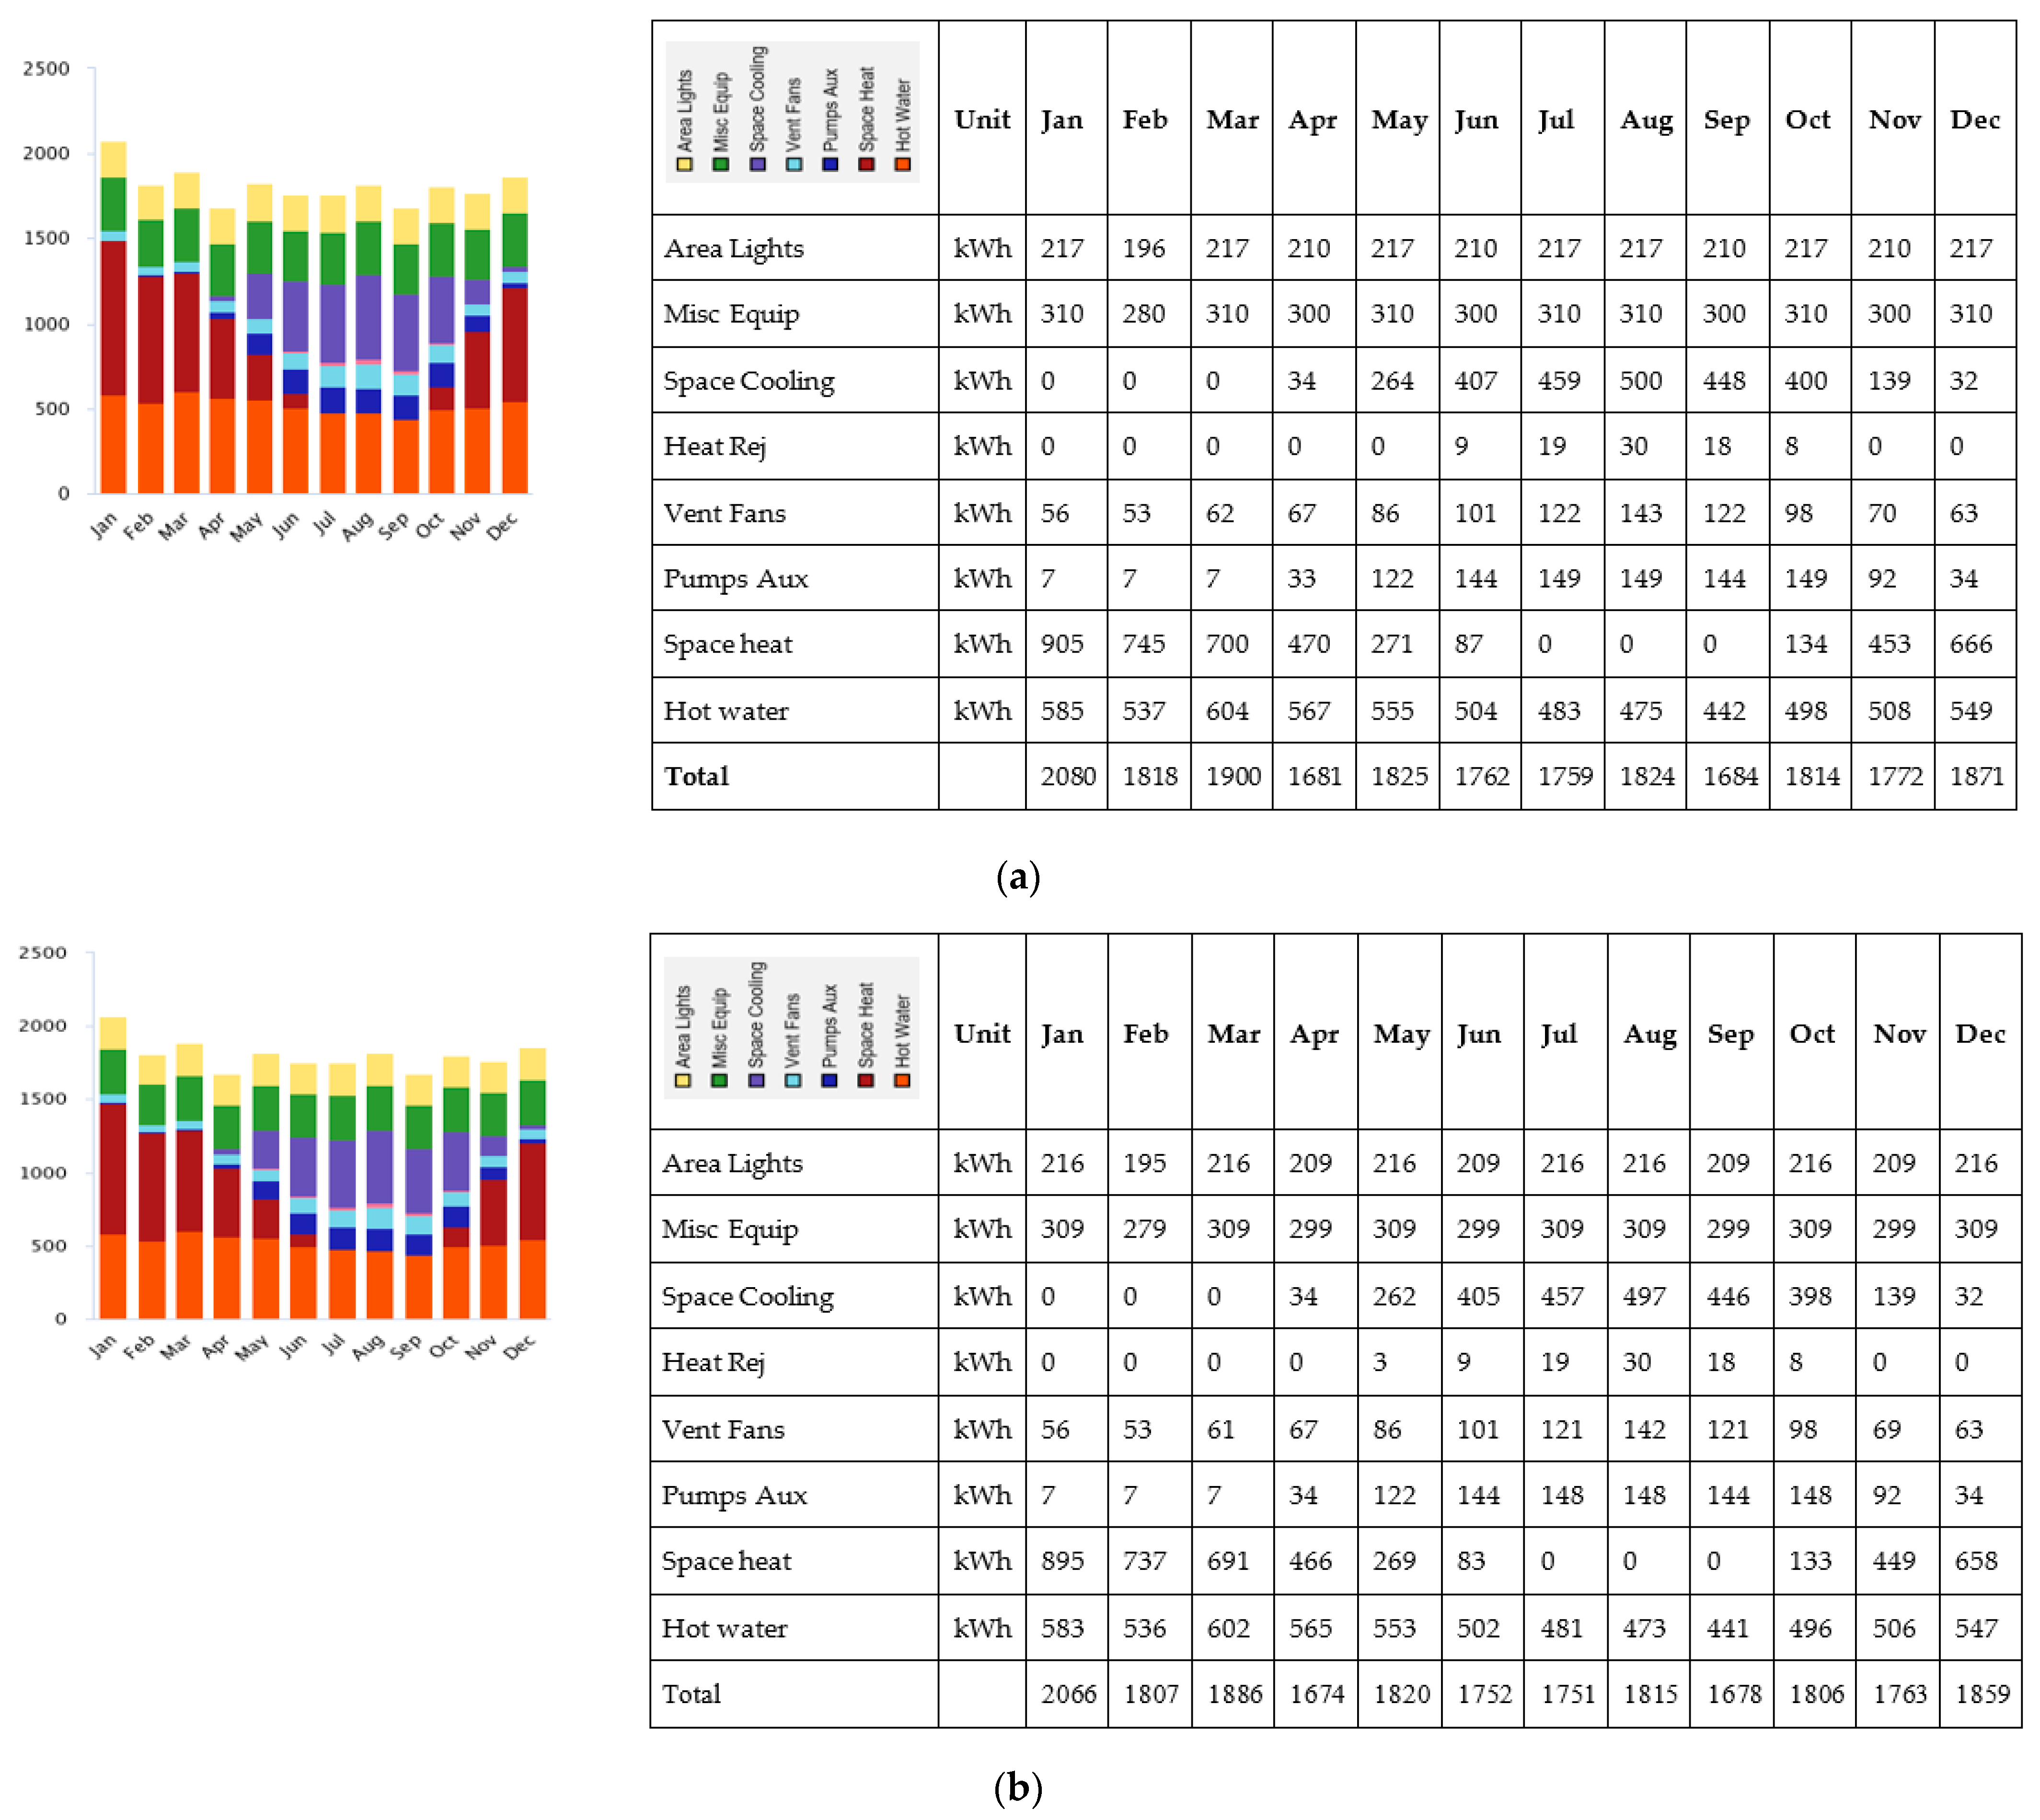
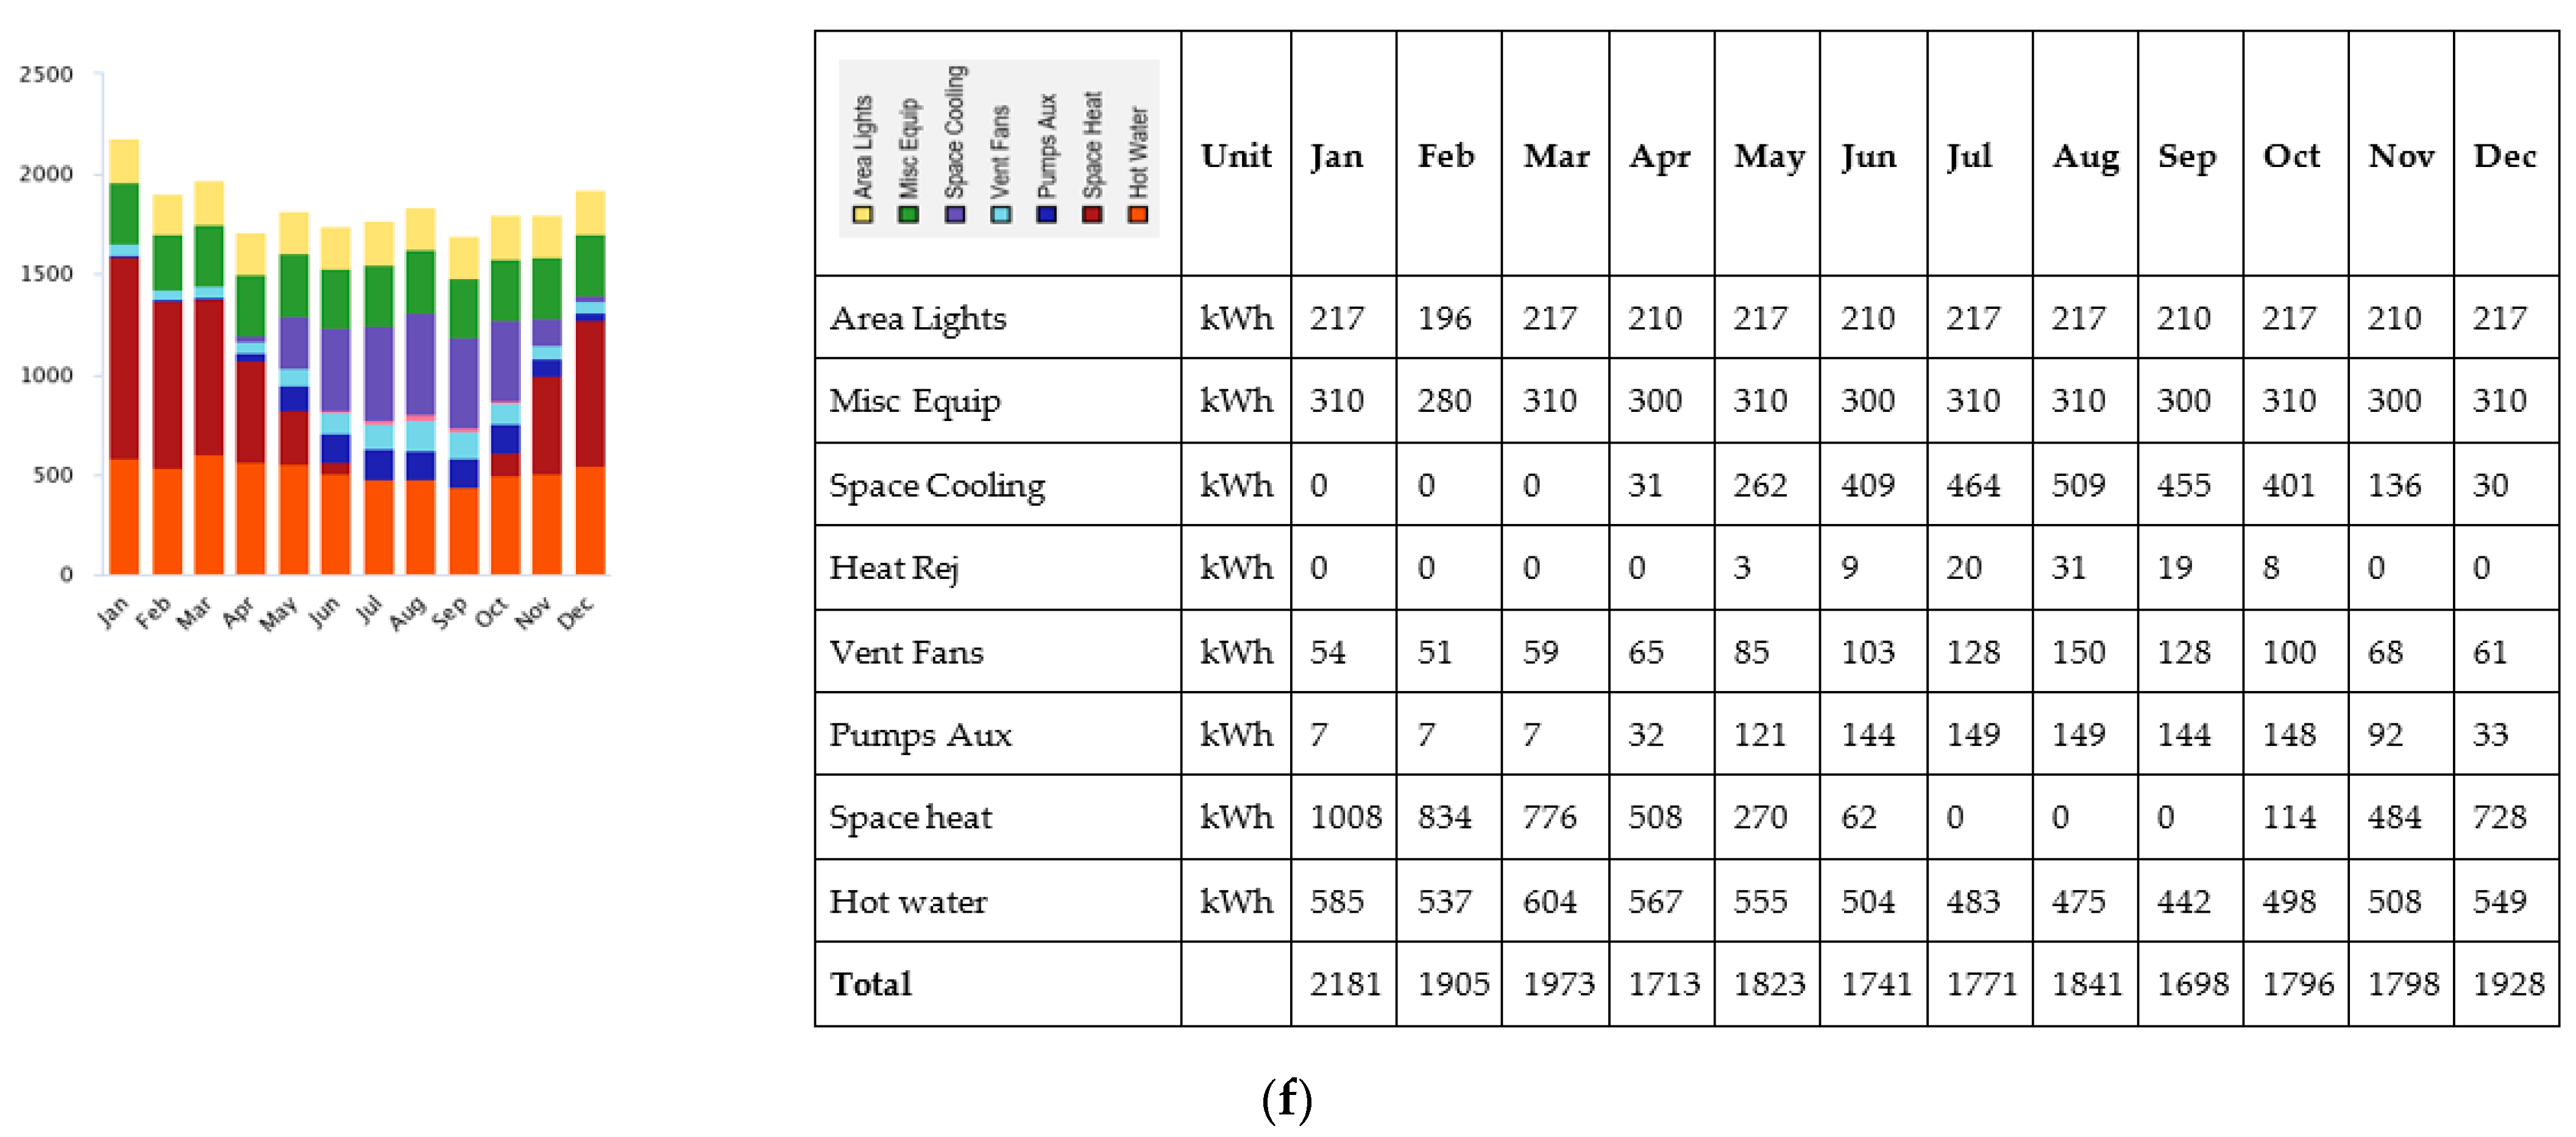
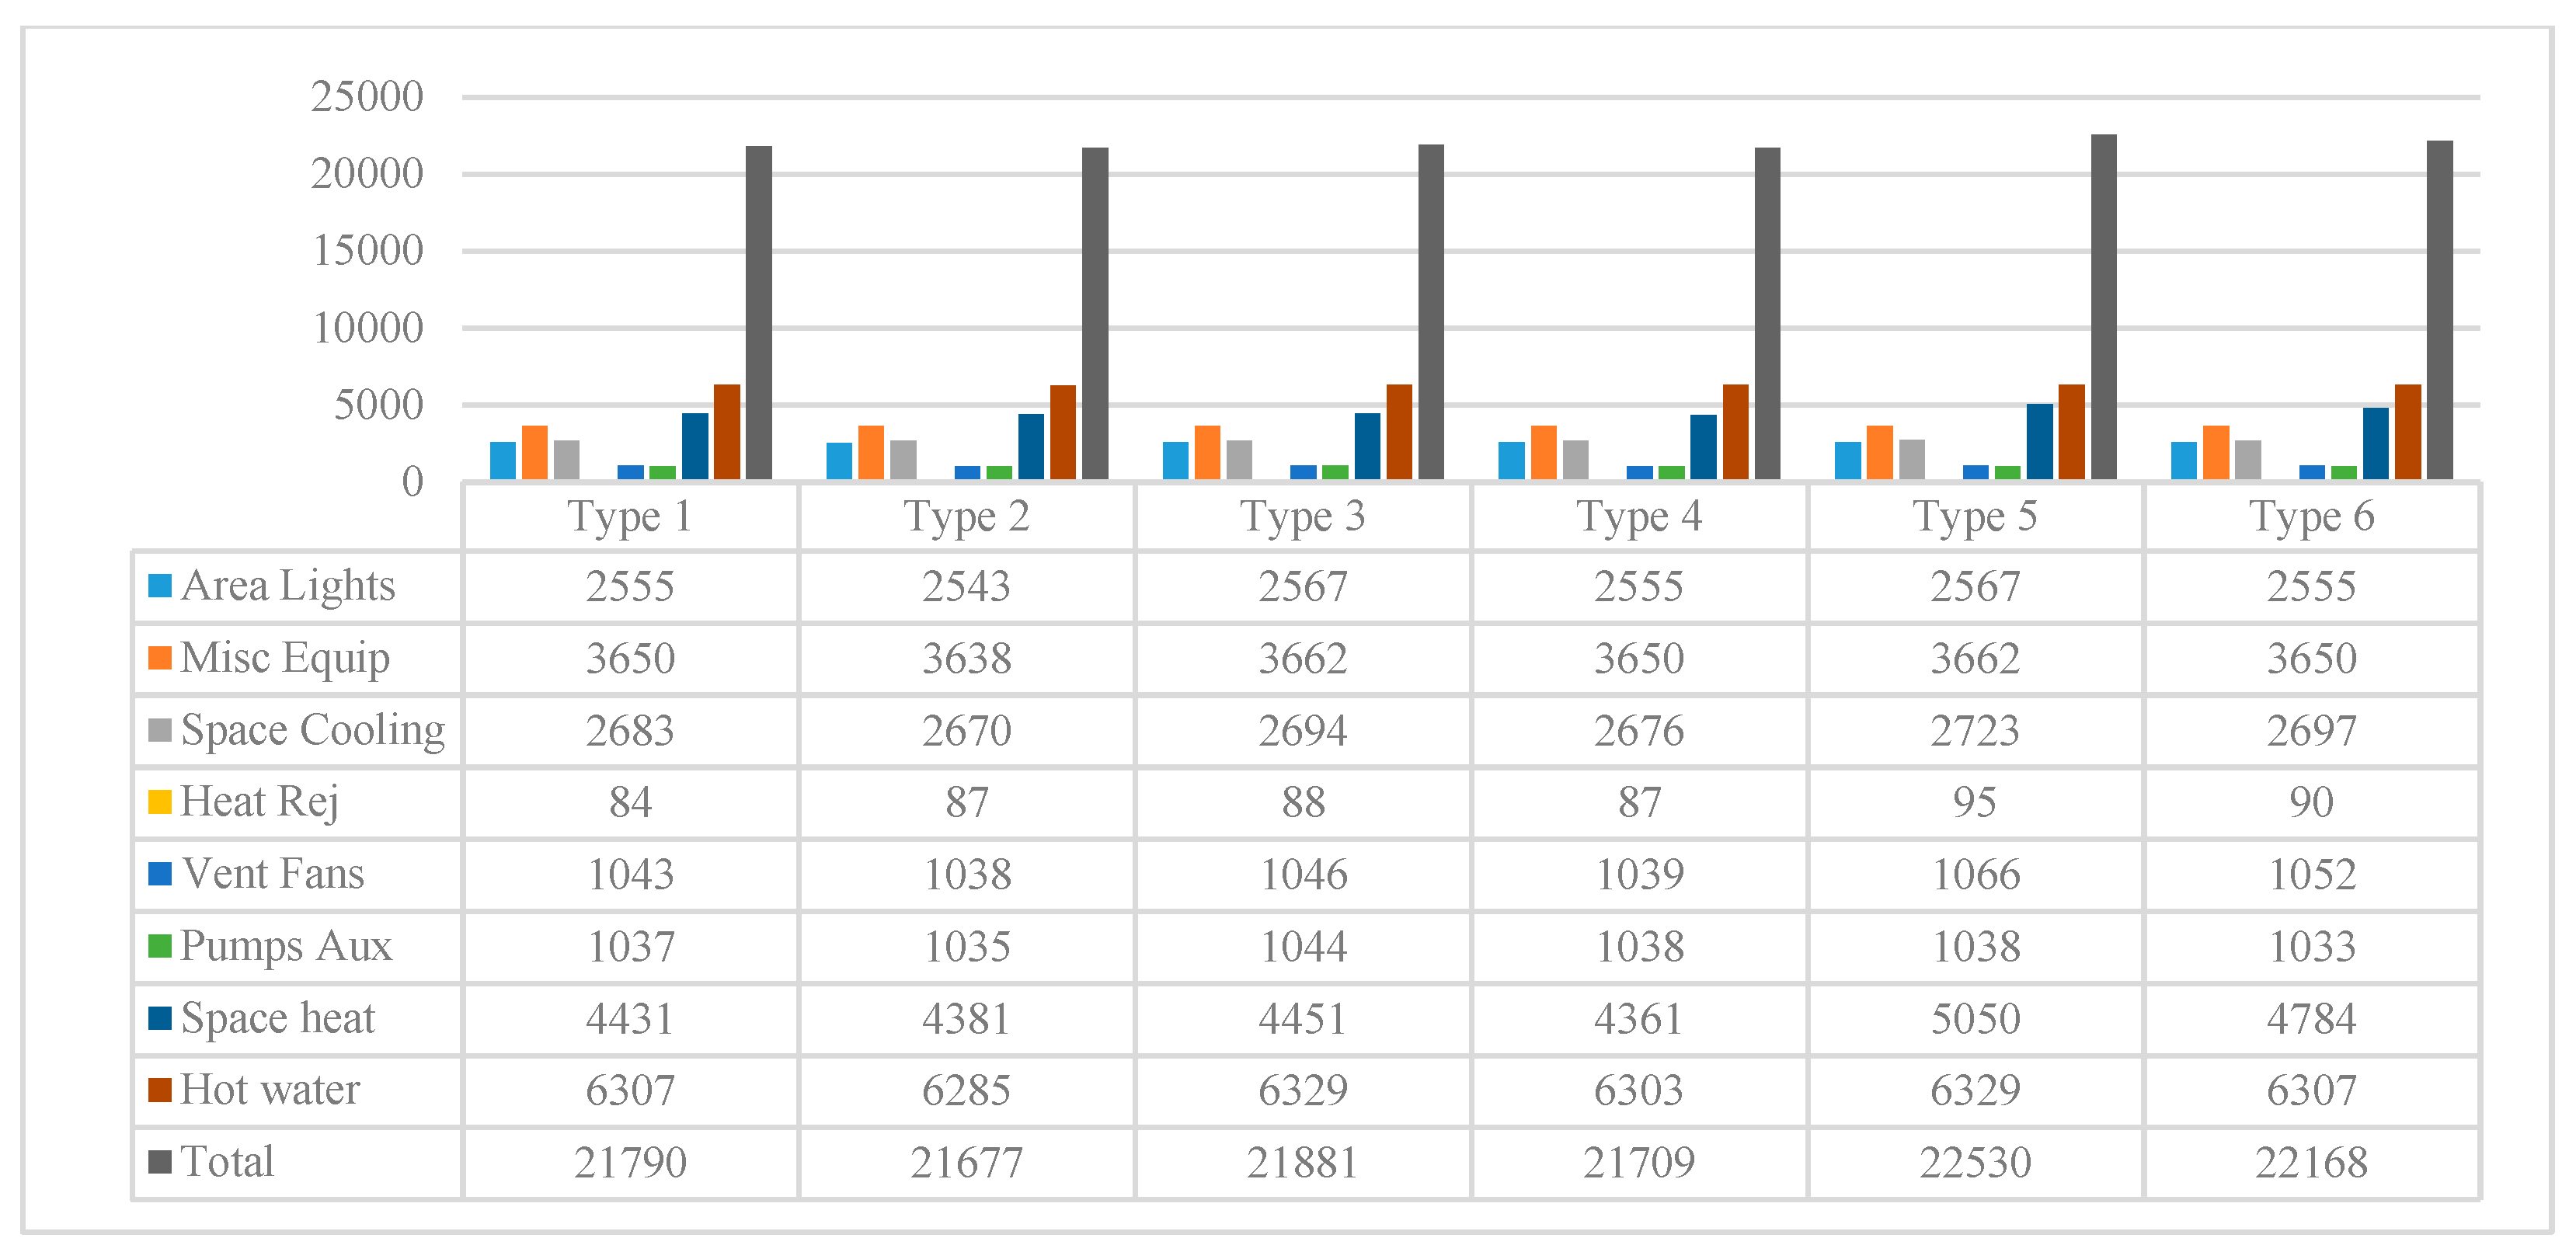
The monthly energy performance values (kWh) of the designed building types are displayed in Figure 9. Among the wall types, the total energy consumption values vary between 22,530 kWh and 21,677 kWh.
As shown in Figure 10 and Figure 11, the highest energy consumption value through Type 5 sandwich walls was obtained at 22,530 kWh over the course of a year. For Type 5, the building material was bims blocks and the insulation material was glass wool. The maximum energy usage was observed in January, with 2256 kWh. Among the energy-consuming elements of a Type 5 building, the maximum energy consumption was found for space heating, at 1079 kWh. The minimum energy consumption of 1714 kWh was found in September. Among the energy-consuming elements of a Type 5 building, the maximum energy consumption was 461 kWh for space cooling.
The minimum energy consumption was found for Type 2 walls as 21,677 kWh during one year. For Type 2, the building material was porous light brick and the insulation material was glass wool. Over the course of a year, the highest monthly total energy consumption was 2066 kWh in January. The lowest monthly energy consumption was 1674 kWh in April. Among the energy-using components of a Type 2 building, the maximum energy use occurred for hot water, with 565 kWh in the total monthly consumption.
In designs where climatic inputs are ignored and devoid of environmental sensitivities, different results are revealed for the same building as a result of not determining the optimum ranges for the design parameters. This causes great losses in the long term in building applications that are thought to have high gains in the short term. Simulation programs that include seasonal parameters give more accurate results in terms of long-term gains to produce climate-sensitive and sustainable buildings. According to the results obtained, energy usage amounts in heating and cooling were found to be seasonal.
For all wall types, the maximum energy consumption areas are generally space heating, hot water, miscellaneous equipment, area lights, space cooling, vent fans, and pumps aux. Seasonally, hot water, space cooling, and space heating draw attention as the highest-energy-consumption areas. The highest values of energy consumption were determined for the periods of December–January–February among all wall types.
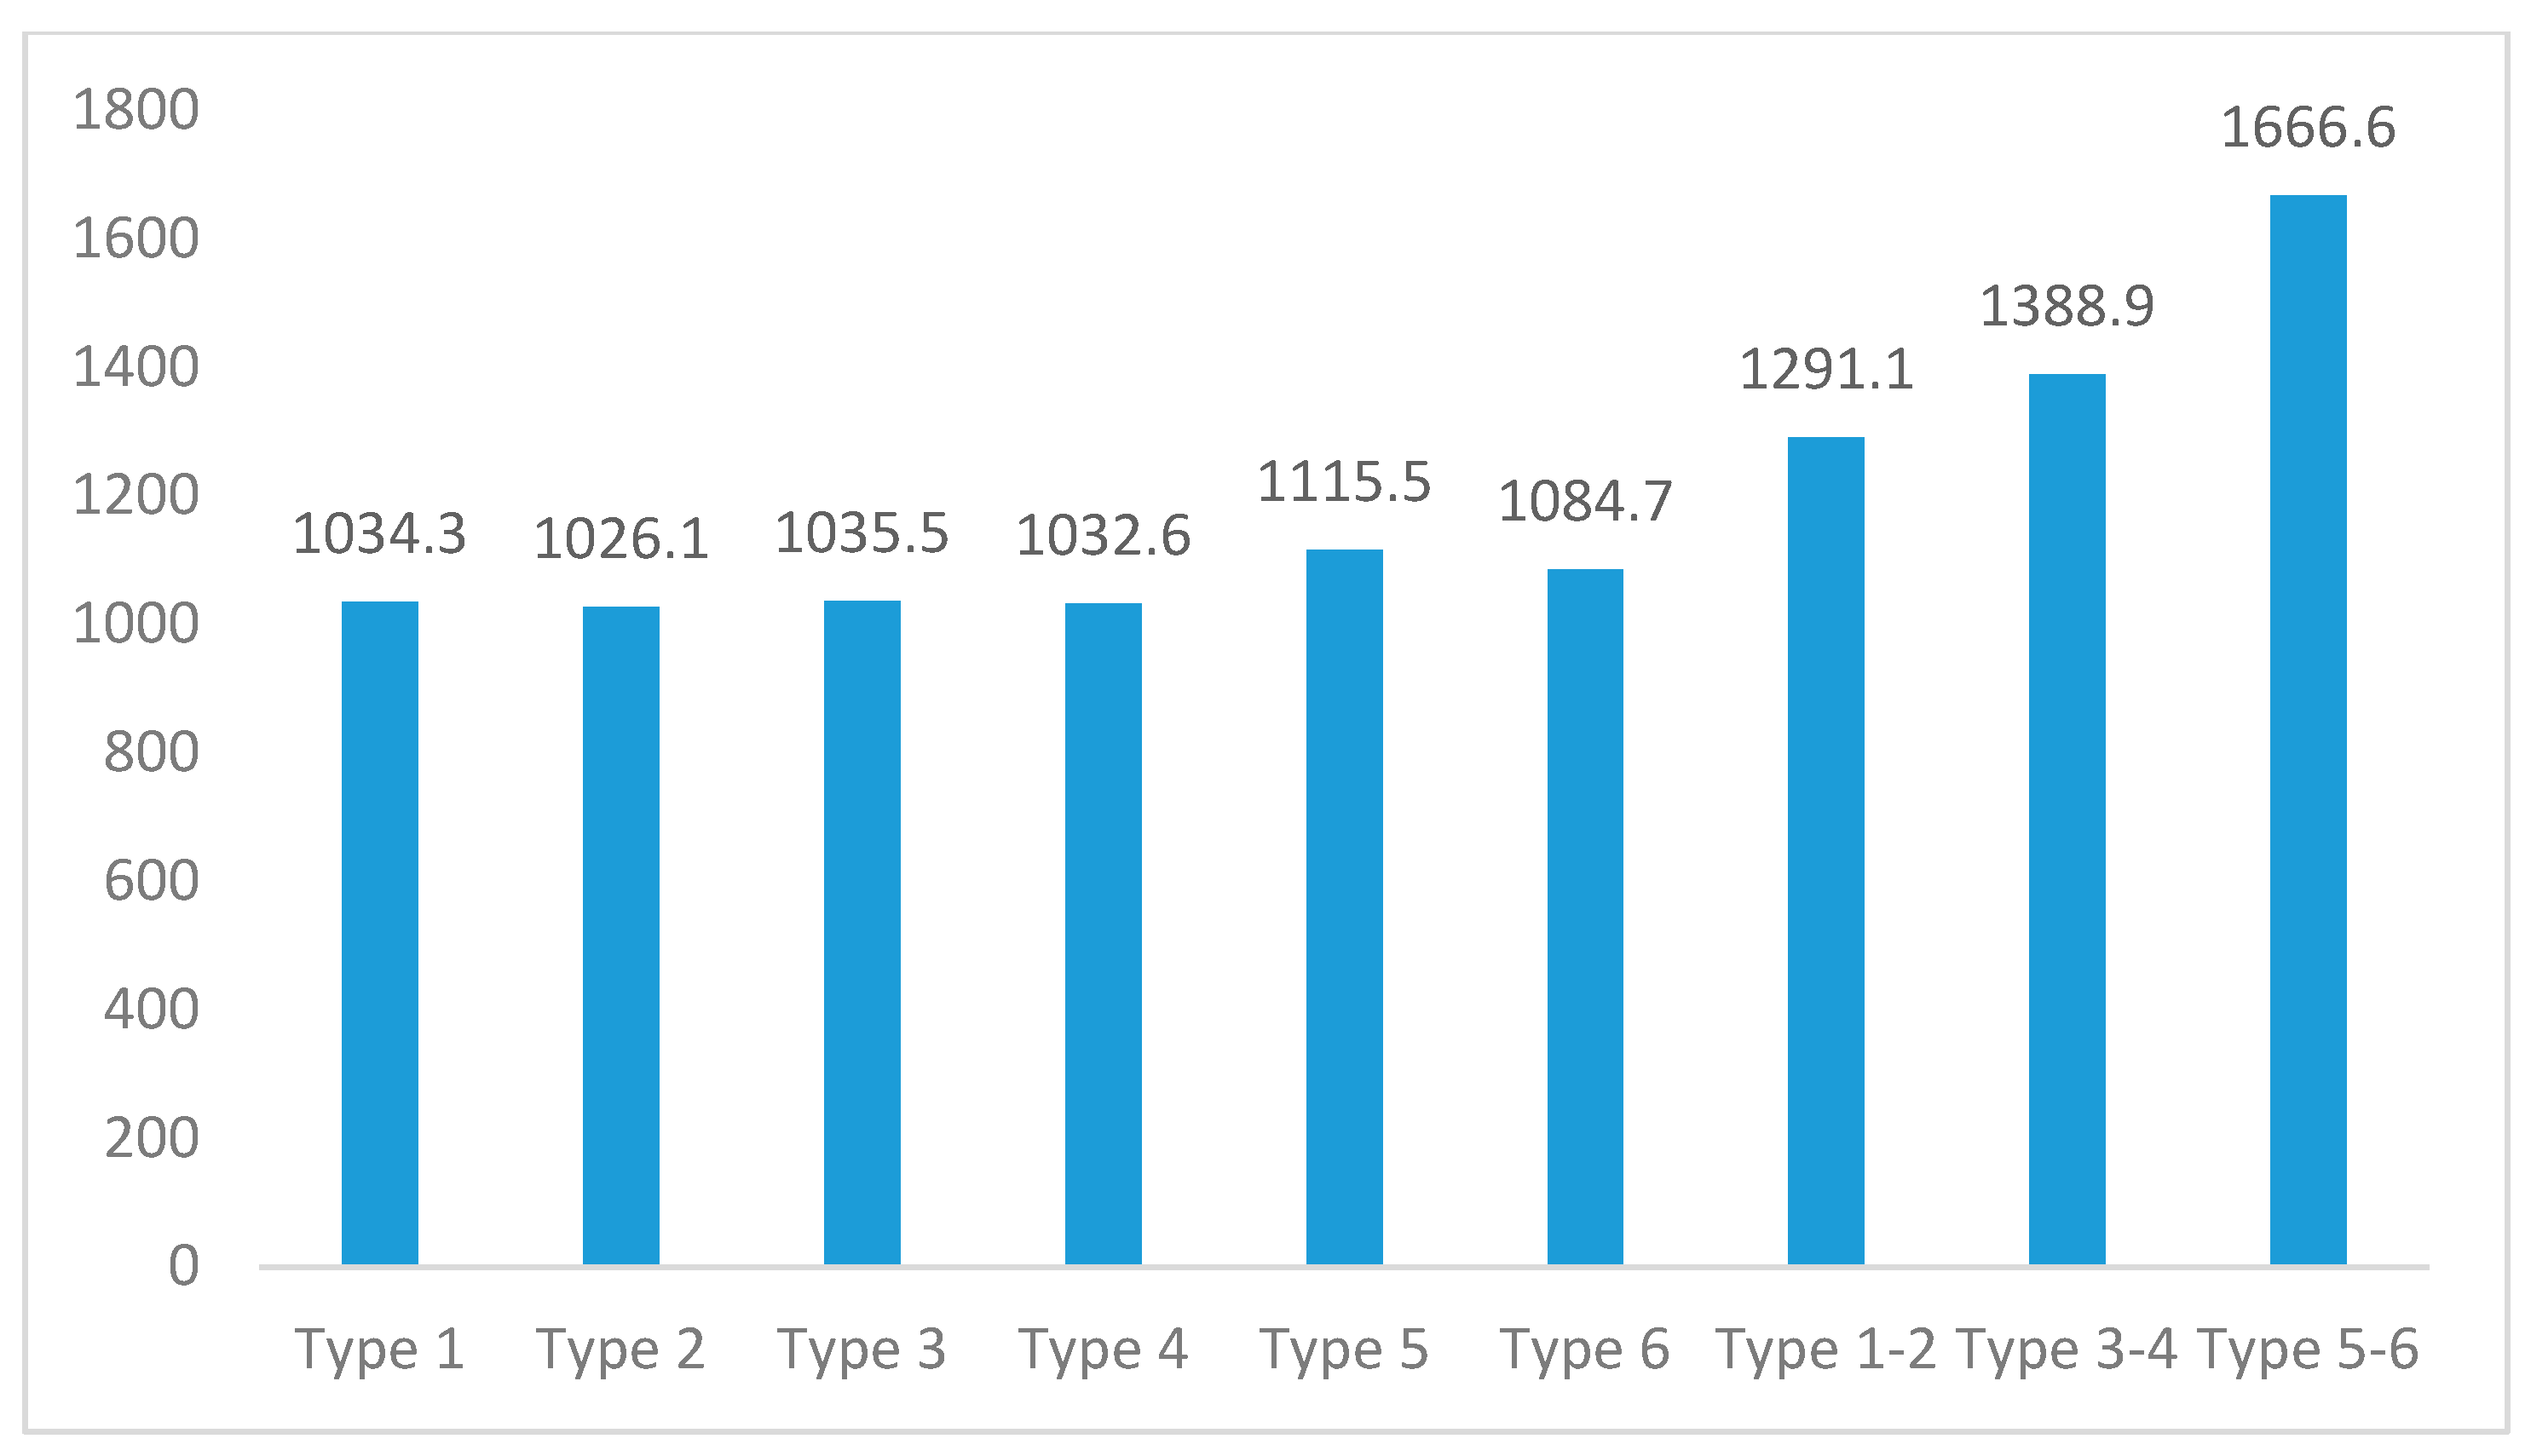
Energy usage intensity (EUI) is a parameter calculated by dividing the annual building energy consumption by the total gross floor area and characterizes the energy use of a building in terms of its function, size, and other characteristics [74]. Among the six wall types, the minimum energy-use intensity was as 1026.1 kWh per m2 for Type 2. The highest energy-use intensity was 1115.5 kWh per m2 for Type 5. Among walls without insulation, the minimum and maximum energy-use intensity values found were 1291.1 kWh per m2 and 1666.6 kWh per m2 for Type 1–2 and Type 5–6, respectively.

4. Conclusions

Fast technological improvements and a growing population lead to increases in power consumption despite the environmental consequences. In Turkey, 34 percent of the total power usage takes place in service and residential buildings. In this research, the life-cycle cost method was utilized to optimize the thermal insulation thickness of building envelopes for energy efficiency. The expenses of insulating materials differ based on the material type. Furthermore, the wall structure, degree-days, and insulating material all have an important effect on the optimum insulating thickness. It is possible to increase or decrease the energy performance by changing the wall structure. In this paper, the optimum insulation thickness for a 10-year lifetime is calculated along with annual heating cost savings based on a sandwich wall type. A sandwich wall is one of the wall structures that can provide good energy efficiency. The payback period and energy savings for sandwich walls are calculated when different combinations of energy source and insulating material are utilized. Two commonly used materials, glass wool and XPS, were utilized as the insulation material for the purpose of this study. These materials’ feasibility for different fuel types and commercially available sizes was evaluated. In Revit simulations, the same construction and insulation materials used in the mathematical model calculations were utilized as the materials on the sandwich-formed exterior walls of this building. In the Revit analysis, the same thickness values of the building materials were used as in the mathematical model. The Revit analysis was performed for six different combinations using the optimum insulation thicknesses obtained from the mathematical analysis of XPS and glass wool.
With life-cycle cost analysis, the minimum optimum insulation thickness was obtained as 0.02 m and 0.04 m for extruded polystyrene and glass wool, respectively, when natural gas was used as the energy source and bims was used as building material.
The minimum payback period was obtained as 2.15 years and 2.27 years for extruded polystyrene and glass wool, respectively. The maximum energy cost savings was obtained as 12.84 TRY/m2 and 14.12 TRY/m2 for extruded polystyrene and glass wool, respectively. Electricity was used as the energy source and porous light brick was used as the building material for both of them.
From the Revit analysis, the minimum energy-use intensity value of 1026 kWh was obtained in Type 2 walls. Using the same materials, the minimum energy consumption was found as 21,677 kWh during one year. For Type 2, the building material was a porous light brick and the insulation material was glass wool.
The results indicate that the highest amount of CO2 and SO2 emissions are reached when coal is utilized as the energy source. On the other hand, CO2 and SO2 emission levels are at their lowest when natural gas is used. Thus, it can be stated that the use of natural gas has a significant impact on lowering air pollution in residential areas. The primary target of this research was to contribute to the optimum insulation thickness research with a never-before-used simulation method. Researchers, policy-makers, and practitioners need to work together in order to design energy efficiency plans in buildings and apply them in reality. Working with different wall types, different building-insulation materials, and different energy sources, this research can be detailed. Renewing existing buildings with optimum insulation so that they can consume energy efficiently and designing future energy-efficient buildings will be possible only through appropriate regulations and standards.

Author Contributions

Conceptualization, F.B. and A.U.; methodology, F.B.; software, F.B.; validation, F.B. and A.U.; formal analysis, A.U.; investigation, F.B.; resources, F.B.; data curation, A.U.; writing—original draft preparation, F.B.; writing—review and editing, F.B. and A.U.; visualization, F.B.; supervision, F.B.; project administration, F.B.; funding acquisition, F.B. and A.U. All authors have read and agreed to the published version of the manuscript.

Funding

This research received no external funding.

Data Availability Statement

Data are contained within the article.

Conflicts of Interest

The authors declare no conflict of interest.

Abbreviations

AsAnnual total cost difference [TRY/m2]
CAAnnual energy cost for hearing [TRY/m2-year]
CfFuel cost [TRY/kg]
CinsInsulation material cost [TRY/m2]
CtTotal heating cost of non-insulated building [TRY/m2-year]
Ct, insTotal heating cost of insulated building [TRY/m2-year]
DDDegree-days [°C day]
EAAnnual energy required for heating [J/m2-year]
gInflation rate [%]
HuThermal value [J/kg]
iInterest rate [%]
UTotal heat-transfer coefficient [W/m2 K]
LCCALife-cycle cost analysis
NLifetime [year]
ppPayback period [year]
PWFPresent-value factor
qThermal loss per unit field of external walls [W/m2]
qAAnnual heating loss [W/m2]
rReal interest rate [%]
RextOutdoor thermal resistance coefficient [m2 K/W]
RintIndoor thermal resistance coefficient [m2 K/W]
RinsThermal resistance coefficient of the insulation material [m2 K/W]
RtThermal resistance coefficient of the brick material [m2 K/W]
RwThermal resistance coefficient of the non-insulated wall layer [m2 K/W]
RtwTotal thermal resistance coefficient of the non-insulated wall layer [m2 K/W]
Rtw, insTotal thermal resistance coefficient of the insulated wall layer
xInsulation thickness [m]
xoptOptimum insulation thickness [m]
kThermal conductivity of the insulation material [W/mK]
ŋEfficiency of burning system
DThickness [m]
MMolecular weight of the fuel [kg/k mol]
MCO2Molecular weight of CO2 [kg CO2/kg fuel]
MSO2Molecular weight of SO2 [kg SO2/kg fuel]
mfaYearly energy cost of heating per unit field [TRY/year]
myYearly fuel consumption [kg/year]
T0Daily temperature [°C]
TbBase temperature [°C]

References

  1. Balo, F. Energy and economic analyses of insulated exterior walls for four different city in Turkey. Energy Educ. Sci. Technol. Part A Energy Sci. Res. 2011, 26, 175–188. [Google Scholar]
  2. Regulation on Heat in Buildings; Ministry of Public Works and Housing: Ankara, Turkey, 2000.
  3. TS 825; Thermal İnsulation Requirements for Buildings. Turkish Standard Institute (TSE). Ministry of Public Works and Housing: Ankara, Turkey, 2008.
  4. TS 825; Thermal İnsulation Requirements for Buildings. Turkish Standard Institute (TSE). Ministry of Public Works and Housing: Ankara, Turkey, 2013.
  5. TS 825; Thermal İnsulation Requirements for Buildings, TS 825 Thermal Insulation Standard. Ministry of Public Works and Housing: Ankara, Turkey, 2000.
  6. Kaygusuz, K.; Kaygusuz, A. Energy and sustainable development in Turkey. Part I: Energy utilization and sustainability. Energy Sources 2002, 24, 483–498. [Google Scholar] [CrossRef]
  7. Abdullah, Y.; Gurlek, G.; Erkek, M.; Ozbalta, N. Economical and environmental analyses of thermal insulation thickness in buildings. J. Therm. Sci. Technol. 2008, 28, 25–34. [Google Scholar]
  8. Kaynakli, O.; Kaynakli, F. Determination of Optimum Thermal Insulation Thicknesses for External Walls Considering the Heating, Cooling and Annual Energy Requirement. Uludağ Univ. J. Fac. Eng. 2016, 21, 227–242. [Google Scholar] [CrossRef]
  9. Kon, O. Determination of optimum insulation thicknesses using economical analyse for exterior walls of buildings with different masses. Int. J. Optim. Control. Theor. Appl. (IJOCTA) 2017, 7, 149–157. [Google Scholar] [CrossRef]
  10. Comakli, K.; Yuksel, B. Optimum Insulation Thickness of External Walls for Energy Saving. Appl. Therm. Eng. 2003, 23, 473–479. [Google Scholar] [CrossRef]
  11. Balo, F.; Ucar, A.; Yucel, H. Development of The Insulation Materials From Coal Fly Ash, Perlite, Clay And Linseed Oil. Ceramics-Silikaty 2010, 54, 182–191. [Google Scholar]
  12. Öykü, D.; Koca, A.; Acet, R.C.; Çetin, M.G.; Gemici, Z. A study on optimum insulation thickness in walls and energy savings based on degree day approach for 3 different demo-sites in Europe. In Proceedings of the International Conference CISBAT 2015 Future Buildings and Districts Sustainability from Nano to Urban Scale, Lausanne, Switzerland, 9–11 September 2015; pp. 155–160. [Google Scholar]
  13. Thermal Insulation Benefits. Available online: https://www.teknopanel.com/en-us/product-detail/thermal-insulation-in-buildings-thermal-insulation-benefits (accessed on 31 July 2021).
  14. Cenker, A.; Atikol, U. Optimum Insulation Thickness for the Exterior Walls of Buildings in Turkey Based on Different Materials, Energy Sources and Climate Regions. Int. J. Eng. Technol.-IJET 2017, 3, 72–82. [Google Scholar]
  15. Nematchoua Kameni, M.; Ricciardi, P.; Reiter, S.; Yvon, A. A comparative study on optimum insulation thickness of walls and energy savings in equatorial and tropical climate. Int. J. Sustain. Built Environ. 2017, 6, 170–182. [Google Scholar] [CrossRef]
  16. Altan, D.Ö.; Ozturk, H.K.; Atalay, Ö.; Acar, Ş.G.; Ulu, E.Y. The impact of optimum insulation thickness of external walls to energy saving and emissions of CO2 and SO2 for Turkey different climate regions. Energy Power Eng. 2016, 8, 327–348. [Google Scholar]
  17. Alsayed, M.F.; Tayeh, R.A. Life cycle cost analysis for determining optimal insulation thickness in Palestinian buildings. Build Eng. 2019, 22, 101–112. [Google Scholar] [CrossRef]
  18. Hasan, A. Optimizing insulation thickness for buildings using life cycle cost. Appl. Energy 1999, 63, 115–124. [Google Scholar] [CrossRef]
  19. Khalid, E.; Younis, O.; Hamdan, A.M.; Hussein, A.K. A study on energy performance and optimum thickness of thermal insulation for building in different climatic regions in Sudan. J. Adv. Res. Fluid Mech. 2020, 73, 146–162. [Google Scholar]
  20. Axaopoulos, I.; Axaopoulos, P.; Gelegenis, J.; Fylladitakis, E.D. Optimum external wall insulation thickness considering the annual CO2 emissions. J. Build Phys. 2019, 42, 527–544. [Google Scholar] [CrossRef]
  21. Yu, J.; Yang, C.; Tian, L.; Liao, D. Evaluation on energy and thermal performance for residential envelopes in hot summer and cold winter zone of China. Appl. Energy 2009, 86, 1970–1985. [Google Scholar] [CrossRef]
  22. Ziapour, B.M.; Rahimi, M.; Yousefi Gendeshmin, M. Thermoeconomic analysis for determining optimal insulation thickness for new composite prefabricated wall block as an external wall member in buildings. J. Build Eng. 2020, 31, 101354. [Google Scholar] [CrossRef]
  23. Fohagui, V.; Cyrille, F.; Ghislain, T. The determination of the most economical combination between external wall and the optimum insulation material in Cameroonian’s buildings. J. Build. Eng. 2017, 9, 155–163. [Google Scholar]
  24. Shekarchian, M.; Moghavvemi, M.; Rismanchi, B.; Mahlia, T.; Olofsson, T. The cost benefit analysis and potential emission reduction evaluation of applying wall insulation for buildings in Malaysia. Renew. Sustain. Energy Rev. 2012, 16, 4708–4718. [Google Scholar] [CrossRef]
  25. Tzoulis, T.; Kontoleon, K. Thermal behaviour of concrete walls around all cardinal orientations and optimal thickness of insulation from an economic point of view. Procedia Environ. Sci. 2017, 38, 381–388. [Google Scholar] [CrossRef]
  26. Bolatturk, A. Optimum insulation thickness for building walls with respect to cooling and heating degree-hours in the warmest zone of Turkey. Build Environ. 2008, 43, 1055–1064. [Google Scholar] [CrossRef]
  27. Farhanieh, B.; Sattari, S. Simulation of energy saving in Iranian buildings using integrative modelling for insulation. Renew. Energy 2006, 31, 417–425. [Google Scholar] [CrossRef]
  28. Comakli, K.; Yuksel, B. Environmental impact of thermal insulation thickness in buildings. Appl. Therm. Eng. 2004, 24, 933–940. [Google Scholar] [CrossRef]
  29. Huanga, H.; Zhoub, Y.; Huanga, R.; Wua, H.; Sunc, Y.; Huangd, G.; Xua, T. Optimum insulation thicknesses and energy conservation of building thermal insulation materials in Chinese zone of humid subtropical climate. Sustain. Cities Soc. 2020, 52, 1018–1140. [Google Scholar] [CrossRef]
  30. Daouas, N. A study on optimum insulation thickness in walls and energy savings in Tunisian buildings based on analytical calculation of cooling and heating transmission loads. Appl. Energy 2011, 88, 156–164. [Google Scholar] [CrossRef]
  31. Al-Khawaja, M.J. Determination and selecting the optimum thickness of insulation for buildings in hot countries by accounting for solar radiation. Appl. Therm. Eng. 2004, 24, 2601–2610. [Google Scholar] [CrossRef]
  32. Mohsen, M.S.; Akash, B.A. Some prospects of energy savings in buildings. Energy Convers. Manag. 2001, 42, 1307–1315. [Google Scholar] [CrossRef]
  33. Murgul, V.; Pukhkal, V. Saving the Architectural Appearance of the Historical Buildings due to Heat Insulation of their External Walls. Procedia Eng. 2015, 117, 891. [Google Scholar] [CrossRef] [Green Version]
  34. Tettey, U.; Dodoo, A.; Gustavsson, L. Prımary Energy Implıcatıons of Dıfferent Wall Insulatıon Materıals for Buıldıngs in a Cold Clımate. Energy Procedia 2014, 2014, 1204. [Google Scholar] [CrossRef]
  35. Zhu, P.; Huckemann, V.; Fisch, M. The optimum thickness and energy saving potential of external wall insulation in different climate zones of China. Procedia Eng. 2011, 21, 608. [Google Scholar] [CrossRef]
  36. Nyers, J.; Kajtar, L.; Tomić, S.; Nyers, A. Investment-savings method for energy-economic optimization ofexternal wall thermal insulation thickness. Energy Build. 2015, 86, 268–274. [Google Scholar] [CrossRef]
  37. Singh, H.K.; Prakash, R.; Shukla, K.K. Economic and environmental benefits of roof insulation in composite climate of India. History 2015, 1, 397–403. [Google Scholar]
  38. Siddique, S.; Arif, S. Optimum Insulation Thickness for Walls and Roofs for Reducing Peak Cooling Loads in Residential Buildings in Lahore. Mehran Univ. Res. J. Eng. Technol. 2016, 35, 523–532. [Google Scholar] [CrossRef]
  39. Hamdan, M.; Malek, M.K. Optimization of insulation thickness for building’s external wall in Jordan. In Proceedings of the International Conference on Water, Energy and Environment, Sharjah, United Arab Emirates, 28 February–2 March 2017; Available online: https://www.researchgate.net/publication/314245931 (accessed on 29 January 2023).
  40. Nematchoua, M.K.; Raminosoa, C.R.R.; Mamiharijaona, R.; René, T.; Orosa, J.A.; Elvis, W.; Meukam, P. Study of the economical and optimum thermal insulation thickness for buildings in a wet and hot tropical climate: Case of Cameroon. Renew. Sustain. Energy Rev. 2015, 50, 1192–1202. [Google Scholar] [CrossRef]
  41. Jraida, K.; Farchi, A.; Mounir, B.; Mounir, I. A study on the optimum insulation thicknesses of building walls with respect to different zones in Morocco. Int. J. Ambient. Energy 2017, 38, 550–555. [Google Scholar] [CrossRef]
  42. Baniassadi, A.; Sayyaadi, H. Multivariate Optimization of PCM and Insulation Layer Thickness for a Residential Building- Case Study of Iran. In Proceedings of the Sixth International Conference on Heating, Ventilation and Air-Conditioning, Tehran, Iran, 26–28 May 2015. [Google Scholar]
  43. Liu, X.; Chen, Y.; Ge, H.; Fazio, P.; Chen, G.; Guo, X. Determination of optimum insulation thickness for building walls with moisture transfer in hot summer and cold winter zone of China. Energy Build. 2015, 109, 361–368. [Google Scholar] [CrossRef]
  44. Barrau, J.; Ibañez, M.; Badia, F. Impact of the optimization criteria on the determination of the insulation thickness. Energy Build. 2014, 76, 459–469. [Google Scholar] [CrossRef]
  45. Derradji, L.; Imessad, K.; Amara, M.; Boudali Errebai, F. A study on residential energy requirement and the effect of the glazing on the optimum insulation thickness. Appl. Therm. Eng. 2017, 112, 975–985. [Google Scholar] [CrossRef]
  46. Alghoul Samah, K.; Gwesha, A.O.; Abdurrauf, M.N. The effect of electricity price on saving energy transmitted from external building walls. Energy Res. J. 2016, 7, 1–9. [Google Scholar] [CrossRef] [Green Version]
  47. Marif, Y.; Hammou, M.B.; Zerrouki, M.; Belhadj, M. Thermal performance of internal and external wall insulation in existing buildings in the South of Algeria. ISESCO J. Sci. Technol. 2013, 9, 53–59. [Google Scholar]
  48. Sagbansua, L.; Balo, F. Ecologıcal Impact & Fınancıal Feasıbılıty of Energy Recovery (EIFFER) Model for Natural Insulatıon Materıal Optımızatıon. Energy Build. 2017, 148, 1–14. [Google Scholar]
  49. Antipova, E.; Boer, D.; Guillén-Gosálbez, G.; Cabeza, L.F.; Jiménez, L. Multi-objective optimization coupled with life cycle assessment for retrofitting buildings. Energy Build. 2014, 82, 92–99. [Google Scholar] [CrossRef]
  50. Diakaki, C.; Grigoroudis, E.; Kololotsa, D.; Kalaitzakis, K.; Stavrakakis, G. Towards a multi-objective optimization approach for improving energy efficiency in buildings. Energy Build. 2008, 40, 1747–1754. [Google Scholar] [CrossRef]
  51. Ascione, F.; Rodriguez-Ubinas, E.; Bianco, N.; Masi, R.F.D.; Mauro, G.M.; Vanoli, G.P. Design of the building envelope: A novel multi-objective approach for the optimization of energy performance and thermal comfort. Sustainability 2015, 7, 10809–10836. [Google Scholar] [CrossRef]
  52. Cengel Yunus, A. Heat Transfer: A Practical Approach, 2nd ed.; McGrawHill: Boston, MA, USA, 2003. [Google Scholar]
  53. Dombayci, O.A. The environmental impact of optimum insulation thickness for external walls of buildings. Build Environ. 2007, 42, 3855–3859. [Google Scholar] [CrossRef]
  54. Onan, C. Determination of the Thermal Insulation for the Model Building Approach and the Global Effects in Turkey. Adv. Mech. Eng. 2014, 2014, 960278. [Google Scholar] [CrossRef]
  55. Gürel, A.; Daşdemir, A. Determination of Optimum Insulation Thickness for Heating and Cooling Loads in Four Different Climate Regions of Turkey. Erciyes Univ. J. Sci. Inst. 2011, 27, 346–352. [Google Scholar]
  56. Bolatturk, A. Determination of optimum insulation thickness for building walls with respect to various fuels and climate zones in Turkey. Appl. Therm. Eng. 2006, 26, 1301–1309. [Google Scholar] [CrossRef]
  57. Dombayci, O.A.; Golcu, M.; Pancar, Y. Optimization of insulation thickness for external walls using different energy-sources. Appl. Energy 2006, 83, 921–928. [Google Scholar] [CrossRef]
  58. Kaynakli, O. A study on residential heating energy requirement and optimum insulation thickness. Renew. Energy 2008, 33, 1164–1172. [Google Scholar] [CrossRef]
  59. Sisman, N.; Kahya, E.; Aras, N.; Aras, H. Determination of optimum insulation thicknesses of the external walls and roof (ceiling) for Turkey’s different degree-day regions. Energy Policy 2007, 35, 5151–5155. [Google Scholar] [CrossRef]
  60. Ucar, A.; Balo, F. Effect of fuel type on the optimum thickness of selected insulation materials for the four different climatic regions of Turkey. Appl. Energy 2009, 86, 730–736. [Google Scholar] [CrossRef]
  61. Ucar, A.; Balo, F. Determination of the energy savings and the optimum insulation thickness in the four different insulated exterior walls. Renew. Energy 2010, 35, 88–94. [Google Scholar] [CrossRef]
  62. Kallioğlu, M.A.; Ercan, U.; Avcı, A.S.; Fidan, C.; Karakaya, H. Empirical modeling between degree days and optimum insulation thickness for external wall. Energy Source Part A 2019, 42, 1–21. [Google Scholar] [CrossRef]
  63. Balo, F. Castor Oil-Based Building Materials Reinforced with Fly Ash, Clay, Expanded Perlite and Pumice Powder. Ceramics-Silikaty 2011, 55, 280–293. [Google Scholar]
  64. D’Agostino, D.; de’Rossi, F.; Marigliano, M.; Marino, C.; Minichiello, F. Evaluation of the optimal thermal insulation thickness for an office building in different climates by means of the basic and modified “cost-optimal” methodology. Build Eng. 2019, 24, 100743. [Google Scholar] [CrossRef]
  65. U-değeri / Yalitim Ölçümü. Available online: https://www.onurenerji.com.tr/olcumler/isi-yalitim-olcumu-isil-gecirgenlik-u-degeri-katsayisi/ (accessed on 31 July 2021).
  66. Gustafsson, S. Optimisation of Insulation Measures on Existing Buildings. Energy Build. 2000, 33, 49–55. [Google Scholar] [CrossRef]
  67. Doğal Gaz Piyasası Tarifeler Listesi. Available online: https://www.epdk.gov.tr/Detay/Icerik/3-0-96/tarifeler (accessed on 1 August 2021).
  68. National Energy Conservation Center. The Principles of Energy Management in Industry; Ministry of Public Works and Housing: Ankara, Turkey, 2006. [Google Scholar]
  69. Ucar, A.; Inalli, M.; Balo, F. Application of three different methods for determination of optimum insulation thickness in external walls. Environ. Prog. Sustain. Energy 2011, 30, 709–719. [Google Scholar] [CrossRef]
  70. Ucar, A.; Balo, F. Determination of Environmental Impact and Optimum Thickness of Insulation for Building Walls. Environ. Prog. Sustain. Energy 2011, 30, 113–122. [Google Scholar] [CrossRef]
  71. Aydin, N.; Biyikoglu, A. Determination of optimum insulation thickness by life cycle cost analysis for residential buildings in Turkey. Sci. Technol. Built Environ. 2021, 27, 2–13. [Google Scholar] [CrossRef]
  72. Altun, A.F. Determination of Optimum Building Envelope Parameters of a Room concerning Window-to-Wall Ratio, Orientation, Insulation Thickness and Window Type. Buildings 2022, 12, 383. [Google Scholar] [CrossRef]
  73. Yuan, J.; Farnham, C.; Emura, K. Optimum insulation thickness for building exterior walls in 32 regions of China to save energy and reduce CO2 emissions. Sustainability 2017, 9, 1711. [Google Scholar] [CrossRef]
  74. Yanga, C.; Choi, J.-H. Energy Use Intensity Estimation Method Based on Façade Features, International Conference on Sustainable Design, Engineering and Construction. Procedia Eng. 2015, 118, 842–852. [Google Scholar] [CrossRef] [Green Version]
Figure 1. The climatic regions and location of the analyzed building according to TS 825 of Turkey [3].
Buildings 13 00408 g001
Figure 2. Sandwich wall model used for calculations (a. External plaster; b. Building material; c. Insulation material; d. Building material; e. Internal plaster).
Buildings 13 00408 g002
Figure 3. (a) The building renders obtained from Lumion software; (b) The building 3D view obtained from Revit.
Buildings 13 00408 g003
Figure 4. Total cost and impact of insulation thickness.
Buildings 13 00408 g004
Figure 5. Impact of insulating thickness on annual savings for energy source types (extruded polystyrene insulating material): (a) Porous light brick wall; (b) Gas concrete wall; (c) Bims wall.
Buildings 13 00408 g005
Figure 6. Impact of insulating thickness on payback duration for energy source types (extruded polystyrene insulating material): (a) Porous light brick wall; (b) Gas concrete wall; (c) Bims wall.
Buildings 13 00408 g006
Figure 7. Correlation of CO2 emission with insulation thickness for different fuel types: (a) Porous light brick wall; (b) Gas concrete wall; (c) Bims wall.
Buildings 13 00408 g007
Figure 8. Correlation of SO2 emission with insulating thickness for diverse energy source types: (a) Porous light brick wall; (b) Gas concrete wall; (c) Bims wall.
Buildings 13 00408 g008
Figure 9. Monthly energy performance values (kWh) of the designed building types with sandwich walsl: (a) Type 1; (b) Type 2; (c) Type 3; (d) Type 4; (e) Type 5; (f) Type 6.
Buildings 13 00408 g009aBuildings 13 00408 g009bBuildings 13 00408 g009c
Figure 10. Total energy consumption of designed building types.
Buildings 13 00408 g010
Figure 11. The energy use intensity values of the designed building types with insulation material and without insulation material.
Buildings 13 00408 g011
Table 1. A brief summary of studies in Turkey pertaining to optimum insulation thickness.
AuthorsFuel TypeCity in TurkeyMethodologyInsulation
Material
Opt.
Insulation Thickness
Yüksel and Comaklı [28]Fuel oilErzurum-Styrofoam0.10 m calculated
Dombaycı [53]CoalDenizli-Expanded polystyrene0.095 m calculated
Onan [54]Natural gasİstanbulP1P2EPS0.0525 cm calculated
Gürel and Daşdemir [55]Fuel oil, natural gasAydın, Edirne, Malatya and SivasLCCEPS, XPS0.036–0.10 m calculated
Bolatturk [56]LPG, electricity, fuel oil, coal, natural gas Four cities for each of DD zones in Turkey (in total, 16 cities)LCCPolystyreneFor heating, they change in a broad range (between 0.019 and 0.172 m)
relying on provinces and utilized energy source type
Dombayci et al. [57]LPG, electricity, fuel oil, coal, natural gasDenizliLCCRock wool, Expanded polystyreneFor EPS, 0.259–0.076 m depending on fuel type
For rock wool, 0.138–0.032 m depending on fuel type
Bolatturk [26]For cooling, electricity
For heating, natural gas
Mersin, Izmir, Iskenderun, Hatay, Antalya, Adana, Aydin,P1P2Extruded polystyrene0.016–0.027 m for HDHs and
0.032–0.038 m for CDHs
Yuksel and Comakli [10]CoalErzincan Kars, ErzurumLCCStyrofoam0.085 m, 0.107 m, 0.105 m
Kaynakli [58]LPG, fuel oil, coal, natural gas, electricity,Bursa Rock wool (for basement), fiberglass (for external walls and for ceiling)0.124 m and 0.053 m depending on fuel type
Sisman et al. [59]CoalErzurum, Izmir, Eskisehir, BursaLCCRock wool0.033, 0.047, 0.061, and 0.080 m (for walls)
Ucar and Balo [60]LPG, natural gas, electricity, fuel oil, coal,Elazig, Kocaeli, Agri, AydinP1P2Extr. polystyrene, foamboard 3500, fiberglass, foamboard 15000.0764–0.0106 m depending on fuel type and city
Ucar and Balo [61] Bitlis, Mersin, Elazig, Sanliurfa,P1P2Rock wool, nil siding, expanded and extruded polystyrene0.01 and 0.076 depending on CDDs or HDDs, fuel type, and insulation material
Kallioglu [62]Natural gas, fuel oil, coalDiyarbakir EPS and XPS0.068 and 0.083 m calculated
Table 2. Thickness, thermal conductivity, and thermal resistance values of the materials used in building design.
MaterialThicknessThermal Condictivity (W/m K)R (m2 K/W)
aInternal plaster (lime-based)0.020.87 [4]0.023
bConstruction materials (internal)
Porous light brick0.085 0.33 [4]0.257
Gas concrete0.0850.18 [4]0.472
Bims block0.0850.156 [4]0.544
Insulation materials
cXPS*0.028 [4]
Glass wool*0.04 [4]
dConstruction materials (external)
Porous light brick0.130.33 [4]0.393
Gas concrete0.130.18 [4]0.722
Bims block0.130.156 [4]0.232
eExterior Plaster (cement-based)0.031.4 [4]0.021
The “*” sign denotes the optimum insulation thickness to be calculated in the study, taking into account different energy sources and all other parameters.
Table 3. Prices, heat values, efficiencies, and chemical formulas of the fuels [35,36].
Energy TypeHu × 106
(j/kg)
ηSUnit Price [TRY/kWh]Chemical Formula
Coal25.1220.651.78 × 10−9 C 7.078 H 5.149 O 0.517 S 0.01 N 0.086
Natural gas34.5420.934.19 C 1.05 H 4 O 0.034 N 0.022
Fuel oil40.6140.804.36 × 10−9 C 7.3125 H 10.407 O 0.04 S 0.026 N 0.02
Electricity3.60.9924.01-
Table 4. The building information of the analyzed structure.
Building Information
Carrier System:Masonry Construction
Number of Floors:Ground Floor
Story Height:3 m
Dimensions:10 m × 10 m
Gross Area:100 m2
Net Area:87 m2
Table 5. The designed building types according to different building and insulation materials.
Type 1Internal plaster (lime-based)Porous light brickXPS (0.04 m)Porous light brickExterior Plaster (cement-based)
Type 2Internal plaster (lime-based)Porous light brickGlass wool (0.06 m)Porous light brickExterior Plaster (cement-based)
Type 3Internal plaster (lime-based)Gas concreteXPS (0.03 m)Gas-concreteExterior Plaster (cement-based)
Type 4Internal plaster (lime-based)Gas concreteGlass wool (0.05 m)Gas-concreteExterior Plaster (cement-based)
Type 5Internal plaster (lime-based)Bims blockXPS (0.02 m)Bims blockExterior Plaster (cement-based)
Type 6Internal plaster (lime-based)Bims blockGlass wool (0.04 m)Bims blockExterior Plaster (cement-based)
Type 2Internal plaster (lime-based)Porous light brickGlass wool (0.06 m)Porous light brickExterior Plaster (cement-based)
Table 6. Optimal insulating thickness depending on fuel and insulating materials for wall types.
Optimal Insulating Thickness (m)
Extruded PolystyreneGlass Wool
CoalNatural GasFuel OilElectricityCoalNatural GasFuel OilElectricity
Porous light brick0.050.040.070.110.080.060.100.16
Gas concrete0.040.030.060.100.070.050.090.14
Bims0.040.020.050.090.060.040.090.14
Table 7. Payback duration depending on fuel and insulating materials for wall types.
Payback Period (Years)
Extruded PolystyreneGlass Wool
CoalNatural GasFuel OilElectricityCoalNatural GasFuel OilElectricity
Porous light brick2.692.892.482.152.823.062.622.27
Gas concrete3.173.382.972.633.373.603.152.78
Bims3.293.513.092.753.513.763.282.91
Table 8. Energy cost savings depending on fuel and insulation materials for wall types.
Energy Cost Savings (TRY/m2)
Extruded PolystyreneGlass Wool
CoalNatural GasFuel OilElectricityCoalNatural GasFuel OilElectricity
Porous light brick8.74 7.669.9512.849.438.1110.8614.12
Gas concrete8.767.649.8312.419.137.7310.5313.66
Bims8.797.569.8312.319.037.5710.43 13.52
Disclaimer/Publisher’s Note: The statements, opinions and data contained in all publications are solely those of the individual author(s) and contributor(s) and not of MDPI and/or the editor(s). MDPI and/or the editor(s) disclaim responsibility for any injury to people or property resulting from any ideas, methods, instructions or products referred to in the content.