Abstract
The creation of building information models requires acquiring real building conditions. The generation of a three-dimensional (3D) model from 3D point clouds involves classification, outline extraction, and boundary regularization for semantic segmentation. The number of 3D point clouds generated using close-range images is smaller and tends to be unevenly distributed, which is not conducive to automated modeling processing. In this paper, we propose an efficient solution for the semantic segmentation of indoor point clouds from close-range images. A 3D deep learning framework that achieves better results is further proposed. A dynamic graph convolutional neural network (DGCNN) 3D deep learning method is used in this study. This method was selected to learn point cloud semantic features. Moreover, more efficient operations can be designed to build a module for extracting point cloud features such that the problem of inadequate beam and column classification can be resolved. First, DGCNN is applied to learn and classify the indoor point cloud into five categories: columns, beams, walls, floors, and ceilings. Then, the proposed semantic segmentation and modeling method is utilized to obtain the geometric parameters of each object to be integrated into building information modeling software. The experimental results show that the overall accuracy rates of the three experimental sections of Area_1 in the Stanford 3D semantic dataset test results are 86.9%, 97.4%, and 92.5%. The segmentation accuracy of corridor 2F in a civil engineering building is 94.2%. In comparing the length with the actual on-site measurement, the root mean square error is found to be ±0.03 m. The proposed method is demonstrated to be capable of automatic semantic segmentation from 3D point clouds with indoor close-range images.
1. Introduction
With the rapid development of laser scanners and digital images in recent years, spatial three-dimensional (3D) point cloud data have been widely used in many fields. Point clouds are convenient for spatial measurements and can show object shapes. However, point clouds only have 3D coordinates and color information; moreover, they do not contain attribute information. Extraction of accuracy objects from a 3D point cloud is a challenge [1]. Therefore, this issue is currently a hot research topic [2,3,4]. The main purpose of this study is to expand the application of point clouds through 3D point cloud classification and segmentation technology. The 3D information of point clouds can be widely applied to different fields for the visual display and management of engineering information.
With the recent development of laser technology and digital photogrammetry, the real appearance of an object can be restored through a 3D point cloud model. Point clouds are easy to visualize; they are simply point clusters without attribute information. Consequently, designers find them difficult to use in drawings. If the point cloud can be segmented, errors in drawings can be reduced [5]. Moreover, point cloud attributes can enable semi-automatic or fully automatic modeling.
The early development of artificial intelligence in the field of computer vision was intended for the classification, detection, and semantic segmentation of two-dimensional (2D) images. The advances in deep learning have indirectly promoted the development of the field of combining deep neural networks with 3D information [1]. With 3D point clouds, supervised learning or unsupervised methods can be used for feature learning so that the neural network can recognize geometric shapes. Because point clouds do not contain attribute information, the attributes of an object can be obtained from a segmented point cloud. Then, the rules of 3D modeling can be formulated, enabling the use of point clouds in automatic modeling.
In recent years, the development of deep learning networks has been effective in the semantic segmentation processing of 3D point clouds [4,6,7,8]. Using the segmentation results, the point cloud can be assigned to a corresponding object label. Accordingly, this study uses a deep learning network to segment 3D point clouds, improving the efficiency and accuracy of artificial segmentation.
This research aims to segment the 3D point cloud of an indoor space using a deep learning network, develop a set of point cloud feature extraction procedures, and complete the automatic modeling of parametric components [9,10,11,12]. The dynamic graph convolutional neural network (DGCNN) proposed by Wang et al. (2018) was used to perform indoor point cloud segmentation [13]. After segmentation, feature extraction technology is applied to derive the endpoints of components. Finally, the endpoint coordinates are imported into the automatic modeling rules to generate parametric components. To ensure the correctness of model reconstruction, the difference between a model and an object (i.e., between a 3D model and a real 3D housing condition, respectively) is evaluated.
This paper presents a framework for automated building component recognition based on close-range images. The proposed approach consists of three main steps: (1) grouping 3D point clouds into five categories using a deep learning classification model; (2) extracting outlines from the five categories of building structure point clouds; and (3) identifying boundary regulation and parametric components. The reason for choosing “columns, beams, walls, ceilings, and floors” as the segmentation target is that these five types of data represent the basic structure and layout of the house that cannot be easily changed, and the simple geometry is also conducive to feature extraction and automatic modeling. The proposed method automatically reconstructs the complete geometry of columns, beams, walls, ceilings, and floors from 3D point clouds using close-range images. Moreover, the material properties of components are included, thus allowing the generation of building information models (BIMs). The proposed approach is then field-validated using an actual building on campus.
2. Related Work
With the development of laser scanner technology and digital photogrammetry in recent years, 3D point cloud models are typically employed to represent the surfaces of objects. Point clouds have spatial coordinates that provide measurement information. In addition, a colored point cloud can be used as a basis for browsing the housing environment and querying the relative positions of components.
The generation of 3D graphs from 3D point clouds of indoor spaces is a current research focus. The early method for this purpose was to construct a point cloud into 3D elements using artificial methods [2,14,15]. For example, based on the geometric shape and edge features of the point cloud distribution, the centerline of the object, the boundary of the structure, and other details are used to build a model. However, after 3D reconstruction, the point cloud becomes non-attribute data. If the 3D point cloud can be effectively segmented and provided with attribute data, the results can aid in the development of automatic modeling. Accordingly, 3D point cloud segmentation has become an important research topic [3,14,16,17]. There are some review-type articles that organize and analyze the progress of relevant research [1,14,15,18].
2.1. Three-Dimensional Point Cloud Classification
A point cloud does not contain geometric information. In contrast, a segmented point cloud contains attribute data to which the rules of 3D modeling can be applied. Hence, point clouds can benefit from automatic modeling.
The current research on 3D data combined with deep learning can be broadly classified into categories, such as RGB-D (red–green–blue depth), volumetric approach, multiview convolutional neural network (CNN), and unordered point set processing [1]. The first three data items are regularly structured data with clear connection information; they yield acceptable results in both object detection and segmentation. However, with automated processing, the direct processing of an out-of-sequence point cloud to achieve point-to-point classification, part segmentation, or semantic segmentation can be implemented. Moreover, the use of a voxel grid or other conversion methods to reduce the risk of potential loss of 3D point cloud data during the conversion process is not necessary.
In recent years, the classification and segmentation technology of point clouds for 3D processing has been investigated [6,19,20,21,22,23]. In 2017, Qi et al. proposed the PointNet method for 3D point cloud processing based on deep learning. The overall semantic segmentation accuracy of the indoor scene point cloud in the mixed test of the S3DIS dataset can reach 78.5% [24].
By ignoring related details on geometry among the points, some local features are lost. After discovering this problem, Qi et al. proposed an improved method. In the improved version, i.e., PointNet++, a 2D CNN processing mechanism is added to the original architecture of the method. The overall semantic segmentation accuracy of PointNet++ in the S3DIS dataset hybrid test is 81.0% [25].
To improve segmentation accuracy, Wang et al. proposed the DGCNN method in 2019 [13]. In addition to obtaining local features, the feature information of the overall scene can be extracted through repeated stacking. The overall accuracy of the point cloud semantic segmentation in indoor scenes reached 84.1%.
Presently, the development of deep learning in the field of computer vision has shifted from a mature 2D platform to 3D space. Since Qi et al. proposed PointNet, breakthroughs have been made in object classification and semantic segmentation applied to 3D point clouds by learning their features [24].
With the introduction of DGCNN, more accurate semantic segmentation of indoor scenes can be achieved. In this study, after referring to relevant research on 3D point clouds [14], the DGCNN with improved performance and a simple operational process is selected for testing.
2.2. Semantic Segmentation and Modeling
A 3D point cloud can be provided with attribute data after semantic segmentation using a deep neural network; for example, certain points can represent columns. For 3D modeling, a 3D point cloud with attributes can be used to extract the feature information of a corresponding target using a feature extraction algorithm [26,27,28,29].
The study focuses on columns, beams, walls, ceilings, and floors in interior space. These objects have clear corners, edges, and other characteristic information in the expression of geometric shapes.
In general, the procedure for generating a building footprint involves three steps using point cloud data: (1) segmentation; (2) extraction of building outlines; and (3) regularization or generalization of boundaries. The first step classifies the points of the building from a point cloud dataset. The second step involves the extraction of building boundaries and the generation of a preliminary polygon. Finally, the third step involves the adjustment of the generated boundary and the retrieval of simple and regular polygons [27,30].
According to Awrangjeb (2016), the methods for extracting building outlines can be divided into two types: direct and indirect [30]. Direct methods extract building outlines based on the points. However, these methods are sensitive to the selection of parameters (such as neighborhood radius) and are easily affected by noise in point cloud data.
The indirect method uses image processing technology to extract edge features from 2D images and then matches them to point cloud data to extract 3D edge features. Wang et al. (2013) pointed out that this method includes detecting 2D edge information from a 2D image corresponding to the point cloud [31]. The image depth is generated from the point cloud, and then it is matched with the original 3D point cloud data. Finally, multiple groups of edge points are merged and used as detected 3D point cloud edges.
When edge features are extracted using the indirect method, spatial information can easily be lost during dimension conversion; thus, 3D edge feature information may be missed. In addition, the actual semantic segmentation results may be less than the number of point clouds before processing due to the parameter setting of deep learning in the point cloud sampling process. Accordingly, this study adopts the direct method for feature extraction.
The direct method extracts edge information directly from a 3D point cloud. For example, Borges (2010) first divided the point cloud and then detected the intersection of the segmentation surface and depth discontinuity edge [32]. In addition, Sampath and Shan (2007) proposed the use of a convex hull algorithm to establish the plane point information of a roof [33]. Then, the same algorithm is used to obtain the edge lines and finally perform boundary regularization.
3. Methodology
The main processing step in this study is to automatically generate the parametric components of BIM from the close-range images. A series of processes in this study can be referred to in Figure 1.
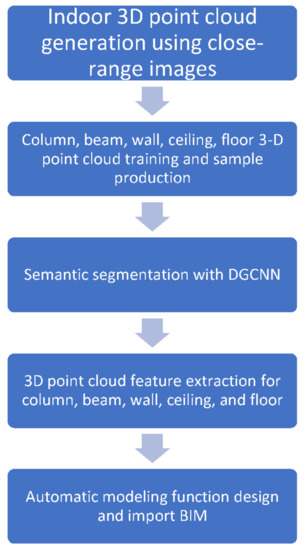
Figure 1.
The overall process of the proposed method in this study.
3.1. Three-Dimensional Point Cloud Classification
3.1.1. Sample Data
A 3D point cloud can be applied to surveying and mapping, unmanned driving, robotics, reverse engineering, and other fields. This is because it has visualization characteristics, and each point contains coordinate information. In addition to the complete and accurate preservation of the actual size of a target object, 3D point clouds present the characteristics of irregular surface changes and image space information. To understand the current geometric environment, the construction plans can be immediately viewed, improved, and modified. Accurate measurements of indoor spaces can also be obtained.
Several methods for obtaining 3D indoor point clouds are available, including laser scanning and close-range photogrammetry. The point cloud properties obtained using these methods vary. After a point cloud is obtained, determining how to classify it is typically required to obtain useful information. Therefore, point cloud segmentation technology is necessary for many applications. Consider BIMs in civil engineering as an example. To facilitate the subsequent surface reconstruction and boundary extraction, the segmentation of the different surfaces of building components is necessary.
In the 3D point clouds of existing buildings, multiple attribute categories are typically present. For example, these categories are found in the 3D point clouds of columns, beams, walls, and panels of structures, pipelines, lamps, desks, and firefighting appliances for non-structural objects. However, existing point cloud segmentation algorithms are mainly intended for specific shapes. For spatial regions with complex environments, manually preprocessing the point cloud first before using segmentation algorithms may be necessary.
Accordingly, this study attempts to use the DGCNN with a deep neural network to apply semantic segmentation to 3D point clouds and maintain the neighborhood relationship among point clouds through edge convolution. Consequently, the semantic segmentation of 3D point clouds of columns, beams, walls, ceilings, and floors can be achieved.
- S3DIS Dataset
The deep learning process typically relies on numerous samples for training and requires relevant benchmark data to evaluate the prediction results of deep neural networks. The S3DIS dataset (more completely described as the Stanford large-scale 3D indoor space dataset) is used in this study. The dataset is built by capturing RGB-D images with a Matterport camera to create a grid and then generating an indoor point cloud through grid sampling. This dataset has approximately 700 million point clouds, and ground truth has also been established [11]. We use five types of samples from the S3DIS dataset, such as columns, beams, walls, floors, and ceilings, to increase the number of training samples to obtain better overall accuracy and to verify our training results.
- 2.
- Close-range Images
The main point cloud acquisition methods can be classified into two categories: laser scanning and close-range photogrammetry methods. Close-range photogrammetry has the advantage of capturing images from multiple perspectives using a general, non-measuring digital camera or mobile phone. It can also produce point clouds through SFM technology, significantly reducing the production time of 3D point clouds and improving the convenience of point cloud acquisition.
Because close-range photogrammetry is characterized by low cost, high mobility, and high precision, it can obtain an indoor 3D point cloud in a more economical, convenient, and reliable manner.
In view of the foregoing, this study adopts close-range photogrammetry to capture indoor images and SFM technology to produce 3D point clouds. SFM technology can produce high-precision 3D point clouds quickly and massively. It is a common technology for generating 3D point clouds from close-range photogrammetry images [34,35]. The precision of the 3D point cloud is within ±6 cm for the control point and ±3 cm for the check point. Consequently, 3D point clouds with sufficient precision and quantity can be generated as deep learning samples.
3.1.2. Sample Training
In this study, the DGCNN is employed to classify 3D point clouds for training using supervised learning. Therefore, to evaluate the correctness of the training results, ground truth samples are required. The ground truth samples in this experiment include those of columns, beams, walls, floors, and ceilings. In the S3DIS dataset, indoor 3D point cloud data are established to complete the ground truth samples for each category. Hence, the ground truth data of close-range images are generated by artificially segmenting the 3D point cloud to train the discriminative parameters of the deep learning model. By manually segmenting the point clouds with this accuracy, we can ensure the accuracy of the ground truth data.
3.2. Semantic Segmentation and Modeling
Each point can be assigned a corresponding attribute value using the trained model to segment the 3D point cloud. For example, the semantic segmentation result of a certain point in space is “column” or “beam.” However, only the segmented point cloud can achieve the purpose of automatically creating 3D model components.
To achieve automatic modeling, the segmentation result must be preprocessed. The features in the 3D point cloud must be extracted, and the extraction rules must be established to convert the point cloud with attributes into model components. This section describes the feature extraction and automatic modeling rules. After automatic processing, the point cloud results can be automatically converted into parametric components.
Sampath and Shan (2007) reported that in their study of the normalized edge results of roof edge extraction, the object model had distinct endpoint features [33]. If the endpoint coordinates can be effectively extracted, they can be used in formulating the size of the parameterized element. Endpoint coordinates can also be based on the defined 3D coordinates where the components are to be placed. To extract endpoint coordinates from the segmented point cloud, data preprocessing must be performed. Without preprocessing, false edges and connection problems can occur because point clouds typically contain noise, errors, and edge irregularities.
In addition, previous related research shows that columns and beams are not consistently considered when classifying 3D point clouds; nevertheless, in such cases, classification is extremely inadequate. After the analysis, the column and beam characteristics are as follows: (1) The point clouds are few, small in size, and difficult to classify. (2) The columns and beams overlap with other structural components of the building. To resolve this problem, this study focuses on the characteristics of columns and beams. The following processing is proposed. (1) First, each category is extracted from the results of DGCNN classification. (2) The point cloud is classified because the columns and beams overlap with other categories; thus, the components are simplified. (3) Outlier points are removed. The characteristics of a category are used to remove incorrect points, avoiding the lines and results of the model. (4) Feature extraction is performed on the point cloud of the confirmed category to extract the outlines of the model. (5) The appearance of the previous model is integrated, and the correct model components are built.
3.2.1. Category Extraction
The 3D point cloud processed by the DGCNN is divided into five categories, which can be extracted separately; colors are assigned to indicate different categories.
This study considers five types of data: “columns,” “beams,” “walls,” “floors,” and “ceilings.” These categories can be distinguished by RGB colors: columns are pink, beams are yellow, walls are light blue, floors are dark blue, and ceilings are green.
The semantic segmentation results have RGB band values; therefore, they are used as classification indicator references. The results are shown in Figure 2.
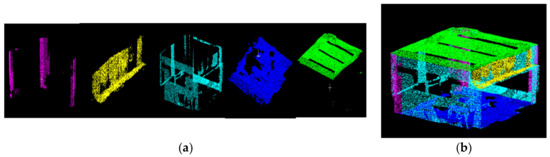
Figure 2.
(a) Classification results for each category (from left to right: column, beam, wall, floor, ceiling). (b) Combination of all classification results.
3.2.2. Labeled Category
In the classified data, “column” and “beam” are repeatedly found in the same space with other categories. These data must first be divided and processed into a single point cloud component, which is beneficial for subsequent feature extraction and component construction. This study adopts the minimum distance segmentation method in Euclidean space for division. After analyzing the actual building, the minimum segmentation distance for the columns and beams was determined to be 60 cm. After checking the minimum distance, effectively preserving the point clouds of beams and columns was found to be possible.
3.2.3. Removal of Outliers
The overall accuracy rates of segmenting beams and columns are low. This may cause the subsequent automatic modeling of components to be inconsistent with the current situation. To solve this problem, this study refers to the method of Torr and Zisseee [36]. The use of building structure characteristics to filter out erroneous point clouds is proposed, and boundary errors are avoided. Three factors are considered: (1) point-to-plane distance; (2) plane normal vector; and (3) maximum angular distance, which uses the range interval and the directionality of the point cloud to remove the erroneous point cloud. The method first identifies the farthest point. Then, this point is used as the center to find the point cloud within a certain radius. This point is evaluated using the maximum and minimum values of the plane coordinates of the point cloud within the radius. Error points are filtered out.
In the category of beams and columns that are difficult to classify, a method for direction evaluation is added to filter out erroneous points and thus improve the accuracy of beam and column models. After this preliminary filtering of error points, the outline of the component becomes visible. However, if the coordinates of the maximum endpoint value of the point cloud are used directly as a component range, the appearance of the model may differ from the real situation.
Therefore, in extracting the boundaries of elements such as columns and beams in this study, the vertical axis (Z axis) is used as the normal vector for the column, and the horizontal axes (X and Y) are used as normal vectors for the beam element. Then, the erroneous points of the 3D point cloud with the maximum angle are removed. This method considers the allowable value of the angle between the point cloud and the normal vector. The point cloud within the allowable range is retained; otherwise, it is eliminated.
3.2.4. Feature Extraction
The endpoint of the component must be extracted from the cross-section of the point cloud. If the cross-sectional information of a certain plane is directly obtained, it can readily result in insufficient information (Figure 3a). To resolve this, the method used in this research projects the segmented point cloud data to the minimum value of the reference direction according to the three axes (XYZ). The planarized point cloud has dense point clouds (Figure 3b).
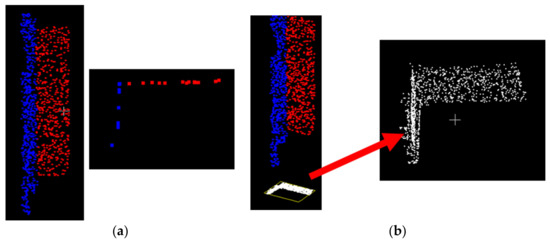
Figure 3.
(a) 3D point clouds are projected onto a certain section; point clouds are few. (b) Planarized point cloud from proposed method has dense point clouds.
An endpoint feature extraction process can then be performed. The planarization results in the three dimensions of XYZ are considered separately during the extraction operation. The coordinate values of components in three dimensions are extracted to achieve feature extraction.
3.2.5. Three-Dimensional Modeling
After completing the point cloud feature extraction, the attribute information can be used for the automatic modeling rules [17,18,37]. In the BIM operating platform, this study uses the Revit software produced by Autodesk for overall modeling display, component information viewing, conflict analysis, and other functional purposes. Design using Dynamo (a visual plug-in program for Revit) in the automatic modeling stage is implemented. Automatic modeling processes five parts: column, beam, wall, floor, and ceiling. Because the research objects are mainly preset components in the parameter library of Revit, several preset family types are directly selected as the modeling types in this study.
4. Experiments and Analyses
4.1. Test Area: Civil Engineering Building
The preliminary planning of the experimental area considered different indoor spaces as research targets; control points were set indoors; and coordinates were obtained for scale constraints and precision analysis. The number of training samples was increased using data amplification methods.
Four experimental areas, 2F, 4F, 6F, and the basement of the civil engineering building of our school, were selected as 3D reconstruction targets (Figure 4). The common characteristics of the four areas are as follows: they have distinct “columns,” “beams,” “walls,” “ceilings,” and “floors,” and a square layout.
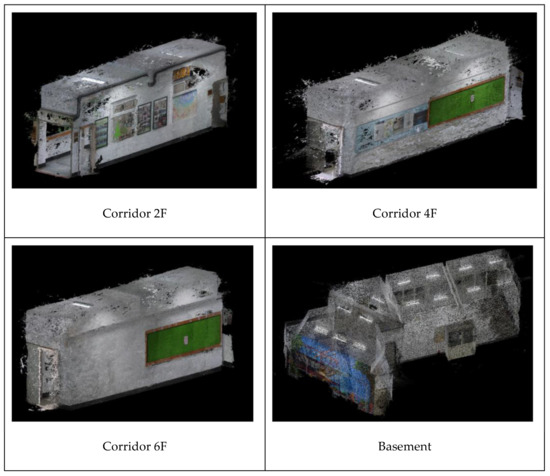
Figure 4.
Three-dimensional point cloud results of test area. Four experimental areas, the corridor of 2F, 4F, 6F, and the basement of the civil engineering building.
4.2. Three-Dimensional Point Cloud Classification
In this study, the DGCNN is used to train and segment the S3DIS dataset and the civil engineering hall of our school. This section presents the evaluation of the results of using the S3DIS dataset.
4.2.1. S3DIS Dataset
The S3DIS dataset has six areas: Area1, Area2, Area3, Area4, Area5, and Area6. In this study, Area2, Area3, Area4, Area5, and Area6 are used as training samples and Area1 is used as the test area. The data in Area1 include 13 categories of objects, such as tables and chairs. To explore the internal structure of the building, this study only retains the point cloud sample data of columns, beams, walls, floors, and ceilings for training and testing.
The parameter setting before training affects the subsequent semantic segmentation results; therefore, the parameters of the DGCNN model can be adjusted before training. After training, the training parameters set by S3DIS were as follows: batch size = 3, decay rate = 0.5, decay step = 300,000, learning rate = 0.001, momentum = 0.9, num point = 4096, and epoch = 40.
Each iteration of the training process lasted approximately 33 min, and the training accuracy started to flatten upon reaching 0.96. In the 40th iteration, the training loss rate was 0.019 and the training accuracy rate was 0.993; overfitting was not observed.
Based on the training results, this study selects the 40th iteration model for the segmentation test of the Area1 indoor area. Three small areas in Area1 were randomly selected for comparative analysis: Conference_Room2, Office_2, and Office_6; the overall segmentation accuracy rates are 86.90%, 97.49%, and 92.47%, respectively. Overall accuracy is calculated as the sum of correctly classified pixels divided by the total number of pixels. Table 1, Table 2 and Table 3 are the confusion matrices.

Table 1.
Conference_Room2 confusion matrix. The overall accuracy is 86.9%.
Table 2.
Office_2 confusion matrix. The overall accuracy is 97.5%.
Table 3.
Office_6 confusion matrix. The overall accuracy is 92.5%.
After analyzing the five structures, the segmentation results of the ceiling, floor, and wall were all found to be excellent; however, the classification results of the beam and column were inadequate.
Some wall point clouds were misclassified as columns, and beams were misjudged as walls and ceilings. The ground truth and segmented results are summarized in Table 4.
Table 4.
Categories of ground truth and segmented results for S3DIS dataset.
4.2.2. Civil Engineering Building
The experimental area of the civil engineering building in our school has four sections: corridors 2F, 4F, and 6F, and the basement.
The information obtained from corridors 4F and 6F as well as the basement is used as a training sample, and that from corridor 2F is used as a test sample.
In this study, the data augmentation method is used to increase the number of samples effectively. The training samples were sequentially divided at 10° intervals, and samples from 10° to 90° were also added. After adding the samples, the parameters obtained through training were as follows: batch size = 5, decay rate = 0.5, decay step = 300,000, learning rate = 0.001, momentum = 0.9, number of points = 4096, epoch = 40, and dropout = 0.4–0.7. In the training results, determining whether overfitting occurs was necessary. The tests for loss and accuracy of calculations using the sampling model was performed. No overfitting occurred during the S3DIS sample training, but overfitting started in round 34 after adding the close-range image sample data. It is assumed that the overfitting problem occurred because the training sample number of close-range images was small.
In the analysis, the lowest loss and highest accuracy rates occurred in the 33rd iteration; these were 0.182% and 94.2%, respectively. Subsequently, at the 34th iteration, the loss rate started to increase and the accuracy rate started to decrease. Accordingly, 0.7 was selected as the dropout point. The 33rd iteration yielded the best segmentation result after adding the samples.
The classification test results for the point cloud of corridor 2F are listed in Table 5.
Table 5.
Confusion matrix for corridor 2F. The overall accuracy is 94.2%.
In the confusion matrix in Table 4, the production accuracy rates were 99.1%, 93.6%, 96.6%, and 92.2% for the ceiling, column, floor, and wall, respectively. The beam achieved an accuracy rate of 76.7%. With regard to user accuracy, the beam, ceiling, floor, and wall reached accuracy rates of 87.1%, 93.7%, 100%, and 95.2%, respectively. The column attained an accuracy rate of 66.9%. The ground truth data of the point cloud and the visualization of the segmentation results are summarized in Table 6.
Table 6.
Categories of ground truth and segmented results for corridor 2F of civil engineering building.
Two types of sample data are used in this study: the S3DIS indoor dataset and the self-constructed point cloud sample of the civil engineering building. In the training process, owing to the sufficient training samples in S3DIS, the trend graphs of test and training accuracy rates were parallel; overfitting did not occur. In the 40th iteration of training, the overall segmentation accuracy rates of Area1_ConferenceRoom2, Area1_Office 2, and Area1_Office 6 reached 86.90%, 97.49%, and 92.47%, respectively.
However, in the training results of the civil engineering gymnasium, owing to the small number of original samples, sample training was performed in the form of data augmentation. The test sample was segmented using the training results of the 33rd iteration; the overall accuracy was 94.2%. After the analysis, the accuracy of beams and columns remained low.
4.2.3. Discussion of Classification Results
In the S3DIS dataset, the segmentation results of the ceiling, floor, and wall were all found to be excellent; however, the classification results of the beam and column were inadequate. Some wall point clouds were misclassified as columns, and beams were misjudged as walls and ceilings. The overabundance of these two types of components was due to the small size and number of point cloud samples; hence, this type of error was expected.
In the civil engineering building dataset, the segmentation accuracy of columns and beams is lower than that of walls, floors, and ceilings because of two possible reasons.
- Number of point clouds
In a single indoor space, the areas of walls, floors, and ceilings are larger than those of columns and beams. The original sample training results of the hall in the civil engineering building indicate that the segmentation results of columns and beams are lower than those of the walls, floors, and ceilings. Segmentation can be improved by increasing the number of training samples.
- 2.
- Geometric distribution of point cloud
The point cloud data of walls, floors, and ceilings has a flat and wide distribution. In contrast, the point cloud geometry of columns and beams has a 90° corner.
4.3. Semantic Segmentation and Modeling
After completing segmentation, the result of each test area was imported into the feature extraction operation. Moreover, parametric modeling was performed using automatic modeling rules.
4.3.1. S3DIS Modeling
In the test sample of S3DIS, three sections of Area_1 were selected for the analysis of segmentation results: Conference_Room2, Office_2, and Office_6. Feature extraction and parametric modeling of the three areas were performed sequentially. The modeling results are shown in Figure 5 to verify the feasibility of the automatic modeling rule design. To facilitate the visualization of internal modeling, the ceiling is removed, as shown in Figure 5.
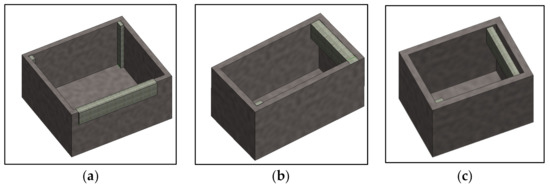
Figure 5.
Automatic modeling results of (a) Conference_Room2, (b) Office_2, and (c) Office_6 without ceiling.
4.3.2. 2F Corridor of Civil Engineering Building
After the segmentation of the point cloud in corridor 2F, feature extraction and automatic modeling were performed sequentially. The modeling results are shown in Figure 6. The ceiling is also removed to visualize the interior.
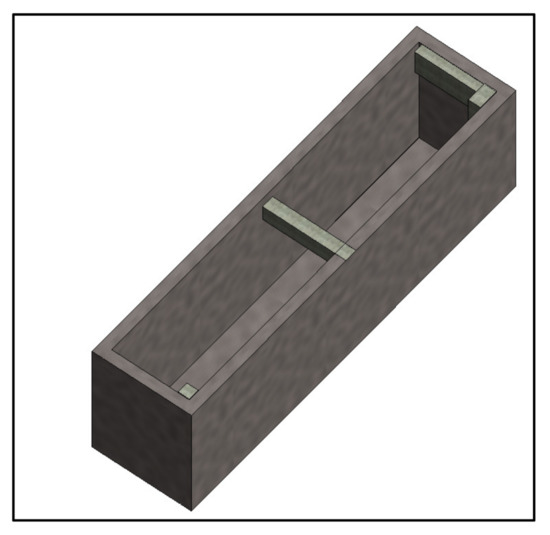
Figure 6.
Automated modeling results of corridor 2F (without ceiling) in civil engineering building.
4.4. Evaluation of 3D Model
As presented in this section, the modeling results of corridor 2F in the civil engineering building of our school were selected for testing. This is because corridor 2F is more convenient to measure on site than the other areas. There were two columns, four walls, two beams, one floor, and a ceiling in the area. This study analyzes the top view and sectional view, as shown in Figure 7.
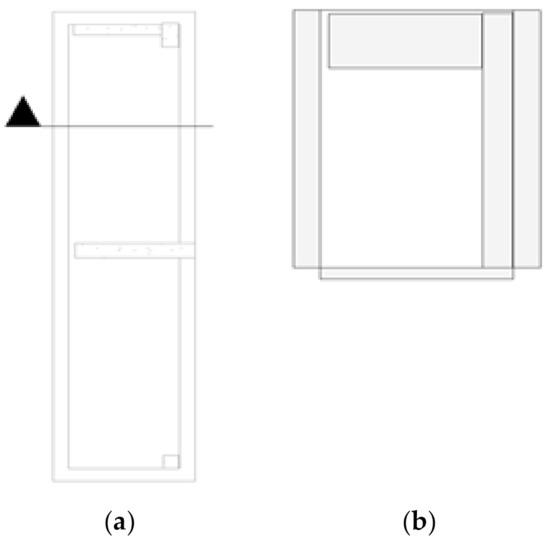
Figure 7.
(a) Top view and (b) sectional view of corridor 2F.
To verify whether the modeling result is consistent with the actual length of the selected area, a total station was used for measuring the points, as shown in Figure 8. The comparison results are listed in Table 7. The root mean square error (RMSE) of the line length given by BIM compared with the actual length is ±0.03 m.
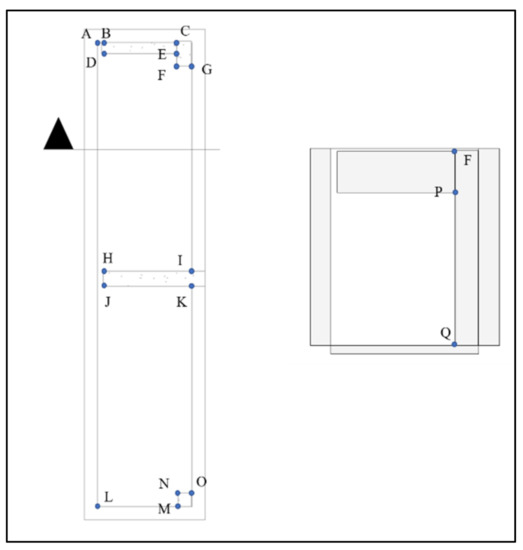
Figure 8.
Line position map for comparing 3D model and in situ field. The letters A–Q indicate the location of the points, and the length of the line segment connecting the two points is measured and compared in this study.
Table 7.
Three-dimensional model and actual line length difference (unit: m).
The feature extraction process developed in this study derives the features of endpoints from the point cloud segmentation results. Then, the parametric elements of columns, beams, walls, floors, and ceilings were automatically modeled based on the attribute information. The experimental results indicate that Area1_ConferenceRoom2, Area1_Office 2, Area1_Office 6 of S3DIS, and corridor 2F in the civil engineering building can be used to create the 3D model data of indoor components automatically. Each component has attribute information, such as material, length, volume, and quantity. The overall process not only reduces the time cost of manual model construction but also serves as follow-up application management. It is a rapid BIM method for reconstructing existing indoor spaces.
In comparing the actual length (obtained by inspection) of corridor 2F with the indoor measurement yielded by automatic modeling, the RMSE is found to be ±0.03 m; hence, the accuracy is acceptable.
5. Conclusions and Future Work
In this study, a DGCNN was used to learn indoor 3D point cloud features. Five items, i.e., columns, beams, walls, floors, and ceilings, were considered the research objects. Training and learning were conducted using two different sources of point cloud data: S3DIS and photogrammetry. Area_1 data in the S3DIS dataset and those of corridor 2F in the civil engineering building were used as test samples for segmentation.
The endpoint feature extraction program developed in this study was applied to process the segmented results. Other details, such as endpoint coordinates, quantity, and length of the research object, are derived. Finally, feature information is imported into an automatic modeling program for parametric element modeling.
This study uses a DGCNN to learn the features of indoor point clouds and segment the point clouds of columns, beams, walls, floors, and ceilings automatically. The overall accuracies using the S3DIS indoor dataset and civil engineering building information were 86.9% and 94.2%, respectively.
An endpoint feature extraction method that overcomes the errors caused by irregular line segments is proposed in this paper. In addition, for columns and beams with low semantic segmentation accuracy, a range processing method is devised to reduce semantic segmentation errors.
The method can be employed to calculate the number of components, boundary length and size, and relative information from the extracted endpoint. In comparing the inspected size of corridor 2F in the civil engineering building with the measurement yielded by automatic modeling, the RMSE is found to be approximately ±0.03 m. Because the point clouds are constrained by control points, the model is similar to the building.
The results of this study demonstrate that indoor 3D point clouds produced by close-range images can be segmented using a trained 3D deep learning network. The automatic feature point extraction method proposed in this study is employed to derive the feature point information of components. Using this information, the point cloud can be imported into an automatic modeling system to generate BIM parametric components and create indoor drawings.
There are a lot of objects in the room, and this study only sets out to study and discuss five categories of structural objects. In the future, we intend to increase the number of samples, increase the types of objects, reduce the noise, and explore ways to improve accuracy.
Author Contributions
Conceptualization, funding acquisition, methodology, writing—original draft preparation, C.-S.H. and X.-J.R.; data curation, software (data experiments), writing—review and editing, visualization, C.-S.H. and X.-J.R.; formal analysis, investigation (physical experiments), validation, X.-J.R. All authors have read and agreed to the published version of the manuscript.
Funding
This research received no external funding.
Data Availability Statement
This research did not use publicly archived datasets.
Conflicts of Interest
The authors declare no conflict of interest.
References
- Griffiths, D.; Boehm, J. A Review on Deep Learning Techniques for 3D Sensed Data Classification. Remote Sens. 2019, 11, 1499. [Google Scholar] [CrossRef]
- Wang, Y.; Ahsan, U.; Li, H.; Hagen, M. A Comprehensive Review of Modern Object Segmentation Approaches. Found. Trends Comput. Graph. Vis. 2022, 13, 111–283. [Google Scholar] [CrossRef]
- Guo, Y.-C.; Weng, T.-H.; Fischer, R.; Fu, L.-C. 3D semantic segmentation based on spatial-aware convolution and shape completion for augmented reality applications. Comput. Vis. Image Underst. 2022, 224, 103550. [Google Scholar] [CrossRef]
- Chen, H.; Liang, M.; Liu, W.; Wang, W.; Liu, P.X. An approach to boundary detection for 3D point clouds based on DBSCAN clustering. Pattern Recognit. 2022, 124, 108431. [Google Scholar] [CrossRef]
- Biagini, C.; Capone, P.; Donato, V.; Facchini, N. Towards the BIM implementation for historical building restoration sites. Autom. Constr. 2016, 71, 74–86. [Google Scholar] [CrossRef]
- Bello, S.A.; Yu, S.; Wang, C.; Adam, J.M.; Li, J. Review: Deep Learning on 3D Point Clouds. Remote. Sens. 2020, 12, 1729. [Google Scholar] [CrossRef]
- Camuffo, E.; Mari, D.; Milani, S. Recent Advancements in Learning Algorithms for Point Clouds: An Updated Overview. Sensors 2022, 22, 1357. [Google Scholar] [CrossRef]
- Diab, A.; Kashef, R.; Shaker, A. Deep Learning for LiDAR Point Cloud Classification in Remote Sensing. Sensors 2022, 22, 7868. [Google Scholar] [CrossRef]
- Sun, Y.; Paik, J.; Koschan, A.; Abidi, M. 3D reconstruction of indoor and outdoor scenes using a mobile range scanner. In Proceedings of the 2002 International Conference on Pattern Recognition, IEEE, Quebec City, QC, Canada, 11–15 August 2002. [Google Scholar]
- Wu, H.; Yue, H.; Han, J.; Zhang, S. Indoor Map Boundary Correction Based on Normalized Total Least Squares of Condition Equation. J. Surv. Eng. 2021, 147, 04021015. [Google Scholar] [CrossRef]
- Armeni, I.; Sener, O.; Zamir, A.R.; Jiang, H.; Brilakis, I.; Fischer, M.; Savarese, S. 3D semantic parsing of large-scale indoor spaces. In Proceedings of the IEEE Conference on Computer Vision and Pattern Recognition, Las Vegas, NV, USA, 27–30 June 2016. [Google Scholar]
- Wang, T.; Wang, Q.; Ai, H.; Zhang, L. Semantics-and-Primitives-Guided Indoor 3D Reconstruction from Point Clouds. Remote. Sens. 2022, 14, 4820. [Google Scholar] [CrossRef]
- Wang, Y.; Sun, Y.; Liu, Z.; Sarma, S.E.; Bronstein, M.M.; Solomon, J.M. Dynamic Graph CNN for Learning on Point Clouds. ACM Trans. Graph. 2019, 38, 1–12. [Google Scholar] [CrossRef]
- Guo, Y.; Wang, H.; Hu, Q.; Liu, H.; Liu, L.; Bennamoun, M. Deep Learning for 3D Point Clouds: A Survey. IEEE Trans. Pattern Anal. Mach. Intell. 2021, 43, 4338–4364. [Google Scholar] [CrossRef]
- Liu, W.; Sun, J.; Li, W.; Hu, T.; Wang, P. Deep Learning on Point Clouds and Its Application: A Survey. Sensors 2019, 19, 4188. [Google Scholar] [CrossRef]
- Yang, J.; Zou, B.; Qiu, H.; Li, Z. MLFNet-Point Cloud Semantic Segmentation Convolution Network Based on Multi-Scale Feature Fusion. IEEE Access 2021, 9, 44950–44962. [Google Scholar] [CrossRef]
- Chen, P.; Luo, Z.; Shi, W. Hysteretic mapping and corridor semantic modeling using mobile LiDAR systems. ISPRS J. Photogramm. Remote. Sens. 2022, 186, 267–284. [Google Scholar] [CrossRef]
- Ochmann, S.; Vock, R.; Klein, R. Automatic reconstruction of fully volumetric 3D building models from oriented point clouds. ISPRS J. Photogramm. Remote. Sens. 2019, 151, 251–262. [Google Scholar] [CrossRef]
- Xie, Y.; Tian, J.; Zhu, X.X. Linking Points with Labels in 3D: A Review of Point Cloud Semantic Segmentation. IEEE Geosci. Remote Sens. Mag. 2020, 8, 38–59. [Google Scholar] [CrossRef]
- Rashdi, R.; Martínez-Sánchez, J.; Arias, P.; Qiu, Z. Scanning Technologies to Building Information Modelling: A Review. Infrastructures 2022, 7, 49. [Google Scholar] [CrossRef]
- Jhaldiyal, A.; Chaudhary, N. Semantic segmentation of 3D LiDAR data using deep learning: A review of projection-based methods. Appl. Intell. 2022, 1–12. [Google Scholar] [CrossRef]
- Lin, H.; Wu, S.; Chen, Y.; Li, W.; Luo, Z.; Guo, Y.; Wang, C.; Li, J. Semantic segmentation of 3D indoor LiDAR point clouds through feature pyramid architecture search. ISPRS J. Photogramm. Remote. Sens. 2021, 177, 279–290. [Google Scholar] [CrossRef]
- Jeon, J.; Jung, J.; Kim, J.; Lee, S. Semantic Reconstruction: Reconstruction of Semantically Segmented 3D Meshes via Volumetric Semantic Fusion. Comput. Graph. Forum 2018, 37, 25–35. [Google Scholar] [CrossRef]
- Qi, C.R.; Su, H.; Mo, K.; Guibas, L.J. PointNet: Deep learning on point sets for 3D classification and segmentation. In Proceedings of the 30th IEEE Conference on Computer Vision and Pattern Recognition, CVPR 2017, Honolulu, HI, USA, 21–26 July 2017. [Google Scholar]
- Qi, C.R.; Yi, L.; Su, H.; Guibas, L.J. PointNet++: Deep hierarchical feature learning on point sets in a metric space. Adv. Neural Inf. Process. Syst. 2017, 30, 5105–5114. [Google Scholar]
- Mitropoulou, A.; Georgopoulos, A. An Automated Process to Detect Edges in Unorganized Point Clouds. ISPRS Ann. Photogramm. Remote. Sens. Spat. Inf. Sci. 2019, IV-2/W6, 99–105. [Google Scholar] [CrossRef]
- Kong, G.; Fan, H.; Lobaccaro, G. Automatic building outline extraction from ALS point cloud data using generative adversarial network. Geocarto Int. 2022, 1–18. [Google Scholar] [CrossRef]
- Mahphood, A.; Arefi, H. Grid-based building outline extraction from ready-made building points. Autom. Constr. 2022, 139, 104321. [Google Scholar] [CrossRef]
- Chen, X.; Yu, K. Feature Line Generation and Regularization from Point Clouds. IEEE Trans. Geosci. Remote Sens. 2019, 57, 9779–9790. [Google Scholar] [CrossRef]
- Awrangjeb, M. Using point cloud data to identify, trace, and regularize the outlines of buildings. Int. J. Remote Sens. 2016, 37, 551–579. [Google Scholar] [CrossRef]
- Wang, Y.; Jeschke, S. Edge extraction by merging 3D point cloud and 2D image data. In Proceedings of the 2013 10th International Conference and Expo on Emerging Technologies for a Smarter World (CEWIT), IEEE, Melville, NY, USA, 21–22 October 2013. [Google Scholar]
- Borges, P.; Zlot, R.; Bosse, M.; Nushke, S.; Tews, A. Vision-based localization using an edge map extracted from 3D laser range data. In Proceedings of the 2010 IEEE International Conference on Robotics and Automation, IEEE, Anchorage, AK, USA, 3–7 May 2010. [Google Scholar]
- Sampath, A.; Shan, J. Building Boundary Tracing and Regularization from Airborne Lidar Point Clouds. Photogramm. Eng. Remote Sens. 2007, 73, 805–812. [Google Scholar] [CrossRef]
- Jiang, S.; Jiang, C.; Jiang, W. Efficient structure from motion for large-scale UAV images: A review and a comparison of SfM tools. ISPRS J. Photogramm. Remote Sens. 2020, 167, 230–251. [Google Scholar] [CrossRef]
- Braun, A.; Tuttas, S.; Borrmann, A.; Stilla, U. Improving progress monitoring by fusing point clouds, semantic data and computer vision. Autom. Constr. 2020, 116, 103210. [Google Scholar] [CrossRef]
- Torr, P.H.S.; Zisserman, A. MLESAC: A New Robust Estimator with Application to Estimating Image Geometry. Comput. Vis. Image Underst. 2000, 78, 138–156. [Google Scholar] [CrossRef]
- Macher, H.; Landes, T.; Grussenmeyer, P. From Point Clouds to Building Information Models: 3D Semi-Automatic Reconstruction of Indoors of Existing Buildings. Appl. Sci. 2017, 7, 1030. [Google Scholar] [CrossRef]


Disclaimer/Publisher’s Note: The statements, opinions and data contained in all publications are solely those of the individual author(s) and contributor(s) and not of MDPI and/or the editor(s). MDPI and/or the editor(s) disclaim responsibility for any injury to people or property resulting from any ideas, methods, instructions or products referred to in the content. |
© 2023 by the authors. Licensee MDPI, Basel, Switzerland. This article is an open access article distributed under the terms and conditions of the Creative Commons Attribution (CC BY) license (https://creativecommons.org/licenses/by/4.0/).