Abstract
Numerous pedestrians interact with the subway station space by finding entrances into this closed area to use the subway system; further, they may use transfer transportation facilities or the complex functions nearby, such as commercial. Many studies examine pedestrian behaviors in subway stations, but most focus on special situations such as disasters and evacuation. Because it is important to analyze gait patterns in everyday situations, this study aims to verify the explanatory power of actual gait behavior by using space syntax theory in constructing an optimal agent-based model. To this end, first, pedestrian characteristics and space types are classified using pedestrian data from Gangnam Station. Second, the depthmapX program is used to develop an appropriate agent-based model for stations. Third, a simulation is run to calculate the frequency of the agent movement at each gate, which is matched with the observed pedestrian volume. Fourth, the relationship between the frequency of the agent movement and pedestrian volume is analyzed using Statistical Package for the Social Sciences. The results show that although agent-based models have limitations in explaining pedestrian patterns in the entire subway station, they are capable of explaining these patterns along the shortest paths between ticket gates and station entrances.
1. Introduction
1.1. Background
As urban areas expand, subways are constructed to alleviate traffic congestion. However, many subway stations in the city center are overcrowded during peak hours [1]. Therefore, predicting people’s space use patterns in stations is important to both their convenience of movement and safety. In addition, many people find it challenging to navigate the station space, given that it is a closed underground space that has many multifunction facilities such as transfer transportation and commercial facilities [2]. Because the behaviors of pedestrians in station space contribute to increased congestion and unused space, it is important to understand how they move from the platforms to the exits after passing through the ticket gates.
In this regard, many commercial software programs support agent-based models to analyze and predict pedestrian behaviors—for example, Building EXODUS, Simulex, Pathfinder, and Unity 3D [3]. However, these programs are typically used to analyze crowd diversion mechanisms for use in emergency evacuation rather than in the daily environment. Further, they set complex conditions for individual agents and are hence suitable for applications in a limited closed space and under special circumstances [4]. In addition, these simulation programs are not used for large and the diverse elements of the surrounding environment cannot be incorporated into them [5]. Therefore, researchers have been seeking ways to overcome the limitations of such simulations and have called for new approaches [6].
In this context, pedestrian behaviors in subway stations under normal circumstances differ from those during an emergency evacuation, when only the shortest distance paths are used. In reality, pedestrians do not calculate the most optimal path to the destination with every step. In other words, they choose paths continuously by using available visual information [7]. Hence, a visual perception-based simulation of space is required to predict their behaviors under normal circumstances. To this end, this study examines subway station space using the Visual Graph Analysis (from now “VGA”) method of space syntax theory [8,9,10,11]. Nevertheless, given that in an analysis of space, VGA cannot be used to examine micro-space use behaviors, an agent-based model was developed by employing space syntax theory. This model can be used to analyze pedestrian behaviors under normal circumstances by incorporating the field of view for agents and the visibility characteristics of the station [12]. However, it needs to be verified in various spatial environments to confirm that it is completely reliable [13].
In sum, this study seeks to apply and verify an agent-based model by examining its correlation with the observed pedestrian volume in a major subway station in which the pedestrian environment is important. The study provides insights into pedestrian behavior patterns according to the characteristics of the subway station space and discusses potential applications for the presented agent-based model.
1.2. Literature Review
1.2.1. Studies on the Effect Factors on Pedestrian Behavior in Subway Stations
Modern subway stations not only transport passengers but also serve as transport hubs and multiuse facilities. Consequently, these are perceived as key urban facilities that significantly influence the development of surrounding areas [14]. Proposals to develop subway stations as multiuse facilities that reflect local identity are often presented [15,16]. Many studies have focused on user satisfaction with the station’s physical environment or the appropriateness of station size [17,18,19]. The key focus area of studies that examine stations as multiuse facilities is often the design of an efficient transit center or the development of an integrated information system [17,20,21]. Thus, subway stations are studied as important spaces that attract people and generate complex behaviors in the urban environment.
Meanwhile, various studies have also considered the characteristics of the spatial configuration of subway stations since it affects human behavior [22]. For instance, Durmisevic and Sariyildiz [23] derived space syntax indicators to assess the quality of underground station space, and Yoon and Kim [2] introduced such indicators as elements of wayfinding in public space within. In addition, Van der Hoeven and Van Nes analyzed design of underground space in two subway stations using space syntax method [24]. These studies have also discussed ways to improve the environment by verifying that the subway station environment is related to spatial configuration indicators.
Other studies have examined the relationship between the spatial configuration of subway stations and pedestrian behaviors in more detail. For example, Kim and Kim [7] showed that pedestrian behaviors in the space between the platform and the ticket gates are related to the field of view, which is dependent on a spatial configuration, but that there was little correlation in other areas. Moreover, Ueno [10] analyzed the spatial characteristics of multiuse commercial facilities connected to Shibuya Station and their relationship to pedestrian volume. This study showed that although the correlation was low overall, there was a positive correlation at the ticket gates and station entrances. Thus, these studies have commonly identified a specific subway station space where pedestrian behavior is determined by spatial configuration. Notably, these studies suffer from a limitation in that they have not analyzed how various pedestrian behaviors are influenced by the spatial configuration of subway stations.
Another stream of studies has investigated the effects on pedestrian behavior of environmental factors other than the spatial configuration in order to compensate for this limitation. In this regard, Okamoto et al. [9] studied an underground market in Nagoya, Japan, and argued that elements other than spatial configuration—such as the visual depth from the corridor and the number of store tenants—significantly affect pedestrian behavior. Further, Xu and Chen [11] measured urban spatial vitality in underground spaces connected to subways by analyzing the relationship between hourly pedestrian volumes and spatial characteristics. They found that vitality is related not only to the accessibility to space syntax elements and the field of view but also to the size of the space, the range of functions, and transportation elements—and that the effects differ according to the time of the day. In other words, since pedestrian behaviors at a station are influenced by factors such as the surrounding function, scale, and environment, it is difficult to explain their behavior by considering existing spatial configuration indicators alone.
In sum, pedestrian behaviors inside subway stations differ from general pedestrian behaviors that depend on spatial configuration.
1.2.2. Studies of Pedestrian Behavior Using Agent-Based Models
Many studies on pedestrian behaviors have used the space syntax approach [25], including that of Turner and Penn [13], who proposed the agent-based model and simulated pedestrian movements using agents with a defined field of view as they moved in space. This approach is based on Gibson’s ecological theory of perception [26]. This model does not depend on learned paths or destinations, but instead follows movement rules based on the spatial configuration of buildings [13,27]. The model can be used in both a closed internal space [28] and a large open space [29,30]. Some key studies that have used this model are as follows.
Turner and Penn [13], who studied the Tate Britain gallery, are the first to have verified the correlation between the agent-based model and the characteristics of pedestrian behaviors. They showed that when agents were programmed to change direction after 3 steps, the model showed the highest correlation with observed pedestrian patterns ( = 0.76). Above all, it is meaningful that they confirmed the validity of the agent-based model. Hu et al. [31], who analyzed pedestrian patterns in a plaza, based their simulations on scenarios of various conditions experienced by pedestrians. They tested for the scenario most similar to the current gait pattern, thus demonstrating the possibility of combining spatial organization and multiple agents. Omer and Kaplan [32] examined pedestrian behavior in the urban environment using an agent-based model, that incorporated a street network and land use. They showed that the agent-based model is more effective than a multiple regression analysis (from now “MRA”) model in explaining pedestrian behaviors. Thus, these studies have confirmed that the agent-based model can be used to explain urban pedestrian behaviors. Jiang and Jia [33], who analyzed a road network through agent-based simulations, found no difference in behavior between pedestrians with and without a final destination. This result is significant for controlling crowd flow. Cheliotis [34] tested agent-based models of space design and human behaviors and asserted that these models explain the complexities of human and crowd behavior in space. Thus, this study confirmed the validity of the agent-based model for analyzing pedestrian behavior in spaces ranging from the interior space of a building to open spaces in a city.
The following studies have analyzed rail stations using agent-based models. Castle et al. [35] argued for applying these models in rail stations—pointing out the need for crowd evacuation and exit simulations—but did not conduct empirical research. Tang and Hu [36] used an agent-based model to study Sihui Station in Beijing, China, focusing on examining the spatial design of the station’s public space and parking space and of the retail space outside the station. They proposed a solution to address congestion at the station entrance and strategies to improve pedestrian circulation patterns. Although agent-based model studies for subway stations are insufficient, the importance of the movement path connected to the entrance has been confirmed. Meanwhile, the analyses in these studies are limited to the station’s surrounding areas and overlook its internal space. Therefore, the present study is meaningful in that it analyzes pedestrian behaviors in the indoor space connected to the subway entrance by using the agent-based model validated in previous studies.
2. Methods and Data
2.1. Methods
This study explores how well an agent-based model can explain observed pedestrian behavior in the underground space connected to subway stations. The hypothesis in this study is as follows: “An agent-based model is capable of explaining pedestrian behavior in the underground space connected to subway stations”. To verify this statement, the study proceeds in five steps.
First, pedestrian behavior and subway station space types were analyzed, given that the underground space connected to station is influenced not only by ticket gates and the external environment of the station but also by visual accessibility. Therefore, pedestrian data were collected to analyze actual pedestrian behaviors, and space types were defined according to pedestrian behaviors. Second, an appropriate agent-based model that reflects the characteristics of the underground space connected to subway stations was created. Using depthmapX program—was used to set values for the agent analysis tool—including the analysis length, the number of agents and locations, and the agent set parameters. Spatial configuration characteristics and Turner and Penn’s study [13] were considered because these authors applied an agent-based model in real space to study visitor behaviors in a gallery and verified their results. Although present study Turner and Penn’s results [13] were initially considered, some parameters have changed the model to fit observed pedestrian behaviors. Third, an agent-based simulation was run for comparison with the observed pedestrian volume at each observation location. The data included the number of agents who moved through the cells, which can be compared with pedestrian behavior. Fourth, the study’s hypothesis was supported by explaining the observed pedestrian volume using an agent-based simulation. To this end, correlation and regression analyses were conducted using Statistical Package for the Social Sciences (from now “SPSS”). The correlation analysis correlation coefficients and significance for each category. In the simple linear regression analysis, the adjusted , Durbin–Watson values, and significance was calculated to ascertain the extent to which the agent-based model can explain the observed pedestrian volume. A section with conclusions and a discussion follows the results section. Figure 1 summarizes the research method and process.
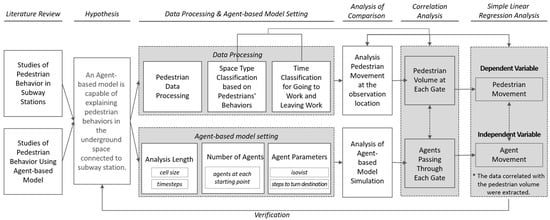
Figure 1.
Research method and process.
2.2. Study Area Characteristics
The study area selected was Gangnam Station, Seoul, Korea. Specifically, the study area was limited to the station’s first basement (B1) level, which has ticket gates and entrances. Gangnam Station is among the busiest subway stations in Korea and is connected to many multiuse facilities. Table 1 shows the five subway stations with the highest annual ridership in 2021. The first is Sinnonhyeon, followed by Gangnam. Gangnam and Jamsil Stations are both transportation hubs connected to the subway and other modes of transportation. They are also connected to underground commercial areas. Gangnam Station was selected for this study since it has both a high level of ridership and a wide range of space use behaviors.

Table 1.
The five subway stations with the highest annual ridership in 2021.
In Gangnam Station (Line 2), the platform is located in the second basement (B2) level, and the ticket gates and the station entrances are located in the level (Figure 2). Pedestrian behaviors on the platform depend on the transfer locations in the previous stations rather than the spatial configuration of this station itself [8]. Therefore, this study excluded the B2 level and focused on the B1 level, where pedestrian behaviors are related to the spatial configuration of the station space. In the B1 level, a corridor links the underground commercial area to the Sinbundang Line for people who wish to transfer. Gangnam Station (Line 2) has 8 entrances. Since the road intersection above this station does not have crosswalks, people sometimes use the B1 level to cross the intersection. More than 89 city and inter-city bus routes connect Gangnam Station to Seoul’s other centers and to satellite cities around Seoul [37].
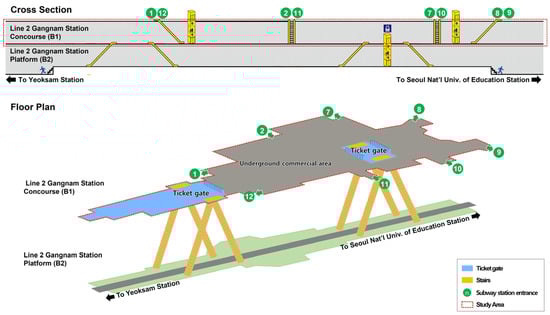
Figure 2.
Study area (first basement level (B1), Line 2 Gangnam Station).
2.3. Components and Path Selection of Agent-Based Model
The agent-based model based on space syntax was simulated in the depthmapX program. The components of the environment were the analysis length, the number of agents, and the starting points.
The analysis length was the time the agent enters and travels. The number of agents was set for each starting point. The agent parameters included the agent stride length, walking speed, isovist, and steps before changing the direction to the destination. The agent stride length and walking speed are related and set the cell size of 1 step. The isovist is the angular extent the agent is heading toward the destination. Therefore, when the agent changes direction, the agent chooses a new random destination within the isovist [12]. This model is not for setting a final destination and move, but for continuously changing the destination according to visibility.
Figure 3 shows the agent’s path selection process in the model [12,38]. First, the scope of analysis space, environment, and agent parameters is set. Then, the number of agents at the starting point is entered. Each agent establishes a destination at the starting point and takes steps before changing direction. Upon arrival, the agent determines a temporary new destination using the isovist. It is based on Poisson distribution. If the agent’s field of view is unclear, they take a step to the left or right to set a new destination. When an agent arrives at a new destination, the agent moves iteratively according to the same rules.
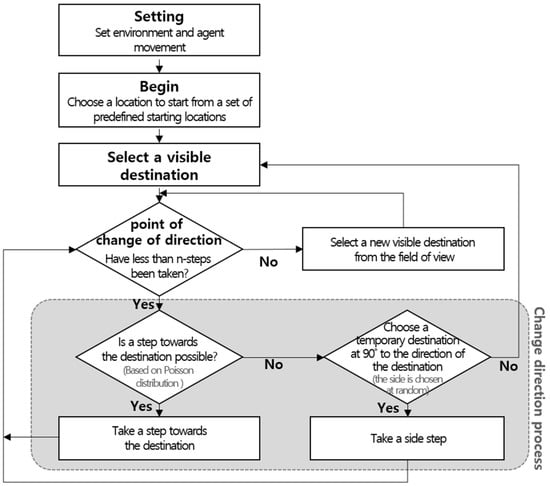
Figure 3.
Flow chart of the agent decision process.
2.4. Pedestrian Data and Behaviors
2.4.1. Pedestrian Data
In this study, pedestrian data from Kim et al. [8] was used for analysis. Specifically, they divided the study into convex spaces and counted the number of pedestrians at the “gates” defined at the boundaries. They collected data for 5 min between 8–9 a.m. and 6–7 p.m. on a Friday. Although Kim et al. [8] included data on 48 gates, this study used data collected from 28 gates only since the study area was restricted to the B1 level and excluded the B2 level (Figure 4). Gangnam Station area is a major office district where the pedestrian volume is highest during commute hours and reaches the highest level during Friday evening commute hours. Therefore, it was considered appropriate to use these data as representing the busiest times.
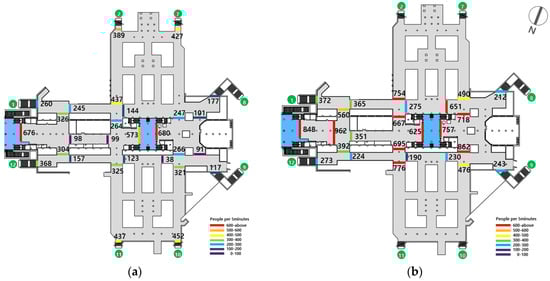
Figure 4.
Pedestrian volume count in first basement level (B1), Gangnam Station: (a) morning commute hours (8–9 a.m.); (b) evening commute hours (6–7 p.m.). (Maps created by the author from Kim et al. [8]).
The data collected from the 28 gates during morning and evening commute hours are shown in Figure 4a,b, respectively. The areas filled in blue are separated by ticket gates, and the numbers in green circles refer to station exit numbers. Pedestrian volume is denoted with colored lines—the red lines denote higher volumes, and the purple lines denote lower volumes. The numbers next to the colored lines are the number of pedestrians who passed the gates during the 5 min observations.
The highest pedestrian volume during the morning commute was observed at the ticket gates, followed by station exits 10(452), 11(437), and 7(427), and the southbound corridor (437). Meanwhile, station exits 8 and 9 had relatively low pedestrian volumes, as did the western section of the station. Similarly, the highest pedestrian volume during the evening commute was observed at the ticket gates and relatively low pedestrian volumes were observed at exits 8 and 9. However, the corridors connecting the ticket gates in the center to exits 2, 7, 10, and 11 had very high pedestrian volume levels. It was observed that there were more people in the corridors, given that the pedestrian count at the ticket gates was approximately 700.
A comparison of the pedestrian volumes during the morning and evening commute hours showed that the pedestrian volume was higher in the evening. In the morning, pedestrians passed the ticket gates, and then immediately dispersed via corridors or exits. In the evening, in addition to subway riders, there were pedestrians who remained in the underground space or passed through the station and left via other exits. This can be observed in the pedestrian volume difference between the ticket gates and nearby corridors. For example, for the northeast ticket gate, the number of pedestrians in the morning was 676. The number of pedestrians in the three connected corridors was 326, 304, and 98, respectively. The difference between ticket gate count and corridor count is 52 and shows the ratio of pedestrians who travel through the connected corridors. However, in the evening, the number of pedestrians at the ticket gate and at a nearby point were 848 and 962, respectively. The pedestrian counts in the three connected corridors was 560, 351, and 392. The difference exceeds 100 even close to the ticket gate and exceeds 340 in connected corridors. This result indicates that pedestrians not only use the ticket gates but also either stay in the station space or pass through it to exit the station.
2.4.2. Space Type Classification Based on Pedestrian Behaviors
Among the pedestrians inside Gangnam Station, workers comprise the largest group [37]. This indicates that during commute hours, most pedestrians have a definite destination and are well aware of its location and the shortest paths to reach it. They tend to travel along the shortest path to their destination, from the subway platform to the ticket gates to the station exits [8,39]. Since pedestrian behaviors differ depending on whether they take the shortest path or not, this study examined pedestrian behaviors separately for different sections of travel. To this end, “shortest path space” was defined as in Figure 5, by directly connecting station exits to the nearest ticket gates (Figure 5a). Spaces outside the “shortest path space” were categorized simply as the corridors of the underground commercial areas.
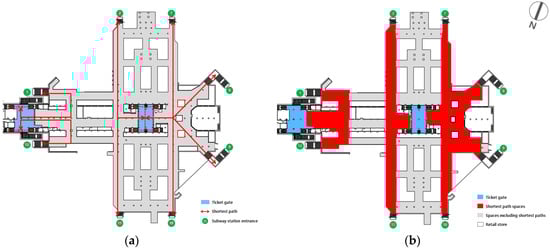
Figure 5.
Definition of shortest path space between ticket gates and subway station entrances: (a) shortest paths; (b) shortest path space.
3. Verification of Pedestrian Volume Using Agent-Based Model
3.1. Definition of Agent-Based Model and Calibration
3.1.1. Analysis Length
The analysis length was set to 5 min after an agent is released. This corresponds to the actual observation period of 5 min and enables direct comparison of agent simulation results with observed pedestrian volume. In addition, it takes approximately 5 min for people to travel from the subway platform to a station exit through a ticket gate.
In the depthmapX program, “timestep” refers to the analysis period. The study area is divided into cells (unit space), and the cells represent the travel time. Sutherland et al. [40] defined the cell size at 0.75 m × 0.75 m and assumed a walking speed of 1.5 m/s. Therefore, 1 s is equivalent to 2 timesteps.
Given that the width of ticket gates in the study area is 0.5 m at most, the cell size cannot be set as 0.75 m × 0.75 m because the space around the ticket gates would be “closed.” VGA, which provides the basis for conducting agent-based modeling, requires a grid setting so that all spaces are connected and accessible [38]. Hence, the cell size was set at 0.375 m × 0.375 m, which is equivalent to a half step and also enables agents to pass through the ticket gates. In addition, the timesteps were set to 4 per second, or 1200 since the analysis length was 5 min (300 s).
3.1.2. Number of Agents
To determine the number of agents, public ridership data for Gangnam Station in October 2007 was applied to enable a direct comparison with the observed pedestrian volume. The average ridership between 8–9 a.m. was 3627 entries and 19,408 exits, corresponding to 1919 in 5 min. The average ridership between 6–7 p.m. was 14,765 entries and 11,726 exits, corresponding to 2207 in 5 min.
The number of agents to be introduced depends on the cell size, and the number of agents to be released per 1/4 s was entered for starting points. For the starting points, the stairs to the subway platform (eight sections) reflect the number of exits, and the station’s eight exits/entrances reflect the number of entries. The number of agents introduced for the analysis length (1200 timesteps) is 1.58 for the morning commute and 1.85 for the evening commute. The ratio between entries/exits is approximately 1:53 during the morning commute, and 1:0.79 during the evening commute, which is similar to the actual pedestrian volume in the station (1 in the equation).
Morning Commute (8–9 a.m.): 1200 [timesteps] × 1.59 [agents] = 1908 agents
Evening Commute (6–7 p.m.): 1200 [timesteps] × 1.84 [agents] = 2208 agents
Evening Commute (6–7 p.m.): 1200 [timesteps] × 1.84 [agents] = 2208 agents
3.1.3. Agent Parameters
The agent parameters were adopted from Turner and Penn’s study [13] on Tate Britain Gallery in London. In this study, agents were programmed such that their field of view was 170° and they changed direction after three steps. The highest correlation between the predicted and observed pedestrian volume ( = 0.76) was observed in this setting, which confirmed the model’s validity.
The field of view angle in the present study was also set to 170° (15 bins), and “steps before turn decision” was initially set to 6 steps or 1.5 s in line with Turner and Penn’s setting of 1.5 s or 3 steps [13]. However, these parameters did not match the actual pedestrian behaviors, and after several trials, it was discovered the setting of 12 steps best fit the actual pedestrian behavior. It can be surmised that in Turner and Penn’s study [13], people changed direction frequently to view the artworks in the gallery, whereas in the subway space, during commute hours people tend to move in a relatively straight way to their destinations.
3.2. Comparison of Agent-Based Model Simulation and Observed Pedestrian Volume
3.2.1. Analysis of Agent-Based Model Simulation
The gate count results from the movement of agents through the cells can be compared with the observed pedestrian volume. As agents move during the 5 min period, cells record the frequency of their movement. In Figure 6, colors closer to red (blue) indicate cells with higher (lower) frequency values.
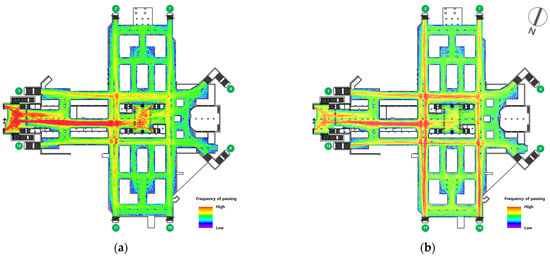
Figure 6.
Agent-based simulation results: (a) morning commute hours (b) evening commute hours.
The morning commute results showed that the section with the highest frequency is the ticket gates in the station’s east section, followed by the corridor linking those ticket gates in the east to the ones in the center. The corridor linking station exits 2 and 11 had the next highest frequency, and the corridors around the underground commercial areas showed relatively low frequency. The evening commute results differ—the corridors near the station exits showed higher frequency values than the ticket gate sections. This finding reflects the fact that the proportion of ‘exits (entries)’ is higher during the morning (evening) commute.
3.2.2. Comparison of Simulated and Observed Pedestrian Volume
The simulation result includes frequency values, which indicate how many times agents passed through each cell. Table 2 presents the frequency values from the cells corresponding to the locations in the station where the actual number of pedestrians was counted. For observation locations without data, the frequency value of the cells was excluded. In sum, a database containing data from 28 locations during the morning commute and 25 locations during the evening commute was prepared. All 53 locations were included in the statistical analysis. In addition, given that pedestrians tend to travel along the shortest paths [7], gates were classified into those along the shortest paths and those that are not, in order to examine their spatial characteristics. In all, 35 gates were along the shortest paths (17 for the morning commute, and 18 for the evening commute), and 18 gates were not (11 for the morning commute, and 7 for the evening commute).
Table 2.
Data on pedestrian movement and agent movement at the observation location.
3.3. Investigation of Observed Pedestrian Volume Using Agent-Based Model
3.3.1. Correlation Analysis
Table 3 shows the correlations between the observed pedestrian volume and the total number of agents by observation period and gate type. Following Turner and Penn’s approach to verification of the simulation results [13], the pedestrian volume and the frequency value of agents were both log-transformed so that the distribution is close to normal distribution.
Table 3.
Correlation between observed pedestrian volume and agent number.
The results in Table 3 show that the observed pedestrian volume and simulation frequency values are positively correlated at 0.35 for all gates. For gates located on the shortest paths, the correlation is very high at 0.83. For gates not located on the shortest paths, the correlation is negative but not statistically significant. Regarding the morning commute hours, there is no correlation for all gates—but for those along the shortest paths, it is 0.83. During evening commute hours, there is a positive correlation of 0.64, and for the shortest paths, it is 0.79. In other words, the observed pedestrian volume and the total number of agents show high correlation in the shortest path spaces. In contrast, the observed pedestrian volume during the morning commute hours differs from that revealed by the agent simulation. For gates not located on the shortest paths, there is only a weak correlation, both during morning and evening commute hours, at the 0.05 confidence level, but the correlation is negative for the morning commute and positive for the evening commute. This difference likely stems from the limitation of a small sample size.
3.3.2. Simple Linear Regression Analysis
After extracting simulation data that had a positive correlation with the observed pedestrian volume, a simple linear regression analysis was conducted to examine agent attributes that explain the observed pedestrian volume clearly. The observed pedestrian volume was the dependent variable, and the frequency value of agents is the independent variable. Both and Durbin–Watson values were checked to determine how well the model fits the data. For the Durbin–Watson test, a value close to 2 indicates that the residuals from the regression analysis are not autocorrelated. An analysis of variance (ANOVA) was used to evaluate whether the results are significant at the p < 0.01 level (99% confidence interval).
Table 4 shows that for the entire study area including all gates, the adjusted is very low at 0.103 and the regression is not statistically significant at the 99% confidence level. However, for gates on the shortest paths, the regression is statistically significant and is 0.693. Table 5, which presents results from morning commute hours, shows that the regression is statistically significant only for gates on the shortest paths, and the adjusted is 0.663.
Table 4.
Simple linear regression analysis for the entire study area.
Table 5.
Simple linear regression analysis for morning commute hours.
Table 6 presents the results for the evening commute hours, and although the regression is statistically significant for all gates (adjusted = 0.378), the Durbin–Watson value is less than 1 and the regression does not have adequate explanatory power. For gates on the shortest paths, the regression is statistically significant and the adjusted is 0.599.
Table 6.
Simple linear regression analysis for evening commute hours.
In sum, the regression is statistically significant and can explain the observed pedestrian volume for only the shortest path spaces. The two regression equations are presented below (two of an equation), as shown in Equation (2) and Figure 7. The agent simulation has the best explanatory power when the morning and evening commute data are both included (68.4%). Specifically, the pedestrian volume for the morning commute is slightly better explained. This study’s hypothesis that “An agent-based model is capable of explaining pedestrian behavior in the underground space connected to subway stations” is therefore rejected for the entire study area. However, it is not rejected when applied only to the shortest path spaces.
Shortest path gate during morning and evening commute hours: y = 0.684x + 0.339
Shortest path gate during morning commute hours: y = 0.663x + 1.201
Shortest path gate during evening commute hours: y = 0.599x + 1.292
Shortest path gate during morning commute hours: y = 0.663x + 1.201
Shortest path gate during evening commute hours: y = 0.599x + 1.292
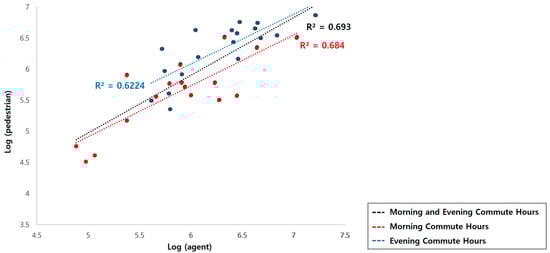
Figure 7.
Simple linear regression analysis between the observed pedestrian volume and the number of agents for gates on the shortest path.
4. Discussion
This study analyzed how an agent-based model can explain real pedestrian behaviors in a subway station. The correlation between the frequency of agent movement from the agent-based model and the observed pedestrian volume was weak and did not have explanatory power (R = 0.346). However, when only the shortest path spaces were analyzed separately, the correlation was high and had strong explanatory power (R = 0.833). In other words, the main result of this study is that it verified that the agent-based model can explain the behavior of pedestrians only for the shortest path within the subway station. Based on previous studies and the results from this study, the following four points need to be discussed.
First, it should be ensured that pedestrians have the appropriate viewing angle in the space corresponding to the shortest path connecting the ticket gate and the station exit to ensure smooth pedestrian flows. In this study, the pedestrian behavior patterns show that the people who use subway stations during commute hours depend on their field of view and follow the shortest paths between the ticket gates and the station exits. In particular, the explanatory power for the morning commute hours was 66% higher than for the evening commute hours (60%). Notably, prior studies have reported this pattern and have also revealed that subway users are well aware of the shortest path to their destinations and choose to travel along these paths [8,39]. In contrast, the correlation was low for spaces outside the shortest path spaces. While this result is not statistically significant (R = −0.321. p-value = 0.097), it indicates that the spaces outside the shortest path spaces are used as travel space to destinations—indicating that these serve as shortcuts based on the experiences of pedestrians rather than on their field of view. This result is related to Penn’s argument that the pedestrian behavior patterns for the spaces along the destination path differ from those determined by spatial configuration.
Second, the agent-based model used to analyze the subway station space should reflect the factors that affect movement by considering the various walking purposes of pedestrians, given that the results of the model used in this study varied depending on the characteristics and space use behavior of the agent. The correlation between the results from the agent-based model and the observed pedestrian volume was low for the subway station space because pedestrians engage in many types of behaviors simultaneously. The observation of pedestrians revealed that some subway riders are aware of the shortest paths from the subway platform to station exits and travel with a clear purpose, but others either look around the underground commercial area or remain in one location. In Turner and Penn’s analysis of the Tate Britain Gallery [13], the explanatory power of agents was high at 76%, because most pedestrians had a common goal of artwork appreciation. Therefore, it is necessary to experiment with different model parameters, for example, by modifying agent conditions or introducing a space-type variable, depending on pedestrian behavior.
Third, subway stations need a physical environment plan to respond to the changing pedestrian behaviors by the time of day. This study analyzed data from a station’s pedestrian peak hours, that is, the morning and evening commute hours on a Friday. The correlation between the frequency of agent movement and the observed pedestrian volume was very high (R = 0.827) along the shortest paths during the morning commute hours, and slightly lower (R = 0.789) during the evening commute hours. During the evening commute hours, the correlation was low (R = 0.636) for the entire station as well. These results are in accordance with Xu and Chen’s argument [11] that spatial vitality varies in different periods of the day depending on environmental variables. In addition to subway riders, there were pedestrians who did not use the subway but stayed in one space during the evening commute hours. This finding indicates that although pedestrian behavior during morning and evening commute hours differs, a multiple regression analysis that includes factors that likely influence such behaviors at other times of the day must be conducted.
Fourth, future studies should adjust the environment and agent settings of the agent-based model according to the characteristics of the actual physical environment and pedestrian behaviors. For the agent program parameter in the present study, “steps before turn decision” was initially set to the default value of three steps [13], but this was not appropriate as a predictive model of pedestrian volume in a subway station. Other values were tested, and it was determined that 12 steps were the most optimal for this study. Therefore, when applying an agent-based model for a structure, it is necessary to apply appropriate parameters for each space type. If researchers modified it to better match actual pedestrian behaviors, the agent-based model would become an effective tool capable of predicting pedestrian behaviors accurately.
5. Conclusions
This study contributes to the literature in two ways. From the academic perspective, it developed an agent-based model—capable of predicting general pedestrian behaviors—and applied it not to a general building structure but, rather, to a subway station, which is a unique space. From the methodological perspective, the study showed that although this model has shortcomings, it has the potential to predict natural pedestrian behaviors and can be applied to diverse types of architectural space.
Regardless, this study has some limitations. First, the pedestrian data size was not large enough, since data from observation locations in only one station were used. Therefore, this study attempted to reveal the model’s validity by testing the residuals and the significance of the regression equation. Second, this study used only an agent-based model to explain actual pedestrian patterns using simple linear regression. Since the goal of the study was to verify the explanatory power of the agent-based model other factors were not considered. Therefore, future studies need to build a more meaningful predictive model and test it using data collected from several subway stations. In addition, multiple regression analysis models should be verified by examining various factors influencing gait behavior.
Therefore, in the future, it is necessary to build a more meaningful predictive model with comprehensively approached data and data from several subway stations. In addition, the multiple regression analysis models should be verified by examining various gait behavior influencing factors.
Despite these limitations, this study is meaningful because it presents an agent-based model that reflects the reality of the subway station space where pedestrians engage in various pedestrian behaviors. The analysis results can provide primary data for developing agent-based models for built and urban environments. In addition, this study can be used as a guide when evaluating and planning a pedestrian-centered subway station space.
Author Contributions
Conceptualization, J.Y.K. and Y.O.K.; methodology, Y.O.K.; software, J.Y.K.; validation, J.Y.K.; formal analysis, J.Y.K. and Y.O.K.; resources, Y.O.K.; data curation, J.Y.K. and Y.O.K.; writing—original draft preparation, J.Y.K.; writing—review and editing, J.Y.K. and Y.O.K.; visualization, J.Y.K.; supervision, Y.O.K. All authors have read and agreed to the published version of the manuscript.
Funding
This research received no external funding.
Data Availability Statement
Data derived from the current study can be provided to readers upon request.
Conflicts of Interest
The authors declare no conflict of interest.
References
- Gupta, S. Facilities for Passenger Movement to Decongest Underground Stations. J. Inst. Eng. Ser. A 2014, 95, 269–276. [Google Scholar] [CrossRef]
- Yoon, H.J.; Kim, Y.O. Analytic Study on the Spatial Configuration of Public Space in Subway: With Focus to the Wayfinding Elements. J. Archit. Inst. Korea Plan Des. 2002, 18, 187–194. [Google Scholar]
- Liu, J.; Zhang, R.; Sun, L.; Yan, W. Fire Evacuation in Complex Underground Space of Personnel. Proceedings of IOP Conference Series: Earth and Environmental Science, Chengdu, China, 23–25 April 2021; IOP Publishing: Bristol, UK, 2021. [Google Scholar]
- Moussaïd, M.; Helbing, D.; Theraulaz, G. How Simple Rules Determine Pedestrian Behavior and Crowd Disasters. Proc. Natl. Acad. Sci. USA 2011, 108, 6884–6888. [Google Scholar] [CrossRef] [PubMed]
- Bellomo, N.; Dogbe, C. On the Modeling of Traffic and Crowds: A Survey of Models, Speculations, and Perspectives. SIAM Rev. 2011, 53, 409–463. [Google Scholar] [CrossRef]
- Thalmann, D.; Musse, S.R. Crowd Simulation, 2nd ed.; Springer Science & Business Media: London, UK, 2012. [Google Scholar]
- Kim, C.J.; Kim, Y.O. A Study on the Movement Pattern of Passengers in Subway Station. J. Archit. Inst. Korea Plan Des. 2007, 23, 71–78. [Google Scholar]
- Kim, Y.O.; Kim, C.J.; Cho, I.O.; Kim, A.H.; Nam, S.W. The Effect of Spatial Layout on Space Use Pattern in Subway Station. Proceedings of KSR Conference, Jeju, Korea, 17–18 May 2007; 2007. [Google Scholar]
- Okamoto, K.; Kaneda, T.; Ota, A.; Meziani, R. Correlation Analyses between Underground Spatial Configuration and Pedestrian Flows by Space Syntax Measures: A Case Study of Underground Mall Complex in Nagoya Station. Natl. Libr. Aust. Cat. Publ. Entry 2014, 1, 116–128. [Google Scholar]
- Ueno, J.; Nakazawa, A.; Kishimoto, T. An Analysis of Pedestrian Movement in Multilevel Complex by Space Syntax Theory-in the Case of Shibuya Station. J. Civ. Eng. Archit. 2009, 118, 1–12. [Google Scholar]
- Xu, Y.; Chen, X. The Spatial Vitality and Spatial Environments of Urban Underground Space (Uus) in Metro Area Based on the Spatiotemporal Analysis. Tunn. Undergr. Space Technol. 2022, 123, 104401. [Google Scholar] [CrossRef]
- Penn, A.; Turner, A. Space Syntax Based Agent Simulation. In Pedestrian and Evacuation Dynamics; Schreckenberg, M., Sharma, S.D., Eds.; Springer-Verlag: Berlin, Germany, 2002; pp. 99–114. [Google Scholar]
- Turner, A.; Penn, A. Encoding Natural Movement as an Agent-Based System: An Investigation into Human Pedestrian Behaviour in the Built Environment. Environ. Plan. B Plan. Des. 2002, 29, 473–490. [Google Scholar] [CrossRef]
- Bae, W.K.; Ahn, H.J.; Jeong, M.K. An Implication Study for Making the Station-Oriented Neighborhood Resulting from the Analysis of Land Use and Pedestrian Environment on Newly Designated Station Area—Focused on the No.9 Subway Line, Second Section (Samjung Station-Coex Station). J. Urban Des. Inst. Korea Urban Des. 2010, 11, 113–128. [Google Scholar]
- Won, J.Y. “Compound” Program Proposal for Railway Station Reflecting Regional Context: Focused on the Case of Shinchon Station. Master’s Thesis, Ewha University, Seoul, Korea, 2005. [Google Scholar]
- Lee, S.K. Bujeon Complex Transfer Station, Developing a Creative Transfer Center That Combines Various Functions Is Emerging as a Task. Busan Dev. Forum 2017, 165, 20–25. [Google Scholar]
- Kim, J.H.; Kim, S.G.; Lee, K.N. Assessment of the New Capacity and Los of Transfer Facilities in the High-Speed Railway Stations. J. Korean Soc. Civ. Eng. D 2008, 28, 735–740. [Google Scholar]
- The Korea Transport Institute. Evaluation of Service Quality of Rail Station on Demand-Side Perspective and Application. 2014. Available online: http://www.dbpia.co.kr/journal/articleDetail?nodeId=NODE06335902 (accessed on 27 October 2022).
- Jang, S.Y.; Han, S.Y.; Kim, S.G. A Study on Level of Service of Pedestrian Facility in Transfer Stations at Urban Railroad. J. Korean Soc. Railw. 2010, 13, 339–348. [Google Scholar]
- Choi, Y.K.; Lee, J.Y.; Cho, Y.S. A Study on the Planning of the Mixed-Use Complex for Urban Revitalization. J. Archit. Inst. Korea Plan. Des. 2009, 25, 183–190. [Google Scholar]
- The Korea Transport Institute. A Study on Planning Guidelines for Transit Center Complex. 2010. Available online: http://www.dbpia.co.kr/journal/articleDetail?nodeId=NODE02416776 (accessed on 29 October 2022).
- Hillier, B.; Hanson, J. The Social Logic of Space; Cambridge University Press: Cambridge/London, UK; New York/New Rochelle, NY, USA; Melbourne/Sydney, Australia, 1984. [Google Scholar]
- Durmisevic, S.; Sariyildiz, S. A Systematic Quality Assessment of Underground Spaces–Public Transport Stations. Cities 2001, 18, 13–23. [Google Scholar] [CrossRef]
- van der Hoeven, F.; van Nes, A. Improving the Design of Urban Underground Space in Metro Stations Using the Space Syntax Methodology. Tunn. Undergr. Space Technol. 2014, 40, 64–74. [Google Scholar] [CrossRef]
- Hillier, B.; Penn, A.; Hanson, J.; Grajewski, T.; Xu, J. Natural Movement: Or, Configuration and Attraction in Urban Pedestrian Movement. Environ. Plan. B Plan. Des. 1993, 20, 29–66. [Google Scholar] [CrossRef]
- Gibson, J.J. The Ecological Approach to Visual Perception: Classic Edition; Psychology press: New York, NY, USA; London, UK, 2014. [Google Scholar]
- Turner, A. From Axial to Road-Centre Lines: A New Representation for Space Syntax and a New Model of Route Choice for Transport Network Analysis. Environ. Plan. B Plan. Des. 2007, 34, 539–555. [Google Scholar] [CrossRef]
- Pelechano, N.; Allbeck, J.M.; Badler, N.I. Controlling Individual Agents in High-Density Crowd Simulation. In Proceedings of the 2007 ACM SIGGRAPH/Eurographics Symposium on Computer Animation, San Diego, CA, USA, 2–4 August 2007. [Google Scholar]
- Batty, M. Agent-Based Pedestrian Modelling. Adv. Spat. Anal. CASA Book GIS 2003, 81, 81–106. [Google Scholar]
- Torrens, P.M. Intertwining Agents and Environments. Environ. Earth Sci. 2015, 74, 7117–7131. [Google Scholar] [CrossRef]
- Hu, H.; Luo, Z.; Chen, Y.; Bian, Q.; Tong, Z. Integration of Space Syntax into Agent-Based Pedestrian Simulation in Urban Open Space. In Proceedings of 22nd International Conference on Computer-Aided Architectural Design Research in Asia(CAADRIA:) Protocols Flows and Glitches, Suzhou, China, 5-8 April 2017; The Association for Computer-Aided Architectural Design Research in Asia: Hong Kong.
- Omer, I.; Kaplan, N. Using Space Syntax and Agent-Based Approaches for Modeling Pedestrian Volume at the Urban Scale. Comput. Environ. Urban Syst. 2017, 64, 57–67. [Google Scholar] [CrossRef]
- Jiang, B.; Jia, T. Agent-Based Simulation of Human Movement Shaped by the Underlying Street Structure. Int. J. Geogr. Inf. Sci. 2011, 25, 51–64. [Google Scholar] [CrossRef]
- Cheliotis, K. An Agent-Based Model of Public Space Use. Comput. Environ. Urban Syst. 2020, 81, 101476. [Google Scholar] [CrossRef]
- Castle, C.; Waterson, N.; Pellissier, E.; Le Bail, S. A Comparison of Grid-Based and Continuous Space Pedestrian Modelling Software: Analysis of Two Uk Train Stations. In Pedestrian and Evacuation Dynamics; Springer: Berlin/Heidelberg, Germany, 2011. [Google Scholar]
- Tang, M.; Hu, Y. Pedestrian Simulation in Transit Stations Using Agent-Based Analysis. Urban Rail Transit 2017, 3, 54–60. [Google Scholar] [CrossRef]
- Chae, S.K. Remodeling Design Directions on the Gangnam Station Underground Public Pedestrian Facility. J. Archit. Inst. Korea Plan. Des. 2012, 56, 48–52. [Google Scholar]
- Turner, A.; Doxa, M.; O’sullivan, D.; Penn, A. From Isovists to Visibility Graphs: A Methodology for the Analysis of Architectural Space. Environ. Plan. B Plan. Des. 2001, 28, 103–121. [Google Scholar] [CrossRef]
- Jung, R.H.; Chung, J.H.; You, S.Y. Analysis of Route Choice Behavior in Subway Station: Focusing on Walking Distance. Korea Spat. Plan. Rev. 2016, 88, 81–100. [Google Scholar]
- Sutherland, D.; Kaufman, K.; Moitoza, J. Kinematics of Normal Human Walking. In Human Walking; Rose, J., Gamble, J.G., Eds.; Williams and Wilkins: Baltimore, MD, USA, 1994. [Google Scholar]


Disclaimer/Publisher’s Note: The statements, opinions and data contained in all publications are solely those of the individual author(s) and contributor(s) and not of MDPI and/or the editor(s). MDPI and/or the editor(s) disclaim responsibility for any injury to people or property resulting from any ideas, methods, instructions or products referred to in the content. |
© 2023 by the authors. Licensee MDPI, Basel, Switzerland. This article is an open access article distributed under the terms and conditions of the Creative Commons Attribution (CC BY) license (https://creativecommons.org/licenses/by/4.0/).