Article

Analysis of Engineering Performance and Environmental Impact of Asphalt Pavement Debonding and Ice Suppression Materials

1
Nanjing Institute of Technology, Nanjing 211167, China
2
NJIT Institute of Industrial Economy and Innovation Management, Nanjing 211167, China
3
Department of Highway and Railway Engineering, School of Highway, Chang’an University, Xi’an 710064, China
*
Author to whom correspondence should be addressed.
Buildings 2023, 13(3), 689; https://doi.org/10.3390/buildings13030689
Submission received: 1 November 2022 / Revised: 16 February 2023 / Accepted: 21 February 2023 / Published: 6 March 2023
(This article belongs to the Special Issue Materials in Sustainable Buildings)

Abstract

:
Aiming at the maladies of high labor intensity, the low efficiency of ice and snow removal, and environmental pollution in traditional ice-deicing and snow-melting methods, we successfully developed a material that can effectively reduce the adhesive force between ice and snow with the pavement, aimed at the characteristics of the road ice de-icing and snow melting. According to the evaluation index and method of de-icing performance, we determined the ratio of the three components of the film-forming component, the adhesive component, the modified ice suppression component, and the preparation technology. It has no perfect evaluation index and method for the viscosity-reducing and ice-defending materials at present, this paper further evaluates the performance of the viscosity-reducing and ice-defending materials from the aspects of ice-deicing performance, durability, and environmental performance. The results show that the viscosity-reducing and ice-defending material has good permeability and water resistance. The material still has good ice-deicing performance after seven rounds of cycle tests at the same time, indicating that it has a good slow-release performance. It is verified that the viscosity-reducing and ice-defending materials have good durability using the low-temperature accelerated test. Finally, from the analysis and evaluation of the environmental protection performance of the viscosity-reducing and ice-defending materials, the materials have no effect on the growth of plants and their average corrosion rate is much lower than the average corrosion rate of the snow melting test piece, which means that the viscosity-reducing and ice-defending materials have good environmental performance.

1. Introduction

In winter, the temperature in most areas is low. Snow and ice are common on the road due to low ambient temperature. When compared to a regular pavement, snow and ice pavements have a much lower friction coefficient, and traffic accidents occur frequently due to vehicle skidding. Traffic accidents caused by rainy and snowy weather have a serious impact on road traffic safety and the social economy [1]. In order to avoid rain and snow-induced traffic accidents in winter and ensure road driving safety, certain measures must be taken to remove ice and snow on the road. Snow and ice removal measures usually adopted by road maintenance workers include manual or mechanical spreading of snow melting agents, manual snow shoveling, and mechanical snow and ice removal [2,3]. At present, the most commonly used method to control and limit the formation of road ice is the use of antifreeze materials, such as salt (usually sodium chloride, calcium chloride, and sodium acetate), which are scattered on roads and other infrastructure [4]. However, this solution is highly demanding for materials, labor, and equipment, and the high economic cost also produces many other side effects [5].
When the ambient temperature is low, ice and snow will form a firm bond structure with the pavement surface, and a large amount of ice and snow will adhere to the road surface. This bond structure makes it more difficult to remove ice and snow from the pavement. Various instruments used for manual or mechanical snow and ice removal will inevitably cause damage to the pavement structure [6]. When observing the microstructure of the road surface that has been cleared of snow, it can be found that there are still many small ice particles on the road surface, causing the adhesion coefficient between the road surface and the tires to decrease, and bringing hidden dangers to road traffic safety [7]. This is especially the case in the back shade of the mountains, bridges, tunnels, and special sections of highways, which are highly accident-prone sections in winter [8].
Traditional road snow and ice removal methods can be divided into two categories: physical and chemical. The physical snow melting and deicing method consists of laying heating cables inside the asphalt mixture when paving the asphalt mixture and using the heat generated by the heating cables to melt the snow and ice on the road surface. Additionally, it entails paving after elastomer components, such as rubber particles, are added to the asphalt mixture [9]. The rubber material can break and melt ice and snow due to its elastic deformation, thus achieving the effect of deicing. The traditional chemical snow melting and deicing method consists of adding various inorganic salts directly into the asphalt mixture [10,11]. Saline substances separated from the asphalt mixture and road surface water form a salt solution. The freezing point of the formed road salt solution is lower than the original solution, which can play a role in restraining snow accumulation [12].
Self-snow-melting asphalt pavement is different from the traditional process of spreading snow-melting agents on the pavement. On the premise of ensuring that the road performance of the asphalt pavement meets all the specifications, self-snow-melting asphalt pavement mixes snow-melting agent into the asphalt mixture to reduce the freezing point of the asphalt pavement, thus achieving the effect of snow-melting and ice suppression [13]. At present, MFL and V-260 snow-melting materials are the two widely used internally mixed snow-melting agents. Since the 1960s, many European countries wanted to get rid of the current situation of using a large amount of chlorine salt deicing agent and began to study self-melting pavement [9]. Switzerland and Germany have long developed a material that can be used as deicing salt to be added to asphalt mixture in order to reduce the freezing point of pavement. Verglimit can lower the freezing point of asphalt roads to minus 20 °C. The V-260 (Verglimit-260) with high performance has been attained via the ongoing advancement of Verglimit’s production procedure and material choice [13].
In the 1980s, Japan started researching self-melting asphalt pavement, enhancing the water absorption capabilities and slow-release mechanism of asphalt pavement additives based on some V-260 principles. Following numerous experimental studies, it was able to produce MFL with improved performance. The road performance of asphalt mixture with MFL was tested, and it was found that its high-temperature stability and low-temperature crack resistance are basically the same as those of traditional asphalt mixture without MFL, and its water damage resistance is improved compared with asphalt mixture with V-260. It can be seen that the performance of MFL is still improved [13]. However, the main dissolved component of MFL is NaCl, which will still cause corrosion pollution to the environment. At the same time, the precipitation rate of MFL is fast in the early stage and slow in the late stage, making it difficult to control, resulting in limited road life. In order to better safeguard the environment, MFL needs to better improve on how to regulate the precipitation of snow-melting salt [14].
In the 21st century, some foreign researchers put the phase change temperature regulating material (PCM), which is used in the aerospace, military, and textile industries, into the production process as an additive material for asphalt mixes, so that the temperature regulating the function of PCM can be used to achieve active snow melting [5]. This ensures the high-temperature rutting resistance of the pavement and also prevents the pavement temperature from falling sharply and freezing when the temperature drops suddenly. Although the technology procures the asphalt mixture pavement with long service life, it has great limitations [15]. Due to the characteristics of phase change temperature regulation, this kind of pavement can only perform well in areas such as southern China where temperature occasionally drops below zero and is not suitable for cold areas where the temperature is lower than zero for a long time in winter [16]. Chen et al. have developed a new type of ice and snow inhibitor. The road performance and snow melting performance of the prepared asphalt mixture is promising, but there is a little breakthrough in environmental protection [17]. Zheng et al. also carried out experimental research on new snow and ice inhibitors. According to climate factors such as temperature, altitude, and snowfall in China. The proportion, mixing amount, and pavement processing technology of snow and ice inhibitors were formulated in different climates [18]. Bai et al. have developed a new self-melting snow asphalt pavement additive IceBane. The test shows that the self-melting snow pavement mixed with IceBane can achieve a better snow-melting effect under conditions ensuring excellent road performance [19]. Dou has improved the snow-melting performance and road life of self-melting asphalt pavement by developing an ultra-thin salt compound TSSAM and studying the maximum amount of this salt compound in the asphalt mixture [20]. Practices of ice suppression in pavements in both China and abroad have proved that self-melting snow pavement technology is the most appropriate snow-melting pavement technology at present, but it still needs to be studied and improved in terms of road life and snow melting effect [21].
The ice-suppressing material developed in this paper has the characteristics of active deicing, zero negative impact on roads, bridges, and other ancillary facilities and vegetation, preventive maintenance for the pavement, and continuous deicing in winter. In asphalt pavement, the effective components of the anti-freezing agent are slowly released for a long time under the action of the slow-release agent to achieve the effect of long-term snow melting and ice suppression. It has great innovation and application prospects and provides a new method and way for road deicing. The flowchart of the paper is shown in Figure 1.

2. Component Design and Preparation of the Ice-Defending Materials

2.1. Component Design and Preparation

Through the pretest, we obtained the viscosity-reducing and ice-defending materials which consist of three components, the mass ratio of Component A, Component B, and Component C is mA:mB:mC = 97:2:3. The preparation technology of the viscosity-reducing and ice-defending materials includes the preparation of film-forming component A, the preparation of adhesive component B, the preparation of modified ice suppression component C and the preparation of finished viscosity-reducing and ice-defending materials.
(1)
The preparation of film-forming component A
We added 4 parts of reinforcing agent A2, 3 parts of filler A3 and 4 parts of film-forming aids A4 to 180 parts of diluent water A9, then stirred them at 300~500 rpm for 15~20 min, after dispersion and mixing, added 100 parts of organic silicone rubber lotion A1, 1.7 parts of catalyst A6, 4.2 parts of plasticizer A5, 3 parts of leveling agent A7 mixture, 0.3 part of defoamer, stirred them at 300~500 rpm for 15~20 min, obtained film-forming component A after mixing well.
(2)
The preparation of adhesive component C
We mixed 29 parts of crosslinker B1 and 71 parts of coupling agent B2, stirred them at 300~500 rpm for 15~20 min, and obtained adhesive component B.
(3)
The preparation of modified ice suppression component C
We added 275 parts of modified silane coupling agent C4 into 54 parts of composite freezing point inhibitor C1, heated and stirred evenly, added 100 parts of porous adsorptive carrier materials C2 after complete dissolution, added 2.5 parts of carbon black C3 to the powder for color enhancement after 5~10 min, after the water was completely evaporated, dried it and crushed it to obtain black ice suppression component C.
(4)
The preparation of viscosity-reducing and ice-defending materials
We added 3.1 parts of modified ice suppression component C into 100 parts of film-forming component A, then added 2.1 parts of adhesive component B, stirred them at 200~400 rpm for 10~15 min, and obtained the viscosity-reducing and ice-defending materials after mixing well. The schematic diagram of the finished product of the viscosity-reducing and ice-defending materials is shown in Figure 2.

2.2. Asphalt and Aggregate Materials

The basic properties of asphalt used in this paper are shown in Table 1.
The basic properties of aggregates used in this paper are shown in Table 2.
The Marshall test is a commonly used test method to determine the optimum asphalt content of asphalt mixture. It can also reflect the high-temperature performance of asphalt mixture and verify its rationality through other tests to guide the implementation of the project. According to experience, seven asphalt and stone ratios are selected for mix design, which are 5.4%, 5.8%, 6.2%, 6.6%, 7.0%, 7.4%, and 8.0%, respectively. The Marshall test pieces of asphalt mixture are formed under the conditions of various asphalt/stone ratios, and the volume parameters and mechanical properties of Marshall test pieces under different asphalt contents are tested. The test results are listed in Table 3, and the optimum asphalt/stone ratio is finally determined to be 7.1%.
The Marshall test piece is only used as a bearing sample to evaluate the deicing capacity of the reagent. Therefore, it is decided not to reflect the performance index of Marshall test piece in the text, but to reflect the index of the sample used in the reply, as shown in Table 4.

3. Experimental Design and Evaluation of the Viscosity-Reducing and Ice-Defending Materials

In order to ensure that the viscosity-reducing and ice-defending materials can continuously play the role of ice-deicing in winter, it is necessary to prepare a small amount of the viscosity-reducing and ice-defending materials with components A, B, and C in a certain proportion for performance testing before large-scale on-site construction, large-scale on-site construction can only be carried out after the passing the test. The viscosity-reducing and ice-defending material is a new type of active environmental protection ice-deicing material, there is little research and evaluation on its performance at present, and no perfect evaluation index and method have been formed, therefore, it is necessary to study the durability of the viscosity-reducing and ice-defending materials, aiming at the environmental protection performance of the viscosity-reducing and ice-defending materials, it is necessary to analyze and evaluate the environmental protection performance of the materials so as to provide technical support for the promotion and application of the viscosity-reducing and ice-defending materials.

3.1. The Durability of the Viscosity-Reducing and Ice-Defending Materials

The durability of the viscosity-reducing and ice-defending materials mainly refers to the ability to achieve the function of lasting ice-deicing, the durability of the viscosity-reducing and ice-defending materials is related to many factors, such as permeability, water resistance, slow-release performance, etc. The durability of the viscosity-reducing and ice-defending materials was analyzed and evaluated from the aspects of water resistance, and slow-release performance, and the ice-deicing performance was verified by the low-temperature accelerated loading test.

3.1.1. Water Resistance

According to the evaluation standard of water resistance of the viscosity-reducing and ice-defending materials, used improved immersion test to test and evaluate the durability of the hydrophobic viscosity-reducing and ice-defending materials, chose a group of Marshall specimens with grading AC-13, brushed the viscosity-reducing and ice-defending materials on the specimens, put them into constant temperature water for 24 h and 48h, respectively, observed the change of the viscosity-reducing and ice-defending materials on the surface of the specimens, the test results are shown in Figure 3.
As shown in Figure 3, it could be seen from the test results after 24 h and 48 h of soak of the specimens of the viscosity-reducing and ice-defending materials that there is no bubbling, shedding, and freezing after 24 h and 48 h of soaking in water, the viscosity-reducing and ice-defending material was still in good condition which implied that the viscosity-reducing and ice-defending materials had good water resistance.

3.1.2. Slow-Release Performance

The viscosity-reducing and ice-defending material adsorbs the freezing point inhibitor through the porous adsorption carrier in its component material, then releases it slowly to achieve an ice-deicing effect, based on this principle, the stronger the adsorption capacity of the porous adsorption material to the freezing point inhibitors, the more the material adsorbs the freezing point inhibitors, and the stronger the release capacity is, the anti-freezing effect will last longer, according to the characteristics of the viscosity-reducing and ice-defending materials, use the adsorption capacity of porous adsorption carrier materials and the precipitation capacity of freezing point inhibitors to evaluate.
(1)
Absorption ability
The adsorption capacity of the porous adsorption carrier material can be quantitatively expressed by the mass change before and after the porous adsorption carrier adsorbs the ice point inhibitor, which is called the adsorption rate, the specific test steps are as follows: We weighed the porous adsorption carrier material C2 with a mass of m0 (correct to 0.01 g) after drying, then soaked them in a saturated solution of freezing point inhibitor C1 prepared in advance and got them out after 24 h. We weighed the mass m1 after drying in a 110 °C low-temperature drier, the adsorption rate of porous adsorption carrier material is calculated according to Formula (1).
S a = m 1 m 0 m 0
where, m1 is the mass of the material after soaking; m0 is the mass of the material before soaking; Sa is the adsorption rate of porous adsorption carrier material.
We selected the commonly used adsorption carrier materials with strong adsorption capacities, such as volcanic rock, zeolite, and the adsorption carrier materials of the viscosity-reducing and ice-defending materials to carry out the adsorption rate test according to Formula (1), the test results are shown in Table 5.
As shown in Table 5, the porous adsorption carrier material of the viscosity-reducing and ice-defending materials had a higher adsorption rate than the volcanic rock and zeolite, which showed that the porous adsorption carrier material of the viscosity-reducing and ice-defending materials has a good ability to adsorb the freezing point inhibitor, it could ensure long-term anticoagulant properties of ice.
(2)
Ice-deicing performance of freezing point inhibitor through precipitation
The method designed in this paper to evaluate the ice-deicing ability of the freezing point inhibitor of the viscosity-reducing and ice-defending materials through precipitation is as follows: we brushed the mixture of the viscosity-reducing and ice-defending materials to Marshall specimens, after the viscosity-reducing and ice-defending materials were dried, we put the specimens in quantitative water to soak for 3 h, and took soaked water specimens for argentimetry [22]. Then, we put the water and the specimens together at the temperature of −30 °C, and took out the specimens after 3 h, we also carried out the “falling ball impact test”. If the ice layer was loose and fragile, it indicated that the viscosity-reducing and ice-defending materials had an ice-deicing effect. We removed the ice layer on the surface of the specimens and continued to place the viscosity-reducing and ice-defending materials specimens in the new same amount of water. We took the soaked water specimens for argentimetry, then put them in the water at a temperature of −30 °C again, and so on. The blank specimen was taken as the control group specimen each time. After at least 7 cycle tests (equivalent to the snowfall of 7 snowstorms in a winter) [23], if the viscosity-reducing and ice-defending material still has the effect of ice-deicing, it indicated that the viscosity-reducing and ice-defending material has a lasting ice-deicing ability.
The specimen of the viscosity-reducing and ice-defending materials after 7 cycles of tests and the “falling ball impact test” is shown in Figure 4. The viscosity-reducing and ice-defending materials specimen still had ice-deicing performance after 7 cycles of tests, through the test, it could also be determined that the concentration of freezing point inhibitor in water was reduced from 34 mg/mL to 16 mg/mL after 7 cycles of tests. The test results are shown in Figure 5. The viscosity-reducing and ice-defending materials still had an ice-deicing effect at this time, indicating that the viscosity-reducing and ice-defending materials had a good ice-deicing performance.

3.1.3. Low Temperature Accelerated Loading Test

After the debonding and ice suppression material is sprayed on the road surface, it must be subjected to the rolling and abrasion effect of the vehicle for a long time in order to verify the wear condition of the debonding and ice suppression material after being rolled by the vehicle and the effect of the debonding and ice suppression material after being rolled and worn by the vehicle. In this paper, the debonding and ice suppression material was sprayed on the rutting plate specimens and tested in the high and low-temperature material and structural performance test room (as shown in Figure 6). The high- and low-temperature material and structural performance test room are specially designed to verify the pavement material and structural performance designed closed laboratory. The temperature in the test room can be controlled by the program, and the temperature can be controlled at −60 °C–+60 °C. The pavement material and structure tests are carried out on the steel channel test platform (as shown in Figure 7). The width of the steel channel test platform is 1.2 m. The length is 3m, asphalt rutting boards can be used for splicing to simulate asphalt pavement, and a trolley (pressure is 0.7 MPa, speed is 30 m/min) is used to simulate vehicle load. The steel channel test platform can control the thickness of the ice layer by controlling the amount of water added. Asphalt pavement simulation specimens were composed of 40 rutting plate specimens. One part of the rutting plate specimens was sprayed with debonding and ice-suppressing material and cured, and the other part was the blank control group specimen.
(1)
Experimental simulation of the deicing performance of debonding and ice suppression materials
In order to simulate the deicing performance of the debonding and ice-suppressing material specimens, the asphalt pavement simulation specimens were composed of 40 rutting plate specimens on the steel channel test platform. The specimen was under a temperature of −30 °C and the thickness of the ice layer was controlled by different water addition amounts to 4 mm and 10 mm to simulate the actual situation of icing on the southern asphalt pavement and the icing on the northern asphalt pavement. We started the trolley to roll the ice surface of the specimen.
The test results show that when the thickness of the ice layer is 4 mm, the number of times of rolling is 327, and the surface of the specimen in the spraying group is exposed to black ruts. The ice layer at the wheel track was crushed; while the ice layer on the surface of the blank group specimen with an ice layer thickness of 10 mm hardly changed, and the ice layer adhered firmly to the rut specimen and was difficult to be crushed. The surfaces of the debonding and ice suppression materials specimen and the blank specimen were hit with a hammer, and the hitting results are shown in Figure 8. The debonding and ice suppression material specimens are easier to break, and there is no dark ice on the bottom. The force is much smaller than the adhesion between the ice layer and the blank specimen.
(2)
Experimental simulation of the effect of vehicle rolling wear on debonding ice suppression materials
After the debonding and ice suppression materials are sprayed on the asphalt pavement, the effect of the debonding and ice suppression materials is affected by the repeated rolling and abrasion of vehicles. To verify the impact of the rolling and abrasion of vehicles on the performance of the debonding and ice suppression materials, the asphalt pavement simulation test specimen on the steel tank test platform is composed of 40 rut plate specimens, which are divided into blank specimens and debonding and ice suppression material specimens. We started the trolley to roll 11,131 times under a temperature of 20 °C, and observed the rolling wear of the debonding ice suppression material specimen, as shown in Figure 9. It can be seen from Figure 9 that there is a small amount of wear on the debonding ice suppression material at the wheel track of the rut plate test piece, but the debonding ice suppression material has not decreased within the structural depth of the rut plate test piece. Some literature studies show that the structural depth of the asphalt pavement is 4–6 times the surface area, the trolley rolling wear is only the debonding ice suppression material on the surface of the test piece, and most of the debonding ice suppression material penetrates into the structural depth of the test piece. Therefore, the rolling wear of the trolley will not have a significant impact on the deicing function of the debonding ice suppression material specimen.
To further verify this conclusion, this paper conducts a simulation test on the deicing effect of the test piece after the trolley is rolled and worn. At −30 °C, an ice layer with a thickness of 4mm is formed on the surface of the test piece by sprinkling water, and then the trolley started to roll. After 400 times of round trip rolling, the wheel track belt on the surface of the test piece sprayed with debonding ice suppression material breaks, and the wheel track belt exposes the surface of the test piece, while the wheel track belt of the blank group test piece has almost no change. As shown in Figure 10, the rolling wear of the trolley has little influence on the deicing effect of the debonding ice suppression material.

3.2. Analysis and Evaluation of Environmental Protection Performance of Debonding and Ice Suppression Materials

At present, the method of spreading snow melt agent has become the most commonly used method for snow and ice removal because it has the characteristics of removing snow and ice thoroughly. The snow melt agent has a serious negative impact on the environment such as plants, auxiliary facilities of roads and bridges, surface runoff, soil, and traffic.
In order to detect the environmental protection performance of the debonding and ice suppression materials, relevant tests were carried out and the relevant procedures and test methods, and the environmental protection performance of the debonding and ice suppression materials themselves were evaluated and the damage to plants caused by the leachate of the debonding and ice suppression materials was used. The corrosion effect of carbon steel by effect and debonding ice suppression material was evaluated.

3.2.1. Environmental Performance Testing of Debonding and Ice Suppression Materials

The environmental protection performance of the debonding and ice-suppression materials was tested by the relevant test standards and methods of GB5749-2006 and GB/T5750-2006. The test results are shown in Table 6.
It can be obtained from Table 6 that the debonding and ice suppression material conforms to GB5749-2006 requirements, with good environmental performance.

3.2.2. Analysis and Evaluation of the Effect of Debonding and Ice-Suppressing Materials on Plants

(1)
Experiment method
Make a pre-painted test piece of debonding and ice suppression material, test the structural depth of the test piece, and spray the debonding and ice suppression material on the test piece according to the recommended optimal amount of debonding and ice suppression material for different structural depths of the test piece. The test specimen is an AC-13C rutting plate specimen with a construction depth of 0.7 mm and a sprinkling amount of debonding and ice suppression material of 0.55 kg/m2. Place the specimen in an outdoor ventilated place to dry.
After soaking the test piece in quantitative water for 1 day, collect enough leaching solution of the debonding and ice suppression material test piece for use.
Choose the commonly used snow-melting agent in China (the main component is calcium chloride) and add water to dissolve and dilute to make the leachate with a concentration of 5% for use.
Cultivate enough healthy green plants as a backup for this experiment.
Irrigate the green plants with 5% snow-melting agent leaching solution and debonding ice-suppressing material leaching solution every day, and observe the growth of the plants every day, and carry out a comparative analysis.
(2)
Test evaluation method
Observe the growth of plants before and after watering the leachate. If the growth of plants before and after watering the leachate has no effect, it means that the debonding and ice-suppressing material leachate does not harm the growth of plants. The greater the damage to the growth of the plant by the leachate.
(3)
Test Results and Analysis
Observe the plants irrigated with the leaching solution of the debonding and ice-suppressing material and the leaching solution of the snow-melting agent for 1–30 days.
It can be seen from Table 7 that the growth of plants after the leaching solution irrigated for 1–30 days that the growth of plants irrigated with the leaching solution of the debonding and ice suppression materials has been growing vigorously, indicating that the debonding and ice suppression materials have no impact on the growth of plants. However, the plants irrigated with the extract of snow melting agent gradually showed signs of withering with the increase in time, and completely withered after 10 days, indicating that the commonly used snow melting agent in China had a greater side effect on the growth of plants.

3.2.3. Analysis and Evaluation of the Influence of Debonding and Ice Suppression Materials on Metal Corrosion

Referring to the test method of the American Society for Testing and Materials standard “ASTMG44-99”, and simulating the actual process of deicing the snow melting agent in liquid and solid state, the test method is as follows:
(1)
Metal specimen samples are prepared. The rebar sample is made into a cuboid with a size of 50 mm × 10 mm × 3 mm, and a round hole (3 mm in diameter) is drilled at one end. After sanding the sample until there are no marks of cutting, it is cleaned and dried with cold air. The sample is weighed and dimensioned.
(2)
Test setup. A test piece is put into the leaching solution of the debonding and ice suppression material for corrosion, and the corrosion performance of the debonding and ice suppression material on the metal test piece is verified. The test is used as a comparative test for the leaching solution of the debonding and ice suppression material.
(3)
Corrosion tests are conducted. Equal volumes of solution are added to 1000 mL beakers, and three pre-weighed metal specimens are added to each beaker. The corrosion test takes 24 h as a cycle, from 9:00 to 17:00 in the morning, according to the immersion test. The solution is placed in the air for 10 min, and the cycle test is carried out by placing it in the air for 50 min, and then the test pieces are put into the solution for 4 h to 21:00, and then the test pieces are taken out and placed in the air until 9:00 the next day. The test is repeated for 30 days in a cyclic manner; after the test, the work that needs to be performed is to use distilled water to wash off the corrosive medium solution, use pure alcohol to remove the moisture of the test piece, and dry it for later use.
(4)
The average corrosion rate is calculated. The first step is to use the cleaning solution prepared by hydrochloric acid, antimony trioxide, and stannous chloride to clean the corrosives on the surface of the test piece, the second step is to wash with clean water, the third step is to soak in saturated sodium bicarbonate solution for about 2–3 min for neutralization, and the fourth step is to wash with clean water and absorb with filter paper, and then put it into anhydrous alcohol or acetone for 3–5 min for dehydration. Weigh after drying with hot air and calculate the average corrosion rate of the test piece according to Formula (2).
ν c o r r = 365000 × Δ g γ t S
where: Vcorr—Average loss rate, mm/a, Δ g —Loss mass of test piece, γ —Specific gravity of test piece, taking 7.85 g/cm3, t—Test time, taking 30 days, S—The surface area of the test piece, mm2
(5)
Evaluation criteria
The smaller the average corrosion rate is, the less corrosive the solution is to the metal specimen; on the contrary, the corrosivity is greater.
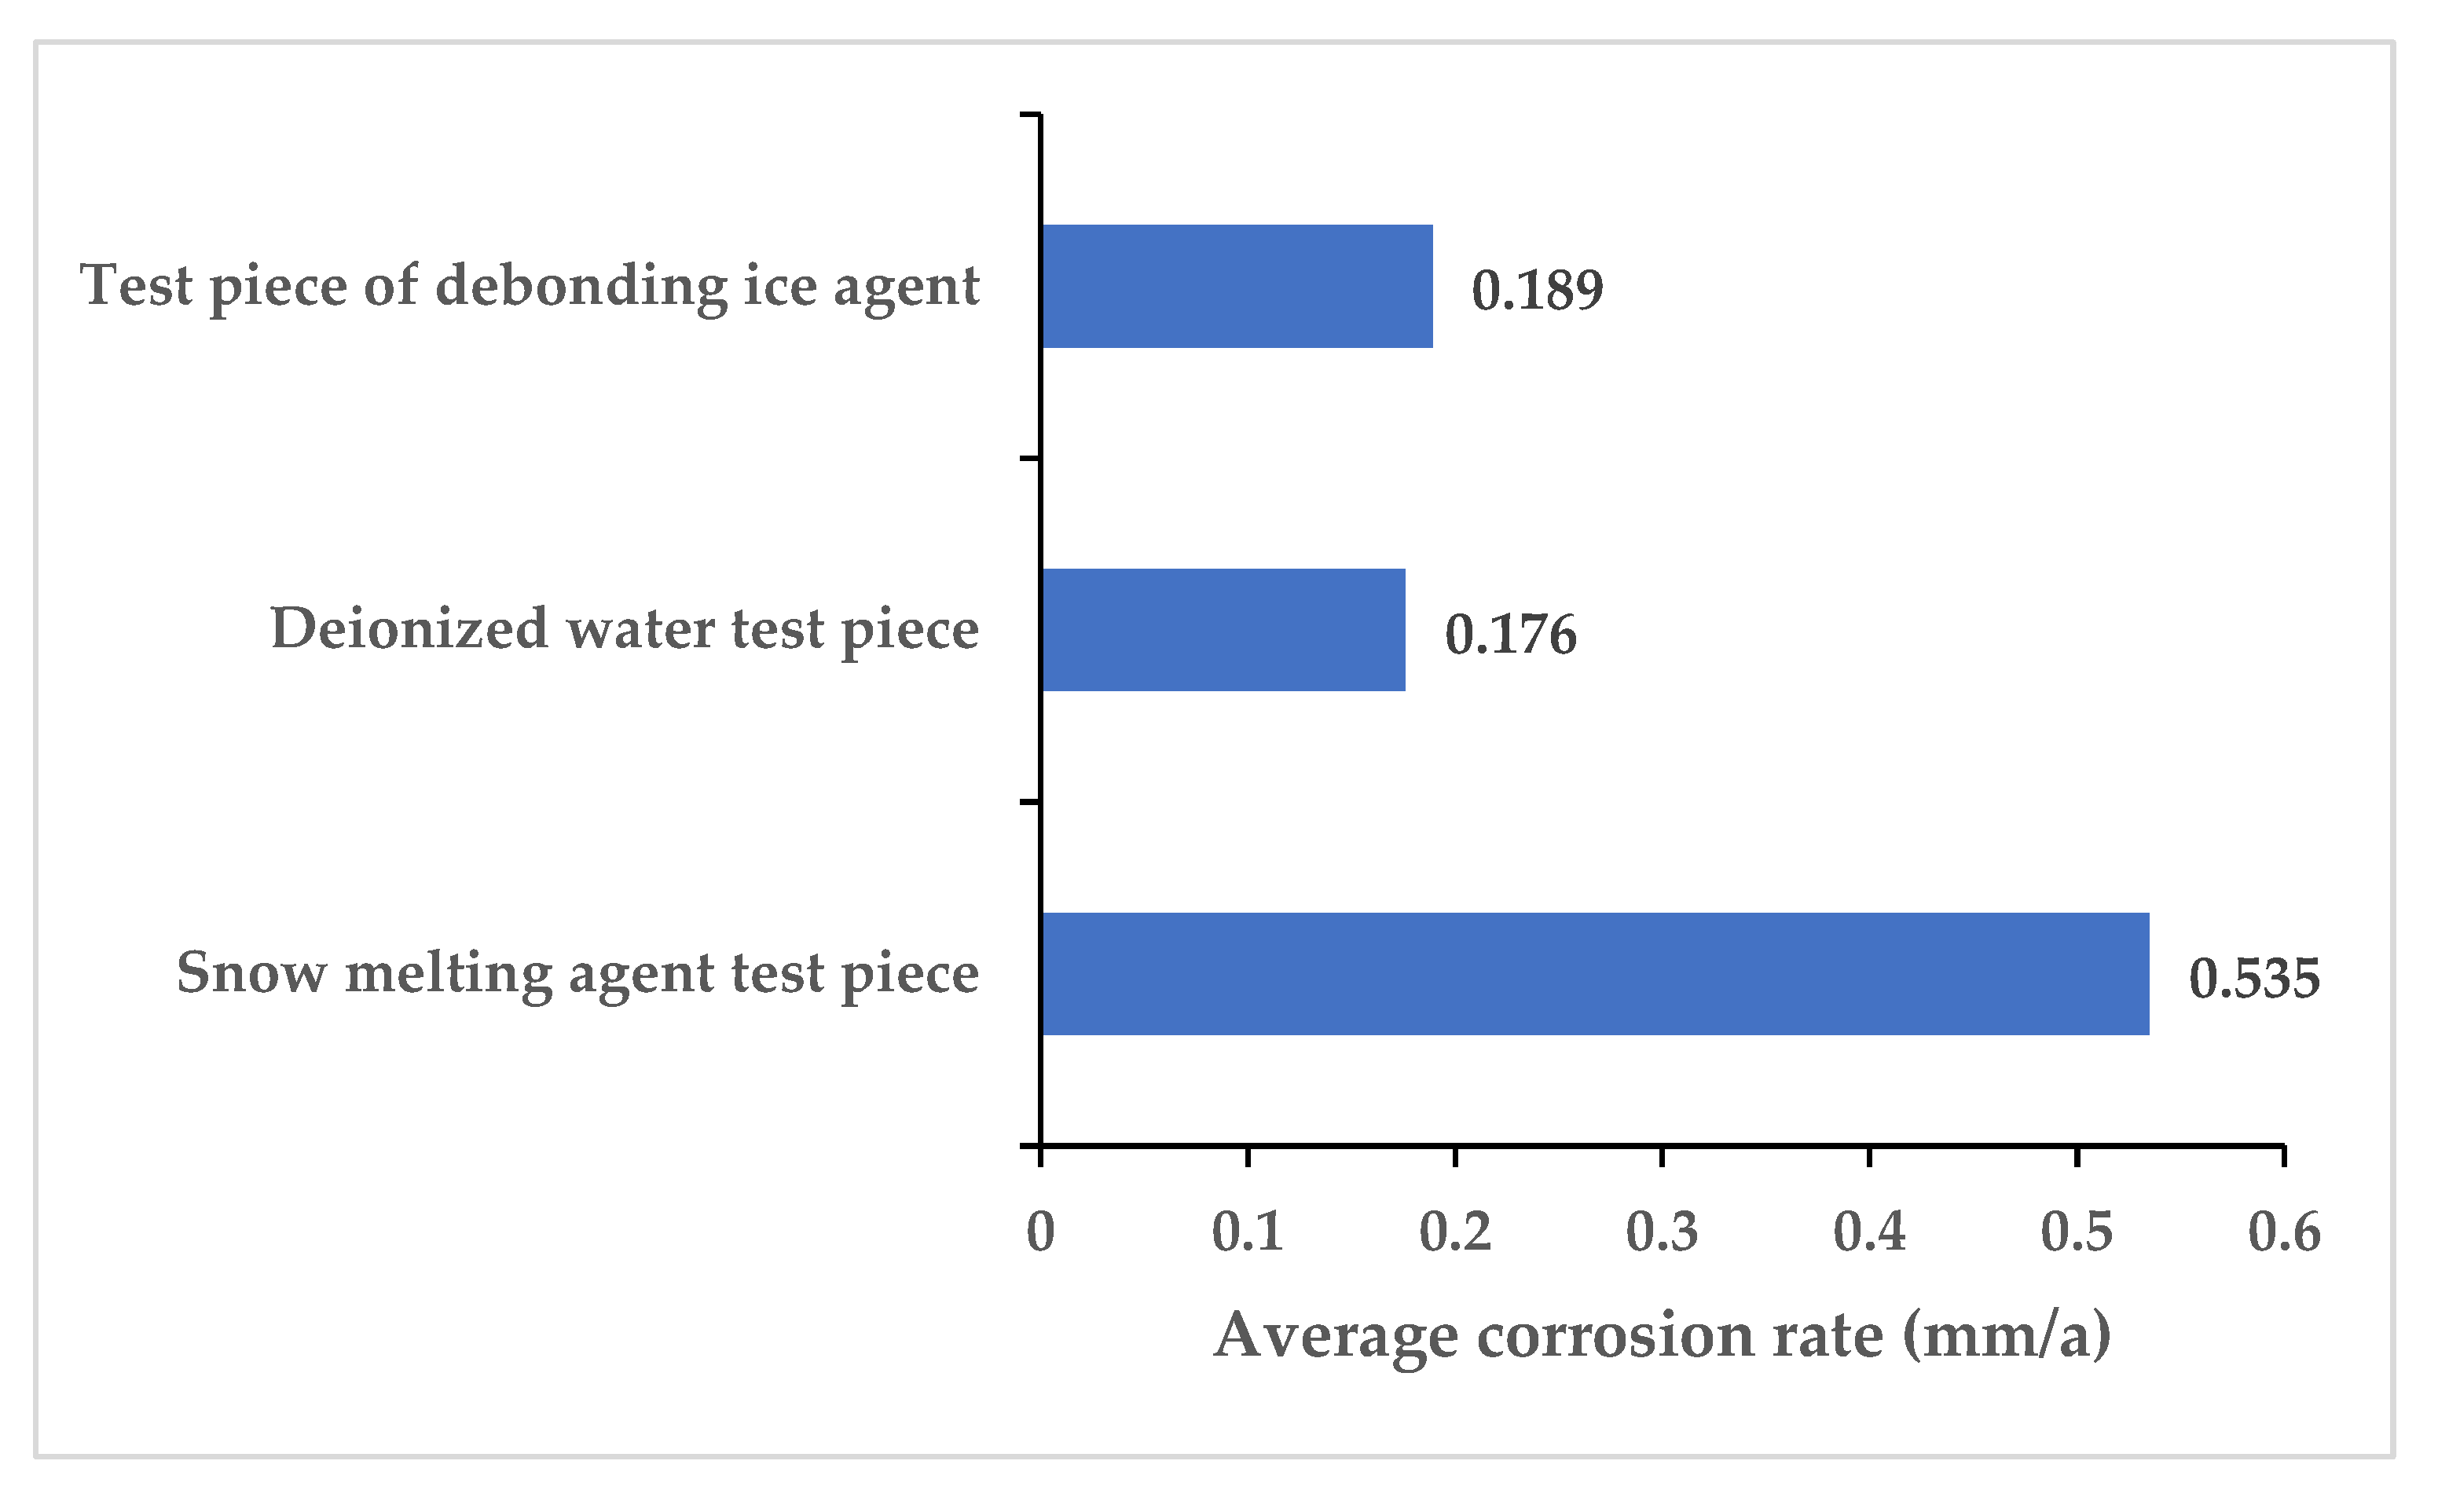
(6)
Test results and analysis
The metal corrosion test of the test piece is conducted according to step 3, and the test results are shown in Table 8 and Figure 11.
From Table 8 and Figure 11, it can be seen that the average corrosion rate of the debonding ice suppression material specimen is far lower than that of the snowmelt agent specimen, which is equivalent to the average corrosion rate of the ionic water specimen. The test results show that the corrosion rate of the leach solution of the debonding ice suppression material to the metal specimen is small, and the debonding ice suppression material has good environmental protection performance.

4. Conclusions

In this paper, the performance of the debonding ice suppression material is studied and analyzed from the aspects of durability, environmental protection, etc. The main conclusions are as follows:
(1)
Based on the evaluation index and method of deicing performance of the debonding and ice suppression materials, the proportion of the three components of the debonding and ice suppression materials, namely, the film-forming component, the adhesive component and the modified ice suppression component, and the indoor preparation process were determined through experiments.
(2)
The debonding ice suppression material test piece has good water resistance. After the debonding ice suppression material test piece is continuously immersed in water for 24h and 48 h, the coating on the surface of the test piece is free from any blistering, peeling and icing, and the coating film is still intact.
(3)
The debonding and ice suppression material has good slow-release performance, and the debonding, and ice suppression material specimen still has good deicing performance after seven cycles of tests.
(4)
Through the simulation of the vehicle rolling wear test, it can be concluded that the debonding ice suppression material still has a deicing effect, which proves that the debonding ice suppression material has good durability.
(5)
From the analysis and evaluation of the environmental protection performance of the debonding and ice suppression materials, it can be concluded that the debonding and ice suppression materials have no impact on the growth of plants and the average corrosion rate of the debonding and ice suppression materials is far lower than the average corrosion rate of the snowmelt agents, indicating that the debonding and ice suppression materials have good environmental protection performance.

Author Contributions

Conceptualization, Y.Z.; methodology, Y.Z.; software, Y.Z.; validation, M.Z.; formal analysis, M.Z.; investigation, X.Z.; resources, M.Z.; data curation, X.Z.; writing—original draft preparation, X.Z.; writing—review and editing, X.Z.; visualization, X.Z.; supervision, X.Z.; project administration, M.Z.; funding acquisition, M.Z. All authors have read and agreed to the published version of the manuscript.

Funding

This research was funded by the project was supported by the Introduction of Talents and Scientific Research Start-Up Fund of Nanjing Institute of Technology, grant number No.YKJ201834 and the project was supported by the Open Research Fund of NJIT Institute of Industrial Economy and Innovation Management (No.JGKA202204).

Data Availability Statement

Not applicable.

Conflicts of Interest

The authors declare no conflict of interest.

References

  1. Wu, S.; Yang, J.; Sun, X.; Wang, C.; Yang, R.; Zhu, J. Preparation and characterization of anti-freezing asphalt pavement. Constr. Build. Mater. 2020, 236, 117579. [Google Scholar] [CrossRef]
  2. Zhou, J.; Li, J.; Liu, G.; Yang, T.; Zhao, Y. Long-term performance and deicing effect of sustained-release snow melting asphalt mixture. Adv. Civ. Eng. 2019, 2019, 1940692. [Google Scholar] [CrossRef]
  3. Wang, T.; Dra, Y.A.S.S.; Cai, X.; Cheng, Z.; Zhang, D.; Lin, Y.; Yu, H. Advanced cold patching materials (CPMs) for asphalt pavement pothole rehabilitation: State of the art. J. Clean. Prod. 2022, 366, 133001. [Google Scholar] [CrossRef]
  4. Shan, L.; Li, Z.; Tian, D.; Tan, Y. Effect of anti-icing additives on the stability of emulsified asphalt binders. Constr. Build. Mater. 2021, 275, 121951. [Google Scholar] [CrossRef]
  5. Wang, Z.; Zhang, T.; Shao, M.; Ai, T.; Zhao, P. Investigation on snow-melting performance of asphalt mixtures incorporating with salt-storage aggregates. Constr. Build. Mater. 2017, 142, 187–198. [Google Scholar] [CrossRef]
  6. Wang, C.; Fu, H.; Ma, W.; Zhang, Z.; Ji, X.; Han, X. Combination design and performance evaluation of conductive bonding layer for asphalt pavement active deicing. Constr. Build. Mater. 2020, 263, 121037. [Google Scholar] [CrossRef]
  7. Sobolev, K.; Nosonovsky, M.; Krupenkin, T.; Flores-Vivian, I.; Rao, S.; Kozhukhova, M.; Hejazi, V.; Muzenski, S.; Bosch, B.; Rivero, R. Anti-Icing and De-Icing Superhydrophobic Concrete to Improve the Safety on Critical Elements on Roadway Pavements; National Center for Freight and Infrastructure Research and Education (US). 2013. Available online: https://rosap.ntl.bts.gov/view/dot/26834 (accessed on 20 February 2023).
  8. Min, Z.; Xia, Y.; Li, X.; Tao, Z. Performances evaluation of epoxy asphalt mixture containing snow-melting agent. Constr. Build. Mater. 2017, 155, 762–769. [Google Scholar] [CrossRef]
  9. Zheng, M.; Zhou, J.; Wu, S.; Yuan, H.; Meng, J. Evaluation of long-term performance of anti-icing asphalt pavement. Constr. Build. Mater. 2015, 84, 277–283. [Google Scholar] [CrossRef]
  10. Wang, W.; Yu, J.Y.; Yi, Y.; Chen, X. Effect of De-Icing Additives on Aging Properties of Bitumen; Materials Science Forum; Trans Tech Publ.: Stafa-Zurich, Switzerland, 2016; pp. 418–424. [Google Scholar]
  11. Wang, T.; Weng, Y.; Cai, X.; Li, J.; Xiao, F.; Sun, G.; Zhang, F. Statistical modeling of low-temperature properties and FTIR spectra of crumb rubber modified asphalts considering SARA fractions. J. Clean. Prod. 2022, 374, 134016. [Google Scholar] [CrossRef]
  12. Xu, O.; Yang, X.; Xiang, S.; Zhang, H. Migration characteristic and model of chloride ions for nacl-based salt storage asphalt mixtures. Constr. Build. Mater. 2021, 280, 122482. [Google Scholar] [CrossRef]
  13. Yang, Y.; Chen, G.; Yang, Y.; Yue, L.; Xu, J. Advances in Salt-Storage Materials, Road and Anti-Freezing Performances of Salt-Storage Asphalt Mixture: A Review. Coatings 2022, 12, 1323. [Google Scholar] [CrossRef]
  14. Ma, T.; Geng, L.; Ding, X.; Zhang, D.; Huang, X. Experimental study of deicing asphalt mixture with anti-icing additives. Constr. Build. Mater. 2016, 127, 653–662. [Google Scholar] [CrossRef]
  15. Yu, W.; Yi, X.; Guo, M.; Chen, L. State of the art and practice of pavement anti-icing and de-icing techniques. Sci. Cold Arid Reg. 2014, 6, 14–21. [Google Scholar]
  16. Chen, J.; Ma, X.; Wang, H.; Xie, P.; Huang, W. Experimental study on anti-icing and deicing performance of polyurethane concrete as road surface layer. Constr. Build. Mater. 2018, 161, 598–605. [Google Scholar] [CrossRef]
  17. Chen, Y.; Tan, Y.; She, H.; Zhang, M.; Jiang, X.; Guo, P.; Li, Y.; Zhang, Y. Characteristics of slow-release ice and snow melting micro-surfacing materials. Int. J. Pavement Eng. 2022, 1–16. [Google Scholar] [CrossRef]
  18. Zheng, M.; Wu, S.; Wang, C.; Li, Y.; Ma, Z.; Peng, L. A study on evaluation and application of snowmelt performance of anti-icing asphalt pavement. Appl. Sci. 2017, 7, 583. [Google Scholar] [CrossRef] [Green Version]
  19. Luo, S.; Yang, X. Performance evaluation of high-elastic asphalt mixture containing deicing agent Mafilon. Constr. Build. Mater. 2015, 94, 494–501. [Google Scholar] [CrossRef]
  20. Huaibing, D. Design and Pavement Performance of Ultra-Thin Snow Melt Salt Asphalt Mixture Pavement Overlay; Chang’an University: Xi’an, China, 2015. [Google Scholar]
  21. Akbari, R.; Antonini, C. Contact angle measurements: From existing methods to an open-source tool. Adv. Colloid Interface Sci. 2021, 294, 102470. [Google Scholar] [CrossRef] [PubMed]
  22. Chen, M.; Wu, S.; Wang, H.; Zhang, J. Study of ice and snow melting process on conductive asphalt solar collector. Sol. Energy Mater. Sol. Cells 2011, 95, 3241–3250. [Google Scholar] [CrossRef]
  23. Kim, K.W.; Lee, G.H.; Hong, S.K.; Jin, J.I.; Doh, Y.S. Evaluation of Self-deicing Function of Snow-melting Asphalt. Int. J. Highw. Eng. 2003, 5, 1–14. [Google Scholar]
Figure 1. Flowchart of the paper.
Buildings 13 00689 g001
Figure 2. Schematic diagram for preparation of finished viscosity-reducing and ice-defending materials.
Buildings 13 00689 g002
Figure 3. Water resistance test: (a) before soaking; (b) 24 h Soak for 24 h; (c) 48 h Soak for 48 h.
Buildings 13 00689 g003
Figure 4. Test piece of the viscosity-reducing and ice-defending materials after 7 cycles of ball impact test.
Buildings 13 00689 g004
Figure 5. The result of the argentimetry of the viscosity-reducing and ice-defending materials.
Buildings 13 00689 g005
Figure 6. Testing room for high- and low-temperature materials and structural properties.
Buildings 13 00689 g006
Figure 7. Steel channel platform for high- and low-temperature materials and structural performance testing room.
Buildings 13 00689 g007
Figure 8. Deicing effect of the rutting plate specimen after knocking.
Buildings 13 00689 g008
Figure 9. Test piece of debonding ice suppression material after trolley rolling and abrasion.
Buildings 13 00689 g009
Figure 10. Surface of the rut specimen after rolling.
Buildings 13 00689 g010
Figure 11. Corrosion Rate Test Results of Metal Specimens.
Buildings 13 00689 g011
Table 1. Performance results of base binder.
Test ItemsJB 70#Quality IndexTest Method
Penetration (25 °C, 5 s, 100 g)/0.1 mm71.260–80T0604
Softening point (R&B)/°C46.3≥46T0606
60 °C Dynamic viscosity/Pa.s184≥180T0620
10 °C Ductility/cm33≥20T0605
Quality change/%0.14≤0.6T0609
Residual penetration ratio (25 °C)/%68≥65T0604
Residual ductility (10 °C)/cm6.6≥6T0605
Table 2. Physical and mechanical basic performance index of aggregate.
Test ItemsTest ValueQuality IndexTest Method
Crushing value (%)12.5≤26T0316-2005
Los Angeles abrasion value (%)10.8≤28T0317-2005
Content of needle and flaky particles≥9.56.5≤12T0312-2005
≤9.512.8≤18T0312-2005
Sand equivalent (particle size less than 2.36 mm) (%)72.5≥60T0334-2005
Angularity (%)55.7≥30T0345-2005
Table 3. Design results of asphalt mixture proportion.
Asphalt-aggregate ratio/%5.45.86.26.67.07.48.0Specification requirements
Asphalt content/%5.125.485.846.196.546.897.41/
Marshall stability/kN6.726.927.927.647.186.706.56>6.0
Flow value/0.1 mm16.916.632.433.634.039.645.320–50
Gross volume relative density2.4482.4572.4712.4732.4752.4662.463/
VV/%6.725.864.784.143.563.373.863~4
VMA/%18.0618.0917.9318.1618.4219.0119.54>17
VFA/%62.8167.6373.3477.1780.6882.2680.2275–85
Table 4. Technical results of AC-13 asphalt mixture.
Technical StandardUnitPerformance ResultsTest Method
Compaction timestimetwo sides 75JTG E20 T0702
Size of test piecemmΦ101.6 × 63.5JTG E20 T0702
Marshall stabilitykN6.0JTG E20 T0709
Flow value0.1 mm32JTG E20 T0709
Voidage VV%3.4JTG E20 T0705
VMA-voids%18JTG E20 T0705
VCAmix%≤VCADRCJTG E20 T0705
VFA%80JTG E20 T0705
Table 5. Test Results of Adsorption Capacity of Adsorption Carrier Materials.
Material CategoriesSpecimen Oven Dry Weigh/m0 (g)Oven Dry Weight/m1 (g)Adsorption Rate/Sa (%)
Volcanic rock67.3574.2310.21
Zeolite111.20124.3011.78
The adsorption carrier materials of the viscosity-reducing and ice-defending materials100.00124.7024.70
Table 6. Test results of environmental protection performance testing of debonding and ice suppression materials.
Serial NumberTest ItemsUnitsTest ResultsGB 5749-2006
Index Limit
GB 3838-2002
Standard Value
Conclusion
1Leadmg/L<0.0020.01≤0.05The debonding and ice suppression material meets the requirements of GB-5749-2006 and has good environmental performance.
2CrVlmg/L<0.010.05≤0.05
3Cadmiummg/L<0.00020.005≤0.005
4Mercurymg/L0.00020.001≤0.001
5Arsenicmg/L<0.00040.01≤0.1
6Seleniummg/L<0.00040.01≤0.02
Note: The test samples of debonding and ice suppression materials were collected at the construction site of the debonding and ice suppression materials of the Dishuizhu Bridge on Ninghuai Expressway, and the testing units with relevant qualifications were entrusted to conduct the testing.
Table 7. Plant growth before and after irrigating leachate.
Watering Days (days)Watering Snow Melting Agent Leachate Plant GrowthIrrigation of Debonding and Ice-Suppressing Material Leachate Plant Growth
0Vigorous growthVigorous growth
1Basically vigorousVigorous growth
2WitheringVigorous growth
3Withering phenomenon is obviousVigorous growth
10WitheredVigorous growth
20WitheredVigorous growth
30WitheredVigorous growth
Table 8. Corrosion Rate Test Results of Metal Specimens.
Test SpecimenLength (mm)Width
(mm)
Height
(m)
Aperture
(m)
Weight before Corrosion (g)Weight after Corrosion (g)Weightless Mass (g)Corrosion Rate (mm/a)Average Corrosion Rate (mm/a)
Snow melting agent test piece 150.1010.013.112.9511.52511.0430.4820.5370.535
Snow melting agent test piece 250.0510.003.022.8611.37710.9060.4710.530
Snow melting agent test piece 350.0310.033.132.9911.57711.0930.4840.538
Deionized water test piece 150.1110.023.052.9411.53611.3830.1530.1710.176
Deionized water test piece 250.0910.113.042.8811.47811.3160.1620.180
Deionized water test piece 350.1410.183.022.9211.88411.7230.1610.178
Test piece of debonding ice suppression material 150.1310.053.122.9211.93411.7600.1740.1930.189
Test piece of debonding ice suppression material 250.1610.043.082.8711.89111.7250.1660.185
Test piece of debonding ice suppression material 350.1810.113.042.9411.77611.6050.1710.190
Disclaimer/Publisher’s Note: The statements, opinions and data contained in all publications are solely those of the individual author(s) and contributor(s) and not of MDPI and/or the editor(s). MDPI and/or the editor(s) disclaim responsibility for any injury to people or property resulting from any ideas, methods, instructions or products referred to in the content.

